Embed Size (px)
Citation preview
A Brain-Machine Interface for Control ofMedically-Induced ComaMaryam M. Shanechi1,2.*, Jessica J. Chemali3., Max Liberman3, Ken Solt3, Emery N. Brown3,4,5*
1 School of Electrical and Computer Engineering, Cornell University, Ithaca, New York, United States of America, 2 Department of Electrical Engineering and Computer
Science, University of California, Berkeley, California, United States of America, 3 Department of Anesthesia, Critical Care and Pain Medicine, Massachusetts General
Hospital, Boston, Massachusetts, United States of America, 4 Institute for Medical Engineering and Science, Massachusetts Institute of Technology, Cambridge,
Massachusetts, United States of America, 5 Department of Brain and Cognitive Sciences, Massachusetts Institute of Technology, Cambridge, Massachusetts, United States
of America
Abstract
Medically-induced coma is a drug-induced state of profound brain inactivation and unconsciousness used to treat refractoryintracranial hypertension and to manage treatment-resistant epilepsy. The state of coma is achieved by continuallymonitoring the patient’s brain activity with an electroencephalogram (EEG) and manually titrating the anesthetic infusionrate to maintain a specified level of burst suppression, an EEG marker of profound brain inactivation in which bursts ofelectrical activity alternate with periods of quiescence or suppression. The medical coma is often required for several days. Amore rational approach would be to implement a brain-machine interface (BMI) that monitors the EEG and adjusts theanesthetic infusion rate in real time to maintain the specified target level of burst suppression. We used a stochastic controlframework to develop a BMI to control medically-induced coma in a rodent model. The BMI controlled an EEG-guidedclosed-loop infusion of the anesthetic propofol to maintain precisely specified dynamic target levels of burst suppression.We used as the control signal the burst suppression probability (BSP), the brain’s instantaneous probability of being in thesuppressed state. We characterized the EEG response to propofol using a two-dimensional linear compartment model andestimated the model parameters specific to each animal prior to initiating control. We derived a recursive Bayesian binaryfilter algorithm to compute the BSP from the EEG and controllers using a linear-quadratic-regulator and a model-predictivecontrol strategy. Both controllers used the estimated BSP as feedback. The BMI accurately controlled burst suppression inindividual rodents across dynamic target trajectories, and enabled prompt transitions between target levels while avoidingboth undershoot and overshoot. The median performance error for the BMI was 3.6%, the median bias was -1.4% and theoverall posterior probability of reliable control was 1 (95% Bayesian credibility interval of [0.87, 1.0]). A BMI can maintainreliable and accurate real-time control of medically-induced coma in a rodent model suggesting this strategy could beapplied in patient care.
Citation: Shanechi MM, Chemali JJ, Liberman M, Solt K, Brown EN (2013) A Brain-Machine Interface for Control of Medically-Induced Coma. PLoS ComputBiol 9(10): e1003284. doi:10.1371/journal.pcbi.1003284
Editor: Olaf Sporns, Indiana University, United States of America
Received February 19, 2013; Accepted August 7, 2013; Published October 31, 2013
Copyright: � 2013 Shanechi et al. This is an open-access article distributed under the terms of the Creative Commons Attribution License, which permitsunrestricted use, distribution, and reproduction in any medium, provided the original author and source are credited.
Funding: Support was provided by NIH Director’s Pioneer Award DP1-OD003646 and NIH Director’s Transformative Award R01 GM104948 (to ENB) and NIH K08-GM094394 (to KS) from the National Institutes of Health, Bethesda, Maryland, and by the Department of Anesthesia, Critical Care, and Pain Medicine,Massachusetts General Hospital, Boston, Massachusetts. The funders had no role in study design, data collection and analysis, decision to publish,or preparationof the manuscript.
Competing Interests: The authors have declared that no competing interests exist.
* E-mail: [email protected] (MMS); [email protected] (ENB)
. These authors contributed equally to this work.
Introduction
Medically-induced coma (also referred to as medical coma) is a
drug-induced state of profound brain inactivation and uncon-
sciousness used to treat refractory intracranial hypertension and
status epilepticus, i.e., epilepsy that is refractory to standard
medical therapies [1–3]. Following a traumatic brain injury, an
anesthetic drug such as a barbiturate or propofol, is administered
continuously to provide brain protection by decreasing the
cerebral metabolism and blood flow, and thereby, intracranial
hypertension [2]. In the treatment of status epilepticus the
anesthetic is administered to directly inhibit activity in the seizure
foci [3]. For treating both refractory intracranial hypertension and
status epilepticus, the state of medical coma is achieved by
continually monitoring the patient’s brain activity with the
electroencephalogram (EEG) and titrating the anesthetic drug
infusion rate to maintain a specified level of burst suppression.
Burst suppression is an EEG pattern characterized by intervals of
electrical bursts that alternate with isoelectric or quiescent intervals
termed suppressions [4,5] and is an EEG marker of profound
brain inactivation. In most cases, once burst suppression is
achieved, it can be controlled by decreasing or increasing the
infusion rate of the anesthetic to decrease or increase the
suppression level.
No guidelines have been set to define what level of burst
suppression should be achieved to maintain a medical coma [3]. A
common practice is for the intensive care unit team to agree upon
a target level of burst suppression, monitor continually the EEG
and adjust manually the infusion rate of the anesthetic to maintain
the target level. In most cases, the medical coma is required for at
PLOS Computational Biology | www.ploscompbiol.org 1 October 2013 | Volume 9 | Issue 10 | e1003284
least 24 hours and frequently longer. It is not realistic to expect
intensive care unit staff to maintain reliable and accurate control
of a patient’s brain state for such a long period by manually
changing the infusion rate of the anesthetic in response to changes
in the EEG observed in the bedside monitor. A more rational
approach would be to define numerically a target level of burst
suppression and implement a computer controlled system or a
brain-machine interface (BMI) that monitors the actual level of
burst suppression based on the brain’s EEG activity and adjusts
the rate of the anesthetic infusion pump as needed in real time to
maintain the target level.
When used to control the delivery of anesthetic drugs, BMIs are
often termed closed loop anesthetic delivery (CLAD) systems.
During the last 60 years considerable work has been done on the
development of CLAD systems for maintenance of general
anesthesia and sedation (see Discussion). Interest in CLAD systems
has grown driven by attempts to design more efficient, cost-
effective ways to administer anesthesia care. To date, no CLAD
system has been developed to manage medical coma. Systems to
control burst suppression have only been studied in rodent models.
Vijn and Sneyd implemented a CLAD system in a rodent model
to establish a paradigm for testing new anesthetics [6]. Cotten and
colleagues used the Vijn and Sneyd paradigm to study new
etomidate-derived anesthetics in a rodent model [7]. Both studies
reported average control results rather than results for individual
animals and controlled constant target levels of burst suppression
rather than time-varying target levels. Here we present a BMI
using a stochastic control framework for control of time-varying
burst suppression target trajectories in individual rodents. Our
study uses a rodent model to establish the feasibility of automatic
control of burst suppression as a way to eventually achieve real-
time control of medical coma for therapeutic purposes in humans.
We show that for individual rodents the BMI enables accurate
maintenance of multiple desired target levels within the same
experimental session, enables prompt transitions between target
levels without overshoot or undershoot, and allows specific
constraints to be formally imposed over the infusion rates or the
vital states (see Discussion).
The presented BMI applies an EEG-guided, closed-loop
infusion of propofol to control the level of burst suppression in
medically-induced coma in a rodent model using a stochastic
control framework. In this framework, we use the concept of the
burst suppression probability (BSP) to define the brain’s instanta-
neous probability of being in the suppressed state and quantify the
burst suppression level. We use a two-dimensional linear
compartment model to characterize the effect of propofol on the
EEG. For each animal, we estimate the parameters of the
compartment model by nonlinear least-squares in an experiment
prior to initiating control. The BMI consists of two main
components: an estimator and a controller. We derive a two-
dimensional state-space algorithm to estimate the BSP in real time
from the EEG thresholded and segmented into a binary time-
series. Taking the BSP estimate as the control signal, we derive
controllers using both a linear-quadratic-regulator (LQR) and a
model predictive control strategy. We first verify the performance
of the developed stochastic control framework in a simulation
study based on the model parameters estimated from the actual
experimental data. We then illustrate the application of our BMI
system by demonstrating its ability to maintain precise control of
time-varying target levels of burst suppression and to promptly
transition between changing target levels without overshoot or
undershoot in individual rodents.
Materials and Methods
Animal Care and Use and Ethics StatementAnimal studies were approved by the Subcommittee on
Research Animal Care, Massachusetts General Hospital, Boston,
Massachusetts, which serves as our Institutional Animal Care and
Use Committee. Animals were kept on a standard day-night cycle
(lights on at 7:00 AM, and off at 7:00 PM), and all experiments
were performed during the day.
BMI DesignOverview. We use a stochastic optimal control paradigm to
design a real-time BMI to control medical coma using burst
suppression (Figure 1a). As our measure of the burst suppression
level, we use the burst suppression probability (BSP), a number
between 0 and 1, which defines the instantaneous probability of
the EEG being suppressed. The BSP is computed in one-second
intervals in real time by filtering and thresholding the EEG to
convert it into binary observations (Figure 1b). To estimate the
BSP from the binary observations we first formulate a two-
dimensional compartment model that relates the BSP to the
concentrations of the anesthetic in the central compartment and
the effect site compartment (Figure 1c). We next estimate the
parameters of the compartment model based on the EEG
observations recorded in a systems identification experiment
conducted prior to initiating real-time control (Figure 2). We
carry out our stochastic control framework by developing from the
two-dimensional compartment model a recursive Bayesian
estimator of the concentration states and consequently of the
BSP from the binary observations in real time (14)–(17). We
develop a LQR controller that takes the concentration estimates as
feedback and determines the drug infusion rate in real time (25). In
addition to the LQR control strategy, we also implement a model
predictive controller (MPC) that allows us to explicitly impose
constraints on the anesthetic infusion rates (27). We present the
mathematical details of the system identification, formulation of
the Bayesian estimator and the two controllers for the interested
readers below. These mathematical details in this subsection are
Author Summary
Brain-machine interfaces (BMI) for closed-loop control ofanesthesia have the potential to enable fully automatedand precise control of brain states in patients requiringanesthesia care. Medically-induced coma is one such drug-induced state in which the brain is profoundly inactivatedand unconscious and the electroencephalogram (EEG)pattern consists of bursts of electrical activity alternatingwith periods of suppression, termed burst suppression.Medical coma is induced to treat refractory intracranialhypertension and uncontrollable seizures. The state ofcoma is often required for days, making accurate manualcontrol infeasible. We develop a BMI that can automaticallyand precisely control the level of burst suppression in realtime in individual rodents. The BMI consists of novelestimation and control algorithms that take as input theEEG activity, estimate the burst suppression level based onthis activity, and use this estimate as feedback to controlthe drug infusion rate in real time. The BMI maintainsprecise control and promptly changes the level of burstsuppression while avoiding overshoot or undershoot. Ourwork demonstrates the feasibility of automatic reliable andaccurate control of medical coma that can provideconsiderable therapeutic benefits.
Brain-Machine Interface to Control Medical Coma
PLOS Computational Biology | www.ploscompbiol.org 2 October 2013 | Volume 9 | Issue 10 | e1003284

Figure 1. The BMI system. (a) The BMI records the EEG, segments the EEG into a binary time-series by filtering and thresholding, estimates the BSPor equivalently the effect-site concentration level based on the binary-time series, and then uses this estimate as feedback to control the druginfusion rate. (b) A sample burst suppression EEG trace. Top panel shows the EEG signal, middle panel shows the corresponding filtered EEGmagnitude signal (orange) and the threshold (blue) used to detect the burst suppression events, and bottom panel shows the corresponding binarytime-series with black indicating the suppression and white indicating the burst events. (c) The two-compartmental model used by the BMI tocharacterize the effect of propofol on the EEG.doi:10.1371/journal.pcbi.1003284.g001
Brain-Machine Interface to Control Medical Coma
PLOS Computational Biology | www.ploscompbiol.org 3 October 2013 | Volume 9 | Issue 10 | e1003284

not necessary to follow the remainder of the paper beginning with
the Results.
Problem formulation. Our goal is to control the anesthetic
state of the brain in burst suppression, which depends on the
effect-site (i.e., brain) drug concentration. The burst suppression
state or the effect-site concentration, however, are not directly
observable. What we observe is the EEG signal, a stochastic
process that depends on the burst suppression state. To design the
closed-loop BMI, we present a certainty-equivalent optimal
feedback control approach [8] by deriving an estimator for the
burst suppression state based on the EEG observations and
designing an optimal feedback controller that takes this estimate as
a feedback signal to control the drug infusion rate in real time
(Figure 1a).
As our measure of the burst suppression state, we use the burst
suppression probability (BSP) by filtering and thresholding the
EEG signal in small intervals to identify the activity in each
interval as a burst or a suppression event (see Experimental
Procedure; Figure 1b). BSP is then defined as the brain’s
instantaneous probability of being in the suppressed state at a
given time interval. We denote the BSP at time t by pt. The BSP is
in turn related to the effect-site drug concentration. Since higher
levels of effect-site concentration should result in higher levels of
BSP and since BSP should be a number between ½0,1�, in this work
we relate the BSP to a measure of the effect-site concentration,
xe(t), using a hyperbolic transform
pt~1{exp({xe(t))
1zexp({xe(t)): ð1Þ
Hence our goal is to control the BSP, or equivalently to control
this measure of effect-site concentration, xe(t).
To develop the estimator and the controller, we construct a state
model for the drug concentration state that describes its dynamics
in response to propofol infusion. Pharmacokinetic models charac-
terize the dynamics of a drug’s absorption, distribution, and
elimination in the body (e.g. [9,10]). We adapt a simplified two-
compartment linear pharmacokinetic model [11] to describe the
anesthetic drug’s dynamics in burst suppression. In this model, one
compartment represents the central plasma and the other
compartment represents the effect-site or brain (Figure 1c). The
anesthetic drug enters the body and is eliminated from the body
through the central compartment, and can flow in both directions
between the two compartments. In the Results section we show
that this model is sufficient to achieve reliable and accurate control
of burst suppression.
Given the two compartments in the model, the concentration
state is two-dimensional and is denoted by xt~½xc(t),xe(t)�0, where
as before, xe(t) is the brain’s anesthetic concentration and xc(t) is a
measure of the central plasma concentration at time t. Denoting
the sequence of drug infusion rates by u0, � � � ,ut, the sequence of
anesthetic concentration states in the two-compartment model,
x0, � � � ,xt, are generated according to the linear dynamical system
xt~Axt{1zBut{1, ð2Þ
where
xt~xc(t)
xe(t)
� �ð3Þ
A~1{D(kcezkc0) Dkec
Dkce 1{Dkec
� �ð4Þ
B~D
0
� �: ð5Þ
Here D is the discretization time step, and A (or equivalently kce,
kec, and kc0) are parameters of the two-compartment model that
we need to estimate (Figure 1c). We estimate this model for each
animal from the EEG data prior to initiating real-time control as
discussed in detail in the System Identification section.
We first derive a recursive Bayesian estimator of the burst
suppression level from the EEG thresholded and segmented into a
binary time-series. We then derive an optimal feedback-controller
that uses this estimate as a feedback signal to decide on the drug
infusion rate in real time.
Recursive Bayesian estimator. We now develop a recur-
sive Bayesian estimator for the drug concentrations and conse-
quently for the BSP based on the binary observations of the
thresholded EEG signal. Since the drug concentration state, xt, is
Figure 2. System identification. (a) and (b) show two sample fitted system responses. The measured BSP trace in response to a preliminary bolusof propofol is shown in grey and the response of the second-order system model in (2) fitted using nonlinear least-squares is shown in red.doi:10.1371/journal.pcbi.1003284.g002
Brain-Machine Interface to Control Medical Coma
PLOS Computational Biology | www.ploscompbiol.org 4 October 2013 | Volume 9 | Issue 10 | e1003284
a positive variable, we estimate its logarithm, zt~log(xt), from the
EEG signal instead.
A recursive Bayesian estimator consists of two probabilistic
models: the prior model on the time sequence of the concentration
states, and the observation model relating the EEG signal to these
states [12,13]. Using the two compartment model in (2), we write
the prior model for zt as
zt~zc(t)
ze(t)
" #
~log A11 exp(zc(t{1))zA12 exp(ze(t{1))½ �
log A21 exp(zc(t{1))zA22 exp(ze(t{1))½ �
" #zBut{1zwt
~f (zt{1)zwt
ð6Þ
where wt is a zero-mean white Gaussian noise with covariance
matrix W and summarizes the uncertainties in the state model,
and Aij is the (i,j)th component of A. At time t, ut{1 is the known
drug infusion rate used by the BMI in the previous time step. Note
that our prior state model is nonlinear.
The observation in the estimator is the binary time-series of the
burst suppression events obtained by thresholding the EEG (see
Experimental Procedure; Figure 1b). To construct the observation
model, we assume that in each time interval D there can be at most
N suppression events and that the number of such suppression
events is binomially distributed with burst suppression probability
pt. Denoting the number of suppression events by Nt, the
observation model is given by
p(NtDzt)~N
Nt
� �pt(zt)
Nt (1{pt(zt))N{Nt ð7Þ
where we have indicated the dependence of the BSP, pt, on the
states, zt, explicitly.
Using the prior and observation models in (6) and (7), we now
derive the recursive Bayesian estimator. The estimator’s goal is to
causally and recursively find the minimum mean-square error
(MMSE) estimate of the state zt at each time step, which is given
by the mean of the posterior density at that time step, p(ztDN1:t).To derive the recursions and denoting the sequence of suppression
counts by N1:t~ N1, . . . ,Nt½ �, using the Bayes rule we can write the
posterior as
p ztjN1:tð Þ~
p Ntjztð Þp ztjN1:t{1ð Þp NtjN1:t{1ð Þ !pt ztð ÞNt 1{pt ztð Þð ÞN{Nt p ztjN1:t{1ð Þ,
ð8Þ
which states the posterior density as a function of prediction
density, p ztjN1:t{1ð Þ. Note that we have used
p Ntjzt,N1:t{1ð Þ~p Ntjztð Þ, since we assume that the observations
of the EEG at a given time step only depend on the concentration
states at that time step and hence are conditionally independent of
the previous EEG observations. Using the Chapman-Kolmogorov
equation, we can in turn write the prediction density as
p ztjN1:t{1ð Þ~ð
p ztjzt{1,N1:t{1ð Þp zt{1jN1:t{1ð Þdzt{1
~
ðp ztjzt{1ð Þp zt{1jN1:t{1ð Þdzt{1:
ð9Þ
Here we have used the conditional independence,
p ztjzt{1,N1:t{1ð Þ~p ztjzt{1ð Þ, which comes from the prior model
in (6). Now the second term inside the integral is just the posterior
density from the previous time step. Hence substituting (9) into
(8) generates the recursion. The exact expression in (8) is in
general complicated and not easy to find analytically. In the
special case when both the prior and observation models are
linear and Gaussian, these recursions have exact analytical
solutions and result in the celebrated Kalman filter. In our case,
however, first, the prior model is nonlinear and second, the
observation model is not Gaussian but binomial. Hence we
make two approximations at every time step to compute the
recursions. First, similar to the case of the extended Kalman
filter, we make a linear approximation to the prior model at
each time step. Second, we make a Gaussian approximation to
the posterior at each time step.
We denote the mean of the posterior, i.e., E ztjN1:tð Þ, by ztDt and
its covariance matrix by WtDt. Similarly, we denote the mean of the
one step prediction density, p ztjN1:t{1ð Þ, by ztDt{1 and its
covariance matrix by WtDt{1. As the first approximation, we
linearize the prior model in (6) around the posterior mean,
zt{1Dt{1. Doing so we have
zt&f (zt{1Dt{1)z~AA(zt{1{zt{1Dt{1)zwt ð10Þwhere
~AA~Lf
Lz
� �zt{1Dt{1
ð11Þ
~
A11 exp(zc(t{1Dt{1))
f1(zt{1Dt{1)
A12 exp(ze(t{1Dt{1))
f1(zt{1Dt{1)
A21 exp(zc(t{1Dt{1))
f2(zt{1Dt{1)
A22 exp(ze(t{1Dt{1))
f2(zt{1Dt{1)
264
375 ð12Þ
with ½:�a denoting the evaluation of the inside expression at value a
and with
f1(zt)~A11 exp(zc(t))zA12 exp(ze(t)),
f2(zt)~A21 exp(zc(t))zA22 exp(ze(t)):ð13Þ
As the second approximation, we make a Gaussian approxi-
mation to the posterior density. Doing so, from (9) the prediction
density will be approximately Gaussian since p(ztDzt{1) is
approximately Gaussian from (10). Using (10) we can find the
prediction mean and covariance as
ztDt{1~f (zt{1Dt{1) ð14Þ
WtDt{1~~AAWt{1Dt{1~AA0zW ð15Þ
This is the prediction step of the estimator. Now making the
Gaussian approximation we get the update step (see Supporting
Text S1 for details)
zt tj ~zt t{1j zWt tj0
ctpt 1{ptð Þ Nt{Nptð Þ
" #zt t{1j
ð16Þ
Brain-Machine Interface to Control Medical Coma
PLOS Computational Biology | www.ploscompbiol.org 5 October 2013 | Volume 9 | Issue 10 | e1003284

W{1tDt ~W{1
tDt{1z0 0
0 ct
� �ztDt{1
ð17Þ
where again ½:�ztDt{1indicates the evaluation of the inside
expression at ztDt{1 and
ct~xe tð Þexp xe tð Þð Þ1zexp xe tð Þð Þ 1{ptð Þ ð18Þ
ct~Nc2
t
pt 1{ptð Þ{Nt{Npt
pt 1{ptð ÞL2pt
Lz2e tð Þ{
1{2pt
pt 1{ptð Þ c2t
" #ð19Þ
with
L2pt
Lz2e tð Þ~ct 1zxe tð Þ{ 1{ptð Þxe tð Þexp xe tð Þð Þ½ � ð20Þ
Hence (14)–(17) give the estimator recursions. The estimator
finds the MMSE estimate of the state or equivalently the posterior
mean at time t in two steps: first, before data Nt is observed, it uses
the prior model in (6) to make a prediction on the state, i.e., find
ztDt{1 given zt{1Dt{1 and ut{1—this is the prediction step in (14)
and (15). Once data Nt is observed, it combines the observation
model in (7) with the prediction density to find the posterior mean
ztDt—this is the update step in (16) and (17). Consequently since
xt~exp(zt), we find the concentration state estimate as
xtDt~exp(ztDt), and since the BSP is related to xe(t) by a hyperbolic
transform in (1), we estimate it as pt tj ~1{exp {xe t tjð Þð Þ1zexp {xe t tjð Þð Þ.
Optimal feedback-controller. The recursive Bayesian esti-
mator derived above provides us with a real-time estimate of
the concentration states at each time step. We now design a
real-time optimal feedback-controller that takes as feedback
this state estimate and decides on the sequence of drug infusion
rates ut to control the BSP. To find ut in the optimal control
framework, we need to quantify the goal of the controller in a
cost function that will then be minimized by selecting the
optimal ut. For the linear state model in (2), if we pick the cost
function as a quadratic function of the state and control signals
given by
J~XT{1
t~1
x0tQxtzwru
2t
� �zx
0T QTxT , ð21Þ
where T is the time duration of anesthesia, Q and QT are
positive semidefinite and wr is positive, then the optimal
control signal at any time, ut, is simply a linear feedback of the
state at that time given by [8]
ut~{Ltxt, ð22Þ
where the feedback matrices, Lt, can be found recursively and
offline [8]. This is the linear-quadratic-regulator (LQR)
solution. Moreover, when the state model ½A,B� is controllable
(as is the case in our problem using the experimental fits; see
Results), there exists a steady-state solution, L, for the feedback
matrix in (22). This steady-state feedback matrix is the solution
to the discrete form of the famous algebraic Riccati equation
given by [8]
L~(wrzB’PB){1B’PA, ð23Þ
where
P~QzA’PA{A’PB(wrzB’PB){1B’PA: ð24Þ
In the general LQR formulation above, however, the goal is to
derive the states close to zero—while limiting the total amount of
control—as evident from the cost function in (21). In the control of
burst suppression, our goal is to achieve a desired non-zero target
BSP level, p�, or equivalently to take the effect-site concentration
state close to a non-zero target level x�~log (1zp�)=(1{p�)ð Þ,using as little drug as possible. Hence to find the solution, we
additionally shift the origin of the state-space to x� [14]. This way,
the control goal is equivalent to deriving the shifted state variable
close to zero, as in the classical LQR formulation. We show in the
Supporting Text S1 that, in our problem, it is possible to shift the
origin and the optimal drug infusion rate is in turn given by
ut~{L(xt{x�)zu� ð25Þ
where
x�~keckce
x�
x�
" #u�~
kc0kec
kce
x� ð26Þ
The value of xt at each time step is provided by the estimator.
Note that the LQR formulation does not impose any
constraints, such as positivity of the control variables. In practice
we can impose these constraints by bounding the LQR control
solution in (25) appropriately (for example if the solution is
negative, use zero instead). Another way to solve optimal control
problems with constraints is to use a model predictive control
approach as we develop next.
Model predictive controller. One approach to solve the
optimal control problem while explicitly imposing constraints on
the state and control variables is to use a model predictive
controller that approximately solves the constrained optimal
control problem at each time step t [8]. In model predictive
control, at every time step t we solve the optimization problem
minxtz1,���,xtzTh
,ut ,���,utzTh{1
XtzTh{1
t~t
(xt{x�)0Q(xt{x�)zwru
2t
� �ð27Þ
subject to ut[U and xtz1~AxtzBut t~t, � � � ,tzTh{1, ð28Þ
where Th is a finite control horizon, U is a convex set of
permissible control values, and xt is the input to the optimization
problem at time t and is given by the estimator (i.e., xt~xtDt). If
needed, we can also add constraints on the permissible state
variables in the optimization problem, i.e., xt[X ,Vt. Hence in
every time step, we solve one quadratic optimization problem over
the state and control variables. Since solving this constrained
optimization problem over the entire time course is computation-
ally expensive, smaller time horizons, Th, are selected in practice.
Solving this optimization problem and denoting the solutions by�xxtz1, � � � ,�xxtzTh
,�uut, � � � ,�uutzTh{1, the model predictive controller
Brain-Machine Interface to Control Medical Coma
PLOS Computational Biology | www.ploscompbiol.org 6 October 2013 | Volume 9 | Issue 10 | e1003284

takes ut~�uut as the drug infusion rate at time t. Note that again the
optimal control or drug infusion rate is a function of the value of
the current state xt, though a complicated function (i.e.,
ut~p(xt)). This process gets repeated for every time step.
In our BMI, we implement both the bounded LQR controller
and the model predictive controller in which such constraints (such
as positivity of drug infusion rates) are explicitly imposed in the
formulation. We show that in our problem, in which there are only
constraints on the drug infusion rate or equivalently the control
variable, the two approaches yield approximately the same
infusion rates. However, as we expand on in the Discussion
section, the recursive Bayesian estimator combined with the
implemented model predictive controller could solve more general
problems in which constraints are also required on the state
variables and could extend our framework to the joint control of
the anesthetic state and other vital states such as blood pressure.
Experimental Setup and Signal AcquisitionSurface EEG recordings were collected using extradural
electroencephalogram electrodes that were surgically implanted
at the following 4 stereotactic coordinates relative to lambda: A
(Anterior) 0 mm L (Lateral) 0 mm, A6L3, A6L-3, and A10L2
[6,15,16]. During implantation, general anesthesia was induced
with isoflurane. At the above four stereotactic coordinates, four
holes were made using a microdrill (Patterson Dental Supply Inc.,
Wilmington, MA). An electrode with mounting screw and socket
(Plastics One, Roanoke, VA) was screwed into each of these four
holes. The sockets were in turn inserted in a pedestal. Dental
acrylic cement was used to permanently fix the screws, sockets and
pedestal. Recording began after at least 7 days of recovery
following implantation.
During the experiment, the potential difference between
electrodes A0L0 and A6L3 was recorded and the signal was
referenced to A10L2 and recorded using a QP511 Quad AC
Amplifier System (Grass Instruments, West Warwick, RI) and a
USB-6009 14-bit data acquisition board (National Instruments,
Austin, TX). The binary signal was acquired at a sampling rate of
500 Hz and fed into our BMI. Our algorithm was implemented in
a simulink-matlab framework on a HP Probook 5430 s laptop.
This setup controlled a Physio 22 syringe pump (Harvard
Apparatus, Holliston, MA) to deliver the propofol infusion rate.
A 24 gauge intravenous catheter was placed in a lateral tail vein
during brief general anesthesia with isoflurane (2% to 3%) in
oxygen, and then the animal was allowed to fully recover from the
isoflurane general anesthetic in room air before the start of the
experiment. The temperature of the animal was monitored and
maintained in the normothermic range for the duration of the
experiment.
Experimental ProcedureFor all experiments, the magnitude of the raw EEG signal was
low-pass filtered below 5 Hz and then thresholded to convert it
into a binary signal. At the start of an experiment, the threshold
level was empirically chosen based on visual inspection of the BSP
and the corresponding binary data and based on the values of the
filtered EEG over the bursts and suppressions. Figure 1b shows the
burst-suppression raw EEG, filtered EEG and threshold, and the
resulting binary signal. The segmentation algorithm was run in
real time. Several preliminary boluses of propofol were adminis-
tered to each rat and the obtained BSP traces were used for system
identification in each animal (see System Identification section
below). The experiment was then conducted by giving the rat a
manual propofol bolus to induce a burst suppression state, and the
real-time BMI control experiment started once the BSP dropped
to a level of 0.1–0.3. In the real-time BMI experiments, the goal
was to acquire, maintain, and transition between three target BSP
levels (low, medium, high). The order of the target levels was
randomized. Each real-time BMI control experiment was
conducted for an average of 62 min. Three rats were available
for the experiments, weighing 366, 391, and 422 gr respectively.
Each rat was used for two real-time experiments, resulting in six
real-time experiments.
System IdentificationOur system identification procedure is conducted prior to real-
time BMI control for each animal in a preliminary experiment and
consists of two steps. First, a BSP signal is estimated from the
binary thresholded EEG trace using a special case of our recursive
Bayesian estimator in which we take the state to be the scalar
variable ze(t). Hence the corresponding state model in the
estimator imposes a smoothness constraint on ze(t) using a first-
order linear Gaussian process [17]. Specifically, we use a special
case of (10) as ze tð Þ~ze t{1ð Þzwt. Second, the corresponding
BSP estimate pt tj is fitted using a non-linear least-squares
procedure to minimize the sum-squared-error between the model
predicted BSP and the estimated BSP. The system parameters are
thus the solution to
arg minkce,kc0,kec
XT
t~1pt tj {psim
t kce,kc0,kecð Þ� 2 ð29Þ
where psimt (kce,kc0,kec) is the model predicted BSP given the
values for the system parameters (see Results and Figure 2).
Experimental Performance MetricsTo characterize the performance of the BMI at steady state, we
compute the error between the target BSP at each time, p�(t), and
the controlled BSP, pt tj , as
et~p� tð Þ{pt tj : ð30Þ
We use the error to calculate multiple standard metrics [18] of
performance. These metrics are the median absolute deviation
(MAD)
MAD~median etj jð Þ, ð31Þ
the median prediction error (MDPE)
MDPE~median et=p� tð Þð Þ|100, ð32Þ
and the median absolute performance error (MDAPE)
MDAPE~median etj j=p� tð Þð Þ|100: ð33Þ
The MDPE is a measure of bias at steady state and the MDAPE is
a measure of normalized error. We compute these metrics for low,
medium, and high target BSP levels and across all levels for each
experiment. The median is computed across data points at steady
state. Finally we compute the median of all these measures across
all experiments to quantify the overall performance of the BMI.
To characterize the performance of the BMI in transitioning
between target BSP levels, we calculate the rise time for an upward
transition and the fall time for a downward transition. These are
defined as the time it takes, once the target is changed, for the BSP
Brain-Machine Interface to Control Medical Coma
PLOS Computational Biology | www.ploscompbiol.org 7 October 2013 | Volume 9 | Issue 10 | e1003284

to reach within 0.05 BSP units of the new target BSP. We then
find the rate of BSP change defined as
rate~DBSP
transition timeð34Þ
and calculate the median of this rate across all upward transitions
and also across all downward transitions.
Bayesian Analysis of BMI PerformanceIn addition to calculating the steady-state error metrics above
for the low, medium, and high levels in each experiment, across all
levels for each experiment, and across all experiments (Table 1),
we also performed specific statistical assessments based on the
error distribution at each level to examine the reliability of the
BMI overall [19]. In particular, we considered the BMI to be
reliable at each level if its absolute error measure, etj j, was lower
than a specified value with high probability. Experimentally we
found that the absolute error at any time step in our BMI system
was almost always below 0:2. Therefore we considered the BMI to
be reliable at a given level if its absolute error at that level was less
than 0.15 with probability $0.95 and highly reliable if the absolute
error at each level was less than 0.10 with probability $0.95. This
is equivalent to the 95th percentile of the absolute error
distribution at a given level being less than 0.15 and 0.10,
respectively. Hence we can compute from the absolute error
distribution at each level the 95th percentile and consequently
identify the BMI performance at each level as reliable or not.
After evaluating the reliability of the BMI at each level
separately, we use a Bayesian analysis to identify the reliability
of the BMI across all levels. To do so, we combine the results of the
reliability assessments across all levels to compute an overall
assessment of reliability for the experiment. In our experiments, we
tested the BMI over 20 levels with the time duration at each level
between target transitions being 18.6 minutes on average. For the
purpose of steady-state error calculation, we remove 5 minutes of
data after an upward transition and 7 minutes of data after a
downward transition to ensure that the system is at steady-state
and to ensure approximate independence between levels. The
independence assumption between levels is justified because if we
assume even a high first-order serial correlation of 0.98 between
adjacent data points separated by one second and we allow
between 5 to 7 minutes for the transition between levels before
making the steady-state error calculations, then the maximum
correlation between the closest two points in immediately adjacent
levels is between (0:98420~2:1|10{4, 0:98300~2:3|10{3),where 420~7 min |60 data point per minute and 300~5minutes |60 data points per minute. Because these maximum
correlations are effectively 0, assuming independence between
levels is highly reasonable (we acknowledge that lack of correlation
is not equivalent to independence). Hence the data between levels
within animals are approximately independent so that the 20 levels
serve as the unit of analysis in the overall assessments of reliability.
Denoting the probability that the BMI system is reliable at any
level by pr, the total number of reliably controlled levels, k, is
binomially distributed with success probability pr out of n~20independent levels. The number of successes k is in turn equal to
the number of levels for which the BMI is identified as reliable as
described above. Given the binomial likelihood and taking the
prior distribution for pr to be the uniform distribution on the
interval (0, 1), it follows that the posterior distribution for pr is the
beta distribution with parameters a~kz1 and b~n{kz1[15,20]. We thus estimate pr as the mode of this beta distribution
and consider the BMI system reliable overall if the leftmost point
of the 95% credibility interval for pr is greater than 0.
Results
To test our closed-loop BMI system for control of medical
coma, we perform both simulation-based verification as well as
real-time in vivo experiments in rats. In both cases, we implement
the recursive Bayesian estimator combined with both the bounded
LQR controller as well as the model predictive controller. Using
both validation methods, we show that the closed-loop BMI
Table 1. Performance metrics across experiments.
Experiment # 1 2 3 4 5 6 Median
Low Level
Median Abs. Dev. 0.027 0.043 0.017 0.032 0.034 0.031 0.032
Median Abs. Perf. Error 5.43 10.72 4.90 11.44 8.47 6.18 7.32
Median Pred. Error 20.80 10.72 1.79 211.44 28.47 23.04 21.92
Mid Level
Median Abs. Dev. 0.018 0.016 0.019 0.017 0.052 0.019 0.019
Median Abs. Perf. Error 2.62 2.32 3.80 3.35 7.37 2.68 3.02
Median Pred. Error 1.75 1.00 20.40 21.45 27.37 20.06 20.23
High Level
Median Abs. Dev. 0.012 0.016 0.031 0.038 0.043 0.017 0.024
Median Abs. Perf. Error 1.35 1.75 3.69 4.35 4.81 1.87 2.78
Median Pred. Error 20.81 21.73 23.69 24.35 24.81 21.84 22.77
All Levels
Median Abs. Dev. 0.019 0.022 0.021 0.032 0.041 0.022 0.022
Median Abs. Perf. Error 2.82 3.01 4.14 4.98 5.61 3.07 3.61
Median Pred. Error 20.13 0.99 21.24 24.87 25.60 21.63 21.44
doi:10.1371/journal.pcbi.1003284.t001
Brain-Machine Interface to Control Medical Coma
PLOS Computational Biology | www.ploscompbiol.org 8 October 2013 | Volume 9 | Issue 10 | e1003284

system can accurately control time-varying target levels of burst
suppression in real time.
System IdentificationFor each experiment, we first performed the system identifica-
tion step for each animal using the scalar filtering and the
nonlinear least-squares model fitting (see Materials and Methods).
Figure 2 shows two sample BSP traces in response to boluses of
propofol administered in preliminary experiments prior to BMI
control, and the fitted system response of the second-order system
in (2). The estimated parameters for Figures 2a and 2b are
(kce,kec,kc0)~(5:6|10{5,0:078,0:006) and (kce,kec,kc0)~
(2:7|10{5,0:048,0:004), respectively. Once the system model
was fitted, the real-time BMI control experiments were conducted.
We use the fitted system model in Figure 2b for our simulation-
based verification below.
SimulationsWe first perform a set of simulations to verify the performance
of the closed-loop BMI system. In our simulations, we assume that
the anesthesia drug delivery period is a total of 45 minutes and
that the goal is to keep the BSP at three desired target levels, 0.4,
0.7, 0.9, each for 15 minutes. We simulate all 6 possible order
permutations of these levels. To run the simulations, we use the
estimated system model in Figure 2b. Note that all the fitted
system models in our experiments were controllable.
To specify the cost function (see (27) and Supporting Text
(S.18)), we take Q~0 0
0 1
� �. We choose this Q since the main
goal is to have the effect-site concentration close to the target value
and since the effect-site concentration is the observable through
the EEG. The choice of wr in turn depends on how fast we desire
the controller response to be. Smaller values of wr result in faster
controller response since the cost on the amount of drug infusion is
reduced. Here we pick wr~0:005 for our desired response.
We take the discretization step to be D~1 sec. This means that
the closed-loop system updates its estimate of the BSP and its drug
infusion rate every second. To simulate a trial of the closed-loop
controlled system response, at each time t we use ut{1 and xt{1 to
find xt using (2) with initial condition x0~0, u0~0. To get the
binary output of the thresholded EEG within this time step, we
generate a realization of the binomial distribution in (7) with mean
Npt~N1{exp {xe tð Þð Þ1zexp {xe tð Þð Þ and using a sampling rate of 10 Hz (i.e.,
taking N~10). Given this binomial realization, we use the
recursive Bayesian estimator to estimate the concentration state
xtDt, and then use this estimate as feedback in the controller to
decide on the infusion rate ut.
We impose the constraints on the control (i.e., drug infusion
rate) by first finding the unconstrained control solution from (25)
and then using the closest value to it in the constrained feasible set
U . For example, to impose positivity and for negative control
solutions we use zero instead. We can similarly do this for
constraints on the maximum drug infusion rate.
Figure 3 shows sample closed-loop controlled BSP traces for
each of the 6 possible permutations of the desired target
trajectories. Here the only imposed constraint is positivity of the
drug infusion rates. In each subfigure, the top panel shows the BSP
traces and the bottom panel shows the drug infusion rate. The
stochastic control framework can achieve successful control of
burst-suppression. The framework is particularly successful in
changing the BSP level without overshoot or undershoot.
We also tested the model predictive controller with various time
horizons, Th. In the model predictive controller, we impose the
constraints on the control inputs (i.e., drug infusion rates) explicitly
in the formulation and thus find the constrained (approximately)
optimal solution. Since our goal is to compare the bounded LQR
and MPC control strategies in this set of simulations, we assume
that both controllers know the BSP perfectly at each time (i.e., we
use the true xt as feedback in the controller). We compare the
MPC drug infusion rate with the bounded LQR infusion rate in
Figure 4, where the constraint is positivity on the drug infusion
rate. As we increase the optimization horizon, the two solutions
converge. This shows that, in this problem, solving the uncon-
strained LQR and then bounding it is approximately optimal. The
controlled BSP in Figure 3 is noisier than in Figure 4 because in
the former the BSP is estimated from a stochastic binary time-
series emulating the segmented EEG (Figure 1b) and in the latter
BSP is assumed to be perfectly known to the controllers. We can
also show that, similarly, when an upper-bound on the drug
infusion rate is desired, the two solutions again converge (Figure 5).
It is important to note, however, that in our problem no
constraints are placed on the state. Our recursive Bayesian
estimator combined with the implemented real-time MPC can
extend our framework to solving more complex problems with
constraints also on the state variables, such as blood pressure (see
Discussion).
Even though simulation-based validations are helpful in
assessing the behavior of the BMI, the true test of the BMI is in
in vivo experiments as we present below.
BMI for Closed-Loop Control of Medical Coma in RodentsWe implemented our BMI in experiments with rodents and
tested it for controlling the level of burst suppression in real time.
The BMI used the recursive Bayesian estimator combined with
either the bounded LQR controller or the MPC. The BMI in both
cases could successfully and accurately control the BSP level in
rodents in real time.
The control sessions lasted an average of 62 minutes and
consisted of at least 3 target BSP levels, thus requiring at least 3
transitions. Figure 6 shows the BSP and the drug infusion rate in 6
closed-loop BMI sessions that were run in real time in rodents (see
also Supporting Figure S1 that shows the evolution of xt in these
experiments). Figure 6a–e were run with the bounded LQR
controller and Figure 6f was run with the MPC. All experiments
except for the one in Figure 6e consisted of 3 target levels,
identified as low, medium, and high levels for the purpose of
metric calculation. The experiment in Figure 6e consisted of 5
target BSP levels and hence we identify the lowest two levels as the
low level and the highest two levels as the high level to calculate
the metrics.
As is evident in Figure 6, the BMI could successfully and
promptly transition between levels and accurately maintain the
BSP at a desired target level. At steady state, the BMI-controlled
BSP closely followed the target BSP level. The real-time variations
in the drug infusion rate at higher levels of BSP, e.g., at 0.9, were
larger than at the lower levels since larger amounts of propofol are
needed to keep the EEG in suppression 90% of the time while
allowing for the bursts 10% of the time (this can also be seen from
(1) by observing that Lxe tð Þ=Lpt is monotonically increasing with
pt). The MDAPE (measure of normalized error) across all
experiments for the low, medium, and high target BSP levels
was only 7.32%, 3.02%, and 2.78%, respectively. When consid-
ering all levels, the MDAPE was only 3.61% (Table 1). Moreover,
the deviation between the target BSP level and the BMI-controlled
BSP, measured through MAD, was 0.03 BSP units or less for any
level. Across all levels the MAD was only 0.02 BSP units (Table 1),
a negligible error in practice. Finally, the MDPE was small across
Brain-Machine Interface to Control Medical Coma
PLOS Computational Biology | www.ploscompbiol.org 9 October 2013 | Volume 9 | Issue 10 | e1003284

all levels. Together, these results demonstrate that the BMI
achieved precise control of multiple target burst suppression levels
at steady state within the same experimental session.
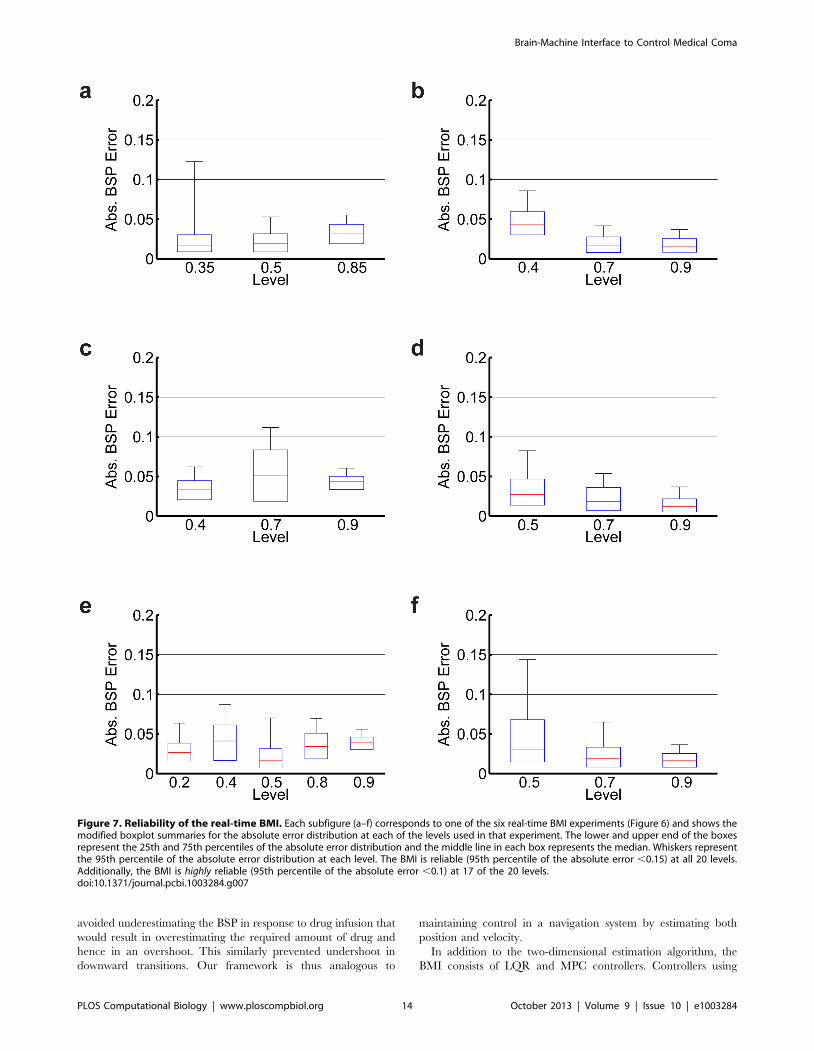
We also performed a Bayesian analysis to assess overall
reliability of the BMI based on the steady state error distributions
at each of the 20 levels used in the experiments (Materials and
Figure 3. Simulated closed-loop controlled BSP traces. In each subfigure, the top panel shows the BSP traces and the bottom panel shows thedrug infusion rate. In the top panels, sample trials of the closed-loop controlled BSP traces are shown in black and the corresponding estimated BSPtraces are shown in grey. The time-varying target BSP level is shown in green. The bottom panel shows the corresponding controller infusion rates.Each subfigure (a–f) corresponds to one possible permutation of the 3 BSP target levels.doi:10.1371/journal.pcbi.1003284.g003
Brain-Machine Interface to Control Medical Coma
PLOS Computational Biology | www.ploscompbiol.org 10 October 2013 | Volume 9 | Issue 10 | e1003284

Methods). The data at different levels within animal are
approximately independent so that the 20 levels serve as the unit
of analysis in the overall assessment of reliability. The 95th
percentile of the absolute error distribution at each of the 20 levels
was less than 0.15 giving a mode of the posterior density for pr
(probability that the BMI is reliable at any level) of ppr~20=20~1and a 95% credibility (Bayesian confidence) interval for pr of (0.87
to 1.00) (Figure 7). The lower bound of the 95% credibility interval
Figure 4. Comparison of the bounded LQR and MPC strategies. In each subfigure, the top panel shows the closed-loop controlled BSP tracesusing the bounded LQR control strategy and using the MPC strategy with various time horizons, Th~50,100,200 time samples (seconds). The bottompanel shows the corresponding drug infusion rates. The only constraint imposed here is non-negativity of the drug infusion rate. Each subfigure (a–f)corresponds to one possible permutation of the 3 BSP target levels.doi:10.1371/journal.pcbi.1003284.g004
Brain-Machine Interface to Control Medical Coma
PLOS Computational Biology | www.ploscompbiol.org 11 October 2013 | Volume 9 | Issue 10 | e1003284

of 0.87 is well above 0, the point of no control. These findings
establish that the system is reliable. In addition, for 17 out of 20 of
the levels the 95th percentile of the absolute error distribution was
less than 0.1, giving a mode of the posterior density for pr of
ppr~17=20~0:85 and a 95% credibility interval for pr of (0.67 to
1.00) (Figure 7). This finding suggests that furthermore the BMI
system meets our definition of being highly reliable overall. We
therefore conclude that the BMI system is highly reliable for real-
time control of medical coma using burst suppression across
dynamic targets.
In addition to accurate and reliable control at steady state, the
BMI was especially successful in promptly transitioning between
target BSP levels. The BMI could increase the level of BSP rapidly,
while avoiding overshoot. To increase the BSP, the BMI
immediately increased the drug infusion rate once the target was
increased, and then gradually reduced the infusion rate until the
BSP approached the new target level. The rate at which the BMI
increased the BSP level was 0.32 BSP units per minute. The
median rise time in our experiments was under a minute
(49 seconds).
The BMI was also able to decrease the BSP level without
undershoot. To decrease the BSP, the BMI first stopped the drug
infusion and then gradually restarted it once the BSP approached
the lower target BSP level. The rate at which the BMI could
decrease the BSP level was 0.11 BSP units per minute. In
decreasing the level of BSP, the time response of the BMI is mainly
governed by the clearance rate in the pharmacokinetic model of
the rat. Hence although the controller stopped the drug infusion
immediately once the target was dropped, it took a few minutes for
the BSP to go down to the desired target level. The median fall
time in our experiments was 4.45 minutes.
These results thus demonstrate the feasibility of automatic
reliable and accurate control of medically-induced coma using a
BMI.
Discussion
To study the feasibility of automating control of medically-
induced coma, we developed a BMI to control burst suppression in
a rodent model. Our BMI system reliably and accurately
controlled burst suppression in individual rodents across dynamic
target trajectories. The BMI promptly changed the BSP in
response to a change in target level without overshoot or
undershoot and accurately maintained a desired target BSP level
with a median performance error of 3.6% and a percent bias
of -1.4%.
BMI Development for Control of Anesthesia-InducedBrain States
Our work contributes to the extensive BMI research in
anesthesiology aimed at controlling brain states under general
anesthesia. This field began in the 1950s [21–23] and developed
further in the 1980s [24]. BMI systems for control of sedation are
now commercially available [25] and have been recently approved
for use in the United States. The most commonly used control
signal is the Bispectral Index (BIS) [26–40]. Other control signals
include an auditory evoked potential index [41], the spectrogram
median frequency [24,42,43], a wavelet-based index [44] and an
entropy measure [45]. Both standard and non-standard control
paradigms [24,27,35,41,45] have been used in these systems with
the principal objective being control of unconsciousness [24,26–
32,34,44]. A recent report controlled both antinociception and
unconsciousness [45]. Although several criteria have been
established for successful control, a criterion used in BIS studies
has been maintaining BIS not at a specific value but in the broad
range between 40 to 60 [26–39]. Vijn and Sneyd [6] and Cotten et
al. [7] controlled constant target levels of burst suppression in
rodent models and reported average control results over rodents.
Schwilden demonstrated control of median frequency in individ-
ual human subjects [24]. None of these studies considered control
of dynamic time-varying trajectories.
We developed a BMI for real-time control of burst suppression
across time-varying target levels in individual rodents using a
stochastic control framework. Our stochastic control framework
consists of a two-dimensional state estimator and an optimal
feedback controller. In our formulation, we assumed a stochastic
form of the log transformed version of our system to incorporate
Figure 5. Comparison of the bounded LQR and MPC strategies with upper-bound constraints on the drug infusion rates. In eachsubfigure, the top panel shows the closed-loop controlled BSP traces using the bounded LQR control strategy and using the MPC strategy withvarious time horizons, Th~50,100,200 time samples (seconds). The bottom panel shows the corresponding drug infusion rates. In addition to beingnon-negative, here the drug infusion rate is required to be less than 2.4 mg/min. Here we have shown two example permutations of the target levelsbut the bounded LQR and the MPC drug infusion rates converge with increasing Th in all cases.doi:10.1371/journal.pcbi.1003284.g005
Brain-Machine Interface to Control Medical Coma
PLOS Computational Biology | www.ploscompbiol.org 12 October 2013 | Volume 9 | Issue 10 | e1003284

both the two-dimensional system model and noise in our estimates
and to ensure non-negative concentration estimates (Eqs. (2) and
(6)). This model-based two-dimensional state estimator is one
major reason that the current BMI largely avoided overshoot and
undershoot. By incorporating the two-dimensional stochastic
dynamic model and computing both xe(t) and xc(t) at each
update (Eqs. (14)–(17)), the estimator predicted the effect of the
real-time drug infusion rate on the BSP. In upward transitions, this
Figure 6. In vivo real-time BMI control of burst suppression in individual rodents. In each subfigure, the top panel shows the estimatedclosed-loop controlled BSP trace (black) and the time-varying target level (green), and the bottom panel shows the corresponding BMI drug infusionrate using the bounded LQR strategy (a–e) and the MPC strategy (f).doi:10.1371/journal.pcbi.1003284.g006
Brain-Machine Interface to Control Medical Coma
PLOS Computational Biology | www.ploscompbiol.org 13 October 2013 | Volume 9 | Issue 10 | e1003284
avoided underestimating the BSP in response to drug infusion that
would result in overestimating the required amount of drug and
hence in an overshoot. This similarly prevented undershoot in
downward transitions. Our framework is thus analogous to
maintaining control in a navigation system by estimating both
position and velocity.
In addition to the two-dimensional estimation algorithm, the
BMI consists of LQR and MPC controllers. Controllers using
Figure 7. Reliability of the real-time BMI. Each subfigure (a–f) corresponds to one of the six real-time BMI experiments (Figure 6) and shows themodified boxplot summaries for the absolute error distribution at each of the levels used in that experiment. The lower and upper end of the boxesrepresent the 25th and 75th percentiles of the absolute error distribution and the middle line in each box represents the median. Whiskers representthe 95th percentile of the absolute error distribution at each level. The BMI is reliable (95th percentile of the absolute error ,0.15) at all 20 levels.Additionally, the BMI is highly reliable (95th percentile of the absolute error ,0.1) at 17 of the 20 levels.doi:10.1371/journal.pcbi.1003284.g007
Brain-Machine Interface to Control Medical Coma
PLOS Computational Biology | www.ploscompbiol.org 14 October 2013 | Volume 9 | Issue 10 | e1003284

MPC and LQR strategies have been used successfully in many
applications. We recently demonstrated the success of a LQR
paradigm to control a motor neuroprosthetic device using point
process observations of spiking activity and a linear Gaussian
kinematic state model [46–50]. MPC has been widely used in
process control and chemical industries [51–53] and has been
previously applied to closed-loop administration of analgesics
[54], for sedation control using the BIS as the control signal
[55] and in a simulation study for control of BIS during
surgery [40]. The LQR and MPC controllers are both
formulated in an optimal feedback control framework [8].
They specify the control objective as a cost function to be
minimized by selecting the optimal infusion rates. We can
therefore adjust the behavior of these controllers, for example
the speed of transitions, by adjusting the penalty on various
terms in the cost function. While our LQR implementation
imposes constraints on the drug infusion rates by bounding the
control solution, our MPC implementation allows us to impose
explicitly any required constraints on both the states and the
drug infusion rates, such as non-negative or bounded infusion
rates, by solving a constrained optimization problem at each
time step in real time. For example, if the BMI system always
needed to keep the drug infusion rate below a specified
maximum level, the MPC controller could impose this
explicitly in the solution. Since the only constraints in our
problem were on the control variable (i.e., the infusion rate),
the LQR and MPC strategies performed similarly (Figure 5).
However, the recursive Bayesian estimator combined with the
real-time MPC strategy can be used to solve problems that
require constraints on the state variables as well. This situation
could arise in problems requiring joint control of multiple state
variables, such as controlling simultaneously the anesthetic
level and other physiological variables such as blood pressure
and heart rate.
Other approaches can also be used for anesthesia control. We
recently reported successful control of burst suppression using a
proportional-integral (PI) controller in simulated rodent [11],
simulated human [11], and actual rodent experiments [19]. The
experimental studies differed from the ones presented here in that
the transitions between target levels were carried out in 5 to
10 minutes ramps. Also, the BSP estimation algorithm in those
studies was one rather than two dimensional. Given the stochastic
two-dimensional dynamic model and the EEG signal, here we
used a stochastic control paradigm consisting of a two-dimensional
estimator and an optimal feedback controller in place of the one
dimensional estimator and the deterministic PI controller. The
model-based two-dimensional state estimator in our framework is
one major reason that the current BMI can both make prompt
and reliable transitions between levels (median rise time of
49 seconds and fall time of 4.45 minutes) and avoids BSP
overshoots and undershoots in any transitions. The stochastic
control framework also offers tremendous flexibility. In particular,
the MPC allows us to extend the BMI to control with constraints
on the control variable and a vital variable such as blood pressure.
The stochastic optimal formulation also provides a framework for
adjusting the behavior of the BMI by simply modifying the cost
function. Finally, while the mathematical derivation for the
stochastic framework may be more complex, the final infusion
rate solution is straight forward. The LQR solution is given simply
by a linear function of the state estimate at each time. The MPC
controller optimization problem is convex and can be solved using
existing convex optimization software. Indeed we ran the MPC in
real-time in our rodent experiments on a standard laptop
(Figure 6f).
A BMI System for Control of Burst SuppressionWe chose levels of burst suppression as a control target because
it is a physiologically defined brain state [4,5] with a well-defined
EEG signature that can be readily characterized in real time for
the purpose of control. The linear two-dimensional state model
(Eq. (2)) is the simplest pharmacokinetics representation for
relating the concentrations of anesthetic in the blood and in the
brain to BSP (Eq. (1)) computed from burst suppression in the
EEG. This simplified two-compartment model was sufficient in
our experiments to achieve reliable and accurate control of burst
suppression.
Our Bayesian state estimator (Eqs. (14)–(17)) computes the
central compartment and the effect-site concentrations in real time
from the EEG converted into binary observations. Here, both the
prior state model (Eq. (6)) and the binomial observation model (Eq.
(7)) are non-linear functions of the state. We thus use two
approximations at each time step to derive the estimator
recursions, a linear approximation to the prior model at that step
and a Gaussian approximation to the posterior model. Gaussian
Laplace-type approximations have been successfully used in many
applications for example in our previous work estimating states
with linear prior models from point process observations of neural
spiking activity [12,13,47–50,56–59]. Our system identification
procedure used the one-dimensional version of the binary filter,
coupled with a non-linear least squares procedure to estimate
model parameters (Eq. (2)) for each animal and thereby,
implement individually tailored control strategies. Future work
can extend this system identification procedure to an efficient
expectation-maximization (EM) algorithm by replacing the one-
dimensional binary filter algorithm with the current Bayesian state
estimator [13,60], or can design an adaptive estimator that not
only computes the BSP but also updates the system parameters
during the several hours of real-time control.
We demonstrated in a rodent model that the BMI achieved
reliable and accurate control of burst suppression. It would also be
valuable as a next step to test this BMI in a rodent model of
refractory seizures or intractable intracranial hypertension prior to
testing it in humans.
A BMI System for Control of Medically-Induced Coma andStates of General Anesthesia
A BMI system to automatically control medically-induced coma
could provide considerable cost-saving and therapeutic benefits.
Although the state of medical coma is often required for several
days, it is achieved by manually adjusting the anesthetic infusion
rate to maintain a specified level of burst suppression assessed by
continual visual inspection of the EEG. Automated control would
allow much more efficient use of intensive care unit personnel as a
single nurse per shift would not have to be solely dedicated to the
task of manually managing the drug infusion of a single patient for
several days. Hence even assuming the same patient outcomes
between automated and manual control, there could be important
savings in intensive care unit resources under the automated
control regimen.
In addition to the inefficient use of the intensive care unit staff,
manual manipulation of the infusion rate does not approximate
the infusion rate changes of an automatic controller (Figure 6).
Similarly, visual inspection of the EEG does not provide an
accurate estimate of the state of burst suppression. The current
work establishes the feasibility of implementing automated,
accurate and reliable control of medical coma in a rodent model
suggesting that a BMI could be developed to study whether such
accurate control improves patient outcomes. For example, reliable
and accurate control of medical coma could offer the possibility of
Brain-Machine Interface to Control Medical Coma
PLOS Computational Biology | www.ploscompbiol.org 15 October 2013 | Volume 9 | Issue 10 | e1003284

ensuring adequate brain protection for intracranial hypertension
and adequate therapy for status epilepticus while using the least
amount of anesthetic and minimizing overshoots when transition-
ing to a desired level of burst suppression. Reliable and accurate
control would also make it easier to induce periodic arousals to
conduct neurological assessments and prevent anesthetic overdose
syndrome [61]. To establish these potential therapeutic benefits of
reliable and accurate control of medical coma, outcome studies in
rodent models of intracranial pressure and status epilepticus will
be required before proceeding to human investigations.
We have also shown that other states of general anesthesia have
well defined EEG signatures [62,63]. Therefore, the ability of our
BMI to track accurately changing target levels of burst suppression
further suggests that it could be adapted to control states of general
anesthesia and sedation for patients requiring surgical or non-
surgical procedures. Our stochastic estimation paradigm and model
predictive controller could also be used to control jointly the state of
general anesthesia and physiological variables such as blood
pressure. These investigations will be the topics of future reports.
Supporting Information
Figure S1 Evolution of xc and xe in real-time BMIexperiments. Each subfigure shows the estimated xc(t) (top
panel) and xe(t) (bottom panel) in the six real-time BMI
experiments (Figure 6) using the bounded LQR strategy (a–e)
and the MPC strategy (f).
(TIF)
Text S1 Derivation of the update step of the recursiveBayesian estimator and the optimal feedback controlsolution.
(PDF)
Author Contributions
Conceived and designed the experiments: MMS JJC ENB. Performed the
experiments: MMS JJC. Analyzed the data: MMS JJC. Contributed
reagents/materials/analysis tools: MMS JJC ML KS. Wrote the paper:
MMS ENB.
References
1. Rossetti AO, Reichhart MD, Schaller MD, Despland PA, Bogousslavsky J (2004)
Propofol treatment of refractory status epilepticus: a study of 31 episodes.Epilepsia 45: 757–763.
2. Doyle PW, Matta BF (1999) Burst suppression or isoelectric encephalogram forcerebral protection: evidence from metabolic suppression studies. Br J Anaesth
83: 580–584.
3. Hunter G, Young GB (2012) Status epilepticus: a review, with emphasis on
refractory cases. Can J Neurol Sci 39: 157–169.
4. Amzica F (2009) Basic physiology of burst-suppression. Epilepsia 50 (Suppl 12):38–39.
5. Ching S, Purdon PL, Vijayan S, Kopell NJ, Brown EN (2012) Aneurophysiological-metabolic model for burst suppression. Proc Natl Acad Sci
USA 109: 3095–3100.
6. Vijn PCM, Sneyd JR (1998) I.v. anesthesia and EEG burst suppression in rats:
bolus injections and closed-loop infusions. Br J Anaesth 81: 415–421.
7. Cotten JF, Ge RL, Banacos N, Pejo E, Husain SS, et al. (2011) Closed-loop
continuous infusions of etomidate and etomidate analogs in rats: A comparativestudy of dosing and the impact on adrenocortical function. Anesthesiology 115:
764–773.
8. Bertsekas D (2005) Dynamic Programming and Optimal Control. Athena
Scientific.
9. Schnider TW, Minto CF, Gambus PL, Andresen C, Goodale DB, et al. (1998)
The influence of method of administration and covariates on the pharmaco-
kinetics of propofol in adult volunteers. Anesthesiology 88: 1170–1182.
10. Arden JR, Holley FO, Stanski DR (1986) Increased sensitivity to etomidate in
the elderly: initial distribution versus altered brain response. Anesthesiology 65:19–27.
11. Liberman MY, Ching S, Chemali J, Brown EN (2013) A closed-loop anestheticdelivery system for real-time control of burst suppression. J Neural Eng 10:
046004.
12. Brown EN, Frank LM, Tang D, Quirk MC, Wilson MA (1998) A statistical
paradigm for neural spike train decoding applied to position prediction fromensemble firing patterns of rat hippocampal place cells. J Neurosci 18: 7411–
7425.
13. Smith AC, Brown EN (2003) Estimating a state-space model from point process
observations. Neural Comput 15: 965–991.
14. Kwakernaak K, Sivan R (1972) Linear Optimal Control Systems. New York,
NY: Wiley- Interscience.
15. Chemali J, Dort CV, Brown E, Solt K (2012) Active emergence from propofol
general anesthesia is induced by methylphenidate. Anesthesiology 116: 998–
1005.
16. Solt K, Cotten J, Cimenser A, Wong K, Chemali J, et al. (2011)
Methylphenidate actively induces emergence from general anesthesia. Anesthe-siology 115: 791–803.
17. Chemali J, Ching S, Purdon PL, Solt K, Brown EN (2013) Burst suppressionprobability algorithms: state-space methods for tracking EEG burst suppression.
J Neural Eng 10: 056017.
18. Varvel J, Donoho D, Shafer S (1992) Measuring the predictive performance of
computer-controlled infusion pumps. J Pharmacokinet Biopharm 20: 63–94.
19. Ching S, Liberman MY, Chemali JJ, Westover MB, Kenny J, et al. (2013) Real-
time closed-loop control in a rodent model of medically induced coma usingburst suppression. Anesthesiology [Epub ahead of print].
20. DeGroot M, Schervish M (2002) Probability and Statistics. Boston, MA:Addison-Wesley.
21. Bickford RG (1950) Automatic electroencephalographic control of generalanesthesia. EEG Clin Neurophysiol 2: 93–96.
22. Bickford RG (1951) Use of frequency discrimination in the automatic
electroencephalographic control of anesthesia (servo-anesthesia). EEG Clin
Neurophysiol 3: 83–86.
23. Mayo CW, Bickford RG, Jr AF (1950) Electroencephalographically controlled
anesthesia in abdominal surgery. J Am Med Assoc 144: 1081–1083.
24. Schwilden H, Schuttler J, Stoeckel H (1987) Closed-loop feedback control of
methohexital anesthesia by quantitative EEG analysis in humans. Anesthesiol-
ogy 67: 341–347.
25. Rinehart J, Liu N, Alexander B, Cannesson M (2012) Review article: closed-loop
systems in anesthesia: is there a potential for closed-loop uid management and
hemodynamic optimization? Anesth Analg 114: 130–143.
26. Struys MM, De Smet T, Versichelen LF, Velde SVD, den Broecke RV, et al.
(2001) Comparison of closed-loop controlled administration of propofol using
bispectral index as the controlled variable versus ‘‘standard practice’’ controlled
administration. Anesthesiology 95: 6–17.
27. Puri GD, Kumar B, Aveek J (2007) Closed-loop anaesthesia delivery system
(CLADS) using bispectral index: a performance assessment study. Anaesthesia
and intensive care 35: 357–362.
28. Agarwal J, Puri GD, Mathew PJ (2009) Comparison of closed loop vs. manual
administration of propofol using the bispectral index in cardiac surgery. Acta
anaesthesiologica Scandinavia 53: 390–397.
29. De Smet T, Struys MM, Neckebroek MM, den Hauwe KV, Bonte S, et al.
(2008) The accuracy and clinical feasibility of a new bayesian-based closed-loop
control system for propofol administration using the bispectral index as a
controlled variable. Anesthesia and analgesia 107: 1200–1210.
30. Hemmerling TM, Charabati S, Zaouter C, Minardi C, Mathieu PA (2010) A
randomized controlled trial demonstrates that a novel closed-loop propofol
system performs better hypnosis control than manual administration. J Can
Anesth 57: 725–735.
31. Liu N, Chazot T, Trillat B, Michel-Cherqui M, Marandon JY, et al. (2008)
Closed-loop control of consciousness during lung transplantation: an observa-
tional study. Journal of cardiothoracic and vascular anesthesia 22: 611–615.
32. Liu N, Chazot T, Genty A, Landais A, Restoux A, et al. (2006) Titration of
propofol for anesthetic induction and maintenance guided by the bispectral
index: closed-loop versus manual control: a prospective, randomized, multicen-
ter study. Anesthesiology 104: 686–695.
33. Absalom AR, Kenny GN (2003) Closed-loop control of propofol anaesthesia
using bispectral index: performance assessment in patients receiving computer-
controlled propofol and manually controlled remifentanil infusions for minor
surgery. British Journal of Anaesthesia 90: 737–741.
34. Absalom AR, Sutcliffe N, Kenny GN (2002) Closed-loop control of anesthesia
using bispectral index: performance assessment in patients undergoing major
orthopedic surgery under combined general and regional anesthesia. Anesthe-
siology 96: 67–73.
35. De Smet T, Struys MM, Greenwald S, Mortier EP, Shafer SL (2007) Estimation
of optimal modeling weights for a bayesian-based closed-loop system for
propofol administration using the bispectral index as a controlled variable: a
simulation study. Anesthesia and analgesia 105: 1629–1638.
36. Haddad WM, Bailey JM, Hayakawa T, Hovakimyan N (2007) Neural network
adaptive output feedback control for intensive care unit sedation and
intraoperative anesthesia. IEEE Transactions on Neural Networks/a publication
of the IEEE Neural Networks Council 18: 1049–1066.
37. Hegde HV, Puri GD, Kumar B, Behera A (2009) Bi-spectral index guided
closed-loop anaesthesia delivery system (CLADS) in pheochromocytoma.
Journal of clinical monitoring and computing 23: 189–196.
Brain-Machine Interface to Control Medical Coma
PLOS Computational Biology | www.ploscompbiol.org 16 October 2013 | Volume 9 | Issue 10 | e1003284

38. Morley A, Derrick J, Mainland P, Lee BB, Short TG (2000) Closed loop control
of anaesthesia: an assessment of the bispectral index as the target of control.Anaesthesia 55: 953–959.
39. Mortier E, Struys M, De Smet T, Versichelen L, Rolly G (1998) Closed-loop
controlled administration of propofol using bispectral analysis. Anaesthesia 53:749–754.
40. Ionescu CM, Keyser RD, Torrico BC, De Smet T, Struys MM, et al. (2008)Robust predictive control strategy applied for propofol dosing using BIS as a
controlled variable during anesthesia. IEEE Trans Biomed Eng 55: 2161–2170.
41. Kenny GN, Mantzaridis H (1999) Closed-loop control of propofol anaesthesia.British journal of anaesthesia 83: 223–228.
42. Schwilden H, Stoeckel H (1993) Closed-loop feedback controlled administrationof alfentanil during alfentanil-nitrous oxide anaesthesia. British journal of
anaesthesia 70: 389–393.43. Schwilden H, Stoeckel H, Schuttler J (1989) Closed-loop feedback control of
propofol anaesthesia by quantitative EEG analysis in humans. British journal of
anaesthesia 62: 290–296.44. Hahn JO, Dumont GA, Ansermino JM (2011) Closed-loop anesthetic drug
concentration estimation using clinical-effect feedback. IEEE Transactions onBiomedical Engineering 58: 3–6.
45. Liu N, Guen ML, Benabbes-Lambert F, Chazot T, Trillat B, et al. (2012)
Feasibility of closed-loop titration of propofol and remifentanil guided by thespectral M-Entropy monitor. Anesthesiology 116: 286–295.
46. Shanechi MM, Wornell GW, Williams ZM, Brown EN (2010) A parallel point-process filter for estimation of goal-directed movements from neural signals. In:
Proc. IEEE international conference on acoustics, speech, and signal processing(ICASSP). Dallas, TX, pp. 521–524.
47. Shanechi MM, Williams ZM, Wornell GW, Brown EN (2011) A brain-machine
interface combining target and trajectory information using optimal feedbackcontrol. In: Computational and Systems Neuroscience (COSYNE) Meeting. Salt
Lake City, USA.48. Shanechi MM, Wornell GW, Williams ZM, Brown EN (2012) Feedback-
controlled parallel point process filter for estimation of goal-directed movements
from neural signals. IEEE Trans Neural Syst Rehabil Eng 21(1):129–40 doi:10.1109/TNSRE.2012.2221743.
49. Shanechi MM, Hu RC, Powers M, Wornell GW, Brown EN, et al. (2012)Neural population partitioning and a concurrent brain-machine interface for
sequential motor function. Nat Neurosci 15: 1715–1722.
50. Shanechi MM, Williams ZM,Wornell GW, Hu R, Powers M, et al.
(2013) A real-time brain-machine interface combining motor target and
trajectory intent using an optimal feedback control design. PLOS ONE 8:
e59049.
51. Morari M, Lee JH (1999) Model predictive control: past, present and future.
Computers and Chemical Engineering 23: 667–682.
52. Mayne DQ, Rawlings JB, Rao CV, Scokaert POM (2000) Constrained model
predictive control: Stability and optimality. Automatica 36: 789–814.
53. Camponogara E, Jia D, Krogh BH, Talukdar S (2002) Distributed model
predictive control. IEEE Control Systems Magazine 22: 44–52.
54. Gentilini A, Schaniel C, Morari M, Bieniok C, Wymann R, et al. (2002) A new
paradigm for the closed-loop intraoperative administration of analgesics in
humans. IEEE Trans Biomed Eng 49: 289–299.
55. Sawaguchi Y, Furutani E, Shirakami G, Araki M, Fukuda K (2008) Model-
predictive hypnosis control system under total intravenous anesthesia. IEEE
Trans Biomed Eng 55: 874–887.
56. Eden UT, Frank LM, Barbieri R, Solo V, Brown EN (2004) Dynamic analysis of
neural encoding by point process adaptive filtering. Neural Comput 16: 971–
998.
57. Smith AC, Frank LM, Wirth S, Yanike M, Hu D, et al. (2004) Dynamic analysis
of learning in behavioral experiments. J Neurosci 24: 447–461.
58. Smith AC, Shah SA, Hudson AE, Purpura KP, Victor JD, et al. (2009) A
Bayesian statistical analysis of behavioral facilitation associated with deep brain
stimulation. J Neurosci Meth 183: 267–276.
59. Smith AC, Scalon JD, Wirth S, Yanike M, Suzuki WA, et al. (2010) State-space
algorithms for estimating spike rate functions. Computational Intelligence and
Neuroscience 2010: 426539.
60. Dempster AP, Laird NM, Rubin DB (1977) Maximum likelihood from
incomplete data via the EM algorithm. J Roy Statist Soc B 39: 1–38.
61. Kam PC, Cardone D (2007) Propofol infusion syndrome. Anaesthesia 62: 690–
701.
62. Lewis LD,Weiner VS, Mukamel EA, Donoghue JA, Eskandar EN, et al. (2012)
Rapid fragmentation of neuronal networks at the onset of propofol-induced
unconsciousness. Proc Natl Acad Sci USA 109: E3377–E3386.
63. Purdon P, Pierce E, Mukamel E, Prerau M, Walsh J, et al. (2013)
Electroencephalogram signatures of loss and recovery of consciousness from
propofol. Proc Natl Acad Sci USA 105: E1142–E1151.
Brain-Machine Interface to Control Medical Coma
PLOS Computational Biology | www.ploscompbiol.org 17 October 2013 | Volume 9 | Issue 10 | e1003284