Embed Size (px)
Citation preview

REF: PFIA-8RWQD5
PRUDENTIAL REAL ESTATE INVESTORS
A Bird’s Eye View of Global Real Estate Markets: 2012 Update FEBRUARY 2012
US Research Paul Fiorilla Vice President [email protected] Manidipa Kapas, CFA Director [email protected] Youguo Liang, PhD, CFA Managing Director [email protected]
1
PRUDENTIAL REAL ESTATE INVESTORS
Executive Summary
• PREI’s global universe of institutional-grade commercial real estate encompassed an estimated
$26.6 trillion in US dollars in 2011. By region, Europe had the most by volume with $9.4 trillion,
followed by US/Canada ($7.5 trillion), Asia-Pacific ($7.2 trillion), Latin America ($1.8 trillion) and
the Gulf Cooperation Council, or GCC ($677 billion).
• Commercial real estate volume is concentrated in a small number of key countries. The US
contains slightly more than one-quarter of all CRE globally (25.4%), followed by Japan (10.1%),
China (7%), Germany (6.1%) and the United Kingdom (5.2%).
• Developed nations dominate the distribution of CRE, representing 75.8% of all commercial real
estate by value. Europe encompasses 30.4% of all CRE, followed by the US/Canada (28.4%) and
Developed Asia (17%).
• Growth over the next decade will be disproportionately dominated by developing countries. By
2021, we forecast that developing countries will encompass 42.8% of the CRE market, up from
24.2% in 2011. The growth will be driven primarily by China.
• On an absolute basis, slightly more than half of the growth in CRE volume over the next decade
will come from China and the US. Combined, they represent 51.5% of the incremental growth in
CRE volume over the next 10 years.
Global Real Estate Investment Universe
This report represents Prudential’s latest study on the size of the global institutional-grade commercial real
estate market. We estimate the value of CRE markets, not only at the present time but over the next 10-year
and 20-year periods. Our analysis is done by country, but we also sort the data into regions and blocs of
developed and developing countries. The goal is to understand the relative size of markets and where growth is
likely to come from in the future, information which should enable investors to better make informed decisions
about strategy.
As of 2011, Prudential’s global CRE universe – encompassing 55 countries with 4.9 billion people that produce
a combined GDP of $65 trillion – totaled $26.6 trillion in value (Chart 1). By region, Europe, the bloc with the
largest number of countries (25), had the largest total value, at $9.4 trillion. The US/Canada totaled $7.5 trillion,
followed by Asia-Pacific ($7.2 trillion), Latin America ($1.8 trillion) and the six-nation Gulf Cooperation Council,
or GCC ($677 billion).
We also group the countries into risk blocs based on region and developed/developing status as defined by the
World Bank. The US/Canada is developed, while all countries in Latin America and the GCC are developing.
Developed Europe encompasses Austria, Belgium, Denmark, Finland, France, Germany, Greece, Ireland, Italy,
Netherlands, Norway, Portugal, Spain, Sweden, Switzerland and the UK, while the rest of Europe is developing.
Developed Asia-Pacific encompasses Australia, Hong Kong, Japan, South Korea, New Zealand, Singapore and
Taiwan, while all other Asia-Pacific nations are developing.
2
PRUDENTIAL REAL ESTATE INVESTORS
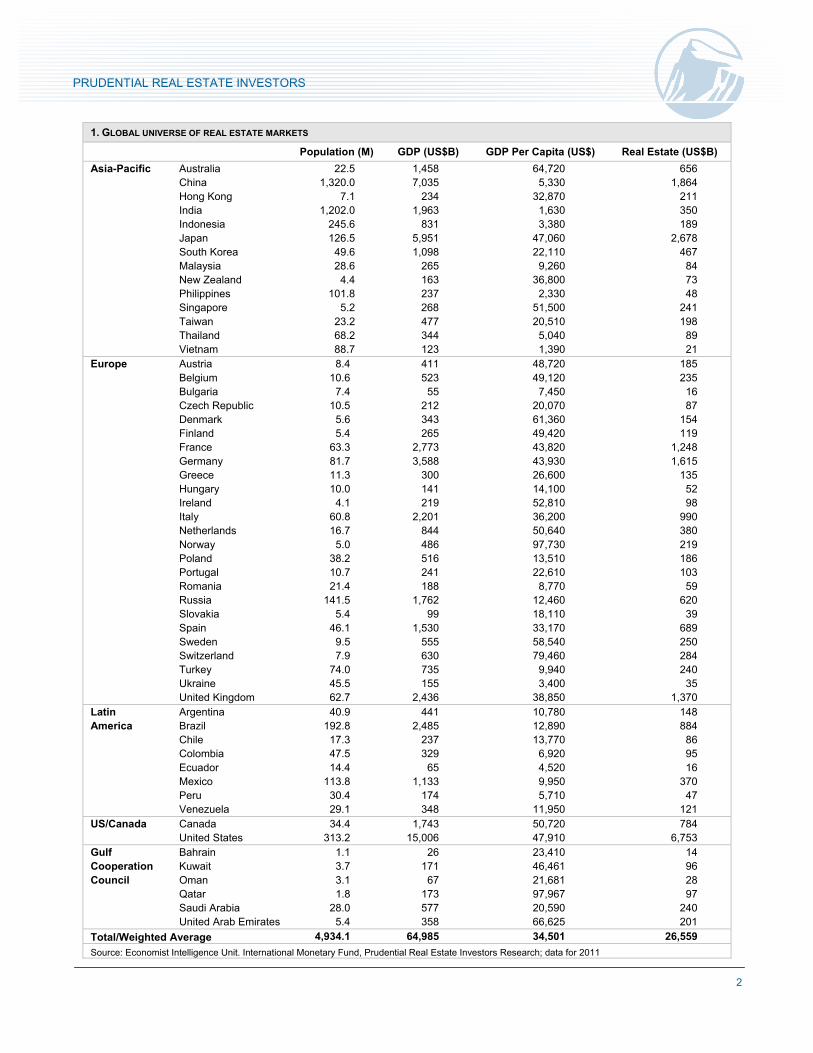
1. GLOBAL UNIVERSE OF REAL ESTATE MARKETS
Population (M) GDP (US$B) GDP Per Capita (US$) Real Estate (US$B)
Asia-Pacific Australia 22.5 1,458 64,720 656 China 1,320.0 7,035 5,330 1,864 Hong Kong 7.1 234 32,870 211 India 1,202.0 1,963 1,630 350 Indonesia 245.6 831 3,380 189 Japan 126.5 5,951 47,060 2,678 South Korea 49.6 1,098 22,110 467 Malaysia 28.6 265 9,260 84 New Zealand 4.4 163 36,800 73 Philippines 101.8 237 2,330 48 Singapore 5.2 268 51,500 241 Taiwan 23.2 477 20,510 198 Thailand 68.2 344 5,040 89
Vietnam 88.7 123 1,390 21 Europe Austria 8.4 411 48,720 185
Belgium 10.6 523 49,120 235 Bulgaria 7.4 55 7,450 16 Czech Republic 10.5 212 20,070 87 Denmark 5.6 343 61,360 154 Finland 5.4 265 49,420 119 France 63.3 2,773 43,820 1,248 Germany 81.7 3,588 43,930 1,615 Greece 11.3 300 26,600 135 Hungary 10.0 141 14,100 52 Ireland 4.1 219 52,810 98 Italy 60.8 2,201 36,200 990 Netherlands 16.7 844 50,640 380 Norway 5.0 486 97,730 219 Poland 38.2 516 13,510 186 Portugal 10.7 241 22,610 103 Romania 21.4 188 8,770 59 Russia 141.5 1,762 12,460 620 Slovakia 5.4 99 18,110 39 Spain 46.1 1,530 33,170 689 Sweden 9.5 555 58,540 250 Switzerland 7.9 630 79,460 284 Turkey 74.0 735 9,940 240 Ukraine 45.5 155 3,400 35
United Kingdom 62.7 2,436 38,850 1,370 Latin Argentina 40.9 441 10,780 148 America Brazil 192.8 2,485 12,890 884
Chile 17.3 237 13,770 86 Colombia 47.5 329 6,920 95 Ecuador 14.4 65 4,520 16 Mexico 113.8 1,133 9,950 370 Peru 30.4 174 5,710 47
Venezuela 29.1 348 11,950 121 US/Canada Canada 34.4 1,743 50,720 784 United States 313.2 15,006 47,910 6,753 Gulf Bahrain 1.1 26 23,410 14 Cooperation Kuwait 3.7 171 46,461 96 Council Oman 3.1 67 21,681 28
Qatar 1.8 173 97,967 97 Saudi Arabia 28.0 577 20,590 240
United Arab Emirates 5.4 358 66,625 201
Total/Weighted Average 4,934.1 64,985 34,501 26,559
Source: Economist Intelligence Unit. International Monetary Fund, Prudential Real Estate Investors Research; data for 2011
3
PRUDENTIAL REAL ESTATE INVESTORS
The US tops the world in total GDP, at $15 trillion, followed by China ($7 trillion), Japan ($6 trillion), Germany
($3.6 trillion) and France (2.8 trillion). Bahrain ($26 billion), Bulgaria ($55 billion), Ecuador ($65 billion) and
Oman ($67 billion) produce the smallest GDPs.
The most-populated countries are in Asia-Pacific: China (1.3 billion) and India (1.2 billion), followed by the US
(313 million), Indonesia (246 million) and Brazil (193 million). The least-populated countries are concentrated in
the GCC: Bahrain (1.1 million), Qatar (1.8 million), Oman (3.1 million) and Kuwait (3.7 million).
Qatar ($97,967) and Norway ($97,730) top the world in GDP per capita, with the top 5 rounded out by
Switzerland ($79,460), United Arab Emirates ($66,625) and Australia ($64,720). At $47,910, the US ranked 15th
in GDP per capita. Vietnam has the lowest GDP per capita at $1,390, followed by India ($1,630), the Philippines
($2,330), Ukraine ($3,400) and Indonesia ($3,380).
Our analysis and forecasts are based on readily available and simple data, such as GDP and GDP per capita
(GDH), which is a good proxy for a country’s level of economic development. Our calculations for the size of
institutional-grade real estate markets are derived from a formula that we developed based on our investment
experience internationally.1 The data for all countries comes from the Economist Intelligence Unit (EIU), with the
exception of the GCC countries, for which we use the International Monetary Fund (IMF). Forecasts are from
EIU, IMF and Prudential research.
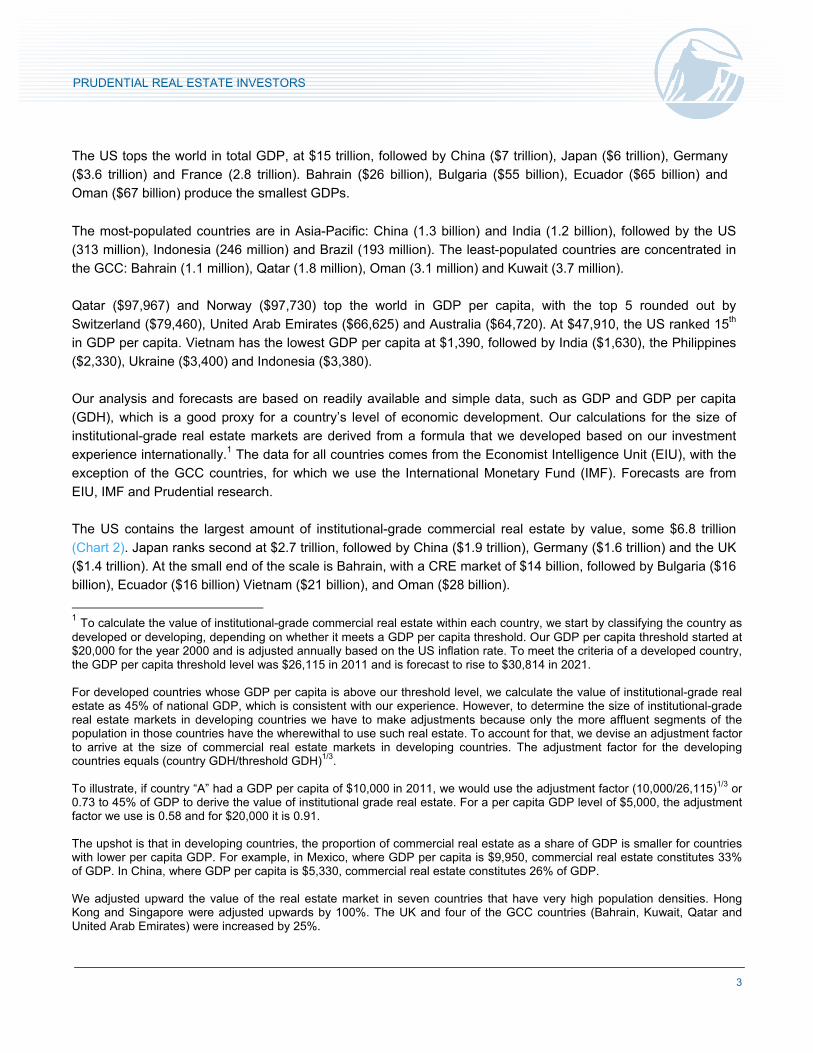
The US contains the largest amount of institutional-grade commercial real estate by value, some $6.8 trillion
(Chart 2). Japan ranks second at $2.7 trillion, followed by China ($1.9 trillion), Germany ($1.6 trillion) and the UK
($1.4 trillion). At the small end of the scale is Bahrain, with a CRE market of $14 billion, followed by Bulgaria ($16
billion), Ecuador ($16 billion) Vietnam ($21 billion), and Oman ($28 billion).
1 To calculate the value of institutional-grade commercial real estate within each country, we start by classifying the country as developed or developing, depending on whether it meets a GDP per capita threshold. Our GDP per capita threshold started at $20,000 for the year 2000 and is adjusted annually based on the US inflation rate. To meet the criteria of a developed country, the GDP per capita threshold level was $26,115 in 2011 and is forecast to rise to $30,814 in 2021. For developed countries whose GDP per capita is above our threshold level, we calculate the value of institutional-grade real estate as 45% of national GDP, which is consistent with our experience. However, to determine the size of institutional-grade real estate markets in developing countries we have to make adjustments because only the more affluent segments of the population in those countries have the wherewithal to use such real estate. To account for that, we devise an adjustment factor to arrive at the size of commercial real estate markets in developing countries. The adjustment factor for the developing countries equals (country GDH/threshold GDH)1/3. To illustrate, if country “A” had a GDP per capita of $10,000 in 2011, we would use the adjustment factor (10,000/26,115)1/3 or 0.73 to 45% of GDP to derive the value of institutional grade real estate. For a per capita GDP level of $5,000, the adjustment factor we use is 0.58 and for $20,000 it is 0.91. The upshot is that in developing countries, the proportion of commercial real estate as a share of GDP is smaller for countries with lower per capita GDP. For example, in Mexico, where GDP per capita is $9,950, commercial real estate constitutes 33% of GDP. In China, where GDP per capita is $5,330, commercial real estate constitutes 26% of GDP. We adjusted upward the value of the real estate market in seven countries that have very high population densities. Hong Kong and Singapore were adjusted upwards by 100%. The UK and four of the GCC countries (Bahrain, Kuwait, Qatar and United Arab Emirates) were increased by 25%.
4
PRUDENTIAL REAL ESTATE INVESTORS
2. ESTIMATED SIZE OF INSTITUTIONAL-GRADE REAL ESTATE BY COUNTRY ($ BILLION)
Source: EIU, IMF, Prudential Real Estate Investors Research
1416162128353947485259738486878995969798103119121135148154185186189198201211219235240240241250
284350370380
467620
656689
784884
9901,248
1,3701,615
1,864Japan = 2,678
US = 6,753
BahrainBulgariaEcuadorVietnam
OmanUkraine
Slovakiaperu
PhilipinesHungaryRomania
New ZealandMalaysia
ChileCzech Republic
ThailandColombia
KuwaitQatar
IrelandPortugalFinland
VenezuelaGreece
ArgentinaDenmark
AustriaPoland
IndonesiaTaiwan
United Arab EmiratesHong Kong
NorwayBelgium
Saudi ArabiaTurkey
SingaporeSweden
SwitzerlandIndia
MexicoNetherlandsSouth Korea
RussiaAustralia
SpainCanada
BrazilItaly
FranceUnited Kingdom
GermanyChinaJapan
United States
5
PRUDENTIAL REAL ESTATE INVESTORS
Regional Distribution
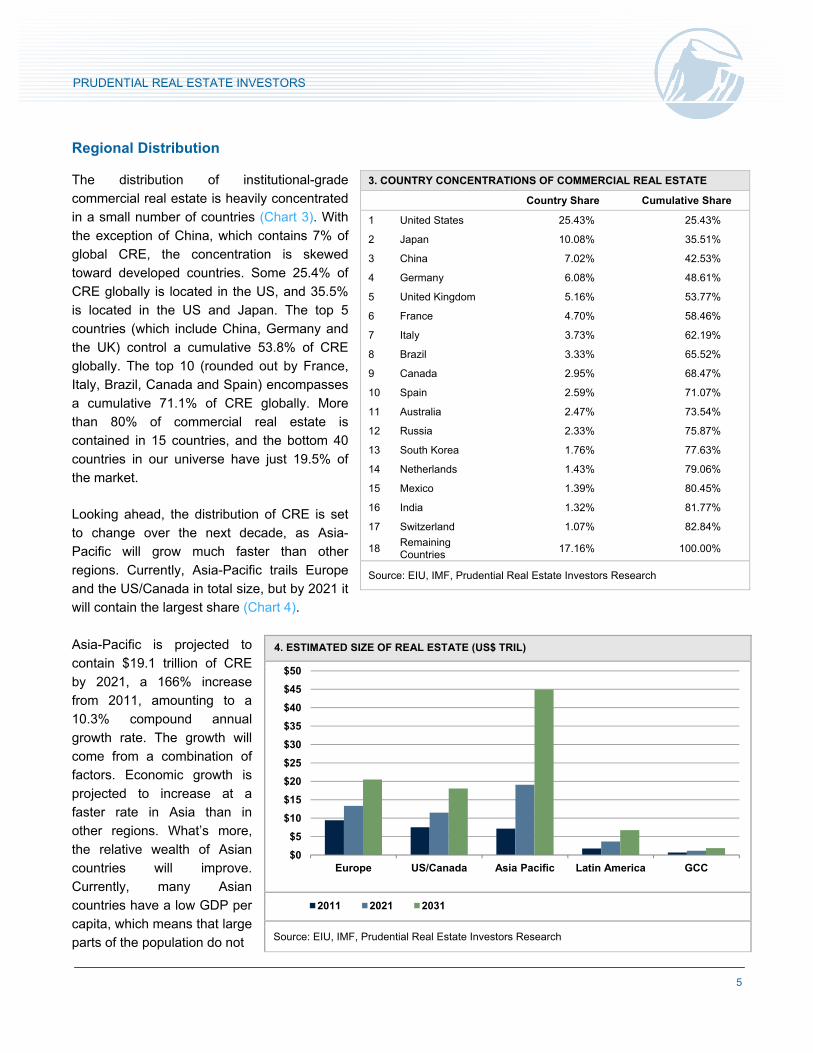
The distribution of institutional-grade
commercial real estate is heavily concentrated
in a small number of countries (Chart 3). With
the exception of China, which contains 7% of
global CRE, the concentration is skewed
toward developed countries. Some 25.4% of
CRE globally is located in the US, and 35.5%
is located in the US and Japan. The top 5
countries (which include China, Germany and
the UK) control a cumulative 53.8% of CRE
globally. The top 10 (rounded out by France,
Italy, Brazil, Canada and Spain) encompasses
a cumulative 71.1% of CRE globally. More
than 80% of commercial real estate is
contained in 15 countries, and the bottom 40
countries in our universe have just 19.5% of
the market.
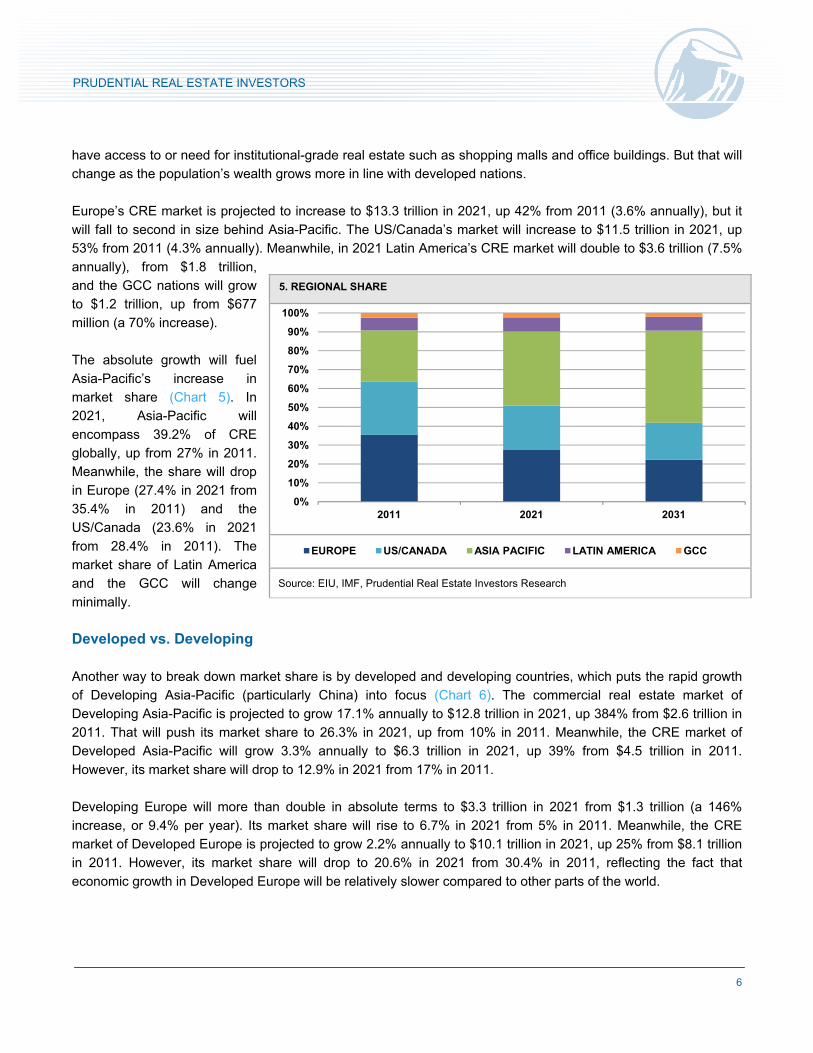
Looking ahead, the distribution of CRE is set
to change over the next decade, as Asia-
Pacific will grow much faster than other
regions. Currently, Asia-Pacific trails Europe
and the US/Canada in total size, but by 2021 it
will contain the largest share (Chart 4).
Asia-Pacific is projected to
contain $19.1 trillion of CRE
by 2021, a 166% increase
from 2011, amounting to a
10.3% compound annual
growth rate. The growth will
come from a combination of
factors. Economic growth is
projected to increase at a
faster rate in Asia than in
other regions. What’s more,
the relative wealth of Asian
countries will improve.
Currently, many Asian
countries have a low GDP per
capita, which means that large
parts of the population do not
3. COUNTRY CONCENTRATIONS OF COMMERCIAL REAL ESTATE
Country Share Cumulative Share
1 United States 25.43% 25.43%
2 Japan 10.08% 35.51%
3 China 7.02% 42.53%
4 Germany 6.08% 48.61%
5 United Kingdom 5.16% 53.77%
6 France 4.70% 58.46%
7 Italy 3.73% 62.19%
8 Brazil 3.33% 65.52%
9 Canada 2.95% 68.47%
10 Spain 2.59% 71.07%
11 Australia 2.47% 73.54%
12 Russia 2.33% 75.87%
13 South Korea 1.76% 77.63%
14 Netherlands 1.43% 79.06%
15 Mexico 1.39% 80.45%
16 India 1.32% 81.77%
17 Switzerland 1.07% 82.84%
18 Remaining Countries
17.16% 100.00%
Source: EIU, IMF, Prudential Real Estate Investors Research
4. ESTIMATED SIZE OF REAL ESTATE (US$ TRIL)
Source: EIU, IMF, Prudential Real Estate Investors Research
$0
$5
$10
$15
$20
$25
$30
$35
$40
$45
$50
Europe US/Canada Asia Pacific Latin America GCC
2011 2021 2031
6
PRUDENTIAL REAL ESTATE INVESTORS
have access to or need for institutional-grade real estate such as shopping malls and office buildings. But that will
change as the population’s wealth grows more in line with developed nations.
Europe’s CRE market is projected to increase to $13.3 trillion in 2021, up 42% from 2011 (3.6% annually), but it
will fall to second in size behind Asia-Pacific. The US/Canada’s market will increase to $11.5 trillion in 2021, up
53% from 2011 (4.3% annually). Meanwhile, in 2021 Latin America’s CRE market will double to $3.6 trillion (7.5%
annually), from $1.8 trillion,
and the GCC nations will grow
to $1.2 trillion, up from $677
million (a 70% increase).
The absolute growth will fuel
Asia-Pacific’s increase in
market share (Chart 5). In
2021, Asia-Pacific will
encompass 39.2% of CRE
globally, up from 27% in 2011.
Meanwhile, the share will drop
in Europe (27.4% in 2021 from
35.4% in 2011) and the
US/Canada (23.6% in 2021
from 28.4% in 2011). The
market share of Latin America
and the GCC will change
minimally.
Developed vs. Developing
Another way to break down market share is by developed and developing countries, which puts the rapid growth
of Developing Asia-Pacific (particularly China) into focus (Chart 6). The commercial real estate market of
Developing Asia-Pacific is projected to grow 17.1% annually to $12.8 trillion in 2021, up 384% from $2.6 trillion in
2011. That will push its market share to 26.3% in 2021, up from 10% in 2011. Meanwhile, the CRE market of
Developed Asia-Pacific will grow 3.3% annually to $6.3 trillion in 2021, up 39% from $4.5 trillion in 2011.
However, its market share will drop to 12.9% in 2021 from 17% in 2011.
Developing Europe will more than double in absolute terms to $3.3 trillion in 2021 from $1.3 trillion (a 146%
increase, or 9.4% per year). Its market share will rise to 6.7% in 2021 from 5% in 2011. Meanwhile, the CRE
market of Developed Europe is projected to grow 2.2% annually to $10.1 trillion in 2021, up 25% from $8.1 trillion
in 2011. However, its market share will drop to 20.6% in 2021 from 30.4% in 2011, reflecting the fact that
economic growth in Developed Europe will be relatively slower compared to other parts of the world.
5. REGIONAL SHARE
Source: EIU, IMF, Prudential Real Estate Investors Research
0%
10%
20%
30%
40%
50%
60%
70%
80%
90%
100%
2011 2021 2031
EUROPE US/CANADA ASIA PACIFIC LATIN AMERICA GCC
7
PRUDENTIAL REAL ESTATE INVESTORS
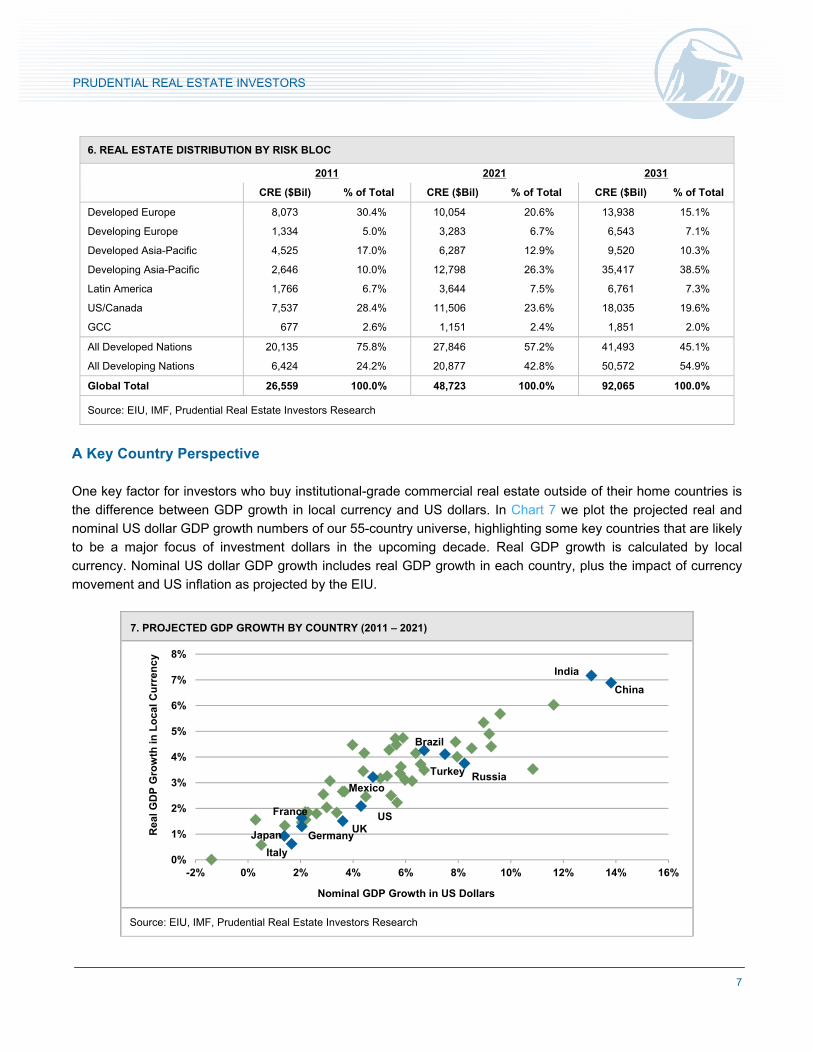
A Key Country Perspective
One key factor for investors who buy institutional-grade commercial real estate outside of their home countries is
the difference between GDP growth in local currency and US dollars. In Chart 7 we plot the projected real and
nominal US dollar GDP growth numbers of our 55-country universe, highlighting some key countries that are likely
to be a major focus of investment dollars in the upcoming decade. Real GDP growth is calculated by local
currency. Nominal US dollar GDP growth includes real GDP growth in each country, plus the impact of currency
movement and US inflation as projected by the EIU.
7. PROJECTED GDP GROWTH BY COUNTRY (2011 – 2021)
Source: EIU, IMF, Prudential Real Estate Investors Research
6. REAL ESTATE DISTRIBUTION BY RISK BLOC
2011 2021 2031
CRE ($Bil) % of Total CRE ($Bil) % of Total CRE ($Bil) % of Total
Developed Europe 8,073 30.4% 10,054 20.6% 13,938 15.1%
Developing Europe 1,334 5.0% 3,283 6.7% 6,543 7.1%
Developed Asia-Pacific 4,525 17.0% 6,287 12.9% 9,520 10.3%
Developing Asia-Pacific 2,646 10.0% 12,798 26.3% 35,417 38.5%
Latin America 1,766 6.7% 3,644 7.5% 6,761 7.3%
US/Canada 7,537 28.4% 11,506 23.6% 18,035 19.6%
GCC 677 2.6% 1,151 2.4% 1,851 2.0%
All Developed Nations 20,135 75.8% 27,846 57.2% 41,493 45.1%
All Developing Nations 6,424 24.2% 20,877 42.8% 50,572 54.9%
Global Total 26,559 100.0% 48,723 100.0% 92,065 100.0%
Source: EIU, IMF, Prudential Real Estate Investors Research
0%
1%
2%
3%
4%
5%
6%
7%
8%
-2% 0% 2% 4% 6% 8% 10% 12% 14% 16%
Rea
l GD
P G
row
th in
Lo
cal
Cu
rren
cy
Nominal GDP Growth in US Dollars
India
Italy
France
Japan
Mexico
UK
China
Germany
Brazil
Turkey Russia
US
8
PRUDENTIAL REAL ESTATE INVESTORS
The results show that the most rapid rate of growth will come from developing Asia-Pacific countries India and
China, which will grow roughly 7% in real terms and 13-14% in nominal terms over the next decade. Developing
nations Brazil, Turkey, Russia and Mexico are at another level, with real GDP growth of 4-5% and nominal growth
of 6-8%. Growth is lower for the developed nations, including the US, France, the UK, Germany, Japan and Italy.
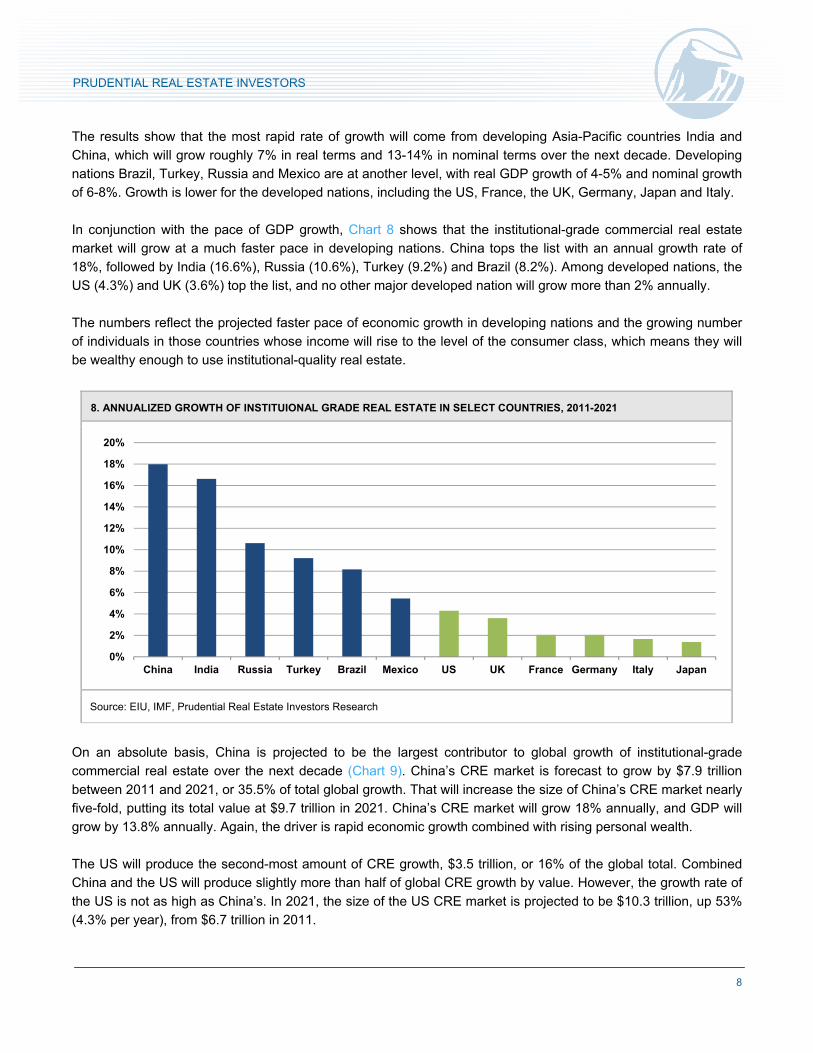
In conjunction with the pace of GDP growth, Chart 8 shows that the institutional-grade commercial real estate
market will grow at a much faster pace in developing nations. China tops the list with an annual growth rate of
18%, followed by India (16.6%), Russia (10.6%), Turkey (9.2%) and Brazil (8.2%). Among developed nations, the
US (4.3%) and UK (3.6%) top the list, and no other major developed nation will grow more than 2% annually.
The numbers reflect the projected faster pace of economic growth in developing nations and the growing number
of individuals in those countries whose income will rise to the level of the consumer class, which means they will
be wealthy enough to use institutional-quality real estate.
On an absolute basis, China is projected to be the largest contributor to global growth of institutional-grade
commercial real estate over the next decade (Chart 9). China’s CRE market is forecast to grow by $7.9 trillion
between 2011 and 2021, or 35.5% of total global growth. That will increase the size of China’s CRE market nearly
five-fold, putting its total value at $9.7 trillion in 2021. China’s CRE market will grow 18% annually, and GDP will
grow by 13.8% annually. Again, the driver is rapid economic growth combined with rising personal wealth.
The US will produce the second-most amount of CRE growth, $3.5 trillion, or 16% of the global total. Combined
China and the US will produce slightly more than half of global CRE growth by value. However, the growth rate of
the US is not as high as China’s. In 2021, the size of the US CRE market is projected to be $10.3 trillion, up 53%
(4.3% per year), from $6.7 trillion in 2011.
8. ANNUALIZED GROWTH OF INSTITUIONAL GRADE REAL ESTATE IN SELECT COUNTRIES, 2011-2021
Source: EIU, IMF, Prudential Real Estate Investors Research
0%
2%
4%
6%
8%
10%
12%
14%
16%
18%
20%
China India Russia Turkey Brazil Mexico US UK France Germany Italy Japan
9
PRUDENTIAL REAL ESTATE INVESTORS
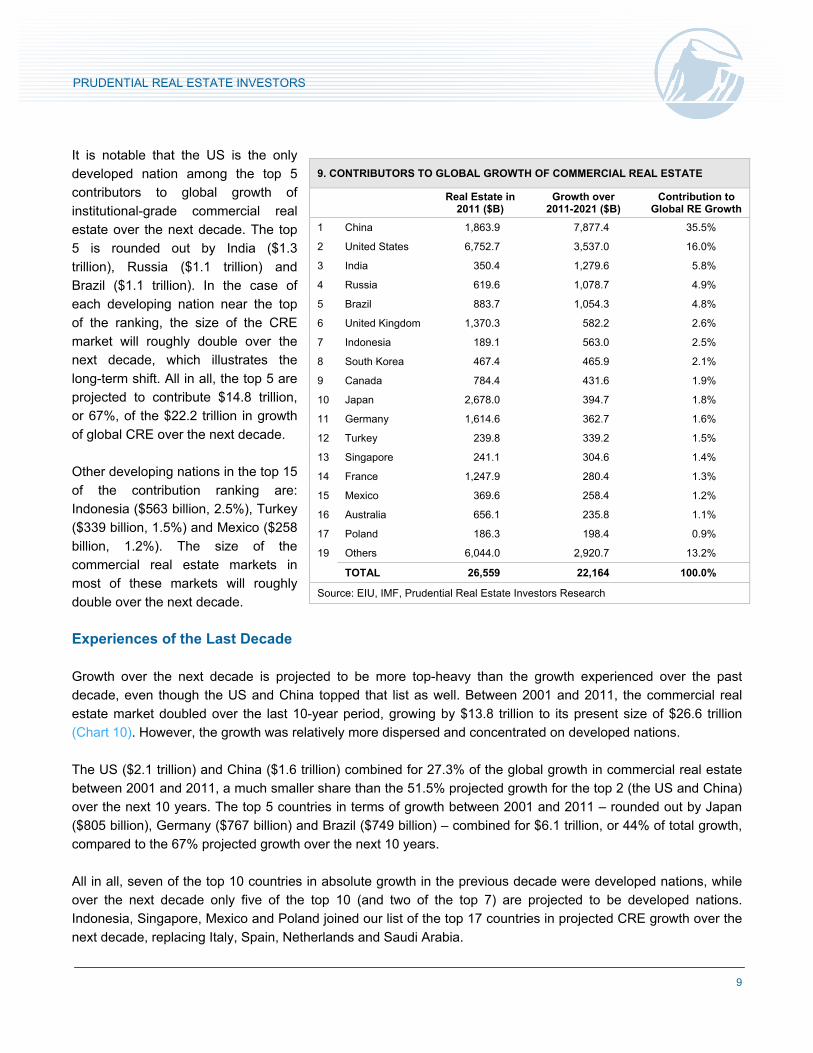
It is notable that the US is the only
developed nation among the top 5
contributors to global growth of
institutional-grade commercial real
estate over the next decade. The top
5 is rounded out by India ($1.3
trillion), Russia ($1.1 trillion) and
Brazil ($1.1 trillion). In the case of
each developing nation near the top
of the ranking, the size of the CRE
market will roughly double over the
next decade, which illustrates the
long-term shift. All in all, the top 5 are
projected to contribute $14.8 trillion,
or 67%, of the $22.2 trillion in growth
of global CRE over the next decade.
Other developing nations in the top 15
of the contribution ranking are:
Indonesia ($563 billion, 2.5%), Turkey
($339 billion, 1.5%) and Mexico ($258
billion, 1.2%). The size of the
commercial real estate markets in
most of these markets will roughly
double over the next decade.
Experiences of the Last Decade
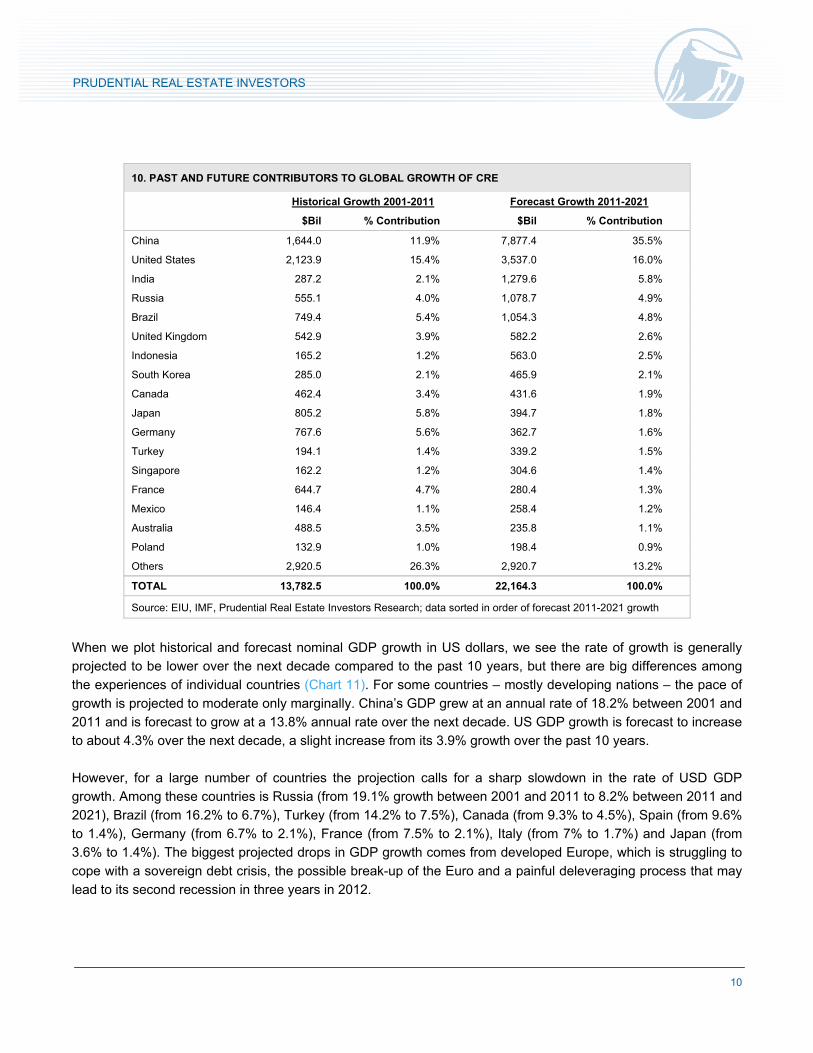
Growth over the next decade is projected to be more top-heavy than the growth experienced over the past
decade, even though the US and China topped that list as well. Between 2001 and 2011, the commercial real
estate market doubled over the last 10-year period, growing by $13.8 trillion to its present size of $26.6 trillion
(Chart 10). However, the growth was relatively more dispersed and concentrated on developed nations.
The US ($2.1 trillion) and China ($1.6 trillion) combined for 27.3% of the global growth in commercial real estate
between 2001 and 2011, a much smaller share than the 51.5% projected growth for the top 2 (the US and China)
over the next 10 years. The top 5 countries in terms of growth between 2001 and 2011 – rounded out by Japan
($805 billion), Germany ($767 billion) and Brazil ($749 billion) – combined for $6.1 trillion, or 44% of total growth,
compared to the 67% projected growth over the next 10 years.
All in all, seven of the top 10 countries in absolute growth in the previous decade were developed nations, while
over the next decade only five of the top 10 (and two of the top 7) are projected to be developed nations.
Indonesia, Singapore, Mexico and Poland joined our list of the top 17 countries in projected CRE growth over the
next decade, replacing Italy, Spain, Netherlands and Saudi Arabia.
9. CONTRIBUTORS TO GLOBAL GROWTH OF COMMERCIAL REAL ESTATE
Real Estate in
2011 ($B) Growth over
2011-2021 ($B) Contribution to
Global RE Growth
1 China 1,863.9 7,877.4 35.5%
2 United States 6,752.7 3,537.0 16.0%
3 India 350.4 1,279.6 5.8%
4 Russia 619.6 1,078.7 4.9%
5 Brazil 883.7 1,054.3 4.8%
6 United Kingdom 1,370.3 582.2 2.6%
7 Indonesia 189.1 563.0 2.5%
8 South Korea 467.4 465.9 2.1%
9 Canada 784.4 431.6 1.9%
10 Japan 2,678.0 394.7 1.8%
11 Germany 1,614.6 362.7 1.6%
12 Turkey 239.8 339.2 1.5%
13 Singapore 241.1 304.6 1.4%
14 France 1,247.9 280.4 1.3%
15 Mexico 369.6 258.4 1.2%
16 Australia 656.1 235.8 1.1%
17 Poland 186.3 198.4 0.9%
19 Others 6,044.0 2,920.7 13.2%
TOTAL 26,559 22,164 100.0%
Source: EIU, IMF, Prudential Real Estate Investors Research
10
PRUDENTIAL REAL ESTATE INVESTORS
10. PAST AND FUTURE CONTRIBUTORS TO GLOBAL GROWTH OF CRE
Historical Growth 2001-2011 Forecast Growth 2011-2021
$Bil % Contribution $Bil % Contribution
China 1,644.0 11.9% 7,877.4 35.5%
United States 2,123.9 15.4% 3,537.0 16.0%
India 287.2 2.1% 1,279.6 5.8%
Russia 555.1 4.0% 1,078.7 4.9%
Brazil 749.4 5.4% 1,054.3 4.8%
United Kingdom 542.9 3.9% 582.2 2.6%
Indonesia 165.2 1.2% 563.0 2.5%
South Korea 285.0 2.1% 465.9 2.1%
Canada 462.4 3.4% 431.6 1.9%
Japan 805.2 5.8% 394.7 1.8%
Germany 767.6 5.6% 362.7 1.6%
Turkey 194.1 1.4% 339.2 1.5%
Singapore 162.2 1.2% 304.6 1.4%
France 644.7 4.7% 280.4 1.3%
Mexico 146.4 1.1% 258.4 1.2%
Australia 488.5 3.5% 235.8 1.1%
Poland 132.9 1.0% 198.4 0.9%
Others 2,920.5 26.3% 2,920.7 13.2%
TOTAL 13,782.5 100.0% 22,164.3 100.0%
Source: EIU, IMF, Prudential Real Estate Investors Research; data sorted in order of forecast 2011-2021 growth
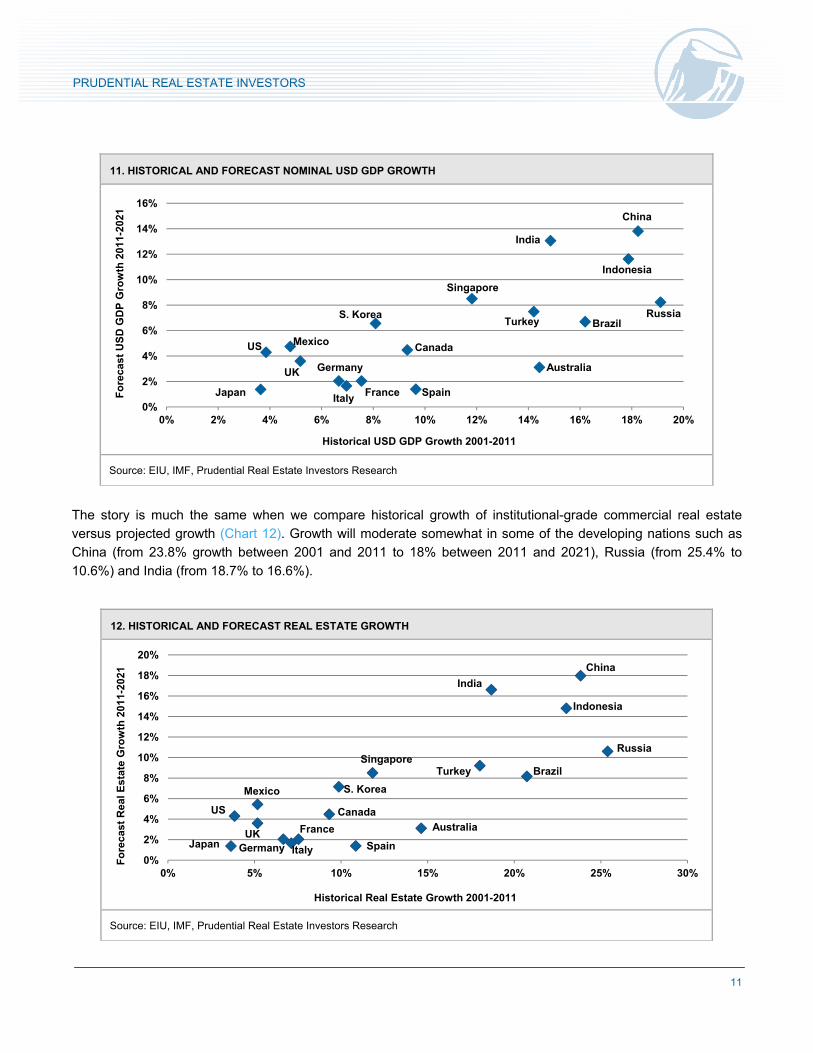
When we plot historical and forecast nominal GDP growth in US dollars, we see the rate of growth is generally
projected to be lower over the next decade compared to the past 10 years, but there are big differences among
the experiences of individual countries (Chart 11). For some countries – mostly developing nations – the pace of
growth is projected to moderate only marginally. China’s GDP grew at an annual rate of 18.2% between 2001 and
2011 and is forecast to grow at a 13.8% annual rate over the next decade. US GDP growth is forecast to increase
to about 4.3% over the next decade, a slight increase from its 3.9% growth over the past 10 years.
However, for a large number of countries the projection calls for a sharp slowdown in the rate of USD GDP
growth. Among these countries is Russia (from 19.1% growth between 2001 and 2011 to 8.2% between 2011 and
2021), Brazil (from 16.2% to 6.7%), Turkey (from 14.2% to 7.5%), Canada (from 9.3% to 4.5%), Spain (from 9.6%
to 1.4%), Germany (from 6.7% to 2.1%), France (from 7.5% to 2.1%), Italy (from 7% to 1.7%) and Japan (from
3.6% to 1.4%). The biggest projected drops in GDP growth comes from developed Europe, which is struggling to
cope with a sovereign debt crisis, the possible break-up of the Euro and a painful deleveraging process that may
lead to its second recession in three years in 2012.
11
PRUDENTIAL REAL ESTATE INVESTORS
The story is much the same when we compare historical growth of institutional-grade commercial real estate
versus projected growth (Chart 12). Growth will moderate somewhat in some of the developing nations such as
China (from 23.8% growth between 2001 and 2011 to 18% between 2011 and 2021), Russia (from 25.4% to
10.6%) and India (from 18.7% to 16.6%).
11. HISTORICAL AND FORECAST NOMINAL USD GDP GROWTH
Source: EIU, IMF, Prudential Real Estate Investors Research
12. HISTORICAL AND FORECAST REAL ESTATE GROWTH
Source: EIU, IMF, Prudential Real Estate Investors Research
0%
2%
4%
6%
8%
10%
12%
14%
16%
18%
20%
0% 5% 10% 15% 20% 25% 30%
Fo
reca
st R
eal
Est
ate
Gro
wth
201
1-20
21
Historical Real Estate Growth 2001-2011
BrazilTurkey
Australia
Spain
Canada
S. Korea
Singapore
France
ItalyGermanyUK
Mexico
US
Japan
China
Russia
Indonesia
India
0%
2%
4%
6%
8%
10%
12%
14%
16%
0% 2% 4% 6% 8% 10% 12% 14% 16% 18% 20%
Fo
reca
st U
SD
GD
P G
row
th 2
011-
2021
Historical USD GDP Growth 2001-2011
Japan
Indonesia
India
Australia
BrazilTurkey
Singapore
Spain
Canada
S. Korea
FranceItaly
GermanyUK
MexicoUS
China
Russia
12
PRUDENTIAL REAL ESTATE INVESTORS
For some developing nations, the commercial real estate market is projected to continue to grow at a fairly robust
rate, although it will slow down from the torrid pace over the past decade. Some of these nations include Brazil
(from 20.7% growth between 2001 and 2011 to 8.2% between 2011 and 2021), Turkey (from 18% to 9.2%),
Singapore (from 11.8% to 8.5%) and South Korea (from 9.9% to 7.2%).
The growth of institutional-grade real estate by value will be relatively consistent in a few nations, such as the US
(4.3% between 2011 and 2021 from 3.9% between 2001 and 2011) and Mexico (from 5.2% to 5.4%). However, in
line with GDP growth projections, the growth of commercial real estate will flatten considerably in many countries,
particularly developed Europe. Examples include: Spain (from 10.9% growth between 2001 and 2011 to 1.4%
between 2011 and 2021), France (from 7.5% to 2.1%), Italy (from 7.1% to 1.7%) and Germany (from 6.7% to
2.1%).
Conclusion
Growth in the size of global markets – both in absolute and relative terms – is an important consideration for those
that invest in commercial real estate across country borders. Our 2012 study of global markets demonstrates that
while the US dominates the global institutional-grade CRE landscape and will continue to grow at a healthy pace,
the fastest growth will come from the Asia-Pacific region, particularly China and India. Growth will also be
relatively high in developing nations such as Russia and Brazil. Europe will continue to grow, both developed and
developing nations, but at a lesser pace than more vibrant parts of the globe.
To be sure, growing markets can produce more and different kinds of opportunities than markets that are
stagnant in size, but rate of growth is just one of many factors that must be considered when making investment
decisions. Investors have to take into account a whole host of other factors, including local demand, transparency,
liquidity, governance, political stability and the institutional legal framework.
Still, there is little doubt that many of today’s developing nations – and Asia-Pacific in particular – will be a growing
destination for commercial real estate investment dollars. Increased economic activity and rising wealth of the
population will produce a great deal of demand for new institutional-quality space, especially relative to countries
with a slower rate of growth. Investors should develop strategy in accordance with future trends.
13
PRUDENTIAL REAL ESTATE INVESTORS
Important Disclosure Prudential Investment Management is the primary asset management business of Prudential Financial, Inc. Prudential Real Estate Investors is Prudential Investment Management’s real estate investment advisory business and operates through Prudential Investment Management, Inc. (PIM), a registered investment advisor. Prudential, the Prudential logo and the Rock symbol are service marks of Prudential Financial, Inc. and its related entities, registered in many jurisdictions worldwide. These materials represent the views, opinions and recommendations of the author(s) regarding the economic conditions, asset classes, securities, issuers or financial instrument referenced herein. Distribution of this information to any person other than the person to whom it was originally delivered and to such person’s advisers is unauthorized, and any reproduction of these materials, in whole or in part, or the divulgence of any of the contents hereof, without prior consent of Prudential Real Estate Investors is prohibited. Certain information contained herein has been obtained from sources that Prudential Real Estate Investors believes to be reliable as of the date presented; however, Prudential Real Estate Investors cannot guarantee the accuracy of such information, assure its completeness, or warrant such information will not be changed. The information contained herein is current as of the date of issuance (or such earlier date as referenced herein) and is subject to change without notice. Prudential Real Estate Investors has no obligation to update any or all of such information; nor do we make any express or implied warranties or representations as to the completeness or accuracy or accept responsibility for errors. These materials are not intended as an offer or solicitation with respect to the purchase or sale of any security or other financial instrument or any investment management services and should not be used as the basis for any investment decision. Past performance is no guarantee or reliable indicator of future results. No liability whatsoever is accepted for any loss (whether direct, indirect, or consequential) that may arise from any use of the information contained in or derived from this report. Prudential Real Estate Investors and its affiliates may make investment decisions that are inconsistent with the recommendations or views expressed herein, including for proprietary accounts of Prudential Real Estate Investors or its affiliates. The opinions and recommendations herein do not take into account individual client circumstances, objectives, or needs and are not intended as recommendations of particular securities, financial instruments or strategies to particular clients or prospects. No determination has been made regarding the suitability of any securities, financial instruments or strategies for particular clients or prospects. For any securities or financial instruments mentioned herein, the recipient(s) of this report must make its own independent decisions. Conflicts of Interest: Key research team staff may be participating voting members of certain Prudential Real Estate Investors fund and/or product investment committees with respect to decisions made on underlying investments or transactions. In addition, research personnel may receive incentive compensation based upon the overall performance of the organization itself and certain investment funds or products. At the date of issue, Prudential Real Estate Investors and/or affiliates may be buying, selling, or holding significant positions in real estate, including publicly traded real estate securities. Prudential Real Estate Investors affiliates may develop and publish research that is independent of, and different than, the recommendations contained herein. Prudential Real Estate Investors personnel other than the author(s), such as sales, marketing and trading personnel, may provide oral or written market commentary or ideas to Prudential Real Estate Investors clients or prospects or proprietary investment ideas that differ from the views expressed herein. Additional information regarding actual and potential conflicts of interest is available in Part II of PIM’s Form ADV.
Prudential Real Estate Investors 8 Campus Drive Parsippany, NJ 07054 USA © Copyright 2012
Tel 973.683.1745 Fax 973.734.1319 Web www.prei.com E-mail [email protected]
REF: PFIA-8RWQD5