Embed Size (px)
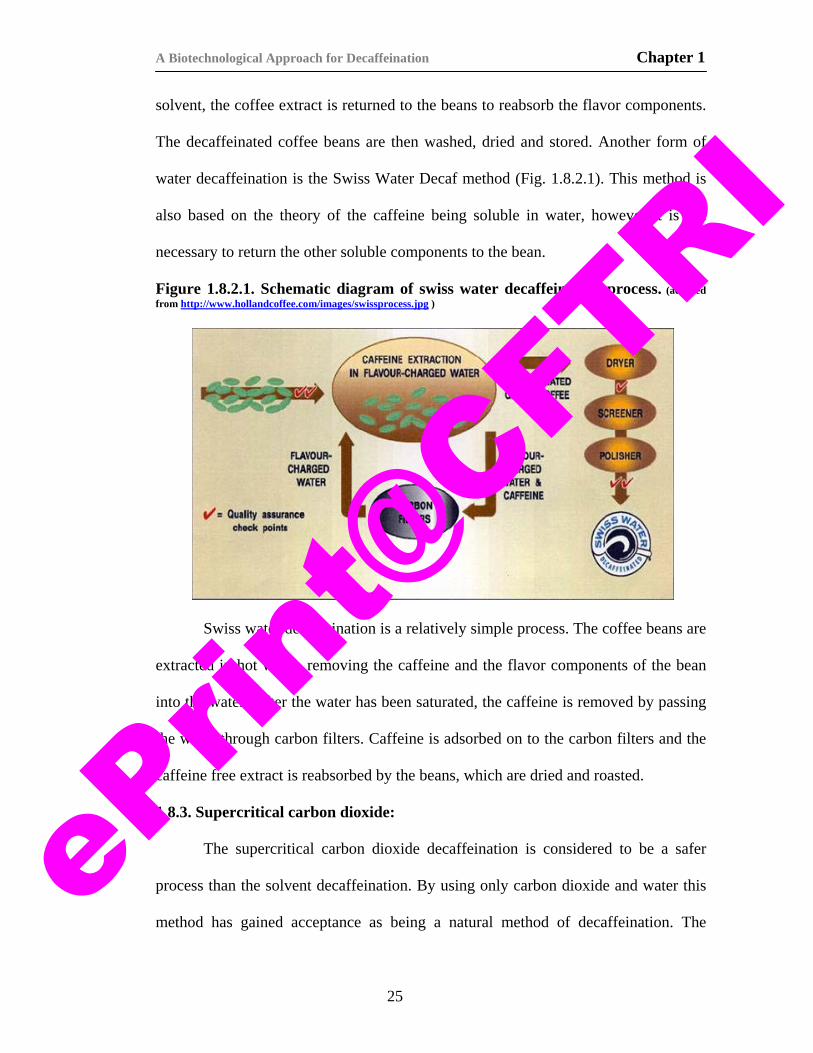
Citation preview
A BIOTECHNOLOGICAL APPROACH FOR DECAFFEINATION
A thesis submitted to the
University of Mysore for the award of the degree of
DOCTOR OF PHILOSOPHY in
BIOTECHNOLOGY
By RENU SARATH BABU VEGESNA
Department of Fermentation Technology and Bioengineering
Central Food Technological Research Institute
Mysore-570020, India
February 2007
ePrin
t@CFT
RI
Dr. M. S.Thakur, Date: Scientist, Fermentation Technology and Bioengineering Department.
CERTIFICATE
I hereby declare that the thesis entitled “A BIOTECHNOLOGICAL
APPROACH FOR DECAFFEINATION” submitted to the University of Mysore for
the award of the degree of DOCTOR OF PHILOSOPHY IN BIOTECHNOLOGY by
Mr. VEGESNA RENU SARATH BABU, is the result of the research work carried out
by him in the Department of Fermentation Technology and Bioengineering, Central Food
Technological Research Institute, Mysore, India, under my guidance during the period
June 2002 – February 2007.
(M. S. Thakur)
ePrin
t@CFT
RI
VEGESNA RENU SARATH BABU, Date: Senior Research Fellow, Fermentation Technology and Bioengineering Department, Central Food Technological Research Institute, Mysore-570020.
DECLARATION
I hereby declare that the thesis entitled “A BIOTECHNOLOGICAL
APPROACH FOR DECAFFEINATION” submitted to the University of Mysore for
the award of the degree of DOCTOR OF PHILOSOPHY IN BIOTECHNOLOGY is
the result of the research work carried out by me in the Department of Fermentation
Technology and Bioengineering, Central Food Technological Research Institute, Mysore,
India, under the guidance of Dr. M. S. Thakur during the period of June 2002 –February
2007.
I further declare that the work embodied in this thesis had not been submitted for
the award of degree, diploma or any other similar title.
(VEGESNA RENU SARATH BABU) ePrin
t@CFT
RI
Acknowledgements
I owe much of what I know about care as well as the ability to express it. My first, and most earnest, acknowledgment must go to my guide Dr. M. S. Thakur. Seven years ago, a chance meeting with him started me on the path I traveled at CFTRI. Dr. Thakur has been instrumental in ensuring my academic, professional, and moral well being ever since. In every sense, none of this work would have been possible without him.
I am immensely grateful to the Director CFTRI, for allowing me to take up my Ph.D. at CFTRI and for providing facilities for carrying out my research work.
In particular, I would like to thank Dr. N.G.Karanth, whose guidance is a privilege very few people can have. I owe a huge debt of gratitude to him, who was instrumental in improving my scientific writing skills. I can hardly imagine how my work would have evolved without his many comments, suggestions and clarifications. It is an honour working with a person like him.
Far too many people to mention individually have assisted in so many ways during my work at CFTRI. They all have my sincere gratitude. I would like to thank Dr. Ghildhyal, Dr. M. C. Misra, Dr. S. Divakar, Dr. S. G. Prapulla, Dr. A. Sattur, Mr. Eugene Raj, Dr. Yogesh, Mr. M.A. Kumar and Dr. Somasekhar for their help and support in my work. I also salute the intellectual input of Dr. Appu Rao, Dr. U.J.S. Prasada Rao and Dr. S.G.Bhat.
I am also indebted to the Council of Scientific and Industrial Research for direct financial aid through CISR-JRF and SRF fellowships, awards, and travel grants.
My sincere thanks also go to Dr. Ch. Mohan Rao, Dr. T. Ramakrishna Murthy and Mr. Tirumal at CCMB, Hyderabad, for helping me with the protein characterization work. I also express my gratitude to Dr. Girish Sahni (Director, IMTECH), Dr. G. P. S. Raghava and Mr. Manish (IMTECH, Chandigarh) for helping me predict the protein structure. My sincere thanks to Mr. Ravi Kumar, Executive Director, AVT Natural Products and Mr. Marimuthu, Manager, Tantea, Pandiar tea factory for their help in procuring tea dhool and valuable interactions in development of biodecaffeination process.
Thanks to the concept of Biodecaffeination, because of which I not only enjoyed science but also had been fortunate to see the wonderland of tea and coffee gardens in Ooty and Coorg. I am indebted to the IT and World Wide Web for opening up a plethora of knowledge to carry out my work. Google had always been a shoulder to depend upon for answering my queries.
No words are enough to express my immense gratitude to Sanju and Ashwin who were with me in all my ups and downs in all these years.
I also thank my former seniors and friends at CFTRI, Devraj, Naveen, Mohan, Suresh, Obul Reddy, Vivek, Ravi and Sekhar who were very helpful. The fun and enthusiasm with the group is never forgettable.
My sincere thanks to Sujith, Raghuraj, Abhijit, Dr. Shabana, Praveen and other Research Fellows and Assistants in FTBE department. A special note of thanks goes to Mr. Somanna, who has been helpful during my fermentation studies and his ready to help nature. eP
rint@
CFTRI
Last but not least I thank the staff of CIFS, Accounts and other administrative departments who were ever ready to help me when required.
A penultimate thank-you goes to my wonderful parents, for always being there when I needed them most, and never once complaining about how infrequently I visit, they deserve far more credit than I can ever give them. I owe this thesis to my brother, who is the driving force in my pursuing my Ph.D.
The same also to my In-laws who have been supportive and encouraging in all these years.
My final, and most heartfelt, acknowledgment must go to my wife Bharathi. Her patience, support, encouragement, and companionship have turned my journey through life into a pleasure. For all that, and for being everything I am not, she has my everlasting love. I thank THEE, for without his blessings, I would never have had been able to be able to reach this stage of life. God, the almighty!! I bow in front of you for being with me in all times of need and giving me the strength, will and opportunities I had enjoyed in all walks of my life.
V. Renu Sarath Babu.
ePrin
t@CFT
RI
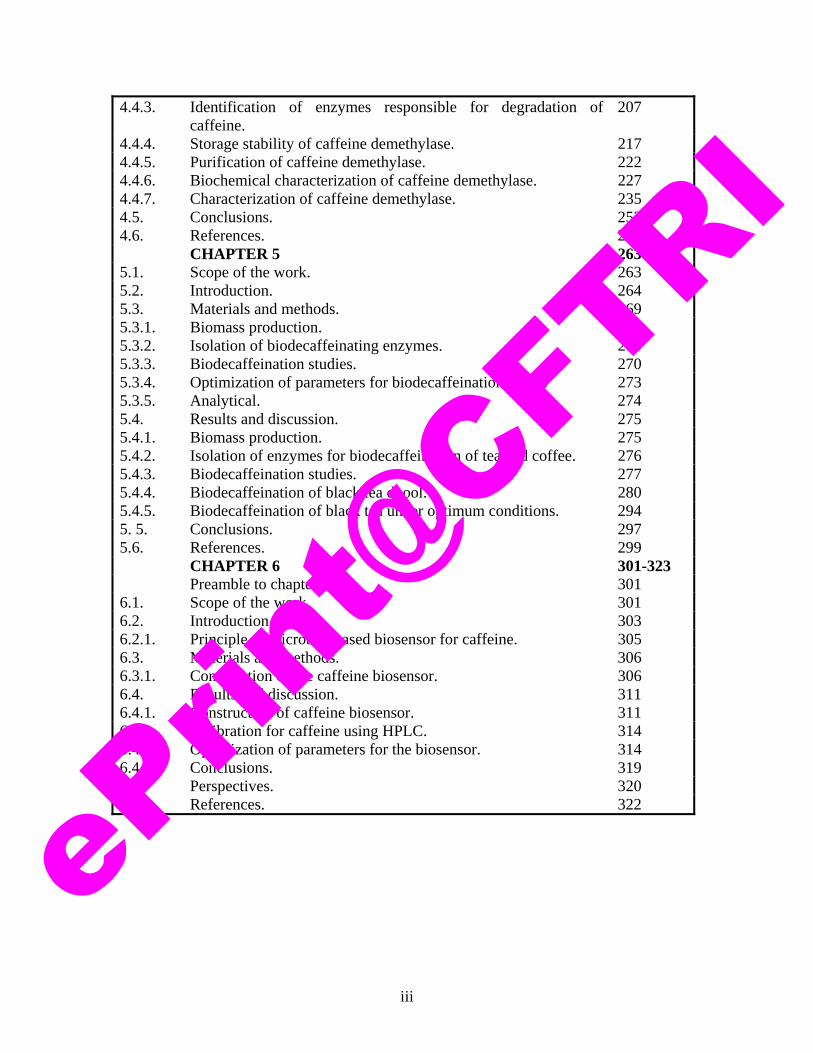
CONTENTS Section Title P. No
List of Abbreviations iv List of tables vi List of Figures viii CHAPTER 1 1-82 1.1. Scope of the review. 1 1.2. History of caffeine. 2 1.2.1. Discovery of caffeine and related compounds. 2 1.3. Sources of caffeine. 4 1.4. Caffeine consumption patterns around the world. 7 1.5. Caffeine chemistry. 12 1.6. Mechanisms of action of caffeine. 13 1.6.1. Cellular effects. 14 1.6.2. Side effects. 16 1.6.3. Caffeine and health problems. 17 1.7. Caffeine containing agro wastes: An environmental problem. 20 1.8. Decaffeination. 21 1.8.1. Solvent decaffeination. 22 1.8.2. Water decaffeination. 24 1.8.3. Supercritical carbon dioxide. 25 1.9. Biodecaffeination: A natural route of decaffeination. 27 1.9.1. Caffeine degradation in eukaryotes. 28 1.9.2. Caffeine catabolism in plants.. 38 1.9.3. Caffeine metabolism in prokaryotes. 40 1.10. Biotechnological processes for decaffeination. 52 1.10.1. Enzymatic methods of caffeine degradation. 54 1.11. Conclusion and future perspectives. 58 1.12. References. 62
CHAPTER 2 83-134 2.0. Scope of the work. 83 2.1. Introduction. 84 2.1.1. Caffeine and microorganisms. 84 2.2. Materials and methods. 92 2.2.1. Isolation of caffeine degrading bacteria from soil. 92 2.2.2. Identification of bacteria. 93 2.2.3. Studies on bacterial growth in caffeine as the sole source of
carbon and nitrogen. 94
2.2.4. Estimation of methylxanthines by high performance liquid chromatography.
94
2.2.5. Growth of cells and induction for caffeine degradation 94 2.2.6. Caffeine degradation experiments. 96 2.2.7. Optimization of parameters for growth and caffeine degradation
by isolate T2. 96
i
ePrin
t@CFT
RI
2.3. Results and discussion. 103 2.3.1. Isolation of caffeine degrading bacteria. 103 2.3.2. Optimization of parameters for growth and caffeine degradation
by P. alcaligenes MTCC 5264. 109
2.4. Conclusions. 128 2.5. References. 130 CHAPTER 3 135-188 3.1. Scope of the work. 135 3.2. Immobilization. 136 3.2.1. Rationale for whole-cell immobilization. 137 3.2.2. Advantages of immobilized cells. 137 3.2.3. Immobilization methods. 138 3.2.4. Immobilization matrices. 142 3.2.5. Biotransformations by immobilized microbial cells. 146 3.2.6. Application of immobilized cells for biodecaffeination. 149 3.3. Materials and methods. 151 3.3.1. Studies on biodecaffeination by P. alcaligenes MTCC 5264. 151 3.3.2. Growth of cells and induction for biodecaffeination 151 3.3.3. Caffeine degradation experiments. 152 3.3.4. Studies on biodecaffeination by immobilized P. alcaligenes
MTCC 5264. 153
3.3.5. Optimization of parameters for biodecaffeination using immobilized cells of P. alcaligenes MTCC 5264.
156
3.4. Results and discussion. 159 3.4.1. Studies on biodecaffeination by immobilized cells of
P. alcaligenes MTCC 5264. 159
3.4.2. Optimization of parameters for decaffeination using immobilized cells of P. alcaligenes MTCC 5264 in calcium alginate beads.
165
3.4.3. Studies on biodecaffeination by immobilized cells under optimized conditions.
176
3.5.1. Biodecaffeination of tea extract by P. Alcaligenes MTCC 5264 immobilized in calcium alginate.
177
3.6. Conclusions. 178 3.7. References. 179 CHAPTER 4 189-262 4.1. Scope of the work. 189 4.2. Introduction. 190 4.3. Materials and methods. 193 4.3.1. Extraction of enzymes. 193 4.3.2. Identification of enzymes involved in degradation of caffeine. 194 4.3.3. Purification of caffeine demethylase. 199 4.3.4. Characterization of caffeine demethylase. 202 4.4. Results and discussion. 204 4.4.1. Extraction of enzymes. 204 4.4.2. Product formation using crude enzyme extract. 206
ii
ePrin
t@CFT
RI
iii
4.4.3. Identification of enzymes responsible for degradation of caffeine.
207
4.4.4. Storage stability of caffeine demethylase. 217 4.4.5. Purification of caffeine demethylase. 222 4.4.6. Biochemical characterization of caffeine demethylase. 227 4.4.7. Characterization of caffeine demethylase. 235 4.5. Conclusions. 253 4.6. References. 255 CHAPTER 5 263-300 5.1. Scope of the work. 263 5.2. Introduction. 264 5.3. Materials and methods. 269 5.3.1. Biomass production. 269 5.3.2. Isolation of biodecaffeinating enzymes. 270 5.3.3. Biodecaffeination studies. 270 5.3.4. Optimization of parameters for biodecaffeination of tea. 273 5.3.5. Analytical. 274 5.4. Results and discussion. 275 5.4.1. Biomass production. 275 5.4.2. Isolation of enzymes for biodecaffeination of tea and coffee. 276 5.4.3. Biodecaffeination studies. 277 5.4.4. Biodecaffeination of black tea dhool. 280 5.4.5. Biodecaffeination of black tea under optimum conditions. 294 5. 5. Conclusions. 297 5.6. References. 299 CHAPTER 6 301-323 Preamble to chapter 6. 301 6.1. Scope of the work. 301 6.2. Introduction. 303 6.2.1. Principle of microbial based biosensor for caffeine. 305 6.3. Materials and methods. 306 6.3.1. Construction of the caffeine biosensor. 306 6.4. Results and discussion. 311 6.4.1. Construction of caffeine biosensor. 311 6.4.2. Calibration for caffeine using HPLC. 314 6.4.3. Optimization of parameters for the biosensor. 314 6.4. Conclusions. 319 6.5. Perspectives. 320 6.6. References. 322
ePrin
t@CFT
RI
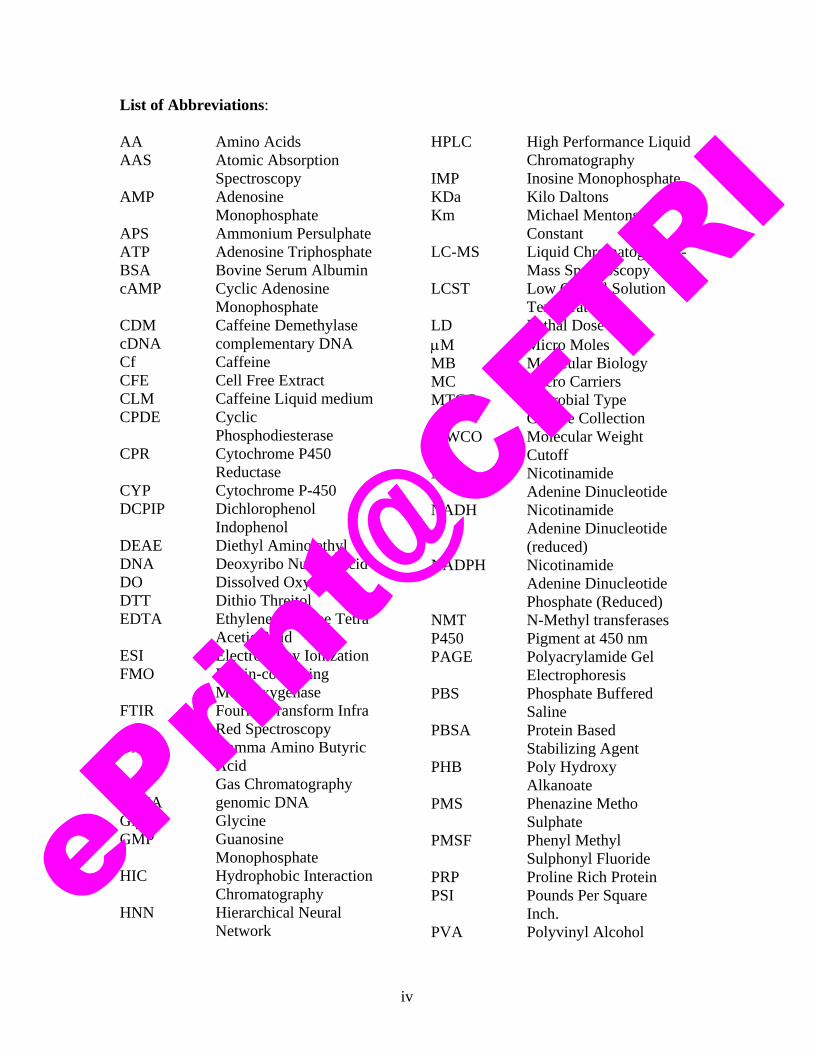
List of Abbreviations: AA Amino Acids AAS Atomic Absorption
Spectroscopy AMP Adenosine
Monophosphate APS Ammonium Persulphate ATP Adenosine Triphosphate BSA Bovine Serum Albumin cAMP Cyclic Adenosine
Monophosphate CDM Caffeine Demethylase cDNA complementary DNA Cf Caffeine CFE Cell Free Extract CLM Caffeine Liquid medium CPDE Cyclic
Phosphodiesterase CPR Cytochrome P450
Reductase CYP Cytochrome P-450 DCPIP Dichlorophenol
Indophenol DEAE Diethyl Amino ethyl DNA Deoxyribo Nucleic acid DO Dissolved Oxygen DTT Dithio Threitol EDTA Ethylene Diamine Tetra
Acetic Acid ESI Electro spray Ionization FMO Flavin-containing
Monooxygenase FTIR Fourier Transform Infra
Red Spectroscopy GABA Gamma Amino Butyric
Acid GC Gas Chromatography gDNA genomic DNA Gly Glycine GMP Guanosine
Monophosphate HIC Hydrophobic Interaction
Chromatography HNN Hierarchical Neural
Network
HPLC High Performance Liquid
Chromatography IMP Inosine Monophosphate KDa Kilo Daltons Km Michael Mentons
Constant LC-MS Liquid Chromatography-
Mass Spectroscopy LCST Low Critical Solution
Temperature LD Lethal Dose μM Micro Moles MB Molecular Biology MC Micro Carriers MTCC Microbial Type
Culture Collection MWCO Molecular Weight
Cutoff NAD Nicotinamide
Adenine Dinucleotide NADH Nicotinamide
Adenine Dinucleotide (reduced)
NADPH Nicotinamide Adenine Dinucleotide Phosphate (Reduced)
NMT N-Methyl transferases P450 Pigment at 450 nm PAGE Polyacrylamide Gel
Electrophoresis PBS Phosphate Buffered
Saline PBSA Protein Based
Stabilizing Agent PHB Poly Hydroxy
Alkanoate PMS Phenazine Metho
Sulphate PMSF Phenyl Methyl
Sulphonyl Fluoride PRP Proline Rich Protein PSI Pounds Per Square
Inch. PVA Polyvinyl Alcohol
iv
ePrin
t@CFT
RI
v
Px Paraxanthine RNA Ribo Nucleic Acid SDS Sodium Dodecyl
Sulphate SEM Scanning Electron
Microscope SIDS Sudden Infant Death
Syndrome SRS Substrate Recognition
Sites Tb Theobromine TEMED Tetra Ethylene Methyl
Ethyl Diamine TFA Trifluoro Acetic Acid THF Tetra hydro furan TLC Thin layer
Chromatography TMU Trimethyl Uric Acid Tp Theophylline Vmax Maximum Velocity of
Enzyme Reaction XMP Xanthosine
Monophosphaste XO Xanthine Oxidase
eP
rint@
CFTRI
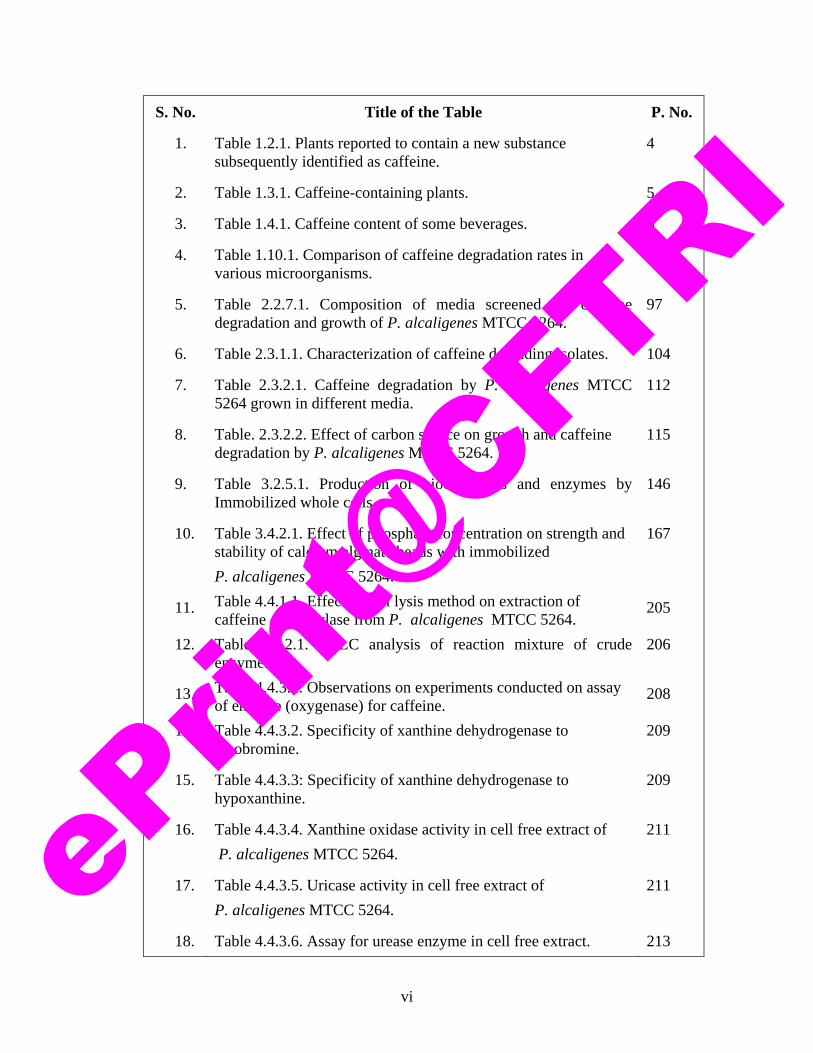
S. No. Title of the Table P. No.
1. Table 1.2.1. Plants reported to contain a new substance subsequently identified as caffeine.
4
2. Table 1.3.1. Caffeine-containing plants. 5
3. Table 1.4.1. Caffeine content of some beverages. 8
4. Table 1.10.1. Comparison of caffeine degradation rates in various microorganisms.
54
5. Table 2.2.7.1. Composition of media screened for caffeine degradation and growth of P. alcaligenes MTCC 5264.
97
6. Table 2.3.1.1. Characterization of caffeine degrading isolates. 104
7. Table 2.3.2.1. Caffeine degradation by P. alcaligenes MTCC 5264 grown in different media.
112
8. Table. 2.3.2.2. Effect of carbon source on growth and caffeine degradation by P. alcaligenes MTCC 5264.
115
9. Table 3.2.5.1. Production of biochemicals and enzymes by Immobilized whole cells.
146
10. Table 3.4.2.1. Effect of phosphate concentration on strength and stability of calcium alginate beads with immobilized P. alcaligenes MTCC 5264.
167
11. Table 4.4.1.1. Effect of cell lysis method on extraction of caffeine demethylase from P. alcaligenes MTCC 5264.
205
12. Table 4.4.2.1. HPLC analysis of reaction mixture of crude enzyme.
206
13. Table 4.4.3.1. Observations on experiments conducted on assay of enzyme (oxygenase) for caffeine.
208
14. Table 4.4.3.2. Specificity of xanthine dehydrogenase to theobromine.
209
15. Table 4.4.3.3: Specificity of xanthine dehydrogenase to hypoxanthine.
209
16. Table 4.4.3.4. Xanthine oxidase activity in cell free extract of P. alcaligenes MTCC 5264.
211
17. Table 4.4.3.5. Uricase activity in cell free extract of P. alcaligenes MTCC 5264.
211
18. Table 4.4.3.6. Assay for urease enzyme in cell free extract. 213
vi
ePrin
t@CFT
RI
19. Table 4.4.6.1. HPLC analysis of the reaction mixture of purified caffeine demethylase obtained from SDS PAGE gel.
227
20. Table 4.4.6.2. Determination of metal content in caffeine demethylase by AAS.
234
21. Table 5.4.4.1. Effect of aeration and agitation on the biodecaffeination of dhool.
288
22. Table 6.4.1.1: Response of the biosensor using different immobilizing agents.
311
23. Table 6.4.3.1. Effect of interfering agents on caffeine biosensor response.
317
24. Table 6.4.3.2. Analysis of caffeine in real samples by Biosensor and by HPLC.
319
vii
ePrin
t@CFT
RI
List of Figures: S. No. Title of Figure P. No.
1) Figure 1.5.1. Structures of purine, xanthine, caffeine, theobromine, theophylline and uric acid.
12
2) Figure1.8.1.1. Schematic process for decaffeination using Solvents.
24
3) Figure 1.8.2.1. Schematic diagram of swiss water decaffeination process.
25
4) Figure1.8.3.1. Schematic of super critical carbon dioxide decaffeination process
26
5) Figure 1.9.1.1. 3-D Structure of cytochrome P-450 cam (Pseudomonas putida) with thiocamphor bound to active site.
31
6) Figure 1.9.1.2. Caffeine degradation pathway in human liver. 34 7) Figure 1.9.1.3. Crystal structure of human cytochrome P450 1A2. 35 8) Figure 1.9.2.1. Metabolism of hypoxanthine and xanthine in buds
of tea leaves. 39
9) Figure 1.9.3.1. Caffeine degradation pathway in microorgansims. 47 10) Figure 1.9.3.2. First steps in the degradation pathway of caffeine
by Rhizopus delemar. 52
11) Figure 2.1.1. Caffeine degradation pathway in microorganisms. 88 12) Figure2.3.1.1. Degradation of caffeine by bacteria isolated from
tea plantation soil. 105
13) Figure 2.3.1.2 a. Pure culture of P. alcaligenes MTCC 5264 growing on caffeine agar plate containing 50g.L-1 of caffeine.
107
14) Figure 2.3.1.2 b. Pure culture of P. alcaligenes MTCC 5264 growing on nutrient agar plate containing 0.3g.L-1 of caffeine.
107
15) Figure 2.3.1.3. HPLC analysis of caffeine degradation products produced by P. alcaligenes MTCC 5264 after 72 hrs of incubation in CLM.
109
16) Figure 2.3.2.1. Growth of P. alcaligenes MTCC 5264 in different media.
111
17) Figure 2.3.2.2 a. Effect of carbon source on growth and caffeine degradation by P. alcaligenes MTCC 5264.
114
18) Figure 2.3.2.2 b. Effect of sucrose concentration on growth and caffeine degradation by P. alcaligenes MTCC 5264.
116
19) Figure 2.3.2.3. Effect of nitrogen sources on growth and caffeine degradation by P. alcaligenes MTCC 5264.
118
20) Figure 2.3.2.4. Effect of pH on growth and caffeine degradation by P. alcaligenes MTCC 5264.
120
21) Figure 2.3.2.5. Effect of temperature on growth and caffeine degradation by P. alcaligenes MTCC 5264.
122
22) Figure 2.3.2.6. Effect of caffeine concentration on growth and caffeine degradation by P. alcaligenes MTCC 5264.
124
23) Figure 2.3.2.7. Effect of inoculum volume on growth and caffeine degradation by P. alcaligenes MTCC 5264.
126
viii
ePrin
t@CFT
RI
24) Figure 2.3.2.8. Growth and caffeine degradation by P. alcaligenes MTCC 5264 under optimum conditions.
128
25) Figure 3.3.4.2. Schematic of Immobilized cell based reactor for biodecaffeination studies.
156
26) Figure 3.4.1.1. Induced cells of P. alcaligenes MTCC 5264, immobilized in gelatin.
159
27) Figure 3.4.1.2. Biodecaffeination of pure caffeine solution (1g.L-1) by P. alcaligenes MTCC 5264 immobilized in different matrices.
161
28) Figure 3.4.1.3. Scanning electron microscope photograph of P. alcaligenes MTCC 5264 immobilized in gelatin.
161
29) Figure 3.4.1.4. Induced cells of P. alcaligenes MTCC5264, immobilized in κ-carrageenan.
162
30) Figure 3.4.1.5. Scanning electron microscope photograph of P. alcaligenes MTCC 5264, immobilized in κ-carrageenan.
163
31) Figure 3.4.1.6. Induced cells of P. alcaligenes MTCC5264, immobilized in Agar.
163
32) Figure 3.4.1.7. Induced cells of P. alcaligenes MTCC 5264, immobilized in Calcium alginate.
164
33) Figure 3.4.1.8. Scanning electron microscope photograph of P. alcaligenes MTCC 5264 immobilized in sodium alginate.
164
34) Figure 3.4.2.1.Effect of buffer composition on biodecaffeination by P. alcaligenes MTCC 5264 immobilized in calcium alginate.
166
35) Figure 3.4.2.2. Effect of pH on biodecaffeination of caffeine solution (1g.L-1) by P. alcaligenes MTCC 5264 immobilized in calcium alginate.
168
36) Figure 3.4.2.3. Effect of temperature on biodecaffeination by P. alcaligenes MTCC 5264 immobilized in calcium alginate.
169
37) Figure 3.4.2.4. Effect of aeration on biodecaffeination by P. alcaligenes MTCC 5264 immobilized in calcium alginate.
171
38) Figure 3.4.2.5. Effect of cell loading on biodecaffeination by P. alcaligenes MTCC 5264 immobilized in calcium alginate.
172
39) Figure 3.4.2.6. Effect of flow rate on biodecaffeination of caffeine solution by immobilized cells of P. alcaligenes MTCC 5264.
174
40) Figure 3.4.2.7. Effect of packed bed volume on biodecaffeination by P. alcaligenes MTCC 5264 immobilized in calcium alginate.
175
41) Figure 3.4.3. Biodecaffeination of pure caffeine solution with P. alcaligenes MTCC 5264 immobilized in calcium alginate under optimum conditions.
177
42) Figure 4.4.3.1. Determination of caffeine demethylase activity in CFE from P. alcaligenes MTCC 5264 by oximetry.
214
43) Figure 4.4.3.2. Caffeine degradation pathway in P. alcaligenes. 216
ix
ePrin
t@CFT
RI
44) Figure 4.4.4.1 a. Storage stability of caffeine demethylase stored at 4oC.
218
45) Figure 4.4.4.1.b. Storage stability of caffeine demethylase in CFE frozen and stored at -20oC.
219
46) Figure 4.4.4.2. Stabilization of caffeine demethylase by PBSAs and polyols.
221
47) Figure 4.4.5.1. Purification of caffeine demethylase by gel permeation chromatography.
223
48) Figure. 4.4.5.2. Purification of caffeine demethylase by ion exchange chromatography on DEAE-Sephadex G-75.
224
49) Figure 4.4.5.3. Purification of caffeine demethylase by hydrophobic interaction chromatography.
225
50) Figure 4.4.5.4. Activity profile during purification of caffeine demethylase.
226
51) Figure 4.4.6.1. HPLC analysis of the incubation mixture of caffeine demethylase I purified by HIC.
228
52) Figure 4.4.6.2. HPLC analysis of the incubation mixture of caffeine demethylase II purified by HIC.
229
53) Figure 4.4.6.3. Substrate saturation plot of caffeine demethylase from P. alcaligenes MTCC 5264.
230
54) Figure 4.4.6.4. Double reciprocal plot of caffeine demethylase activity.
231
55) Figure 4.4.6.5 SDS-PAGE of crude and purified caffeine demethylase
233
56) Figure 4.4.6.6. Determination of the cofactor requirement of caffeine demethylase.
235
57) Figure 4.4.7.1a: LC MS analysis of pure caffeine demethylase. 236 58) Figure 4.4.7.1b: Molecular mass graph of caffeine demethylase
analyzed by LC MS. 236
59) Figure 4.4.7.2a. Peptide mass finger prints of tryptic digest of caffeine demethylase.
237
60) Figure 4.4.7.2b. Peptide mass finger prints of tryptic digest of caffeine demethylase.
238
61) Figure 4.4.7.2c. Peptide mass finger prints of tryptic digest of caffeine demethylase.
238
62) Figure 4.4.7.3. Hierarchical neural network result for caffeine demethylase for prediction of secondary structure.
242
63) Figure 4.4.7.4 a. Graphical representation of the predicted secondary structure of caffeine demethylase.
243
64) Figure 4.4.7.4b. Graphical representation of secondary structure of caffeine demethylase (HNN).
243
65) Figure 4.4.7.5. Ramachandran plot of caffeine demethylase. 244 66) Figure 4.4.7.6: Predicted 3D structure of caffeine demethylase
enzyme based on PSSM output. 250
x
ePrin
t@CFT
RI
xi
67) Figure 4.4.7.7. 3D Structure Fe-S center of rieske iron sulphur protein of vanillate demethylase.
251
68) Figure 5.3.3.2. Schematic of the process for continuous bio-decaffeination of coffee beans/Solids.
272
69) Figure 5.4.1.1. Growth and biodecaffeinating enzymes production by P. alcaligenes MTCC 5264.
276
70) Figure 5.4.3.2. Biodecaffeination of pure caffeine by immobilized CFE of P. alcaligenes MTCC 5264.
278
71) Figure 5.4.3.3. Laboratory scale apparatus for biodecaffeination of coffee beans.
279
72) Figure 5.4.4.1. Effect of enzyme concentration on biodecaffeination of tea dhool.
281
73) Figure 5.4.4.2. Effect of different treatments of dhool on availability of caffeine for biodecaffeination of tea.
283
74) Figure 5.4.4.3. Effect of moisture content on enzymatic biodecaffeination of tea dhool.
285
75) Figure 5.4.4.4. Effect of intermittent enzyme addition on biodecaffeination of tea dhool.
286
76) Figure 5.4.4.5. Interactions of caffeine with polyphenols. 289 77) Figure 5.4.4.6. Interaction of catechin (10mg/ml) with CFE. 291 78) Figure 5.4.4.7. Effect of glycine and glycerol on inhibition of
protein polyphenol interactions in tea dhool. 293
79) Figure 5.4.5.1. Kinetics of caffeine degradation during biodecaffeination of tea dhool.
296
80) Fig. 6.3.1.1. Schematic diagram of the whole cell electrode used for the biosensor.
307
81) Figure 6.3.1.2. Schematic diagram of the biosensor for the estimation of caffeine.
309
82) Figure 6.4.1.1. Response of the biosensor to 1% w/v of pure caffeine.
311
83) Figure 6.4.1.2. Calibration of caffeine using immobilized cell biosensor.
313
84) Figure 6.4.2.1. Calibration for caffeine using HPLC. 314 85) Figure 6.4.3.1. Effect of pH on response of biosensor to caffeine. 315 86) Figure 6.4.3.2. Effect of temperature on the response of biosensor
to caffeine. 316
87) Figure 6.4.3.3. Response of immobilized xanthine oxidase to caffeine, theobromine and theophylline.
318
eP
rint@
CFTRI
Title: A BIOTECHNOLOGICAL APPROACH FOR DECAFFEINATION
Synopsis
Tea and coffee are consumed largely world over. India is one of the largest
exporters of coffee and tea and these beverages form a part of the major foreign exchange
earner for our country. Presence of caffeine limits the frequent intake of these beverages,
the reason being the toxic and addictive effects of caffeine when taken in large doses
leading to a need for the decaffeination of coffee and tea. The market for decaffeinated
products is increasing at 10-15% Per annum. However conventional decaffeination
technologies use toxic solvents, and methods, which not only strip the essential flavor
and aroma components, but also are expensive, and environmentally unsafe. The present
day shift is towards safe and economical processes for decaffeination through
biotechnological route (biodecaffeination) are considered as the best alternative to the
existing methods of decaffeination. This thesis reports the development of a process for
biodecaffeination of caffeine containing materials by suitable microorganisms and
enzymes.
The work involved the isolation, characterization and identification of potent
microorganisms capable of degrading caffeine, selection of the efficient organisms for
caffeine degradation and optimization of parameters of growth and caffeine degradation.
Further work was carried out on the identification of enzyme/enzymes responsible for
caffeine degradation, immobilization of whole cells and enzymes for bio-decaffeination
and optimization of parameters for efficient bio-decaffeination by the immobilized
cell/enzyme system. Work was also carried out on the development of biodecaffeination
processes for coffee, tea and caffeine containing solutions. Development of
1
ePrin
t@CFT
RI
biodecaffeination process for tea and coffee involved several complex problems to be
solved for application to the real samples, which are detailed in the thesis.
Proposed objectives:
1. Isolation, purification, characterization and identification of microbial cultures for
decaffeination.
2. Selection of the efficient organisms for caffeine degradation.
3. Optimization of parameters of growth and caffeine degradation by the selected
microorganisms.
4. Identification of enzyme/enzymes responsible for caffeine degradation.
5. Immobilization of whole cells for bio-decaffeination.
6. Immobilization of enzymes responsible for bio-decaffeination.
7. Optimization of parameters for efficient bio-decaffeination by the immobilized
cell/enzyme system.
Thesis Organization:
Chapter 1:
The first chapter of thesis is on review of the literature on caffeine, its effects on
health, existing methods of decaffeination and their advantages and disadvantages,
degradation of caffeine in different biological systems and microbial degradation of
caffeine.
The first section in the chapter deals with caffeine, in general; availability of
caffeine, details on worldwide consumption of caffeine and health problems associated
with excess caffeine intake. The second section of the chapter details the importance of
decaffeination, the conventional methods of decaffeination and the disadvantages.
2
ePrin
t@CFT
RI
The last section is related to the importance of biodecaffeination, its advantages,
the constraints existing for developing methods of biodecaffeination and the possibilities
of developing biodecaffeination methods. It also deals with the, work carried out by
different groups around the world on development of biodecaffeination, biological
systems involved in biodecaffeination and the drawbacks and constraints present in the
development of efficient biodecaffeination technologies. The chapter concludes with the
challenges and opportunities for the development of biodecaffeination technologies at
CFTRI and future prospects.
Chapter 2:
The second chapter is organized into three sections and is focused on the
isolation, and characterization of caffeine degrading microorganisms and optimization of
parameters for biodecaffeination using the cells.
The first section is a brief background of the work done by other groups on
isolation of microorganisms capable of degrading caffeine, and includes an introduction
to biodecaffeination.
The second section deals with experimental details of isolation, characterization
and identification of biodecaffeinating organisms and optimization of several physico-
chemical parameters for biodecaffeination by the isolated organisms.
The third section deals with results and discussion of the work on the isolation
and characterization of three bacteria capable of degrading caffeine, selection of potent
caffeine degrading organism (Pseudomonas alcaligenes MTCC 5264), optimization of
media, carbon source, nitrogen source and physical conditions for efficient biomass
production and caffeine degradation by P. alcaligenes MTCC 5264.
3
ePrin
t@CFT
RI
Chapter 3:
The third chapter deals with immobilization of whole cells of P. alcaligenes
MTCC 5264 in different matrices and studies on biodecaffeination with immobilized
cells. The chapter details the studies on the selection of a suitable matrix for
immobilization and biodecaffeination of pure caffeine and tea and coffee using the
immobilized cells. Cells immobilized in calcium alginate were found to be most suitable
and used for immobilization of P. alcaligenes MTCC 5264. Immobilized cells could do
biodecaffeination of a pure caffeine solution, whereas complete biodecaffeination of
coffee and tea was not possible due to the utilization of sugars and other nutrients in tea
by the organism and not caffeine. Moreover, the process affects the quality of the coffee
and tea making it unsuitable for biodecaffeination of coffee and tea. Therefore an
enzymatic process for biodecaffeination is viewed as a potent alternative and this chapter
ends with suggestions on development of biodecaffeination processes based on
immobilized or soluble enzymes.
Chapter 4:
Fourth chapter deals with the isolation, identification and partial characterization
of enzymes involved in the biodecaffeination.
The first section of the chapter is a brief introduction to the enzymes involved in
degradation of caffeine by microorganisms.
The second sections deals with the methodologies applied in the study. The third
section represents the results, discussion and conclusions on the nature of the enzymes
involved in caffeine degradation. The enzymes involved in the degradation of caffeine by
P.alcaligenes MTCC 5264 identified as caffeine demethylase, xanthine oxidase, uricase,
4
ePrin
t@CFT
RI
allantoinase, allantoicase, glyoxylate dehydrogenase and urease. Caffeine demethylase
has been found to be the rate-limiting enzyme in this process and is highly inducible. The
enzyme is also highly unstable and is being reported conclusively for the first time in this
thesis. This chapter focuses on the isolation, identification and characterization of
caffeine demethylase enzyme and the stabilization of the enzyme.
Caffeine demethylase enzyme (1N-demethylase) was purified and characterized
by using LC-MS/MS Analysis and bioinformatics tools and the 3D structure of the
enzyme was predicted.
Chapter 5:
This chapter is organized into three sections. The first section is a brief
introduction to the concept of biodecaffeination, and a survey of the research work done
on biodecaffeination in different parts of the world.
The second section of the chapter represents the methodologies adopted to
develop biodecaffeination processes for coffee and tea.
The third section is a detailed analysis of the results and includes discussions on
the biochemical aspects of biodecaffeination. In conclusion, the parameters for efficient
biodecaffeination using enzymes were optimized and the stabilized enzyme preparation
was used for the biodecaffeination of tea dhool and immobilized enzymes were used for
the biodecaffeination of coffee beans through an extraction cum biodecaffeination
process designed by us. These processes achieved more than 80-90% biodecaffeination in
tea and coffee respectively. This chapter ends with recommendations on further work to
be carried out on the caffeine demethylase enzyme and other enzymes involved in
biodecaffeination.
5
ePrin
t@CFT
RI
Chapter 6:
Chapter 6, deals with studies on the development of a whole cell based biosensor
for caffeine analysis in food, fermentation and clinical samples. In brief, we have utilized
a microbe, which can degrade caffeine to develop an amperometric biosensor for
determination of caffeine in solutions. Whole cells of P. alcaligenes MTCC 5264 having
the capability to degrade caffeine were immobilized by covalent crosslinking method.
The biosensor system was able to detect caffeine in solution over a concentration range
from 0.1 mg mL-1 to 1 mg mL-1. With read-times as short as 3 min, this caffeine
biosensor acts as a rapid analysis system for caffeine in solutions. Although a few
biosensing methods for caffeine are reported, they have limitations in application for
commercial samples. The optimum pH and temperature of measurement were 6.8 and
30±20C respectively. Interference in analysis of caffeine due to different substrates was
not observed. Caffeine content of commercial samples of instant tea and coffee was
analysed by the biosensor and the results compared well with HPLC analysis.
Conclusions and Future Recommendations:
The work reported in this thesis has led to the development of biodecaffeination
processes for coffee and tea. Although several critical factors, which affect the
biodecaffeination process, have been identified and optimized, there is a scope for
improvement of the efficiency of this process. Further studies on stabilization of caffeine
demethylase, cloning and hyper expression of caffeine demethylase, molecular
characterization of the enzyme are to be carried out. Also studies on the scale up of the
biodecaffeination process are needed and are being carried out.
6
ePrin
t@CFT
RI
7
In conclusion, this thesis deals with the basic studies on the microbiological,
enzymological and biochemical aspects of development of biodecaffeination processes.
Several bottlenecks which were found to hinder the process of biodecaffeination were
overcome through a detailed study on the factors influencing the activities of enzymes in
biodecaffeination has been carried out. An enzymatic process for biodecaffeination of
coffee was developed by using an immobilized system and a biodecaffeination process
for tea was developed by using soluble enzymes during fermentation of tea. The
biodecaffeinated tea and coffee had the same taste and aroma profile and no change in
quality was observed. These processes have immense potential in industries and are being
pursued.
Dr. M.S. Thakur V. R. Sarath Babu
Guide.
ePrin
t@CFT
RI

CHAPTER 1 REVIEW OF LITERATURE
ePrin
t@CFT
RI
A Biotechnological Approach for Decaffeination Chapter 1
1.1. SCOPE OF THE REVIEW:
Caffeine as a stimulant molecule has gained very high prominence and is the
most widely used molecule without any legal restrictions. This molecule has attracted
several researchers around the world and a lot of research has been done around
several aspects of this molecule. Apart from its clinical importance, caffeine is also
commercially significant in terms of its consumption in the form of caffeinated
beverages like coffee, tea and cola drinks. Recent studies show that excess
consumption of caffeine has many health implications in humans. Therefore
decaffeination technologies have been developed since 1920’s through chemical
routes. These chemical decaffeination methods have several disadvantages.
Biodecaffeination as an alternative route for decaffeination is in the budding stage
and knowledge about this area of coffee and tea biotechnology is scarce.
The first part of this review of literature details a brief history of caffeine, its
use world over, statistics of caffeine consumption in terms of different beverages and
clinical aspects of caffeine consumption. Conventional decaffeination technologies
and their disadvantages are detailed in the middle part of the review and the later part
of the review deals with the biological aspects of caffeine metabolism by different
organisms, the enzyme systems involved in humans, plants, fungi and bacteria and
the existing literature on biodegradation of caffeine by these systems. The later part
also discusses the developments in the area of biodecaffeination at Central Food
Technological Research Institute (CFTRI), Mysore, India. The review ends with
conclusions and future perspectives of the development of biodecaffeination
technologies using enzymes isolated from microorganisms.
1
ePrin
t@CFT
RI
A Biotechnological Approach for Decaffeination Chapter 1
1.2. HISTORY OF CAFFEINE: Caffeine, a methyl xanthine molecule is the most widely consumed
psychoactive substance in the world over, most commonly from the beverages coffee,
tea and soda. The English word caffeine comes from the French (Spanish &
Portuguese) word for coffee: café. Because of its stimulatory nature, it was used as a
cardiotonic till the end of 19th century (Wijhe, 2002). In the first half of the 20th
century, it was used as a stimulant of respiration and circulation in Dutch medicine.
The Islamic physicians were the first to exploit the medicinal use of coffee well
before second millennium A.D, the first documented use as a beverage was by the
Sufis of Yemen. With caffeine being increasingly used as a stimulant, it was
prohibited from being used as it was thought that caffeine use was a cause for vices
and is seditious. Coffee was introduced to England around 1650’s and in Holland a
decade later. The Dutch introduced the coffee plant to the island of Java in 1688. The
island's association with coffee production led to the use of "Java" as a nickname for
high quality coffee.
In 1903 an Italian manufacturer invented the espresso (Italian for fast).
Espresso topped with equal parts of foamed and steamed milk is called cappuccino.
Caffeine contributes to a particular proportion of the perceived bitterness of a cup of
coffee and makes a small contribution to espresso’s strength and body (Illy and Viani,
1995).
1.2.1. Discovery of caffeine and related compounds:
Kihlman (1974) has excellently reviewed the discovery of caffeine in his book
'Caffeine and Chromosomes'. Although not called caffeine or 1,3,7-trimethylxanthine
at the time, German and French workers discovered the compound independently in
2
ePrin
t@CFT
RI
A Biotechnological Approach for Decaffeination Chapter 1
the early 1820s. In the book 'Neueste Phytochemische Entdeckungen zur Begründung
einer wissenschaftlichen Phytochemie', Ferdinand Runge (1820) described a
substance with basic properties which he had isolated from green coffee beans, and
which he termed 'Kaffebase'. This publication appears to contain the first detailed
description of caffeine. However, during the same year his German colleague F. Von
Giese (1820) reported in a letter to Scherer's 'Allgemeine nordische Annalen der
Chemie für die Freunde der Naturkunde und Arzneiwissenschaft' that he had found a
new alkaloid in extracts of coffee beans. He called the alkaloid 'Kaffeestoff', but
subsequently declared it to be identical with Runge's 'Kaffebase' (Giese, 1821).
Independent of the German discoveries, the French workers Robiquet (1823) and
Pelletier (1826) (in collaboration with Caventou) discovered caffeine in extracts of
coffee beans, and described it as a white crystalline volatile substance remarkable for
its very high content of nitrogen, without referring to it by any particular name. Who
first named the compound caffeine is difficult to say. However, in the Dictionnaire
des termes de Médicine of 1823, the substance is listed under the name 'cafiéne' or
'cofeina' and Fechner (1826) described it in his 'Repertorium der organischen Chemie'
under the heading 'Caffeine oder Coffein'.
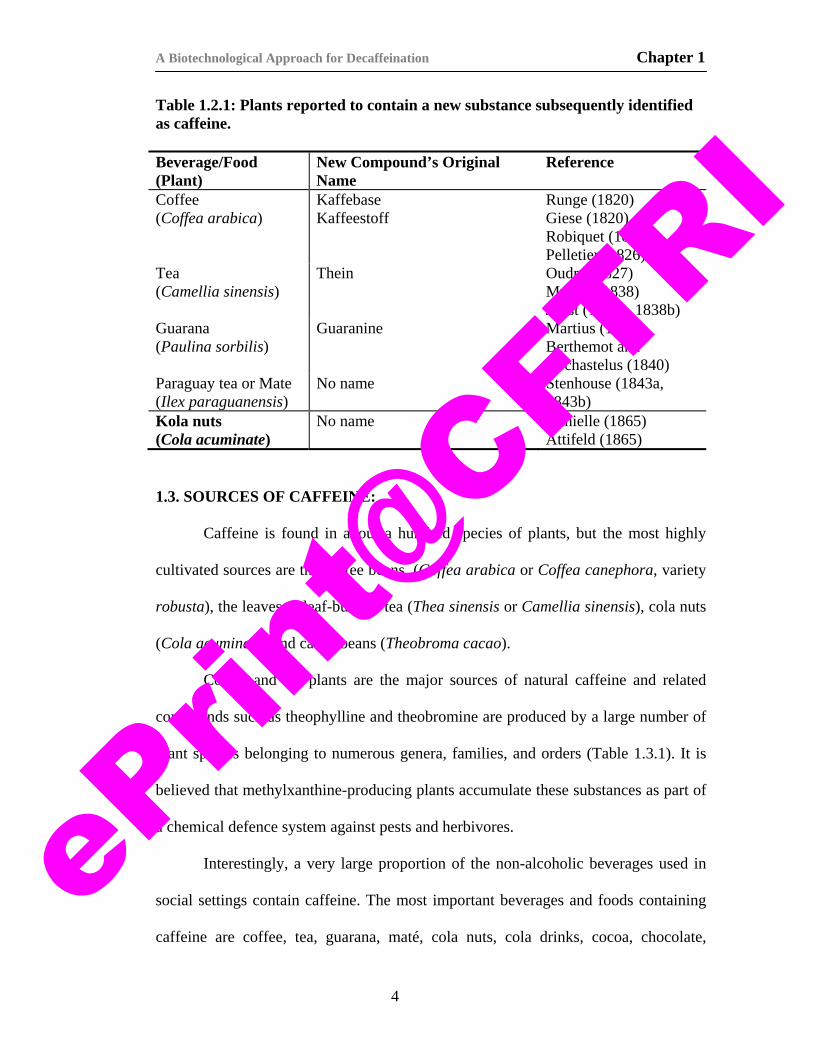
Table 1.2.1. lists plants, which contained a new substance, given a specific
name by the discoverer, but which was subsequently shown to be caffeine. An
analogous alkaloid, theobromine, was identified in cacao beans (Theobromina cacao)
by Woskresensky (1842) and another one, theophylline, in tea leaves by Kossel
(1888). Both these compounds are dimethylxanthines.
3
ePrin
t@CFT
RI
A Biotechnological Approach for Decaffeination Chapter 1
Table 1.2.1: Plants reported to contain a new substance subsequently identified as caffeine. Beverage/Food (Plant)
New Compound’s Original Name
Reference
Coffee (Coffea arabica)
Kaffebase Kaffeestoff
Runge (1820) Giese (1820) Robiquet (1823) Pelletier (1826)
Tea (Camellia sinensis)
Thein Oudry (1827) Mulder (1838) Jobst (1838a, 1838b)
Guarana (Paulina sorbilis)
Guaranine Martius (1840) Berthemot and Dechastelus (1840)
Paraguay tea or Mate (Ilex paraguanensis)
No name Stenhouse (1843a, 1843b)
Kola nuts (Cola acuminate)
No name Danielle (1865) Attifeld (1865)
1.3. SOURCES OF CAFFEINE:
Caffeine is found in about a hundred species of plants, but the most highly
cultivated sources are the coffee beans, (Coffea arabica or Coffea canephora, variety
robusta), the leaves & leaf-buds of tea (Thea sinensis or Camellia sinensis), cola nuts
(Cola acuminata) and cacao beans (Theobroma cacao).
Coffee and tea plants are the major sources of natural caffeine and related
compounds such as theophylline and theobromine are produced by a large number of
plant species belonging to numerous genera, families, and orders (Table 1.3.1). It is
believed that methylxanthine-producing plants accumulate these substances as part of
a chemical defence system against pests and herbivores.
Interestingly, a very large proportion of the non-alcoholic beverages used in
social settings contain caffeine. The most important beverages and foods containing
caffeine are coffee, tea, guarana, maté, cola nuts, cola drinks, cocoa, chocolate,
4
ePrin
t@CFT
RI
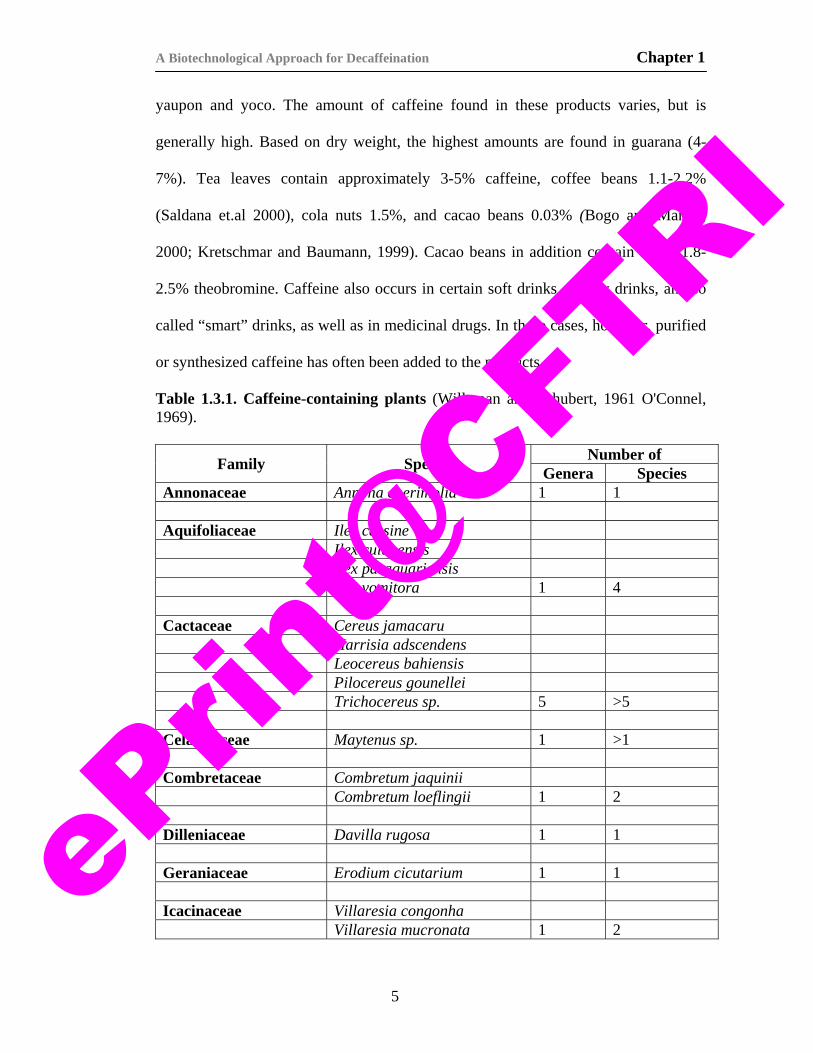
A Biotechnological Approach for Decaffeination Chapter 1
yaupon and yoco. The amount of caffeine found in these products varies, but is
generally high. Based on dry weight, the highest amounts are found in guarana (4-
7%). Tea leaves contain approximately 3-5% caffeine, coffee beans 1.1-2.2%
(Saldana et.al 2000), cola nuts 1.5%, and cacao beans 0.03% (Bogo and Mantle,
2000; Kretschmar and Baumann, 1999). Cacao beans in addition contain about 1.8-
2.5% theobromine. Caffeine also occurs in certain soft drinks, energy drinks, and so
called “smart” drinks, as well as in medicinal drugs. In these cases, however, purified
or synthesized caffeine has often been added to the products.
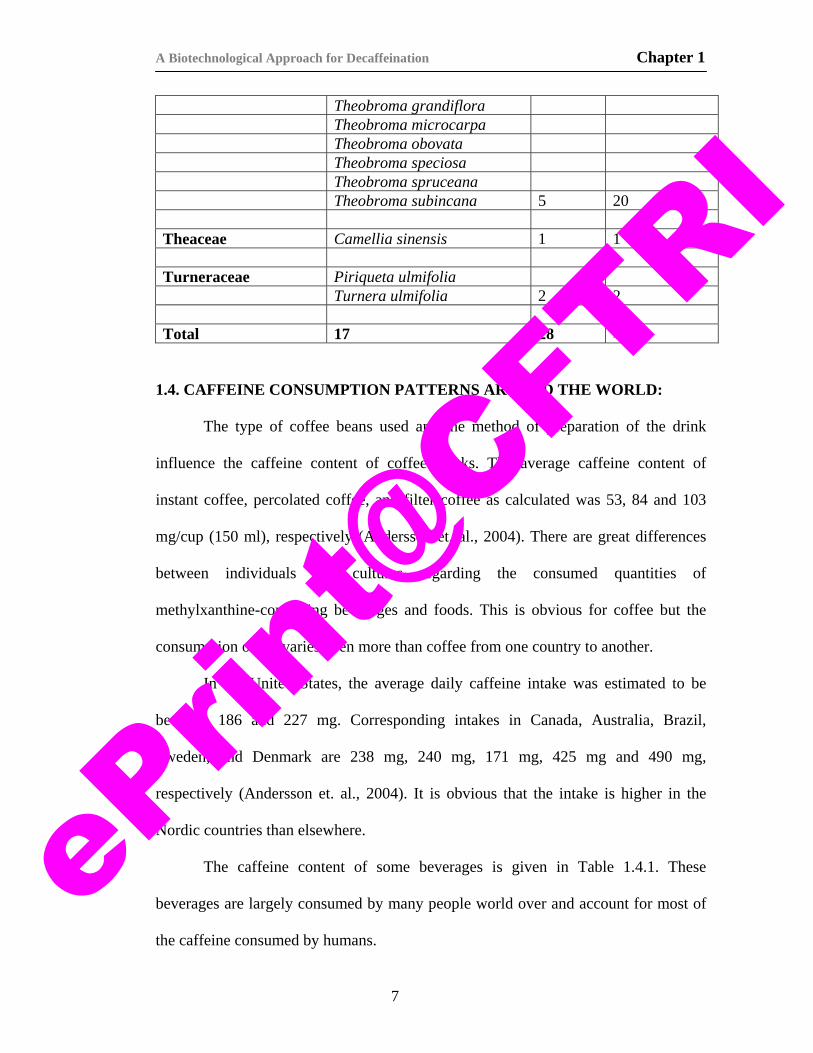
Table 1.3.1. Caffeine-containing plants (Willaman and Schubert, 1961 O'Connel, 1969).
Family Species Number of Genera Species
Annonaceae Annona cherimolia 1 1 Aquifoliaceae Ilex cassine Ilex cuiabensis Ilex paraguariensis Ilex vomitora 1 4 Cactaceae Cereus jamacaru Harrisia adscendens Leocereus bahiensis Pilocereus gounellei Trichocereus sp. 5 >5 Celastraceae Maytenus sp. 1 >1 Combretaceae Combretum jaquinii Combretum loeflingii 1 2 Dilleniaceae Davilla rugosa 1 1 Geraniaceae Erodium cicutarium 1 1 Icacinaceae Villaresia congonha Villaresia mucronata 1 2
5
ePrin
t@CFT
RI
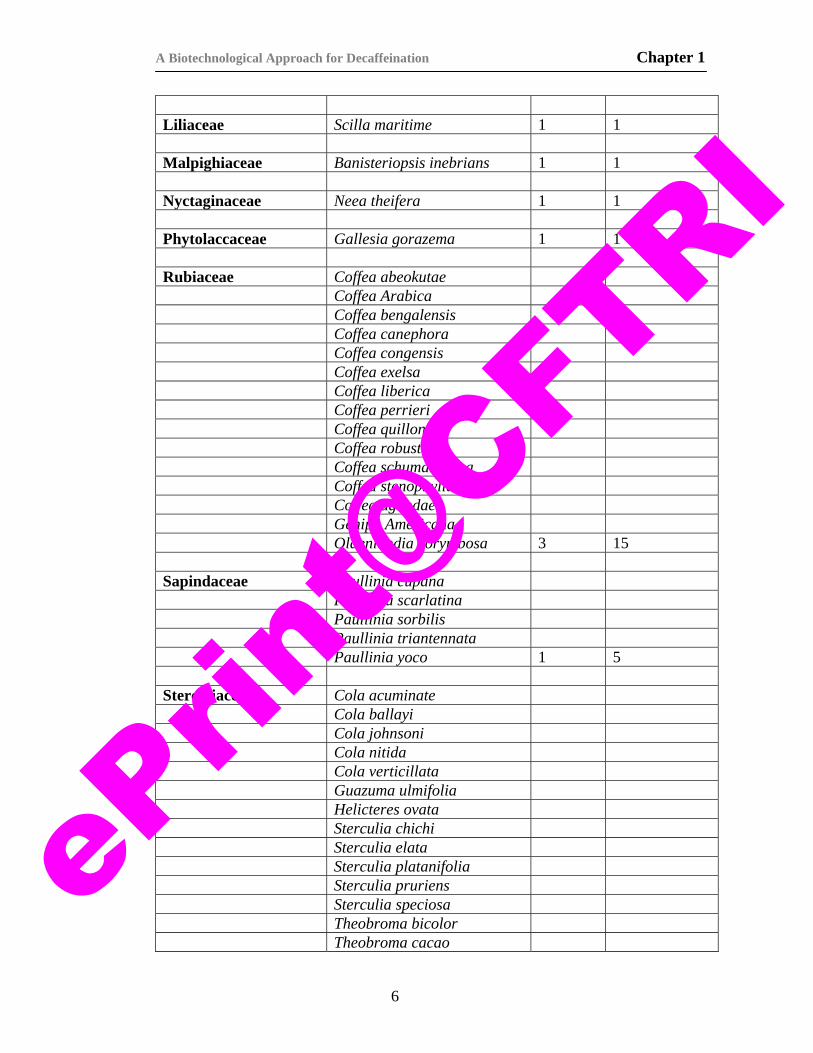
A Biotechnological Approach for Decaffeination Chapter 1
Liliaceae Scilla maritime 1 1 Malpighiaceae Banisteriopsis inebrians 1 1 Nyctaginaceae Neea theifera 1 1 Phytolaccaceae Gallesia gorazema 1 1 Rubiaceae Coffea abeokutae Coffea Arabica Coffea bengalensis Coffea canephora Coffea congensis Coffea exelsa Coffea liberica Coffea perrieri Coffea quillon Coffea robusta Coffea schumanniana Coffea stenophylla Coffea ugandae Genipa Americana Oldenlandia corymbosa 3 15 Sapindaceae Paullinia cupana Paullinia scarlatina Paullinia sorbilis Paullinia triantennata Paullinia yoco 1 5 Sterculiaceae Cola acuminate Cola ballayi Cola johnsoni Cola nitida Cola verticillata Guazuma ulmifolia Helicteres ovata Sterculia chichi Sterculia elata Sterculia platanifolia Sterculia pruriens Sterculia speciosa Theobroma bicolor Theobroma cacao
6
ePrin
t@CFT
RI
A Biotechnological Approach for Decaffeination Chapter 1
Theobroma grandiflora Theobroma microcarpa Theobroma obovata Theobroma speciosa Theobroma spruceana Theobroma subincana 5 20 Theaceae Camellia sinensis 1 1 Turneraceae Piriqueta ulmifolia Turnera ulmifolia 2 2 Total 17 28 >63
1.4. CAFFEINE CONSUMPTION PATTERNS AROUND THE WORLD:
The type of coffee beans used and the method of preparation of the drink
influence the caffeine content of coffee drinks. The average caffeine content of
instant coffee, percolated coffee, and filter coffee as calculated was 53, 84 and 103
mg/cup (150 ml), respectively (Andersson et. al., 2004). There are great differences
between individuals and cultures regarding the consumed quantities of
methylxanthine-containing beverages and foods. This is obvious for coffee but the
consumption of tea varies even more than coffee from one country to another.
In the United States, the average daily caffeine intake was estimated to be
between 186 and 227 mg. Corresponding intakes in Canada, Australia, Brazil,
Sweden, and Denmark are 238 mg, 240 mg, 171 mg, 425 mg and 490 mg,
respectively (Andersson et. al., 2004). It is obvious that the intake is higher in the
Nordic countries than elsewhere.
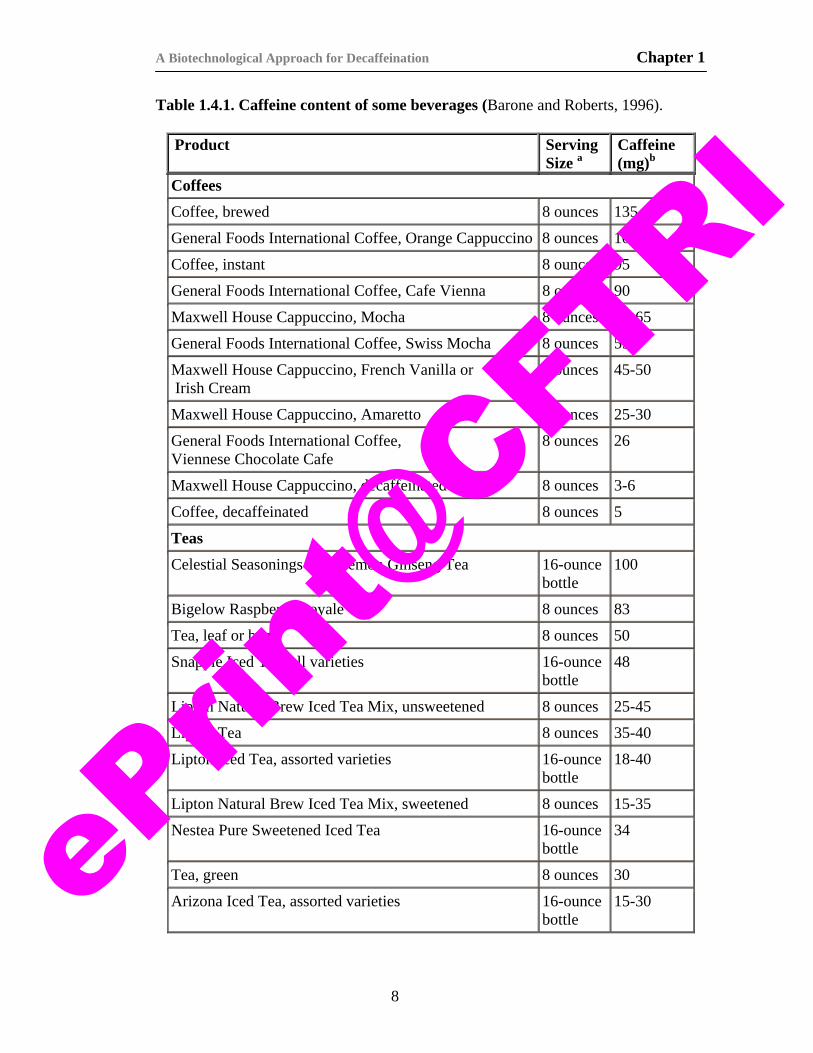
The caffeine content of some beverages is given in Table 1.4.1. These
beverages are largely consumed by many people world over and account for most of
the caffeine consumed by humans.
7
ePrin
t@CFT
RI
A Biotechnological Approach for Decaffeination Chapter 1
Table 1.4.1. Caffeine content of some beverages (Barone and Roberts, 1996).
Product Serving Size a
Caffeine (mg)b
Coffees Coffee, brewed 8 ounces 135
General Foods International Coffee, Orange Cappuccino 8 ounces 102
Coffee, instant 8 ounces 95
General Foods International Coffee, Cafe Vienna 8 ounces 90
Maxwell House Cappuccino, Mocha 8 ounces 60-65
General Foods International Coffee, Swiss Mocha 8 ounces 55
Maxwell House Cappuccino, French Vanilla or Irish Cream
8 ounces 45-50
Maxwell House Cappuccino, Amaretto 8 ounces 25-30
General Foods International Coffee, Viennese Chocolate Cafe
8 ounces 26
Maxwell House Cappuccino, decaffeinated 8 ounces 3-6
Coffee, decaffeinated 8 ounces 5
Teas Celestial Seasonings Iced Lemon Ginseng Tea 16-ounce
bottle 100
Bigelow Raspberry Royale Tea 8 ounces 83
Tea, leaf or bag 8 ounces 50
Snapple Iced Tea, all varieties 16-ounce bottle
48
Lipton Natural Brew Iced Tea Mix, unsweetened 8 ounces 25-45
Lipton Tea 8 ounces 35-40
Lipton Iced Tea, assorted varieties 16-ounce bottle
18-40
Lipton Natural Brew Iced Tea Mix, sweetened 8 ounces 15-35
Nestea Pure Sweetened Iced Tea 16-ounce bottle
34
Tea, green 8 ounces 30
Arizona Iced Tea, assorted varieties 16-ounce bottle
15-30
8
ePrin
t@CFT
RI
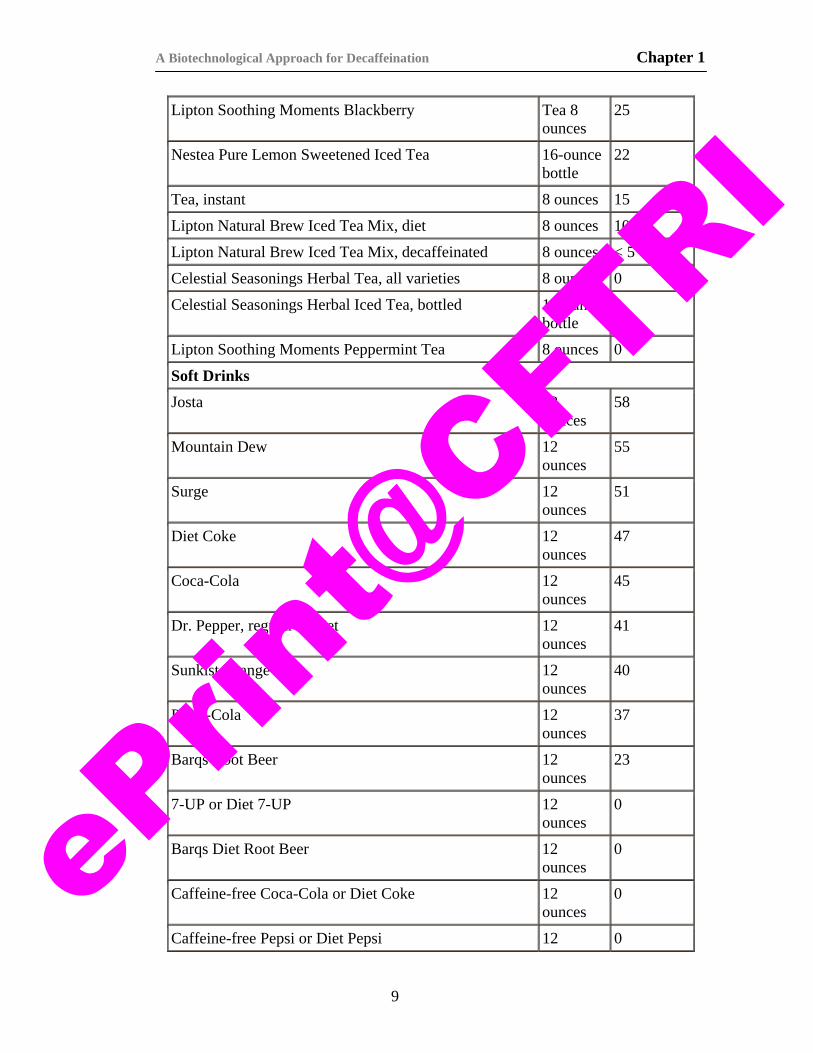
A Biotechnological Approach for Decaffeination Chapter 1
Lipton Soothing Moments Blackberry Tea 8 ounces
25
Nestea Pure Lemon Sweetened Iced Tea 16-ounce bottle
22
Tea, instant 8 ounces 15
Lipton Natural Brew Iced Tea Mix, diet 8 ounces 10-15
Lipton Natural Brew Iced Tea Mix, decaffeinated 8 ounces < 5
Celestial Seasonings Herbal Tea, all varieties 8 ounces 0
Celestial Seasonings Herbal Iced Tea, bottled 16-ounce bottle
0
Lipton Soothing Moments Peppermint Tea 8 ounces 0
Soft Drinks Josta 12
ounces 58
Mountain Dew 12 ounces
55
Surge 12 ounces
51
Diet Coke 12 ounces
47
Coca-Cola 12 ounces
45
Dr. Pepper, regular or diet 12 ounces
41
Sunkist Orange Soda 12 ounces
40
Pepsi-Cola 12 ounces
37
Barqs Root Beer 12 ounces
23
7-UP or Diet 7-UP 12 ounces
0
Barqs Diet Root Beer 12 ounces
0
Caffeine-free Coca-Cola or Diet Coke 12 ounces
0
Caffeine-free Pepsi or Diet Pepsi 12 0
9
ePrin
t@CFT
RI
A Biotechnological Approach for Decaffeination Chapter 1
ounces
Minute Maid Orange Soda 12 ounces
0
Mug Root Beer 12 ounces
0
Sprite or Diet Sprite 12 ounces
0
Caffeinated Waters Java Water 16.9
ounces 125
Krank 20 16.9 ounces
100
Aqua Blast 16.9 ounces
90
Water Joe 16.9 ounces
60-70
Aqua Java 16.9 ounces
50-60
Juices Juiced 10
ounces 60
Frozen Desserts Ben & Jerry’s No Fat Coffee Fudge Frozen Yogurt 1 cup 85
Starbucks Coffee Ice Cream, assorted flavors 1 cup 40-60
Häagen-Dazs Coffee Ice Cream 1 cup 58
Häagen-Dazs Coffee Frozen Yogurt, fat-free 1 cup 40
Häagen-Dazs Coffee Fudge Ice Cream, low-fat 1 cup 30
Starbucks Frappuccino Bar 1 bar (2.5 ounces)
15
Healthy Choice Cappuccino Chocolate Chunk or Cappuccino Mocha Fudge Ice Cream
1 cup 8
Yogurts, one container Dannon Coffee Yogurt 8 ounces 45
Yoplait Cafe Au Lait Yogurt 6 ounces 5
Dannon Light Cappuccino Yogurt 8 ounces < 1
10
ePrin
t@CFT
RI
A Biotechnological Approach for Decaffeination Chapter 1
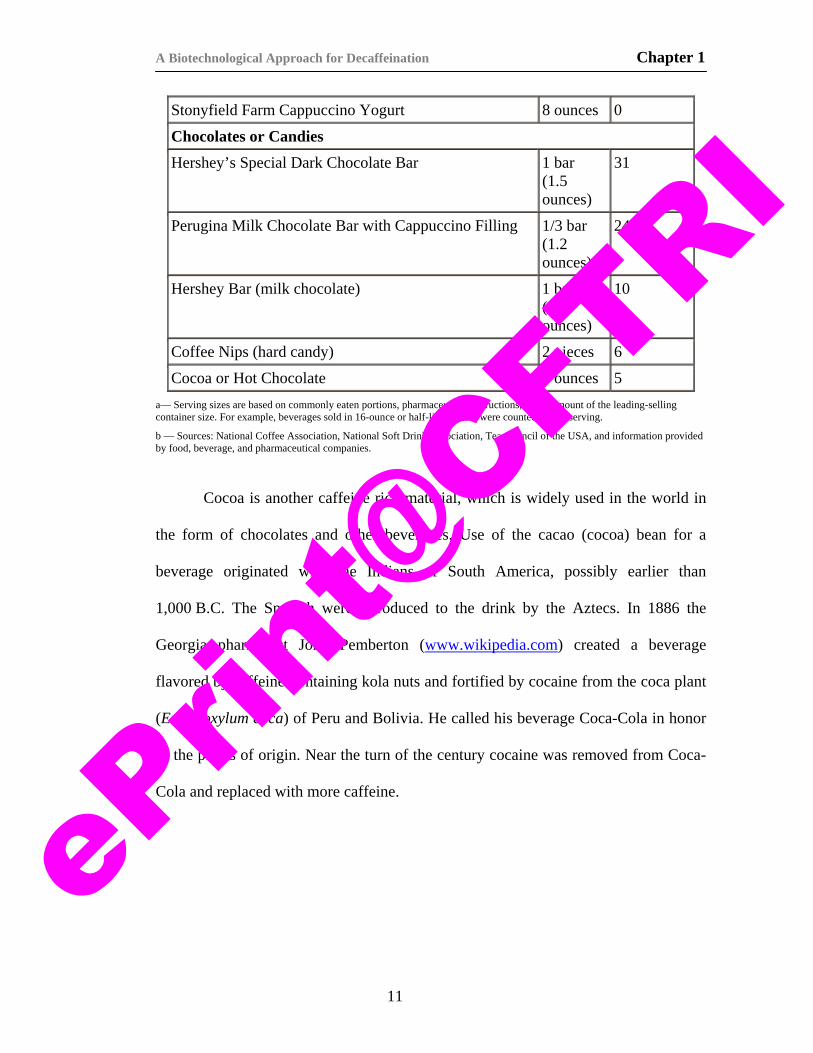
Stonyfield Farm Cappuccino Yogurt 8 ounces 0
Chocolates or Candies Hershey’s Special Dark Chocolate Bar 1 bar
(1.5 ounces)
31
Perugina Milk Chocolate Bar with Cappuccino Filling 1/3 bar (1.2 ounces)
24
Hershey Bar (milk chocolate) 1 bar (1.5 ounces)
10
Coffee Nips (hard candy) 2 pieces 6
Cocoa or Hot Chocolate 8 ounces 5 a— Serving sizes are based on commonly eaten portions, pharmaceutical instructions, or the amount of the leading-selling container size. For example, beverages sold in 16-ounce or half-liter bottles were counted as one serving.
b — Sources: National Coffee Association, National Soft Drink Association, Tea Council of the USA, and information provided by food, beverage, and pharmaceutical companies.
Cocoa is another caffeine rich material, which is widely used in the world in
the form of chocolates and other beverages. Use of the cacao (cocoa) bean for a
beverage originated with the Indians of South America, possibly earlier than
1,000 B.C. The Spanish were introduced to the drink by the Aztecs. In 1886 the
Georgia pharmacist John Pemberton (www.wikipedia.com) created a beverage
flavored by caffeine-containing kola nuts and fortified by cocaine from the coca plant
(Erythroxylum coca) of Peru and Bolivia. He called his beverage Coca-Cola in honor
of the plants of origin. Near the turn of the century cocaine was removed from Coca-
Cola and replaced with more caffeine.
11
ePrin
t@CFT
RI
A Biotechnological Approach for Decaffeination Chapter 1
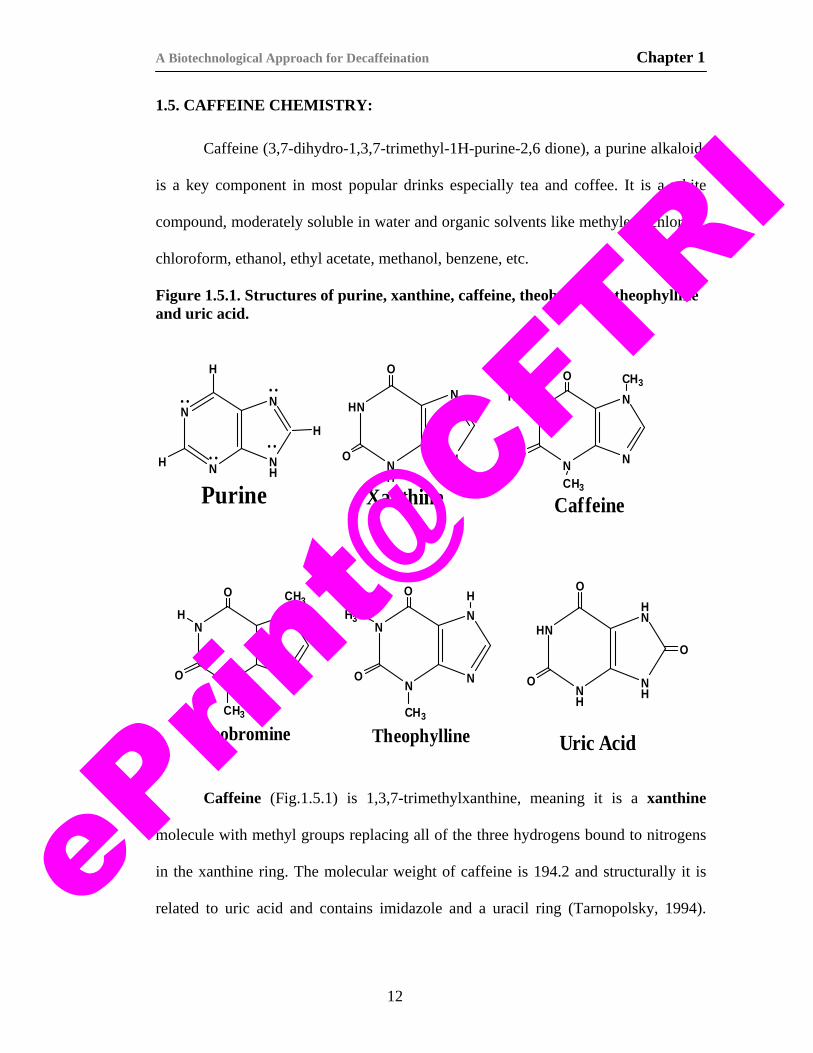
1.5. CAFFEINE CHEMISTRY:
Caffeine (3,7-dihydro-1,3,7-trimethyl-1H-purine-2,6 dione), a purine alkaloid,
is a key component in most popular drinks especially tea and coffee. It is a white
compound, moderately soluble in water and organic solvents like methylene chloride,
chloroform, ethanol, ethyl acetate, methanol, benzene, etc.
Figure 1.5.1. Structures of purine, xanthine, caffeine, theobromine, theophylline and uric acid.
HN
NH
NH
HN
O
O
O
Uric Acid
HN
NH
NH
N
O
O
Xanthine
N
N N
N
O
OH3C
CH3
CH3
Caffeine
N
N N
N
O
O
H
CH3
CH3
Theobromine
N
N
H
NH
N
H
H
Purine
N
N N
N
O
O
H3C
CH3
H
Theophylline
Caffeine (Fig.1.5.1) is 1,3,7-trimethylxanthine, meaning it is a xanthine
molecule with methyl groups replacing all of the three hydrogens bound to nitrogens
in the xanthine ring. The molecular weight of caffeine is 194.2 and structurally it is
related to uric acid and contains imidazole and a uracil ring (Tarnopolsky, 1994).
12
ePrin
t@CFT
RI

A Biotechnological Approach for Decaffeination Chapter 1
Besides its stimulatory effects for which it is consumed, caffeine has no nutritional
value (Clarkson, 1993; Tarnopolsky, 1994; MacIntosh and Wright, 1995).
Theobromine and Paraxanthine (Fig. 1.5.1.) are dimethyl xanthines derived
from the removal of methyl groups at 1 and 3 N positions of the xanthine ring of
caffeine. Caffeine, paraxanthine and theobromine have stimulatory effects on
humans, but caffeine due to its three methyl groups is associated with highest
stimulatory activity and other ill effects on health. Dimethyl xanthines are known to
possess anti asthmatic, anti cancer and antioxidant properties (Persson, 1984; Yuji, et.
al., 1998; Omar et. al., 2005). Removal of methyl groups reduces the ill effects of
these molecules and increases the therapeutic values of the derivatives.
1.6. MECHANISMS OF ACTION OF CAFFEINE:
Caffeine is responsible for the stimulant action of coffee (Europaisches,
1978). It stimulates the Central nervous system, increases the contraction power of
the heart, widens the vessels of heart, kidney and the skin and exhibits broncholytical
and diuretical actions (Europaisches, 1978).
In mammals, ingested caffeine is rapidly absorbed, metabolized, and excreted
in the urine as methyl xanthine derivatives. Apart from being a stimulant to the
central nervous system, if consumed in excess it causes mutation; it is teratogenic,
causes inhibition of DNA repair, inhibition of cyclic AMP phoshodiesterase activity
and inhibits seed germination (Friedman and Waller, 1983a and b). It is the major
cause of cancer, heart diseases, and complications in pregnant women and aging
(Green and Suls, 1996; Infante et. al., 1993; Srisuphan and Bracken, 1986, Dlugosz
et.al., 1996; Fenster et. al., 1991).
13
ePrin
t@CFT
RI
A Biotechnological Approach for Decaffeination Chapter 1
The stimulant effect of caffeine is thought to be due to an increase in
adrenaline release, which may stimulate the sympathetic nervous system, but the
mechanism is not wholly understood (Clarkson, 1993). Caffeine enhances
Acetylcholine release in the hippocampus in vivo by a selective interaction with
adenosine A1 receptors (Carter, et al, 1995).
It is known that caffeine is responsible for many effects on the human body.
Details of the mechanism of caffeine at cellular and organ level can give an insight
into how this molecule affects different functions in the body and the reasons for
adverse effects on the body.
1.6.1. Cellular Effects:
There are four main mechanisms of caffeine action at the cellular level. These
are intracellular mobilisation of calcium from the sarcoplasmic reticulum of the
skeletal muscle, inhibition of phosphodiesterases, adenosine antagonism and
Sodium/Potassium ATPase pump activity changes (Tarnopolsky, 1994).
1.6.1.1. Mobilization of extra cellular calcium:
In vitro, caffeine increases the release of calcium and inhibits its uptake from
the sarcoplasmic reticulum. After ingestion of coffee the circulating plasma
concentration of caffeine is less than 100 μM and caffeine becomes toxic at a
concentration above 200 μM and lethal at 500 μM (Tarnopolsky, 1994).
1.6.1.2. Phosphodiesterase Inhibition:
Phosphodiesterase breaks down cAMP which is the second messenger in most
of the cell signaling pathways in humans and animals. Caffeine is known to inhibit
the phosphodiesterase in vitro and invivo (Fredholm, 1995). When this process is
14
ePrin
t@CFT
RI

A Biotechnological Approach for Decaffeination Chapter 1
inhibited increase in cAMP results, which enhances the stimulation of
catecholamines.
1.6.1.3 Adenosine antagonism:
Caffeine being structurally similar to adenosine competes for adenosine
receptors. Adenosine reduces the spontaneous firing of neurons, suppresses synaptic
transmission and causes the release of neurotransmitters. The net effect of this
process includes vasoconstriction, increased diuresis and central nervous system
stimulation (Tarnopolsky, 1994). This can occur at less than 100 mM, which can be
achieved by drinking one to three cups of coffee. Thus this mechanism may be
feasible as a mechanism of action of caffeine in vivo (Nehlig and Debry, 1994).
1.6.1.4 Sodium/Potassium ATPase Pump Activity:
Caffeine is known to increase the levels of adrenalin in the body, which in
turn increases the sodium/potassium ATPase pump activity. This leads to the
accumulation of low levels of potassium in the muscle during exercise leading to
fatigue. Therefore caffeine affects performance by varying the sodium/potassium
ATPase pump activity (Tarnopolsky, 1994).
1.6.1.5. Catecholamines:
A number of studies report the increase in plasma adrenaline levels after
caffeine ingestion (Graham, et. al., 1994). Caffeine shows a direct specific action on
the adrenal medulla, which is a stress mechanism. Excessive caffeine consumption
therefore increase stress in the body (Graham, et. al., 1994).
15
ePrin
t@CFT
RI
A Biotechnological Approach for Decaffeination Chapter 1
1.6.2. Side Effects:
Caffeine stimulates the central nervous system and can produce a variety of
effects elsewhere in the body. The symptoms of a caffeine overdose ("caffeinism")
will vary, according to individual differences and the amount consumed. Doses
ranging from 250 to 750 mg (2 to 7 cups of coffee) can produce restlessness, nausea,
headache, tense muscles, sleep disturbances, and irregular heart beats (Tarnopolsky,
1994). Doses of over 750 mg (7 cups of coffee) can produce a reaction similar to an
anxiety attack, including delirium, ringing ears, and light flashes. These amounts of
caffeine may come from a single dose or from multiple doses at short intervals
(Shirlow and Mathers, 1985).
1.6.2.1. Effects on sleep:
Adenosine is a potentiator of sleep by increasing potassium ion influx thereby
hyperpolarizing (inhibiting) neurons. Adenosine also reduces the activity of GABA
neurons in the brain promoting sleep (Strecker et. al., 2000). Caffeine promotes
wakefulness by opposing the actions of adenosine, blocking the adenosine receptors.
Caffeine increases attention & vigilance and lessens feelings of weariness.
1.6.2.2. Toxic dose:
The LD-50 of caffeine is estimated at 10 grams for oral administration. The
lethal dosage varies from individual to individual according to weight. Ingestion of
150mg/kg of caffeine seems to be the LD-50 for all people (Kerrigan and Lindsey,
2005; Holmgren et.al., 2004; Walsh et.al., 1987; Mrvos et.al., 1989). In small children
ingestion of 35 mg/kg can lead to moderate toxicity.
16
ePrin
t@CFT
RI
A Biotechnological Approach for Decaffeination Chapter 1
1.6.3. Caffeine and health problems:
1.6.3.1. Gastrointestinal problems:
Many people experience a burning sensation in their stomach after drinking
coffee because coffee increases the secretion of hydrochloric acid leading to an
increased risk for ulcers (James and Stirling, 1983). Coffee reduces the pressure on
the valve between the esophagus and the stomach so that the highly acidic contents of
the stomach pass up to the esophagus leading to heartburn and gastro-esophageal
reflux disease.
1.6.3.2. Heart disease:
Researchers at Johns Hopkins Medical Institute (LaCroix et al., 1986) found
heavy coffee drinkers (defined as five or more cups per day) were two to three times
more likely to have coronary heart disease than were nondrinkers (Onrot et.al., 1985).
This relationship was true even when accounting for other important risk factors such
as age, smoking habits, serum cholesterol and blood pressure (James, 1997; Waring
et. al., 2003; Leviton and Cowan, 2002).
If coffee drinking does increase the risk of heart disease, it may do so through
its effect on cholesterol. A few studies have linked heavy coffee consumption to
elevated total serum cholesterol, although caffeine alone does not seem to be
responsible (Thelle et. al., 1983). Coffee in excess of 8 cups per day may
aggravate cardiac arrhythmias (Meyers et.al., 1991) and raise plasma homo-
cysteine (Petra et. al., 2002). Caffeine is also linked to coronary vasospasms, the
cause for 20% of all fatal heart attacks, which kill otherwise perfectly healthy people.
17
ePrin
t@CFT
RI
A Biotechnological Approach for Decaffeination Chapter 1
1.6.3.3. Cancer:
In the period between the 1950s and 1970s many believed that caffeine could
be a serious cause of cancer in humans because of studies in plants showing
chromosome breaks, inhibition of mitosis and formation of chromatin bridges after
high-dose caffeine treatment (Brogger, 1979). More recent evidence does show a
capacity for caffeine to worsen the mutagenicity of ionizing radiation and other
carcinogenic agents through interference with cell cycle control (Kaufmann et. al.,
1997).
1.6.3.4. Addiction and withdrawal:
Caffeine is addictive according to several definitions of 'addiction' (Kaufmann
et.al., 1997; Daly and Fredholm, 1995; Greenberg et. al., 1999). It causes withdrawal
symptoms after cessation of heavy use (most commonly headaches) and regular users
develop tolerance and experience cravings when ceasing use. Regular users can also
become emotionally and mentally dependent upon their daily caffeine (coffee, soda,
etc). The withdrawal effects of caffeine in humans are headache, fatigue, apathy and
drowsiness (Nehlig, 1999; Lorist and Tops, 2003).
1.6.3.5. Effects on pregnant women:
Caffeine has long been suspected of causing mal-formations in fetus, and that
it may reduce fertility rates (Hatch and Bracken, 1993; Mills, et.al, 1993; Eskenazi,
1999; Cnattingius et. al., 2000; Christian and Brent, 2001). A recent study found a
weak link between Sudden-Infant-Death-Syndrome (SIDS) and caffeine consumption
by the mother, which reinforces the recommendation for moderation -possibly even
abstinence- above. On men, it has been shown that caffeine reduces rates of sperm
18
ePrin
t@CFT
RI
A Biotechnological Approach for Decaffeination Chapter 1
motility, which may account for some findings of reduced fertility (Christian and
Brent, 2001).
1.6.3.6. Osteoporosis:
There was a significant association between (drinking more) caffeinated
coffee and decreasing bone mineral density at both the hip and the spine, independent
of age, obesity, years since menopause, and the use of tobacco, estrogen, alcohol,
thiazides, and calcium supplements (in women) (Barrett, et, al., 1994).
1.6.3.7. Metabolism:
Caffeine increases the level of circulating fatty acids. This has been shown to
increase the oxidation of these fuels, hence enhancing fat oxidation. Caffeine has
been used for years by runners and endurance in people to enhance fatty acid
metabolism. It's particularly effective in those who are not habitual users (Acheson et.
al., 2004; Graham et.al., 1994)
1.6.3.8. Blood sugar swings:
Caffeine mobilizes intracellular sugars and induces a temporary surge in blood
sugar which is then followed by an overproduction of insulin that causes a blood
sugar crash within hours (Pizziol et. al., 1998). Its use as a weight loss agent infact
leads to the increase in weight due to its hyperglycemic effect which stimulates
insulin's message to the body to store excess sugar as fat (Dam and Hu, 2005; Lee
et.al., 2005).
1.6.3.9. Nutritional deficiencies:
Caffeine inhibits the absorption of some nutrients and causes the urinary
excretion of calcium, magnesium, potassium, iron and trace minerals, all essential
19
ePrin
t@CFT
RI
A Biotechnological Approach for Decaffeination Chapter 1
elements necessary for good health. Coffee drinking is associated with decreased
absorption of magnesium resulting in lower blood levels of magnesium (Johnson,
2001). Caffeine reduces the reabsorption of calcium and magnesium in the kidney,
causing minerals to be excreted in the urine (Massey and Wise, 1984; Massey et.al.,
1994). Although caffeine and coffee intake does not directly influence potassium
absorption, caffeine has a diuretic effect, and diuretics increases excess excretion of
potassium as well as magnesium from the kidneys (al'Absi et. al., 1998, Lovallo et.al.,
1996)
1.6.3.10. Other effects of caffeine:
Caffeine administered acutely increases diuresis (urination). Caffeine
regularly increases energy metabolism throughout the brain while decreasing cerebral
blood flow and there is no tolerance for these effects. Vasoconstriction due to
250 milligrams of caffeine can decrease central blood flow by 20-30%, which is why
caffeine has been used to treat migraine headache. Because blood glucose is usually
more than ample for cerebral metabolism the combination of increased metabolism &
decreased blood flow would be more likely to induce hypoxia than ischemia. But if
caffeine increases oxygen intake by bronchodilation or increases sensitivity to carbon
dioxide in the medulla, then there may be compensation. (Both hypoxia and caffeine
elevate plasma adenosine.) The consumption of fewer than four cups of coffee daily
during pregnancy is not deemed to endanger the child (Leviton and Cowan, 2002).
1.7. CAFFEINE CONTAINING AGRO WASTES: An environmental problem:
Coffee pulp is the most abundant waste produced during the pulping operation of
the coffee cherry (Cabezas et. al., 1979; Braham, 1987). Wet Coffee processing
results in discharge of waste-water rich in fermentable sugars and caffeine
20
ePrin
t@CFT
RI
A Biotechnological Approach for Decaffeination Chapter 1
(Elias, 1986). Coffee pulp is improperly utilized and, therefore, it is considered the
most abundant pollutant material of lakes and rivers located near the coffee-
processing sites (Adams and Dougan, 1981). The utilization of coffee pulp is limited
by anti-physiological factors like high caffeine, polyphenolic, potassium, and fiber
content naturally occurring in the material (Bressani, 1987a). Several technologies to
detoxify coffee pulp have been investigated by several authors, but have met with
little success (Bressani, 1987b). Decaffeination through chemical solvents has proved
to be an alternative process to detoxify the material for animal feeding
(Molina et.al., 1974). However, it is considered a relatively high-cost technology to
be implemented at the coffee-processing sites.
In view of the ill effects of excessive consumption of caffeine by humans and
the pollution problems posed by coffee and tea processing wastes to water and soil,
development of methods for removal of caffeine from caffeine containing foods,
beverages and agricultural wastes was considered very important from both health
and environmental point of view. Since the start of the 20th century several methods
for the removal of caffeine were developed and the area of decaffeination still
remains an active area of research owing to the increasing demand for decaffeinated
foods and beverages.
1.8. DECAFFEINATION:
Decaffeination is defined as the act of removing caffeine from coffee beans
and tea leaves (http://en.wikipedia.org/wiki/Decaffeination). Most decaffeination
processes are performed on unroasted (green) coffee beans, but the methods vary
somewhat. It generally starts with the steaming of the beans. They are then dipped
21
ePrin
t@CFT
RI
A Biotechnological Approach for Decaffeination Chapter 1
into solvent for several hours. The process is repeated for 8 to 12 times until it meets
either the international standard of having removed 97 % of the caffeine in the beans
or the EU standard of having the beans 99.9 % caffeine free by mass.
The first commercially successful decaffeination process was invented by
Ludwig Roselius and Karl Wimmer in 1903. It involved steaming coffee beans with a
brine (salt water) solution and then using benzene as a solvent to remove the caffeine.
Coffee decaffeinated this way was sold as Cafe sanka in France and later as Sanka
brand coffee in the US. Due to health concerns regarding benzene, this process is no
longer used commercially and Sanka is produced using a different process.
Three different methods of decaffeination, widely used, are; 'Water
decaffeination', 'Solvent decaffeination' and 'Carbon dioxide decaffeination'.
Although caffeine is water soluble above 175o F, water alone is generally not used to
decaffeinate coffee because it strips away too many of the essential flavor and aroma
elements.
Decaffeination by solvents can be through two methods: direct and indirect
contact. In the first the beans come directly in contact with the decaffeinating agents,
after being softened by steam. In the latter method, a water/coffee solution is
normally used to draw off the caffeine; after being separated from the beans, the
solution containing the caffeine is then treated with a decaffeinating agent. In both
methods, the agent is removed from the final product.
1.8.1. Solvent decaffeination:
A solvent is used for decaffeination in this technique. There are criteria in
choosing the right solvent for this process. According to Katz (1987), some of the
22
ePrin
t@CFT
RI
A Biotechnological Approach for Decaffeination Chapter 1
criteria include: Safety, cost, caffeine solubility, ease of solvent removal and
recovery, toxicity and chemical reactivity, and environmental effects. The common
solvents used are methylene chloride and ethyl acetate. However, methylene chloride
is mostly used in the industry. This chemical is more selective to remove caffeine
without removing the taste and aroma of coffee. According to the United States Food
and Drug Administration (FDA), most decaffeinated coffee has less than 0.1 parts per
million residual methylene chloride.
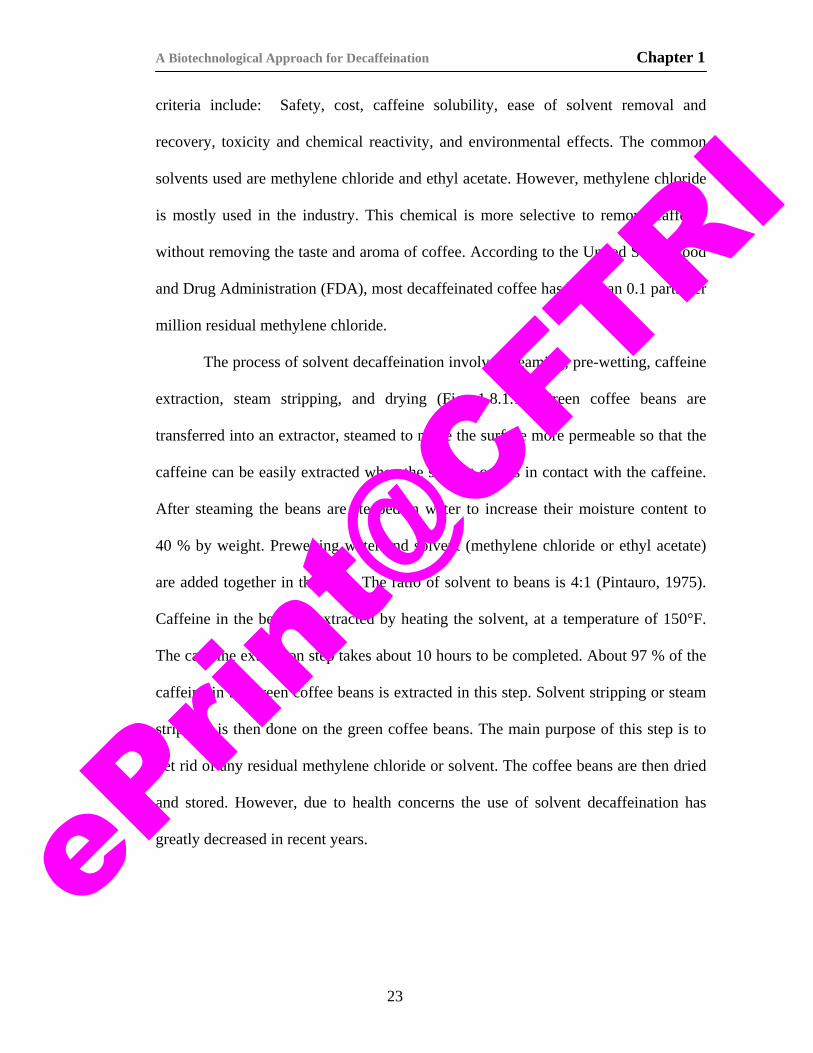
The process of solvent decaffeination involves steaming, pre-wetting, caffeine
extraction, steam stripping, and drying (Fig. 1.8.1.1). Green coffee beans are
transferred into an extractor, steamed to make the surface more permeable so that the
caffeine can be easily extracted when the solvent comes in contact with the caffeine.
After steaming the beans are steeped in water to increase their moisture content to
40 % by weight. Prewetting water and solvent (methylene chloride or ethyl acetate)
are added together in this step. The ratio of solvent to beans is 4:1 (Pintauro, 1975).
Caffeine in the beans is extracted by heating the solvent, at a temperature of 150°F.
The caffeine extraction step takes about 10 hours to be completed. About 97 % of the
caffeine in the green coffee beans is extracted in this step. Solvent stripping or steam
stripping is then done on the green coffee beans. The main purpose of this step is to
get rid of any residual methylene chloride or solvent. The coffee beans are then dried
and stored. However, due to health concerns the use of solvent decaffeination has
greatly decreased in recent years.
23
ePrin
t@CFT
RI
A Biotechnological Approach for Decaffeination Chapter 1
Figure 1.8.1.1: Schematic process for decaffeination using solvents.
1.8.2. Water decaffeination:
Water decaffeination, uses water to extract caffeine from the green coffee
beans. The water decaffeination is probably the most widely accepted method used to
decaffeinate coffee. This method is based on the natural ability of water to make
caffeine soluble. However, in this process the water acts non-selectively on the raw
coffee, extracting all of the soluble components, like the aromas and the flavor. In
order to prevent the extraction of all water-soluble components of coffee beans, the
extraction water contains essentially equilibrium quantities of the non-caffeine
soluble solids (Katz, 1987). The coffee beans are kept in the extractor for about
8 hours to remove about 98 % of the original caffeine. The extract water with
caffeine, coffee solids, coffee aroma and flavor is subjected to caffeine extraction by
solvents. The organic solvent also extracts the flavor and aroma of coffee. Since the
extract water is recycled, the organic solvent must be removed. After removal of the
24
ePrin
t@CFT
RI
A Biotechnological Approach for Decaffeination Chapter 1
solvent, the coffee extract is returned to the beans to reabsorb the flavor components.
The decaffeinated coffee beans are then washed, dried and stored. Another form of
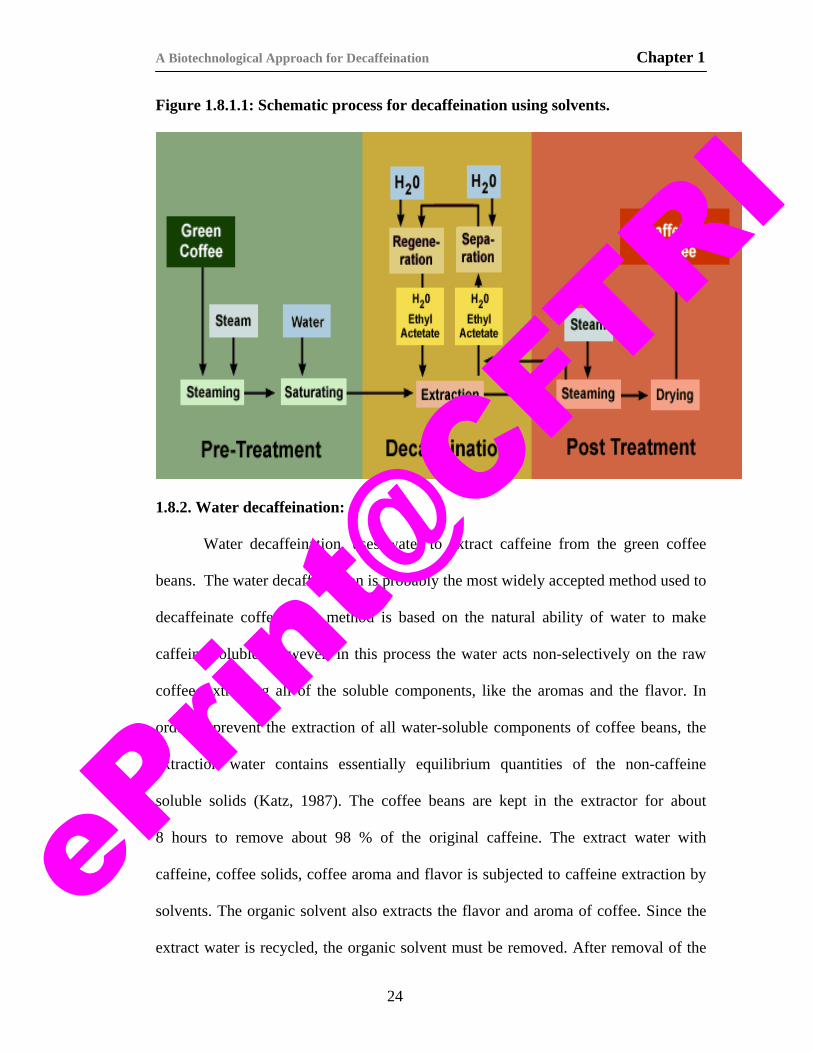
water decaffeination is the Swiss Water Decaf method (Fig. 1.8.2.1). This method is
also based on the theory of the caffeine being soluble in water, however it is not
necessary to return the other soluble components to the bean.
Figure 1.8.2.1. Schematic diagram of swiss water decaffeination process. (adapted from http://www.hollandcoffee.com/images/swissprocess.jpg )
Swiss water decaffeination is a relatively simple process. The coffee beans are
extracted in hot water, removing the caffeine and the flavor components of the bean
into the water. After the water has been saturated, the caffeine is removed by passing
the water through carbon filters. Caffeine is adsorbed on to the carbon filters and the
caffeine free extract is reabsorbed by the beans, which are dried and roasted.
1.8.3. Supercritical carbon dioxide:
The supercritical carbon dioxide decaffeination is considered to be a safer
process than the solvent decaffeination. By using only carbon dioxide and water this
method has gained acceptance as being a natural method of decaffeination. The
25
ePrin
t@CFT
RI
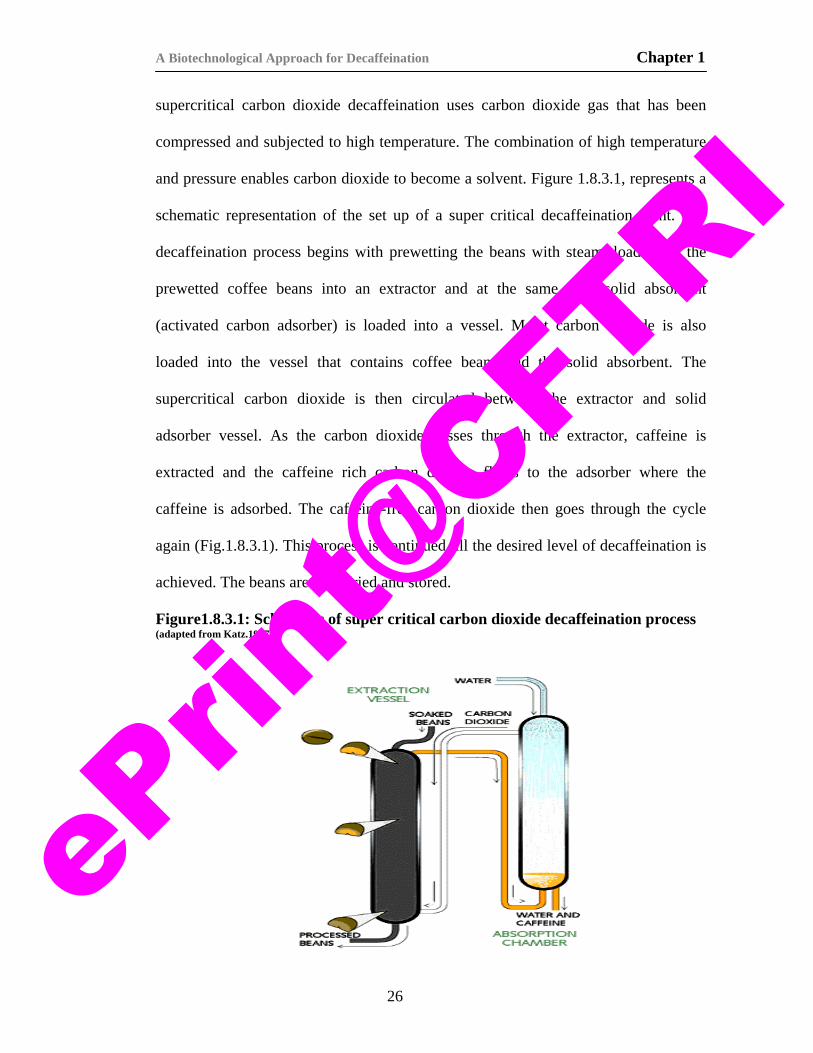
A Biotechnological Approach for Decaffeination Chapter 1
supercritical carbon dioxide decaffeination uses carbon dioxide gas that has been
compressed and subjected to high temperature. The combination of high temperature
and pressure enables carbon dioxide to become a solvent. Figure 1.8.3.1, represents a
schematic representation of the set up of a super critical decaffeination plant. The
decaffeination process begins with prewetting the beans with steam, loading of the
prewetted coffee beans into an extractor and at the same time solid absorbent
(activated carbon adsorber) is loaded into a vessel. Moist carbon dioxide is also
loaded into the vessel that contains coffee beans and the solid absorbent. The
supercritical carbon dioxide is then circulated between the extractor and solid
adsorber vessel. As the carbon dioxide passes through the extractor, caffeine is
extracted and the caffeine rich carbon dioxide flows to the adsorber where the
caffeine is adsorbed. The caffeine-free carbon dioxide then goes through the cycle
again (Fig.1.8.3.1). This process is continued till the desired level of decaffeination is
achieved. The beans are then dried and stored.
Figure1.8.3.1: Schematic of super critical carbon dioxide decaffeination process (adapted from Katz.1987).
26
ePrin
t@CFT
RI
A Biotechnological Approach for Decaffeination Chapter 1
The advantage of this process is that no flavor elements are lost from the
coffee and 98% of caffeine can be removed from the coffee beans. However, there are
a couple of disadvantages. The first disadvantage is that due to the high pressure used,
the equipment is costly and only batch processing can be done (Katz, 1987). The
second disadvantage is that the average concentration of caffeine in the carbon
dioxide is low; therefore a large quantity of carbon dioxide is needed. This might also
be costly. The disadvantages might cause the price of the decaffeinated coffee beans
to be higher than solvent decaffeinated and water decaffeinated coffee beans.
Moreover, the use of membranes or carbon filters in caffeine removal processes will
be very expensive and the commercialization of the process becomes less viable.
In lieu of the disadvantages of the existing processes of decaffeination
research there has been an increasing emphasis of developing greener and economic
methods of decaffeination.
Biotechnological decaffeination methods are the only alternatives, which offer
safe, economical and greener routes of decaffeination of beverages. Moreover
biological means of decaffeination have a wider reach of application even to pollution
abatement due to coffee and tea processing wastes.
1.9. BIODECAFFEINATION: A natural route of decaffeination:
Biodecaffeination can be defined as the removal of caffeine from coffee, tea
and other caffeine containing materials by the action of externally added microbial
cells or enzymes.
The concept of biodecaffeination is a relatively new area of decaffeination and
there is a growing interest in this area of biotechnology due the advantages it offers
27
ePrin
t@CFT
RI
A Biotechnological Approach for Decaffeination Chapter 1
like being environmentally safe, economical and in preserving the quality of the
beverages. Development of biological or enzymatic methods of decaffeination
demands a deep understanding of the caffeine metabolism in microbial, plant and
animal systems. A thorough knowledge of the caffeine metabolism, the enzymes
involved and various factors involved in the caffeine degradation in different living
systems will give deep insights into the development of efficient biodecaffeination
processes. Detailed information on different enzymes involved in the degradation of
caffeine in different organisms could help in developing an enzymatic process for
caffeine removal. Caffeine degrading systems in humans, plants, fungi and bacteria
and the prospects of developing biodecaffeination processes are dealt with in the
following sections.
1.9.1. Caffeine degradation in eukaryotes:
In plants, degradation of caffeine occurs through sequential demethylation that
finally results in the formation of xanthine. The demethylation reactions have been
found to be catalyzed by demethylase enzymes, viz., N-1 demethylase, N-7
demethylase and N-3 demethylase. Xanthine is then converted into CO2 and ammonia
by purine catabolism (Mazzafera, 1994a; Ashihara et.al., 1996a&b; Ashihara et.al.,
1997; Vitoria and Mazzafera, 1998; Koyama et.al., 2003). In contrast to plants, the
degradation pathway in mammals results in the formation of methyl xanthines and
methyl uric acids by cytochrome P450 enzymes (CYP1A2, CYP3A4, CYP2E1),
xanthine oxidase and N-acetyl transferase (Cornish and Christman, 1957; Khanna
et.al., 1972; Wreck and Feyereisen, 2000). Methylated xanthines and the respective
uric acid formed due to degradation are excreted from the body through urine
28
ePrin
t@CFT
RI
A Biotechnological Approach for Decaffeination Chapter 1
(Rao, et.al., 1973). Caffeine is metabolized (demethylated) in the liver by
Cytochrome P450 enzymes known as 1A2 CYP1A2s (Shirley et. al., 2003). The half-
life for caffeine metabolism is typically 5-6 hours in an adult. In yeast and fungi,
caffeine is degraded via theophylline to respective methyl xanthines, further degraded
to ammonia and carbon dioxide. The key enzymes involved are reported to be
cytochrome P-450s.
1.9.1.1. Cytochrome p 450 and related enzymes:
NADPH-cytochrome P450 reductase (CPR) is the electron donor protein for
several oxygenase enzymes found on the endoplasmic reticulum of most eukaryotic
cells. These oxygenases include the cytochromes P450, a family of enzymes
involved in the metabolism of many drugs and dietary substances, and in the
synthesis of steroid hormones and other extracellular lipid signaling molecules; heme
oxygenase, a hemeprotein that catalyzes the first step in the degradation of heme to
bilirubin; and squalene monooxygenase, the second enzyme in the committed
pathway for sterol biosynthesis. CPR may also donate electrons to 7-
dehydrocholesterol reductase in the sterol synthesis pathway, and to cytochrome b5,
which supports both sterol synthesis and the fatty acid desaturase and elongase
pathways.
The name P450 refers to the "pigment at 450 nm", so named for the
characteristic Soret peak formed by absorbance of light at wavelengths near 450 nm
when the heme iron is reduced (with sodium dithionite) and complexed to carbon
monoxide. The cytochrome P450s (P450) are exceptional, not only because they are
ubiquitous throughout nature, but also because of their ability to effect the
29
ePrin
t@CFT
RI
A Biotechnological Approach for Decaffeination Chapter 1
metabolism of multiple unrelated, exogenous, and endogenous compounds. The
cytochrome P450 (CYP) super family consists of more than 2500 members joined
into 281 families (Nelson, 1995). While the majority of CYPs have unknown function
because they have been sequenced during genome projects, others are known to
catalyze mono-oxygenation reactions of more than 10,000 organic compounds
(Danielson, 2002; Newcomb et al., 2003). In accordance with their functions, these
P450s can be divided into two groups, those which metabolize Xenobiotics (drugs,
pollutants, agrochemicals, etc.) and those participating in key biosynthetic pathways
(steroidogenesis, biosynthesis of sterols, Vitamin D, etc.). The families from the first
group metabolize a broad variety of different structures and biosynthesis of these
P450s is often substrate inducible and their gene knockouts sometimes do not show
any obvious phenotype (Gonzalez and Kimura, 2003).
Camphor (cytochrome P450) 5-monooxygenase (Fig. 1.9.1.1), originally
isolated from the bacterium Pseudomonas putida PgG 786, catalyzes the degradation
of camphor (Zurek, et.al., 2006), an organic pollutant into non toxic forms. It is also
known to convert essentially stereospecific conversion of tetralin (1,2,3,4-
tetrahydronaphthalene) to (R)-1-tetralol (Grayson et.al., 1996). It is the first bacterial
Cytochrome P450, whose crystal structure could be resolved.
30
ePrin
t@CFT
RI
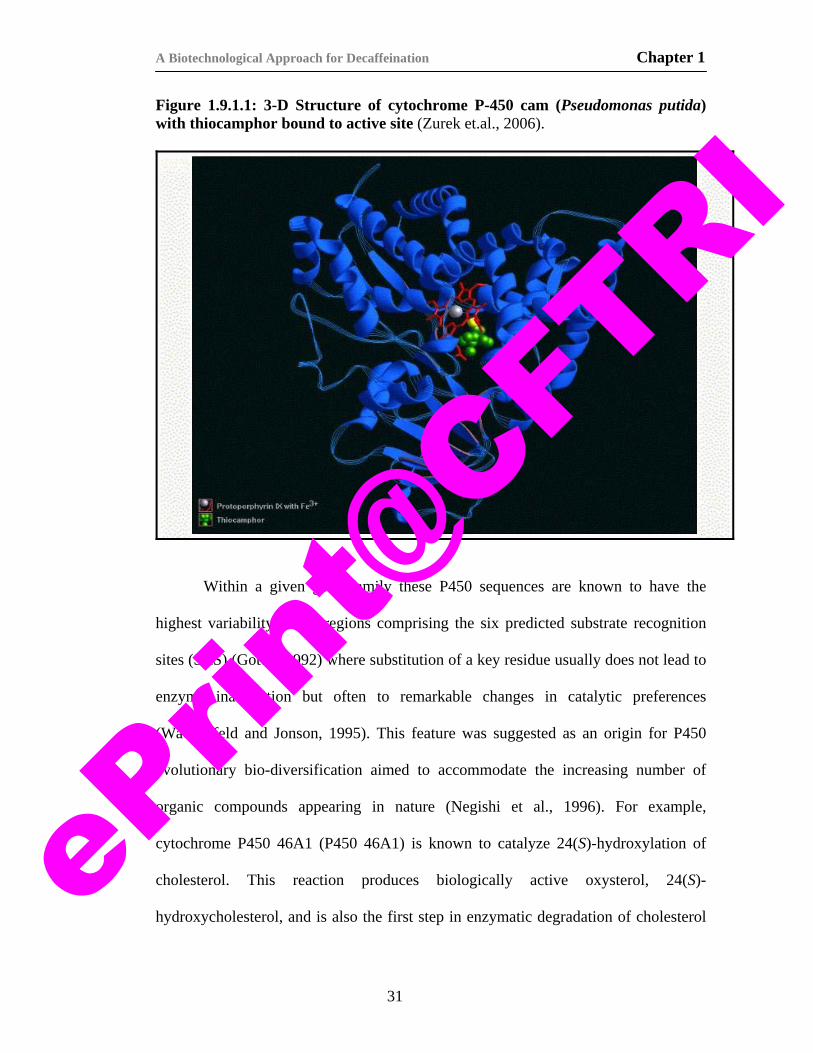
A Biotechnological Approach for Decaffeination Chapter 1
Figure 1.9.1.1: 3-D Structure of cytochrome P-450 cam (Pseudomonas putida) with thiocamphor bound to active site (Zurek et.al., 2006).
Within a given gene family these P450 sequences are known to have the
highest variability in the regions comprising the six predicted substrate recognition
sites (SRS) (Gotoh, 1992) where substitution of a key residue usually does not lead to
enzyme inactivation but often to remarkable changes in catalytic preferences
(Wachenfeld and Jonson, 1995). This feature was suggested as an origin for P450
evolutionary bio-diversification aimed to accommodate the increasing number of
organic compounds appearing in nature (Negishi et al., 1996). For example,
cytochrome P450 46A1 (P450 46A1) is known to catalyze 24(S)-hydroxylation of
cholesterol. This reaction produces biologically active oxysterol, 24(S)-
hydroxycholesterol, and is also the first step in enzymatic degradation of cholesterol
31
ePrin
t@CFT
RI
A Biotechnological Approach for Decaffeination Chapter 1
in the brain. Mast et. al., (2003) report that P450 46A1 can further metabolize 24(S)-
hydroxycholesterol, giving 24,25- and 24,27-dihydroxycholesterols. In addition, P450
46A1 is able to carry out side chain hydroxylations of two endogenous C27-steroids
with and without a double bond between C5-C6 (7 -hydroxycholesterol and
cholestanol, respectively) and introduce a hydroxyl group on the steroid nucleus of
the C21-steroid hormones with the C4-C5 double bond (progesterone and
testosterone). Also, P450 46A1 was found to metabolize xenobiotics carrying out
dextromethorphan O- and N-demethylations, diclofenac 4'-hydroxylation, and
phenacetin O-deethylation. Thus, it was concluded that substrate specificities of P450
46A1 are not limited to cholesterol and include a number of structurally diverse
compounds. Activities of P450 46A1 suggest that, in addition to the involvement in
cholesterol homeostasis in the brain, this enzyme may participate in metabolism of
neurosteroids and drugs that can cross the blood-brain barrier and are targeted to the
central nervous system.
The P450s from the second group have narrow substrate specificity.
Catalyzing a particular regio- and stereospecific reaction, they are designed to
preserve metabolic pathways of endogenous compounds. This group is a potential
subject for study of the basis of P450 functional conservation. Essential residues in
this group of P450s, however, are usually masked under a high degree of identity of
the entire sequence, because the families predominantly consist of enzymes from
evolutionarily close species (Nelson et al., 1996).
Cytochrome P-450 (CYP) 1A2 is constitutively expressed in liver in mice and
humans (Sesardic et. al., 1988; Ikeya et. al., 1989). CYP1A2 is involved in the
32
ePrin
t@CFT
RI
A Biotechnological Approach for Decaffeination Chapter 1
metabolism of a number of clinically significant drugs, as well as the bioactivation of
heterocyclic and arylamine procarcinogens (Shimada et al., 1989). In general, the
active site(s) are believed to be hydrophobic in nature. The overall broad specificity
of the P450s is due to the existence of several subfamilies, each possessing different,
sometimes overlapping, substrate specificities. P450 1A2 is a significant constituent
of the P450s found in the average human liver (Relling, et.al., 1992; Lewis and Lake,
1996). Most P450s are generally involved in the deactivation and detoxification of
Xenobiotics (Guengerich and Shimada,1991; Lewis et al., 1994). Remarkably, there
is a striking similarity in the structures of the substrates, inducers, and inhibitors of
the P450 1A subfamily; i.e., structures tend to be planar, aromatic, lipophilic, and
generally polycyclic (Lewis et. al., 1986).
1.9.1.2. Caffeine degradation in humans: Role of cytochrome P450:
In humans caffeine is rapidly metabolized by the Cytochrome P450 enzymes.
The half life of caffeine in humans is usually 4-5 hours and excreted into urine. The
first products of metabolism are all dimethyl xanthines: paraxanthine (84% 1,7-
dimethylxanthine), theobromine (12%, 3,7-dimethylxanthine), and theophylline
(4% , 1,3-dimethylxanthine) (Fig. 1.9.1.2). Caffeine (1,3,7-trimethylxanthine) has
been extensively studied as an in vivo metabolic probe for CYP1A2 activity in mice
(Buters et. al., 1996) and humans (Kalow and Tang, 1991; Fuhr et.al., 1996; Rostami
et al., 1996).
33
ePrin
t@CFT
RI
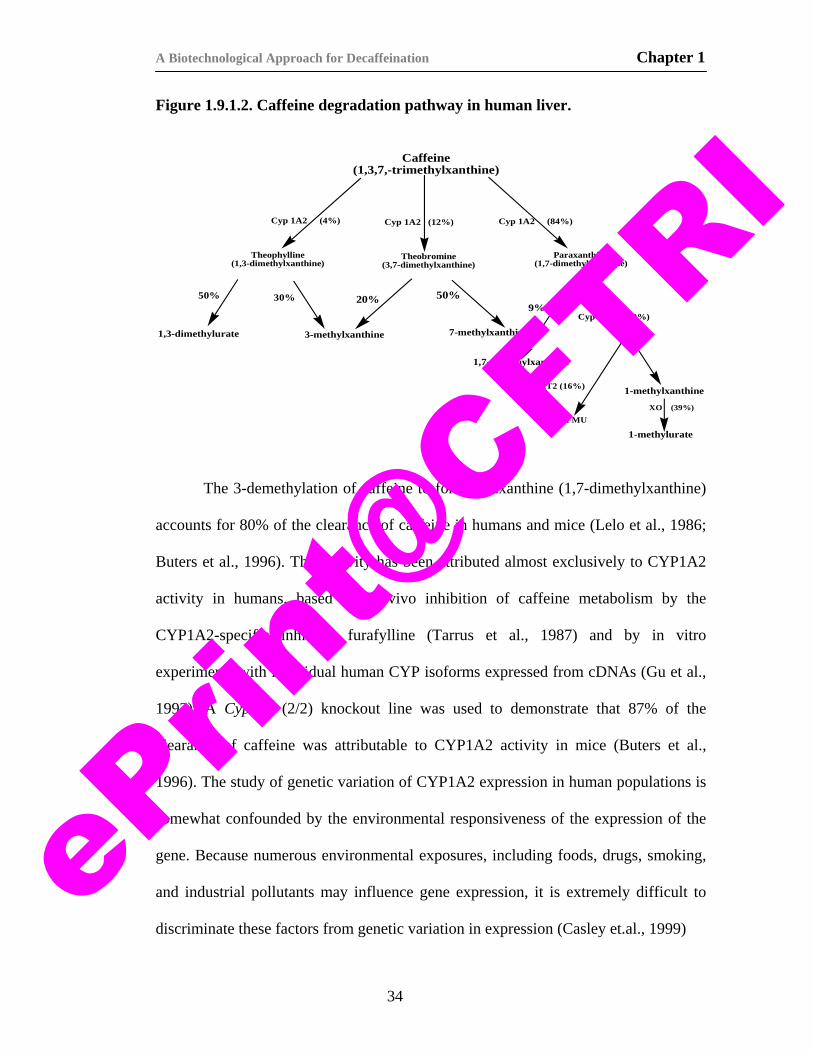
A Biotechnological Approach for Decaffeination Chapter 1
Figure 1.9.1.2. Caffeine degradation pathway in human liver.
Caffeine (1,3,7,-trimethylxanthine)
Theophylline (1,3-dimethylxanthine)
Theobromine (3,7-dimethylxanthine)
Paraxanthine (1,7-dimethylxanthine)
1,3-dimethylurate 3-methylxanthine 7-methylxanthine
Cyp 1A2 (4%) Cyp 1A2 (12%) Cyp 1A2 (84%)
Cyp 1A2 (20%)
50% 30% 20% 50%9%
1,7-dimethylxanthine
1-methylxanthine
AFMU
1-methylurate
NAT2 (16%)
XO (39%)
The 3-demethylation of caffeine to form paraxanthine (1,7-dimethylxanthine)
accounts for 80% of the clearance of caffeine in humans and mice (Lelo et al., 1986;
Buters et al., 1996). This activity has been attributed almost exclusively to CYP1A2
activity in humans, based on in vivo inhibition of caffeine metabolism by the
CYP1A2-specific inhibitor furafylline (Tarrus et al., 1987) and by in vitro
experiments with individual human CYP isoforms expressed from cDNAs (Gu et al.,
1992). A Cyp1a2 (2/2) knockout line was used to demonstrate that 87% of the
clearance of caffeine was attributable to CYP1A2 activity in mice (Buters et al.,
1996). The study of genetic variation of CYP1A2 expression in human populations is
somewhat confounded by the environmental responsiveness of the expression of the
gene. Because numerous environmental exposures, including foods, drugs, smoking,
and industrial pollutants may influence gene expression, it is extremely difficult to
discriminate these factors from genetic variation in expression (Casley et.al., 1999)
34
ePrin
t@CFT
RI
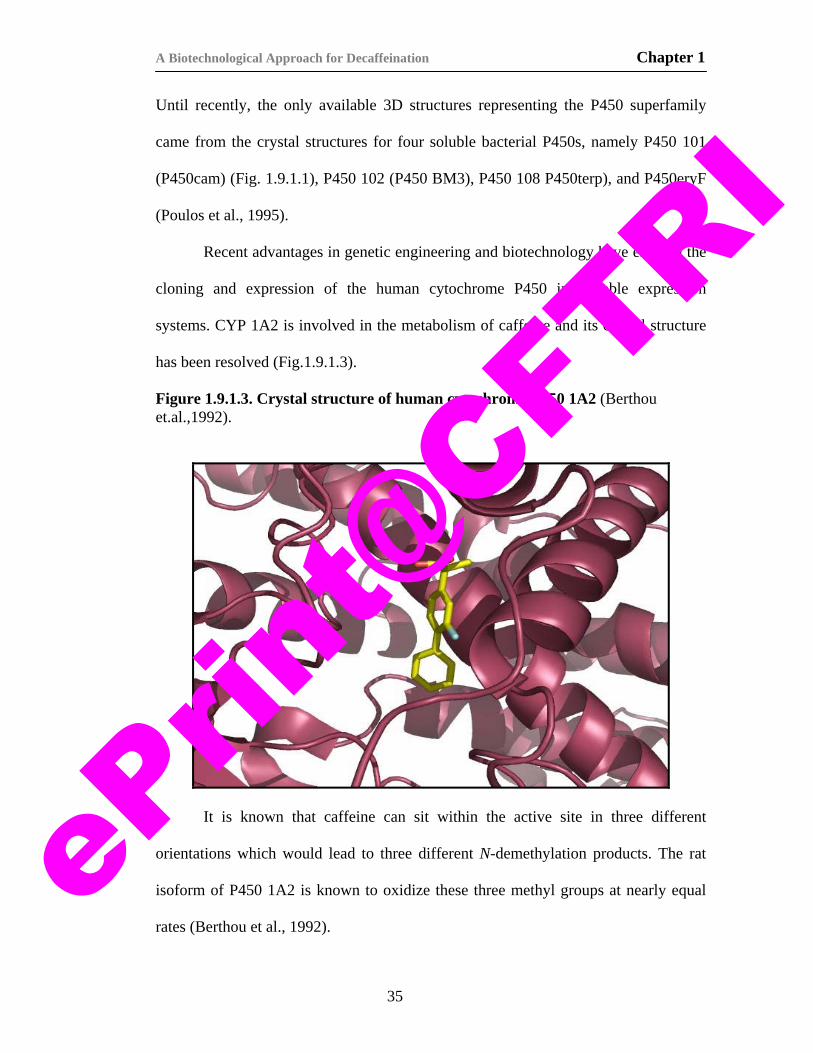
A Biotechnological Approach for Decaffeination Chapter 1
Until recently, the only available 3D structures representing the P450 superfamily
came from the crystal structures for four soluble bacterial P450s, namely P450 101
(P450cam) (Fig. 1.9.1.1), P450 102 (P450 BM3), P450 108 P450terp), and P450eryF
(Poulos et al., 1995).
Recent advantages in genetic engineering and biotechnology have enabled the
cloning and expression of the human cytochrome P450 in suitable expression
systems. CYP 1A2 is involved in the metabolism of caffeine and its crystal structure
has been resolved (Fig.1.9.1.3).
Figure 1.9.1.3. Crystal structure of human cytochrome P450 1A2 (Berthou et.al.,1992).
It is known that caffeine can sit within the active site in three different
orientations which would lead to three different N-demethylation products. The rat
isoform of P450 1A2 is known to oxidize these three methyl groups at nearly equal
rates (Berthou et al., 1992).
35
ePrin
t@CFT
RI
A Biotechnological Approach for Decaffeination Chapter 1
The activity of CYP1A2, assessed by the caffeine metabolite ratio, has large
inter individual difference (Kalow and Tang, 1991; Butler et. al., 1992; Nakajima et.
al., 1994; Ou-Yang et. al., 2000). The remarkable inter individual variations of
activity of CYP1A2 may affect the disposition and response of some drugs, such as
phenacetin (Kobayashi , 1998), acetaminophen (Patten et. al., 1993), theophylline (Gu
et. al., 1992), mexiletine (Abolfathi et. al., 1995), imipramine (Lemoine et. al., 1993),
propranolol (Yoshimoto et. al., 1995), clozapine (Pirmohamed et. al., 1995) and
tacrine (Xu et. al., 1996; Fontana, 1998). Some inducers of CYP1A2, such as
omeprazole, may increase enzyme activity in a dose-dependent manner, leading to
certain drug interactions (Rost et al., 1994a,b). CYP1A2 also plays an important role
in the metabolisms of many procarcinogens, such as 2-amino-1-methyl-6-
phenylimidazo[4,5-b]pyridine (PhIP), 2-amino-3,8-dimethylimidazo [4,5-
f]quinoxaline (MeIQx) and aflatoxin B1. In humans, large interindividual differences
have been reported in the activity of CYP1A2-mediated phenacetin O-deethylation
(Alvares et al., 1979), carcinogen metabolism (Butler et al., 1989), the protein content
of CYP1A2 (Sesardic et. al., 1988), and the mRNA content of CYP1A2 (Farin and
Omiecinske, 1993), which were due more to environmental factors than to heredity
(Tantcheva et. al., 1999).
Upon consumption of caffeine containing beverages like coffee and tea, the
caffeine present in it undergoes metabolic oxidation by N-demethylation at each of
the 3 tertiary amine nitrogen atoms by hepatic microsomal enzymes and generates
theobromine (Tb, 3,7-dimetylxanthine), paraxanthine (Px, 1,7-dimethylxanthine) and
theophylline (Tp, 1,3-dimethylxanthine,) (Carrillo, et.al., 2000; Chung and Cha,
36
ePrin
t@CFT
RI
A Biotechnological Approach for Decaffeination Chapter 1
1997) (Figure 1.9.1.2). Additionally, the caffeine is also hydroxylated and forms
1,3,7-trimethylurate (TMU) by the liver microsomal enzymes. Among these
microsomal metabolites, the N-3 demethylation of caffeine producing paraxanthine is
known to be catalyzed by CYP1A2 in human liver (Butler et.al., 1989). Ingested
caffeine undergoes extensive biotransformation in human and generates at least 17
detectable urinary metabolites including those mentioned above (Nakajima et. al,
1994). Attempts have been made to identify the specific microsomal enzymes
responsible for productions of Theobromine (Tb), Theophylline (Tp) and
Trimethyluric acid (TMU) from caffeine for the purpose of finding additional
methods of phenotyping drug metabolizing enzymes in human (Rostami, et. al., 1997)
and the results indicated that CYPs 1A2, 2A6, 2D6, 2E1, 3A4 and 3A5 as well as
xanthine oxidase are involved (Rostami, et. al., 1997).
1.9.1.3. Role of flavin containing monooxygenase:
Flavin-containing monooxygenase (FMO) is known to be present in liver
microsomes together with the CYP (Ziegler, 1988). Based on the fact that multiple
forms of FMO are known to exist and that FMO is responsible for the oxidation of
many clinically useful drugs bearing nitrogen- and sulfur- atoms, interest on FMO has
been fast developing (Cherrington et.al, 1998). Studies on caffeine metabolism in rat
and human liver microsomes at various pH conditions suited either for the hepatic
microsomal CYP or FMO, as well as in the presence of inhibitors for each of these
hepatic oxidases, present the evidence that FMO is responsible primarily for
productions of Tb and Tp from caffeine. While FMO is known to be present in human
liver microsomes together with CYP and to share substrate specificities with CYP, it
is known to catalyze preferentially the oxidation of nitrogen- and sulfur-containing
37
ePrin
t@CFT
RI
A Biotechnological Approach for Decaffeination Chapter 1
medicines and alkaloids. The FMO is known to be much more sensitive to thermal
degradation than the CYP (Ziegler, 1988). It was also found that both CYP and FMO
together are capable of catalyzing the N-demethylations of caffeine. Attempts to
determine the contributions of CYP and FMO in liver microsomes of rat and human
by inhibiting the caffeine metabolism with their respective inhibitors like SKF525A
(CYP) and methimazole (FMO) showed clearly that the CYP played a primary role in
the production of Paraxanthine (Px) and the FMO in the production of Tb and Tp.
Unlike the CYP reaction mechanism sequences which require initial binding of an
acidic substrate to receive the electron input into the heme iron and the oxygen input
for eventual drug oxidation, the FMO is kept under reactive state having the 4a-
hydroperoxy flavin form at a high pH to oxidize the drugs with high pKa immediately
upon contact (Ziegler, 1993). The hydroperoxy flavin moiety contained in FMO is
known to make an electrophilic attack on the nitrogen atom and oxidizes numerous
tertiary amine type drugs to produce their N-oxide metabolites. The N-oxides formed
from tertiary amines are known to be relatively stable and thus, these have served as
reliable markers for the FMO catalyzed oxidation for many substrates. In the case of
1-N- and in particular N-demethylation of caffeine, apart from CYP1A2, other
cytochrome P-450 isoenzymes play a considerable role.
1.9.2. Caffeine catabolism in plants:
The metabolic path of xanthine and hypoxanthine in buds of tea is given in
Figure 1.9.2.1, below. Hypoxanthine is converted to xanthine, which is converted to
xanthosine monophosphate through inosine monophosphate as the intermediate. This
molecule is further converted to guanosine monophosphate or adenosine
38
ePrin
t@CFT
RI
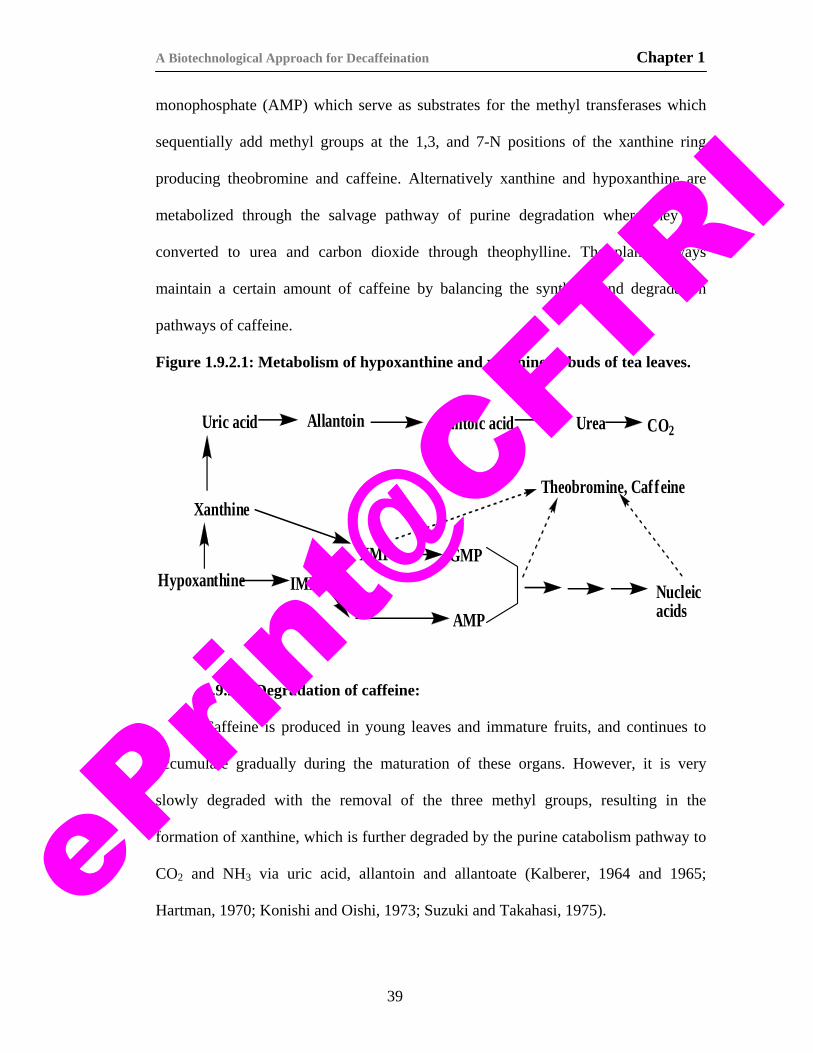
A Biotechnological Approach for Decaffeination Chapter 1
monophosphate (AMP) which serve as substrates for the methyl transferases which
sequentially add methyl groups at the 1,3, and 7-N positions of the xanthine ring
producing theobromine and caffeine. Alternatively xanthine and hypoxanthine are
metabolized through the salvage pathway of purine degradation where they are
converted to urea and carbon dioxide through theophylline. The plants always
maintain a certain amount of caffeine by balancing the synthetic and degradation
pathways of caffeine.
Figure 1.9.2.1: Metabolism of hypoxanthine and xanthine in buds of tea leaves.
Hypoxanthine
Xanthine
Uric acid Allantoin Allantoic acid Urea CO2
IMPXMP GMP
AMPNucleicacids
Theobromine, Caffeine
1.9.2.1. Degradation of caffeine:
Caffeine is produced in young leaves and immature fruits, and continues to
accumulate gradually during the maturation of these organs. However, it is very
slowly degraded with the removal of the three methyl groups, resulting in the
formation of xanthine, which is further degraded by the purine catabolism pathway to
CO2 and NH3 via uric acid, allantoin and allantoate (Kalberer, 1964 and 1965;
Hartman, 1970; Konishi and Oishi, 1973; Suzuki and Takahasi, 1975).
39
ePrin
t@CFT
RI
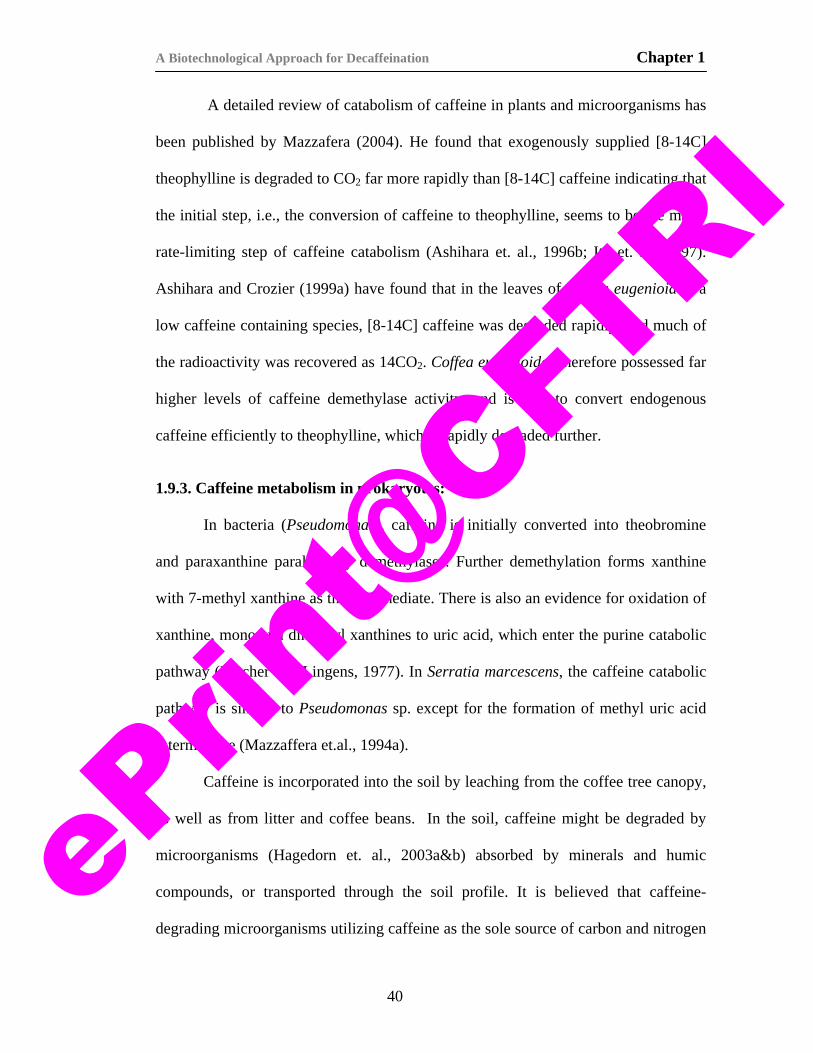
A Biotechnological Approach for Decaffeination Chapter 1
A detailed review of catabolism of caffeine in plants and microorganisms has
been published by Mazzafera (2004). He found that exogenously supplied [8-14C]
theophylline is degraded to CO2 far more rapidly than [8-14C] caffeine indicating that
the initial step, i.e., the conversion of caffeine to theophylline, seems to be the major
rate-limiting step of caffeine catabolism (Ashihara et. al., 1996b; Ito et. al., 1997).
Ashihara and Crozier (1999a) have found that in the leaves of Coffea eugenioides, a
low caffeine containing species, [8-14C] caffeine was degraded rapidly, and much of
the radioactivity was recovered as 14CO2. Coffea eugenioides therefore possessed far
higher levels of caffeine demethylase activity, and is able to convert endogenous
caffeine efficiently to theophylline, which is rapidly degraded further.
1.9.3. Caffeine metabolism in prokaryotes:
In bacteria (Pseudomonas), caffeine is initially converted into theobromine
and paraxanthine parallely by demethylases. Further demethylation forms xanthine
with 7-methyl xanthine as the intermediate. There is also an evidence for oxidation of
xanthine, mono and dimethyl xanthines to uric acid, which enter the purine catabolic
pathway (Blecher and Lingens, 1977). In Serratia marcescens, the caffeine catabolic
pathway is similar to Pseudomonas sp. except for the formation of methyl uric acid
intermediate (Mazzaffera et.al., 1994a).
Caffeine is incorporated into the soil by leaching from the coffee tree canopy,
as well as from litter and coffee beans. In the soil, caffeine might be degraded by
microorganisms (Hagedorn et. al., 2003a&b) absorbed by minerals and humic
compounds, or transported through the soil profile. It is believed that caffeine-
degrading microorganisms utilizing caffeine as the sole source of carbon and nitrogen
40
ePrin
t@CFT
RI
A Biotechnological Approach for Decaffeination Chapter 1
have enzymes that bring about the actual degradation of the substrate (Mazzafera et.
al., 1994a). Silva et. al. (2000) studied the diversity of microbial populations during
the maturation and natural processing (sun-dried) of coffee fruits during two
consecutive years. A total of 754 isolates of bacteria, yeast and fungi were obtained.
They found that bacteria were the predominant microorganisms and they detected a
large variation of microorganisms depending on the farm where the coffee was
collected, the maturation stage, and the processing method, but no consistent pattern
of variation was observed. Fermentative bacteria and yeast, cellulolytic bacteria, and
pectinolytic bacteria, yeast and filamentous fungi were identified among 626
microorganisms. They found that caffeine degradation was very slow in the coffee
pulp and proposed that ensiling of the coffee pulp would enhance the quality of the
pulp for use as cattle feed. But they could not trace the caffeine degrading capability
to any of these microorganisms.
1.9.3.1. Caffeine degradation by bacteria:
Till the 1970s it was believed that caffeine is toxic to bacteria and no studies
on caffeine degradation by microorganisms were reported till 1970 (Sundarraj and
Dhala, 1965; Putrament et. al., 1972; Kihlman, 1974). A few studies have established
that caffeine can be mutagenic through inhibition of DNA repair in bacteria (Grigg,
1972; Kihlman, 1974; Frischknecht et. al., 1985). It was also shown that caffeine at
0.1% concentration also reversibly inhibits protein synthesis in bacteria and yeast.
However the reports state that the inhibition of protein synthesis is post translational
since caffeine does not affect RNA translation (Putrament et. al., 1972). Although
high concentrations are required for bactericide action, caffeine is regarded as toxic
41
ePrin
t@CFT
RI

A Biotechnological Approach for Decaffeination Chapter 1
for bacteria and fungi (Nehlig and Derby, 1994; Denis et. al., 1998; Bogo and Mantle,
2000). However, some microorganisms have the ability to grow in the presence of
caffeine and survival would be related to their capacity to degrade the alkaloid
(Sundarraj and Dhala, 1965). Actually, it is not rare to find bacterial strains resistant
to caffeine (Woolfolk, 1975). Some microorganisms, e.g., Klebsiella pneumoniae,
can utilize purines as carbon or nitrogen sources (Vogels and Drift, 1976.). First
report on caffeine degradation by microorganisms was in the early 1970s (Kurtzman
and Schwimmer, 1971). Since then progress has been achieved on using caffeine as
source for microbial growth (Schwimmer and Khurtzman, 1971; Vogels and Drift,
1976; Roussos et. al., 1995).
A few reports in the literature have already described the isolation of bacteria
strains from soil with the ability to degrade caffeine (Wool folk, 1975; Blecher and
Lingens, 1977; Gluck and Lingens, 1987; Mazzafera et.al, 1994a). Bacterial strains
capable of degrading caffeine belonged to Pseudomonas and Serratia genus. Caffeine
concentration greater than 2.5 mg/ml in the growth medium has been found to inhibit
the growth of many bacterial species. Synergistic effect has been observed when
caffeine is added to antimicrobial agents like chloramphenicol (Sundarraj and Dhala,
1965). Attempts were made for biological production of caffeine catabolic
intermediates with the help of inhibitors. Asano et. al., (1993) reported the production
of theobromine using Pseudomonas strain for the first time. Theobromine was
accumulated at different levels ranging from 5 g/l and above in the presence of 1mM
of Zn2+. Fructose and tryptone were found to be the most suitable carbon and
nitrogen sources (Asano et. al., 1993).
42
ePrin
t@CFT
RI
A Biotechnological Approach for Decaffeination Chapter 1
Bacteria can be used in reducing the caffeine content in caffeine bearing
plants. It has been found that leaf surface play a vital role in Agrobacterium infection
in tea plants (Kumar et. al., 2004). A method has been proposed for producing tea
leaves with less caffeine content by growing caffeine degrading bacteria on the
surface of the leaf. Ramarethinam and Rajalakshmi (2004) found in situ lowering of
caffeine in tea leaves without affecting the quality of the other tea components when
tea plants were sprayed with a suspension of Bacillus licheniformis.
Anaerobic fermentation of coffee pulp resulted in about 13–63% reduction of
caffeine in 100 days (Porres et. al., 1993). In contrast, aerobic fermentation resulted in
100% degradation of caffeine in 14 days (Rojas, et. al., 2003). Several studies were
carried out to investigate the use of purines, including caffeine, as a source of energy
for microorganism growth (Schwimmer and Kurtzman., 1971; Woolfolk, 1975;
Woolfolk and Downard, 1977; Middelhoven and Bakker, 1982; Mazzafera et. al.,
1994a). A comprehensive review on purine utilization by microorganisms was
published by Vogels and Drift (1976). Although fungi growing on caffeine have been
isolated, most of the studies were done with bacteria isolated from soil, mainly those
belonging to the Pseudomonads group, with particular attention to Pseudomonas
putida (Burr and Caesar, 1985). Madyastha et. al., (1998, 1999) have reported the
degradation of caffeine by a consortium of bacteria belonging to Klebsiella and
Acinetobacter species. They have reported that the caffeine degradation in this
consortium is through a novel route of oxidation at C-8 position in carbon, unlike the
normal N-demethylation reported in other bacteria. They have also reported that the
enzyme involved in the first step of caffeine degradation is a caffeine oxidase and the
43
ePrin
t@CFT
RI
A Biotechnological Approach for Decaffeination Chapter 1
product is 1,3,7-trimethyl uric acid. Gokulakrishnan et. al., (2005), have reviewed the
caffeine degradation by bacteria and fungi. They report the degradation of caffeine by
a strain of Pseudomonas. NCIM 5235.
Dickstein et al. (1957) and Bergmann et al. (1964) studied the degradation of
3-monomethylxanthine mediated by dehydrogenase activity in Pseudomonas
fluorescens. They did not find activity with 1-monomethylxanthine as substrate.
However, Woolfolk (1975) used a P. fluorescens strain with ability to grow on
caffeine to demonstrate dehydrogenase activity against both mono methyl xanthines.
Hydrolytic enzyme degrading caffeine, with the methyl groups being removed by
sequential hydrolysis was suggested. Methanol and xanthine were the final reaction
products, and indications were that methanol was further oxidized to CO2. Blecher
and Lingens (1977) studied degradation of caffeine by P. putida strains isolated from
soil. They identified 14 catabolites: theobromine, paraxanthine,
7-monomethylxanthine, xanthine, 3,7-dimethyluric acid, 1,7-dimethyluric acid,
7-methyluric acid, uric acid, allantoin, allantoic acid, ureidoglycolic acid, glyoxylic
acid, urea and formaldehyde. The overall pathway of caffeine degradation in bacteria
and fungi is given in figure 1.9.3.1.
Caffeine is first converted to respective dimethyl xanthines (theobromine,
paraxanthine and theophylline) by a caffeine demethylase enzyme. The diemthyl
xanthines are either converted to the respective dimethyluric acids by xanthine
oxidase or directly demethylated to their monomethyl uric acids by the action of
xanthine dehydrogenases present in the system. The monomethylxanthines are
converted to xanthine which is oxidized by xanthine oxidase to uric acid. By the
44
ePrin
t@CFT
RI
A Biotechnological Approach for Decaffeination Chapter 1
action of uricase uric acid is degraded to allantoin. Allantoin is further degraded down
the pathway and ends up in ammonia and CO2 by the action of urease.
Middelhoven and Lommen (1984) studied degradation of caffeine as
influenced by oxygen. They concluded that the first enzymatic steps in caffeine
degradation in a P. putida strain were the successive removal of the three methyl
groups, probably mediated by mono-oxygenases. However, they failed to demonstrate
the mono-oxygenase activities.
Enzymological aspects of caffeine degradation by Pseudomonas putida were
reported by Hohnloser et al. (1980) in detail. Using NADPH as cofactor in enzyme
assays, they observed that only theobromine was formed from caffeine, but when they
used paraxanthine, theobromine or 7-monomethylxanthine, they did not detect any
activity. The authors suggested that there was only a single enzymatic system
responsible for the sequential demethylation of caffeine. Regarding the lack of
activity against theobromine and other substrates, they also suggested that although
not detected in vitro, enzymatic degradation might occur in vivo but at very low rates.
It was also argued that the slow and poor growth of the bacteria on caffeine as
the sole source of carbon was due to a limiting demethylation of caffeine as well as
other methylxanthines. A limiting demethylation rate of caffeine was observed by
Mazzafera et al. (1994a) in a Serratia marcescens strain isolated from soil collected
under coffee trees. By cultivating the bacteria on different substrates as the sole
source of carbon and nitrogen, they could establish that caffeine was degraded to
paraxanthine and/or theobromine, and subsequently to 7-monomethylxanthine and
xanthine.
45
ePrin
t@CFT
RI
A Biotechnological Approach for Decaffeination Chapter 1
Sauer (1982) obtained indications that caffeine in yeast was degraded by
cytochrome P450, suggesting that the catabolic pathway might be similar to animals.
In humans, several cytochrome P-450 isoforms are responsible for caffeine
degradation (Berthou et al., 1992).
However, data obtained by Schwimmer et al. (1971), who studied the
degradation of caffeine to theophylline in fungi, and Blecher and Lingens (1977),
who studied degradation of caffeine to theobromine in bacteria; do not indicate
participation of P-450 on caffeine degradation mechanism.
Gluck and Lingens (1987) by P. putida mutants obtained a mixture of
theobromine and paraxanthine as degradation products of caffeine. These results
support inferences of Blecher and Lingens (1977), who suggested that caffeine can be
degraded either via theobromine or via paraxanthine. Similar conclusion was reached
by Mazzafera et. al., (1994a) with Serratia marcescens.
46
ePrin
t@CFT
RI
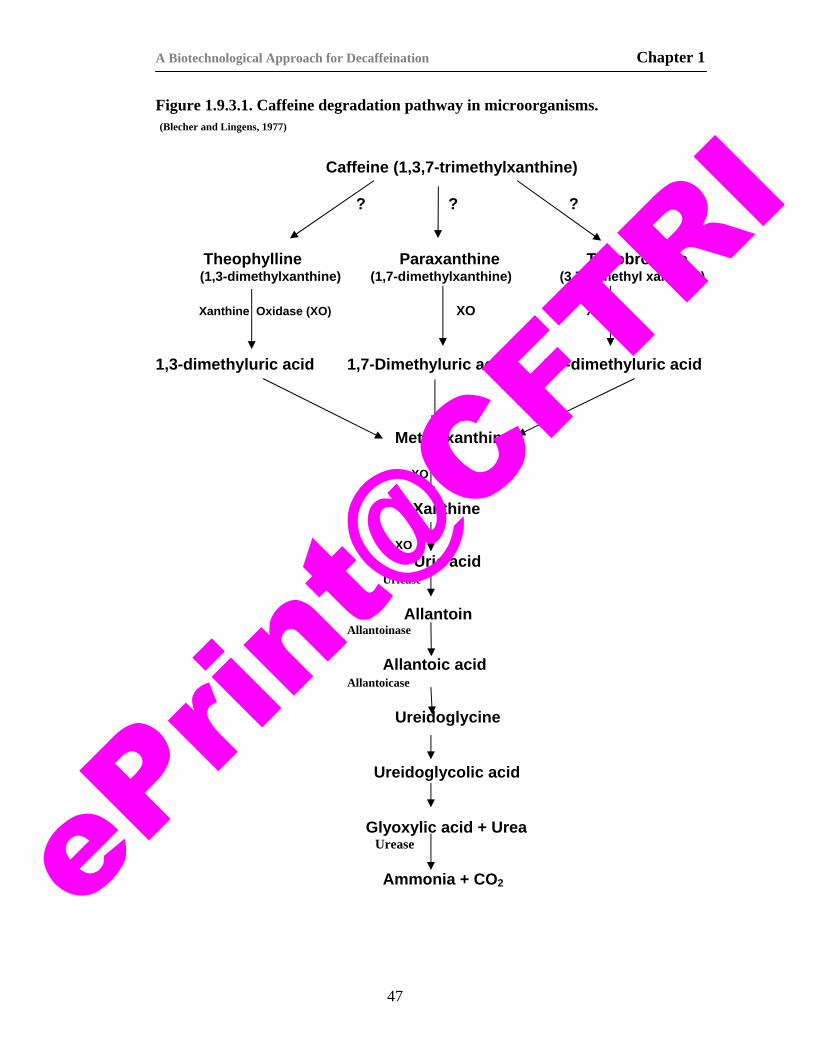
A Biotechnological Approach for Decaffeination Chapter 1
Figure 1.9.3.1. Caffeine degradation pathway in microorganisms. (Blecher and Lingens, 1977) Caffeine (1,3,7-trimethylxanthine) ? ? ?
Theophylline Paraxanthine Theobromine (1,3-dimethylxanthine) (1,7-dimethylxanthine) (3,7 Dimethyl xanthine)
Xanthine Oxidase (XO) XO XO 1,3-dimethyluric acid 1,7-Dimethyluric acid 3,7-dimethyluric acid
Methylxanthine
XO
Xanthine
XO Uric acid Uricase
Allantoin Allantoinase
Allantoic acid Allantoicase Ureidoglycine Ureidoglycolic acid
Glyoxylic acid + Urea Urease
Ammonia + CO2
47
ePrin
t@CFT
RI

A Biotechnological Approach for Decaffeination Chapter 1
Most studies on caffeine degradation by Pseudomonas use bacterial strains
obtained through a procedure known as enrichment. Caffeine was added to the soil
(Woolfolk, 1975) or culture medium (Blecher and Lingens, 1977; Hohnloser et. al.,
1980; Middelhoven and Lommen, 1984) to induce the appearance of mutants. In the
case of soil enrichment, caffeine was mixed to the soil and incubated for several
months. In the second case, using artificial media, caffeine was added in low
concentrations and the bacteria sub cultured several times until mutants were
obtained. After that, bacteria were maintained in media containing caffeine as the sole
source of carbon. Gluck and Lingens (1987) isolated a P. putida strain by culturing
the bacteria with 2.0% caffeine as the sole source of carbon and nitrogen. Blecher and
Lingens (1977) added caffeine up to 5.0% in the culture media. Middelhoven and
Bakker (1982) grew the strain C 3204 of P. putida at 20 g L-1 of caffeine. However,
Mazzafera et al. (1994a) and Yano and Mazzafera (1998) used a different approach,
and collected mutants in soil samples taken under coffee plants. Water was added to
the soil samples and after shaking for a few hours, aliquots were plated in solid
medium containing caffeine as the sole source of carbon and nitrogen. In the first
case, they isolated a S. marcescens strain (Mazzafera et al., 1994a) and in the second
(Yano and Mazzafera, 1998), several P. putida strains and other bacteria.
A strain of P. putida isolated by Yano and Mazzafera (1998) showed an
impressive ability to grow in high concentrations of caffeine. Growth was observed at
25 g L-1 in liquid medium and at 50 g L-1 in solid medium. The direct isolation from
the soil without any enrichment is a strong indication that because of competition for
organic nutrients, bacteria growing in soil under coffee plants have developed
48
ePrin
t@CFT
RI

A Biotechnological Approach for Decaffeination Chapter 1
mechanisms to degrade the caffeine released by the plants (leaves, fruits and litter). In
other words, there was a natural enrichment.
Yano and Mazzafera (1999) studied the caffeine degradation pathway in this
P. putida strain, and in agreement with results previously obtained by Blecher and
Lingens (1987), suggested the degradation pathway showed in Figure. 1.9.3.1. Yano
and Mazzafera (1999) also purified a xanthine oxidase, which is responsible for the
conversion of methylxanthines to their respective uric acids. Attempts to purify the
demethylase involved in the first step of caffeine degradation were not successful
(Yano and Mazzafera, 1998). The activity was labile in partially purified extracts.
The enzyme was NADH or NADPH- dependent producing theobromine and
paraxanthine from caffeine. Activity was higher for paraxanthine, as observed in
previous studies (Yano and Mazzafera, 1998).
Blecher and Lingens (1977) and Gluck and Lingens (1987) isolated P. putida
mutants with the ability to degrade caffeine and attempted to block its degradation in
order to produce caffeine derivatives like theobromine, paraxanthine and other
monomethyl xanthines for commercial application. In contrast to these authors,
Asano et al. (1993) were successful in isolating a P. putida strain where the route of
caffeine degradation could be blocked by addition of Zn to the culture medium,
accumulating theobromine. This dimethylxanthine was excreted in the medium, and
precipitated at the bottom of the flask because of its low solubility. This was the first
time that a caffeine derivative was selectively produced using a bacterium.
Yano and Mazzafera (1998) isolated more than 20 bacteria strains from soil
collected under coffee plants, observing predominance of Pseudomonas sp., which
49
ePrin
t@CFT
RI
A Biotechnological Approach for Decaffeination Chapter 1
was also the most efficient caffeine degrader. Mazzafera (2002) used the same P.
putida strain, used by Yano and Mazzafera (1996 and 1998), to study coffee husk
decaffeination. Different proportions of inoculum and husk were incubated during 30
days, resulting in a reduction of up to 80% of caffeine. At shorter incubation periods
(9 days) a 40% reduction was observed.
1.9.3.2. Caffeine degradation by fungi:
Several studies have shown that coffee fruits are a rich source of
microorganisms. Boccas et. al., (1994) isolated 248 fungal cultures from coffee plants
and soil collected from plantation areas. Roussos et. al., (1995) isolated 272 strains of
filamentous fungi from soil, fruits and leaves using a culture media containing coffee
extract, coffee extract plus sucrose, and coffee pulp extract. The fungi strains with the
highest ability to degrade caffeine were identified as Aspergillus and Penicillium.
In studies in which the addition of coffee pulp was made at relatively high
amounts in animal diets, it was suggested that its success was related to the pulps
processing method which would allow a decrease of caffeine and tannin contents by
microorganisms (Braham, 1987; Cabezas et. al., 1987; Jarquin, 1987). Actually,
Murillo (1987) showed a decrease of these substances in ensiled coffee husk.
Caffeine degradation has been observed in fungal species like Stemphyllium
sp., Penicillium sp. (Kurtzmann and Schwimmer, 1971), and Aspergillus sp. (Roussos
et. al., 1995), A. tamari, A. niger, A. fumigatus and P. commune showed appreciable
growth when caffeine was used as the sole source of nitrogen (Hakil et. al., 1998) A.
tamari and P. commune showed good caffeine degrading ability (about 60%) whereas
others had less than 20% caffeine degradation (Hakil et. al., 1998). Bioremediation of
50
ePrin
t@CFT
RI
A Biotechnological Approach for Decaffeination Chapter 1
coffee pulp to reduce the caffeine content has been studied more in fungal systems.
Among the microbial community present in coffee pulp, only a few species like
Aspergillus, Penicillium and Rhizopous could degrade caffeine (Roussos et. al.,
1995). Aspergillus and Penicillium species degraded caffeine almost with 100%
efficiency at 250C, whereas the efficiency of degradation decreased to 30% at 300C
(Roussos et. al., 1995). Rhizopous sp. produced a higher quantity of biomass, whereas
Aspergillus sp. showed more efficient caffeine degradation (92%). The degradation of
caffeine in coffee pulp and coffee husk has been studied by solid-state fermentation
with Aspergillus, Rhizopus and Phanerochaete. In Rhizopus and Phanerochaete, the
critical parameters affecting caffeine degradation were pH and moisture. The critical
values of pH and moisture content for Rhizopus and Phanerochaete were found to be
5.5, 65 and 6, 60%, respectively. For A. niger the critical parameters affecting
caffeine degradation were temperature and pH and the optimal values were 280 C and
4.0, respectively (Brand et. al., 2000). An effective method has been reported for
utilizing the caffeine using coffee pulp and husk as the substrate for the growth of
molds (Leifa et. al, 2000; Salmones et. al., 2005). Caffeine was degraded during the
growth of Lentinus edode whereas caffeine was accumulated in the fruiting bodies of
Pleurotus sp. Hence, Pleurotus sp. could be used to recover caffeine from coffee and
tea waste. The first steps of caffeine degradation by Rhizopus delemar LPB 34 by
solid state fermentation of coffee husk consist of demethylation reactions (Fig.
1.9.3.2.). According to Hakil (1998), theophylline is the major degradation product of
caffeine by various filamentous fungi.
51
ePrin
t@CFT
RI
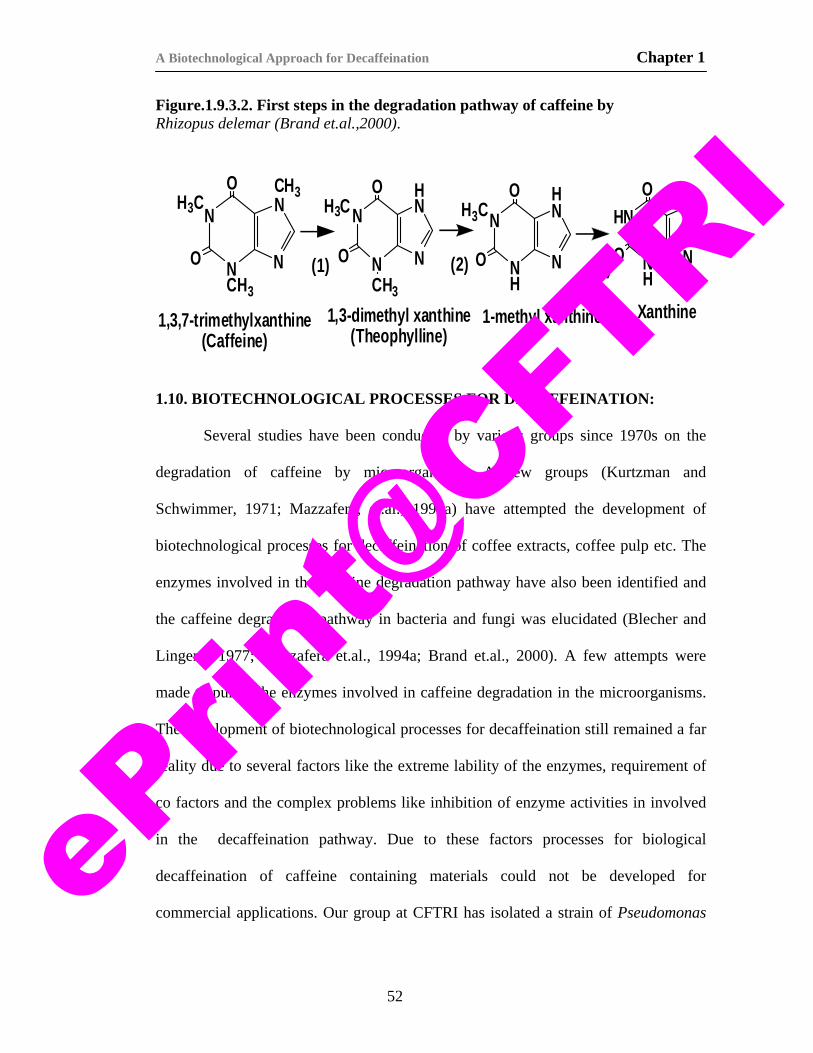
A Biotechnological Approach for Decaffeination Chapter 1
Figure.1.9.3.2. First steps in the degradation pathway of caffeine by Rhizopus delemar (Brand et.al.,2000).
N
N N
N
O
OH3C
CH3
CH3
1,3,7-trimethylxanthine(Caffeine)
N
N N
N
O
OH3C
CH3
HN
NH
N
N
O
OH3C
H
1-methyl xanthine
HN
NH
NH
N
O
O
Xanthine1,3-dimethyl xanthine(Theophylline)
(1) (2) (3)
1.10. BIOTECHNOLOGICAL PROCESSES FOR DECAFFEINATION:
Several studies have been conducted by various groups since 1970s on the
degradation of caffeine by microorganisms. A few groups (Kurtzman and
Schwimmer, 1971; Mazzafera, et.al., 1994a) have attempted the development of
biotechnological processes for decaffeination of coffee extracts, coffee pulp etc. The
enzymes involved in the caffeine degradation pathway have also been identified and
the caffeine degradation pathway in bacteria and fungi was elucidated (Blecher and
Lingens, 1977; Mazzafera et.al., 1994a; Brand et.al., 2000). A few attempts were
made to purify the enzymes involved in caffeine degradation in the microorganisms.
The development of biotechnological processes for decaffeination still remained a far
reality due to several factors like the extreme lability of the enzymes, requirement of
co factors and the complex problems like inhibition of enzyme activities in involved
in the decaffeination pathway. Due to these factors processes for biological
decaffeination of caffeine containing materials could not be developed for
commercial applications. Our group at CFTRI has isolated a strain of Pseudomonas
52
ePrin
t@CFT
RI
A Biotechnological Approach for Decaffeination Chapter 1
alcaligenes MTCC 5264, having a high caffeine degrading capacity (Sarath et. al.,
2005). We have successfully developed a process for biodecaffeination of tea, coffee
and beverages by using enzymes from P. alcaligenes MTCC 5264 strain isolated in
our laboratory and this will be described in detail in the subsequent chapters.
The important parameters for the development of technological process for
microbial degradation of caffeine are: (i) rate of caffeine degradation; (ii) initial
caffeine content; (iii) nitrogen source and (iv) pH. The rate of caffeine degradation by
important microorganisms is given in Table 1.10.1. The bacterial degradation of
caffeine was better than fungi because the rate of degradation was higher in bacteria.
Since caffeine is toxic to microorganisms (Sundarraj et. al., 1965; Putrament et. al.,
1972; Kihlman 1974), the initial concentration of caffeine in fermentation is crucial.
In S. marcescens, the critical inhibitory concentration has been found to be 1.2 mg/ml
(Mazzafera et. al., 1994a). P. putida has been found to be the best organism for
degrading caffeine at higher concentration. In fungi, the presence of an external
nitrogen source inhibits caffeine degradation completely till the external source is
depleted. The presence of urea and ammonium sulphate prevents the uptake of
caffeine in A. niger and Penicillium verrucosum (Hakil et. al., 1999; Roussos et. al.,
1994). However, in contrast to fungi, the presence of an external organic nitrogen
source did not prevent the degradation of caffeine in bacteria (Asano et.al., 1993).
Packed bed fermentation of R. delemar with coffee pulp as a substrate has been
reported to produce theophylline and 3-methyl xanthine as the major metabolites due
to the degradation of caffeine in the pulp (Tagliari et.al., 2003; Hakil et.al., 1998). No
reports are available on bacterial degradation of caffeine in bioreactor.
53
ePrin
t@CFT
RI
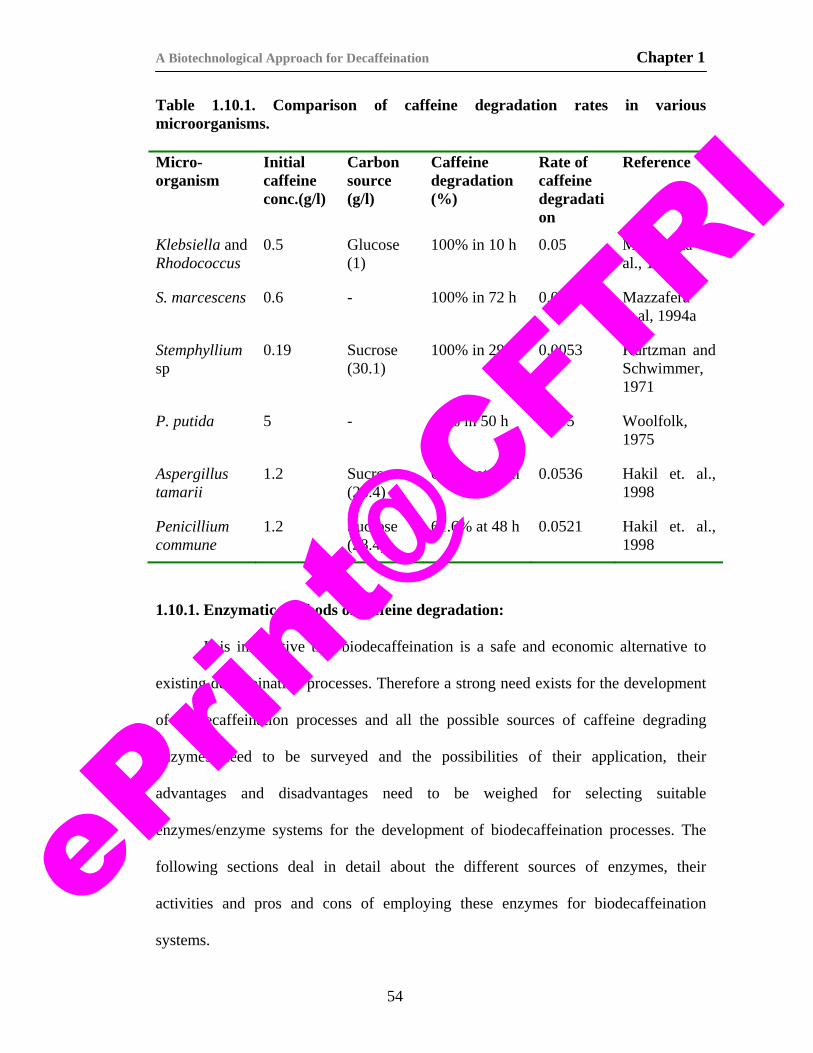
A Biotechnological Approach for Decaffeination Chapter 1
Table 1.10.1. Comparison of caffeine degradation rates in various microorganisms.
Micro- organism
Initial caffeine conc.(g/l)
Carbon source (g/l)
Caffeine degradation (%)
Rate of caffeine degradation
Reference
Klebsiella and Rhodococcus
0.5 Glucose (1)
100% in 10 h 0.05 Madhyasta et. al., 1998
S. marcescens 0.6 - 100% in 72 h 0.008 Mazzafera et.al, 1994a
Stemphyllium sp
0.19 Sucrose (30.1)
100% in 29 h 0.0053 Kurtzman and Schwimmer, 1971
P. putida 5 - 95% in 50 h 0.095 Woolfolk, 1975
Aspergillus tamarii
1.2 Sucrose (28.4)
67.2% at 48 h 0.0536 Hakil et. al., 1998
Penicillium commune
1.2 Sucrose (28.4)
61.6% at 48 h 0.0521 Hakil et. al., 1998
1.10.1. Enzymatic methods of caffeine degradation:
It is imperative that biodecaffeination is a safe and economic alternative to
existing decaffeination processes. Therefore a strong need exists for the development
of biodecaffeination processes and all the possible sources of caffeine degrading
enzymes need to be surveyed and the possibilities of their application, their
advantages and disadvantages need to be weighed for selecting suitable
enzymes/enzyme systems for the development of biodecaffeination processes. The
following sections deal in detail about the different sources of enzymes, their
activities and pros and cons of employing these enzymes for biodecaffeination
systems.
54
ePrin
t@CFT
RI
A Biotechnological Approach for Decaffeination Chapter 1
1.10.1.1. Plant enzymes:
The most studied enzymes are plant caffeine anabolic enzymes, which are
aimed at producing decaffeinated plants. The caffeine synthesis in plants comprises of
sequential methylations at N-7,N-3 andN-1 of xanthosine ring which are catalyzed by
different N-methyl transferases (NMT), viz., 7-methyl transferase, 3-methyl
transferase and 1-methyl transferase (Suzuki and Takahasi, 1975; Magalhaes et. al.,
1991; Mazzafera et., al 1994b). Caffeine synthesis in plants can be stopped if
xanthosine synthesis in plants is inhibited since caffeine is synthesized from
xanthosine. It has been proposed that by deactivation of inosine monophosphate
dehydrogenase using inhibitor ribavarin, caffeine deficient tea and coffee plant can be
produced (Keyaa et. al., 2003). Recently, cDNA of theobromine synthase (methyl
transferase enzyme which produces theobromine) enzyme was isolated. The
repression of theobromine synthase and caffeine synthase genes in a coffee plant
using RNA interference technique resulted in a plant with 50% lower caffeine (Ogita
et. al., 2004). A naturally decaffeinated coffee plant was also recently reported
(Silvarolla et. al., 2004). Chemical defense theory proposes that caffeine may give
protection to young leaves, fruits and flower buds from predators like larvae
(Harborne, 1993). It was seen that solutions of caffeine are effective in killing or
repelling slugs and snails when applied to foliage or the growing medium of plants
(Hollingsworth et. al., 2002). Allelopathic theory proposes that caffeine may prevent
the growth of other species of plants in its surroundings (Waller, 1989). So, aiming
for decaffeinated plants with the knowledge of the genes involved in caffeine
production may not be advantageous than microbial and enzymatic degradation of
55
ePrin
t@CFT
RI
A Biotechnological Approach for Decaffeination Chapter 1
caffeine source as and when required. Caffeine is known to be degraded via
theophylline to ammonia and carbon dioxide, a pathway similar to fungal
metabolism. It is imperative that all the enzymes involved are the same as those of
microorganisms. The possibility of using caffeine degrading enzymes from coffee
and tea plants offers the advantage of abundant fresh leaf material for enzyme
extraction and isolation. Ashihara et.al, (1999a and b), have identified coffee plants
with very low caffeine. They report that the low caffeine content of the plant is not
due to a defective mechanism in caffeine synthesis, but a high caffeine degrading
activity in the plants. However, studies on the extraction of caffeine demethylase
enzyme from coffee plants were not successful till date (Ashihara, 2006). Kato, et. al.,
(1999) attempted the purification of caffeine synthase enzyme from leaves of coffee
and found that the enzyme was highly labile for conducting experiments in vitro. It is
also well known that demethylases are highly instable (Sideso, et. al., 2001). Even the
presence of caffeine demethylase enzyme in coffee plants is not established well.
Therefore development of bio-decaffeination processes using plant enzymes is still
not very feasible. Alternative sources of the enzymes are microorganisms which have
the capability to degrade caffeine.
1.10.1.2. Microbial enzymes:
The enzymes involved in the degradation of caffeine in microorganisms are
demethylases and oxidases (Hohnloser et. al., 1980; Asano et. al., 1993; Yano and
Mazzafera, 1998; Yano and Mazzafera, 1999). Yano and Mazzafera (1998) attempted
to purify caffeine demethylase but found that the purified enzyme was labile and it
rapidly lost its activity. It has been observed that the use of cryo-protectants and
56
ePrin
t@CFT
RI

A Biotechnological Approach for Decaffeination Chapter 1
freeze-drying to low moisture contents improved the stability of the enzyme (Sideso
et. al., 2001). In general, the caffeine degrading enzymes are very labile and more
studies are required to improve the stability of the enzymes, which will help in
developing a specific process for caffeine degradation in reactors. In a mixed culture
consortium belonging to Klebsiella sp. and Rhodococcus sp., caffeine was directly
oxidized by the enzyme caffeine oxidase at the C-8 position leading to the formation
of 1,3,7-trimethyluric acid and this process did not have demethylation steps. Only
partial characterization of this enzyme is available (Madyastha et. al., 1998,
Madyastha et. al., 1999). The oxidative degradation of caffeine to trimethyluric acid
(single step) appears to be efficient for development of enzymatic degradation of
caffeine. Studies on enzyme stability, cloning and over expression of this enzyme in
suitable hosts will lead to development of technological process for efficient caffeine
degradation. Sauer (1982) obtained indications that caffeine in yeast was degraded by
cytochrome P450, suggesting that the catabolic pathway might be similar to animals.
Sauer (1982) reported that degradation of caffeine in fungi is brought about by
Cytochrome P450. However, the application of cytochrome P450s for
biodecaffeination process is not feasible as their cofactor requirement is very high and
the caffeine degradation rates are too slow. Moreover, these enzymes are expressed at
very low quantities and are microsome bound requiring the separation of these
enzymes in the form of microsomes which would increase the costs of a commercial
process to inhibitory levels. Bacterial enzymes are known to degrade caffeine more
efficiently, and their co-factor requirements are less. Moreover, extraction and
purification of these enzymes is relatively simpler and crude cell free extracts contain
57
ePrin
t@CFT
RI
A Biotechnological Approach for Decaffeination Chapter 1
relatively higher enzyme activities. But the disadvantage of enzyme lability still exists
in these processes and efforts were made at CFTRI to address these problems.
Work at CFTRI:
Three strains of caffeine degrading bacteria belonging to Alcaligenes fecalis,
Pseudomonas alcaligenes and Acetobacter species were isolated. P. alcaligenes
MTCC 5264, was found to have a very high caffeine degrading capability and this
strain was found to completely degrade caffeine (1 g/l) within 12 hours of incubation
(Sarath et. al., 2005). This strain was also found to grow at caffeine concentrations as
high as 10g/L of caffeine. This strain was used for the development of
biodecaffeination processes for coffee and tea extracts. The enzymes involved in
biodecaffeination were isolated and identified. These enzymes were found to be
highly labile and were stabilized using different stabilizing agents. The enzymes were
immobilized into suitable matrices and process for biodecaffeination of coffee and tea
extracts were developed. A process for the biodecaffeination of tea has also been
developed for use during tea fermentation and the results were promising (Sarath et.
al., 2003 (428/Del/03); Sarath et. al., 2006a, 2006b). Further work is underway on the
cloning and hyper expression of the caffeine demethylase enzyme into a suitable
vector for the production of enzymes at a larger scale, increasing the stability of the
enzymes in vitro and application of these enzymes for biodecaffeination processes.
1.11. CONCLUSION AND FUTURE PERSPECTIVES:
Present day scenario around the globe demands for more safe products
produced through green route. Coffee and tea being the most widely consumed
beverages all around the world, and the risks associated with high intake of these
58
ePrin
t@CFT
RI
A Biotechnological Approach for Decaffeination Chapter 1
beverages have led to the development of the existing decaffeination processes. Each
process has its own disadvantage either in the form of solvent residues or loss of
essential flavors or inhibitory costs of decaffeination as in the case of super critical
process. Moreover these processes are capable of catering only coffee and tea, but are
not feasible for application to the huge amounts of coffee and tea wastes generated.
These processes also have added up to the existing environmental problems of the
industrialized world. Alternative green technologies are the need of the day and
biological means of decaffeination is the best alternative.
Though the search for caffeine degrading microorganisms began nearly 35
years ago, studies conducted in this area are inadequate. In bacteria, Pseudomonas
species and in fungi Aspergillus and Penicillium species are reported to be efficient
degraders of caffeine. Degradation in bacteria occurs predominantly through
demethylation route but oxidative route occurs predominantly in mammals and the
degradation pathway in fungi is not clearly known. The area of fungal decaffeination
is limited by insufficient literature and knowledge generated. Even in microbial
systems, studies have to be performed to ensure that toxic metabolites are not formed
by the strain during its growth. More microorganisms, which could degrade caffeine,
need to be isolated. Use of whole cells might be an alternative, due to the advantages
of the stability of the biomolecules and reusability. Coffee and tea are rich in nutrients
and the organisms would prefer the simple nutrients for caffeine (Sarath et. al., 2005)
leading to a compromise in the quality of the finished products.
Enzymatic methods of biodecaffeination are the only alternative and
research needs to be focused in this area. The limitation of the use of
59
ePrin
t@CFT
RI

A Biotechnological Approach for Decaffeination Chapter 1
biodecaffeinating enzymes is their high lability. Stabilization of the enzymes,
improving the yields of the enzymes through biochemical and genetic engineering of
the caffeine degraders, improved process conditions etc. are the key areas which need
a lot of research. Focus is now on the development of coffee and tea plants devoid of
caffeine. But this alternative is not a very suitable method as the plant defense system
would be completely inactivated and would be detrimental to the plant. This would
demand more pesticides and herbicides to protect the plant leading to environmental
pollution problems. Moreover this would demand a replanting of at least a part of the
206 million hectares of tea and coffee plantations all over the world which would
amount to huge expenditure and loss of crop and it is not necessary that the products
should be completely decaffeinated. The caffeine levels in the beverages should be
brought to levels safe for human consumption to get the benefits of caffeine also.
Caffeine degradation by microbes and enzymes is more advantageous than creating
decaffeinated plants with the help of genes of the plant anabolic enzymes. An
alternative will be cloning and hyper expression of the genes coding the caffeine and
its metabolite degrading enzymes into suitable expression vectors, increasing the
yields of the enzymes, stabilizing the enzymes and application of these enzymes for
the development of biodecaffeination processes. Once this is done, the enzymes may
be purified, immobilized in a bioreactor and its caffeine degrading ability can be
studied and optimized. Biological production of theobromine and other methyl
xanthines from caffeine need to be optimized. Such studies will lead to development
of process for caffeine degradation as well as production of value added compounds
and this work is going on in our laboratory. An integrated approach of basic science
60
ePrin
t@CFT
RI
A Biotechnological Approach for Decaffeination Chapter 1
with biochemical engineering will help in developing a successful process for
caffeine degradation using microorganisms or enzymes associated with it. Success
was achieved in our laboratory at CFTRI on the development of enzymatic
biodecaffeination of coffee and tea using immobilized and free enzymes. Work is
also underway in our laboratory on the cloning and hyper expression of the genes
coding for the caffeine degrading enzymes in a suitable expression vector. Also work
is underway on the scaling up of the biodecaffeination process for industrial
applications. Several problems like protein polyphenol interactions, caffeine catechin
complexes, inhibition of the caffeine degrading enzymes etc have been addressed but
need an in-depth study and industry applicable solutions so that the biodecaffeination
process would be converted to an industrial success from being a mere scientific
discovery.
61
ePrin
t@CFT
RI
A Biotechnological Approach for Decaffeination Chapter 1
1.12. REFERENCES:
1. Abolfathi Z., Pakdel, H., Beaune, P., (1995), CYP1A2 is the major enzyme
involved in the N-oxidation of mexiletine in man. Clin. Pharml. Ther. 57:210.
2. Acheson, K., Gremaud, G., Meirim, I., (2004), Metabolic effects of caffeine in
humans: lipid oxidation or futile cycling? Am. J. Clin. Nutr. 79: 40-46.
3. Adams, M.R., Dougan, J. (1981), Biological management of coffee processing.
Tropic. Sci. 123: 178-196.
4. al'Absi, M., Lovallo, W.R., McKey, B., Sung, B.H., Whitsett, T.L., Wilson, M.F.,
(1998), Hypothalamic-pituitary-adrenocortical responses to psychological stress
and caffeine in men at high and low risk for hypertension. Psychosom. Med.
60(4): 521-7.
5. Alvares, A.P., Kappas, A., Eiseman, J.L., Anderson, K.E., Pantuck, C.B.,
Pantuck, E.J., (1979), Intra individual variation in drug disposition. Clin.
Pharmacol. Ther. 26:407- 419.
6. Andersson, H. C., Hallström, H., Kihlman, B.A, (2004), Intake of caffeine and
other methylxanthines during pregnancy and risk for adverse effects in pregnant
women and their fetuses. TemaNord. :565
7. Asano, Y., Komeda, T., Yamada, H., (1993), Microbial production of
theobromine from caffeine. Biosci. Biotech. Biochem. 57: 1286–89.
8. Asano, Y., Komeda, T., Yamada, H., (1994), Enzymes involved in theobromine
production from caffeine by a Pseudomonas putida No. 352. Biosci. Biotech.
Biochem. 58:2303–2304.
9. Ashihara, H., Crozier, A., (1999a), Biosynthesis and catabolism of caffeine in
low-caffeine-containing species of Coffea. J. Agric. Food Chem. 47: 3425-3431.
10. Ashihara, H., Crozier, A., (1999b), Biosynthesis and metabolism of caffeine and
related purine alkaloids in plants. Adv. Bot. Res. 30: 118-205.
62
ePrin
t@CFT
RI

A Biotechnological Approach for Decaffeination Chapter 1
11. Ashihara, H., Gillies, F.M., Crozier, A., (1997), Metabolism of caffeine and
related purine alkaloids in leafs of tea (Camellia Sinensis). Plant Cell Physiol. 38:
413–19.
12. Ashihara, H., Monteiro, A.M., Gillies, F.M., Crozier, A., (1996a), Biosynthesis of
caffeine in leaves of coffee. Plant Physiol. 111: 747-753.
13. Ashihara, H., Monteiro, A.M., Moritz, T., Gillies, F.M., Crozier, A., (1996b),
Catabolism of caffeine and related purine alkaloids in leaves of Coffea arabica L.,
Planta. 198: 334-339.
14. Ashihara, H., (2006), Metabolism of alkaloids in coffee plants. Braz. J. Plant
Physiol. 18(1): 1-8.
15. Attifeld, J., (1865). On the food-value of the cola-nut- a new source of thein.
Pharm. J. 6: 457-460.
16. Barone, J.J., Roberts, H.R., (1996), "Caffeine Consumption." Food Chem.
Toxicol.. 34: 119-129.
17. Barrett, C., Chang, J. C., Edelstein, S. L., (1994), Coffee-associated osteoporosis
offset by daily milk consumption. The Rancho Bernardo Study, J. Amer. Med.
Ass. 271: 280-283.
18. Bergmann, F., Ungar-Waron, H., Kwietny-Govrin H., (1964), Some specific
reactions of the purine oxidizing system of Pseudomonas aeruginosa. Biochim.
Biophys. Acta, 79: 512-522.
19. *Berthemot, Dechastelus (1840), Chemische Untersuchung des Guarana. Liebig
´s Ann. Chem. 36: 90-93.
20. Berthou, F., Guillois, B., Riche, C., Dreano, Y., Jacqz-Aigrain, E., and Beaune, P.
(1992), Xenobiotica, 22: 671–680.
21. Blauch, J.L., Tarka J.R., Stanley, M., (1983), HPLC determination of caffeine and
theobromine in coffee, tea and instant hot cocoa mixes. J. Food Sci. 48: 745-748.
22. Blecher, R., Lingens, F., (1977), Metabolism of caffeine by Pseudomonas putida.
Hoppe Seyler’s Z Physiol Chem. 358:807–17.
63
ePrin
t@CFT
RI

A Biotechnological Approach for Decaffeination Chapter 1
23. Boccas F., Roussos S., Gutierrez M., Serrano L., Viniegra G.G., (1994),
Production of pectinase from coffee pulp in solid-state fermentation system -
selection of wild fungal isolate of high potency by a simple 3-step screening
technique. J. Food Sci. Tech. (Mysore). 31:.22-26.
24. Bogo, A., Mantle, P.G., (2000), Caffeine: also a fungal metabolite, Phytochem;
54: 937–939.
25. Braham, J.E., (1987), Coffee pulp in other species. In: Brahan, J.E., Bressani, R.
(Ed.) Coffee pulp: composition, technology, and utilization. Guatemala City:
Institute of Nutrition of Central America and Panama, 51-54.
26. Brand, D., Pandey, A., Roussos, S., Soccol, C.R., (2000) Biological detoxification
of coffee husk by filamentous fungi using a solid-state fermentation system. Enz.
Microb. Technol. 27:127–33.
27. Bressani, R., (1987a), Antiphysiological factors in coffee pulp. In: Brahan, J.E.;
Bressani, R. (Ed.) Coffee pulp: composition, technology, and utilization.
Guatemala City: Institute of Nutrition of Central America and Panama. 83-88.
28. Bressani, R., (1987b), Potential uses of coffee berry byproducts. In: Brahan, J.E.;
Bressani, R. (Ed.) Coffee pulp: composition, technology, and utilization.
Guatemala City: Institute of Nutrition of Central America and Panama, 17-25.
29. Brogger, A., (1979), Caffeine-induced enhancement of chromosome damage in
human lymphocytes treated with methyl-methane-sulphonate, mitomycin C and
X-rays, Mut.Res./Gen. Toxicol. 23(3): 353-360.
30. Burr, T.J., Caesar, A., (1985), Beneficial plant bacteria. CRC Critic. Rev. Plant
Sci., 2:120.
31. Buters, J. T., Tang, B.K., Pineau, T., Gelboin, H,V., Kimura, S., Gonzalez, F.J.,
(1996), Role of CYP1A2 in caffeine pharmacokinetics and metabolism: Studies
using mice deficient in CYP1A2. Pharmacogen. 6: 291-296.
32. Butler, M. A., Lang, N.P., Young, J.F., Caporaso, N.E., Vineis, P., Hayes, R.B.,
(1992), Determination of CYP1A2 and NAT2 phenotypes in human population
by analysis of caffeine urinary metabolites. Pharmacogen. 2:116-127.
64
ePrin
t@CFT
RI
A Biotechnological Approach for Decaffeination Chapter 1
33. Butler, M. A., Iwasaki, M., Guengerich, F. P., Kadlubar, F. F. (1989), Proc. Natl.
Acad. Sci. USA, 86: 7696–7700.
34. Cabezas, M. T., Flores, A., Egana, J. I., (1987), Use of coffee pulp in ruminant
feeding. In: Braham, J.E.; Bressani, R. (Ed.) Coffee pulp: composition,
technology, and utilization. Guatemala City: Institute of Nutrition of Central
America and Panama. 25-38.
35. Carrillo, J.A., Christensen, M., Ramos, S., Alm, C., Dahl, M.L., Benitez, J.,
(2000), Evaluation of caffeine as an in vivo probe for CYP 1A2 using
measurements in plasma, saliva and urine. Ther. Drug. Monit. 22: 409-417.
36. Carter, A.J., O'Connor, W.T., Carter, M.J., Ungerstedt, U., (1995), Caffeine
enhances Acetylcholine release in the hippocampus in vivo by a selective
interaction with adenosine A1 receptors. J. Pharmacol. Exp. Ther. 273(2):
637-42.
37. Casley, W.L., Menzies,J.A., Whitehouse,L.W., Moon,T.W., (1999), Detection Of
Quantitative Trait Loci Affecting Caffeine Metabolism By Interval Mapping In
A Genome-Wide Scan Of C3h/Hej 3 Apn F2 Mice, Drug. Meta. Disp. 27(12):
1375–1380.
38. Cherrington, N.J., Cao, Y., Cherrington, J.W., Rose, R.L., Hodgson, E., (1998),
Physiological factors affecting protein expression of flavin-containing
monooxygenases 1, 3, and 5. Xenobiotica, 28:673–682.
39. Christian, M., Brent, R., (2001), Teratogen Update: Evaluation of the
Reproductive and Developmental Risks of Caffeine. Teratology, 64: 51-78.
40. Chung W.G., Cha, Y.N., (1997), Oxidation of Caffeine to Theobromine and
Theophylline Is Catalyzed Primarily by Flavin-Containing Monooxygenase in
Liver Microsomes, Biochem. Biophys. Res. Comm, 235: 685–688.
41. Clarkson, (1993), Nutritional Ergogenic Aids: Caffeine. Int.J. Sport Nutr. 3:103-
111.
42. Cnattingius, S., Signorello, L.B., Anneren, G., Clausson, B., Ekbom, A., Ljunger,
E., Blot, W.J., McLaughlin, J.K., Petersson, G., Rane, A., Granath, F., (2000),
65
ePrin
t@CFT
RI
A Biotechnological Approach for Decaffeination Chapter 1
Caffeine Intake and the Risk of First-Trimester Spontaneous Abortion. New
Eng. J. Med. 343: 1839-1845.
43. Cornish, H. H., Christmanm A. A., (1957), A study of the metabolism of
theobromine, theophylline and caffeine in man. J. Biol. Chem. 228:315–23.
44. Daly, J.W., Fredholm, B.B., (1998), Caffeine—an atypical drug of dependence.
Drug. Alcohol. Depend. 51:199–206.
45. Dam, R. M. V., Hu, F. B., (2005), Coffee Consumption and Risk of Type 2
Diabetes: A Systematic Review, J. Amer. Med. Assoc. 294(1): 97 - 104.
46. *Danielle, W.F. (1865), On the cola-nut of tropical West Africa (The guru nut of
Sudan). Pharm. J. 6: 450-457.
47. Danielson, P.B., (2002), The cytochrome P450 superfamily: biochemistry,
evolution and drug metabolism in humans. Curr. Drug. Metab. 6: 561–597.
48. Denis, S., Augur, C., Marin, B., Roussos S., (1998), Biotechnol. Techn.
12(5):359-362.
49. Dickstein, S., Bergmann, F., Henis, Y., (1957), Studies on uric acid and related
compounds. IV. The specificity of bacterial xanthine oxidases. J. Biol. Chem.
224: 6777.
50. Dlugosz, L., Belanger, K., Hellenbrand, K., et al., (1996), Maternal caffeine
consumption and spontaneous abortion: a prospective cohort study.
Epidemiol. 7:250–5.
51. Elias, P.S. (1986), Current biological problems with coffee and caffeine. In:
Colloque International Sur La Chimie Du Cafe. 12., Lome, 1985. Proceedings.
Paris: Assoc. Scientifi.-112.
52. Eskenazi, B., (1999), Caffeine- filtering the facts. New Eng. J. Med. 341:1688-
1689.
53. *Europaisches, A., (1978), Coffeinum, p 670: Theophyllinum, 1213; Deutscher
Apotheker Verlag Stuttgart.
66
ePrin
t@CFT
RI
A Biotechnological Approach for Decaffeination Chapter 1
54. Farin, F,M,, Omiecinske, C,J., (1993), Region-specific expression of cytochrome
P450s and microsomal epoxide hydrolase in human brain tissue. J Toxicol.
Environ. Health. 40:323-341.
55. *Fechner, M.G.T., (1826), Repertorium der organischen Chemie, (Leipzig).
56. Fenster, L., Eskenazi, B., Windham, G.C., (1991), Caffeine consumption during
pregnancy and fetal growth. Am. J. Public Health. 81:458–61.
57. Fontana, R. J., (1998), Caffeine based measures of CYP1A2 activity correlate
with oral clearance of tacrine in patients with Alzheimer's disease. Br. J. Clin.
Pharmacol. 46:221-228.
58. Fredholm, B., (1995), Adenosine, adenosine receptors and actions of caffeine.
Pharmacol. Toxicol. 76:93-101.
59. Friedman, J., Waller, G.R., (1983a), Caffeine hazards and their prevention in
germinating seeds of coffee (Coffea arabica L.). J. Chem. Ecol. 9:1099-1106.
60. Friedman, J., Waller, G.R., (1983b), Seeds as allelopathic agents. J. Chem. Ecol.
9:1107-1115.
61. Frischknecht, P. M., (1985), Purine alkaloid formation in buds and developing
leaflets of Coffea arabica: expression of an optimal defense strategy??
Phytochem. 3:613-616.
62. Fuhr, U., Rost, K.L., Engelhardt, R., Rachs, M., Liermann, D., Belloc, C., (1996),
Evaluation of caffeine as a test drug for CYP1A2, NAT2 and CYP2E1
phenotyping in man by in vivo versus correlations. Pharmacogenetics. 6:159-176.
63. *Giese, F.V., (1820), Vermischte Notizen .1. Kaffestoff und Salzgehalt des
Quassia Extrakts. Allg. Nord. Ann. Chem. Freunde Naturkd. Arzneiwiss. 4: 240-
241.
64. *Giese, F.V. (1821) Verschiedene Beobachtungen. J. Chem. Phys. 31, 203-209.
65. Gluck, M., Lingens, F., (1987), Studies on the microbial production of thebromine
and heteroxanthine from caffeine. Appl. Microb. Biotech. 25: 334-340.
67
ePrin
t@CFT
RI

A Biotechnological Approach for Decaffeination Chapter 1
66. Gokulakrishnan, S., Chandraraj, K., Gummadi, S.N., (2005), Microbial and
enzymatic methods for the removal of caffeine, Enz. Microb. Tech. 37, 225-232.
67. Gonzalez, F.J., Kimura, S., (2003), Study of P450 function using gene knockout
and transgenic mice. Arch. Biochem. Biophys. 409: 153– 158.
68. Gotoh, O., (1992), Substrate recognition sites in cytochrome P450 family 2
(CYP2) proteins inferred from comparative analyses of amino acid and coding
nucleotide sequences. J. Biol. Chem. 267: 83–90.
69. Graham, T.E., Rush, J.W.E., Soeren, M.H., (1994), Caffeine and exercise:
Metabolism and performance. Can. J. App. Physiol. 19: 111-138.
70. Grayson, D. A., Tewari, Y. B., Mayhew, M. P., Vilker, V. L., Goldberg, R. N.,
(1996), Tetralin as a substrate for camphor (cytochrome P450) 5-monooxygenase.
Arch. Biochem. Biophys. 332(2): 239-47.
71. Green, P.J., Suls, J., (1996), The effects of caffeine on ambulatory blood pressure,
heart rate, and mood in coffee drinkers. J. Behavior. Med. 19(2):111-28.
72. Greenberg, J. L., Lewis, S. E., Dodd, D. K., (1999), Overlapping addictions and
self-esteem among college men and women. Addict. Behav. 24:565–71.
73. Grigg, C.W., (1972), Effects of coumarin, pyronine Y, 6,9-dimethyl-2
methylthiopurine and caffeine on excision repair and recombination in
Escherichia coli., J. Gen. Microb. 70;221230.
74. Gu, L., Gonzalez, F. J., Kalow, W., Tang, B. K., (1992), Biotransformation of
caffeine, paraxanthine, theobromine and theophylline by cDNA-expressed human
CYP1A2 and CYP2E1. Pharmacogenetics 2: 73-77.
75. Guengerich, F. P., Shimada, T., (1991) Chem. Res. Toxicol. 4, 391–407.
76. Hagedorn, C. J. B., Crozier, K. A., Mentz, A. M., Booth, A. K., Graves, N. J.,
Nelson, R. B. Reneau, Jr. (2003a), Carbon source utilization profiles as a method
to identify sources of fecal pollution in water. J. Appl. Microb. 94(5): 792-799.
77. Hagedorn, C. (2003b). BST Methodologies. Internet address:
http://soils1.cses.vt.edu/ch/biol_4684/bst/BSTmeth.html .
68
ePrin
t@CFT
RI
A Biotechnological Approach for Decaffeination Chapter 1
78. Hakil, M., Denis, S., Gonzalez G.V., Augur, C., (1998), Degradation and product
analysis of caffeine and related dimethyl xanthines by filamentous fungi. Enz.
Microb. Technol. 22:355–9.
79. Hakil, M., Voisinet, F., Gonzalez, G.V., Augur, C., (1999), Caffeine degradation
in solid-state fermentation by Aspergillus tamarii: effects of additional nitrogen
sources. Process Biochem. 35:103–9.
80. Harborne, J. B., (1993), Introduction to ecological biochemistry. Academic Press.
81. Hartman, S. C., (1970), Metab. Pathways. 4, 1-68.
82. Hatch, E., Bracken, M., (1993), Association of Delayed Conception with Caffeine
Consumption. Amer. J. Epidem. 138: 1082-1091.
83. Hiroshi, Ashihara,. (2006), Metabolism of alkaloids in coffee plants, Braz. J.
Plant Physiol. 18(1):1-8.
84. Hohnloser, W., Osswalt, B., Lingens, F., (1980), Enzymological aspects of
caffeine demethylation and formaldehyde oxidation by Pseudomonas putida C1.
Hoppe seyler’s Z. Physiol. Chem. 361:1763–76.
85. Hollingsworth, R. G., Armstrong, J., Wi, Campbell, E., (2002), Pest control:
caffeine as a repellent for slugs and snails. Nature. 417(6892): 915–6.
86. Holmgren, P., Norden-P. L., Ahlner, J., (2004). "Caffeine fatalities — four case
reports". Forensic Sci. Int. 139 (1): 71-3.
87. Ikeya, K., Jaiswal, A. K., Owens, R. A., Jones, E., Nebert, D.W., Kimura, S.,
(1989), Human CYP1A2: sequence, gene structure, comparison with the mouse
and rat orthologous gene, and differences in liver 1A2 mRNA expression. Mol.
Endocrinol. 3: 1399-1408.
88. Illy, A., Viani, R., (1995), Definition of quality. In Espresso Coffee: the
Chemistry,of quality, Ed by Illy A and Viani R, Academic press, London., 24-26.
89. Infante, R. C., Fernandez, A., Gauthier, R., David, M., Rivard, G.E., (1993),
Fetal loss associated with caffeine intake before and during pregnancy. J. Am.
Med. Assoc. 270:2940-2943.
69
ePrin
t@CFT
RI
A Biotechnological Approach for Decaffeination Chapter 1
90. Ito. E., Crozier. A., Ashihara, H., (1997), Theophylline metabolism in higher
plants. Biochim. Biophys. Acta. 1336: 323-330.
91. James, J.E., (1997), Is habitual caffeine use a preventable cardiovascular risk
factor? Lancet. 349:279–81.
92. James, J.E., Stirling, K.P., (1983), Caffeine: A summary of some of the known
and suspected deleterious effects of habitual use. Brit. J. Addict. 78(3): 251-8.
93. Jarquín, R ., (1987), Coffee pulp in swine feeding. In: Braham, J.E.; Bressani, R.
(Ed.) Coffee pulp: composition, technology, and utilization. Guatemala City:
Institute of Nutrition of Central America and Panama, 39-49.
94. *Jobst, C., (1838a), Thein identisch mit Caffein. Ann. Chem. Pharm. 25: 63-66.
95. *Jobst, C., (1838b), Analyse des Theins. Arch. Pharm. 65: 85-86.
96. Johnson, S., (2001), The multifaceted and widespread pathology of magnesium
deficiency. Medical Hypothesis. 56(2):163-70.
97. *Kalberer, P., (1964) Ber. Schweiz. Bot. Ges. 74: 62-107.
98. Kalberer, P., (1965) Nature (London) 205: 597-598.
99. Kalow, W., Tang, B.K., (1991), Use of caffeine metabolite ratios to explore
CYP1A2 and xanthine oxidase activities. Clin. Pharmacol. Ther. 50:508-519.
100. Kato, M., Mizuno, K., Fujimura, T., Iwama, M., Irie, M., Crozier, A.,
Ashihara, H., (1999), Purification and characterization of caffeine synthase from
tea leaves. Plant Physiol. 120: 597-586.
101. Katz, S.N., (1987), Decaffeination of Coffee, Coffee Technology. Ed. Clarke
R.J. and R. Macrae. New York: Elsevier Applied Science.
102. Kaufmann, W. F., Heffernan, T. P., Beaulieu, L. M., Doherty, S., Frank, A. R.,
Zhou, Y., Bryant, M. F., Zhou, T., Luche, D. D., Feinberg, N. N., Schuh, K. J.,
Griffiths, R. R., (1997), Caffeine reinforcement: the role of withdrawal.
Psychopharmacology; 130:320–6.
70
ePrin
t@CFT
RI
A Biotechnological Approach for Decaffeination Chapter 1
103. Kerrigan, S., Lindsey, T., (2005), Fatal caffeine overdose: two case reports.
Forensic Sci. Int. 153 (1): 67-9.
104. Keyaa, C. A., Crozier, A., Ashihara, H., (2003), Inhibition of caffeine
biosynthesis in tea (Camellia sinensis) and coffee (Coffea arabica) plants by
ribavirin. FEBS Lett. 554:473–7.
105. Khanna, K. L., Rao. G.S., Cornish, H.H., (1972), Metabolism of caffeine-3H in
the rat. Toxicol. Appl. Pharmacol. 23:720–30.
106. Kihlman, B. A., (1974), Effects of caffeine on the genetic material. Mutat. Res.
26:53–71.
107. Kobayashi, K., (1998), Inhibitory effects of antiarrhythmic drugs on phenacetin
O-deethylation catalysed by human CYP1A2. Br. J. Clin. Pharmacol.
45:361-368.
108. Konishi, S., Oishi, F., (1973), Nippon Chagyo-Gijutsu, Kyokai Kenkyu-
Happyokai Abstr. 38.
109. *Kossel, A. (1888) Ueber eine neue Base aus dem Pflanxenreich. Ber. Dtsch.
Chem. Ges., 21:2164-2167.
110. Koyama, Y., Tomoda, Y., Kato, M., Ashihara, H., (2003), Metabolism of purine
bases, nucleosides and alkaloids in theobromine-forming Theobroma cacao
leaves. Plant Physiol. Biochem. 41:977–84.
111. Kretschmar, J.A., Baumann, T.W., (1999), Caffeine in citrus flowers.
Phytochemistry. 52:19–23.
112. Kumar, N., Pandey, S., Bhattacharya, A., Ahuja, P.S., (2004), Do leaf surface
characteristics affect Agrobacterium infection in tea [Camellia sinensis (L.) O.
Kuntze]. J. Biosci. 29(3):309–17.
113. Kurtzman Jr., R.H., Schwimmer, S., (1971), Caffeine removal from growth
media by microorganism. Experientia. 27:481–2.
71
ePrin
t@CFT
RI
A Biotechnological Approach for Decaffeination Chapter 1
114. LaCroix, A. Z., Mead, L. A., Liang, K., Thomas, C. B., Pearson, T. A. (1986),
Coffee consumption and the incidence of coronary heart disease. New Eng. J.
Med. 315: 977-982.
115. Lee, S., Hudson, R., Kilpatrick, K., Graham, T. E., Ross, R. (2005),
Caffeine Ingestion Is Associated With Reductions in Glucose Uptake
Independent of Obesity and Type 2 Diabetes Before and After Exercise
Training. Diabetes Care, 28(3): 566 - 572.
116. Leifa, F., Pandey, A., Soccol, CR., (2000), Solid-state cultivation—an efficient
method to use toxic agro-industrial residues. J. Basic Microbiol. 40(3):187–97.
117. Lelo, A., Birkett, D.J., Robson, R.A., Miners, J. O., (1986), Comparative
pharmacokinetics of caffeine and its primary demethylated metabolites
paraxanthine, theobromine and theophylline in man. Br. J. Clin. Pharmacol. 22:
177-182.
118. Lemoine, A., Gautier, J. C., Azoulay, D., Kiffel, L., Belloc, C., Guengerich, F.
P., (1993), Major pathway of imipramine metabolism is catalysed by
cytochromes P450 1A2 and P450 3A4 in human liver. Mol. Pharmacol. 43:827-
832.
119. Leviton, A., Cowan, L., (2002), A review of the literature relating caffeine
consumption by women to their risk of reproductive hazards. Food Chem.
Toxicol. 40:1271–310.
120. Lewis, D. F. V., Lake, B. G., (1996), Xenobiotica.. 26: 723–753.
121. Lewis, D. F. V., Ioannides, C., Parke, D. V., (1986), Biochem. Pharmacol. 35:
2179–2185.
122. Lewis, D. F. V., Moereels, H., Lake, B. G., Loannides, C., Parke, D. V., (1994),
Drug Metab. Rev. 26: 261–285.
123. Lorist, M. M., Tops, M., (2003), Caffeine, fatigue, and cognition. Brain Cogn.
53:82–94.
72
ePrin
t@CFT
RI

A Biotechnological Approach for Decaffeination Chapter 1
124. Lovallo, W.R., Al'Absi, M., Blick, K., Whitsett, T.L. and Wilson, M.F. (1996),
Stress-like adrenocorticotropin responses to caffeine in young healthy men.
Pharmacol. Biochem. Behavior. 55(3):365-9.
125. MacIntosh, B.R., Wright, B.M.., (1995), Caffeine ingestion and performance of
a 1500 m swim. Can. J. Appl. Physiol., 20: 168-177.
126. Madyastha, K.M., Sridhar, G.R., Vadiraja, B.B., Madhavi, Y.S., (1999),
Purification and partial characterization of caffeine oxidase-A novel enzyme
from a mixed culture consortium. Biochem. Biophys. Res. Commun. 263:460–4.
127. Madyastha, K.M., Sridhar, G.R., (1998), A Novel pathway for the metabolism
of caffeine by a mixed culture consortium. Biochem. Biophys. Res. Commun.
249:178–81.
128. *Martius, T., (1840) , Ueber die Zusammensetzung des Guaranins. Ann. Chem.
36: 93-95.
129. Massey, L. K., Wise, K. J., (1984), The effect of dietary caffeine on urinary
excretion of calcium, magnesium, sodium and potassium in healthy young
females. Nutr. Res. 4: 43–50.
130. Massey, L. K., Bergman, E. A., Wise, K. J. and Sherrard, D. J. (1994)
Interactions between dietary caffeine and calcium on calcium and bone
metabolism in older women. J. Am. Coll. Nutr. 13: 592–596.
131. Mast, N., Norcross, R., Andersson, U., Shou, M, Nakayama, K., Bjorkhem, I.,
Pikuleva, I.A., (2003), Broad Substrate Specificity of Human Cytochrome P450
46A1 Which Initiates Cholesterol Degradation in the Brain, Biochemistry. 42
(48):14284 -14292.
132. Mazzafera, P., (2004), Catabolism of caffeine in plants and microorganisms.
Front. Biosci. 9: 1348-1359.
133. Mazzafera, P., Crozier, A., Magalhaes. A.C., (1991), Caffeine metabolism in
Coffea arabica and other species of coffee. Phytochemistry. 30:3913–6.
73
ePrin
t@CFT
RI

A Biotechnological Approach for Decaffeination Chapter 1
134. Mazzafera, P., Crozier, A., Sandbergs, G., (1994a), Studies on the metabolic
control of caffeine turnover in developing endosperms and leaves of Coffea
arabica and Coffea dewevrei. J. Agric. Food Chem. 42:7423–77.
135. Mazzafera, P., Olsson, O., Sandberg, G., (1994b), Degradation of caffeine and
related methyl xanthines by Serratia marcescens isolated from soil under coffee
cultivation. Microb. Ecol. 31:199–207.
136. *Meyers, M.G. et al. (1991) Ann. Intern. Med., 114: 147-150.
137. Middelhoven, W. J., Bakker, C. M., (1982), Degradation of caffeine by
immobilized cells of Pseudomonas putida strain C 3024. Euro. J. Appl.
Microbial. Biotechnol. 15: 214-217.
138. Middelhoven, W. J., Lommen, A., (1984), Degradation of caffeine by
Pseudomonas putida C3024. Anton. van Leeuwenho. 50:298-30.
139. Mills, J.L., Holmes, L.B., Aarons, J.H., Simpson, J.L., Brown, Z.A., Jovanovic-
Peterson, L.G., Conley, M.R., Graubard, B.I., Knopp, R.H. and Metzger, B.E.,
(1993), Moderate caffeine use and the risk of spontaneous abortion and
intrauterine growth retardation. J. Am. Med.Assoc. 269:593-597.
140. Molina, M. R., de la Fuente, G., Batten, M. A., Bressani, R., (1974),
Decaffeination. A process to detoxify coffee pulp. J. Agric. Food Chem.
22(6):1055-59.
141. Mrvos, R. M., Reilly, P. E., Dean, B. S., Krenzelok, E. P., (1989), Massive
caffeine ingestion resulting in death. Vet. Hum. Toxicol. 31 (6): 571-2.
142. Mulder, Ch. J., (1838), Chemische Untersuchung des chinesischen und des
javanischen Threes. Arch. Pharm. 65: 68-84.
143. Murillo, B., (1987), Coffee pulp silage. In: Braham, J.E.; Bressani, R. (Ed.)
Coffee pulp: composition, technology, and utilization. Guatemala City: Institute
of Nutrition of Central America and Panama. 55-62.
144. Nakajima, M., Yokoi, T., Mizutani, M., Shin, S., Kadlubar, F.F., Kamataki, T.,
(1994), Phenotyping of CYP1A2 in a Japanese population by analysis of
74
ePrin
t@CFT
RI

A Biotechnological Approach for Decaffeination Chapter 1
caffeine urinary metabolites: absence of mutation prescribing the phenotype the
CYP1A2 gene. Cancer Epidemiol. Biomark. Prev. 55:413-421.
145. Negishi, M., Iwasaki, M., Juvonen, R. O., Sueyoshi, T., Darden, T. A.,
Pedersen, L. G., (1996), Structural flexibility and functional versatility of
cytochrome P450 and rapid evolution. Mutat. Res. 350: 43– 50.
146. Nehlig, A., Debry, G., (1994), Potential genotoxic, mutagenic and
antimutagenic effects of coffee: a review. Mutat. Res. 317(2):145-62.
147. Nehlig, A., (1999), Are we dependent upon coffee and caffeine? A review on
human and animal data. Neurosci. Biobehav. Rev. 23:563–76.
148. Nelson, D. R., (1995), in “Cytochrome P450: Structure, Mechanism and
Biochemistry, Ortiz de Montellano, P., Ed., 575–606, Plenum Press, New York.
149. Nelson, D.R., Koymans, L., Kamataki, T., Stegeman, J.J., Feyereisen, R.,
Waxman, D.J., Waterman, M.R., Gotoh, O., Coon, M.J., Estabrook, R.W.,
Gunsalus, I.C., Nebert, D.W., (1996), P450 superfamily: update on new
sequences, gene mapping, accession numbers and nomenclature.
Pharmacogenetics 1: 1–42.
150. Newcomb, M., Hollenberg, P. F., Coon, M. J., (2003), Multiple mechanisms and
multiple oxidants in P450-catalyzed hydroxylations. Arch. Biochem. Biophys.
409: 72–79.
151. O’Conell, F. D., (1969), Isolation of caffeine from Banisteriopsis inebrians
(Malpighiaceae). Naturwissenschaften. 56: 139.
152. Ogita, S., Uefuji, H., Yamaguchi, Y., Koizumi, N., Sano, H., (2003), Producing
decaffeinated coffee plants. Nature. 423: 823.
153. Omar, S., Usmani, Maria, G., Belvisi, Hema, J. P., Natascia, C., Mark, A. B.,
Marta, K., Dezso, K., Peter, J. B., (2005), Theobromine inhibits sensory nerve
activation and cough, FASEB. J. 19: 231-233.
154. Onrot, J., Goldberg, M. R., Biaggioni, I., Hollister, A. S., Kingaid, D.,
Robertson D., (1985), Hemodynamic and humoral effects of caffeine in
75
ePrin
t@CFT
RI
A Biotechnological Approach for Decaffeination Chapter 1
autonomic failure. Therapeutic implications for postprandial hypotension., N.
Engl. J. Med. 313(9):549-54.
155. Oudry, V., (1827), Thein, eine organische Salzbase im Three (Thea chinesis).
Mag. Pharm. 19: 49-50.
156. Ou-Yang, D. S., Huang, L., Wang, W., Xie, H. G., Xu, Z. H., Zhou, H. H.,
(2000), Phenotypic polymorphism and gender-related differences of CYP1A2
activity in a Chinese population. Br. J. Clin. Pharmacol. 49:141-151.
157. Pablos, M. J., Gonzalez. A. G. F., (1998), Discrimination between arabica and
robusta green coffee varieties according to their chemical composition. Talanta.
46:1259–64.
158. Patten, C. J., Thomas, P.E., Guy, R.L,, Lee, M., Gonzalez, F.J., Guengerich,
F.P., (1993), Cytochrome P450 enzymes involved in acetaminophen activation
by rat and human liver microsomes and their kinetics. Chem. Res. Toxicol.
6:511-518.
159. *Pelletier, M. J., (1826), Note sur la caféine. J. Pharm. 12: 229-233.
160. Persson, C. G. A., (1985), On the medical history of xanthines and other
remedies for asthma: a tribute to H. H. Salter. Thorax ; 40:881-6.
161. Petra.V., Pasman, W.J., Vliet, T.V., Urgert, R., Katan, M.B., (2002),
Contribution of caffeine to the homocysteine-raising effect of coffee: a
randomized controlled trial in humans, Amer. J. Clin. Nut. 76 (6): 1244-1248.
162. Pintauro, N.D., (1975), Coffee Solubilization: Commercial Process and
Techniques. Park Ridge: Noyes Data Corporation.
163. Pirmohamed, M., Williams, D., Madden, S., Templeton, E., Park, B. K., (1995),
Metabolism and bioactivation of clozapine by human liver in vitro.
J. Pharmacol. Exp. Ther. 272: 984-990.
164. Pizziol, V., Tikhonoff, C.D., Paleari, (1998), Effects of Caffeine on Glucose
Tolerance: A Placebo Controlled Study, European J. Clin. Nut. 52: 846-849.
76
ePrin
t@CFT
RI

A Biotechnological Approach for Decaffeination Chapter 1
165. Porres, C., Alvarez, D., Calzada, J,. (1993), Caffeine reduction in coffee pulp
through silage. Biotechnol. Adv. 11(3):519–23.
166. Poulos, T. L., Cupp-Vickery, J., Li, H. (1995), in “Cytochrome P450: Structure,
Mechanism and Biochemistry” Ortiz de Montellano, P., Ed., 125–150, Plenum
Press, New York.
167. Preusser, E., (Proiser, E.), Serenkov, G. P., (1963), Biokhimiya 28: 857-861.
168. Putrament, A., Baranowska, H., Bilinsky, T., Prazmo, W., (1972), On the
specificity of caffeine effects. Mol. Gen. 118:373–9.
169. Ramarethinam, S., Rajalakshmi, N., (2004), Caffeine in tea plants [Camellia
sinensis (L.) O. Kuntze]: in situ lowering by Bacillus licheniformis (Weigmann)
Chester. Indian J. Exp. Biol. 42(6):575–80.
170. Rao, K.L., Khanna, H.H., Cornish, (1973), Identification of two new
metabolites in rat urine. Experientia; 29:953–5.
171. Relling, M.V., Lin, J.S., Ayers, G. D., Evans, W. E., (1992), Racial and gender
differences in N-acetyltransferase, xanthine oxidase, and CYP1A2 activities.
Clin. Pharmacol. Ther. 52:643-658.
172. *Robiquet, (1823), Cafe. In: Dictionnarie technologique, Vol.4, (Thomine et
Fortic, Paris).
173. Rojas, J. B. U., Verreth, J. A. J., Amato, S., Huisman, E. S., (2003), Biological
treatments affect the chemical composition of coffee pulp. Bioresour. Technol.
89:267–74.
174. Rost, K. L., Brosicke, H., Heinemeyer, G., Roots, I., (1994a) Specific and dose
dependent enzyme induction by omeprazole in human beings. Hepatology.
20:1204-1212.
175. Rost, K. L., Roots, I., (1994b), Accelerated caffeine metabolism after
omeprazole treatment is indicated by urinary metabolite ratios: coincidence with
plasma clearance and breath test. Clin Pharmacol Ther. 55:402-411.
77
ePrin
t@CFT
RI
A Biotechnological Approach for Decaffeination Chapter 1
176. Rostami, H. A., Nurminen, S., Jackson, P. R., Tucker, G. T., (1996), Caffeine
urinary metabolite ratios as markers of enzyme activity: A theoretical
assessment. Pharmacogenetics. 6: 121-149.
177. Roussos, S., Angeles, A. M. D. L., Trejo, H. M. D. R., Gaime, P. I., Favela, E.,
Ramakrishna, M., (1995), Biotechnological management of coffee pulp-
isolation, screening, characterization, selection of caffeine degrading fungi and
natural microflora present in coffee pulp and husk. Appl Microbiol Biotechnol.
42:756–62.
178. *Runge, F., (1820), Phytochemische Entdeckungen, (Berlin) 204 .
179. Saldana, M. D. A., Mohamed, R. S. and Mazzafera, P., (2000), Supercritical
carbon dioxide extraction of methylxanthines from mate tea leaves, Braz. J.
Chem. Engg. 17 (3): 251-259.
180. Salmones, D., Mata, G., Waliszewski, K. N., (2005), Comparative culturing of
Pleurotus spp. on coffee pulp and wheat straw: biomass production and
substrate biodegradation. Bioresour Technol. 93:537–44.
181. Sarath Babu, V. R., Thakur, M. S., Karanth, N. G., (2003), A process for the
bio-decaffeination of solutions containing caffeine (428/Del/03, Columbia
patent applied).
182. Sarath Babu, V. R., Thakur, M. S., Karanth, N. G., (2006a), A bioreactor design
for enzymatic decaffeination (Patent Applied).
183. Sarath Babu, V. R., Thakur, M. S., Karanth, N. G., (2006b), A process for
enzymatic decaffeination of tea (Patent Applied).
184. Sarath Babu, V. R., Patra, S., Karanth, N. G., Varadaraj, M. C., Thakur M. S.,
(2005), Degradation of caffeine by Pseudomonas alcaligenes CFR 1708, Enz,
Microb. Tech. 37: 617-624.
185. Sauer, M., (1982), Comparison of the cytochrome P450 containing
monooxygenases originating from two different yeasts. Dev. Biochem. 23:.452-
457.
78
ePrin
t@CFT
RI
A Biotechnological Approach for Decaffeination Chapter 1
186. Schwimmer, S., Kurtzman, Jr., R. H., Heftmann, E., (1971), Caffeine
metabolism by Penicillium roqueforti. Arch Biochem Biophys; 147:109–13.
187. Sesardic, D., Boobis, A. R., Edwards, R. J., Davis, D. S., (1988), A form of
cytochrome P450 in man, orthologous to form in the rat, catalyse the O-
deethylation of phenacetin and is inducible by cigarette smoking. Br. J. Clin.
Pharmacol. 26:363-372.
188. Shilo, L., Sabbah, H., Hadari, R., Kovatz, S., Weinberg, U., Dolev, S., (2002),
The effects of coffee consumption on sleep and melatonin sectretion. Sleep
Med. 3:271–3.
189. Shimada, T., Martin, M. V., Pruess, S., D., Marnett, L. J., Guengerich, F. P.,
(1989), Roles of individual human cytochrome P-450 enzymes in the
bioactivation of benzo(a)pyrene, 7,8-dihydroxy-7,8-dihydrobenzo(a)pyrene, and
other dihydrodiol derivatives of polycyclic aromatic hydrocarbons. Cancer Res.
49: 6304-6312.
190. Shirley, K. L., Hon, Y. Y., Penzak, S. R., Lam, Y. W. F., Spratlin, V., Jann, M.
W., (2003), Correlation of cytochrome P450 (CYP) 1A2 activity using caffeine
phenotyping and olanzapine disposition in healthy volunteers,
Neuropsychopharmacology, 28: 961-966.
191. Shirlow, M. J., Mathers, C. D., (1985), A study of caffeine consumption and
symptoms; indigestion, palpitations, tremor, headache and insomnia. Int. J.
Epidemiol. 14(2):239-48.
192. Sideso, O. F. P., Marvier, A. C., Katerelos, N. A., Goodenough, P. W., (2001),
The characteristics and stabilization of a caffeine demethylase enzyme complex.
Int. J. Food Sci. Technol. 36:693–8.
193. Silva, C. F., Scwan, R. F., Dias, E. S., Wheals, A. E., (2000), Microbial
diversity during maturation and natural processing of coffee cheries of Coffea
arabica in Brazil. Int. J. Food Microbiol. 60: 251-260.
194. Silvarolla, M. B., Mazzafera. P., Fazuol, L. C., (2004), Plant biochemistry: a
naturally decaffeinated arabica coffee. Nature. 429(6994):826.
79
ePrin
t@CFT
RI
A Biotechnological Approach for Decaffeination Chapter 1
195. Srisuphan, W., Bracken, M. B., (1986), Caffeine consumption during pregnancy
and association with late spontaneous abortion. Am. J. Obstet. Gynecol.
154:14–20.
196. *Stenhouse, J., (1843a), Ueber Thein und seine Dartstellung. Liebig´s Ann.
Chem. 45:366-372.
197. *Stenhouse, J., (1843b), Nachträgliches über das Thein. Lieglig´s Ann. Chem.
46: 227-230.
198. Strecker, R. E., Morairty. S., Thakkar, M. M., Porkka, H. T., Basheer, R.,
Dauphin, L. J., Rainnie, D. G., Portas, C. M., Greene, R.W., McCarley, R.W.,
(2000), Adenosinergic modulation of basal forebrain and preoptic/anterior
hypothalamic neuronal activity in the control of behavioral state? Behavior
Brain Res., 115: 183-204.
199. Sundarraj, C. V., Dhala, S., (1965), Effect of naturally occurring xanthines on
bacteria (I). Antimicrobial action and potentiating effect on antibiotic spectra.
Appl. Microbiol. 13:432–6.
200. Suzuki, T., Takahasi, E., (1975), Biosynthesis of caffeine by tea leaf extracts,
enzyme formation of theobromine from 7-methyl xanthine and of caffeine from
theobromine. Biochem. J. 146:87–96.
201. Tagliari, C. V., Sanson, R. K., Zanette, A., Franco, T.T., Soccol, C. R., (2003),
Caffeine degradation by Rhizopus delemar in packed bed column bioreactor
using coffee husk as substrate. Braz. J. Microbiol. 34:102–4.
202. Tantcheva, P. I., Zaigler, M., Rietbrock, S., Fuhr, U., (1999), Estimation of
cytochrome P450 CYP1A2 activity in 863 healthy Caucasians using a saliva-
based caffeine test. Pharmacogenetics. 9:131-144.
203. Tarnopolsky, M. A., (1994), Caffeine and endurance performances. Sports Med.
18 (2): 109 – 125.
204. Tarrus, E., Cami, J., Roberts, D.J., Spickett, R.G., Celdran, E., Segura, J.,
(1987), Accumulation of caffeine in healthy volunteers treated with furafylline.
Br. J. Clin. Pharmacol. 23: 9-18.
80
ePrin
t@CFT
RI
A Biotechnological Approach for Decaffeination Chapter 1
205. Thelle, D. S., Arnesen, E., Forde, O. H., (1983), The Tromsø heart study. Does
coffee raise serum cholesterol? New Eng. J. Med. 308(24):1454-7.
206. Vitoria, A. P., Mazzafera, P., (1998), Caffeine degradation in fruits and leaves
of Coffea arabica and Coffeea dewevrei. Pesq. Agropec. Bras. 33:1957–61.
207. Vogels, G. D., Van der Drift, C., (1976), Degradation of purines and
pyrimidines by microorganisms. Bacteriol. Rev. 40: 403–468.
208. Wachenfeld, V. C., Jonson, E. F., (1995), Structures of eukaryotic P450s. In:
Ortiz de Montellano, P.R. (Ed.), Cytochrome P450: Structure, Mechanism, and
Biochemistry, 2nd Ed. Plenum Publishing Corp., New York, pp. 183–225.
209. Waller, G. R., (1989), Biochemical frontiers of allelopathy. Biol. Plant.
31: 418–447.
210. Walsh, I., Wasserman, G. S., Mestad, P., Lanman, R. C., (1987), Near-fatal
caffeine intoxication treated with peritoneal dialysis". Pediatr. Emerg. Care
3(4): 244-9.
211. Waring, W. S., Goudsmith, J., Marwick, J., Webb, D. J., Maxwell, S. R. J.,
(2003), Acute caffeine intake influences central more than peripheral blood
pressure in young adults. Am. J. Hypertens. 16: 919–24.
212. Wijhe, M. V., (2002), The history of caffeine as used in anaesthesia. Int.
Congr. Ser. 1242:101–3.
213. Willaman, J. J., Schubert, B. G., (1961), Alkaloid-bearing plants and their
contained alkaloids. Agric. Res. Serv., U.S. Dept. Agric., Tech. Bull. 1234:
1-287.
214. Woolfolk, C. A., Downard, J. S., (1977), Distribution of xanthine oxidase and
xanthine dehydrogenase specificity types among bacteria. J. Bacteriol. 130:
1175-1191.
215. Woolfolk, C. A., (1975), Metabolism of N- methylpurines by a Pseudomonas
putida strain isolated by enrichment on caffeine as the sole source of carbon and
nitrogen. J. Bacteriol. 123:1088-1106.
81
ePrin
t@CFT
RI
A Biotechnological Approach for Decaffeination Chapter 1
82
216. *Woskresensky, A. (1842) , Ueber das Theobromin. Liebig´s Ann. Chem. 41:
125-127.
217. Wreck, R. D., Feyereisen, R., (2000), Cytochrome P-450 a success story.
Genome Biol. 6(3003): 1–9.
218. Xu, Z. H., Zhou, H. H., (1996), Cytochrome P4501A2 in drug metabolism.
Chin. J. Clin. Pharmacol. 12:115-121.
219. Yano, Y. D. M., Mazzafera, P., (1998), Degradation of caffeine by
Pseudomonas putida isolated from soil. Allel. J. 5: 23–34.
220. Yano, Y. D. M., Mazzafera, P., (1999), Catabolism of Caffeine and Purification
of xanthine oxidase responsible for methyluric acids production in
Pseudomonas putida L. Revista de Microbiologia. 30: 62-70.
221. *Yano, Y. D. M., Mazzafera, P., (1996), Descafeinação da palha de café Por
bactérias. In: congresso brasileiro de pesquisas, Cafeeiras, 22., águas de lindóia,
1996. Resumos. Rio de janeiro: Ministério da agricultura e reforma agrarian
.36-39.
222. Yoshimoto, K., Echizen, H., Chiba, K., (1995), Identification of human CYP
isoforms involved in the metabolism of propranolol enantiomers- N-
desisopropylation is mediated by CYP1A2. Br. J. Clin. Pharmacol.
39:421-431.
223. Yuji, T., Nakahara, H., Kubo, H., Muraki, M., Fukuoka, M., Nakajima, S.,
(1998), Theophylline suppresses the release of interleukin-4 by peripheral blood
mononuclear Cells, Int. Arch. Aller. Immunol. 115:42-46.
224. Ziegler, D. M., (1988), Drug Metab. Rev. 19: 1–32.
225. Ziegler, D. M., (1993), Ann. Rev. Pharmacol. Toxicol. 33:179–199.
226. Zurek, J., Nicolas, F., Jeremy N. H., Adrian J.M., (2006), Mechanisms of
reaction in cytochrome P450: hydroxylation of camphor in P450cam, Org.
Biomol. Chem. 4: 3931-3937.
* Original reference not seen.
ePrin
t@CFT
RI
CHAPTER 2 ISOLATION AND CHARACTERIZATION OF CAFFEINE
DEGRADING BACTERIA
ePrin
t@CFT
RI
A Biotechnological Approach for Decaffeination Chapter 2
2.0. SCOPE OF THE WORK:
Caffeine (1,3,7-trimethylxanthine) was a molecule discovered by serendipity
and has been consumed worldwide since hundreds of years. The coffee plant has
evolved a defense mechanism to ward off pests, insects and to prevent competition
due to other plants by leaching the compound into the surrounding soil and water.
Many microorganisms have evolved mechanisms of surviving the inhibitory effect of
caffeine either by developing resistance to caffeine or by developing mechanisms to
use caffeine as a source of nitrogen and carbon. Several bacteria, fungi and a few
yeasts are known to degrade caffeine and have been growing in coffee and tea
plantation soils.
Harnessing the caffeine degrading potential of such organisms is of
importance in developing processes for biodecaffeination and production of
methylxanthine intermediates which have therapeutic value. This chapter deals with
the isolation, identification and characterization of bacteria capable of degrading
caffeine. The first section of the chapter presents a survey of literature on the isolation
of caffeine degrading microorganisms and the potential of these organisms in
developing microbial process for caffeine degradation. The second section of the
chapter deals with the methodologies used for the isolation, identification and
characterization of caffeine degrading bacteria, optimization of media, and physical
conditions for efficient biodegradation of caffeine by the selected isolates and the
third section of the chapter deals with studies on caffeine degradation by
Pseudomonas alcaligenes MTCC 5264, and the optimum conditions for the
degradation of caffeine by the isolate.
83
ePrin
t@CFT
RI
A Biotechnological Approach for Decaffeination Chapter 2
2.1. INTRODUCTION:
The purine alkaloid caffeine belonging to xanthines or methyl xanthines is
found in more than sixty plant species, with significant levels in coffee beans, tea,
cocoa, etc (Mazzafera et.al., 1991; Suzuki et al., 1992). Other two important alkaloids
of the xanthine derivative group are theobromine (3,7-dimethylxanthine) and
theophylline (1,3-dimethylxanthine) and are found in coco beans, tea leaves, mate
leaves, cola nuts and guarana seeds.
2.1.1. Caffeine and microorganisms:
Caffeine production by plants is known to be an evolutionary adaptation to
ward off predators, insects and microorganisms. Caffeine found in plants at doses
found in C. arabica is toxic to a variety of insects and fungi (Baumann and Gabriel,
1984; Nathanson, 1984; Frischknecht et al. 1986). Caffeine is known to be powerfully
allelopathic to many plants, insects and microorganisms. Caffeine is known to inhibit
the growth of plants and bacteria near the germinating seeds. Friedman and Waller
(1983a) showed that caffeine inhibits mitosis in the roots of many plants and thereby
reduces access to nutrients.
Since caffeine reduces root growth and kills most bacteria, it effectively kills
off any nearby competition for vital nutrients as well as protects itself from being
consumed by microbes (Friedman and Waller, 1983b). Caffeine's solubility in water
provides for simple transport into the nearby soil where inhibition of nearby
organisms will occur. High concentrations are required for bactericide action,
however, some microorganisms have the ability to grow in the presence of caffeine
and survival would be related to their capacity to degrade the alkaloid (Sundarraj and
84
ePrin
t@CFT
RI
A Biotechnological Approach for Decaffeination Chapter 2
Dhala, 1965). Actually, it is not rare to find bacterial strains resistant to caffeine
(Woolfolk, 1975).
The oxidation of purine forms xanthine which is the parent molecule for the
methylxanthines. There are three pyrrole type nitrogens which can be N-methylated to
form methylxanthines. If all three available pyrrole type nitrogen atoms are
methylated, the product is caffeine.
Several studies are reported in literature on the use of purines, including
caffeine, as a source of energy for microorganism growth (Mazzafera et. al., 1994a;
Middelhoven and Bakker, 1982; Schwimmer et. al., 1971; Woolfolk, 1975; Woolfolk
and Downard, 1977). A comprehensive review on purine utilization by
microorganisms was published by Vogels and Van der Drift (1976). Although fungi
growing on caffeine have been isolated, most of the studies were done with bacteria
isolated from soil, mainly those belonging to the Pseudomonads group, with
particular attention to Pseudomonas putida (Burr and Caesar, 1985).
Woolfolk (1975) used a Pseudomonas fluorescens strain with ability to grow
on caffeine to demonstrate dehydrogenase activity against both
monomethylxanthines. Blecher and Lingens (1977) studied degradation of caffeine by
P. putida strains isolated from soil. They identified 14 catabolites: theobromine,
paraxanthine, 7-monomethylxanthine, xanthine, 3,7-dimethyluric acid, 1,7-
dimethyluric acid, 7-methyluric acid, uric acid, allantoin, allantoic acid,
ureidoglycolic acid, glyoxylic acid, urea and formaldehyde.
Mazzafera et. al., (1994b) isolated a strain of Serratia marcescens from coffee
plantation soil having the capability to degrade caffeine. They observed that
85
ePrin
t@CFT
RI
A Biotechnological Approach for Decaffeination Chapter 2
demethylation of caffeine was the rate limiting step in the degradation of caffeine by
the microorganism. They found that caffeine was degraded to paraxanthine and/or
theobromine, and subsequently to 7-monomethylxanthine and xanthine.
Most studies on caffeine degradation by Pseudomonas use bacterial strains
obtained through a procedure known as enrichment. Caffeine was added to the soil
(Woolfolk, 1975) or culture medium (Blecher and Lingens, 1977; Hohnloser et. al.,
1980; Middlhoven and Lommen, 1984) to induce the appearance of mutants. In the
case of soil enrichment, caffeine was mixed to the soil and incubated for several
months. In the second case, using artificial media, caffeine was added in low
concentrations and the bacteria sub-cultured several times until mutants were
obtained. After that, bacteria were maintained in media containing caffeine as the sole
source of carbon. Gluck and Lingens (1987) isolated a P. putida strain by culturing
the bacteria with 20 g.L-1 of caffeine as the sole source of carbon and nitrogen.
Blecher and Lingens (1977) reported the growth of a P. putida strain in media
containing up to 50 g.L-1 caffeine in the culture media. Middelhoven and Bakker
(1982) grew the strain C32024 of P. putida at 20 g.L-1 of caffeine. However,
Mazzafera et. al., (1994b) and Yano and Mazzafera (1998) used a different approach,
and collected mutants in soil samples taken under coffee plants. Water was added to
the soil samples and after shaking for a few hours, aliquots were plated in solid
medium containing caffeine as the sole source of carbon and nitrogen. In the first
case, they isolated a S. marcescens strain (Mazzafera et. al., 1994b) and in the second
(Yano and Mazzafera, 1998), several P. putida strains and other bacteria.
86
ePrin
t@CFT
RI
A Biotechnological Approach for Decaffeination Chapter 2
A strain of P. putida isolated by Yano and Mazzafera (1998) showed an
impressive ability to grow in high concentrations of caffeine. Growth was observed at
25 g.L-1 in liquid medium and at 50 g.L-1 in solid medium. Yano and Mazzafera
(1999) studied the caffeine degradation pathway in this P. putida strain, and in
agreement with results previously obtained by Blecher and Lingens (1977), suggested
the degradation pathway showed in Figure 2.1.1.
Blecher and Lingens (1977) and Gluck and Lingens (1987) isolated P. putida
mutants with the ability to degrade caffeine to theobromine and attempted to block
the degradation of theobromine for commercial application. In contrast to these
authors, Asano et. al., (1993) were successful in isolating a P. putida strain where the
route of caffeine degradation could be blocked by addition of Zn to the culture
medium, accumulating theobromine.
Through inhibition of DNA repair in bacteria it has been shown that caffeine
can be mutagenic (Grigg, 1972; Kihlman, 1974). Caffeine at 0.1% concentration also
reversibly inhibits protein synthesis in bacteria and yeast. This effect is post
translational since caffeine does not affect RNA translation (Putrament et. al., 1972).
Sauer (1982) obtained indications that caffeine in yeast was degraded by cytochrome
P450, suggesting that the catabolic pathway might be similar to animals. In humans,
several cytochrome P-450 isoforms are responsible for caffeine degradation (Berthou
et. al., 1992). Schwimmer et. al., (1971), reported that the degradation of caffeine to
theophylline in fungi, and Blecher and Lingens (1977), who studied degradation of
caffeine to theobromine in bacteria, do not indicate participation of P-450 on caffeine
degradation mechanism.
87
ePrin
t@CFT
RI
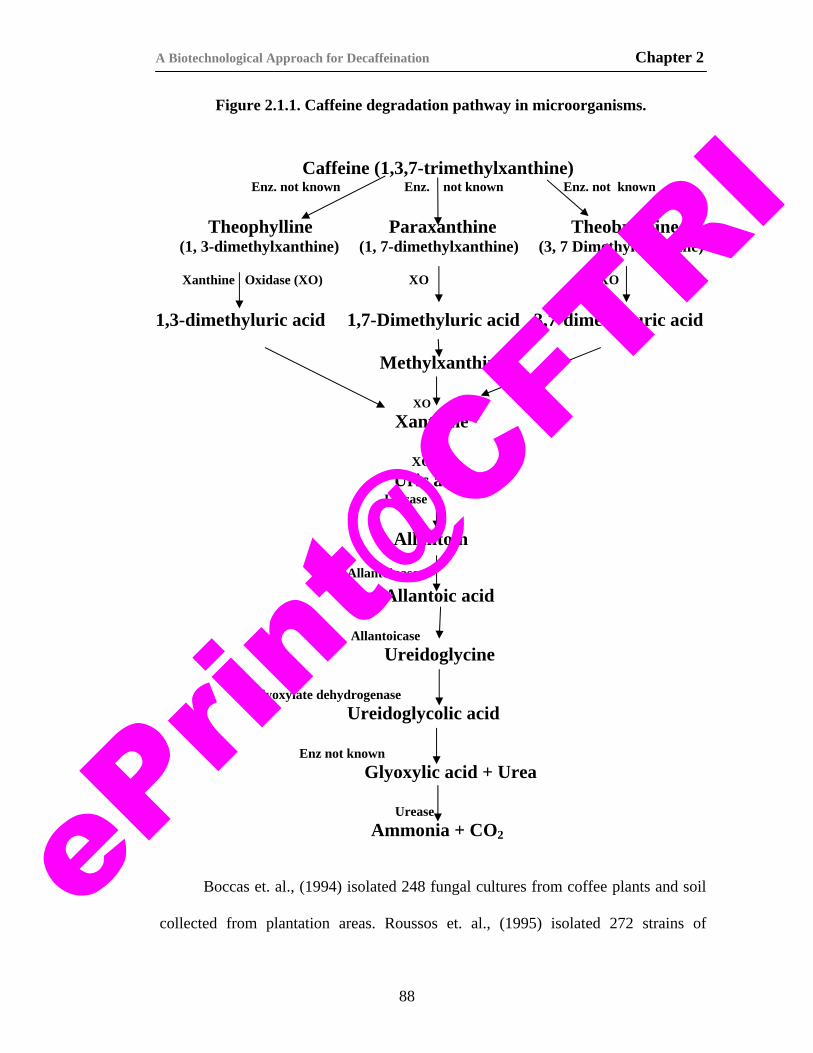
A Biotechnological Approach for Decaffeination Chapter 2
Figure 2.1.1. Caffeine degradation pathway in microorganisms.
Caffeine (1,3,7-trimethylxanthine) Enz. not known Enz. not known Enz. not known Theophylline Paraxanthine Theobromine (1, 3-dimethylxanthine) (1, 7-dimethylxanthine) (3, 7 Dimethyl xanthine) Xanthine Oxidase (XO) XO XO 1,3-dimethyluric acid 1,7-Dimethyluric acid 3,7-dimethyluric acid Methylxanthine
XO
Xanthine
XO Uric acid Uricase Allantoin
Allantoinase
Allantoic acid Allantoicase Ureidoglycine Glyoxylate dehydrogenase Ureidoglycolic acid Enz not known
Glyoxylic acid + Urea
Urease Ammonia + CO2
Boccas et. al., (1994) isolated 248 fungal cultures from coffee plants and soil
collected from plantation areas. Roussos et. al., (1995) isolated 272 strains of
88
ePrin
t@CFT
RI

A Biotechnological Approach for Decaffeination Chapter 2
filamentous fungi from soil, fruits and leaves using a culture media containing coffee
extract, coffee extract plus sucrose, and coffee pulp extract. The fungi strains with
the highest ability to degrade caffeine were identified as Aspergillus and Penicillium.
Yano and Mazzafera (1998) isolated more than 20 bacteria strains from soil collected
under coffee plants, observing predominance of Pseudomonas sp., which was also
the most efficient caffeine degrader. Silva et. al., (2000) studied the diversity of
microbial populations during the maturation and natural processing (sun-dried) of
coffee fruits during two consecutive years. A total of 754 isolates of bacteria, yeast
and fungi were obtained. Bacteria were the predominant microorganisms.
Fermentative bacteria and yeast, cellulolytic bacteria, and pectinolytic bacteria, yeast
and filamentous fungi were identified among 626 microorganisms. Porres et. al.,
(1993) have studied the ensilation of coffee pulp and the effect of addition of sugar
cane molasses on caffeine degradation. In the case of treatment with 5% molasses
63% caffeine was degraded in the pulp and in the absence of the treatment only 13%
of the caffeine was degraded. Reduction in caffeine from 13-63% was observed, with
the highest reduction in the treatment with 5% of molasses. In the case of
compressed silage very low caffeine degradation was observed. Coffee pulp is
considered to be the major polluting agent of rivers and lakes located near the coffee-
processing regions (Roussos et. al., 1995). For environmental protection and
economic gain, attempts have been made in the past to utilize coffee pulp, but were
not successful due to the presence of anti-physiological factors such as caffeine,
tannins, chlorogenic acid and high levels of potassium (Bressani 1987a, 1987b).
Work has been carried out in our laboratory at CFTRI on the biodecaffeination of
89
ePrin
t@CFT
RI

A Biotechnological Approach for Decaffeination Chapter 2
coffee processing wastes such as coffee pulp, coffee hulls and spent coffee. Caffeine
could be completely degraded in these coffee wastes and edible mushrooms could be
grown on these substrates with high protein and free amino acid content. The coffee
processing wastes were also used for the production of biofertilizers through
vermicomposting and bioferttilizer from these wastes was found to have high NPK
and organic carbon content. These wastes after the growth of mushrooms and
earthworms were found to contain less antinutritional factors like tannins.
Accurate knowledge about the nature and characteristics of coffee pulp natural
microflora is of utmost importance for its further utilization in the development of
biodecaffeination process for caffeine containing materials and in the isolation and
identification of potent caffeine degrading strains.
The consumption of decaffeinated products like coffee, tea and chocolate is
increasing world over. Several processes based on organic solvents and super critical
carbon dioxide have been developed for the decaffeination of coffee and tea. These
methods are either unsafe to the human health and environment or too expensive.
The need for safe and eco-friendly decaffeination processes has given rise to the
novel concept of Biodecaffeination, where enzymes are employed for the
decaffeination. These processes are safe, preserve the quality of the decaffeinated
products and are eco friendly. The development of biodecaffeination processes
necessitates the isolation of enzymes capable of degrading caffeine and its
metabolites from microorganisms capable of degrading caffeine. Several
microorganisms present in the vicinity of the caffeine containing plants like coffee
and tea have developed mechanisms to overcome the toxic effects of caffeine by
90
ePrin
t@CFT
RI
A Biotechnological Approach for Decaffeination Chapter 2
producing enzymes responsible for degrading caffeine. Screening for
microorganisms and selection of potent biodecaffeinating microorganisms is
important to develop processes for biodecaffeination. The optimum conditions for
the growth and production of biodecaffeinating enzymes by the selected isolates have
to be determined. This chapter reports the isolation, purification and characterization
of caffeine degrading bacteria from coffee plantation soils. Studies on the
degradation of caffeine by the organisms and the selection of a caffeine degrader are
also reported. This chapter also describes the optimization of media and physical
conditions for the production of biodecaffeinating enzymes by the selected isolate.
91
ePrin
t@CFT
RI
A Biotechnological Approach for Decaffeination Chapter 2
2.2. MATERIALS AND METHODS:
Caffeine, theobromine, paraxanthine and methyl xanthines were purchased
from Sigma Chemicals, St. Louis, USA. Nutrient broth, nutrient agar, citrate agar,
peptone, yeast extract, and other chemicals for identification of bacterial isolates
were procured from Hi Media labs, Mumbai, India. Sodium dihydrogen
orthophosphate, di sodium hydrogen ortho phosphate, ferric chloride, zinc sulphate,
sodium molybdate, manganese tetra oxide, magnesium oxide, sodium hydroxide,
hydrochloric acid and other chemicals were of analytical grade and procured from
Qualigenes Fine Chemicals, Mumbai. HPLC grade acetonitrile and methanol were
procured from Merck, Germany. All other chemicals were of the highest purity and
were procured from standard sources.
2.2.1. Isolation of caffeine degrading bacteria from soil:
Soil was collected under tea plants growing at the tea plantations at Gudalur,
Udhagamandalam District, Tamilnadu and from Chamundi Coffee Curing Works,
Mysore, Karnataka. Leaves and debris were removed from the soil surface, and the
topmost 15-cm layer was collected. A medium designated as M9 (Table 2.2.7.1) after
modification with supplementation of 0.3 g.L-1 caffeine was used for screening. For
enrichment of isolates capable of degrading caffeine as well as for induction of the
organism, the following medium designated as Caffeine Liquid Medium (CLM) was
used which contained the following constituents in (g.L-1) Na2HPO4.7H2O, 6.4;
KH2PO4, 1.5; NaCl, 0.25; NH4Cl, 0.5, and Caffeine, 0.3. The pH of the medium was
adjusted to 7.2 with 0.1N NaOH. CLM was used as the growth medium with caffeine
as the sole source of carbon and nitrogen.
92
ePrin
t@CFT
RI
A Biotechnological Approach for Decaffeination Chapter 2
In the laboratory 1 g of soil was mixed with 50 ml of CLM in a 250-ml flask
and agitated for 72 hrs (150 rpm), at room temperature (28±2°C). Caffeine agar
medium was prepared by addition of 2.5% agar to CLM and poured into petri plates.
Serial dilutions (10-1 to 10-9) of the above grown culture were then made and 0.1 ml
of the same was inoculated on to each petri plate and incubated at 37oC for 2 days.
Isolated single colonies growing on the above plates were purified further to obtain
pure cultures. The caffeine degrading isolates were initially designated as T1, T2 and
T3. These purified cultures were inoculated on to fresh slants of caffeine agar
medium with subsequent sub culturing.
Single colonies were transferred to new caffeine agar plates, and colonies
growing on these plates were transferred once more to a new set of plates.
2.2.2. Identification of bacteria:
The bacterial isolates were characterized by biochemical tests according to
Bergey’s manual of determinative bacteriology. The following tests were conducted
for the identification of the bacterial isolates.
Catalase, oxidase, nitrate reduction, indole production, methyl red test, voges
proskauer test, starch hydrolysis, citrate utilization, oxidation, fermentation, motility,
malonate utilization, arginine dihydrolase, gelatin hydrolysis, growth at 410C, growth
at 40C, acid slant, acid butt, alkaline slant, gas production, urease, dextrose utilization,
mannitol utilization and polyhydroxy alkanoate (PHA) accumulation.
The results of these tests were reported as either positive or negative and
identification was based on these tests.
93
ePrin
t@CFT
RI

A Biotechnological Approach for Decaffeination Chapter 2
2.2.3. Studies on bacterial growth in caffeine as the sole source of carbon and nitrogen:
The ability of the bacteria to grow in liquid medium containing caffeine was
tested. Pure, isolated single colonies from caffeine containing plates were used as
inoculum. Bacterial growth was also investigated in caffeine at 1000, 2000, 4000, and
5000 mg.L-1. Three replicates were made for each concentration. Bacterial growth
was followed by measuring the optical density at 600 nm in 1-ml aliquots taken from
the flasks. These samples were centrifuged at 14,000 rpm in a bench-top centrifuge,
and the supernatant was stored at -21°C until analysis for methylxanthine
concentrations.
2.2.4. Estimation of methylxanthines by high performance liquid chromatography (HPLC):
HPLC analysis of caffeine was performed in a Shimadzu LC 10 A- HPLC
system, and the methyl xanthine compounds were separated on a C18 ODS-Luna
column under isocratic conditions with 15 % acetonitrile in water at a flow rate of 1.0
ml/min. Compounds eluting from the column were detected at 273 nm, and the peak
areas were compared with those obtained with standards of known concentration.
2.2.5. Growth of cells and induction for caffeine degradation:
A loop full of actively growing culture of the isolate from the culture slant was
transferred to 100ml of nutrient broth containing 0.3 g.L-1 caffeine and incubated at
30oC in an orbital shaker for 24 hrs. A 5% v/v of the 24 hrs grown pre inoculum was
transferred to 100ml of nutrient broth containing 0.3 g.L-1 caffeine and grown under
the same conditions.
94
ePrin
t@CFT
RI
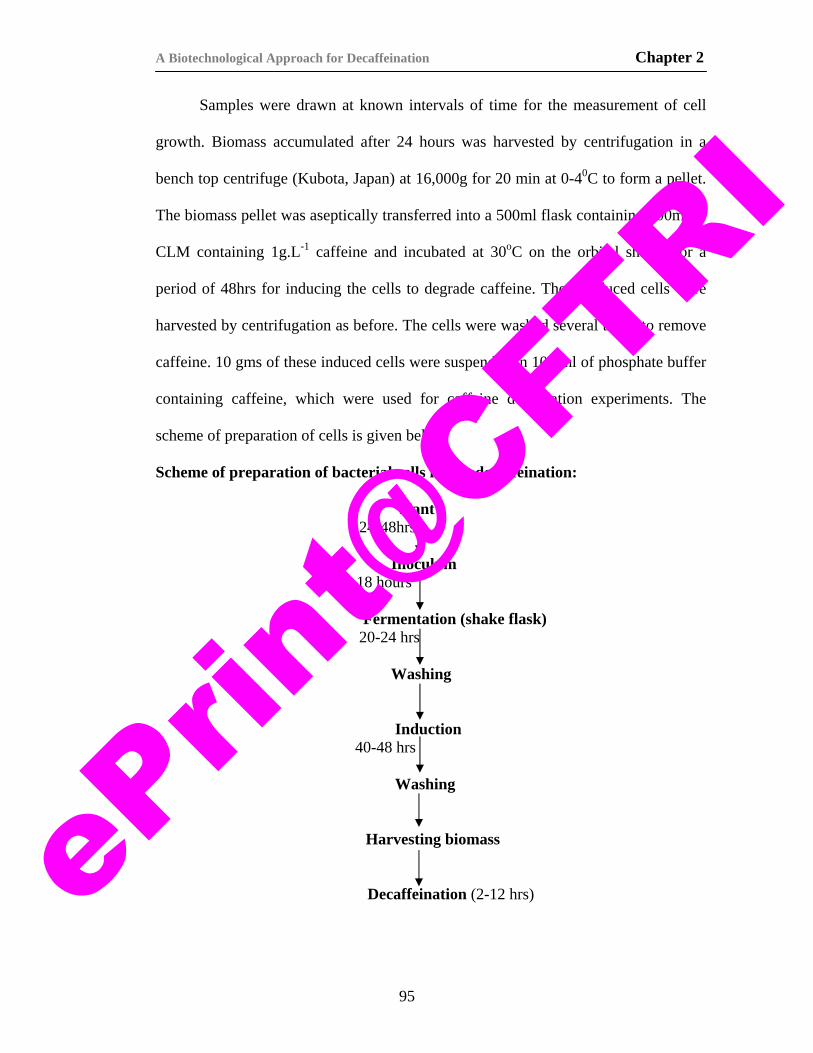
A Biotechnological Approach for Decaffeination Chapter 2
Samples were drawn at known intervals of time for the measurement of cell
growth. Biomass accumulated after 24 hours was harvested by centrifugation in a
bench top centrifuge (Kubota, Japan) at 16,000g for 20 min at 0-40C to form a pellet.
The biomass pellet was aseptically transferred into a 500ml flask containing 100ml of
CLM containing 1g.L-1 caffeine and incubated at 30oC on the orbital shaker for a
period of 48hrs for inducing the cells to degrade caffeine. These induced cells were
harvested by centrifugation as before. The cells were washed several times to remove
caffeine. 10 gms of these induced cells were suspended in 100 ml of phosphate buffer
containing caffeine, which were used for caffeine degradation experiments. The
scheme of preparation of cells is given below.
Scheme of preparation of bacterial cells for biodecaffeination:
Slant 24-48hrs
Inoculum 12-18 hours
Fermentation (shake flask) 20-24 hrs
Washing
Induction 40-48 hrs
Washing
Harvesting biomass
Decaffeination (2-12 hrs)
95
ePrin
t@CFT
RI
A Biotechnological Approach for Decaffeination Chapter 2
2.2.6. Caffeine degradation experiments:
10 ml of the induced cell suspension was aseptically transferred to 90ml of
CLM containing 1g.L-1 caffeine and incubated on a rotary shaker at 30oC for 24
hours. 0.5 ml aliquot samples were drawn at 2, 4, 6 and 24 hours, centrifuged and the
supernatants were analyzed for caffeine content. Studies on the effect of pH and
temperature on caffeine degradation by the isolate were carried out by incubating the
induced cells in CLM containing 1g.L-1 caffeine, which was adjusted to different pH
and temperature.
For studying the effect of inoculum on caffeine degradation, induced cell
suspension was added to CLM containing 1g.L-1 caffeine so as to obtain inoculum
levels of 1.2, 2.5, 5.0 and 7.5%w/v (based on wet weight of cells). Studies on the
effect of caffeine concentration on the efficiency were carried out by incubating the
induced cells in CLM containing caffeine in the concentration range of 1-5 g.L-1.
Samples were drawn at known intervals of time and analyzed for caffeine content and
calculations of the residual caffeine content were made on the basis of the final
volume after drawing the sample. Percentage caffeine degradation was calculated as
follows:
% Caffeine degradation = (a- b) x 100/a Eqn.1
where, a = initial caffeine concentration, and
b = residual caffeine concentration
2.2.7. Optimization of parameters for growth and caffeine degradation by isolate T2:
The development of Biodecaffeination processes demands high enzymatic
activity expressed by the organism during the course of the fermentation. So,
96
ePrin
t@CFT
RI
A Biotechnological Approach for Decaffeination Chapter 2
selection of a suitable media, with carbon, nitrogen and other nutrient sources,
optimum conditions like pH, temperature, inoculum age, volume etc need to be
determined for maximum enzyme production in the cells. Therefore studies on the
optimization of conditions for growth and decaffeination by the organism were
carried out.
2.2.7.1. Screening of media:
The following 21 different media were initially screened for the growth and
caffeine degrading efficiency by the isolate P. alcaligenes MTCC 5264.
The composition of media is given in Table 2.2.7.1, below (g.L-1). The pH of all the
media was adjusted to 7.0, and sterilized at 1210C for 15 min at 15 PSI, cooled and
inoculated with a loop full of actively growing culture of P. alcaligenes MTCC 5264.
Table 2.2.7.1. Composition of media screened for caffeine degradation and growth of P. alcaligenes MTCC 5264.
Media Composition (g.L-1), pH 7.0
M1. Nutrient Broth Peptones 5.0 Yeast extract 3.0 Sodium chloride 6.0 Beef Extract 15.0
M2. Czepek-Dox broth Sucrose 30.0 NaNO3 3.0 K2HPO4 1.0 MgSO4.7H2O 0.5 KCl 0.5 FeSO4.7H2O 0.01
M 3. Defined Medium Sucrose 10.0 K2HPO4 2.5 KH2PO4 2.5 (NH4)2HPO4 1.0 MgSO4 7H2O 0.20 FeSO4 7H2O 0.01 MnSO4 H2O 0.007
M4. O-Brien Synthetic media Glucose 20.0 Glycine 2.6 Sodium acetate 1.36 (NH4)2SO4 0.54 K2HPO4.3H2O 0.05 ZnSO4.7H2O 0.03 FeSO4.7H2O 0.025 CuSO4.5H2O 0.016 MnSO4.4H2O 0.012 CaCl2. 2H2O 0.05 MgSO4.7H2O 0.05
97
ePrin
t@CFT
RI
A Biotechnological Approach for Decaffeination Chapter 2
M 5. Glucose- NH4SO4 Medium : Glucose 50.0 Na2HPO4.12 H2O 16.0 KH2PO4 2.96 NH4SO4 5.0 MgSO4 1.0 FeSO4 0.0002
M6. Dulaney’s medium Glucose 10.0 NaCl 5.0 K2HPO4 2.0 MgSO4.7H2O 0.4 CaCl2 0.4 FeSO4.7H2O 0.02 ZnSO4.7H2O 0.01 (NH4)2HPO4 4.0
M 7. Complex organic media Glucose 25.0 Yeast extract 3.0 (NH4)2SO4 2.0 CaCO3 2.0 NaCl 2.0 KH2PO4
M8. Hobb’s medium Glucose 20.0 NaCl 5.0 Na2SO4 5.0 NaNO3 4.5 K2HPO4 1.2 Trisbase 1.2 MgSO4.7H2O 1.0 ZnSO4 0.01
M 9. Gause Mineral Salt Medium Starch 20.0 KNO3 1.0 K2HPO4 0.5 MgSO4 x 7H2O 0.5 NaCl 0.5 FeSO4 0.01
M 10. Lindenberg Synthetic Media Glycerol 30.0 NaNO3 2.0 K2HPO4 1.0 MgSO4.7H2O 0.5 FeSO4.7H2O 0.4
M11. Tryptone Commercial Sugar medium Tryptone 1.5 Yeast extract 3.0 Sucrose 10.0 KH2PO4 1.5
M12. Tryptone Yeast Extract Medium: Tryptone 1.5 Yeast extract 3.0 Peptone 6.0 Glucose 1.0
M 13. Production media II: Soyabean Meal 20.0 (NH4)2SO4 5.0 Meat Extract 4.0 Yeast Extract 2.5 Glucose 6.0 KCl 4.0 CaCO3 0.1 K2HPO4 0.1
M14. Production media III Yeast extract 4.0 Glucose 20.0 Peptone 4.0 (NH4)2SO4 5.0
98
ePrin
t@CFT
RI
A Biotechnological Approach for Decaffeination Chapter 2
M 15. Synthetic Medium II: Fructose 5.0 NH4Cl 0.52 KH2PO4 0.28 MgSO4 7H2O 0.25 CaCl2 2H2O 0.07
M16. Synthetic medium III D-glucose 12.0 yeast extract 1.5 malt extract 1.5 peptone 2.5 (NH.4)2 HPO4 1.5 K2 HPO4 2.5 MgSO4 0.05
M 17. Growth Medium Sucrose 20.0 Yeast Extract 2.6 Peptone 3.00 (NH4)2SO4 1.54 FeSO4.7H2O 0.03 CuSO4.5H2O 0.5 K2HPO4 0.5
M18. MS Medium KH2PO4 2.3 NaHPO4 .2H2O 2.9 NH4Cl 1.0 MgSO4 .7H2O 0.005 NaHCO3 0.005 Fe(NH4) citrate 0.05 Trace element solution 5.0 ml
M 19. Xanthine MS Medium Xanthine 1.0 KH2PO4 2.3 NaHPO4. 2H2O 2.9 NH4Cl 1.0 MgSO4. 7H2O 0.005 NaHCO3 0.005 Fe(NH4) citrate 0.05 Trace element solution 5.0 ml
M 20. M9-medium Na2HPO4 6.0 KH2PO4 3.0 NaCl 0.5 NH4Cl 1.0
M 21. Trypticase Soy Broth
Trypticase peptone 17.0 Phytone peptone 3.0 NaCl 5.0 K2HPO4 2.5 Glucose 2.5
All the above media were modified by the addition of 1.0 g.L-1 of caffeine. A
loop full of the actively growing culture of the bacteria was inoculated in to the media
and incubated on a shaker at 150rpm at a temperature of 30±2oC for 96 hours.
Samples were drawn at 12 hours intervals and the growth was recorded as an increase
in the absorbance of the medium at 600nm. The sample was then centrifuged, and the
99
ePrin
t@CFT
RI
A Biotechnological Approach for Decaffeination Chapter 2
pellet was dried on a Whatman filter paper (No.1) in an oven at 60oC for 8 hrs and the
dry weight was recorded. Caffeine degradation was followed by HPLC analysis of the
residual caffeine present in the medium.
2.2.7.2. Effect of carbon source on caffeine degradation isolate T2:
Carbon sources are required for the basic metabolic activities, growth and
modulating the organisms’ metabolic activities either enabling them to use a substrate
such as caffeine or regulating the uptake of the substrate itself. Therefore careful
selection of a suitable carbon source is very important in the development of a
bioprocess like decaffeination. Fructose, sucrose, glucose, inulin, sorbose, cellobiose,
raffinose and starch were checked for their suitability as the carbon sources for
growth as well as caffeine degradation by the organism. The carbon sources were
added individually at 10g.L-1 concentrations into caffeine liquid medium, which
served as the basal medium for the studies. The media was sterilized and a loopfull
of actively growing culture of P. alcaligenes MTCC 5264 was inoculated into the
medium and incubated on a shaker at 150rpm at a temperature of 30± 2oC for 96
hours. Samples were drawn at 12 hours intervals and the growth was recorded as an
increase in the biomass by weight. Caffeine degradation was followed by HPLC
analysis of the residual caffeine present in the medium.
2.2.7.3. Effect of nitrogen source on caffeine degradation isolate T2:
The various organic nitrogen sources tried were yeast extract, tryptone,
peptone and beef extract. The inorganic nitrogen sources tried were ammonium
nitrate, ammonium sulphate and urea. The nitrogen sources were added individually
at 10 g.L-1 concentrations into caffeine liquid medium, which served as the basal
100
ePrin
t@CFT
RI
A Biotechnological Approach for Decaffeination Chapter 2
medium for the studies. The media was sterilized and a loop full of actively growing
culture of P. alcaligenes MTCC 5264 was inoculated into the medium and incubated
on a shaker at 150rpm at a temperature of 30± 2oC for 96 hours. Samples were drawn
at 12 hours intervals and the growth was recorded as an increase in the biomass by
weight. Caffeine degradation was followed by HPLC analysis of the residual caffeine
in the medium. The optimum concentration of each of the suitable nitrogen source
was also determined.
2.2.7.4. Effect of pH on caffeine degradation isolate T2:
pH plays an important role on the growth and activity of different enzymes
required for caffeine degradation. The optimization studies were carried out with
respect to the maximum rate of caffeine degradation where biomass growth and
caffeine utilization were maximum. 100 ml of the CLM was adjusted to pH in the
range of 4.0-9.0 in 500ml Erlenmeyer flasks was inoculated with a loop full of
actively growing culture of P. alcaligenes MTCC 5264 and incubated at 30oC for 96
hrs on an incubator shaker at 150 rpm. The growth and caffeine degradation were
recorded as increase in the biomass by weight and residual caffeine analysis of the
samples drawn at 12 hr intervals by HPLC.
2.2.7.5. Effect of temperature on caffeine degradation by isolate T2:
Temperature is an important parameter for achieving efficient
biodecaffeination and has a drastic effect on the activities of the enzymes involved in
biodecaffeination. 100 ml of the CLM was adjusted to pH 7.0, was inoculated with a
loop full of actively growing culture of P. alcaligenes MTCC 5264 and incubated at
different temperatures in the range of 20-60oC for 96 hrs on an incubator shaker at
101
ePrin
t@CFT
RI
A Biotechnological Approach for Decaffeination Chapter 2
150 rpm. The growth and caffeine degradation were recorded as increase in the
biomass by weight and residual caffeine analysis of the samples drawn at 12 hr
intervals by HPLC.
2.2.7.6. Effect of caffeine concentration on caffeine degradation by isolate T2:
Caffeine is known to be toxic to micro-organisms at high concentrations and
the efficient biodecaffeination demands the selection of a threshold level of caffeine
which the organisms can tolerate and degrade efficiently. Therefore the optimum
caffeine concentration for biodecaffeination was checked by incubating the organism
in CLM containing caffeine in the concentration range of 0.5 g.L-1 to 5 g.L-1 and
recording the growth and caffeine degradation according to the above experiments.
2.2.7.7. Effect of inoculum volume on caffeine degradation by isolate T2:
Initial Inoculum volume gives a measure of the number of cells at the start of
the Biodecaffeination process in the liquid culture. An optimum initial cell
concentration is essential for overcoming the initial lag phase by the organism in
CLM. Therefore a 24 hrs old inoculum was prepared and inoculated into fresh CLM
flask in the range of 1-10 % v/v, incubated at 30±2 oC for 96 hours and the growth
and caffeine degradation were followed as above.
102
ePrin
t@CFT
RI
A Biotechnological Approach for Decaffeination Chapter 2
2.3. RESULTS AND DISCUSSION:
2.3.1. Isolation of caffeine degrading bacteria:
Initially the screening was carried out in nutrient medium containing caffeine
at a lower concentration (0.3g.L-1). Active growth of bacteria was observed in
caffeine plates receiving the soil filtrate. When transferred to a new set of caffeine
plates containing 1.0g.L-1 caffeine, most of the bacterial colonies did not grow,
indicating that residues from the soil filtrate were supplying nutrients for growth in
the first plating.
Further selection of efficient caffeine degraders was achieved by enrichment
technique and only three bacterial strains were found to grow on the caffeine enriched
plates indicating that these organisms are resistant to caffeine and have the capability
to degrade caffeine.
The three bacterial strains (initially designated as T1, T2 and T3) capable of
growing on caffeine agar were selected for decaffeination studies. Based on the
biochemical tests and by referring the results with Bergey’s manual of determinative
Bacteriology, they were identified as Alcaligenes fecalis (T1), Pseudomonas
alcaligenes MTCC 5264 (T2) and Acetobacter sps. (T3) (Table 2.3.1.1).
103
ePrin
t@CFT
RI
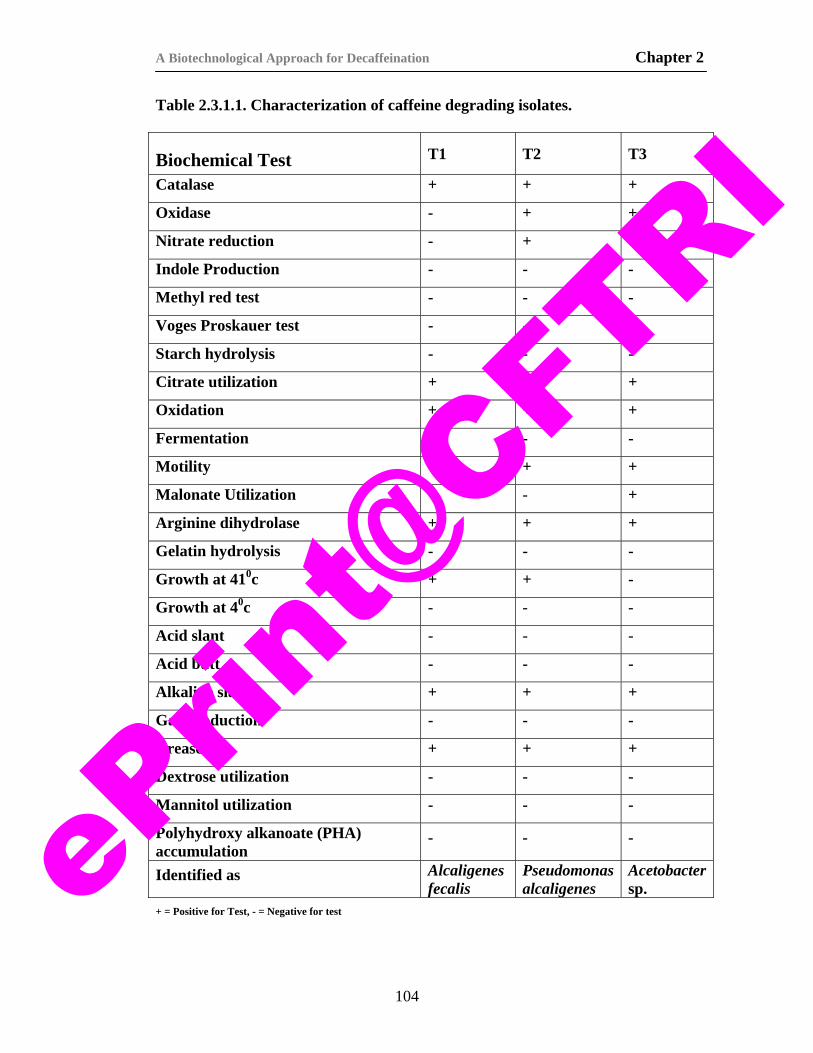
A Biotechnological Approach for Decaffeination Chapter 2
Table 2.3.1.1. Characterization of caffeine degrading isolates.
Biochemical Test T1 T2 T3
Catalase + + +
Oxidase - + +
Nitrate reduction - + -
Indole Production - - -
Methyl red test - - -
Voges Proskauer test - - -
Starch hydrolysis - - -
Citrate utilization + + +
Oxidation + + +
Fermentation + - -
Motility + + +
Malonate Utilization + - +
Arginine dihydrolase + + +
Gelatin hydrolysis - - -
Growth at 410c + + -
Growth at 40c - - -
Acid slant - - -
Acid butt - - -
Alkaline slant + + +
Gas production - - -
Urease + + +
Dextrose utilization - - -
Mannitol utilization - - -
Polyhydroxy alkanoate (PHA) accumulation
- - -
Identified as Alcaligenes fecalis
Pseudomonas alcaligenes
Acetobacter sp.
+ = Positive for Test, - = Negative for test
104
ePrin
t@CFT
RI
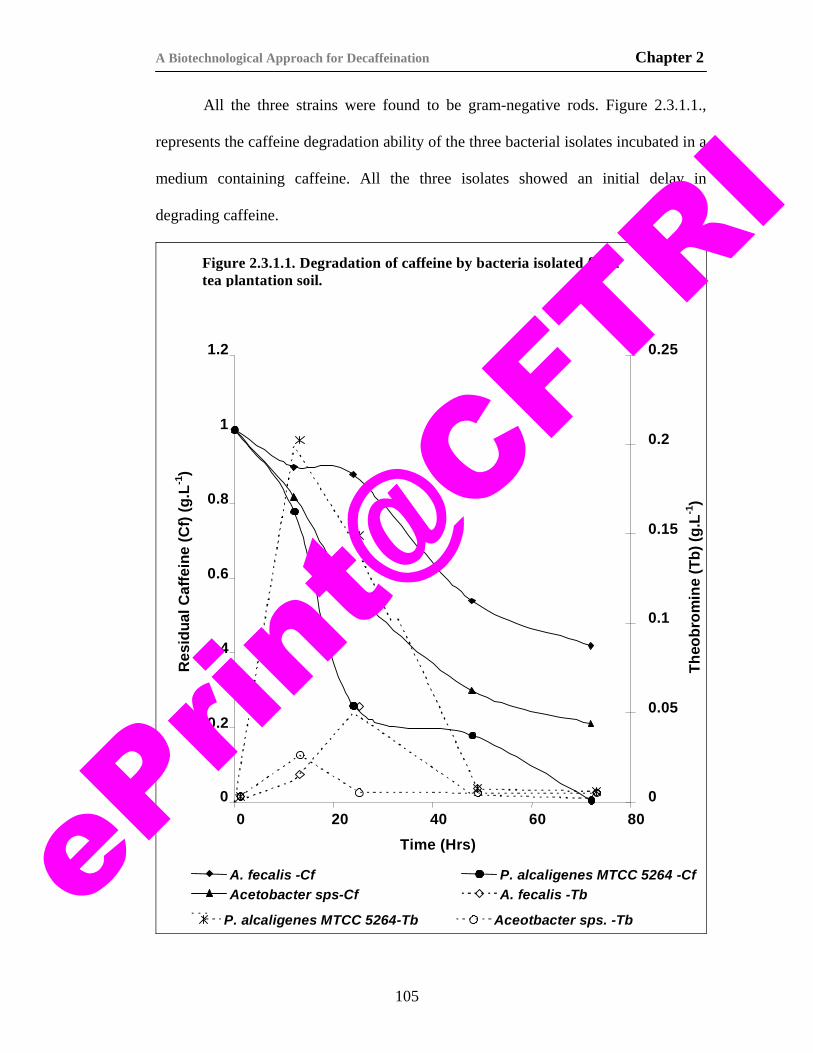
A Biotechnological Approach for Decaffeination Chapter 2
All the three strains were found to be gram-negative rods. Figure 2.3.1.1.,
represents the caffeine degradation ability of the three bacterial isolates incubated in a
medium containing caffeine. All the three isolates showed an initial delay in
degrading caffeine.
Figure 2.3.1.1. Degradation of caffeine by bacteria isolated from tea plantation soil.
0
0.2
0.4
0.6
0.8
1
1.2
0 20 40 60 80
Time (Hrs)
Res
idua
l Caf
fein
e (C
f) (g
.L-1
)
0
0.05
0.1
0.15
0.2
0.25
Theo
brom
ine
(Tb)
(g.L
-1)
A. fecalis -Cf P. alcaligenes MTCC 5264 -Cf Acetobacter sps-Cf A. fecalis -Tb
P. alcaligenes MTCC 5264-Tb Aceotbacter sps. -Tb
105
ePrin
t@CFT
RI

A Biotechnological Approach for Decaffeination Chapter 2
Only 11% of the initial caffeine was degraded by A. fecalis within the first 12
hours of incubation, whereas P. alcaligenes MTCC 5264 and Acetobacter sps.
degraded 22 and 18% of the initial caffeine within 12 hours of incubation.
In the case of P. alcaligenes, the degraded caffeine was found to accumulate
as theobromine (199mg.L-1) whereas the corresponding values for the other two
strains were below 20mg.L-1 within the same time of incubation. The rate of
degradation of caffeine as well as theobromine increased with an increase in time of
incubation and 74% of the initial caffeine was degraded by P. alcaligenes within 24
hrs of incubation. The corresponding caffeine degradation rates in the other two
isolates were 12 and 43% for A. fecalis and Acetobacter sps. respectively. 99% of the
initial caffeine was degraded by P. alcaligenes within 72 hours of incubation whereas
only 40% caffeine was degraded by A. fecalis and 79% caffeine was degraded by
Acetobacter Sp. within the same time.
Of the three isolates P. alcaligenes MTCC 5264 (strain T2) was found to be
the best caffeine degrader and was selected for further studies (Fig.2.3.1.1). Purified
culture of P. alcaligenes MTCC 5264 growing on caffeine agar plate is shown in
Figure 2.3.1.2a., and on Nutrient agar is shown in Figure 2.3.1.2b. The isolate could
grow in caffeine agar plates containing 50bg.L-1 of caffeine. Zones of clearance are
found around the colonies indicating that the organism has utilized the caffeine in the
plates.
106
ePrin
t@CFT
RI
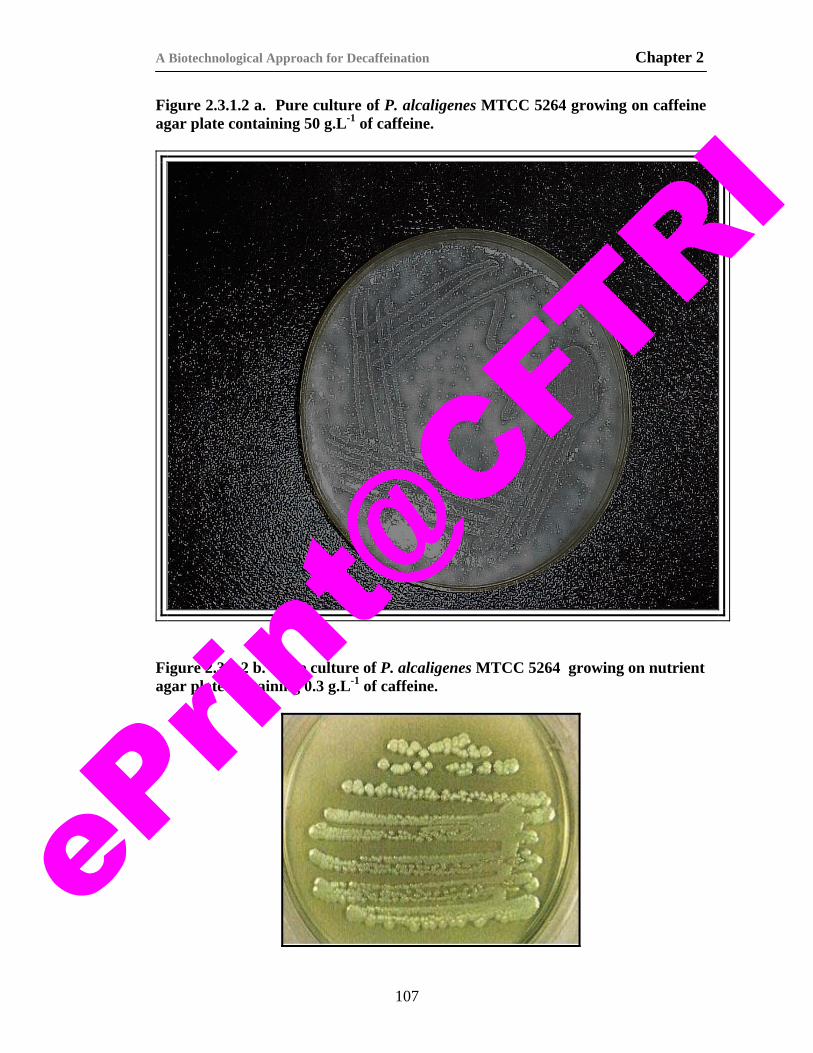
A Biotechnological Approach for Decaffeination Chapter 2
Figure 2.3.1.2 a. Pure culture of P. alcaligenes MTCC 5264 growing on caffeine agar plate containing 50 g.L-1 of caffeine.
Figure 2.3.1.2 b. Pure culture of P. alcaligenes MTCC 5264 growing on nutrient agar plate containing 0.3 g.L-1 of caffeine.
107
ePrin
t@CFT
RI

A Biotechnological Approach for Decaffeination Chapter 2
Caffeine has been mentioned as a potent allelopathic compound, inhibiting
selectively, several fungi and bacteria under coffee trees (Fries and Kihlman, 1948;
Waller et al. 1986). Several studies were conducted on the isolation and
characterization of microorganisms capable of degrading caffeine (Woolfolk, 1975;
Asano et.al., 1993; Roussos et al., 1995). Mazzafera et al (1996) reported the isolation
of a strain of Serratia marcescens from soil from coffee plantations. However most of
the caffeine degrading strains reported till date belong to Pseudomonas putida
(Bergmann et.al., 1964; Woolfolk, 1975; Asano et.al., 1993; Mazzafera et.al., 1996).
There are no reports on the isolation or degradation of caffeine by Alcaligenes fecalis,
Pseudomonas alcaligenes and Acetobacter sps. We have isolated for the first time
isolates belonging to the fore mentioned strains. All the caffeine degrading bacteria
are reported in literature are known to require long acclimatization times (Asano et.
al., 1993; Woolfolk, 1975; Mazzafera et. al., 1994). The bacterial strains isolated in
our laboratory required short acclimatization times and induction times for the
caffeine degradation activity. The caffeine degradation times in shake flask cultures
are also shorter compared to the earlier reports (Asano et al., 1993). HPLC analyses
of the fermentation broth showed that catabolites of caffeine and theobromine were
released in the medium (Fig. 2.3.1.3), and their reabsorption could explain the
continued growth after the disappearance of the original substrates in the medium.
7-Methylxanthine, uric acid and allantoin were detected in CLM (Fig.2.3.1.3).
Xanthine and 7-methylxanthine were detected in the medium after 48 hrs. After 72
hrs of incubation, uric acid, allantoin, allantoic acid, urea and ammonia were released
into the medium. The formation of ammonia was monitored by Nessler’s Reagent.
108
ePrin
t@CFT
RI
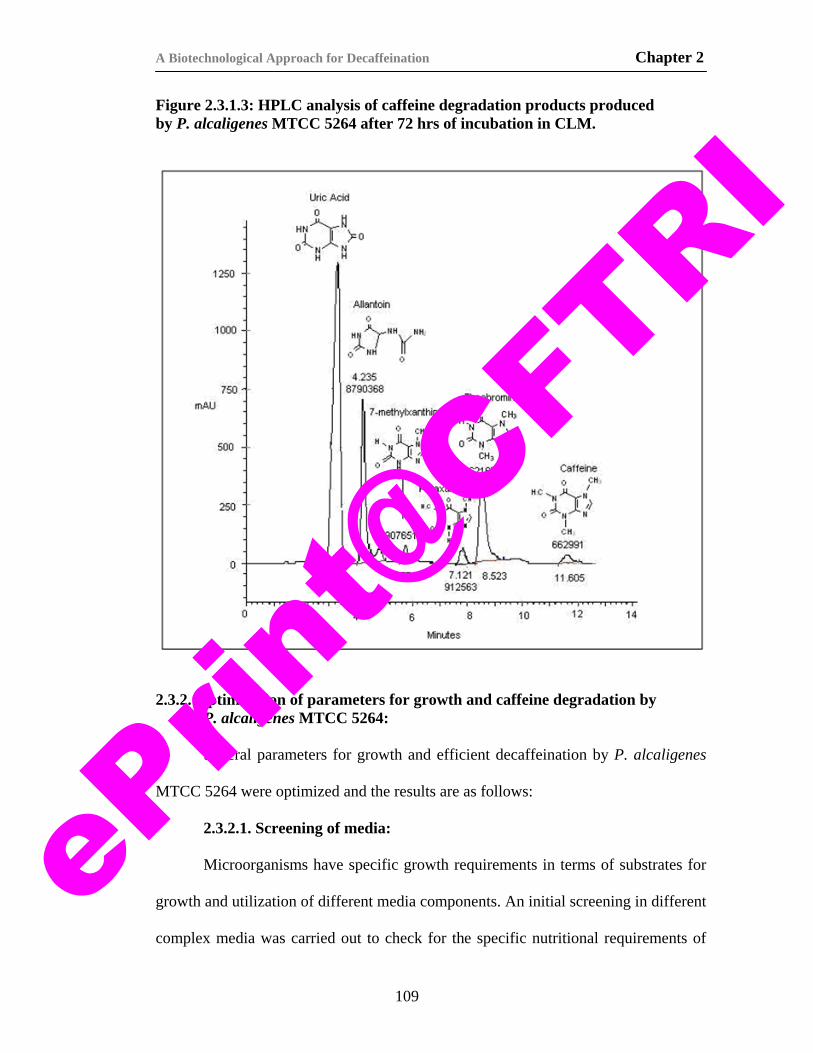
A Biotechnological Approach for Decaffeination Chapter 2
Figure 2.3.1.3: HPLC analysis of caffeine degradation products produced by P. alcaligenes MTCC 5264 after 72 hrs of incubation in CLM.
2.3.2. Optimization of parameters for growth and caffeine degradation by
P. alcaligenes MTCC 5264:
Several parameters for growth and efficient decaffeination by P. alcaligenes
MTCC 5264 were optimized and the results are as follows:
2.3.2.1. Screening of media:
Microorganisms have specific growth requirements in terms of substrates for
growth and utilization of different media components. An initial screening in different
complex media was carried out to check for the specific nutritional requirements of
109
ePrin
t@CFT
RI
A Biotechnological Approach for Decaffeination Chapter 2
P. alcaligenes MTCC 5264. Therefore 21 different media were initially screened for
the growth and caffeine degrading efficiency by P. alcaligenes MTCC 5264. Figure
2.3.2.1, represents the growth of P. alcaligenes in different media. In Growth
medium containing sucrose (M17), maximum biomass accumulation of 2.137 g.L-1
was observed. Production media II (M13) and III (M14), MS (M18) medium and
Xanthine MS medium (M19) also supported good growth of the organism and the
biomass accumulated in these media was 1.611, 1.787, 0.982 and 0.643 g.L-1
respectively. Growth was minimum in Complex organic medium, Tryptone Yeast
extract medium (M12), Tryptone commercial sugar medium (M11), Guase Mineral
Medium (M9), Dulaney’s medium (M6), Lindenberg Synthetic medium (M10) and
Trypticase Soy Broth (M21). Moderate growth was observed in the remaining media.
Inhibition of growth was observed in the tryptone containing media probably due to
the inhibitory effect of tryptone on the organism. Caffeine degradation was observed
only in Growth medium containing sucrose (M17), Production media II (M13) and III
(M14), MS (M18) medium and Xanthine MS medium (M19). Complete degradation
of caffeine was observed in the sucrose growth medium (M17) within 48 hrs of
incubation. Caffeine degradation in Production media II (M13) and III (M14), MS
medium (M18) and Xanthine MS medium (M19) was 27%, 33%, 54% and 62%
respectively (Table 2.3.2.1).
110
ePrin
t@CFT
RI
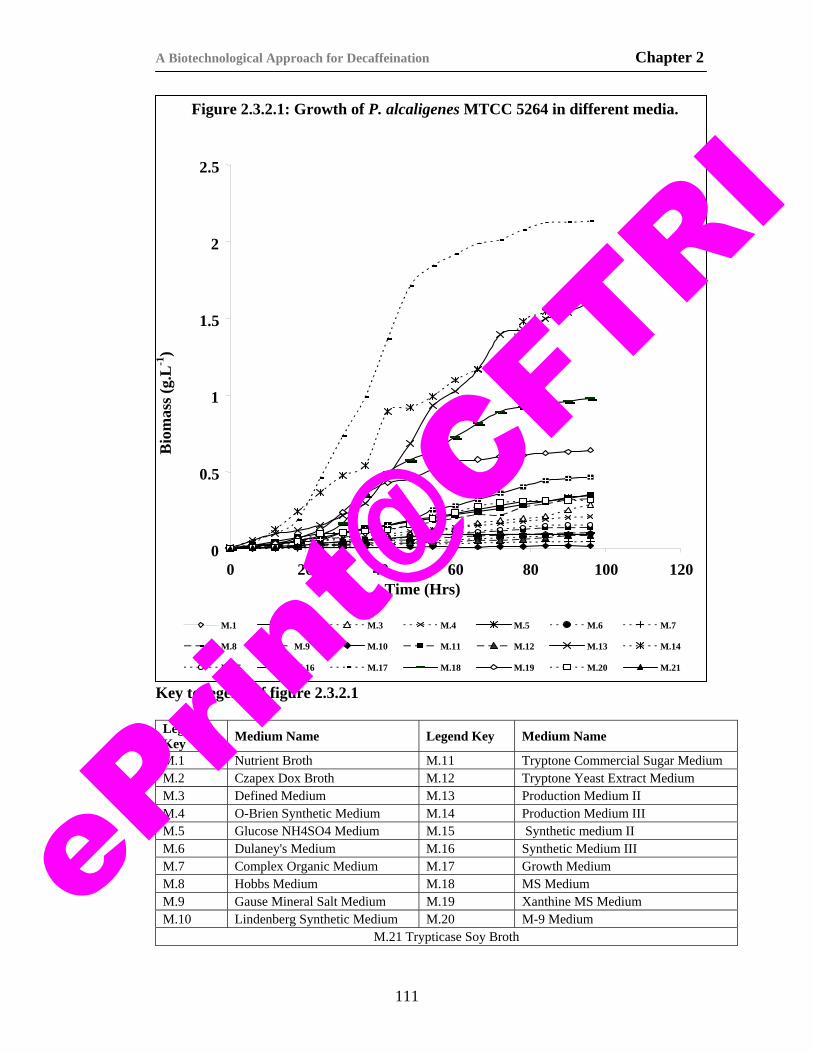
A Biotechnological Approach for Decaffeination Chapter 2
Figure 2.3.2.1: Growth of P. alcaligenes MTCC 5264 in different media.
Key to legend of figure 2.3.2.1
Legend Key Medium Name Legend Key Medium Name
M.1 Nutrient Broth M.11 Tryptone Commercial Sugar Medium M.2 Czapex Dox Broth M.12 Tryptone Yeast Extract Medium M.3 Defined Medium M.13 Production Medium II M.4 O-Brien Synthetic Medium M.14 Production Medium III M.5 Glucose NH4SO4 Medium M.15 Synthetic medium II M.6 Dulaney's Medium M.16 Synthetic Medium III M.7 Complex Organic Medium M.17 Growth Medium M.8 Hobbs Medium M.18 MS Medium M.9 Gause Mineral Salt Medium M.19 Xanthine MS Medium M.10 Lindenberg Synthetic Medium M.20 M-9 Medium
M.21 Trypticase Soy Broth
2.5
2
1.5
Bio
mas
s (g.
L-1
)
1
0.5
00 20 40 60 80 100 120
Time (Hrs)
M.1 M. 2 M.3 M.4 M.5 M.6 M.7
M.8 M.9 M.10 M.11 M.12 M.13 M.14
M.15 M.16 M.17 M.18 M.19 M.20 M.21
111
ePrin
t@CFT
RI
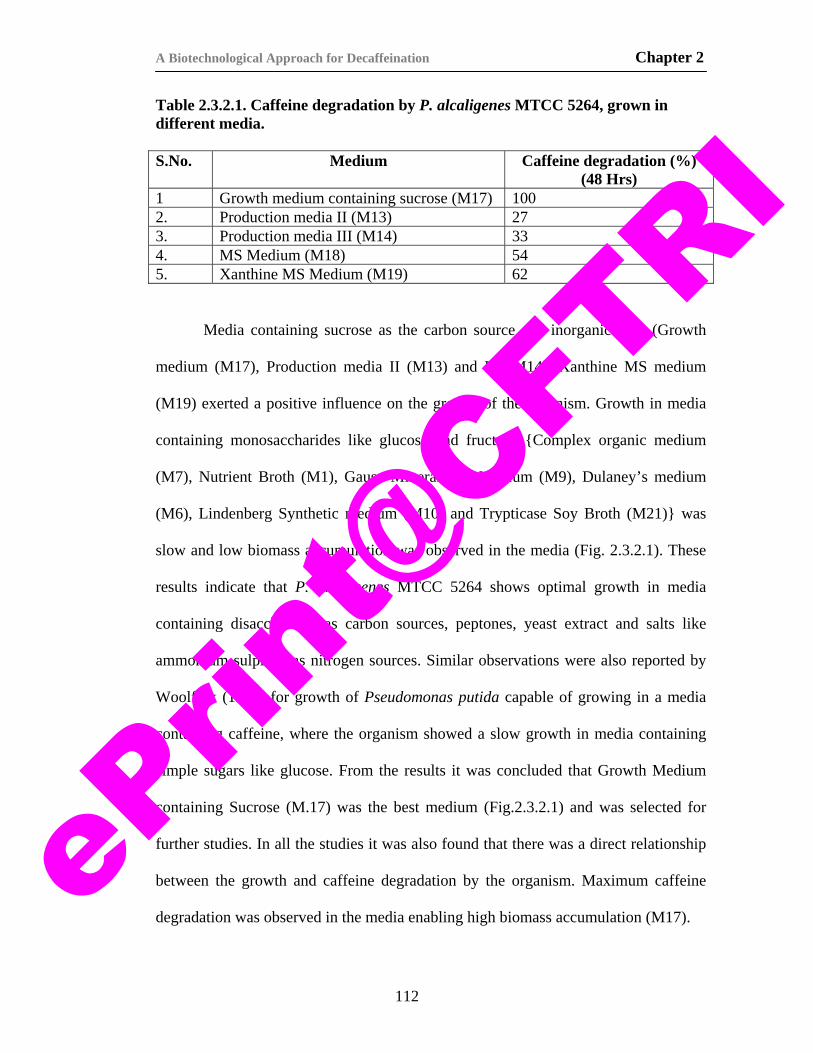
A Biotechnological Approach for Decaffeination Chapter 2
Table 2.3.2.1. Caffeine degradation by P. alcaligenes MTCC 5264, grown in different media.
S.No. Medium Caffeine degradation (%)
(48 Hrs) 1 Growth medium containing sucrose (M17) 100 2. Production media II (M13) 27 3. Production media III (M14) 33 4. MS Medium (M18) 54 5. Xanthine MS Medium (M19) 62
Media containing sucrose as the carbon source and inorganic salts (Growth
medium (M17), Production media II (M13) and III (M14), Xanthine MS medium
(M19) exerted a positive influence on the growth of the organism. Growth in media
containing monosaccharides like glucose and fructose {Complex organic medium
(M7), Nutrient Broth (M1), Gause Mineral Salt Medium (M9), Dulaney’s medium
(M6), Lindenberg Synthetic medium (M10) and Trypticase Soy Broth (M21)} was
slow and low biomass accumulation was observed in the media (Fig. 2.3.2.1). These
results indicate that P. alcaligenes MTCC 5264 shows optimal growth in media
containing disaccharides as carbon sources, peptones, yeast extract and salts like
ammonium sulphate as nitrogen sources. Similar observations were also reported by
Woolfolk (1975) for growth of Pseudomonas putida capable of growing in a media
containing caffeine, where the organism showed a slow growth in media containing
simple sugars like glucose. From the results it was concluded that Growth Medium
containing Sucrose (M.17) was the best medium (Fig.2.3.2.1) and was selected for
further studies. In all the studies it was also found that there was a direct relationship
between the growth and caffeine degradation by the organism. Maximum caffeine
degradation was observed in the media enabling high biomass accumulation (M17).
112
ePrin
t@CFT
RI
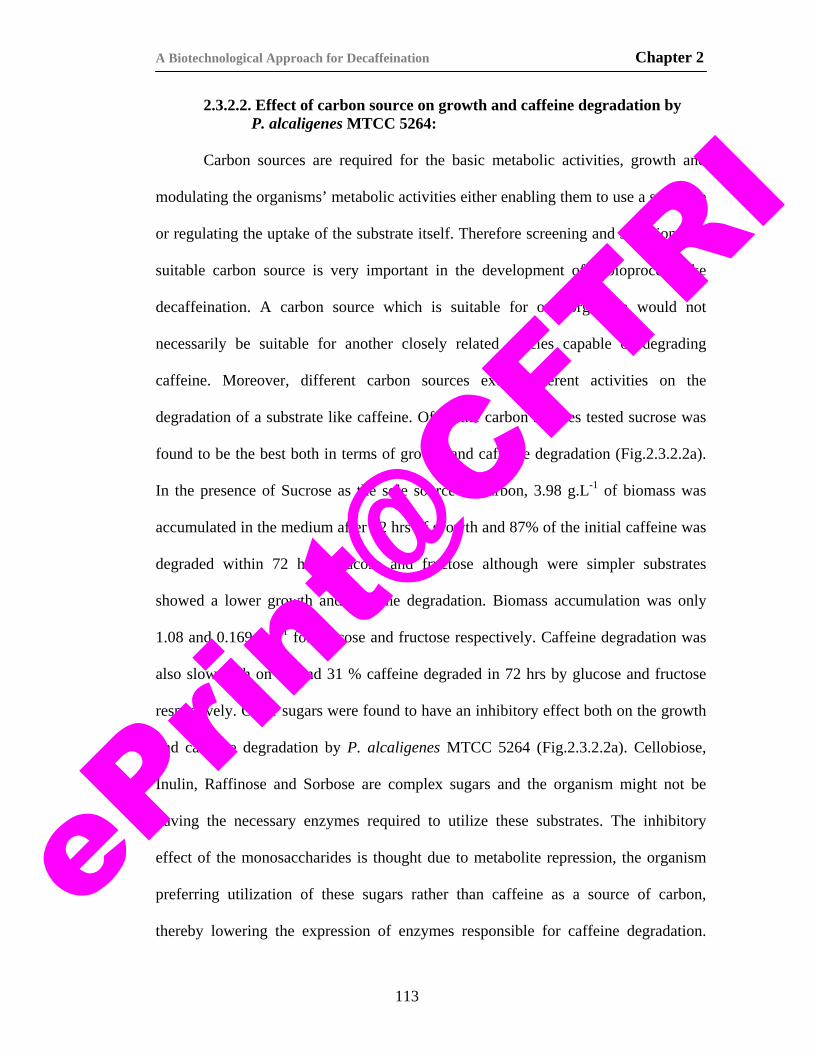
A Biotechnological Approach for Decaffeination Chapter 2
2.3.2.2. Effect of carbon source on growth and caffeine degradation by P. alcaligenes MTCC 5264:
Carbon sources are required for the basic metabolic activities, growth and
modulating the organisms’ metabolic activities either enabling them to use a substrate
or regulating the uptake of the substrate itself. Therefore screening and selection of a
suitable carbon source is very important in the development of a bioprocess like
decaffeination. A carbon source which is suitable for one organism would not
necessarily be suitable for another closely related species capable of degrading
caffeine. Moreover, different carbon sources exert different activities on the
degradation of a substrate like caffeine. Of all the carbon sources tested sucrose was
found to be the best both in terms of growth and caffeine degradation (Fig.2.3.2.2a).
In the presence of Sucrose as the sole source of carbon, 3.98 g.L-1 of biomass was
accumulated in the medium after 72 hrs of growth and 87% of the initial caffeine was
degraded within 72 hrs. Glucose and fructose although were simpler substrates
showed a lower growth and caffeine degradation. Biomass accumulation was only
1.08 and 0.169 g.L-1 for glucose and fructose respectively. Caffeine degradation was
also slow with on 38 and 31 % caffeine degraded in 72 hrs by glucose and fructose
respectively. Other sugars were found to have an inhibitory effect both on the growth
and caffeine degradation by P. alcaligenes MTCC 5264 (Fig.2.3.2.2a). Cellobiose,
Inulin, Raffinose and Sorbose are complex sugars and the organism might not be
having the necessary enzymes required to utilize these substrates. The inhibitory
effect of the monosaccharides is thought due to metabolite repression, the organism
preferring utilization of these sugars rather than caffeine as a source of carbon,
thereby lowering the expression of enzymes responsible for caffeine degradation.
113
ePrin
t@CFT
RI
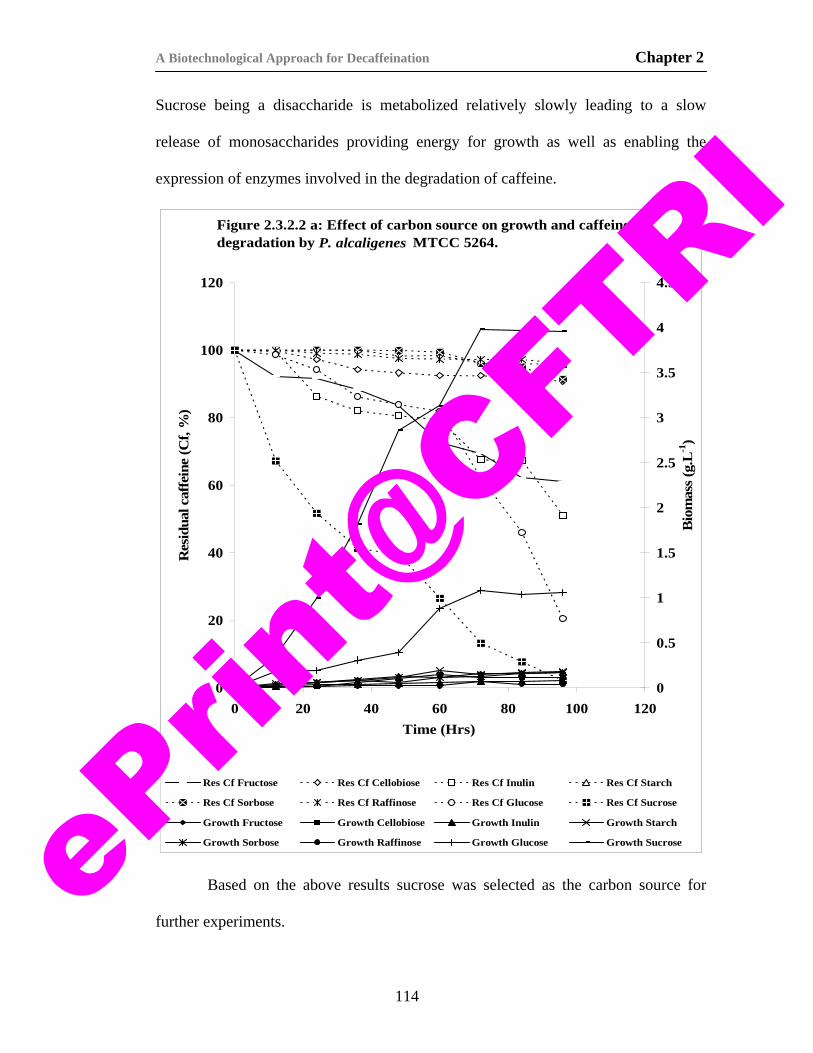
A Biotechnological Approach for Decaffeination Chapter 2
Sucrose being a disaccharide is metabolized relatively slowly leading to a slow
release of monosaccharides providing energy for growth as well as enabling the
expression of enzymes involved in the degradation of caffeine.
Figure 2.3.2.2 a: Effect of carbon source on growth and caffeine degradation by P. alcaligenes MTCC 5264.
0
20
40
60
80
100
120
0 20 40 60 80 100 120Time (Hrs)
Res
idua
l caf
fein
e (C
f, %
)
0
0.5
1
1.5
2
2.5
3
3.5
4
4.5
Bio
mas
s (g.
L-1)
Res Cf Fructose Res Cf Cellobiose Res Cf Inulin Res Cf Starch
Res Cf Sorbose Res Cf Raffinose Res Cf Glucose Res Cf Sucrose
Growth Fructose Growth Cellobiose Growth Inulin Growth Starch
Growth Sorbose Growth Raffinose Growth Glucose Growth Sucrose
Based on the above results sucrose was selected as the carbon source for
further experiments.
114
ePrin
t@CFT
RI
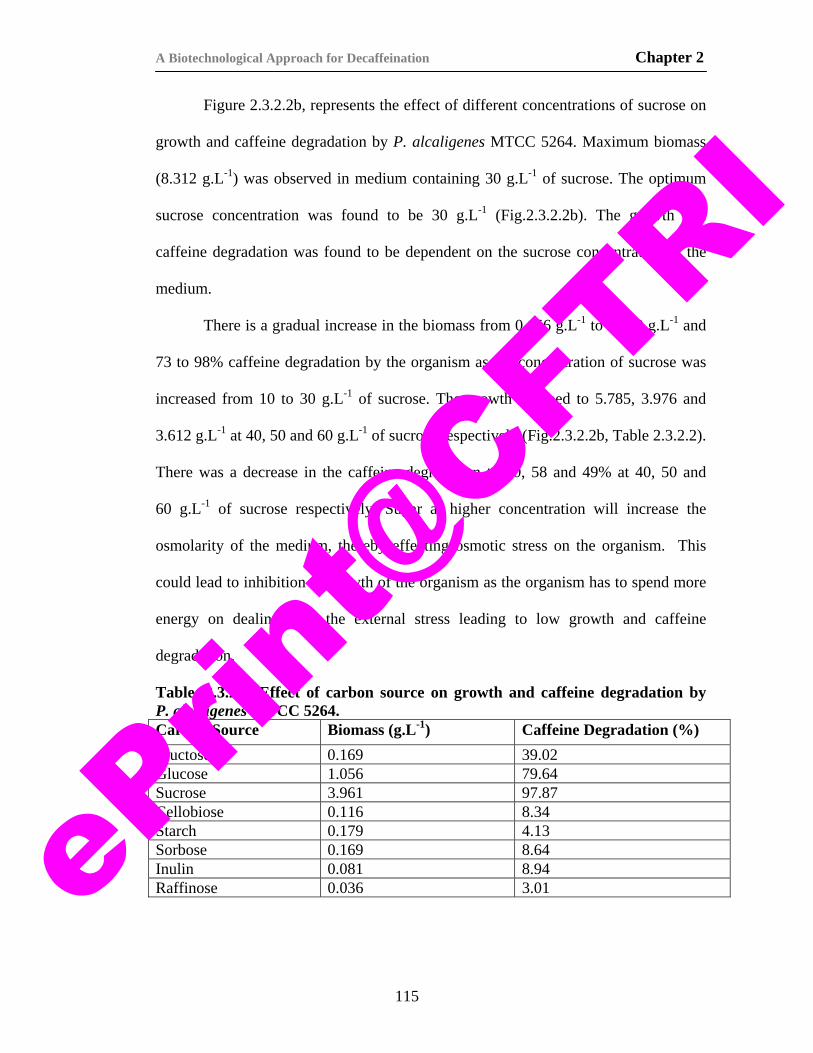
A Biotechnological Approach for Decaffeination Chapter 2
Figure 2.3.2.2b, represents the effect of different concentrations of sucrose on
growth and caffeine degradation by P. alcaligenes MTCC 5264. Maximum biomass
(8.312 g.L-1) was observed in medium containing 30 g.L-1 of sucrose. The optimum
sucrose concentration was found to be 30 g.L-1 (Fig.2.3.2.2b). The growth and
caffeine degradation was found to be dependent on the sucrose concentration in the
medium.
There is a gradual increase in the biomass from 0.156 g.L-1 to 8.312 g.L-1 and
73 to 98% caffeine degradation by the organism as the concentration of sucrose was
increased from 10 to 30 g.L-1 of sucrose. The growth dropped to 5.785, 3.976 and
3.612 g.L-1 at 40, 50 and 60 g.L-1 of sucrose respectively (Fig.2.3.2.2b, Table 2.3.2.2).
There was a decrease in the caffeine degradation to 60, 58 and 49% at 40, 50 and
60 g.L-1 of sucrose respectively. Sugar at higher concentration will increase the
osmolarity of the medium, thereby effecting osmotic stress on the organism. This
could lead to inhibition of growth of the organism as the organism has to spend more
energy on dealing with the external stress leading to low growth and caffeine
degradation.
Table. 2.3.2.2. Effect of carbon source on growth and caffeine degradation by P. alcaligenes MTCC 5264. Carbon Source Biomass (g.L-1) Caffeine Degradation (%) Fructose 0.169 39.02 Glucose 1.056 79.64 Sucrose 3.961 97.87 Cellobiose 0.116 8.34 Starch 0.179 4.13 Sorbose 0.169 8.64 Inulin 0.081 8.94 Raffinose 0.036 3.01
115
ePrin
t@CFT
RI
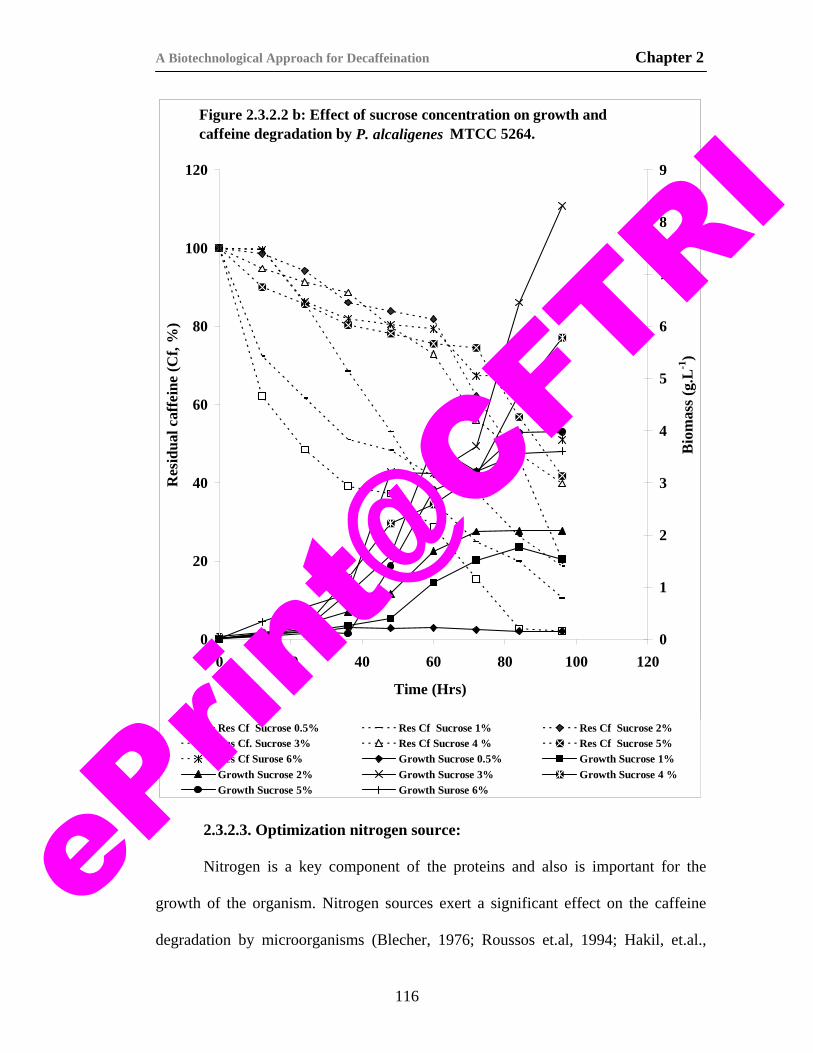
A Biotechnological Approach for Decaffeination Chapter 2
Figure 2.3.2.2 b: Effect of sucrose concentration on growth and caffeine degradation by P. alcaligenes MTCC 5264.
0
20
40
60
80
100
120
0 20 40 60 80 100 120
Time (Hrs)
Res
idua
l caf
fein
e (C
f, %
)
0
1
2
3
4
5
6
7
8
9
Bio
mas
s (g
.L-1
)
Res Cf Sucrose 0.5% Res Cf Sucrose 1% Res Cf Sucrose 2%Res Cf. Sucrose 3% Res Cf Sucrose 4 % Res Cf Sucrose 5%Res Cf Surose 6% Growth Sucrose 0.5% Growth Sucrose 1%Growth Sucrose 2% Growth Sucrose 3% Growth Sucrose 4 %Growth Sucrose 5% Growth Surose 6%
2.3.2.3. Optimization nitrogen source:
Nitrogen is a key component of the proteins and also is important for the
growth of the organism. Nitrogen sources exert a significant effect on the caffeine
degradation by microorganisms (Blecher, 1976; Roussos et.al, 1994; Hakil, et.al.,
116
ePrin
t@CFT
RI
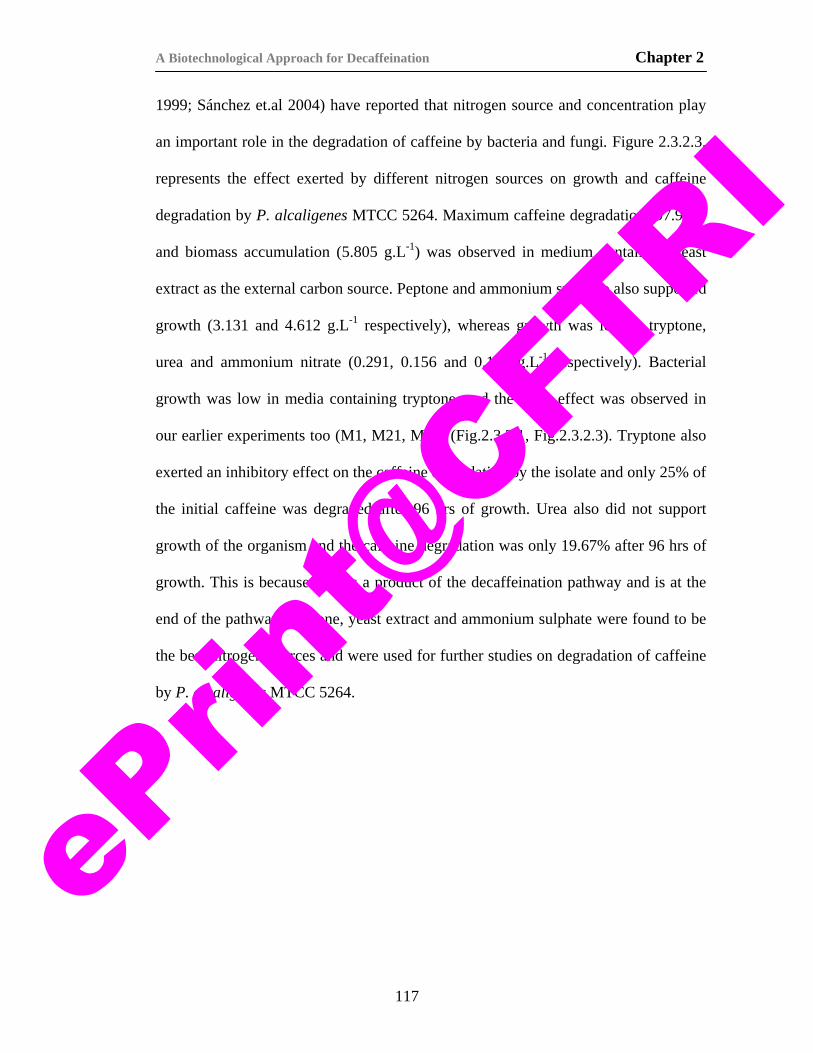
A Biotechnological Approach for Decaffeination Chapter 2
1999; Sánchez et.al 2004) have reported that nitrogen source and concentration play
an important role in the degradation of caffeine by bacteria and fungi. Figure 2.3.2.3,
represents the effect exerted by different nitrogen sources on growth and caffeine
degradation by P. alcaligenes MTCC 5264. Maximum caffeine degradation (97.9 %)
and biomass accumulation (5.805 g.L-1) was observed in medium containing yeast
extract as the external carbon source. Peptone and ammonium sulphate also supported
growth (3.131 and 4.612 g.L-1 respectively), whereas growth was low in tryptone,
urea and ammonium nitrate (0.291, 0.156 and 0.189 g.L-1 respectively). Bacterial
growth was low in media containing tryptone, and the same effect was observed in
our earlier experiments too (M1, M21, M12) (Fig.2.3.2.1, Fig.2.3.2.3). Tryptone also
exerted an inhibitory effect on the caffeine degradation by the isolate and only 25% of
the initial caffeine was degraded after 96 hrs of growth. Urea also did not support
growth of the organism and the caffeine degradation was only 19.67% after 96 hrs of
growth. This is because urea is a product of the decaffeination pathway and is at the
end of the pathway. Peptone, yeast extract and ammonium sulphate were found to be
the best nitrogen sources and were used for further studies on degradation of caffeine
by P. alcaligenes MTCC 5264.
117
ePrin
t@CFT
RI
A Biotechnological Approach for Decaffeination Chapter 2
Figure 2.3.2.3: Effect of nitrogen sources on growth and caffeine degradation by P. alcaligenes MTCC 5264.
0
20
40
60
80
100
120
0 20 40 60 80 100 120
Time (Hrs)
Res
idua
l caf
fein
e (C
f, %
)
0
1
2
3
4
5
6
7
Bio
mas
s (g.
L-1
)
Res Cf. Peptone Res Cf. Yeast Extract Res Cf. TryptoneRes Cf. Ammonium Sulphate Res Cf. Urea Res Cf. Ammonium NitrateGrowth Peptone Growth Yeast Extract Growth TryptoneGrowth Ammonium Sulphate Growth Urea Growth Ammonium Nitrate
2.3.2.4. Optimization of pH:
pH plays an important role on the growth and activity of different enzymes
required for caffeine degradation. Figure 2.3.2.4 represents the effect of pH on growth
and caffeine degradation by P. alcaligenes MTCC 5264.
118
ePrin
t@CFT
RI
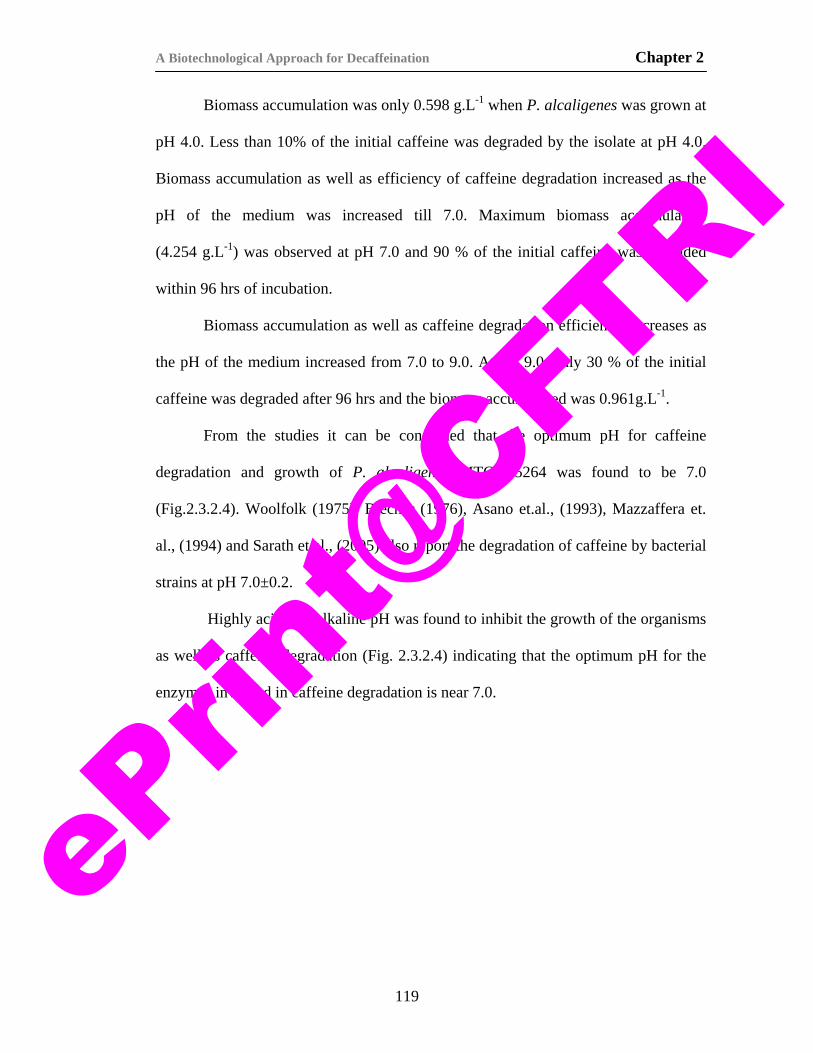
A Biotechnological Approach for Decaffeination Chapter 2
Biomass accumulation was only 0.598 g.L-1 when P. alcaligenes was grown at
pH 4.0. Less than 10% of the initial caffeine was degraded by the isolate at pH 4.0.
Biomass accumulation as well as efficiency of caffeine degradation increased as the
pH of the medium was increased till 7.0. Maximum biomass accumulation
(4.254 g.L-1) was observed at pH 7.0 and 90 % of the initial caffeine was degraded
within 96 hrs of incubation.
Biomass accumulation as well as caffeine degradation efficiency decreases as
the pH of the medium increased from 7.0 to 9.0. At pH 9.0, only 30 % of the initial
caffeine was degraded after 96 hrs and the biomass accumulated was 0.961g.L-1.
From the studies it can be concluded that the optimum pH for caffeine
degradation and growth of P. alcaligenes MTCC 5264 was found to be 7.0
(Fig.2.3.2.4). Woolfolk (1975), Blecher (1976), Asano et.al., (1993), Mazzaffera et.
al., (1994) and Sarath et.al., (2005) also report the degradation of caffeine by bacterial
strains at pH 7.0±0.2.
Highly acidic or alkaline pH was found to inhibit the growth of the organisms
as well as caffeine degradation (Fig. 2.3.2.4) indicating that the optimum pH for the
enzymes involved in caffeine degradation is near 7.0.
119
ePrin
t@CFT
RI
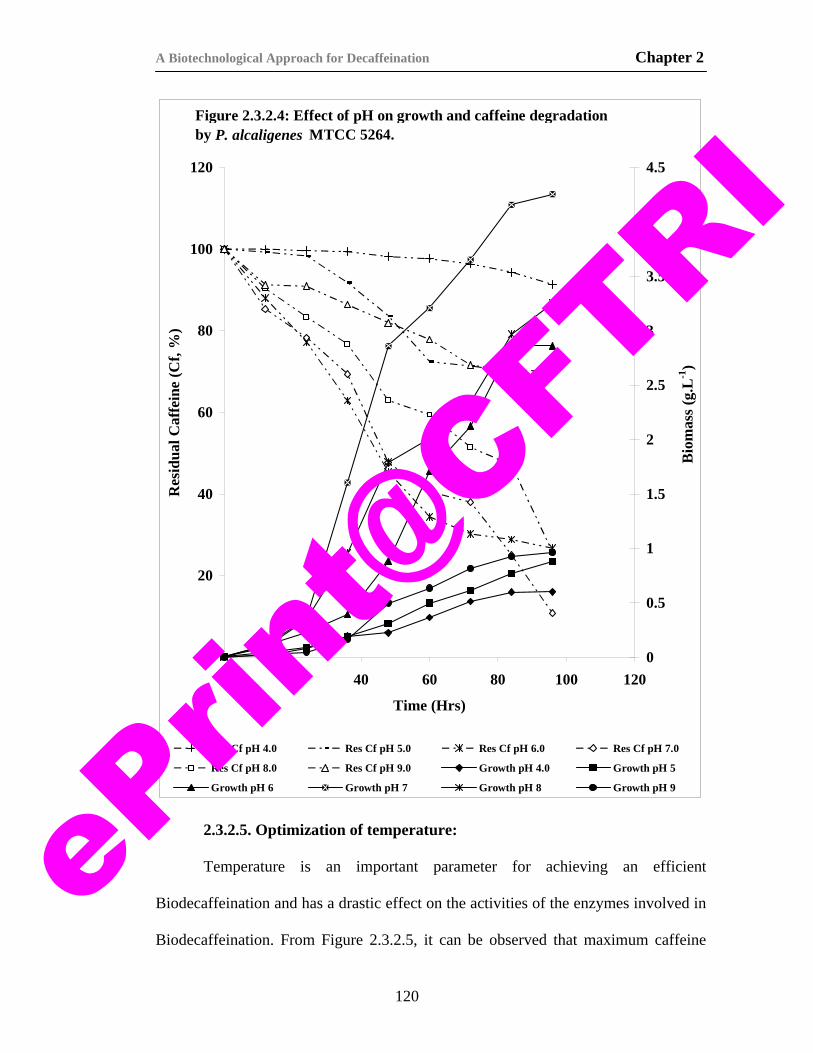
A Biotechnological Approach for Decaffeination Chapter 2
Figure 2.3.2.4: Effect of pH on growth and caffeine degradation by P. alcaligenes MTCC 5264.
0
20
40
60
80
100
120
0 20 40 60 80 100 120
Time (Hrs)
Res
idua
l Caf
fein
e (C
f, %
)
0
0.5
1
1.5
2
2.5
3
3.5
4
4.5
Bio
mas
s (g
.L-1
)
Res Cf pH 4.0 Res Cf pH 5.0 Res Cf pH 6.0 Res Cf pH 7.0
Res Cf pH 8.0 Res Cf pH 9.0 Growth pH 4.0 Growth pH 5
Growth pH 6 Growth pH 7 Growth pH 8 Growth pH 9
2.3.2.5. Optimization of temperature:
Temperature is an important parameter for achieving an efficient
Biodecaffeination and has a drastic effect on the activities of the enzymes involved in
Biodecaffeination. From Figure 2.3.2.5, it can be observed that maximum caffeine
120
ePrin
t@CFT
RI
A Biotechnological Approach for Decaffeination Chapter 2
degradation (95%) was achieved when the organism was grown at 300C and the
biomass accumulation was also high at this temperature (3.937 g.L-1). Good Growth
was observed at 25oC (3.131 g.L-1) and the organism also degrades around 90% of the
initial caffeine at 25oC. Caffeine degradation as well as biomass accumulation was
high till the temperature of the medium was increased upto 35oC (Fig. 2.3.2.5) (3-4
g.L-1 biomass and 90-95% Caffeine degradation). Increase in the temperature above
40oC led to decrease in the growth as well as caffeine degradation by the isolate.
These results indicate that the organism is a mesophile and thrives well at 25-35oC
with maximum efficiency of caffeine degradation. Maximum caffeine degradation
efficiency of the isolate in the mesophilic temperature range is due to the enzymes
acting more efficiently in this temperature range. Interestingly the organism degraded
around 50% of the initial caffeine at 60o indicating a possible use of P. alcaligenes
MTCC 5264 at higher temperatures also. Usually bacteria belonging to Pseudomonas
sps. are known to be mesophilic living in almost any substrate at these temperatures
(Mennet and Nakayama, 1971). However they are known to adapt themselves to
extreme temperatures by developing protective mucilage layer around them which
would protect them from the effects of temperature (Gügi et.al., 1991; Hebraud et.al.,
1994). This mechanism may probably be involved in the survival and degradation of
caffeine by P. alcaligenes observed in this study.
121
ePrin
t@CFT
RI
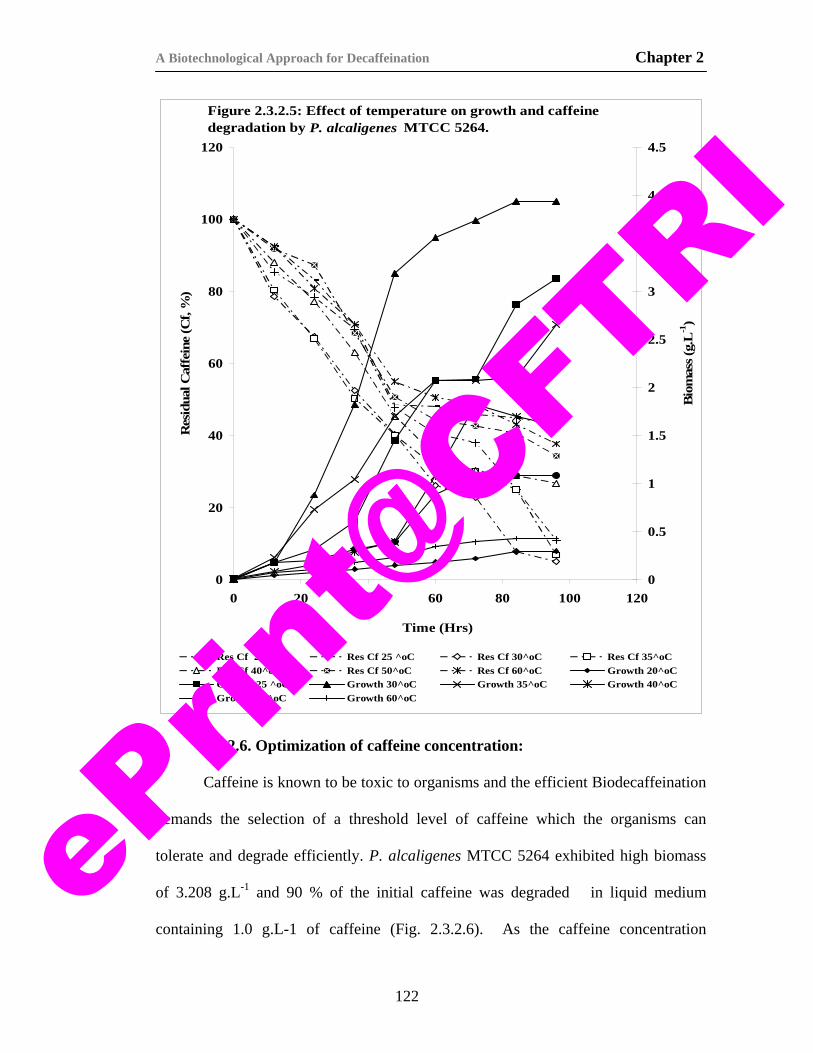
A Biotechnological Approach for Decaffeination Chapter 2
Figure 2.3.2.5: Effect of temperature on growth and caffeine degradation by P. alcaligenes MTCC 5264.
0
20
40
60
80
100
120
0 20 40 60 80 100 120
Time (Hrs)
Res
idua
l Caf
fein
e (C
f, %
)
0
0.5
1
1.5
2
2.5
3
3.5
4
4.5
Bio
mas
s (g.
L-1)
Res Cf 20^oC Res Cf 25 ^oC Res Cf 30^oC Res Cf 35^oCRes Cf 40^oC Res Cf 50^oC Res Cf 60^oC Growth 20^oCGrowth 25 ^oC Growth 30^oC Growth 35^oC Growth 40^oCGrowth 50^oC Growth 60^oC
2.3.2.6. Optimization of caffeine concentration:
Caffeine is known to be toxic to organisms and the efficient Biodecaffeination
demands the selection of a threshold level of caffeine which the organisms can
tolerate and degrade efficiently. P. alcaligenes MTCC 5264 exhibited high biomass
of 3.208 g.L-1 and 90 % of the initial caffeine was degraded in liquid medium
containing 1.0 g.L-1 of caffeine (Fig. 2.3.2.6). As the caffeine concentration
122
ePrin
t@CFT
RI

A Biotechnological Approach for Decaffeination Chapter 2
increased to 2.0 g.L-1 , there was a slight decrease in the growth but more than 95 %
of the initial caffeine was degraded within 96 hrs of incubation. At the beginning of
the incubation period, a slight growth inhibition of growth and caffeine degradation
was observed at 2.0 g.L-1 of caffeine, which was probably due to the initial toxic
effect of caffeine. The organism could however degrade more than 95% of the
caffeine within 96 hrs and this trend was observed till a concentration of 2.0 g.L-1.
Initial concentration of caffeine above 2.0 g.L-1 were highly inhibitory for the
organism and only 70-75 % of the initial caffeine was degraded after 96 hrs of
incubation owing to the inhibitory effect of caffeine on the organism. At a caffeine
concentration of 5.0 g.L-1, 49 % of the initial caffeine was degraded although the
biomass accumulated was only 0.041 g.L-1 (Fig. 2.3.2.6). Although caffeine is known
to be toxic at high concentrations, P. alcaligenes MTCC 5264 appears to have
adapted itself to survive the high concentrations of caffeine by expressing enzymes
capable of degrading the caffeine. The low efficiency of caffeine degradation is due
to the inhibitory effect of caffeine on the enzymes. Similar effect of caffeine was also
observed by several authors like Asano et.al., (1993), wherein they have reported the
growth of a strain of P. putida capable of growing on caffeine at 5.0 g.L-1. The
organism could degrade only 40-45 % of the initial caffeine within 8 weeks after a
long acclimatization time of 2 years. Studies on caffeine degradation by bacteria upto
concentrations of 50.0 g.L-1 have been reported earlier (Blecher and Lingens, 1977).
But the caffeine degradation rates reported in all thee studies are low and require very
long acclimatization times and partial degradation at high initial caffeine
concentrations (Woolfolk, 1975; Asano et.al., 1993; Mazzaffera et.al., 1994a). The
123
ePrin
t@CFT
RI
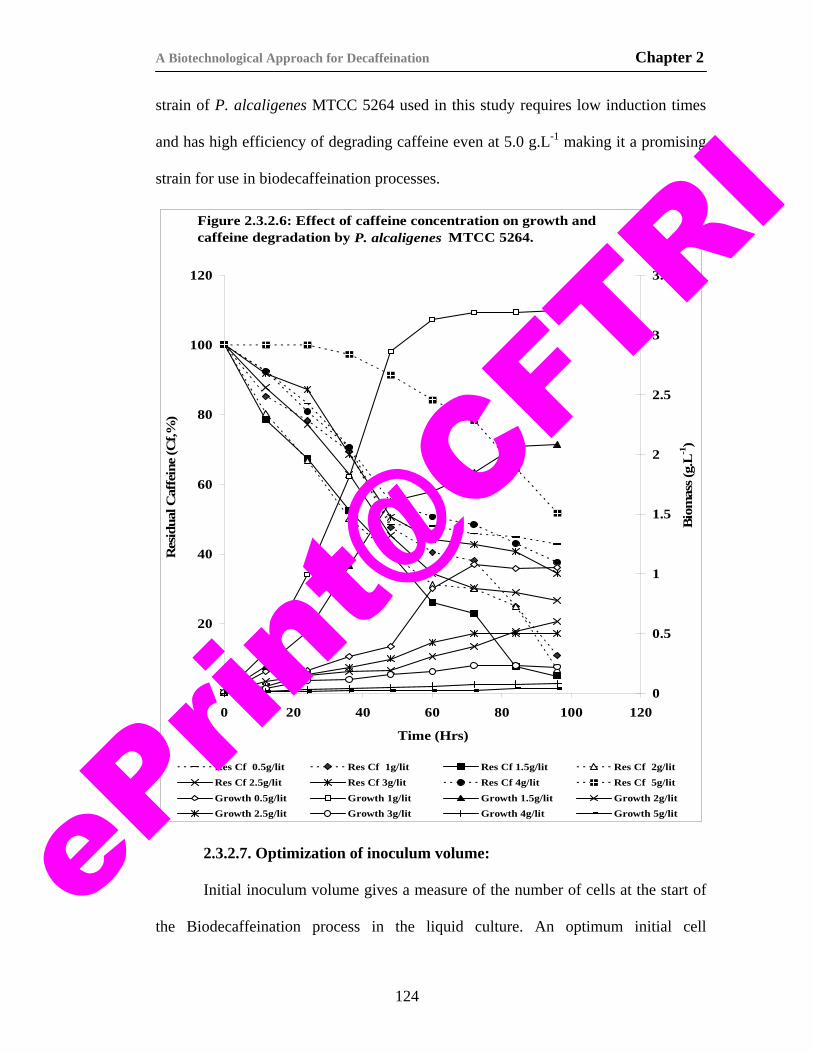
A Biotechnological Approach for Decaffeination Chapter 2
strain of P. alcaligenes MTCC 5264 used in this study requires low induction times
and has high efficiency of degrading caffeine even at 5.0 g.L-1 making it a promising
strain for use in biodecaffeination processes.
Figure 2.3.2.6: Effect of caffeine concentration on growth and caffeine degradation by P. alcaligenes MTCC 5264.
0
20
40
60
80
100
120
0 20 40 60 80 100 120
Time (Hrs)
Res
idua
l Caf
fein
e (C
f,%)
0
0.5
1
1.5
2
2.5
3
3.5
Bio
mas
s (g.
L-1)
Res Cf 0.5g/lit Res Cf 1g/lit Res Cf 1.5g/lit Res Cf 2g/litRes Cf 2.5g/lit Res Cf 3g/lit Res Cf 4g/lit Res Cf 5g/litGrowth 0.5g/lit Growth 1g/lit Growth 1.5g/lit Growth 2g/litGrowth 2.5g/lit Growth 3g/lit Growth 4g/lit Growth 5g/lit
2.3.2.7. Optimization of inoculum volume:
Initial inoculum volume gives a measure of the number of cells at the start of
the Biodecaffeination process in the liquid culture. An optimum initial cell
124
ePrin
t@CFT
RI
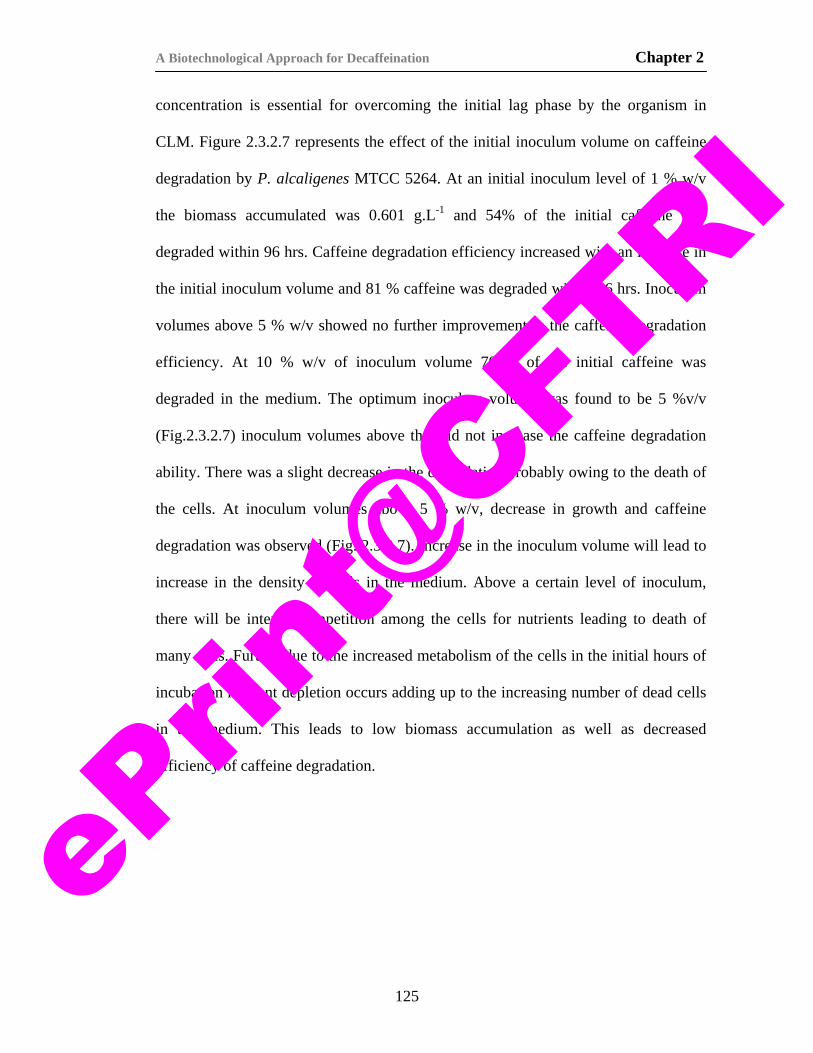
A Biotechnological Approach for Decaffeination Chapter 2
concentration is essential for overcoming the initial lag phase by the organism in
CLM. Figure 2.3.2.7 represents the effect of the initial inoculum volume on caffeine
degradation by P. alcaligenes MTCC 5264. At an initial inoculum level of 1 % w/v
the biomass accumulated was 0.601 g.L-1 and 54% of the initial caffeine was
degraded within 96 hrs. Caffeine degradation efficiency increased with an increase in
the initial inoculum volume and 81 % caffeine was degraded within 96 hrs. Inoculum
volumes above 5 % w/v showed no further improvement in the caffeine degradation
efficiency. At 10 % w/v of inoculum volume 70 % of the initial caffeine was
degraded in the medium. The optimum inoculum volume was found to be 5 %v/v
(Fig.2.3.2.7) inoculum volumes above this did not increase the caffeine degradation
ability. There was a slight decrease in the degradation probably owing to the death of
the cells. At inoculum volumes above 5 % w/v, decrease in growth and caffeine
degradation was observed (Fig. 2.3.2.7). Increase in the inoculum volume will lead to
increase in the density of cells in the medium. Above a certain level of inoculum,
there will be intense competition among the cells for nutrients leading to death of
many cells. Further due to the increased metabolism of the cells in the initial hours of
incubation nutrient depletion occurs adding up to the increasing number of dead cells
in the medium. This leads to low biomass accumulation as well as decreased
efficiency of caffeine degradation.
125
ePrin
t@CFT
RI
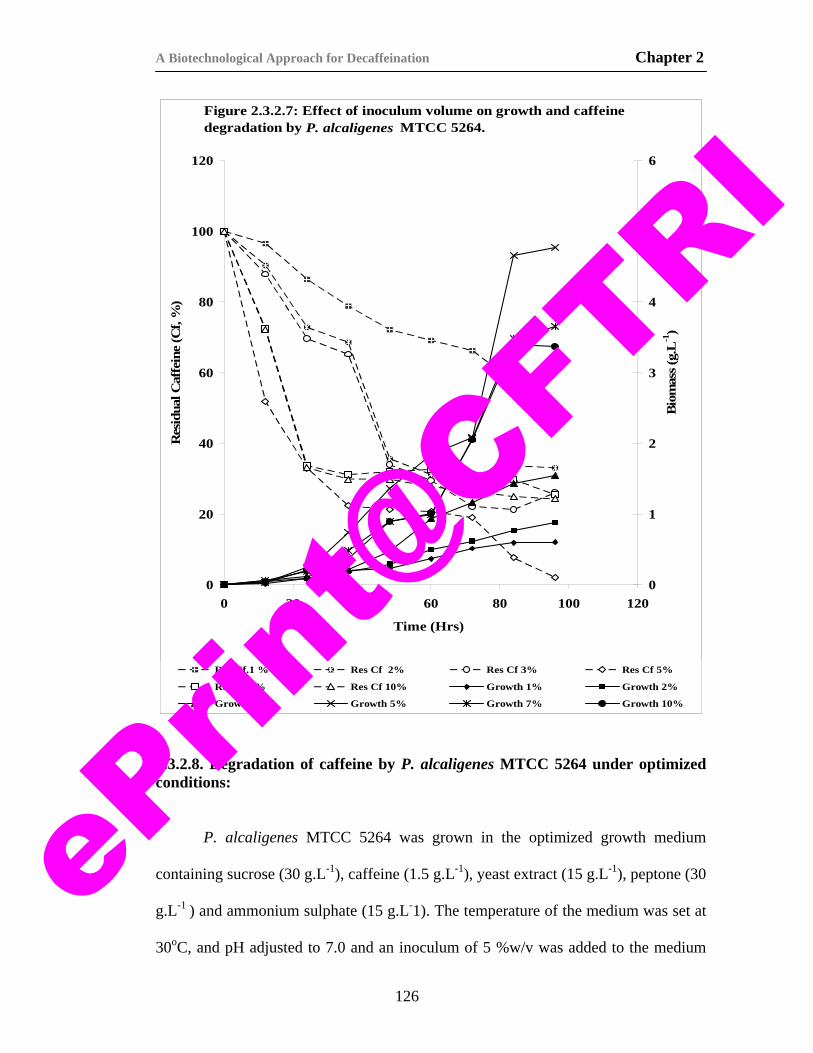
A Biotechnological Approach for Decaffeination Chapter 2
Figure 2.3.2.7: Effect of inoculum volume on growth and caffeine degradation by P. alcaligenes MTCC 5264.
0
20
40
60
80
100
120
0 20 40 60 80 100 120
Time (Hrs)
Res
idua
l Caf
fein
e (C
f, %
)
0
1
2
3
4
5
6
Bio
mas
s (g.
L-1)
Res Cf.1 % Res Cf 2% Res Cf 3% Res Cf 5%
Res Cf 7% Res Cf 10% Growth 1% Growth 2%
Growth 3% Growth 5% Growth 7% Growth 10%
2.3.2.8. Degradation of caffeine by P. alcaligenes MTCC 5264 under optimized conditions:
P. alcaligenes MTCC 5264 was grown in the optimized growth medium
containing sucrose (30 g.L-1), caffeine (1.5 g.L-1), yeast extract (15 g.L-1), peptone (30
g.L-1 ) and ammonium sulphate (15 g.L-1). The temperature of the medium was set at
30oC, and pH adjusted to 7.0 and an inoculum of 5 %w/v was added to the medium
126
ePrin
t@CFT
RI
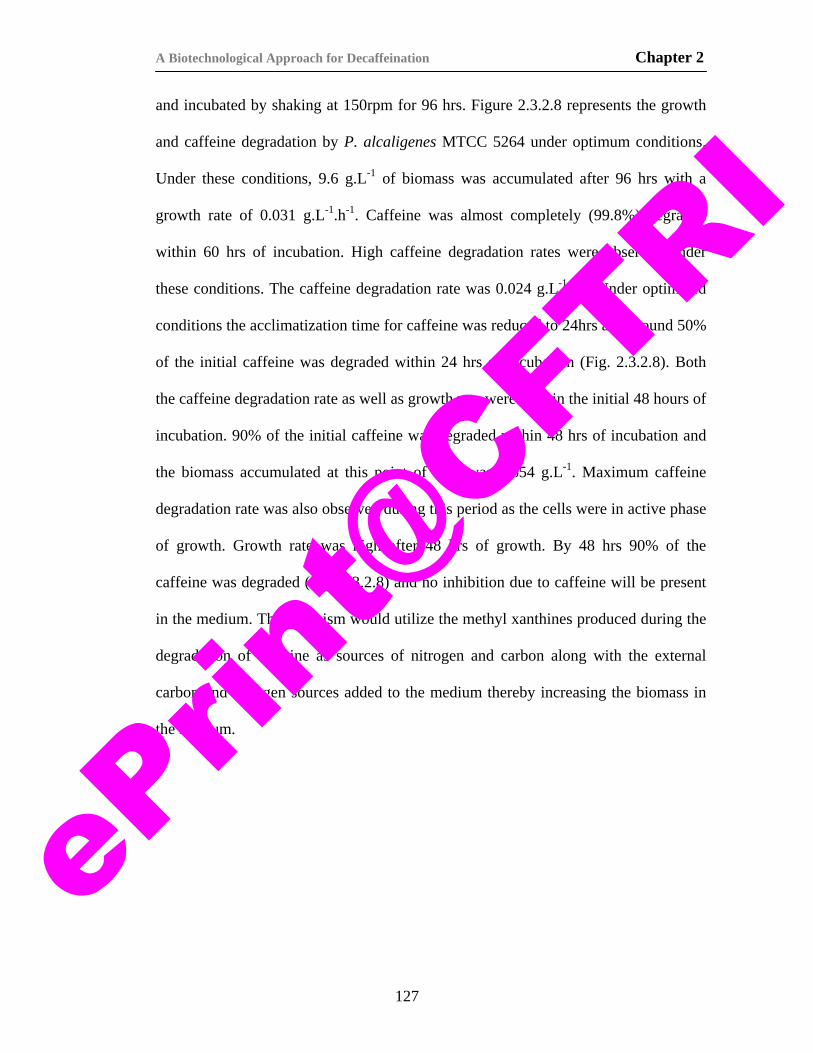
A Biotechnological Approach for Decaffeination Chapter 2
and incubated by shaking at 150rpm for 96 hrs. Figure 2.3.2.8 represents the growth
and caffeine degradation by P. alcaligenes MTCC 5264 under optimum conditions.
Under these conditions, 9.6 g.L-1 of biomass was accumulated after 96 hrs with a
growth rate of 0.031 g.L-1.h-1. Caffeine was almost completely (99.8%) degraded
within 60 hrs of incubation. High caffeine degradation rates were observed under
these conditions. The caffeine degradation rate was 0.024 g.L-1.h-1. Under optimized
conditions the acclimatization time for caffeine was reduced to 24hrs and around 50%
of the initial caffeine was degraded within 24 hrs of incubation (Fig. 2.3.2.8). Both
the caffeine degradation rate as well as growth rate were high in the initial 48 hours of
incubation. 90% of the initial caffeine was degraded within 48 hrs of incubation and
the biomass accumulated at this point of time was 3.654 g.L-1. Maximum caffeine
degradation rate was also observed during this period as the cells were in active phase
of growth. Growth rate was high after 48 hrs of growth. By 48 hrs 90% of the
caffeine was degraded (Fig. 2.3.2.8) and no inhibition due to caffeine will be present
in the medium. The organism would utilize the methyl xanthines produced during the
degradation of caffeine as sources of nitrogen and carbon along with the external
carbon and nitrogen sources added to the medium thereby increasing the biomass in
the medium.
127
ePrin
t@CFT
RI
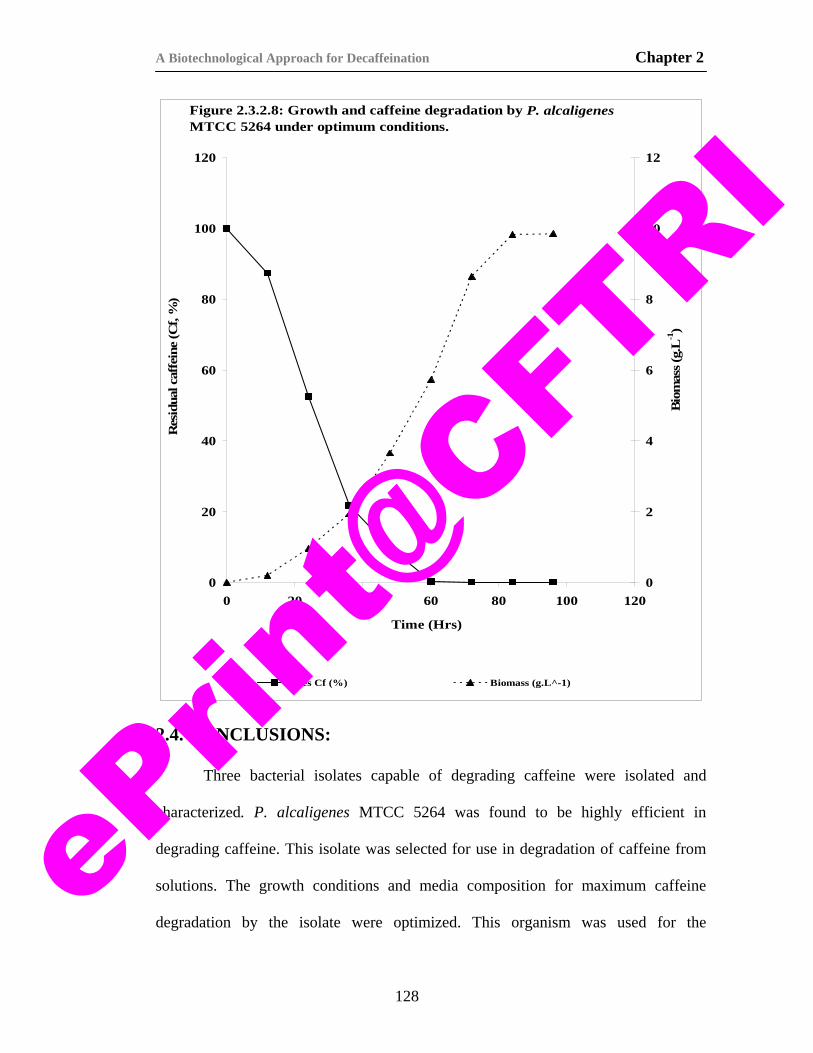
A Biotechnological Approach for Decaffeination Chapter 2
Figure 2.3.2.8: Growth and caffeine degradation by P. alcaligenes MTCC 5264 under optimum conditions.
0
20
40
60
80
100
120
0 20 40 60 80 100 120
Time (Hrs)
Res
idua
l caf
fein
e (C
f, %
)
0
2
4
6
8
10
12
Bio
mas
s (g.
L-1)
Res Cf (%) Biomass (g.L^-1)
2.4. CONCLUSIONS:
Three bacterial isolates capable of degrading caffeine were isolated and
characterized. P. alcaligenes MTCC 5264 was found to be highly efficient in
degrading caffeine. This isolate was selected for use in degradation of caffeine from
solutions. The growth conditions and media composition for maximum caffeine
degradation by the isolate were optimized. This organism was used for the
128
ePrin
t@CFT
RI
A Biotechnological Approach for Decaffeination Chapter 2
decaffeination of caffeine containing liquids. P. alcaligenes MTCC 5264 is an
efficient caffeine degrader requiring little acclimatization times and having the ability
to resist high concentrations of caffeine in the medium. Although several studies have
been reported on the degradation of caffeine by bacteria and fungi, they have been
largely limited by the long acclimatization times, low caffeine tolerances and low
caffeine degradation efficiency of the organisms. The isolate reported in this study is
advantageous over the other strains reported in literature and has immense potential
of development of enzymatic processes for decaffeination which will be dealt in the
later chapters.
129
ePrin
t@CFT
RI
A Biotechnological Approach for Decaffeination Chapter 2
2.5. REFERENCES:
1. Asano, Y., Komeda, T, Yamada, H. (1993), Microbial production of theobromine
from caffeine. Biosci. Biotech. Biochem. 57:1286–89.
2. Baumann, T. W., Gabriel, H., (1984), Metabolism and excretion of caffeine
during germination of Coffea arabica L. Plant Cell Physiol. 25: 1431–1436.
3. Bergmann, F., Ungar-Waron, H., Kwietny-Govrin H., (1964), Some specific
reactions of the purine oxidizing system of Pseudomonas aeruginosa. Biochim.
Biophys. Acta, 79: 512-522.
4. Berthou, F., Guillois, B., Riche, C., Dreano, Y., Jacqz-Aigrain, E., Beaune, P.,
(1992), Xenobiotica, 22: 671–680.
5. Blecher, (1976), Microbial breakdown of caffeine (author's transl), Zentralbl
Bakteriol [Orig B]. 162(1-2): 180-3. [Article in German]
6. Blecher, R., Lingens, F., (1977), The metabolism of caffeine by a Pseudomonas
putida strain. Hoppe Seylers Z Physiol Chem. 358(7): 807-17.
7. Boccas, F., Roussos, S., Gutierrez, M., Serrano, L., Viniegra, G.G., (1994),
Production of pectinase from coffee pulp in solid-state fermentation system -
selection of wild fungal isolate of high potency by a simple 3-step screening
technique. J. Food Sci. Tech. (Mysore), 31: 22-26.
8. Bressani, R., (1987a), Antiphysiological factors in coffee pulp. In: Brahan, J.E.;
Bressani, R. (Ed.) Coffee pulp: composition, technology, and utilization.
Guatemala City: Institute of Nutrition of Central America and Panama, 83-88.
9. Bressani, R., (1987b), Potential uses of coffee berry byproducts. In: Brahan, J.E.;
Bressani, R. (Ed.) Coffee pulp: composition, technology, and utilization.
Guatemala City: Institute of Nutrition of Central America and Panama, 17-25.
10. Burr, T.J., Caesar, A., (1985), Beneficial plant bacteria. CRC Critic. Rev. Plant
Sci., 2:120.
130
ePrin
t@CFT
RI
A Biotechnological Approach for Decaffeination Chapter 2
11. Friedman, J., Waller, G.R., (1983a), Caffeine hazards and their prevention in
germinating seeds of coffee (Coffea arabica L.) J. Chem. Ecol. 9:1099-1106.
12. Friedman, J., Waller, G.R., (1983b), Seeds as allelopathic agents. J. Chem. Ecol.
9:1107-1115.
13. Fries, N., Kihlman, B., (1948), Nature, 162: 573
14. Frischknecht, P.M., Ulmer, D.J., Baumann, T.W., (1986), Purine alkaloid
formation in buds and developing leaflets of Coffea arabica: expression of an
optimal defense strategy?? Phytochemistry. 25:613-616.
15. Gluck, M., Lingens, F., (1987), Studies on the microbial production of thebromine
and heteroxanthine from caffeine. Appl. Microb.Biotech. 25: 334-340.
16. Grigg, C.W., (1972), Effects of coumarin, pyronine Y, 6,9-dimethyl-
2methylthiopurine and caffeine on excision repair and recombination in
Escherichia coli. J. Gen. Microb., 70: 221230.
17. Gügi, B., Orange, N., Hellio, F., Burini, J.F., Guillou, C, Leriche F., Guespin-
Michel J.F., (1991), Effect of growth temperature on several exported enzyme
activities in the psychrotrophic bacterium Pseudomonas fluorescens. J Bacteriol.
173(12): 3814-3820
18. Hakil, M., Voisinet, F., Gonz´alez, G.V., Augur, C., (1999), Caffeine degradation
in solid-state fermentation by Aspergillus tamarii: effects of additional nitrogen
sources. Process Biochem. 35:103–9.
19. Hebraud, M., Dubois, E., Potier, E., Labadie, J., (1994), Effect of growth
temperatures on the protein levels in a psychrotrophic bacterium, Pseudomonas
fragi. J Bacteriol. 176(13): 4017-4024
20. Hohnloser, W., Osswalt ,B., Lingens, F., (1980), Enzymological aspects of
caffeine demethylation and formaldehyde oxidation by Pseudomonas putida C1.
Hoppe seyler’s Z Physiol Chem. 361: 1763–76.
21. Kihlman, B.A., (1974), Effects of caffeine on the genetic material. Mutat Res.,
26:53–71.
131
ePrin
t@CFT
RI
A Biotechnological Approach for Decaffeination Chapter 2
22. Mazzafera, P., Crozier, A., Magalhaes, A.C., (1991), Caffeine metabolism in
Coffea arabica and other species of coffee. Phytochem. 30:3913–16.
23. Mazzafera, P., Crozier, A., Sandbergs, G., (1994a), Studies on the metabolic
control of caffeine turnover in developing endosperms and leaves of Coffea
arabica and Coffea dewevrei. J Agric Food Chem. 42:7423–77.
24. Mazzafera, P., Olsson, O., Sandberg, G., (1994b), Degradation of caffeine and
related methyl xanthines by Serratia marcescens isolated from soil under coffee
cultivation. Microb Ecol. 31:199–207.
25. Mennett, R.H., Nakayama, T.O.M., (1971), Influence of Temperature on
Substrate and Energy Conversion in Pseudomonas fluorescens, Appl Microbiol.
22(5): 772–776.
26. Middelhoven, W. J., Bakker, C. M., (1982), Degradation of caffeine by
immobilized cells of Pseudomonas putida strain C 3024. Europ. J. Appl.
Microbial Biotechnol. 15: 214-217.
27. Middelhoven, W.J.; Lommen, A., (1984), Degradation of caffeine by
Pseudomonas putida C3024. Anton. van Leeuwenho. .50: 298-30.
28. Nathanson, J. A., (1984), Caffeine and related methylxanthines: possible naturally
occuring pesticides. Science, 226: 184–187.
29. Porres, C., Alvarez, D., Calzada, J., (1993), Caffeine reduction in coffee pulp
through silage. Biotechnol. Adv. 11(3): 519–23.
30. Putrament, A., Baranowska, H., Bilinsky, T., Prazmo, W., (1972) On the
specificity of caffeine effects. Mol. Gen.118: 373–9.
31. Roussos, S., Hannibal, L., Aquiahuatl, M. A., Trejo Hernandez, M. R., Marakis,
S., (1994), Caffeine degradation by Penicillium verrucosum in solid state
fermentation of coffee pulp: critical effect of additional inorganic and organic
nitrogen sources. J. Food Sci. Technol., 31: 316-319.
32. Roussos, S., Angeles-Aquiahuatl, M.D.L., Trejo-Hernandez, M.D.R., Gaime-
Perraud, I., Favela, E., Ramakrishna, M., (1995), Biotechnological management
132
ePrin
t@CFT
RI

A Biotechnological Approach for Decaffeination Chapter 2
of coffee pulp-isolation, screening, characterization, selection of caffeine
degrading fungi and natural microflora present in coffee pulp and husk. Appl
Microbiol Biotechnol. 42:756–62.
33. Sanchez, G. G., Roussos, S., Augur, C., (2004), Effect of the nitrogen source on
caffeine degradation by Aspergillus tamarii. Letts. Appl. Microbiol. 38(1): 50-55.
34. Sarath Babu, V.R., Patra, S, Karanth, N.G., Varadaraj, M.C., Thakur M.S.,
(2005), Degradation of caffeine by Pseudomonas alcaligenes CFR 1708, Enz,
Microb. Tech. 37: 617-624.
35. Sauer, M., (1982), Comparison of the cytochrome P450 containing
monooxygenases originating from two different yeasts. Dev. Biochem. 23: 452-
457.
36. Schwimmer, S., Kurtzman Jr. R.H., Heftmann E., (1971), Caffeine metabolism by
Penicillium roqueforti. Arch Biochem Biophys; 147:109–13.
37. Silva, C.F.; Scwan, R.F.; Dias, E.S.; Wheals, A.E. (2000), Microbial diversity
during maturation and natural processing of coffee cherries of Coffea arabica in
Brazil. Int. J. Food Microbiol. 60: 251-260.
38. Sundarraj C. V., Dhala, S., (1965), Effect of Naturally Occurring Xanthines on
Bacteria I. Antimicrobial Action and Potentiating Effect on Antibiotic Spectra,
Appl. Microbiol. 13(3): 432–436.
39. Suzuki T, Ashihara H., Waller G. R., (1992), Purine and purine alkaloid
metabolism in Camellia and Coffea plants, Plant Physiol., 31(8): 2575-2584.
40. Vogels, G. D. and Van der Drift C., (1976), Degradation of purines and
pyrimidines by microorganisms. Bacteriol. Rev. 40: 403–468.
41. Waller, G. R., Kumari D., Friedman, J., Friedman, N., Chou, C. H., (1986),
Caffeine autotoxicity in Coffea arabica L. In Advances in Allelopathy. Eds. C. S .
Tang and A. R. Putnam. J. Wiley and Sons, New York.
133
ePrin
t@CFT
RI
A Biotechnological Approach for Decaffeination Chapter 2
134
42. Woolfolk, C.A. (1975), Metabolism of N- methylpurines by a Pseudomonas
putida strain isolated by enrichment on caffeine as the sole source of carbon and
nitrogen. J. Bacteriol, 123: 1088-1106.
43. Woolfolk, C.A., Downard, J.S. (1977), Distribution of xanthine oxidase and
xanthine dehydrogenase specificity types among bacteria. J. Bacteriol. 130: 1175-
1191.
44. Yano, Y.D.M., Mazzafera, P., (1998), Degradation of caffeine by Pseudomonoas
putida isolated from soil. Allel. J; 5: 23–34.
45. Yano, Y.D.M., Mazzafera, P., (1999), Catabolism of Caffeine and Purification of
xanthine oxidase responsible for methyluric acids production in Pseudomonas
putida L. ; Revista de Microbiologia, 30: 62-70.
ePrin
t@CFT
RI
CHAPTER 3 IMMOBILIZATION: AN APPLICATION
ORIENTED METHOD FOR
BIODECAFFEINATION.
ePrin
t@CFT
RI
A Biotechnological Approach for Decaffeination Chapter 3
3.1. SCOPE OF THE WORK:
Biodecaffeination of tea, coffee and other caffeine containing materials is
gaining importance due to the increasing demand for the decaffeinated products and
the consumer preference towards naturally biodecaffeinated products. Development
of biodecaffeination processes for caffeine containing materials requires the
employment of microorganisms or enzymes capable of degrading caffeine.
Immobilized cells have advantages over free cells due to the retention of the cells in
the matrix enabling reuse of the immobilized cells and multi enzymes involved in
sequential degradation of caffeine to NH3 and CO2. The conversion of caffeine to its
metabolites is primarily brought about by N-demethylases (such as caffeine 1N-
demethylase and 3N-demethylase), xanthine oxidase, uricase, urease etc., that are
produced by several caffeine-degrading bacterial species such as Pseudomonas
putida, Serratia, Alcaligenes sp., Rhodococcus, Klebsiella, etc. Development of
biodecaffeination techniques using whole cells offers an attractive alternative to the
present existing chemical and physical methods removal of caffeine, which are costly,
toxic and non-specific to caffeine. This chapter mainly focuses on the microbial
caffeine degradation of caffeine in pure solutions as well as real samples.
135
ePrin
t@CFT
RI
A Biotechnological Approach for Decaffeination Chapter 3
3.2. IMMOBILIZATION:
The technique used for the physical or chemical fixation of cells, organelles,
enzymes, or other proteins (e.g. antibodies), Nucleic acids (DNA, RNA) onto a solid
support, into a solid matrix or retained by a membrane, in order to increase their
stability and make possible their repeated or continued use making the process
economical.
The industrial biotechnology processes using microorganisms generally
involve the cells suspended in the fermentation medium. The classical fermentations
suffer from various constrains such as low cell density, nutritional limitations, and
batch-mode operations requiring high power input. It has been well recognized that
the microbial cell density is of prime importance to attain higher volumetric
productivities. The continuous fermentations with free-cells and cell recycle options
aim to enhance the cell population inside the fermentor. During the last 20–25 years,
the cell immobilization technology, with its origins in enzyme immobilization,
eliminates most of the constrains faced with free-cell systems and has attracted the
attention of several research groups. The remarkable advantage of immobilized cell
based system is the freedom it has to determine the cell density prior to fermentation.
It also facilitates operation of microbial fermentation on continuous mode without
cell washout. Since the early 70s, when Chibata’s group (Chibata et.al., 1974 a&b)
announced successful operation of continuous fermentation of l-aspartic acid,
numerous research groups have attempted various microbial fermentations with
immobilized cells. Several process based on immobilized microbial cells have been
developed.
136
ePrin
t@CFT
RI
A Biotechnological Approach for Decaffeination Chapter 3
3.2.1. Rationale for whole-cell immobilization:
Immobilization commonly is accomplished using a high molecular
hydrophilic polymeric gel such as alginate, carrageenan, agarose, etc. In these cases,
the cells are immobilized by entrapment in the pertinent gel by a drop-forming
procedure. The major factors which determine the applicability of an immobilized
cell based bioprocess include cost of immobilization, mass transport limitations,
applicability to a specific end-product, etc. These factors are to be carefully examined
before choosing any particular methodology.
Many processes have been practised traditionally, embodying the basic
principle of microbial conversions offered by cells bound to surfaces. Some examples
of use of immobilized cells include waste treatment in trickling filters and ethanol
oxidation to produce vinegar. Immobilization of cells is the attachment of cells or
their inclusion in distinct solid phase that permits exchange of substrates, products,
inhibitors, etc., but at the same time separates the catalytic cell biomass from the bulk
phase containing substrates and products. Therefore it is expected that the
microenvironment surrounding the immobilized cells is not necessarily the same
experienced by their free-cell counterparts.
3.2.2. Advantages of immobilized cells (Webb, 1989):
a) The use of immobilized whole microbial cells and/or organelles eliminates the
often tedious, time consuming, and expensive steps involved in isolation and
purification of intracellular enzymes where all the required enzymes are
concentrated in the immobilized cells.
137
ePrin
t@CFT
RI
A Biotechnological Approach for Decaffeination Chapter 3
b) It also tends to enhance the stability of the enzyme by retaining its natural
catalytic surroundings during immobilization and subsequent continuous
operation.
c) It enables the ease of conversion of batch processes into a continuous mode
and maintenance of high cell density without washout conditions even at very
high dilution rates.
d) Immobilized cells are advantageous over immobilized enzymes where co-
factors are necessary for the catalytic reactions. Since co-factor regeneration
machinery is an integral function of the cell, its external supply is
uneconomical.
e) The bound-cell systems are far more tolerant to perturbations in the reaction
environment and similarly less susceptible to toxic substances present in the
liquid medium.
f) Immobilized cells enable higher retention of plasmids and can be used for
recombinant product formation.
3.2.3. Immobilization methods:
Many methods namely adsorption, covalent bonding, cross-linking,
entrapment, and encapsulation are widely used for immobilization (Groboillot, et.al.,
1994). Every method has its own advantages and disadvantages and the
immobilization method varies from process to process.
3.2.3.1. Adsorption:
Adsorption of cells to surfaces is a mild process, and suitable for obtaining
viable cells and the adsorption is based on non-covalent forces such as ionic
138
ePrin
t@CFT
RI

A Biotechnological Approach for Decaffeination Chapter 3
interactions. Ion-exchange materials such as Dowex-1 and DEAE-cellulose have
proved useful (West and Strohfus, 1996). Cell immobilization by this method
depends on a number of factors and one of the most important is the charge on the
support material.
The disadvantage of adsorption is cell leaching, and this would cause serious
problems if the cell continues growing downstream of the reaction or provides a
source for bacterial growth or releases contaminating proteins and biochemicals when
the cell is disrupted (Yaskovich, 1998). Microcarriers (MC) are known to be the best
supports for adsorption of cells. They are very small (0.2mm) so provide a large
surface area for cell growth. One gram of MC provides more than 6000 cm2. MC are
manufactured from dextran, polyacrylamide, or polystyrene and binding of cells is by
ionic attraction (Van Wezel, 1967, Dixit, et.al., 1992). MC are small and would pack
down to much in a column so are always used in a stirred apparatus with gentle
agitation. Salter et. al., (1990) have reported a novel method of cell immobilization
called as Hydrodynamic deposition on ceramic microspheres. The spheres are hollow
and cell immobilization is carried out by passing a cell suspension through a column
of such particles. The advantage of this method is ability to achieve high biomass
densities, while the hydrodynamic properties of columns containing such
immobilized cells are excellent. (Kanasawud, et. al., 1989; Guoqiang et.al., 1992)
3.2.3.2. Covalent bonding:
The mechanism involved in this method is based on covalent bond formation
between activated inorganic support and cell in the presence of a binding
(crosslinking) agent. For covalent linking, chemical modification of the surface is
139
ePrin
t@CFT
RI
A Biotechnological Approach for Decaffeination Chapter 3
necessary. Cells of S. cerevisiae were immobilized by coupling silanized silica beads
(Novarro and Durand, 1977). The reaction requires introduction of reactive organic
group on inorganic silica surface for the reaction between the activated support
material and yeast cells. a -amino propyl triethoxy silane is generally used as the
coupling agent (Marek et. al., 1986). This inorganic functional group condenses with
hydroxyl group on silica surface. As a result, the organic group is available for
covalent bond formation on the surface of silica. Covalent bonding can also be
achieved by treating the silica surface with glutaraldehyde and isocyanate (Kennedy
and Cabral, 1985). A system of more general interest has been developed by Kennedy
and Cabral (1985), using inorganic carrier system. The addition of Ti4+ or Zr4+
chloride salts to water results in pH-dependent formation of gelatinous polymeric
metal hydroxide precipitates wherein the metals are bridged by hydroxyl or oxide
groups. By conducting such a precipitation in a suspension of microbial cells, the
cells have been entrapped in the gel-like precipitate formed. In continuous operation,
titanium hydroxide-immobilized cells of Acetobacter were employed to convert
alcohol to acetic acid.
3.2.3.3. Cross linking:
Microbial cells can be immobilized by cross-linking each other with bi- or
multifunctional reagents such as glutaraldehyde (Novarro, and Durand, 1977),
toluenediisocyanate (Kennedy and Cabral, 1985) was used for cross-linking
obviously imposes limitations for the general applicability of these procedures. Apart
from chemical cross-linking, procedures employing physical processes, such as
flocculation (Lee and Long, 1974) and pelletization (Mcginis, 1985), also benefit the
140
ePrin
t@CFT
RI
A Biotechnological Approach for Decaffeination Chapter 3
immobilization techniques because of strong mutual adherence forces of some
microbial cell cultures. Bacterial cells can be cross-linked using agents such as
glutaraldehyde to join cells together to provide viable cells. If only interested in the
enzyme then a non-viable cell can be produced by heating and has been used to
aggregate bacterial cells directly after fermentation and used for glucose isomerase
activity. Fungal cells have been dried to produce an aggregated mass still have alpha-
galactosidase activity used to refine sucrose. A different type of aggregation uses Ti4+
and Zr4+ chlorides, which produce a polymer metal hydroxide precipitate that
aggregates the cells. Animal cells have not been immobilized extensively by this
method as many procedures involve toxic chemicals.
3.2.3.4. Entrapment:
The most extensively studied method in cell immobilization is the entrapment
of microbial cells in polymer matrices. The matrices used are agar, alginate,
carrageenan, cellulose and its derivatives, collagen, gelatin, epoxy resin, photo cross-
linkable resins, polyacrylamide, polyester, polystyrene and polyurethane. Among the
above matrices, polyacrylamide has been widely used by several workers (Martinsen,
et.al., 1989). The entrapment methods are based on the inclusion of cells within a
rigid network to prevent the cells from diffusing into surrounding medium while still
allowing penetration of substrate. The other procedures for network formation for cell
entrapment are precipitation, ion exchange gelation, and polymerization. The
precipitation techniques are exemplified by collagen (Kurosawa, et al., 1989),
cellulose and carrageenan (Axelsson, et.al., 1994). Entrapment of cells in alginate gel
141
ePrin
t@CFT
RI

A Biotechnological Approach for Decaffeination Chapter 3
is popular because of the requirement for mild conditions and the simplicity of the
used procedure. Several reports on alginate gel are available (Jamuna, et.al., 1992).
κ -carrageenan is one of the earliest gel materials used for cell immobilization
for continuous production of l-lactic acid by Escherichia coli (Ogbonna et.al., 1989).
The immobilization procedure is similar to alginate. Using k -carrageenan, Takata
et al. (1978) reported that the immobilized Brevibacterium flavum attained high
stability against several denaturing chemicals. The rate of cell leakage could be
lowered by hardening the gel with potassium cations. Similarly several other natural
polymers such as agar, agarose, pectin and gelatin were also employed for cell
immobilization. The reversible network formed is affected by certain calcium-
chelating agents like phosphates, Mg2+, K+ and EDTA and the gel integrity was poor.
3.2.4. Immobilization matrices:
Immobilization matrices must prevent the bacteria from dislodging from the
matrix and flowing downstream. An ideal immobilization matrix would be functional
at ambient temperatures, survive harsh wastewater conditions including contaminated
water and turbidity, and allow the flow of nutrients and oxygen and analytes through
the matrix along with wastes out. It would also prevent cell flow within the matrix.
There are several types of immobilization matrices used for whole cells studied today.
3.2.4.1. Alginates:
Common immobilization matrices include naturally occurring alginates.
Alginates are formed by converting mannuronic and guluronic acid into their salt
forms of mannuronate (M) and guluronate (G). They are copolymers consisting of (1-
4) linked β-D-mannuronic acid and β-L-guluronic acid (Smidsrod and Skajk., 1990).
142
ePrin
t@CFT
RI

A Biotechnological Approach for Decaffeination Chapter 3
Alginates are linear polymers comprised of blocks of M and G, or alternating GM
blocks. Alginates are often used in the food industry as gelling compounds, such as in
the production of the meat-like chunks found in pet food. Alginates are ionically
crosslinked between the carboxylic acid elements through divalent ions like Ca+2.
Because their crosslinks are ionic as opposed to covalent, they are easily broken apart
by cationic scavengers such as sodium citrate and chelators such as ethylene diamine
tetra acetic acid (EDTA) (Smeds and Grinstaff, 2001, Lu et al., 2000). In addition to
the weak bonding structure, natural hydrogels are also susceptible to biodegradation,
making their use somewhat limited depending upon the cell type being immobilized.
3.2.4.2. Photopolymers:
Another commonly used class of immobilization matrices is photopolymers.
Most photopolymers utilize visible or ultraviolet light to crosslink the monomers used
in the formation of the matrices. Some photopolymers utilize harsh chemical initiators
to facilitate the polymerization. A photon from the light source breaks the photo
initiator into groups of highly energized radicals. The radicals then react with the
resident monomer in solution and initiate the thermoset polymerization (Bryant et al.,
2000). This method has a major drawback of loss of cells.
3.2.4.3. Sol gels:
Sol gels are hybrid organic-inorganic compounds that are a bridge between
glasses and polymers (Livage, 1997). Sol gels are rigid, thermally and structurally
stable, and transparent, making them very useful for the immobilization of cells that
are luminescent or show other visible changes when sensing the environment. Most
commonly used sol-gels are silica gels which are made by the hydrolysis and
143
ePrin
t@CFT
RI
A Biotechnological Approach for Decaffeination Chapter 3
condensation of silicon alkoxides that produces alcohol, a cell killer (Nassif et al.,
2002). Recently, aqueous silica gels formed at room temperature have been found to
effectively immobilize viable bacterial cells (Brinker and Scherrer, 1990, Yu, et al.,
2004). The aqueous silica provides a non-toxic and biologically inert environment
that shows an increase in overall cell viability when formed in the presence of
glycerol (Nassif, et.al., 2003).
3.2.4.4. Thermally reversible gels:
Thermally reversible gels, while most commonly used in drug delivery
systems, are quickly being viewed as a potential matrix for immobilization. In
aqueous solutions, thermally reversible gels undergo volume-phase transitions about a
certain temperature (Sun, et al., 2003). They form collapsed, dehydrated, hydrophobic
gels above a lower critical solution temperature (LCST) and swollen, hydrated,
hydrophilic dispersed solutions below the LCST. Cells can be easily immobilized by
mixing cells with the aqueous thermally reversible gel solution at low temperatures.
When the solution temperature is raised above its LCST, the cells will be
immobilized within the hydrogel matrix.
3.2.4.5. Modified methods of cell immobilization:
Entrapment of microbial cells within the polymeric matrices is preferred by
many researchers. Among the various methods, alginate gels have received maximum
attention. There are several studies on the composition of alginate and their suitability
for cell immobilization (Nguyen and Luong, 1986; Kurosawa et al., 1989; Mignot,
and Junter, 1990). Studies on the diffusional characteristics of the immobilized
system are being carried out to provide a better understanding on the
144
ePrin
t@CFT
RI
A Biotechnological Approach for Decaffeination Chapter 3
microenvironment prevailing near the immobilized cells (Axelsson, et. al, 1994;
Westrin, 1990; Willaert, and Baron, 1994; Teixeira, et.al., 1994; Jamuna et.al., 1992;
Ogbonna et.al., 1989; Vorlop, and Klein, 1981) which will enable researchers to
optimize the immobilization protocols (Nishida et.al., 1977; Takata et.al., 1978) and
to improve the stability of the gel beads by modifying the protocols like hardening the
beads by glutaraldehyde treatment (Ruggeri et.al., 1991; Yamagiwa et.al., 1993).
Incorporation of additional component into the gel matrix to improve the
mechanical strength has been tried. Several components such as silica (Chu et.al.,
1995), sand, alumina, and various gums are generally used. In addition, the gel
particles are further strengthened by treating with various cross-linking agents, such
as glutaraldehyde. Chu et al. (1995) reported the polyelectrolyte complex gel
prepared from xanthan and chitosan for immobilization of Corynebacterium
glutamicum having fumarase activity. By mixing two opposite-charged electrolytes, a
complex resulted due to electrostatic interactions. Generally, these complexes were
obtained as precipitates, but Sakiyama et al (1993) and Chu et al. (1995) obtained
moldable chitosan/ k -carrageenan and xanthan/chitosan complex gels in the presence
of NaCl. It has been observed that the cells immobilized in these complexes were
very stable and exhibited 5-fold higher activity compared to free-cells. The pore size
was found to be similar to that of polysaccharide gel. In a similar study, Pandya and
Knorr (1991) used low molecular weight compounds which were immobilized in
complex coacervate capsules consisting of water-soluble chitosan salts or acid-
soluble chitosan cross-linked with k -carrageenan or alginate. This type of coacervate
145
ePrin
t@CFT
RI
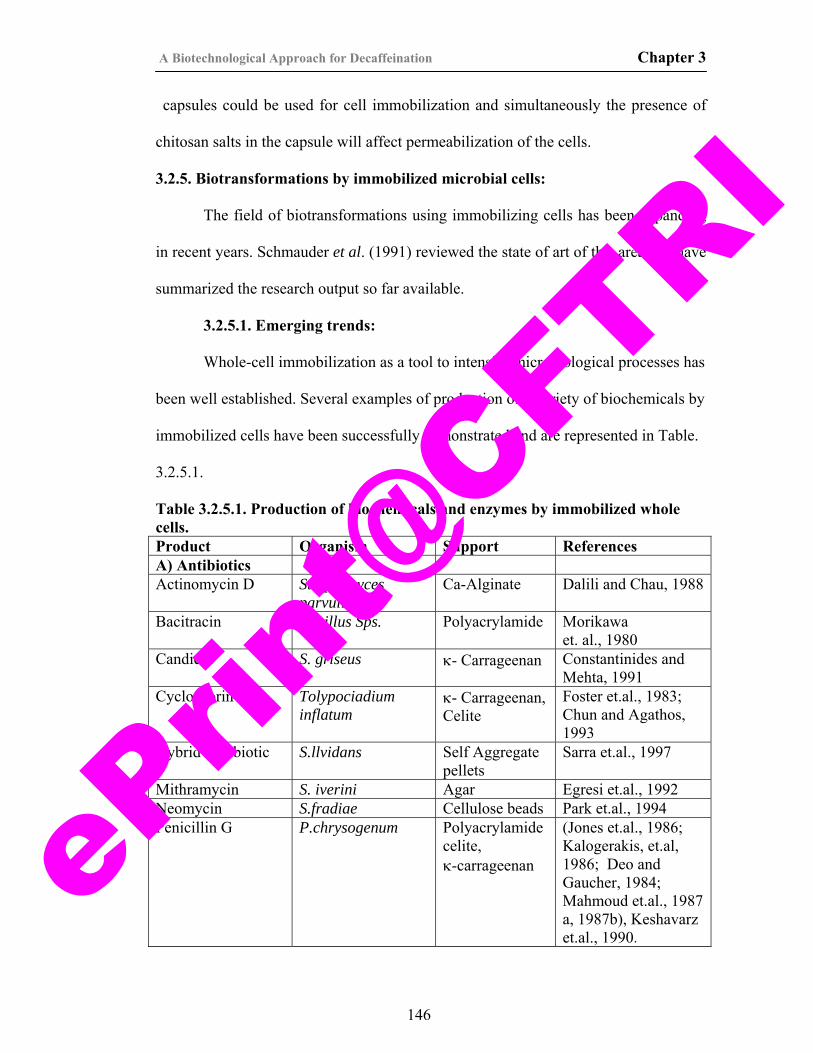
A Biotechnological Approach for Decaffeination Chapter 3
capsules could be used for cell immobilization and simultaneously the presence of
chitosan salts in the capsule will affect permeabilization of the cells.
3.2.5. Biotransformations by immobilized microbial cells:
The field of biotransformations using immobilizing cells has been expanding
in recent years. Schmauder et al. (1991) reviewed the state of art of this area and have
summarized the research output so far available.
3.2.5.1. Emerging trends:
Whole-cell immobilization as a tool to intensify microbiological processes has
been well established. Several examples of production of a variety of biochemicals by
immobilized cells have been successfully demonstrated and are represented in Table.
3.2.5.1.
Table 3.2.5.1. Production of biochemicals and enzymes by immobilized whole cells. Product Organism Support References A) Antibiotics Actinomycin D Streptomyces
parvullus Ca-Alginate Dalili and Chau, 1988
Bacitracin Bacillus Sps. Polyacrylamide Morikawa et. al., 1980
Candicin S. griseus κ- Carrageenan Constantinides and Mehta, 1991
Cyclosporin A Tolypociadium inflatum
κ- Carrageenan, Celite
Foster et.al., 1983; Chun and Agathos, 1993
Hybrid Antibiotic S.llvidans Self Aggregate pellets
Sarra et.al., 1997
Mithramycin S. iverini Agar Egresi et.al., 1992 Neomycin S.fradiae Cellulose beads Park et.al., 1994 Penicillin G P.chrysogenum Polyacrylamide
celite, κ-carrageenan
(Jones et.al., 1986; Kalogerakis, et.al, 1986; Deo and Gaucher, 1984; Mahmoud et.al., 1987 a, 1987b), Keshavarz et.al., 1990.
146
ePrin
t@CFT
RI
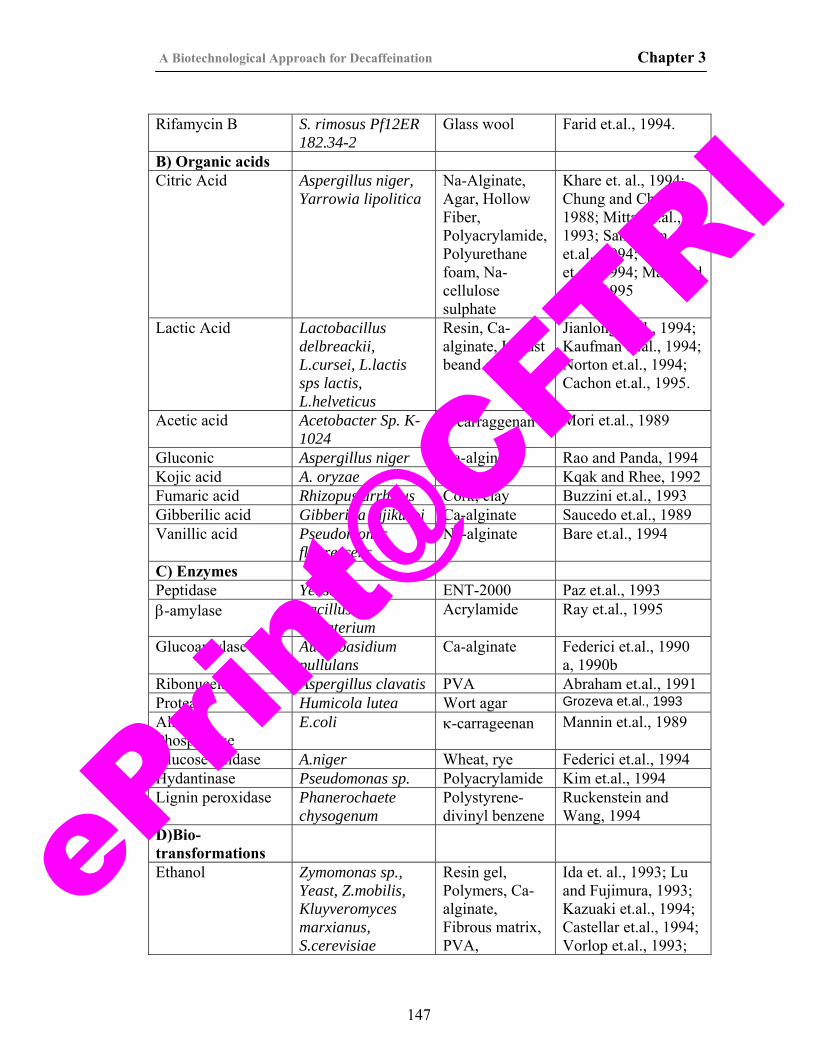
A Biotechnological Approach for Decaffeination Chapter 3
Rifamycin B S. rimosus Pf12ER
182.34-2 Glass wool Farid et.al., 1994.
B) Organic acids Citric Acid Aspergillus niger,
Yarrowia lipolitica Na-Alginate, Agar, Hollow Fiber, Polyacrylamide, Polyurethane foam, Na-cellulose sulphate
Khare et. al., 1994; Chung and Chang, 1988; Mittal et.al., 1993; Sanroman et.al., 1994; Ostr, et.al., 1994; Mansfeld et.al., 1995
Lactic Acid Lactobacillus delbreackii, L.cursei, L.lactis sps lactis, L.helveticus
Resin, Ca-alginate, Locust beand gel
Jianlong et.al., 1994; Kaufman et.al., 1994; Norton et.al., 1994; Cachon et.al., 1995.
Acetic acid Acetobacter Sp. K-1024
κ-carraggenan Mori et.al., 1989
Gluconic Aspergillus niger Ca-alginate Rao and Panda, 1994 Kojic acid A. oryzae Alginate Kqak and Rhee, 1992 Fumaric acid Rhizopus arrhizus Cork, clay Buzzini et.al., 1993 Gibberilic acid Gibberilla fujikuroi Ca-alginate Saucedo et.al., 1989 Vanillic acid Pseudomonas
fluorescens Na-alginate Bare et.al., 1994
C) Enzymes Peptidase Yeast ENT-2000 Paz et.al., 1993 β-amylase Bacillus
megaterium Acrylamide Ray et.al., 1995
Glucoamylase Aureobasidium pullulans
Ca-alginate Federici et.al., 1990 a, 1990b
Ribonucelase Aspergillus clavatis PVA Abraham et.al., 1991 Protease Humicola lutea Wort agar Grozeva et.al., 1993Alkaline Phosphatase
E.coli κ-carrageenan Mannin et.al., 1989
Glucose oxidase A.niger Wheat, rye Federici et.al., 1994 Hydantinase Pseudomonas sp. Polyacrylamide Kim et.al., 1994 Lignin peroxidase Phanerochaete
chysogenum Polystyrene-divinyl benzene
Ruckenstein and Wang, 1994
D)Bio- transformations
Ethanol Zymomonas sp., Yeast, Z.mobilis, Kluyveromyces marxianus, S.cerevisiae
Resin gel, Polymers, Ca-alginate, Fibrous matrix, PVA,
Ida et. al., 1993; Lu and Fujimura, 1993; Kazuaki et.al., 1994; Castellar et.al., 1994; Vorlop et.al., 1993;
147
ePrin
t@CFT
RI
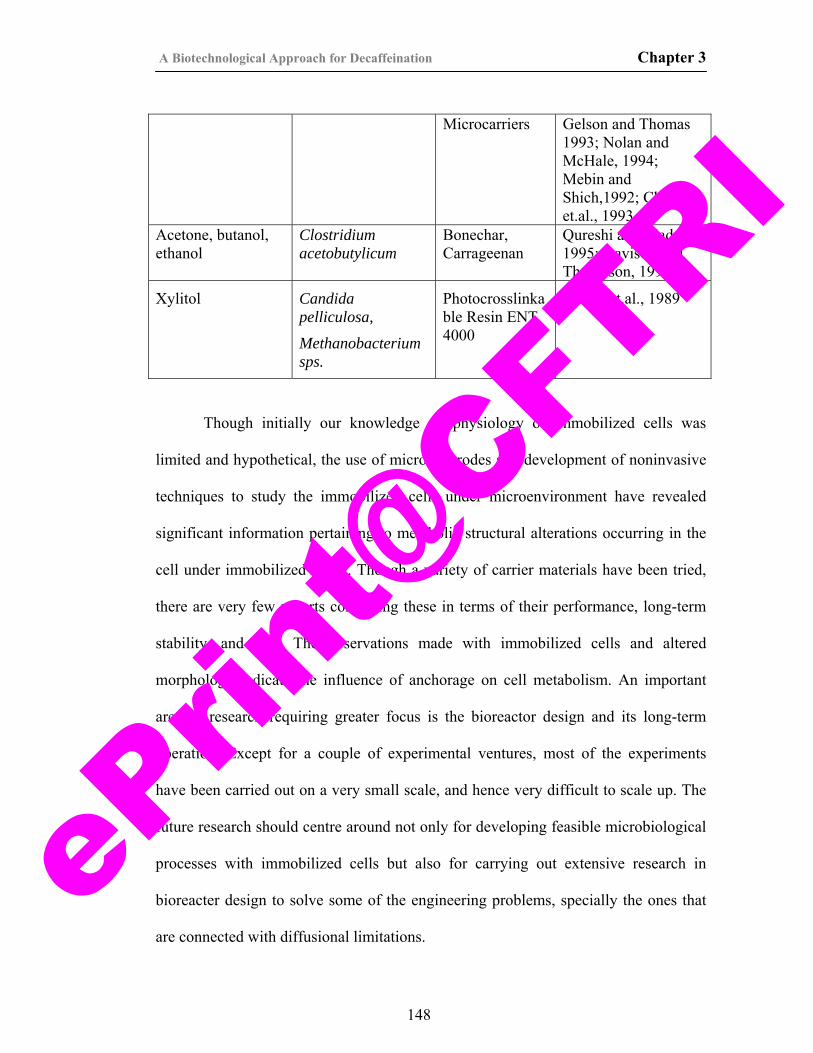
A Biotechnological Approach for Decaffeination Chapter 3
Microcarriers Gelson and Thomas
1993; Nolan and McHale, 1994; Mebin and Shich,1992; Cheong et.al., 1993
Acetone, butanol, ethanol
Clostridium acetobutylicum
Bonechar, Carrageenan
Qureshi and Maddox, 1995; Davison and Thompson, 1993
Xylitol Candida pelliculosa,
Methanobacterium sps.
Photocrosslinkable Resin ENT 4000
Nishio et.al., 1989
Though initially our knowledge on physiology of immobilized cells was
limited and hypothetical, the use of microelectrodes and development of noninvasive
techniques to study the immobilized cells under microenvironment have revealed
significant information pertaining to metabolic structural alterations occurring in the
cell under immobilized phase. Though a variety of carrier materials have been tried,
there are very few reports comparing these in terms of their performance, long-term
stability, and cost. The observations made with immobilized cells and altered
morphology indicate the influence of anchorage on cell metabolism. An important
area of research requiring greater focus is the bioreactor design and its long-term
operation. Except for a couple of experimental ventures, most of the experiments
have been carried out on a very small scale, and hence very difficult to scale up. The
future research should centre around not only for developing feasible microbiological
processes with immobilized cells but also for carrying out extensive research in
bioreacter design to solve some of the engineering problems, specially the ones that
are connected with diffusional limitations.
148
ePrin
t@CFT
RI

A Biotechnological Approach for Decaffeination Chapter 3
3.2.6. Application of immobilized cells for biodecaffeination:
Caffeine is an alkaloid naturally occurring in coffee, cocoa beans, cola nuts
and tea leaves, and is a central nervous system stimulant. It is known to show toxicity
when fed in excess and is even mutagenic in-vitro (Friedman and Waller, 1983a and
b). Excessive consumption of caffeine through beverages is associated with a number
of health problems (Friedman and Waller, 1983a and b, Srisuphan and Bracken,
1986, Dlugosz et.al., 1996). Increasing knowledge of the effects of caffeine on
human health led to the development of processes for decaffeination using solvents
which are considered unsafe for humans. Biotechnological means of decaffeination
have been considered as safe alternatives for the conventional decaffeination
processes. Since 1970’s several studies have been conducted by several groups in the
world on the identification of caffeine degrading organisms for possible use in the
development of biodecaffeination technologies.
Caffeine degrading bacteria and fungi have immense potential in the
decaffeination processes for utilization of coffee, tea and other caffeine containing
wastes which are otherwise unusable and pose sever health and environmental
problems (Roussos, et.al., 1995). Although several reports on the use of free cells of
bacteria and fungi for the degradation of caffeine are available, they are limited to
solid state fermentation of caffeine containing agro wastes (Jarquín, 1987). Caffeine
is now being determined as a marker for contamination of water and processes
involving decontamination of caffeine laden waste waters have high environmental
significance. Literature in this area is scanty. Middelhoven and Beckker- (1982)
report the immobilization of a caffeine-resistant strain of Pseudomonas putida
149
ePrin
t@CFT
RI
A Biotechnological Approach for Decaffeination Chapter 3
isolated from soil in agar gel particles which were continuously supplied with a
caffeine solution in a homogeneously mixed aerated reaction vessel. The caffeine
degradation was monitored in this reactor system. No other reports are available on
the immobilization of microbial cells for the degradation of caffeine. Caffeine
degrading microorganisms utilizing caffeine as the sole source of carbon and
nitrogen have been isolated and characterized which have enzymes that bring about
the actual degradation of the substrate. In this communication, we report the isolation
of an effective caffeine-degrading microbe (P. alcaligenes MTCC 5264) from soil,
its growth and decaffeination studies.
150
ePrin
t@CFT
RI

A Biotechnological Approach for Decaffeination Chapter 3
3.3. MATERIALS AND METHODS:
Sodium alginate, κ- carrageenan, agar, potassium chloride, peptone and yeast
extract were procured from M/s HiMedia Labs, Mumbai, India. Sucrose, potassium
dihydrogen orthro phosphate, ammonium sulphate and toluene were from Qualigenes
Fine Chemicals, Mumbai, India. Gelatin (Porcine Skin), γ-aminopropyl trimethoxy
silane, sodium cyanoborohydride, polyethyleneimine and glutaraldehyde were
procured from Sigma-Aldrich, St. Louis, USA. All other chemicals and reagents
were procured from standard sources and were of highest purity. Double distilled
water was used in all the experiments.
3.3.1. Studies on biodecaffeination by P. alcaligenes MTCC 5264:
Pseudomonas alcaligenes MTCC 5264 which was isolated in our lab from
soils of coffee plantations and maintained by sub-culturing on caffeine containing
nutrient agar slants was used for the present study. Studies on the degradation of
caffeine by this strain, immobilization of whole cells in different matrices and
biodecaffeination of pure caffeine solutions and caffeine containing real samples
were carried out.
3.3.2. Growth of cells and induction for biodecaffeination:
A loop full of actively growing culture of P. alcaligenes MTCC 5264 was
transferred to 100 ml of nutrient broth containing 0.3 g/l caffeine and incubated at
30oC in an orbital shaker set at 150rpm for 24 hrs. A 5% v/v of the 24 hrs grown pre
inoculum was transferred to 100 ml of nutrient broth containing 0.3g.L-1 caffeine and
grown under the same conditions.
151
ePrin
t@CFT
RI

A Biotechnological Approach for Decaffeination Chapter 3
Aliquots of samples (10 ml) were drawn from each flask at known intervals
of time for the measurement of cell growth. Biomass accumulated in the flasks after
24 hours was harvested by centrifugation in a bench top centrifuge (Kubota, Japan)
at 16,000g for 20 min at 0-40 C to form a pellet. The biomass pellet was aseptically
transferred into a 500ml flask containing 100ml of caffeine liquid medium (CLM)
containing 1g/l caffeine and incubated at 30oC on the orbital shaker for a period of
48hrs for inducing the cells to degrade caffeine. These induced cells (incubated in
CLM for 48 hrs) were harvested by centrifugation as before. The cells were washed
several times to remove caffeine. 10 gms of these induced cells were suspended in
100 ml of phosphate buffer, which were used for caffeine degradation experiments.
3.3.3. Caffeine degradation experiments:
Induced cell suspension (10 ml) was aseptically transferred to 90ml of CLM
containing 1g/l caffeine and incubated on a rotary shaker at 30oC set at 150 rpm for
24 hours. 0.5 ml aliquot samples were drawn at 2, 4, 6, 12 and 24 hours, centrifuged
and the supernatants were analyzed for residual caffeine content.
Studies on the effect of pH and temperature on biodecaffeination by the
isolate were carried out by incubating the induced cells in CLM containing 1g/l
caffeine, which was adjusted to different pH and temperature.
For studying the effect of inoculum on caffeine degradation, induced cell
suspension was added to CLM containing 1g/l caffeine so as to obtain inoculum
levels of 1.2, 2.5, 5.0 and 7.5%w/v (based on wet weight). Studies on the effect of
caffeine concentration on the biodecaffeination efficiency of the isolate were carried
out by incubating the induced cells in CLM containing caffeine in the concentration
152
ePrin
t@CFT
RI
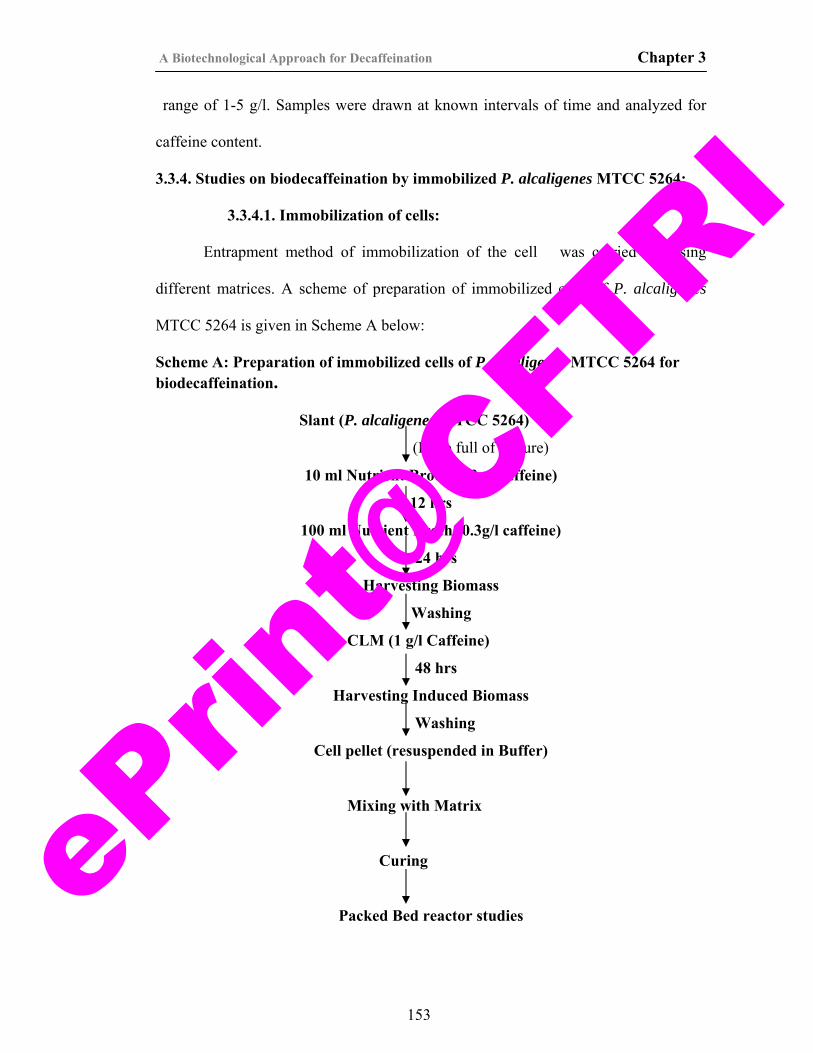
A Biotechnological Approach for Decaffeination Chapter 3
range of 1-5 g/l. Samples were drawn at known intervals of time and analyzed for
caffeine content.
3.3.4. Studies on biodecaffeination by immobilized P. alcaligenes MTCC 5264: 3.3.4.1. Immobilization of cells:
Entrapment method of immobilization of the cell was carried out using
different matrices. A scheme of preparation of immobilized cells of P. alcaligenes
MTCC 5264 is given in Scheme A below:
Scheme A: Preparation of immobilized cells of P. alcaligenes MTCC 5264 for biodecaffeination.
Slant (P. alcaligenes MTCC 5264)
(Loop full of culture)
10 ml Nutrient Broth (0.3g/l caffeine)
12 hrs
100 ml Nutrient Broth (0.3g/l caffeine)
24 hrs
Harvesting Biomass
Washing
CLM (1 g/l Caffeine)
48 hrs
Harvesting Induced Biomass
Washing
Cell pellet (resuspended in Buffer)
Mixing with Matrix
Curing
Packed Bed reactor studies
153
ePrin
t@CFT
RI
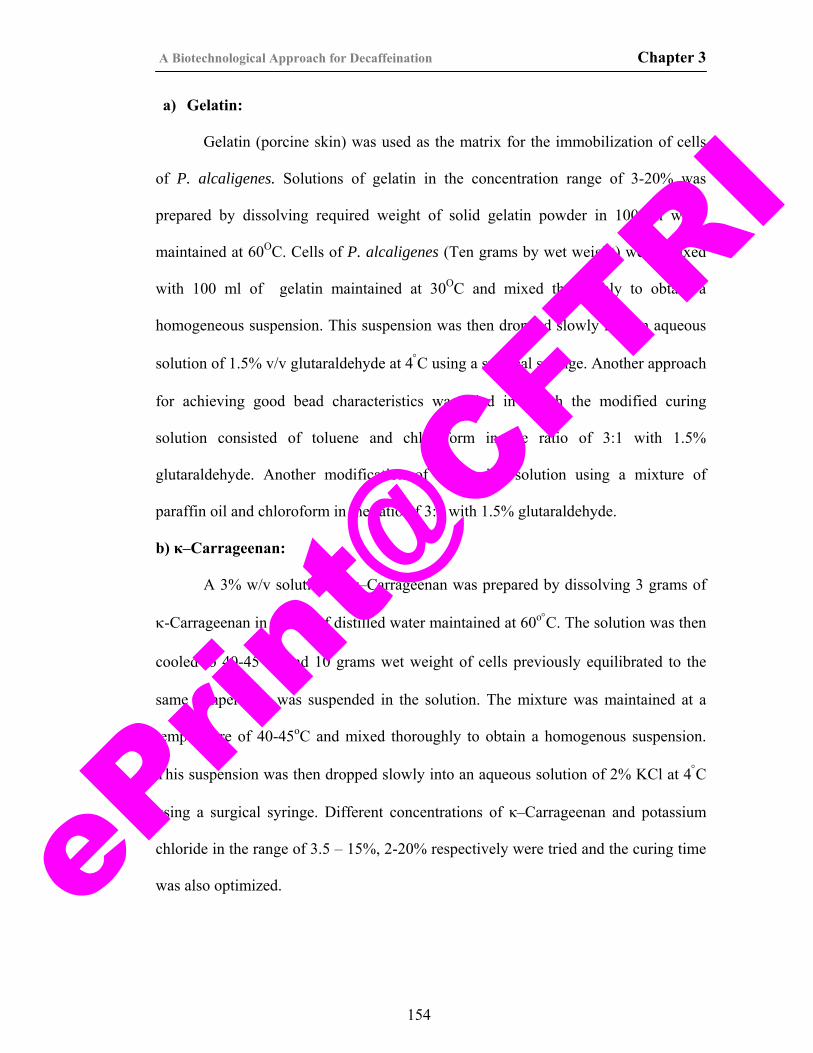
A Biotechnological Approach for Decaffeination Chapter 3
a) Gelatin:
Gelatin (porcine skin) was used as the matrix for the immobilization of cells
of P. alcaligenes. Solutions of gelatin in the concentration range of 3-20% was
prepared by dissolving required weight of solid gelatin powder in 100 ml water
maintained at 60OC. Cells of P. alcaligenes (Ten grams by wet weight) were mixed
with 100 ml of gelatin maintained at 30OC and mixed thoroughly to obtain a
homogeneous suspension. This suspension was then dropped slowly into an aqueous
solution of 1.5% v/v glutaraldehyde at 4°C using a surgical syringe. Another approach
for achieving good bead characteristics was tried in which the modified curing
solution consisted of toluene and chloroform in the ratio of 3:1 with 1.5%
glutaraldehyde. Another modification of the curing solution using a mixture of
paraffin oil and chloroform in the ratio of 3:1 with 1.5% glutaraldehyde.
b) κ–Carrageenan:
A 3% w/v solution of κ–Carrageenan was prepared by dissolving 3 grams of
κ-Carrageenan in 100ml of distilled water maintained at 60o°C. The solution was then
cooled to 40-45o°C and 10 grams wet weight of cells previously equilibrated to the
same temperature was suspended in the solution. The mixture was maintained at a
temperature of 40-45oC and mixed thoroughly to obtain a homogenous suspension.
This suspension was then dropped slowly into an aqueous solution of 2% KCl at 4°C
using a surgical syringe. Different concentrations of κ–Carrageenan and potassium
chloride in the range of 3.5 – 15%, 2-20% respectively were tried and the curing time
was also optimized.
154
ePrin
t@CFT
RI
A Biotechnological Approach for Decaffeination Chapter 3
c) Agar:
Immobilisation of the cell of P. alcaligenes MTCC 5264 in agar was done
by dissolving 3 gm of agar in 100ml of distilled water 80OC and then cooling it to
40O C with subsequent mixing of 10 gm of cell equilibrated to the same temperature.
After thorough mixing, the suspension was dropped through a syringe into water
maintained at 4 OC.
d) Sodium alginate:
Sodium alginate solution (3% w/v) and was prepared and sterilized. 10 grams
cell by wet weight was mixed thoroughly in the alginate solution. The cell suspension
was dropped slowly into a solution of 0.22 M Calcium chloride at 4oC. The beads
were kept for primary curing at 4oC for 24 hours and secondary curing was done in
0.02 M calcium chloride for 48 hours at 4oC. Traces of calcium chloride were
removed by through washing with distilled water and used for further studies.
3.3.4.2. Biodecaffeination by immobilized cells:
a) Shake flask experiments:
Immobilized cells of P. alcaligenes MTCC 5264 were tested for the ability to
degrade caffeine in shake flask. 10 gm of the immobilized beads were incubated with
100 ml of the working medium under agitation on a rotary shaker set at 200 rpm at
30±2oC.
b) Packed column reactor studies:
Cells of P. alcaligenes MTCC 5264 immobilized in different matrices was
packed into glass columns of 2 cm internal diameter and 20 cm length. The total bed
volume was 34.54 ml. Working medium, i.e. PO4 Buffer, 5μM, and pH 7.2 containing
155
ePrin
t@CFT
RI
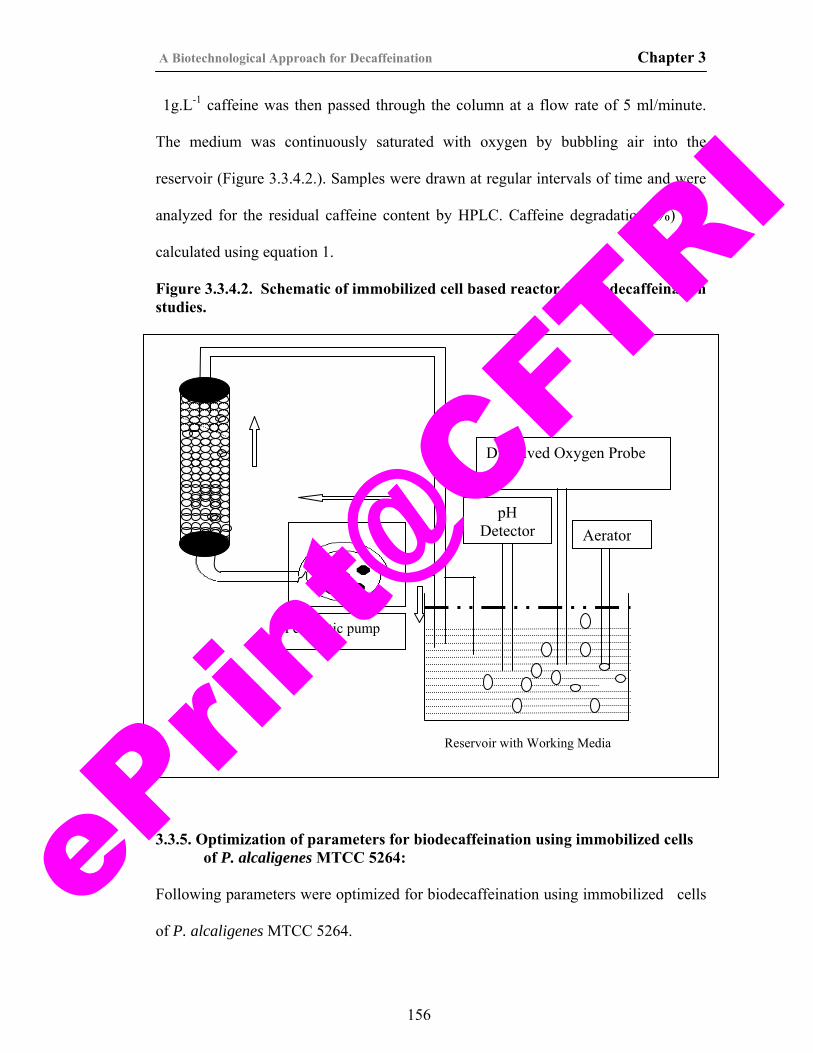
A Biotechnological Approach for Decaffeination Chapter 3
1g.L-1 caffeine was then passed through the column at a flow rate of 5 ml/minute.
The medium was continuously saturated with oxygen by bubbling air into the
reservoir (Figure 3.3.4.2.). Samples were drawn at regular intervals of time and were
analyzed for the residual caffeine content by HPLC. Caffeine degradation (%) was
calculated using equation 1.
Figure 3.3.4.2. Schematic of immobilized cell based reactor for biodecaffeination studies.
Dissolved Oxygen Probe
pH Detector Aerator
Peristaltic pump
Reservoir with Working Media
3.3.5. Optimization of parameters for biodecaffeination using immobilized cells
of P. alcaligenes MTCC 5264: Following parameters were optimized for biodecaffeination using immobilized cells
of P. alcaligenes MTCC 5264.
156
ePrin
t@CFT
RI
A Biotechnological Approach for Decaffeination Chapter 3
3.3.5.1. Effect of Buffer composition and phosphate concentration:
Various buffers like Tris-Cl, acetate, carbonate and phosphate buffer were
tested for degradation of caffeine by P. alcaligenes MTCC 5264 by incubating the
immobilized cells with different buffers containing caffeine. The effect of phosphate
concentration on stability of calcium alginate was determined by incubating the
immobilized cells with phosphate buffer containing phosphates in the range of 5µM
to 100mM.
3.3.5.2. Effect of pH:
For maximal caffeine degradation it is important that the working medium
should be at an optimal pH, which would maintain the cells in their viable state, and
the enzymes responsible for decaffeination are highly active. Phosphate buffer at
different pH was used for biodecaffeination of caffeine solution and the residual
caffeine at different pH was recorded.
3.3.5.3. Temperature:
Immobilized cells of P. alcaligenes MTCC 5264 were incubated with
phosphate buffer containing 1g.L-1 of caffeine which was adjusted to 18, 28, 32, 48
and 600C in a water bath and incubated for 96 hours and checked for
biodecaffeination ability.
3.3.5.4. Effect of cell loading on the immobilization of whole cell for decaffeination:
Cell suspensions containing w/v of cells (wet weight) in 3% sodium alginate
solution were prepared and dropped slowly into a 2% calcium chloride solution and
cured in the same solution. The immobilized cells were then incubated with caffeine
and their decaffeination ability was checked.
157
ePrin
t@CFT
RI
A Biotechnological Approach for Decaffeination Chapter 3
3.3.5.5. Effect of flow rate:
To enable a proper retention time of the sample in the column for increased
contact an optimum flow rate is necessary. For this, flow rates of 1, 2, 3, 5, 7 and 10
ml/min were tested.
3.3.5.6. Oxygen availability:
The caffeine-degrading organism being an aerobe needs oxygen for its
viability. Further, some of the enzymes involved in caffeine degradation pathway are
also oxygenases necessitating the presence of molecular oxygen in the system.
Therefore to check the requirement of oxygen for efficient degradation of caffeine,
experiment was conducted without external oxygen supply.
3.3.5.7. Biodecaffeination of tea extract using immobilized cells:
Extract of tea sample was prepared by boiling 10 grams of tea powder in
100ml of distilled water then filtering it. The caffeine content of the extract was
checked by HPLC analysis (Martin et al., 2000). The extract was then recirculated
through the column at a flow rate of 5ml/min for 5 hours. Aliquots of samples (1ml)
were collected at regular intervals and analyzed for residual caffeine through HPLC
analysis.
% Caffeine degradation = (a- b) x 100/a Eqn.1
where, a = initial caffeine concentration, and
b = residual caffeine concentration
158
ePrin
t@CFT
RI
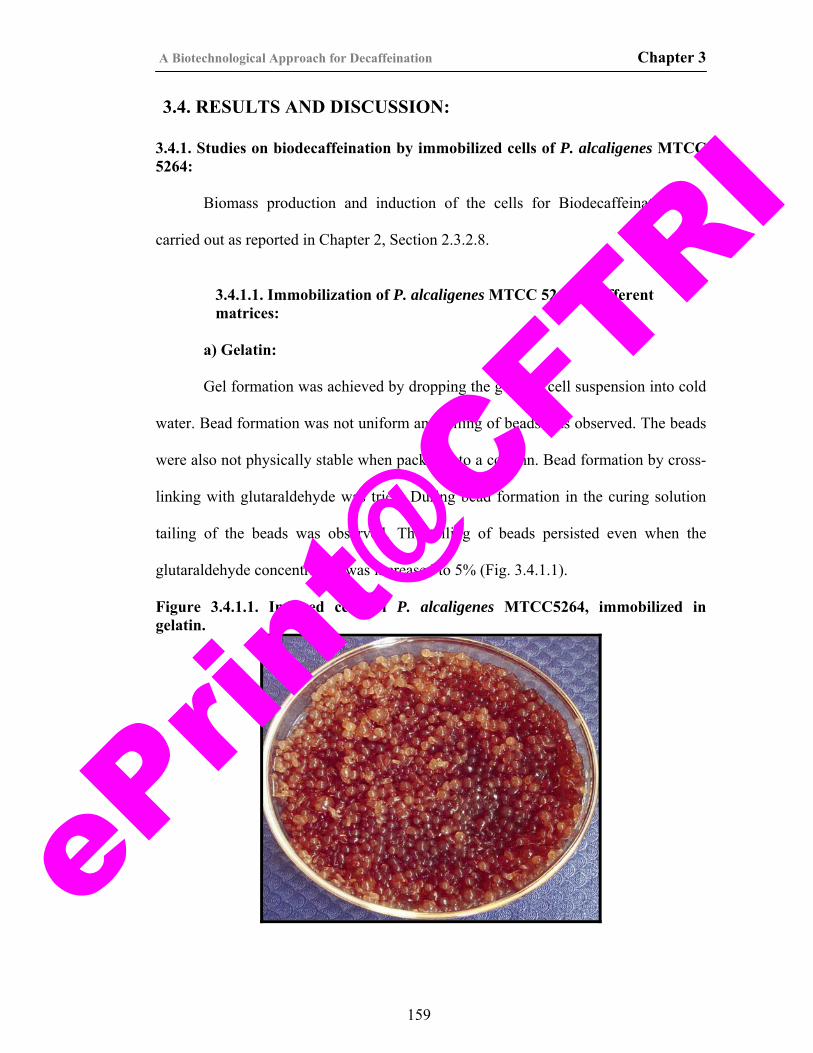
A Biotechnological Approach for Decaffeination Chapter 3
3.4. RESULTS AND DISCUSSION:
3.4.1. Studies on biodecaffeination by immobilized cells of P. alcaligenes MTCC 5264:
Biomass production and induction of the cells for Biodecaffeination was
carried out as reported in Chapter 2, Section 2.3.2.8.
3.4.1.1. Immobilization of P. alcaligenes MTCC 5264 in different matrices:
a) Gelatin:
Gel formation was achieved by dropping the gelatin- cell suspension into cold
water. Bead formation was not uniform and tailing of beads was observed. The beads
were also not physically stable when packed into a column. Bead formation by cross-
linking with glutaraldehyde was tried. During bead formation in the curing solution
tailing of the beads was observed. The tailing of beads persisted even when the
glutaraldehyde concentration was increased to 5% (Fig. 3.4.1.1).
Figure 3.4.1.1. Induced cells of P. alcaligenes MTCC5264, immobilized in gelatin.
159
ePrin
t@CFT
RI

A Biotechnological Approach for Decaffeination Chapter 3
Changing the curing condition by using toluene and chloroform in the ratio
of 3:1 with 1.5% glutaraldehyde led to formation of beads with good strength and
shape. But the use of toluene is toxic to cells. Another modification of the curing
solution using a mixture of paraffin oil and chloroform in the ratio of 3:1 with 1.5%
glutaraldehyde gave beads with good stability. However this approach necessitates
extensive washing to remove the paraffin oil on the surface. Despite giving several
washes a coat of oil persisted. When P. alcaligenes MTCC 5264 immobilized using
this method was used for decaffeination, it was found that caffeine degradation was
not considerable for further work to be carried out. Also because of the toxicity of the
solvents used it’s not a viable approach for use in case of real samples. Only 3%
caffeine degradation was observed in 80 hours using gelatin as the matrix for bead
formation (Figure. 3.4.1.2.).
Under Scanning electron microscope (SEM) of the beads appeared to be
compact (Figure 3.4.1.3) probably having low porosity. The low porosity of the beads
offers diffusional resistance to caffeine and oxygen entering the beads leading to a
low efficiency of the beads. Also the high concentration of glutaraldehyde, used for
cross linking may be toxic to the cell probably leading to loss of viability of many
cells in the matrix, hence the low rate of caffeine degradation.
The beads obtained were not of uniform size and also lacked bead strength
and hindered the flow, when packed into a column. Hence this matrix was not used
for further studies.
160
ePrin
t@CFT
RI
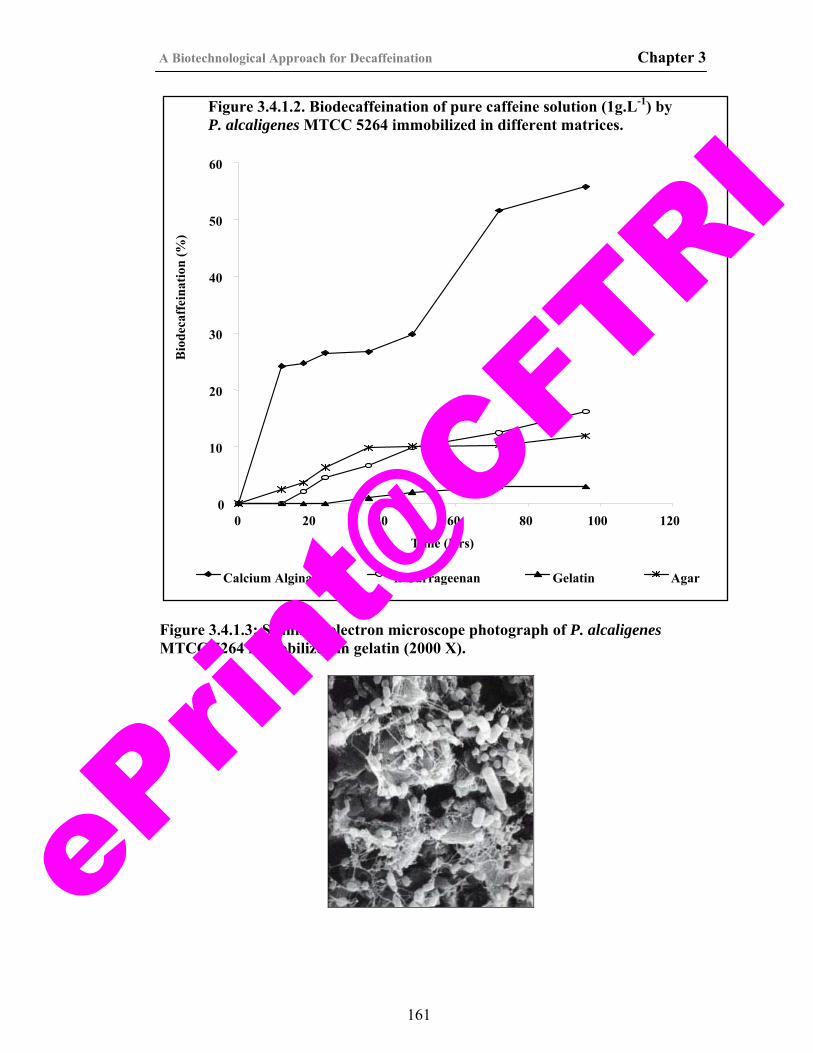
A Biotechnological Approach for Decaffeination Chapter 3
AgarGelatink-CarrageenanCalcium Alginate
Bio
deca
ffei
natio
n (%
)
Time (Hrs)
60 80 100 12020 400
60
50
40
30
20
10
0
Figure 3.4.1.2. Biodecaffeination of pure caffeine solution (1g.L-1) by P. alcaligenes MTCC 5264 immobilized in different matrices.
Figure 3.4.1.3: Scanning electron microscope photograph of P. alcaligenes MTCC 5264 immobilized in gelatin (2000 X).
161
ePrin
t@CFT
RI
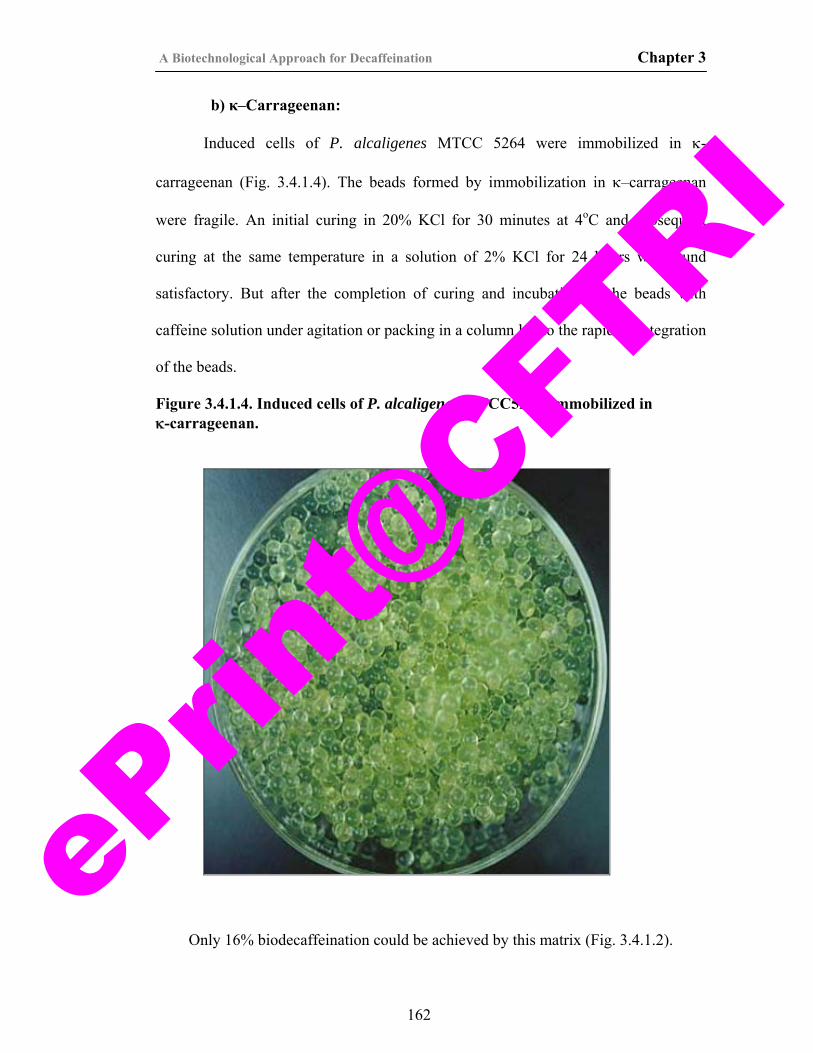
A Biotechnological Approach for Decaffeination Chapter 3
b) κ–Carrageenan:
Induced cells of P. alcaligenes MTCC 5264 were immobilized in κ-
carrageenan (Fig. 3.4.1.4). The beads formed by immobilization in κ–carrageenan
were fragile. An initial curing in 20% KCl for 30 minutes at 4oC and subsequent
curing at the same temperature in a solution of 2% KCl for 24 hours was found
satisfactory. But after the completion of curing and incubation of the beads with
caffeine solution under agitation or packing in a column led to the rapid disintegration
of the beads.
Figure 3.4.1.4. Induced cells of P. alcaligenes MTCC5264, immobilized in κ-carrageenan.
Only 16% biodecaffeination could be achieved by this matrix (Fig. 3.4.1.2).
162
ePrin
t@CFT
RI
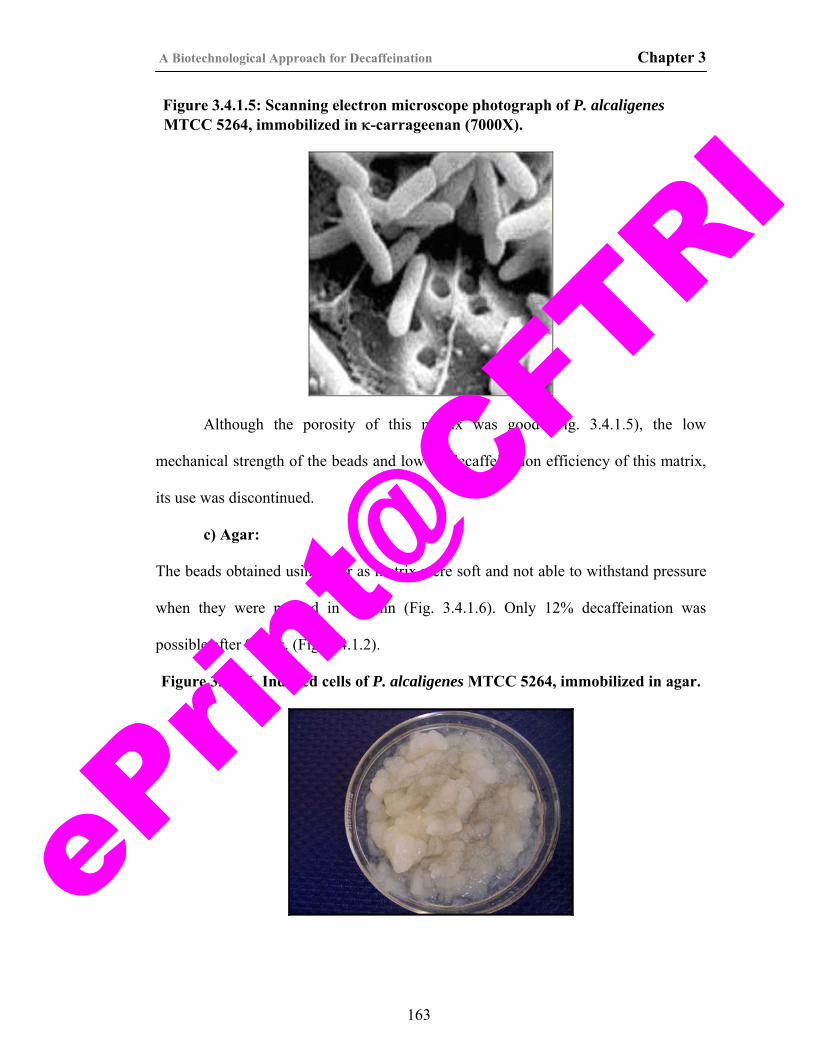
A Biotechnological Approach for Decaffeination Chapter 3
Figure 3.4.1.5: Scanning electron microscope photograph of P. alcaligenes MTCC 5264, immobilized in κ-carrageenan (7000X).
Although the porosity of this matrix was good (Fig. 3.4.1.5), the low
mechanical strength of the beads and low biodecaffeination efficiency of this matrix,
its use was discontinued.
c) Agar:
The beads obtained using agar as matrix were soft and not able to withstand pressure
when they were packed in column (Fig. 3.4.1.6). Only 12% decaffeination was
possible after 96 hrs. (Fig. 3.4.1.2).
Figure 3.4.1.6. Induced cells of P. alcaligenes MTCC 5264, immobilized in agar.
163
ePrin
t@CFT
RI
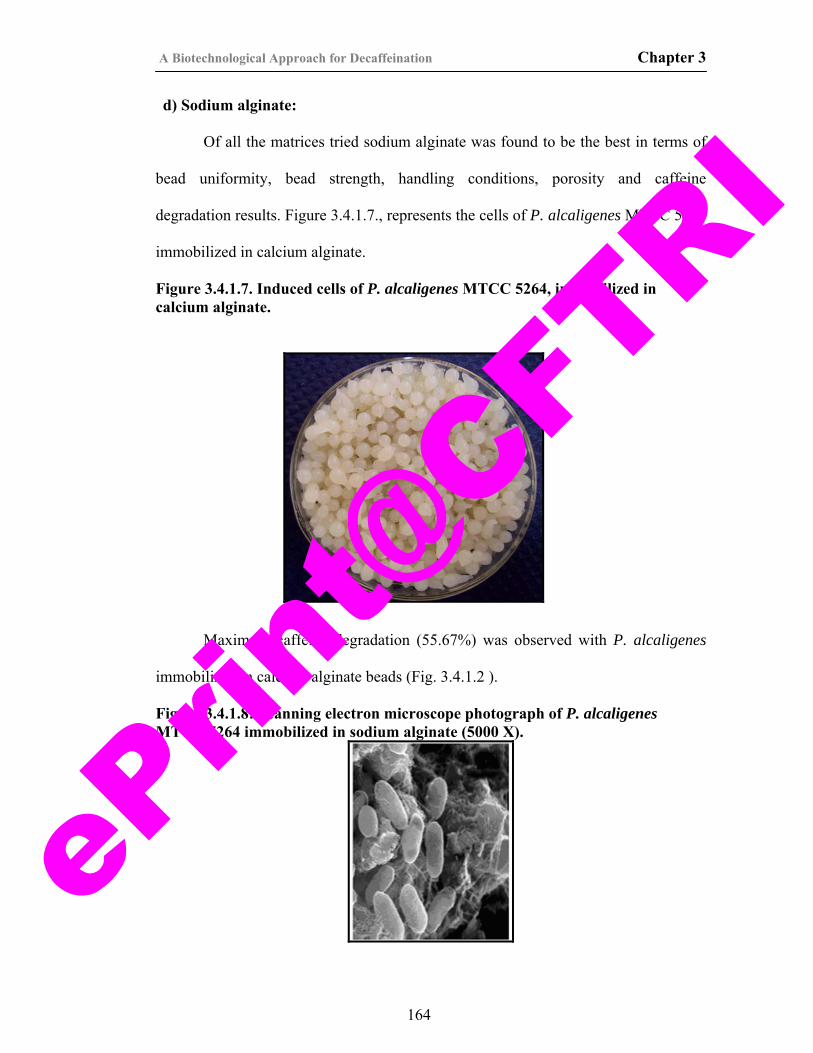
A Biotechnological Approach for Decaffeination Chapter 3
d) Sodium alginate:
Of all the matrices tried sodium alginate was found to be the best in terms of
bead uniformity, bead strength, handling conditions, porosity and caffeine
degradation results. Figure 3.4.1.7., represents the cells of P. alcaligenes MTCC 5264
immobilized in calcium alginate.
Figure 3.4.1.7. Induced cells of P. alcaligenes MTCC 5264, immobilized in calcium alginate.
Maximum caffeine degradation (55.67%) was observed with P. alcaligenes
immobilized in calcium alginate beads (Fig. 3.4.1.2 ).
Figure 3.4.1.8: Scanning electron microscope photograph of P. alcaligenes MTCC 5264 immobilized in sodium alginate (5000 X).
164
ePrin
t@CFT
RI
A Biotechnological Approach for Decaffeination Chapter 3
From the electron microscopic picture of the beads (Fig. 3.4.1.6) indicates
that the beads have high porosity and enable uniform distribution of the cells. The
mild and non toxic nature of the gel also enables higher biodecaffeination rates.
Hence it was the matrix of choice for further studies.
3.4.2. Optimization of parameters for decaffeination using immobilized cells of P. alcaligenes MTCC 5264 in calcium alginate beads:
The effect of buffer composition, phosphate concentration, pH, temperature,
aeration, packed bed volume, cell loading and flow rate on the biodecaffeination of
caffeine solution by P. alcaligenes MTCC 5264 was studied and the parameters for
optimum biodecaffeination were optimized.
3.4.2.1. Phosphate concentration:
Figure 3.4.2.1., represents the efficiency of biodecaffeination by
P. alcaligenes MTCC 5264 immobilized in calcium alginate incubated in different
buffers. No biodecaffeination was found in Tris-Cl, acetate and carbonate buffers, but
complete decaffeination could be achieved with phosphate buffer. Therefore
biodecaffeination studies using immobilized cells were carried out in phosphate
buffer.
Initially a phosphate ion concentration of 100 mM was used for the
decaffeination experiments and at this concentration of phosphate ions a rapid
disintegration of the beads was observed. Salts like phosphates, potassium and EDTA
are known to destabilize the calcium alginate beads by displacing the calcium ions
from the alginate hydrogels (Kierstan and Bucke, 1977; Mattiasson, 1983) resulting
in disintegration of the beads. Therefore experiments were conducted to see the effect
of different concentrations of phosphate ions on the strength of the beads. Various
165
ePrin
t@CFT
RI
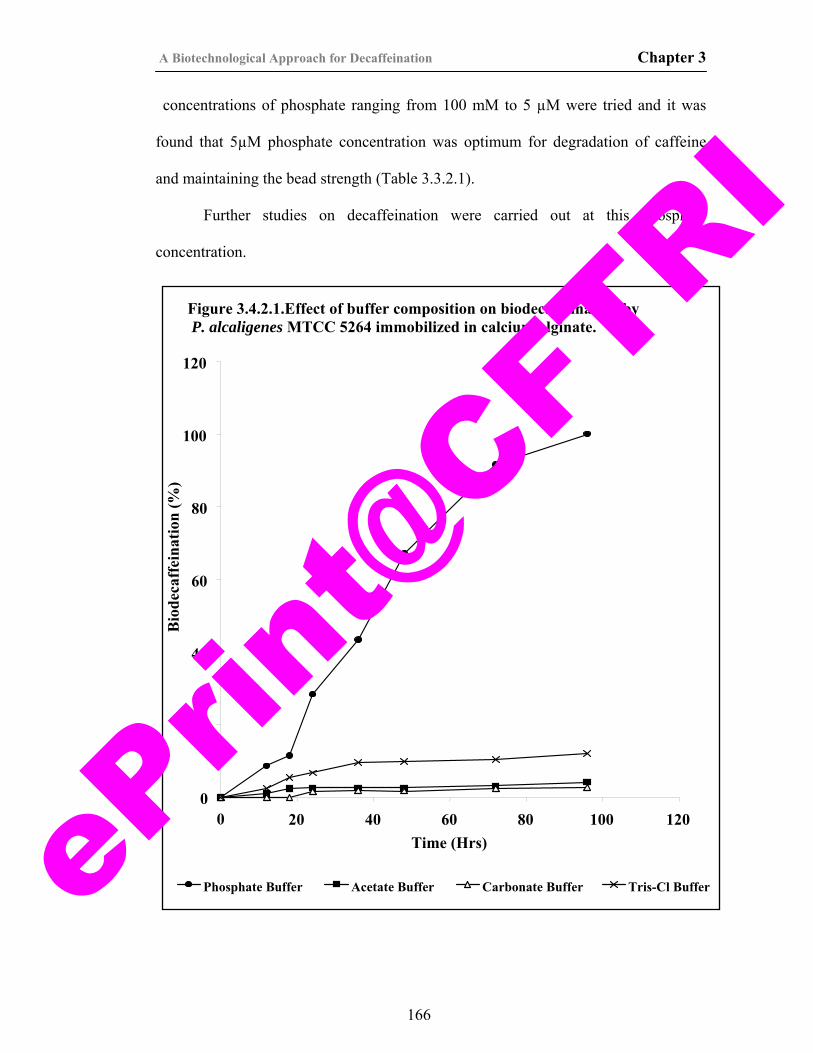
A Biotechnological Approach for Decaffeination Chapter 3
concentrations of phosphate ranging from 100 mM to 5 µM were tried and it was
found that 5µM phosphate concentration was optimum for degradation of caffeine
and maintaining the bead strength (Table 3.3.2.1).
Further studies on decaffeination were carried out at this phosphate
concentration.
Figure 3.4.2.1.Effect of buffer composition on biodecaffeination by P. alcaligenes MTCC 5264 immobilized in calcium alginate.
120
100
Bio
deca
ffei
natio
n (%
)
80
60
40
20
0 0 20 40 60 80 100 120
Time (Hrs)
Phosphate Buffer Acetate Buffer Carbonate Buffer Tris-Cl Buffer
166
ePrin
t@CFT
RI
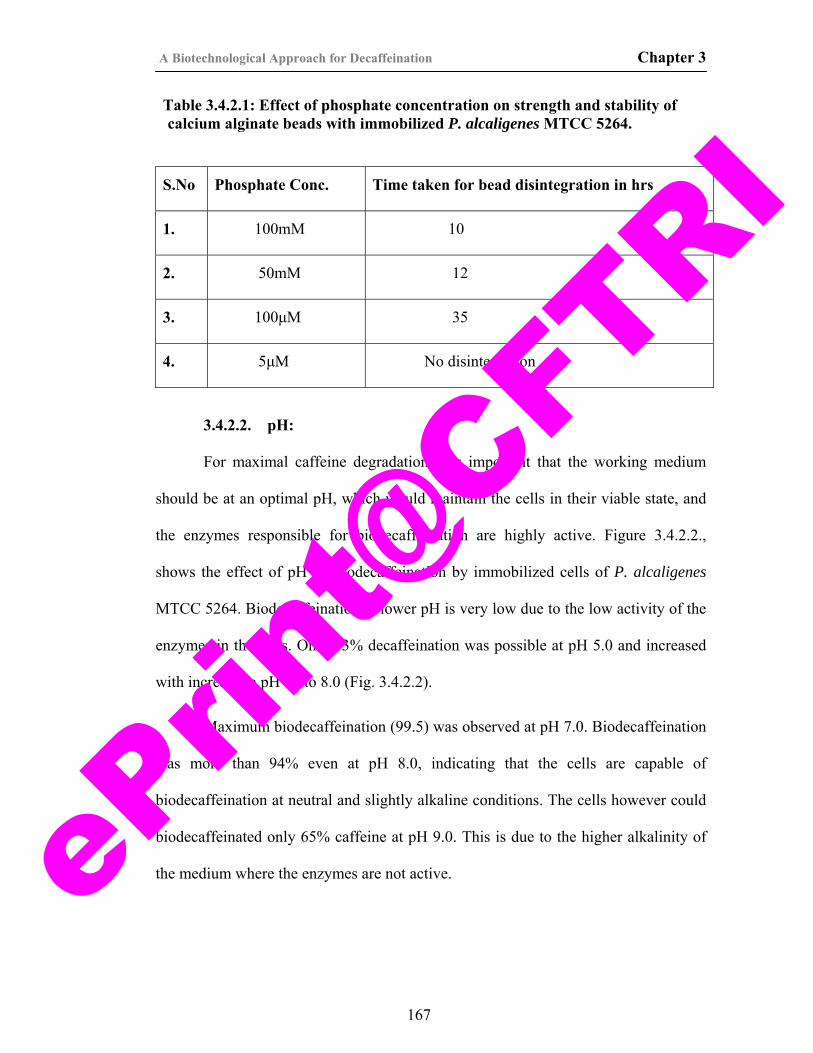
A Biotechnological Approach for Decaffeination Chapter 3
Table 3.4.2.1: Effect of phosphate concentration on strength and stability of calcium alginate beads with immobilized P. alcaligenes MTCC 5264.
S.No Phosphate Conc. Time taken for bead disintegration in hrs
1. 100mM 10
2. 50mM 12
3. 100μM 35
4. 5μM No disintegration
3.4.2.2. pH:
For maximal caffeine degradation it is important that the working medium
should be at an optimal pH, which would maintain the cells in their viable state, and
the enzymes responsible for biodecaffeination are highly active. Figure 3.4.2.2.,
shows the effect of pH on biodecaffeination by immobilized cells of P. alcaligenes
MTCC 5264. Biodecaffeination at lower pH is very low due to the low activity of the
enzymes in the cells. Only 43% decaffeination was possible at pH 5.0 and increased
with increase in pH up to 8.0 (Fig. 3.4.2.2).
Maximum biodecaffeination (99.5) was observed at pH 7.0. Biodecaffeination
was more than 94% even at pH 8.0, indicating that the cells are capable of
biodecaffeination at neutral and slightly alkaline conditions. The cells however could
biodecaffeinated only 65% caffeine at pH 9.0. This is due to the higher alkalinity of
the medium where the enzymes are not active.
167
ePrin
t@CFT
RI
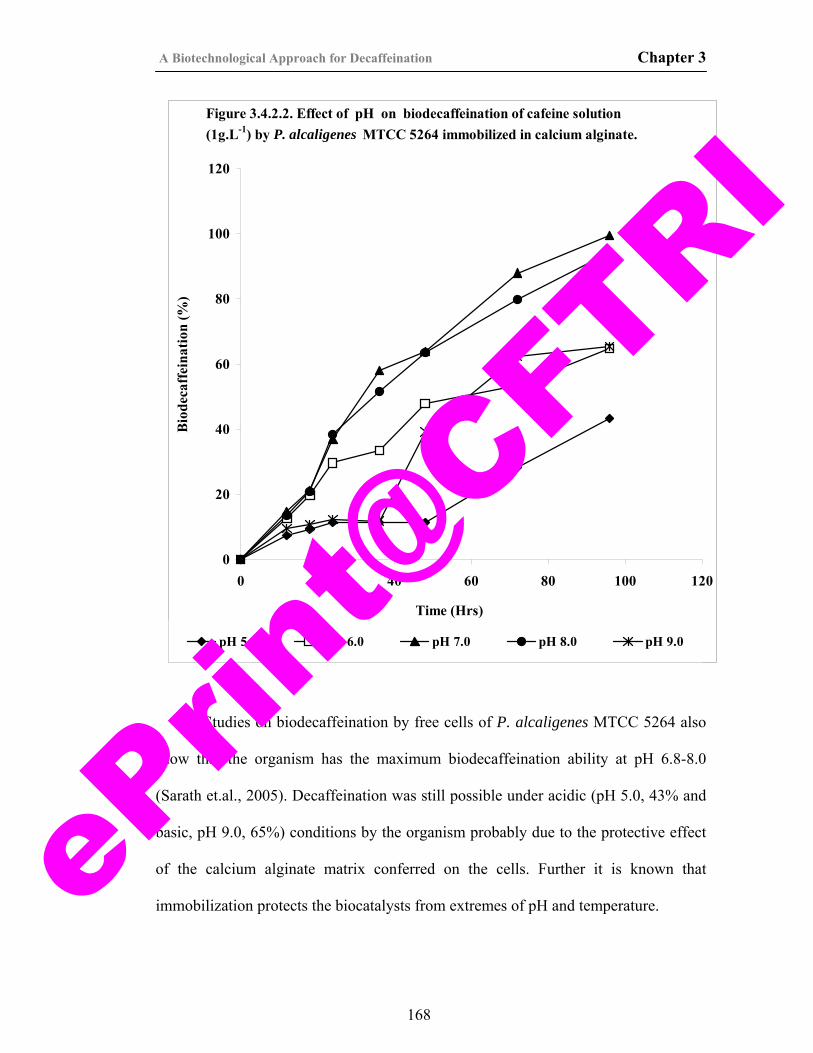
A Biotechnological Approach for Decaffeination Chapter 3
Figure 3.4.2.2. Effect of pH on biodecaffeination of cafeine solution (1g.L-1) by P. alcaligenes MTCC 5264 immobilized in calcium alginate.
0
20
40
60
80
100
120
0 20 40 60 80 100 120
Time (Hrs)
Bio
deca
ffei
natio
n (%
)
pH 5.0 pH 6.0 pH 7.0 pH 8.0 pH 9.0
Studies on biodecaffeination by free cells of P. alcaligenes MTCC 5264 also
show that the organism has the maximum biodecaffeination ability at pH 6.8-8.0
(Sarath et.al., 2005). Decaffeination was still possible under acidic (pH 5.0, 43% and
basic, pH 9.0, 65%) conditions by the organism probably due to the protective effect
of the calcium alginate matrix conferred on the cells. Further it is known that
immobilization protects the biocatalysts from extremes of pH and temperature.
168
ePrin
t@CFT
RI
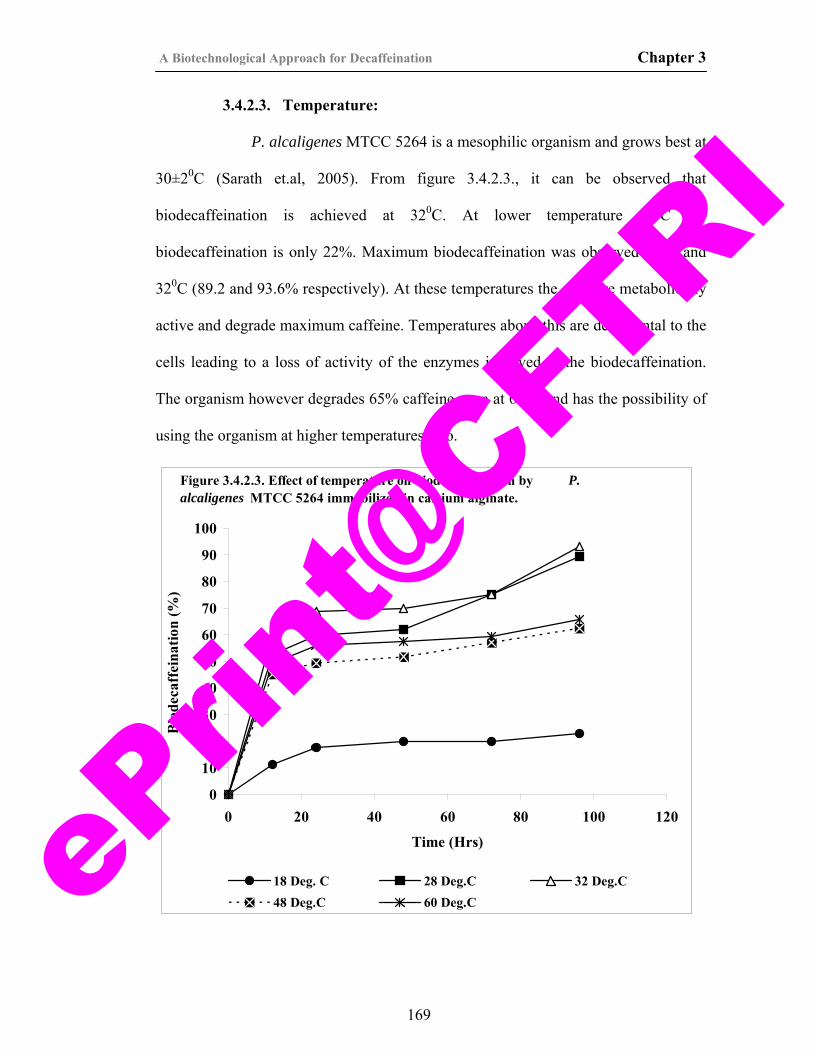
A Biotechnological Approach for Decaffeination Chapter 3
3.4.2.3. Temperature:
P. alcaligenes MTCC 5264 is a mesophilic organism and grows best at
30±20C (Sarath et.al, 2005). From figure 3.4.2.3., it can be observed that
biodecaffeination is achieved at 320C. At lower temperature 180C the
biodecaffeination is only 22%. Maximum biodecaffeination was observed at 28 and
320C (89.2 and 93.6% respectively). At these temperatures the cells are metabolically
active and degrade maximum caffeine. Temperatures above this are detrimental to the
cells leading to a loss of activity of the enzymes involved in the biodecaffeination.
The organism however degrades 65% caffeine even at 600C and has the possibility of
using the organism at higher temperatures also.
Figure 3.4.2.3. Effect of temperature on biodecaffeination by P. alcaligenes MTCC 5264 immobilized in calcium alginate.
80
90
100
)
0
10
20
30
40
50
60
70
0 20 40 60 80 100 120
Time (Hrs)
Bio
deca
ffei
natio
n (%
18 Deg. C 28 Deg.C 32 Deg.C48 Deg.C 60 Deg.C
169
ePrin
t@CFT
RI
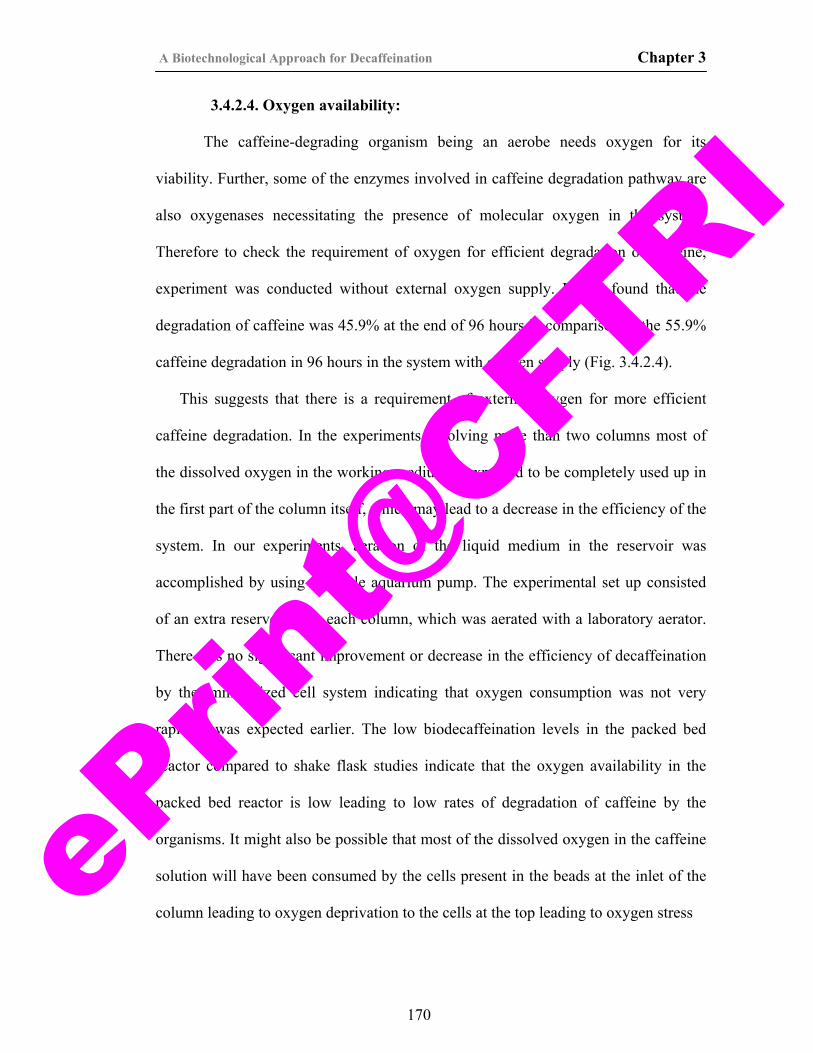
A Biotechnological Approach for Decaffeination Chapter 3
3.4.2.4. Oxygen availability:
The caffeine-degrading organism being an aerobe needs oxygen for its
viability. Further, some of the enzymes involved in caffeine degradation pathway are
also oxygenases necessitating the presence of molecular oxygen in the system.
Therefore to check the requirement of oxygen for efficient degradation of caffeine,
experiment was conducted without external oxygen supply. It was found that the
degradation of caffeine was 45.9% at the end of 96 hours in comparison to the 55.9%
caffeine degradation in 96 hours in the system with oxygen supply (Fig. 3.4.2.4).
This suggests that there is a requirement of external oxygen for more efficient
caffeine degradation. In the experiments involving more than two columns most of
the dissolved oxygen in the working medium is expected to be completely used up in
the first part of the column itself, which may lead to a decrease in the efficiency of the
system. In our experiments, aeration of the liquid medium in the reservoir was
accomplished by using a simple aquarium pump. The experimental set up consisted
of an extra reservoir after each column, which was aerated with a laboratory aerator.
There was no significant improvement or decrease in the efficiency of decaffeination
by the immobilized cell system indicating that oxygen consumption was not very
rapid as was expected earlier. The low biodecaffeination levels in the packed bed
reactor compared to shake flask studies indicate that the oxygen availability in the
packed bed reactor is low leading to low rates of degradation of caffeine by the
organisms. It might also be possible that most of the dissolved oxygen in the caffeine
solution will have been consumed by the cells present in the beads at the inlet of the
column leading to oxygen deprivation to the cells at the top leading to oxygen stress
170
ePrin
t@CFT
RI
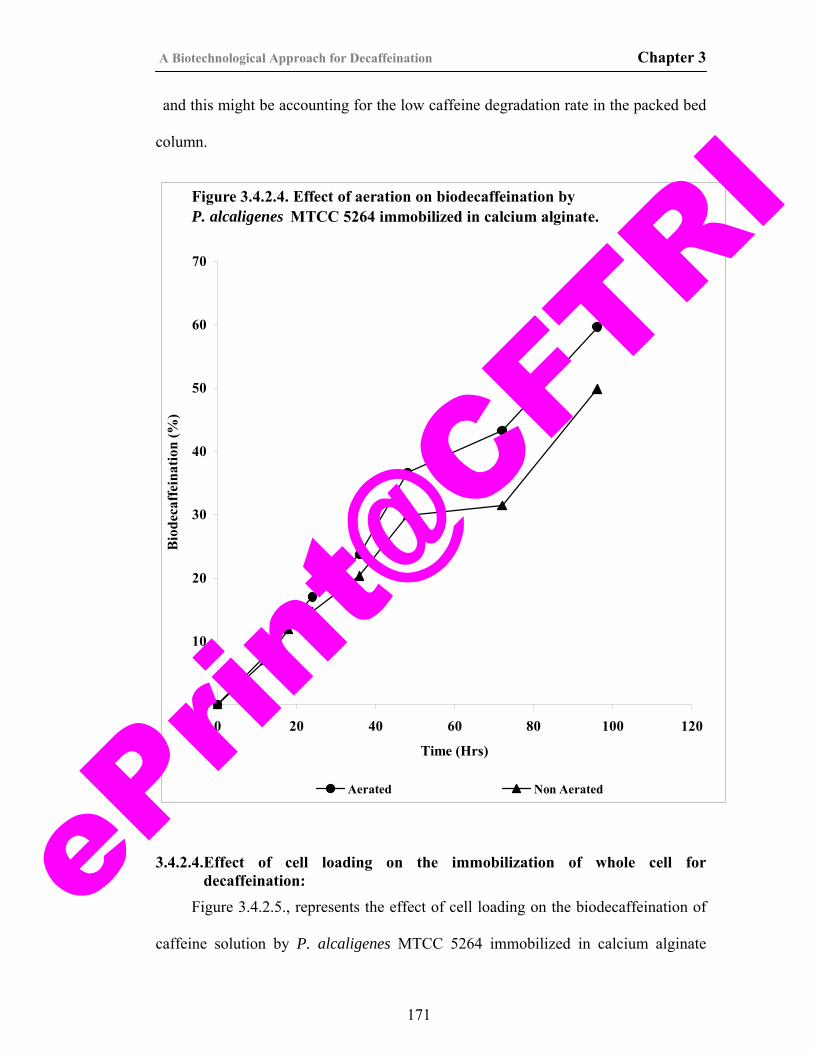
A Biotechnological Approach for Decaffeination Chapter 3
and this might be accounting for the low caffeine degradation rate in the packed bed
column.
Figure 3.4.2.4. Effect of aeration on biodecaffeination by P. alcaligenes MTCC 5264 immobilized in calcium alginate.
0
10
20
30
40
50
60
70
0 20 40 60 80 100 120
Time (Hrs)
Bio
deca
ffei
natio
n (%
)
Aerated Non Aerated
3.4.2.4.Effect of cell loading on the immobilization of whole cell for decaffeination:
Figure 3.4.2.5., represents the effect of cell loading on the biodecaffeination of
caffeine solution by P. alcaligenes MTCC 5264 immobilized in calcium alginate
171
ePrin
t@CFT
RI
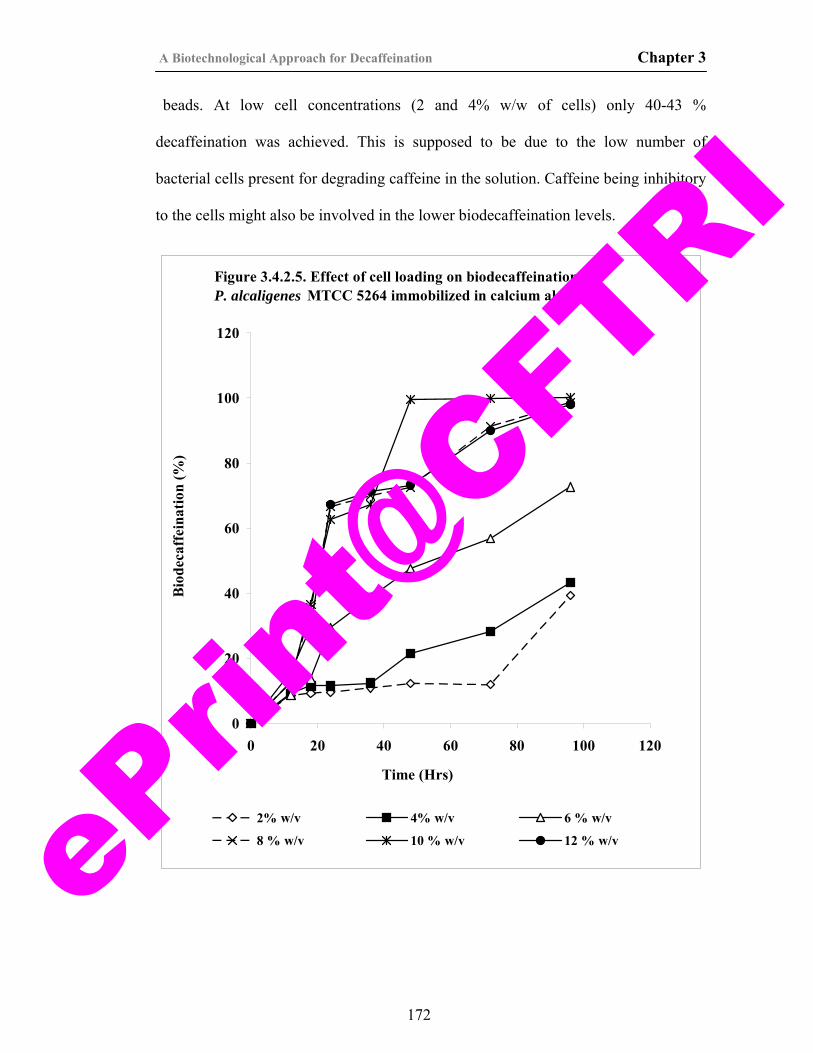
A Biotechnological Approach for Decaffeination Chapter 3
beads. At low cell concentrations (2 and 4% w/w of cells) only 40-43 %
decaffeination was achieved. This is supposed to be due to the low number of
bacterial cells present for degrading caffeine in the solution. Caffeine being inhibitory
to the cells might also be involved in the lower biodecaffeination levels.
Figure 3.4.2.5. Effect of cell loading on biodecaffeination by P. alcaligenes MTCC 5264 immobilized in calcium alginate.
0
20
40
60
80
100
120
0 20 40 60 80 100 120
Bio
deca
ffei
natio
n (%
)
Time (Hrs)
2% w/v 4% w/v 6 % w/v
8 % w/v 10 % w/v 12 % w/v
172
ePrin
t@CFT
RI
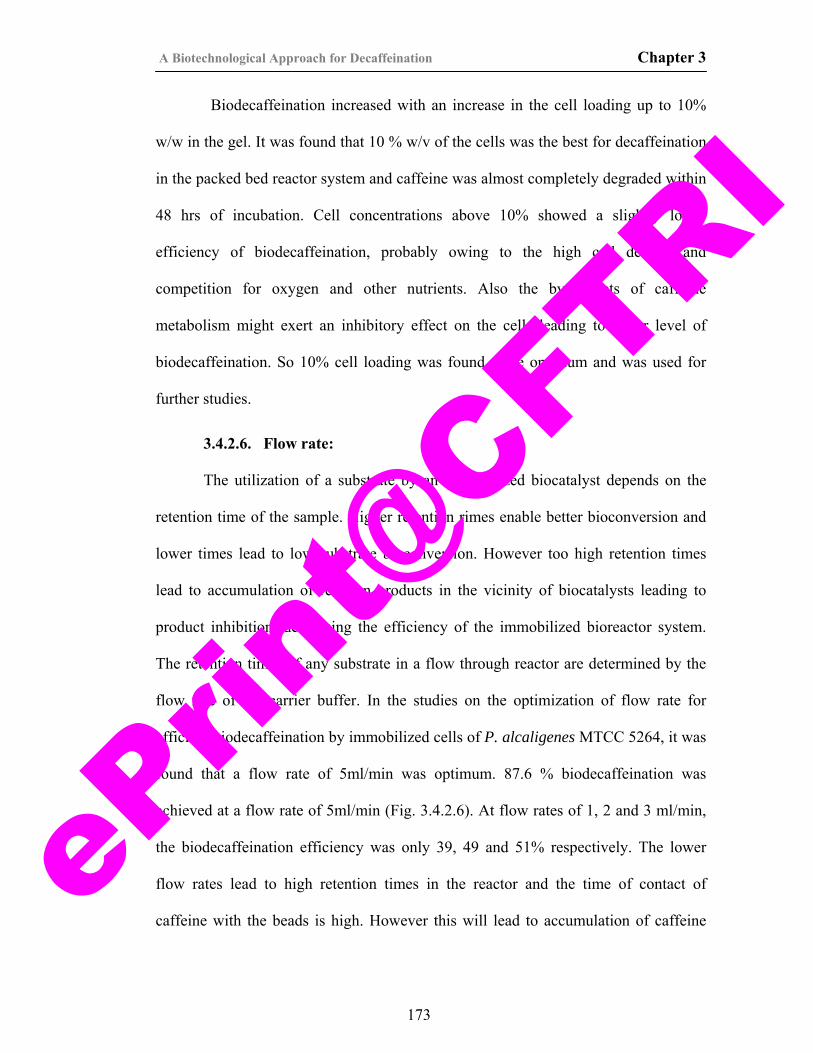
A Biotechnological Approach for Decaffeination Chapter 3
Biodecaffeination increased with an increase in the cell loading up to 10%
w/w in the gel. It was found that 10 % w/v of the cells was the best for decaffeination
in the packed bed reactor system and caffeine was almost completely degraded within
48 hrs of incubation. Cell concentrations above 10% showed a slightly lower
efficiency of biodecaffeination, probably owing to the high cell density and
competition for oxygen and other nutrients. Also the byproducts of caffeine
metabolism might exert an inhibitory effect on the cells leading to lower level of
biodecaffeination. So 10% cell loading was found to be optimum and was used for
further studies.
3.4.2.6. Flow rate:
The utilization of a substrate by an immobilized biocatalyst depends on the
retention time of the sample. Higher retention rimes enable better bioconversion and
lower times lead to low substrate bioconversion. However too high retention times
lead to accumulation of reaction products in the vicinity of biocatalysts leading to
product inhibition, decreasing the efficiency of the immobilized bioreactor system.
The retention times of any substrate in a flow through reactor are determined by the
flow rate of the carrier buffer. In the studies on the optimization of flow rate for
efficient biodecaffeination by immobilized cells of P. alcaligenes MTCC 5264, it was
found that a flow rate of 5ml/min was optimum. 87.6 % biodecaffeination was
achieved at a flow rate of 5ml/min (Fig. 3.4.2.6). At flow rates of 1, 2 and 3 ml/min,
the biodecaffeination efficiency was only 39, 49 and 51% respectively. The lower
flow rates lead to high retention times in the reactor and the time of contact of
caffeine with the beads is high. However this will lead to accumulation of caffeine
173
ePrin
t@CFT
RI
A Biotechnological Approach for Decaffeination Chapter 3
degradation products like ammonia and carbon dioxide which limit the oxygen
availability to the cells leading to low biodecaffeination levels. At higher flow rates,
the retention times are too low leading to low contact times with caffeine and the
biodecaffeination decreases. It was found that 5 ml/ min was optimum for efficient
caffeine degradation in the system (Fig.3.4.2.6.).
Figure 3.4.2.6. Effect of flow rate on biodecaffeination of caffeine solution by immobilized cells of P. alcaligenes MTCC 5264.
0
10
20
30
40
50
60
70
80
90
100
0 20 40 60 80 100 120
Time (Hrs)
Bio
deca
ffein
atio
n (%
)
1ml/min 2 ml/min 3 ml/min 5 ml/min7ml/min 10 ml/min
174
ePrin
t@CFT
RI
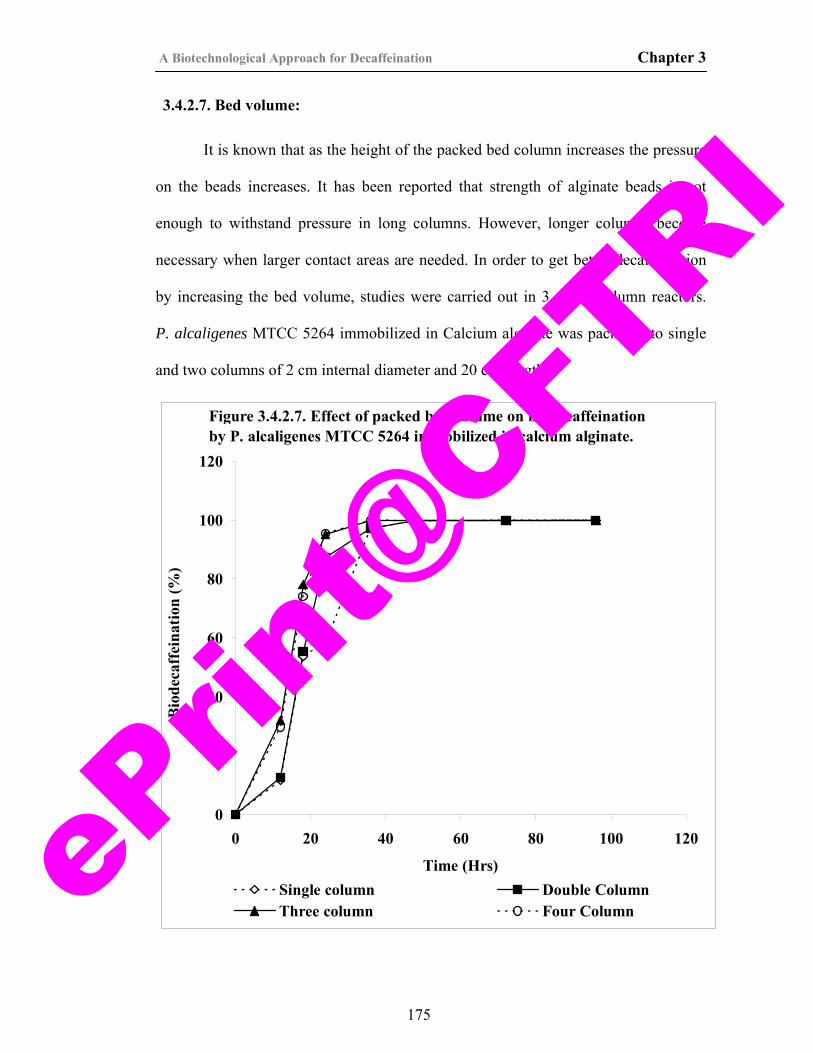
A Biotechnological Approach for Decaffeination Chapter 3
3.4.2.7. Bed volume:
It is known that as the height of the packed bed column increases the pressure
on the beads increases. It has been reported that strength of alginate beads is not
enough to withstand pressure in long columns. However, longer columns become
necessary when larger contact areas are needed. In order to get better decaffeination
by increasing the bed volume, studies were carried out in 3 and 4 column reactors.
P. alcaligenes MTCC 5264 immobilized in Calcium alginate was packed into single
and two columns of 2 cm internal diameter and 20 cm length.
Figure 3.4.2.7. Effect of packed bed volume on biodecaffeination by P. alcaligenes MTCC 5264 immobilized in calcium alginate.
60
80
100
120
ecaf
fein
atio
n (%
)
0
20
40
0 20 40 60 80 100 120
Time (Hrs)
Bio
d
Single column Double Column Three column Four Column
175
ePrin
t@CFT
RI
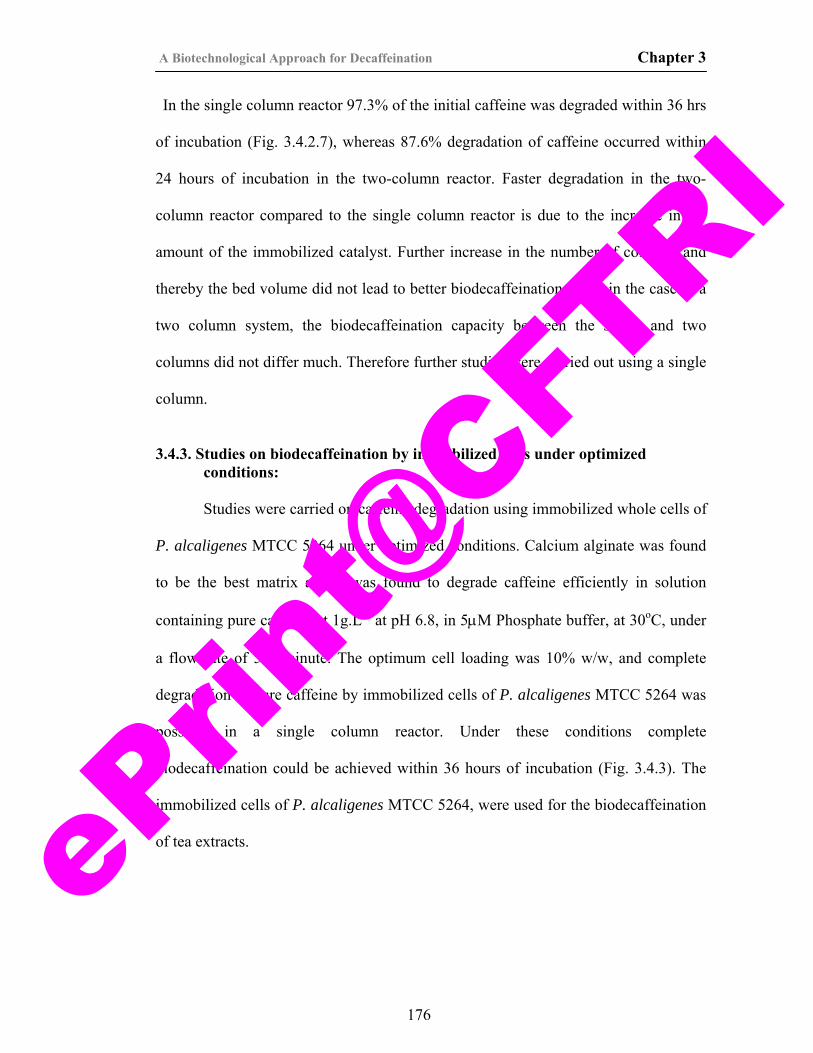
A Biotechnological Approach for Decaffeination Chapter 3
In the single column reactor 97.3% of the initial caffeine was degraded within 36 hrs
of incubation (Fig. 3.4.2.7), whereas 87.6% degradation of caffeine occurred within
24 hours of incubation in the two-column reactor. Faster degradation in the two-
column reactor compared to the single column reactor is due to the increase in the
amount of the immobilized catalyst. Further increase in the number of columns and
thereby the bed volume did not lead to better biodecaffeination. Even in the case of a
two column system, the biodecaffeination capacity between the single and two
columns did not differ much. Therefore further studies were carried out using a single
column.
3.4.3. Studies on biodecaffeination by immobilized cells under optimized
conditions:
Studies were carried on caffeine degradation using immobilized whole cells of
P. alcaligenes MTCC 5264 under optimized conditions. Calcium alginate was found
to be the best matrix and it was found to degrade caffeine efficiently in solution
containing pure caffeine at 1g.L-1 at pH 6.8, in 5μM Phosphate buffer, at 30oC, under
a flow rate of 5ml/minute. The optimum cell loading was 10% w/w, and complete
degradation of pure caffeine by immobilized cells of P. alcaligenes MTCC 5264 was
possible in a single column reactor. Under these conditions complete
biodecaffeination could be achieved within 36 hours of incubation (Fig. 3.4.3). The
immobilized cells of P. alcaligenes MTCC 5264, were used for the biodecaffeination
of tea extracts.
176
ePrin
t@CFT
RI
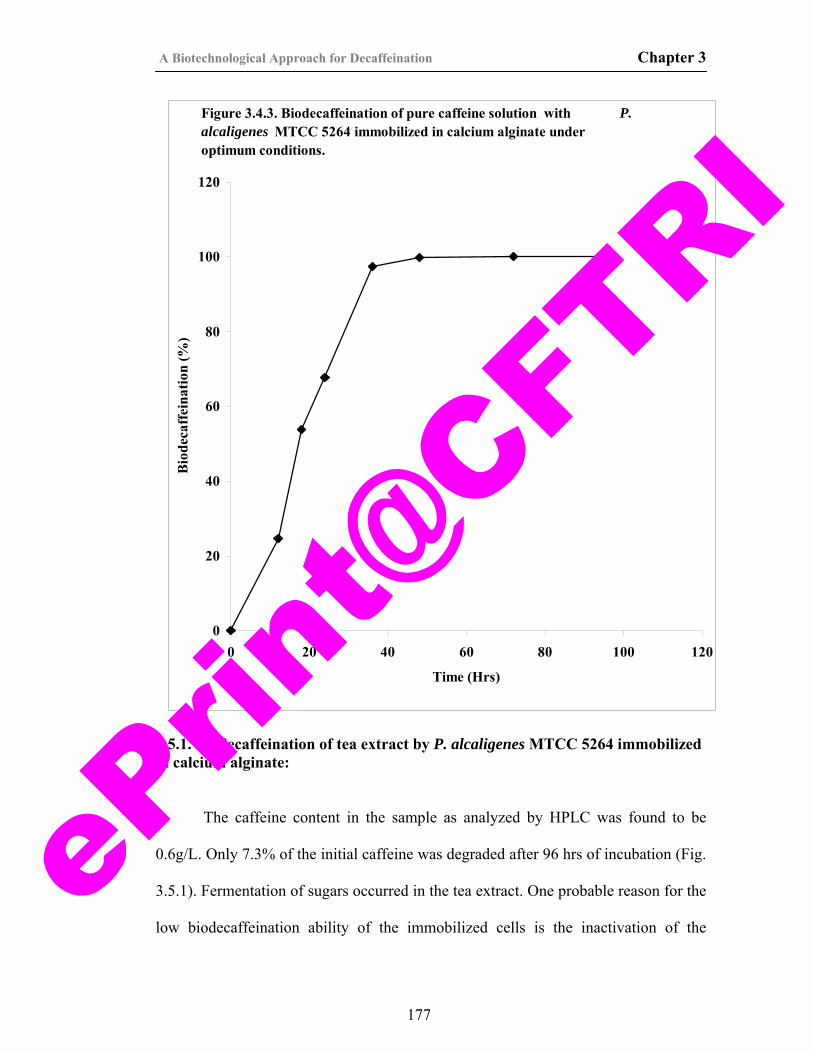
A Biotechnological Approach for Decaffeination Chapter 3
Figure 3.4.3. Biodecaffeination of pure caffeine solution with P. alcaligenes MTCC 5264 immobilized in calcium alginate under optimum conditions.
0
20
40
60
80
100
120
0 20 40 60 80 100 120
Time (Hrs)
Bio
deca
ffei
natio
n (%
)
3.5.1. Biodecaffeination of tea extract by P. alcaligenes MTCC 5264 immobilized in calcium alginate:
The caffeine content in the sample as analyzed by HPLC was found to be
0.6g/L. Only 7.3% of the initial caffeine was degraded after 96 hrs of incubation (Fig.
3.5.1). Fermentation of sugars occurred in the tea extract. One probable reason for the
low biodecaffeination ability of the immobilized cells is the inactivation of the
177
ePrin
t@CFT
RI
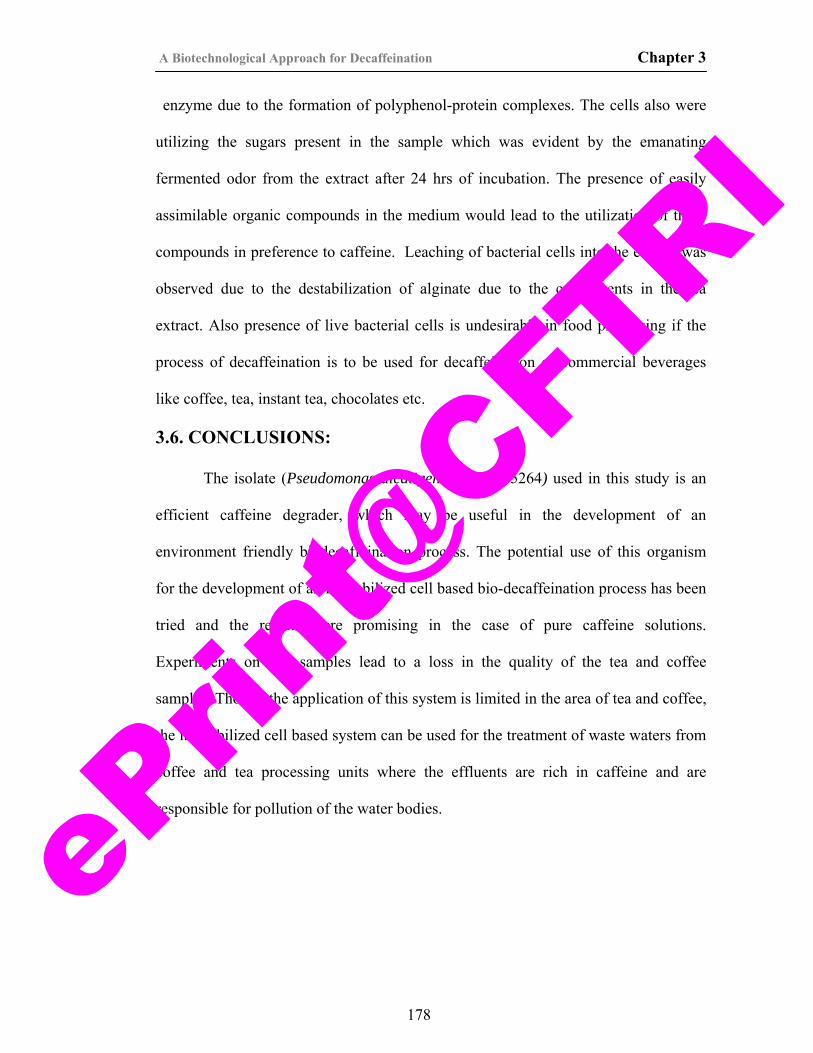
A Biotechnological Approach for Decaffeination Chapter 3
enzyme due to the formation of polyphenol-protein complexes. The cells also were
utilizing the sugars present in the sample which was evident by the emanating
fermented odor from the extract after 24 hrs of incubation. The presence of easily
assimilable organic compounds in the medium would lead to the utilization of these
compounds in preference to caffeine. Leaching of bacterial cells into the extract was
observed due to the destabilization of alginate due to the components in the tea
extract. Also presence of live bacterial cells is undesirable in food processing if the
process of decaffeination is to be used for decaffeination of commercial beverages
like coffee, tea, instant tea, chocolates etc.
3.6. CONCLUSIONS:
The isolate (Pseudomonas alcaligenes MTCC 5264) used in this study is an
efficient caffeine degrader, which may be useful in the development of an
environment friendly biodecaffeination process. The potential use of this organism
for the development of an immobilized cell based bio-decaffeination process has been
tried and the results were promising in the case of pure caffeine solutions.
Experiments on real samples lead to a loss in the quality of the tea and coffee
samples. Though the application of this system is limited in the area of tea and coffee,
the immobilized cell based system can be used for the treatment of waste waters from
coffee and tea processing units where the effluents are rich in caffeine and are
responsible for pollution of the water bodies.
178
ePrin
t@CFT
RI
A Biotechnological Approach for Decaffeination Chapter 3
3.7. REFERENCES:
1. Abraham, T. E., Jamuna, R., Bansilal, C.V., Ramakrishna, S. V., Starch/Starke,
(1991), 43: 113–116.
2. Axelsson, A., Sisak, C., Westrin, B. A., Szajani, B., (1994), Diffusional
characteristics of a swelling gel and its consequences for bioreactor
performance. Chem. Eng. J. 55: B35–39.
3. Bare, G., Delaunois, V., Rikir, R., Thonart, P. H., (1994), Bioconversion of
Vanillin into Vanillic Acid by Pseudomonas fluorescens Strain BTP9 - Reactor
Design and Parameters Optimization. Appl. Biochem. Biotech. 45/46: 599–610.
4. Braham, J.E., (1987), Coffee pulp in other species. In: Brahan, J.E., Bressani, R.
(Ed.) Coffee pulp: composition, technology, and utilization. Guatemala City:
Institute of Nutrition of Central America and Panama, 39-49.
5. Brinker, C.J., Scherrer, G., (1990), The physics and chemistry of sol-gel
processing. Academic, Boston.
6. Bryant, S.J., Nuttleman, C.R., Anseth, K.S., (2000), Cytocompatibility of UV
and visible light photoinitiating systems on cultured NIH/3T3 Fibroblasts in
vitro. Journal of Biomaterial Science Polymer Edition. 11: 439-457.
7. Buzzini, P., Gobbetti, M., Rossi, J., Ann. Microbiol. Enzymol., (1993), 43: 53–
60.
8. Cachon, R., Molin, P., Divies, C., (1995), Modeling of continuous Ph-stat
stirred tank reactor with Lactococcus lactis ssp. lactis bv. diacetylactis
immobilized in calcium alginate gel beads. Biotechnol. Bioeng., 47: 567–574.
9. Castellar, M. R., Borrego, F., Canovas, M., Iborra, J. L., (1994), Optimization of
the start-up of a passively immobilized Zymomonas mobilis system for
continuous ethanol production. Process Biochem., 29: 569–574.
10. Cheong, S. H., Park, J. K., Kun, B. S., Chang, H. N., (1993),
Microencapsulation of yeast cells in the calcium alginate membrane.
Biotechnol. Tech., 12: 879–884.
11. Chibata, I., Tosa, T., Sato, T., (1974 a), Immobilized Aspartase-Containing
Microbial Cells: Preparation and Enzymatic Properties, Appl. Environ.
Microbiol. 27: 878-885.
179
ePrin
t@CFT
RI

A Biotechnological Approach for Decaffeination Chapter 3
12. Chibata, I., Tosa, T., Sato,T., Mori,T., (1974b), Basic Studies for Continuous
Production of L-Aspartic Acid by Immobilized Escherichia coli Cells
Appl. Environ. Microbiol. 27: 886-889.
13. Chu, C. H., Sakiyama, T., Yano, T., (1995), Biosci. Biotech. Biochem., 59: 717.
14. Chun, G. T., Agathos, S. N., (1993), Dynamic response of immobilized cells to
pulse addition of -valine in cyclosporin A biosynthesis. J. Biotechnol., 27:
283–294.
15. Chung, B. H., Chang, H. N., (1988), Aerobic fungal cell immobilization in a
dual hollow-fiber bioreactor: Continuous production of a citric acid. Biotechnol.
Bioeng. 32: 205–212.
16. Constantinides, A., Mehta, N., (1991), Periodic operation of immobilized live
cell bioreactor for the production of candicidin. Biotechnol. Bioeng., 37: 1010–
1020.
17. Dalili, M., Chau, P. C., (1988), Production of actinomycin D with immobilized
Streptomyces parvullus under nitrogen and carbon starvation conditions.
Biotechnol. Lett., 10(5): 331–336.
18. Davison, B. H., Thompson, J. E., (1993), Appl. Biochem. Biotehcnol., 39/40:
415-426.
19. Deo, Y. M., Gaucher, G. M., (1984), Semicontinuous and continuous
production of penicillin-G by Penicillium chrysogenum cells immobilized in -
carrageenan beads. Biotechnol. Bioeng., 26: 285–295.
20. Dixit, V., Piskin, E., Arthur, M., Denizli, A., Tuncel, S.A., Denkbas, E.,
Gitnick, G., (1992), Hepatocyte immobilization on PHEMA microcarriers and
its biologically modified forms, Cell Transplant.1(6):391-9.
21. Dlugosz, L., Belanger, K., Hellenbrand, K., (1996), Maternal caffeine
consumption and spontaneous abortion: a prospective cohort study.
Epidemiology 7:250–5.
22. Egresi, A., Sisak, G. S., Harasanyi, I., Szajani, B., (1992), An improved method
for the entrapment of microbial cells into a thermogel. Biotechnol. Tech. 6:
261–264.
180
ePrin
t@CFT
RI
A Biotechnological Approach for Decaffeination Chapter 3
23. Farid, M. A., El Diwany, A. I., El, Enshasy, H. A., (1994), Production of
oxytetracycline and rifamycins B and SV with cells immobilized on glass wool.
Acta Biotechnol., 14: 67–74.
24. Federici, R. G., Federici, F., Petruccioli, M., (1990a), Continuous production of
glucoamylase by immobilized growing cells of Aureobasidium pullulans
Biotechnol. Lett., 12: 661–666.
25. Federici, F., Petruccioli, M., Miller, M. W., (1990b), Enhancement and
stabilization of the production of glucoamylase by immobilized cells of
Aureobasidium pullulans in a fluidized-bed reactor. Appl. Microbiol.
Biotechnol., 33(4): 407–409.
26. Federici, J., Gromada, A., Szczodrak, J., (1994), Microbiol. Res. 149: 425–428.
27. Forstr, M., Mansfeld, J., Schellenberger, A., Dautzenberg, H., (1994),
Immobilization of citrate-producing Yarrowia lipolytica cells in polyelectrolyte
complex capsules. Enz. Microb. Technol., 16: 777–784.
28. Foster, B. C., Coutts, R. T., Pasutto, F. M., Dossetor, J. B., (1983), Production
of cyclosporin a by carrageenan-immobilized tolypocladium inflatum in an
airlift reactor with external loop. Biotechnol. Lett., 5: 693-696.
29. Friedman, J., Waller, G.R., (1983a), Caffeine hazards and their prevention in
germinating seeds of coffee (Coffea arabica L.). J. Chem. Ecol. 9:1099-1106.
30. Friedman, J., and Waller, G.R. (1983b), Seeds as allelopathic agents. J. Chem.
Ecol. 9:1107-1115.
31. Gelson, C. D., Thomas, A., (1993), A novel fluidised bed bioreactor for
fermentation of glucose to ethanol using alginate immobilised yeast. Biotechnol.
Tech., 7(5): 397–400.
32. Groboillot, A., Boadi, D. K., Poncelet, D. and Neufeld, R., (1994),
Immobilization of cells for. application in the food industry. Critical Rev.
Biotechnol., 14: 75–107.
33. Grozeva, L., Tchorbanov, B., Aleksieva, P., (1993), Production of casein
hydrolysates by extracellular acid proteinases of immobilized Humicola lutea
cells. Appl. Microbiol. Biotechnol., 39: 512–514.
181
ePrin
t@CFT
RI
A Biotechnological Approach for Decaffeination Chapter 3
34. Guoqiang, D., Kaul R.H., Mattiasson, B., (1992), Immobilization of
Lactobacillus casei cells to ceramic material pretreated with polyethylenimine
Appl. microbiol. Biotechnol, 37(3): 305-310.
35. Ida, T., Hitoshi, I., Yoshimi, A., Masahiro, S., (1993), Continuous ethanol
fermentation in molasses medium using Zymomonas mobilis immobilized in
photo-crosslinkable resin gels. J. Ferment. Bioeng., 75: 32–35.
36. Jamuna, R., Vora, S., Sai, P. S. T., Ramakrishna, S. V., (1992), Optimization of
critical parameters for immobilization of yeast cells to alginate gel matrix.
J. Ferment. Bioeng., 73: 319–322.
37. Jianlong, W., Ping, L., Ding, Z., (1994), Extractive fermentation of lactic acid
by immobilizedLactobacillus casei using ion—exchange resin. Biotechnol.
Tech., 8: 905–908.
38. Jones, A., Wood, D. N., Razniewska, T., Gaucher, G. M., (1986), Can. J. Chem.
Eng., 64: 547–552.
39. Kalogerakis, N., Linarda, T., Behie, L. A., Svrcek, W. Y., Gaucher, G. M.,
(1986), Can. J. Chem. Eng., 64: 581–587.
40. Kanasawud, Hjorleifsdottir, Holst, Mattiasson, B., (1989), "Studies on
immobilization of the thermophilic bacterium Thermus aquaticus YT-1 by
entrapment in various matrices," Appl. Microbiol. Biotech. 31:228-233.
41. Kaufman, E. N., Cooper, S. P., Davison, B. H., (1994), Appl. Microbiol.
Biotechnol., 45/46: 545–554.
42. Kazuaki, Y., Yukan, S., Taro, K., Masayuki, O., Akira, O., (1994), Ethanol
production by encapsulated and immobilized yeast. Biotechnol. Tech., 8: 271–
274.
43. Kennedy, J. F., Cabral, J. M. S., (1985), in Immobilized Cells and Enzymes (ed.
Woodward, J.), IRL Press. 19–37.
44. Keshavarz,T., Eglin, R., Walker, E., Bucke, C., Holt, G., Bull, A. T., Lilly, M.
D., (1990), The large-scale immobilization of Penicillium chrysogenum: Batch
and continuous operation in an air-lift reactor. Biotechnol. Bioeng., 36: 763–
770.
182
ePrin
t@CFT
RI
A Biotechnological Approach for Decaffeination Chapter 3
45. Khare, S. K., Jha, K., Gandhi, A. P., (1994), Use of agarose-entrapped
Aspergillus niger cells for the production of citric acid from soy whey. Appl.
Microbiol. Biotechnol., 41: 571–573.
46. Kierstan M., Bucke C., (1977), The immobilization of microbial cells,
subcellular organelles, and enzymes in calcium alginate gels. Biotechnol
Bioeng. 19(3):387-97.
47. Kim, D. M., Kim, G. J., Kim, S. K., (1994), Enhancement of operational
stability of immobilized whole cell D-hydantoinase. Biotechnol. Lett., 16: 11–
16.
48. Kqak, M. Y., Rhee, J. S., (1992), Controlled mycelial growth for kojic acid
production using Ca-alginate-immobilized fungal cells. Appl. Microbiol.
Biotechnol., 36: 578–583.
49. Kurosawa, H., Matsumura, M., Tanaka, H., (1989), Oxygen diffusivity in gel
beads containing viable cells. Biotechnol. Bioeng., 34, 926–932.
50. Lee, G. K., Long, M. E., (1974), U.S. Patent. No. 3,821,086,
51. Livage, J., (1997), Sol gel processes. Current Opinion in Solid State and
Materials Science. 2: 132-138.
52. Lu, M.Z., Lan, H.L., Wang, F.F., Chang, S.J., Wang, Y.J., (2000), Cell
encapsulation with alginate and 2-phenoxycinnamylidene-acetylated
poly(allylamine). Biotechnol.Bioeng.. 70: 479-483.
53. Lu, Z., Fujimura, T., (1993), Radiat. Phys. Chem., 42: 923–926.
54. Mahmoud, A. H., El Sayed, M., Rehm, H. J., (1987a), Semicontinuous
penicillin production by two Penicillium chrysogenum strains immobilized in
calcium alginate beads Appl. Microbiol. Biotechnol., 26: 211–214.
55. Mahmoud, A. H., El Sayed, M., Rehm, H. J., (1987b), Continuous penicillin
production by Penicillium chrysogenum immobilized in calcium alginate beads.
Appl. Microbiol. Biotechnol., 26: 215–218.
56. Mannin, C., Barbotin, J. N., Thomas, D., Lazzaroni, J. C., Portaier, R., (1989),
Production of alkaline phosphatase by immobilized growing cells of
Escherichia coli excretory mutants. Appl. Microbiol. Biotechnol., 32:143–147.
183
ePrin
t@CFT
RI
A Biotechnological Approach for Decaffeination Chapter 3
57. Mansfeld, J., Forster, M., Hoffmann, T., Schellenberg, H., (1995),
Coimmobilization of Yarrowia lipolytica cells and invertase in polyelectrolyte
complex microcapsules. Enzyme Microbiol. Technol., 17: 11–17.
58. Marek, M., Kas, J., Valentová, O., Demnerová, K., and Vodrá zka, Z., (1986),
Immobilization of cells via activated cell walls. Biotech. Letts. 8(10): 721-724.
59. Martin, M. J., Fernandez, P. L., Gonzalez, A. G., Pablos, F., (2000), HPLC
determination of catechins and caffeine in tea. Differentiation of green, black
and instant teas. Analyst, 125(3): 421-425.
60. Martinsen, A., Skjak-Break, G, Smidsrod, O., (1989), Alginate as
immobilization material: I. Correlation between chemical and physical
properties of alginate gel beads. Biotechnol. Bioeng., 33: 79–89.
61. Mattiasson, B. (1983), Immobilization methods, p. 4–19. In: Immobilized Cells
and Organelles, Vol. 1. Mattiasson, B. (Ed.) CRC Press, Inc., Boca Raton,
Florida.
62. Mcginis, R., (1985) Sugar J., 38, 8.
63. Mebin, E., Shich, W. K., (1992), Chem. Eng. J., 50: B17–B22.
64. Middelhoven, W. J., Bakker, C. M., (1982) Degradation of caffeine by
immobilized cells of Pseudomonas putida strain C 3024. European. J. Appl.
Microbial Biotechnol. 15; 214-217.
65. Mignot, L., Junter, G. A., (1990), Diffusion in immobilized-cell agar layers:
influence of bacterial growth on the diffusivity of potassium chloride. Appl.
Microbiol. Biotechnol., 33: 167–171.
66. Mittal, Y., Mishra, I. M., Varshney, B. S., (1993), Biotechnol. Tech., 15: 41–46.
67. Mori, A., Matsumoto, N., Imai, C., (1989), Biotechnol. Lett., 11: 183–188.
68. Morikawa, Y., Karube, I., Suzukis, S., (1980), Continuous production of
bacitracin by immobilized living whole cells of Bacillus sp. Biotechnol.
Bioeng., 22: 1015.
69. Nassif, N., Bouvet, O., Rager, M.N., Roux, C., Coradin, T., Livage, J., (2002),
Living bacteria in silica gels. Nature Materials. 1: 42-44.
184
ePrin
t@CFT
RI
A Biotechnological Approach for Decaffeination Chapter 3
70. Nassif, N., Roux, C., Coradin, T., Rager, M.N., Bouvet, O.M.M., Livage, J.,
(2003), A sol-gel matrix to preserve the viability of encapsulated bacteria.
Journal of Materials Chemistry. 13: 203-208.
71. Nguyen, A. L., Luong, J. H. T., (1986), Diffusion in -carrageenan gel beads.
Biotechnol. Bioeng. 28: 1261–1267.
72. Nishida, Y., Sato, T., Tosa, T., Chibata, I., (1977), Immobilization of
Escherichia coli cells having aspartase activity with carrageenan and locust bean
gum. Enzyme Microb. Technol., 1: 95–99.
73. Nishio, N., Sugawa, K., Hayase, N., Nagai, S., (1989), Conversion of -xylose
into xylitol by immobilized cells of Candida pelliculosa and Methanobacterium
sp. HU. J. Ferment. Bioeng., 67: 356–360.
74. Nolan, A. M., McHale, A. P., (1994), Ethanol production at 45° by an alginate-
immobilized, thermo-tolerant strain of Kluyveromyces marxianus following
growth on glucose-containing media. Biotechnol. Lett. 16: 849–852.
75. Norton, S., Lacroix, C., Vuillemard, J. C., (1994), Kinetic study of continuous
whey permeate fermentation by immobilized Lactobacillus helveticus for lactic
acid production. Enz. Microb. Technol., 16: 457–466.
76. Novarro, J. M. and Durand, G., (1977) Eur. J. Appl. Microbiol., 4: 243–254.
77. Ogbonna, J. C., Amuno, Y. and Nakamura, K., (1989), Elucidation of optimum
conditions for immobilization of viable cells by using calcium alginate. J.
Ferment. Bioeng., 67: 92–96.
78. Pandya, Y., Knorr, D., (1991), Diffusion characteristics and properties of
chitosan coacervate capsules. Process Biochem., 26: 75–81.
79. Park, S. O., Ohta, N., Okabe, M., (1994), Neomycin production by partial
immobilization Streptomyces fradiae on cellulose beads in an air-lift bioreactor.
J. Ferment. Bioeng., 78: 265–268.
80. Paz, D. E. D., Aantana, M. H. A., Eguchi, S. Y., (1993), Appl. Biochem.
Biotechnol., 39/40: 455–466.
185
ePrin
t@CFT
RI
A Biotechnological Approach for Decaffeination Chapter 3
81. Qureshi, N., Maddox, I. S., (1995), Continuous production of acetone-butanol-
ethanol using immobilized cells of Clostridium acetobutylicum and integration
with product removal by liquid-liquid extraction. J. Ferment. Bioeng. 80: 185–
189.
82. Rao, D. S., Panda, T., (1994), Bioprocess Eng., 11: 209–212.
83. Ray, R. R., Jana, S. C., Nanda, G., (1995), J. Basic Microbiol., 2: 113–116.
84. Roussos, S., Angeles-Aquiahuatl, M.D.L., Trejo-Hernandez, M.D.R., Gaime-
Perraud, I,, Favela, E., Ramakrishna, M., (1995), Biotechnological management
of coffee pulp-isolation, screening, characterization, selection of caffeine
degrading fungi and natural microflora present in coffee pulp and husk. Appl
Microbiol Biotechnol; 42:756–62.
85. Ruckenstein, E., Wang, X. B., (1994), Production of lignin peroxidase by
Phanerochaete chrysosporium immobilized on porous poly(styrene-
divinylbenzene) carrier and its application to the degrading of 2-chlorophenol.
Biotechnol. Bioeng. 44: 79–86.
86. Ruggeri, B., Sassi, G., Specchia, V., Bosco, F., Marzona, M., Alginate beads
coated with polyacrylamide resin: potential as a biocatalyst. (1991), Process
Biochem., 26: 331–335.
87. Sakiyama, T., Chu, C.H., Fujii, T., Yano, T., (1993), J. Appl. Polymer Sci., 59:
88. Sanroman, A., Pintado, J., Lema, J. M., (1994), A comparison of two techniques
(adsorption and entrapment) for the immobilization of Aspergillus niger in
polyurethane foam. Biotechnol. Tech. 8: 389–394.
89. Sarath Babu, V.R., Patra, S., Karanth, N.G., Varadaraj M.C., Thakur M.S.,
(2005), Degradation of caffeine by Pseudomonas alcaligenes CFR 1708, Enz,
Microb. Tech. 37: 617-624.
90. Sarra, M., Casas, C., Godia, F., (1997), Continuous production of a hybrid
antibiotic by Streptomyces lividans TK21 pellets in a three-phase fluidized-bed
bioreactor. Biotechnol. Bioeng., 53: 601–610.
91. Saucedo, J. E. N., Barbotin, J. N., Thomas, D., (1989), Continuous production
of gibberellic acid in a fixed-bed reactor by immobilized mycelia of Gibberella
fujikuroi in calcium alginate beads. Appl. Microbiol Biotechnol., 30: 226–233.
186
ePrin
t@CFT
RI

A Biotechnological Approach for Decaffeination Chapter 3
92. Smeds, K.A., Grinstaff, M.W., (2001), Photocrosslinkable polysaccharides for
in situ hydrogel formation. J. Biomed. Mat. Res. 54: 115-121.
93. Smidsrod, O., Skjak-Braek, G., (1990), Alginate as immobilization matrix for
cells. Trends in Biotechnology. 8: 71-78.
94. Srisuphan W, Bracken MB.(1986), Caffeine consumption during pregnancy and
association with late spontaneous abortion. Am J Obstet Gynecol 154:14–20.
95. Sun, P., Li, B., Wang, Y., Ma, J., Din, D., He, B., (2003), 1H NMR studies of
poly (Nisopropylacrylamide) gels near the phase transition. European Polymer
Journal. 39: 1045-1050.
96. Takata, I., Tosa, T., Chibata, I., (1978), J. Solid. Phase Biochem., 2: 255–366.
97. Teixeira, J. A., Mota, M., Venancio, A., (1994), Model identification and
diffusion coefficients determination of glucose and malic acid in calcium
alginate membranes. Chem. Eng. J., 56: B9–B14.
98. Van Wezel, A.L., (1967), Growth of Cell Strains and Primary Cells on
Microcarriers in Homogeneous Culture. Nature. 216: 64-65.
99. Vorlop, K. D., Klein, J., (1981), Formation of spherical chitosan biocatalysts by
ionotropic gelation. Biotechnol. Lett., 3: 9–14.
100. Vorlop, K., Di, E., David, G. F., (1993), Design of Ca-alginate immobilized
yeast cell beads with controlled low density to enhance their fluidization
behaviour in bioreactors. Biotechnol. Tech., 7: 287–292.
101. Webb, C., (1989), The role of cell immobilization in fermentation technology.
Aust. J. Biotechnol. 3(1):50-5.
102. West, T. P., Strohfus, B., (1996), Fungal cell immobilization on ion exchange
resins for pullulan production, Microbios, 88(356): 177-187.
103. Westrin, I. A., (1990), Diffusion in immobilized-cell gels. Appl. Microbiol.
Biotechnol., 34: 189–190.
104. Willaert, R. G. and Baron, G. V., (1994), Effectiveness factor calculation for
immobilised growing cell systems. Biotechnol. Tech., 8: 695–700.
105. Yamagiwa, K., Shimizu, Y., Kozawa, T., Onodera, M., Ohkawa, A., (1993), J.
Chem. Eng. Japan. 26: 449–450.
187
ePrin
t@CFT
RI

A Biotechnological Approach for Decaffeination Chapter 3
188
106. Yaskovich G. A., (1998), the role of cell surface hydrophobicity in adsorption
immobilization of bacterial strains. Appl. Biochem. Microbiol. 34(4): 373-376.
107. Yu, D., Voloponi, J., Chhabra, S., Brinker, C.J., Mulchandani, A., Singh, A.,
(2005), Aqueous sol–gel encapsulation of genetically engineered Moraxella
spp. cells for the detection of organophosphates. Biosens. Bioelec. 20(7): 1433-
1437.
ePrin
t@CFT
RI
CHAPTER 4 ISOLATION, IDENTIFICATION AND
CHARACTERIZATION OF
CAFFEINE DEMETHYLASE
ePrin
t@CFT
RI
A Biotechnological Approach for Decaffeination Chapter 4
189
4.1. SCOPE OF THE WORK:
The xanthine alkaloid, caffeine is present in several food materials,
beverages and pharmaceutical preparations. The excessive consumption of caffeine
containing beverages like coffee and tea has been reported to be the cause for
several ill effects on human health, which paved way for research into the
development of processes for decaffeination. Commonly decaffeination processes
employ organic solvents which are reported to be unsafe, thus leading to research in
the area of biotechnology for development of processes for biodecaffeination.
A basic requirement in development of biodecaffeination processes is the
isolation and identification of enzymes involved in the biodegradation of caffeine.
This chapter deals with the isolation, identification and characterization of caffeine
demethylase from Pseudomonas alcaligenes MTCC 5264. The first section of the
chapter deals with a review of the literature on research carried out by different
groups in the world on biodegradation of caffeine. The second section of chapter
deals with methodologies used in the work.
The third section of the chapter deals with the results and discussion. The
enzymes involved in biodecaffeination were isolated and identified. The pathway
for caffeine degradation has been elucidated in this work. Caffeine demethylase, a
rate limiting enzyme which is highly labile even under sub zero temperatures has
been isolated, characterized and stabilized and the results are detailed in the third
section of the chapter. The chapter ends with the conclusions and future
perspectives of research on caffeine demethylase.
eP
rint@
CFTRI
A Biotechnological Approach for Decaffeination Chapter 4
190
4.2. INTRODUCTION:
Caffeine has deleterious effects on cardiac patients and women (James,
1997; Leviton and Cowan, 2002; Waring et. al., 2003). Reports are also available
on the effects of caffeine on health and of its toxic effects to animals and plants
(Pincheira et.al., 2003; Meyer et.al., 2004). Decaffeination is being carried out
widely in beverages because of the growing belief that the chronic ingestion of
caffeine can have adverse effects on health. The biological decaffeination of coffee
pulp not only decreases the caffeine content in it but also improves the nutritional
value of the coffee pulp (Rojas et. al., 2003). Hence, caffeine degradation is
essential from both health and environmental point of view.
In plants, degradation of caffeine occurs through sequential demethylation
that finally results in the formation of xanthine. The demethylation reactions have
been found to be catalyzed by demethylase enzymes, viz., N-1 demethylase, N-7
demethylase and N-3 demethylase. Xanthine is then converted into CO2 and
ammonia by purine catabolism (Mazzaffera, 1993; Ashihara et.al., 1996; Ashihara
et.al., 1997; Vittoria and Mazzaffera, 1998; Koyama et.al., 2003). In contrast to
plants, the degradation pathway in mammals results in the formation of methyl
xanthines and methyl uric acids by cytochrome P450 enzymes CYP1A2, CYP3A4,
CYP2E1 xanthine oxidase and N-acetyl transferase (Cornish and Christman, 1957;
Khanna et.al., 1972; Wreck and Fevereisen, 2000; Caubet et.al., 2004). In fungi, the
initial degradation product has been found to be theophylline. Other dimethyl and
monomethyl xanthines were also detected as products of caffeine degradation.
However, the catabolic pathway is not clearly known (Hakil et.al., 1998). In eP
rint@
CFTRI
A Biotechnological Approach for Decaffeination Chapter 4
191
bacteria (Pseudomonas), caffeine is initially converted into theobromine and
paraxanthine parallely by demethylases.
Studies on caffeine degradation by microorganisms were not reported till
1970 probably because caffeine was regarded as toxic to bacteria (Sundarraj and
Dhala, 1965; Putrament et.al., 1972; Kihlman, 1974). Bacterial strains capable of
degrading caffeine belong to Pseudomonas and Serratia genus (Kurtzman and
Schwimmer, 1971; Woolfolk ,1975; Vogels and Drift, 1976; Blecher and Lingens,
1977; Asano et.al., 1993; Porres et.al., 1993; Mazzaffera et.al., 1994; Roussos et.al.,
1994; Hakil et.al., 1998; Hakil et.al., 1999; Brand et.al., 2000; Tagliari et.al., 2003;
Ramarethinam and Rajalakshmi, 2004). The enzymes involved in the degradation
of caffeine in microorganisms are demethylases and oxidases (Asano et.al., 1993;
Asano et.al., 1994; Hohnloser et.al., 1980; Yano and Mazzaffera, 1999; Sideso
et.al., 2001; Madyastha and Sridhar, 1998; Madyastha et.al., 1999). Yano and
Mazzafera, (1999) attempted to purify caffeine demethylase, but found that the
purified enzyme was labile and it rapidly lost its activity. It has been observed that
the use of cryoprotectants and freeze drying to low moisture contents improved the
stability of the enzyme (Sideso et.al., 2001). In general, the caffeine degrading
enzymes are very labile and more studies are required to improve the stability of the
enzymes, which will help in developing a specific process for caffeine degradation.
In mixed culture consortium belonging to Klebsiella sp. and Rhodococcus sp.,
caffeine was directly oxidized by the enzyme caffeine oxidase at the C-8 position
leading to the formation of 1,3,7-trimethyluric acid and this process did not have
demethylation steps (Madhyasta et.al., 1999). Only partial characterization of this ePrin
t@CFT
RI
A Biotechnological Approach for Decaffeination Chapter 4
192
enzyme is available (Madyastha et.al., 1999, Sideso et.al., 2001). Though enzymes
involved in degradation of caffeine are known, in vitro enzymatic studies for
caffeine degradation are not yet reported. Since demethylase enzymes are not very
stable more studies on enzyme stability and biochemical characterization is
required.
Caffeine degrading bacteria, belonging to the Pseudomonas sps,
demethylate caffeine to yield xanthine, which is further catabolised to NH3 and
CO2. The pathways via which this is achieved were elucidated. It has been found
that caffeine-degrading microorganisms utilizing caffeine as the sole source of
carbon and nitrogen have enzymes that bring about the actual degradation of the
substrate (Sarath et.al., 2005).
A few reports in the literature have already described the isolation of
bacteria strains from soil with the ability to degrade caffeine (Woolfolk, 1975;
Blecher and Lingens, 1977; Gluck and Lingens, 1987; Mazzaffera et.al., 1994).
Only a few reports are available on the partial purification and
characterization of caffeine demethylase complex (Sideso et.al., 2001) but the
complete purification and characterization of this enzyme has not been done till
now. In lieu of the need for the development of an enzymatic decaffeination
process, and in view of the instability of the enzyme, an in-depth knowledge of the
biochemical and biophysical characteristics of the enzyme is essential. This chapter
deals with the studies on isolation, identification and characterization of caffeine
demethylase enzyme from P. alcaligenes MTCC 5264 which was isolated and
characterized at our laboratory previously (Sarath et.al., 2005). ePrin
t@CFT
RI
A Biotechnological Approach for Decaffeination Chapter 4
193
4.3. MATERIALS AND METHODS:
Caffeine (99.9%), lysozyme, Tris, sodium cyano borohydride, phenazine
methosulphate (PMS), methyl xanthine standards, xanthine oxidase, uricase, urease,
trifluoro acetic acid (TFA), acrylamide, silver nitrate, DEAE-Sephadex A-50 and
trypsin (MB Grade) were procured from M/s Sigma-Aldrich, St. Louis, USA.
Dichlorophenol indo phenol (DCPIP), nicotinamide adenosine dinucleotide
phosphate, reduced tetra sodium salt (NADPH sodium salt), nicotinamide adenosine
dinucleotide (NAD), dithiothreitol, phenyl methyl sulfonyl fluoride (PMSF), NNN-
bisacrylamide, TEMED, ammonium persulphate (APS), sodium dodecyl suplhate
(SDS, MB Grade), caffeine (LR Grade), uric acid standard, urea standard and
methylene blue were purchased from Sisco Research laboratories, Mumbai, India.
Peptone and yeast extract were from HiMedia labs, Mumbai, India. All
other reagents were of the highest purity and were procured from standard sources.
4.3.1. Extraction of enzymes:
Induced cells of P. alcaligenes MTCC 5264 were harvested by
centrifugation at 12000 g for 30 minutes at 4oC. The biomass pellet was washed
several times with ice cold buffer (Tris-Cl, 50 mM; pH 6.8) and frozen at –20oC. 10
grams of the frozen pellet was thawed into 100 ml of Lysis buffers containing 1-
5mg/ml of lysozyme, 1mM PMSF, 0.1mM DTT and 15 %v/v of glycerol at 37oC
for 1 hour. The lysate was then centrifuged at 12000 g for 30 minutes to separate
the cell debris. The supernatant obtained was designated as crude enzyme and used
for further purification. Different methods of lysis of cells were tried which include
freezing and thawing, mechanical lysis on a bead mill (dynomill), ultrasonication, eP
rint@
CFTRI

A Biotechnological Approach for Decaffeination Chapter 4
194
combination of lysozyme and freeze thawing. Glass beads (0.25-0.75 mm dia) were
used in the dynomill. 10 gms of glass beads were added to 10gms (wet weight) of
cell pellet suspended in 100 ml of Tris-Cl buffer (100mM, pH 6.8) containing 4%
w/v sorbose as the stabilizer and maintained at 5-10oC. The dynomill was set at
2000 rpm and cell lysis was brought about in 5 cycles of 5 minutes each with
intermittent cooling for 5 minutes. Cold water was circulated throughout the lysis
period to avoid heating of the contents. The protein content of the cell free extract
(CFE) was determined by the method of Bradford (1976) using bovine serum
albumin (BSA) as the standard protein. All the experiments involving enzyme
purification and characterization were carried out at 4oC unless otherwise specified.
4.3.2. Identification of enzymes involved in degradation of caffeine:
The enzyme involved in the N-demethylation of caffeine to its respective
dimethyl xanthines has not been reported conclusively. Although few reports
indicate the involvement of a demethylase with monooxygenase activity (Asano
et.al., 1994) and the involvement of a caffeine oxidase (Madhyasta et.al., 1999), the
reports have been inconclusive. The involvement of an oxidase in the degradation
pathway does not fit into the existing biochemical pathway elucidated for the
degradation of caffeine as it involves no demethylation steps. Therefore, a
demethylase model is much valid. In lieu of the inconclusivity of the nature of the
enzyme involved in the N-demethylation of caffeine, extensive studies on the nature
of this reaction were required. Thus experiments were conducted to identify the
enzymes responsible for caffeine degradation. The following enzymes were
assayed. The enzyme involved in the first step of caffeine degradation is believed to ePrin
t@CFT
RI
A Biotechnological Approach for Decaffeination Chapter 4
195
be a demethylase. The exact nature of this enzyme is not known and studies were
carried out on the extraction, purification and identification of the demethylase and
the experimental details are described in section 4.4.3.8.
4.3.2.1. Caffeine oxidase:
a) Spectrophotometric assay:
Caffeine oxidase activity in the cell free extract was checked according to
the method of Madhyastha et al, 1999. In brief, the reaction mixture consisted of 10
mM Caffeine, 10 mM DCPIP, 1mM PES in 1 ml of 100 mM phosphate buffer at
pH 7.2. The reaction was initiated by the addition of 100 µl of crude enzyme.
Enzyme activity was measured as a decrease in the absorbance of the reaction
mixture due to the reduction of DCPIP.
b) Incubation Test:
100µl of crude enzyme was incubated with 10 mM caffeine in 1 ml of 100
mM phosphate buffer pH 7.2, and incubated at 30± 2oC for 1 hour. The reaction
was terminated by addition of 10µl of glacial acetic acid. The reaction mixture was
analyzed by HPLC for the presence of 1,3,7-trimethyluric acid. HPLC analysis was
carried out in a Shimadzu LC 10A system with a diode array detector and
connected to a octadecyl silica column (Luna C18, Phenomenex, 4.2 x 250 mm)
under isocratic conditions with water and acetonitrile (85:15) as the mobile phase.
4.3.2.2. Xanthine oxidase:
Xanthine oxidase is known to accept theobromine and theophylline as the
substrates and convert them into their respective uric acids. The presence of this
enzyme was tested by assayed by methylene blue reduction test (Bray, 1963). The ePrin
t@CFT
RI
A Biotechnological Approach for Decaffeination Chapter 4
196
reaction mixture contained 10 mM hypoxanthine, 25mM methylene blue and 100 µl
of crude enzyme in 1 ml of reaction Buffer (100 mM, PO4; pH 7.2). The enzyme
activity was recorded as a decrease in the absorbance of the reaction mixture at 600
nm. One unit of xanthine oxidase activity is defined as the conversion of 1 μM of
methylene blue reduced per minute, which is equal to 1μM of uric acid formed
from the substrate.
4.3.2.3. Heteroxanthine demethylase:
Heteroxanthine demethylase activity in the crude enzyme extract was
determined by the method of Gluck and Lingens (1988). The reaction mixture
consisted of paraxanthine (100μl), crude enzyme extract (100μl), and NADPH
(20μl) in 1 ml of phosphate buffer (50mM, pH 6.8). This reaction mixture was
incubated for three hours at 300C. Samples were drawn at 0, 30, 60, 120 and 180
minutes and analyzed for their caffeine content by HPLC and product formation.
One unit of activity is defined as the formation of 1μM of 7-methyluric acid formed
per minute.
4.3.2.4. Xanthine dehydrogenase:
Xanthine dehydrogenase activity in the crude enzyme extract was
determined by the method of Gluck and Lingens (1987). The reaction mixture
consisted of theobromine (100μl), crude enzyme extract (100μl), and NAD (20μl)
in 1 ml of phosphate buffer (50mM, pH 7.0). This reaction mixture was incubated
for three minutes at 300C. Enzyme activity was recorded as an increase in the
absorbance of the reaction mixture at 340 nm. One unit of xanthine dehydrogenase
activity is defined as the formation of 1μM of NADH from NAD per minute. eP
rint@
CFTRI
A Biotechnological Approach for Decaffeination Chapter 4
197
4.3.2.5. Uricase:
The uric acid formed by the oxidation of theobromine and other dimethyl
xanthines are converted to allantoin by the enzyme uricase. Uricase activity was
determined by incubating uric acid with crude extract and the removal of uric acid
was monitored spectrophotometrically (Mahler et.al., 1955). The reaction mixture
consisted of 10mM uric acid and 100µl of crude enzyme in 1 ml of phosphate
buffer (100mM, pH 6.5). The activity was recorded as the decrease in the
absorbance at 290nm. One unit of uricase activity is defined as the formation of
1μM of allantoin from uric acid per minute.
4.3.2.6. Allantoinase:
Allantoinase activity in the crude enzyme was detected by incubating the
crude enzyme extract (100μl) with allantoin (100μl) in Tris-Cl buffer (100mM; pH.
6.8) for 1 hr and analyzing the reaction mixture for the production of allantoic acid
by HPLC.
4.3.2.7. Allantoicase:
Allantoicase activity in the crude enzyme extract was determined by
incubating the crude enzyme extract (100μl) with allantoic acid (100μl) in Tris-Cl
buffer (100mM; pH.7.0) for 1 hr and analyzing the reaction mixture for the
reduction in the allantoic acid content in the reaction mixture by HPLC.
4.3.2.8. Urease:
Urea formed by the action of allantoicase is now converted to ammonia and
carbon dioxide by the enzyme Urease that marks the final step in the degradation of
caffeine. Urease activity was determined by estimation of the amount of ammonia eP
rint@
CFTRI
A Biotechnological Approach for Decaffeination Chapter 4
198
released by using Nessler’s reagent (Jayaraman, 1988). The reaction mixture
consisted of 1 ml urea and 1 ml of crude enzyme. The reaction mixture was
incubated at 300C for 1 hour and samples drawn at 0, 5, 15, 30 and 60 minutes.
100μ.l of Nessler’s reagent was added and absorbance recorded at 490 nm. One unit
of urase activity is defined as the formation of 1μM of ammonia per minute.
4.3.2.9. Caffeine demethylase:
Initially assay protocol for this enzyme was not available. Therefore, to
confirm the presence of this enzyme in the crude extract, a HPLC based method for
detection of enzymatic product was used. The reaction mixture consisted of
caffeine (100μl), crude enzyme extract (100μl), and NADPH (20μl) in 1 ml of
phosphate buffer (50mM, pH 7.2). This reaction mixture was incubated for three
hours at 300C. Samples were drawn at 0, 30, 60, 120 and 180 minutes and analyzed
for their caffeine content by HPLC and product formation. Enzyme activity was
recorded as the number of micromoles of caffeine consumed per minute.
a) Oxygenase activity of caffeine demethylase:
The enzyme assay was done by using a dissolved oxygen meter (EDT
Instruments, UK). The reaction mixture contained 100μl of enzyme suspended in 1
ml of buffer and continuously agitated. When the dissolved oxygen probe showed a
stable response, 0.1% w/v caffeine (100μl) was injected and the response was
recorded as a drop in the dissolved oxygen content (Gouda et.al., 2000). The
reaction was stopped by addition of 5μl of Glacial acetic acid and the reaction
mixture was analyzed for the theobromine content by HPLC. The oxygen (mM)
consumed in this reaction was calculated determined from the value obtained from eP
rint@
CFTRI
A Biotechnological Approach for Decaffeination Chapter 4
199
the oximeter and the amount of oxygen consumed per mM of theobromine
produced was determined.
4.3.3. Purification of caffeine demethylase:
Purification of caffeine demethylase was carried out and the following steps
were involved. All the experiments were carried out below 5oC in a cold room
unless otherwise specified. All the buffers and reagents used were prepared in triple
distilled water and were of the highest quality. The enzyme preparations were
stored at 4o C in a refrigerator till further use. All the buffers contained protease
inhibitors and thiol reducing agents.
4.3.3.1. Salting out:
Salting out of the enzyme was carried out with ammonium sulphate at
different concentrations (Jakoby, 1971). Solid ammonium sulphate was added to the
crude enzyme at 4oC slowly and then centrifuged at 6000 rpm for 10 minutes. The
supernatant was decanted slowly without disturbing the pellet. The pellet was
dissolved in minimal amount of buffer and checked for activity. Based on the
presence of the enzyme, either the pellet or supernatant were selected for further
processing. The pellet containing enzyme activity was desalted by passing through
a Sephadex G-10 column. Active fractions were collected, pooled and subjected to
further purification.
4.3.3.2. Ion exchange chromatography:
Ion exchange chromatography was carried out on a DEAE-Sephadex A-50
column (Yamamoto and Ishihara, 1999). The matrix was first swelled by boiling 10
grams of the gel with 200 ml of distilled water. The gel was then equilibrated with ePrin
t@CFT
RI
A Biotechnological Approach for Decaffeination Chapter 4
200
Tris-Cl buffer and packed into a column of 2 cm X 20 cm. The column was further
equilibrated and used for purification of the enzyme. The packed bed volume was
20 ml. 5 ml of the crude enzyme (0.64 mg/ml of protein) was loaded on the column
and the column was washed with equilibration buffer to remove the unbound
fractions. Bound proteins were eluted by an increasing salt gradient. The unbound
and bound fractions were checked for enzyme activity by incubating the fraction
with pure caffeine (2mM) and NADPH (1 mM) at 30oC for 3 hours. The reaction
was stopped by addition of 50 µl of glacial acetic acid and analyzed for the
presence of products by HPLC. Active fractions were pooled and the purity of
enzyme was checked by SDS-PAGE.
4.3.3.3. Gel permeation chromatography:
Purification of the enzyme by gel permeation chromatography (Ward and
Arnott, 1965), was carried out in a Sephadex G -100 column of 1cm X 120 cm
dimensions (bed Volume= 144 cc), equilibrated with Tris-Cl buffer and 1.5 ml of
the sample (1.19 mg /ml protein) was applied to the top of the column. Elution was
carried out in the same buffer containing 100 mM NaCl to avoid non specific
binding to the matrix. 2 ml fractions were collected and active fractions were
pooled and used for further purification.
4.3.3.4. Hydrophobic interaction chromatography:
Hydrophobic interaction chromatography (HIC) was carried out on a phenyl
sepharose column (Machold, et.al., 2002). The matrix was washed off all the
remaining preservative, equilibrated with Tris-Cl buffer containing 1.0 M
ammonium sulphate and packed into a column of 2 cm X 20 cm. The packed bed ePrin
t@CFT
RI
A Biotechnological Approach for Decaffeination Chapter 4
201
volume was 10 ml. 2 ml of the crude enzyme (0.64 mg/ml of protein) was loaded on
the column and the column was washed with equilibration buffer to remove the
unbound fractions. Bound proteins were eluted by a negative ammonium sulphate
gradient. The unbound and bound fractions were checked for enzyme activity by
incubating the fraction with pure caffeine (2 mM) and NADPH (1 mM) at 30oC for
3 hours. The reaction was stopped by addition of 50 µl of glacial acetic acid and
analyzed for the presence of products by HPLC. Active fractions were pooled and
the purity was checked by SDS-PAGE.
4.3.3.5. Affinity chromatography:
The biogel blue sepharose (Biorad labs, UK) was packed to a column
(15mm X 100 mm) and used for purification of caffeine demethylase by a
modification of the method of Johan and Mooibroek, (1998). The column was
equilibrated with 50 mM NaCl and 2 ml of the enzyme (0.26 mg/ml of protein)
from HIC fractions was loaded on the column and washed with equilibration buffer
to remove the unbound fractions. Bound proteins were eluted by increasing sodium
chloride gradient (50-500 mM). The unbound and bound fractions were checked for
enzyme activity by incubating the fraction with pure caffeine (2 mM) and NADPH
(1 mM) at 30oC for 1 hour. The reaction was stopped by addition of 50 µl of glacial
acetic acid and analyzed for the presence of products by HPLC. Active fractions
were pooled and the purity was checked by SD- PAGE according to the method of
Laemmli (1970).
ePrin
t@CFT
RI
A Biotechnological Approach for Decaffeination Chapter 4
202
4.3.4. Characterization of caffeine demethylase:
4.3.4.1. Trypsin digestion for LC-MS analysis: Active fractions were pooled and concentrated. The protein content was
checked and to 750µg of the protein, 75 µg of trypsin was added in Tris-Cl buffer
pH 8.0 and incubated at 38oC for 1 hour. The reaction mixture was further
incubated for 12 hours at room temperature to complete the digestion (Stone and
Williams, 1996). The tryptic digest thus obtained was used for LC MS analysis.
4.3.4.2. Liquid chromatography with mass spectroscopic (LC-MS) analysis of caffeine demethylase: Active fractions of caffeine demethylase enzyme obtained from affinity
chromatography were injected into a Q-Tof Ultima mass spectrometer equipped
with a liquid chromatograph connected to a C8 column (Shevchenko et.al., 1996).
The chromatographic separation of the protein was done under an increasing
gradient of 70% acetonitrile containing 0.1% TFA and water containing 0.1% TFA
(Papayannopoulos, 1995). The peaks were directly injected into the mass
spectrophotometer attached with electro spray ionization injector in the positive
mode. The collision energy was 10.0 kV. The mass peaks obtained were analyzed
by mass lynx software and the masses of the proteins were calculated using the
mass finder option. The peptides obtained by tryptic digestion were also analysed in
the ESI positive mode and the sequencing of the mass fragments was done by using
MASCOT software (Matrix Science Inc. Boston, USA; www.matrixsciences.com).
4.3.4.3. Determination of the metal in the enzyme atomic absorption spectroscopy: The metal present in the enzyme was also determined by complete digestion
of the protein in nitric acid followed by atomic absorption spectroscopy (Shimadzu-eP
rint@
CFTRI
A Biotechnological Approach for Decaffeination Chapter 4
203
AA-6800 Atomic Absorption Spectrophotometer), with iron standards (Freedman
and Peisach, 1984).
4.3.4.4. Determining the co-factors for the enzyme:
The enzyme was dialyzed against buffer for 18 hrs with three changes in
buffer and then incubated with the co factors FAD, FADH, NAD, NADH, NADP
and NADPH and the preference to these co-factors was studied.
4.3.4.5. Stabilization of caffeine demethylase:
The enzymes extracted from cells are known to be unstable in vitro and
caffeine demethylase enzyme activity is lost rapidly in solution. Therefore,
stabilization of caffeine demethylase a key enzyme in the biodecaffeination process
is very important. Several stabilizing agents were used for the stabilization of
caffeine demethylase enzyme. Lysozyme, bovine serum albumin (BSA) and gelatin
were used as protein based stabilizing agents and sorbose, mannose, and raffinose
were used as the polyols for the stabilization of the enzymes. Gelatin, BSA and
lysozyme were added to the enzyme preparation at 2 mg/ml to 10 ml of crude
enzyme and incubated at room temperature for 3 hrs. All the polyols were incubated
at concentrations of 2% w/v. The residual enzyme activity was determined by
spectrophotometric assay of the caffeine demethylase activity at different intervals
of time. The enzyme preparation incubated with stabilizing agents was then stored
at 4oC in a refrigerator. The residual activity of the demethylase was checked every
10 days over a period of 90 days. ePrin
t@CFT
RI
A Biotechnological Approach for Decaffeination Chapter 4
204
4.4. RESULTS AND DISCUSSION:
4.4.1. Extraction of enzymes:
Several methods were employed in the present study for the extraction of
the enzymes involved in caffeine degradation in cells of P. alcaligenes. The cells
were harvested from shake flask and caffeine demethylase enzyme activity in the
cell free extract (CFE) was used as a measure of the enzyme activity in the study
and represented in the study. Table 4.4.1.1., represents the effect of different lysis
methods on the extraction of the enzymes.
Among the physical methods of lysis sonication for 10 minutes with 1
minute cycles and 5 minutes intermittent cooling was found to be efficient with
44.9 U/ml of caffeine demethylase activity and a protein content of 0.388mg/ml.
The protein content in the CFE increased with increasing the time of sonication, but
there was a drastic loss in the enzyme activity which is attributed to the mechanical
stress effected on the enzymes. Cell lysis by freezing and thawing was not efficient
in extraction of the enzyme and the protein content was also very low (0.112mg/ml)
compared to other methods. The enzyme activity was also low (2.8 U/ml) by using
this method. However, a lysis by freezing and thawing of the cells followed by
sonication was found to improve the extraction of the enzymes (0.554 mg/ml
protein and 12.6 U/ml) of activity.
Dynomill treatment was found to be more efficient among the physical
methods of cell lysis with 0.964mg/ml protein and 78.54U/ml of enzyme activity.
This method is useful in lysis of cells at a large scale. Enzymatic method of lysis
was found to be the best in terms of yields and activity of caffeine demethylase in
ePrin
t@CFT
RI
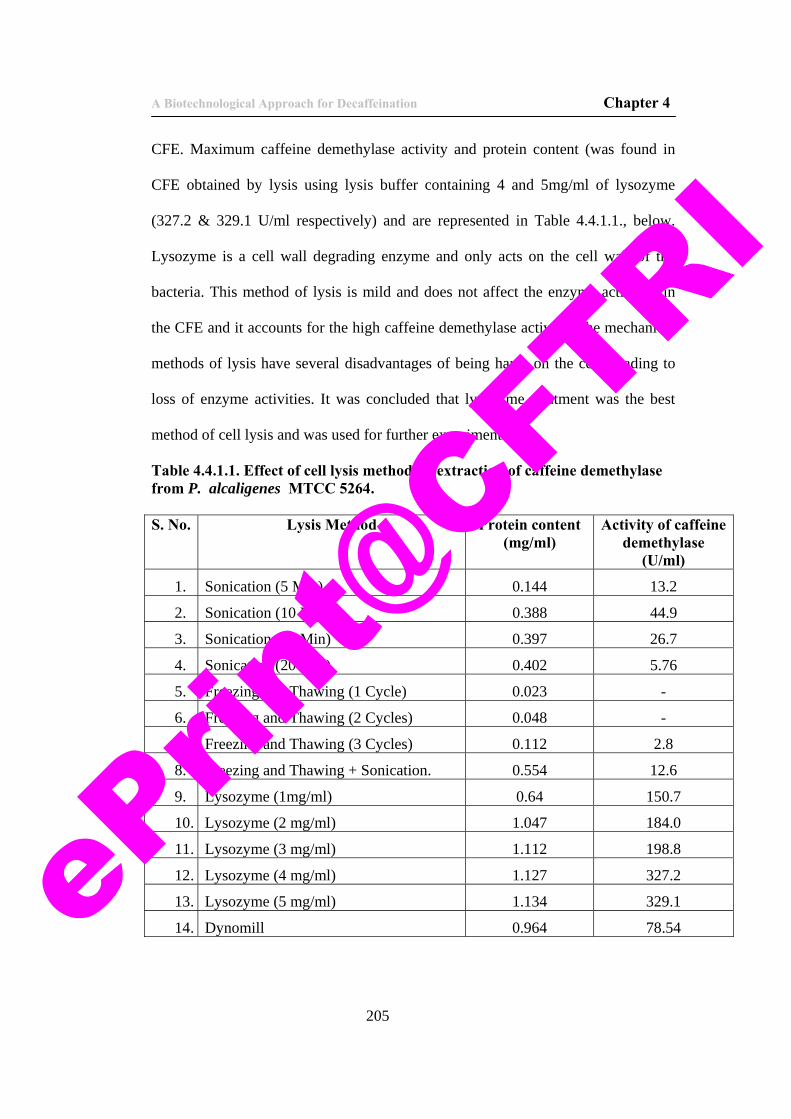
A Biotechnological Approach for Decaffeination Chapter 4
205
CFE. Maximum caffeine demethylase activity and protein content (was found in
CFE obtained by lysis using lysis buffer containing 4 and 5mg/ml of lysozyme
(327.2 & 329.1 U/ml respectively) and are represented in Table 4.4.1.1., below.
Lysozyme is a cell wall degrading enzyme and only acts on the cell wall of the
bacteria. This method of lysis is mild and does not affect the enzyme activities in
the CFE and it accounts for the high caffeine demethylase activity. The mechanical
methods of lysis have several disadvantages of being harsh on the cells leading to
loss of enzyme activities. It was concluded that lysozyme treatment was the best
method of cell lysis and was used for further experiments.
Table 4.4.1.1. Effect of cell lysis method on extraction of caffeine demethylase from P. alcaligenes MTCC 5264. S. No. Lysis Method Protein content
(mg/ml) Activity of caffeine
demethylase (U/ml)
1. Sonication (5 Min) 0.144 13.2
2. Sonication (10 Min) 0.388 44.9
3. Sonication (15 Min) 0.397 26.7
4. Sonication (20 Min) 0.402 5.76
5. Freezing and Thawing (1 Cycle) 0.023 -
6. Freezing and Thawing (2 Cycles) 0.048 -
7. Freezing and Thawing (3 Cycles) 0.112 2.8
8. Freezing and Thawing + Sonication. 0.554 12.6
9. Lysozyme (1mg/ml) 0.64 150.7
10. Lysozyme (2 mg/ml) 1.047 184.0
11. Lysozyme (3 mg/ml) 1.112 198.8
12. Lysozyme (4 mg/ml) 1.127 327.2
13. Lysozyme (5 mg/ml) 1.134 329.1
14. Dynomill 0.964 78.54
ePrin
t@CFT
RI
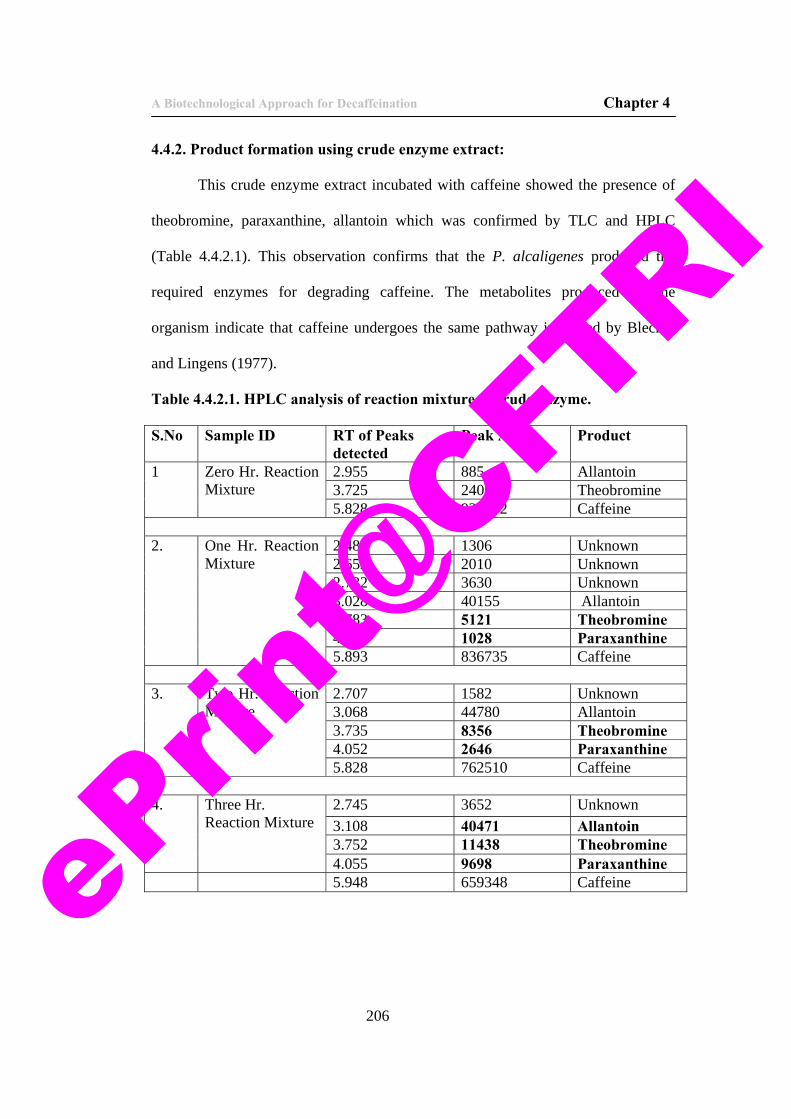
A Biotechnological Approach for Decaffeination Chapter 4
206
4.4.2. Product formation using crude enzyme extract:
This crude enzyme extract incubated with caffeine showed the presence of
theobromine, paraxanthine, allantoin which was confirmed by TLC and HPLC
(Table 4.4.2.1). This observation confirms that the P. alcaligenes produced the
required enzymes for degrading caffeine. The metabolites produced by the
organism indicate that caffeine undergoes the same pathway indicated by Blecher
and Lingens (1977).
Table 4.4.2.1. HPLC analysis of reaction mixture of crude enzyme.
S.No Sample ID RT of Peaks detected
Peak Area Product
1 Zero Hr. Reaction Mixture
2.955 885 Allantoin 3.725 2406 Theobromine 5.828 926892 Caffeine
2. One Hr. Reaction
Mixture 2.487 1306 Unknown 2.652 2010 Unknown 2.732 3630 Unknown 3.028 40155 Allantoin 3.783 5121 Theobromine 4.05 1028 Paraxanthine 5.893 836735 Caffeine
3. Two Hr. Reaction
Mixture 2.707 1582 Unknown 3.068 44780 Allantoin 3.735 8356 Theobromine 4.052 2646 Paraxanthine 5.828 762510 Caffeine
4. Three Hr.
Reaction Mixture 2.745 3652 Unknown 3.108 40471 Allantoin 3.752 11438 Theobromine 4.055 9698 Paraxanthine
5.948 659348 Caffeine
ePrin
t@CFT
RI

A Biotechnological Approach for Decaffeination Chapter 4
207
4.4.3. Identification of enzymes in crude extract responsible for degradation of caffeine:
4.4.3.1. Caffeine oxidase:
Initial experiments on the identification of the enzymes responsible for
caffeine degradation by P. alcaligenes MTCC 5264 showed an oxygenase activity.
Madhyasta et.al., (1999), using a consortium of Klebsiella sp. and Rhodococcus sp.
reported the presence of a caffeine oxidase which oxidizes caffeine at the C-8
position producing 1,3,7-trimethyl uric acid. However, when purification of
caffeine degrading enzymes from crude extract of P. alcaligenes MTCC 5264 was
attempted, there was a rapid loss in the activity. The reasons for this loss in the
activity were not known. When the dialyzed enzyme was assayed for activity in the
presence of NADPH, there was a regain in the activity. The reason for the loss and
regain of activity was also found to be due to cofactor leaching during the dialysis
step (Table 4.4.3.1).
This made us rethink whether the enzyme was an oxidase or it belongs to
other classes of enzymes. The loss of activity after dialysis and partial regain in the
activity of the enzyme by addition of NADPH lead to confirm whether the enzyme
is a oxygenase or a dehydrogenase. So the crude enzyme extract was assayed for its
specificity towards caffeine, theobromine and hypoxanthine. We have confirmed
that that the partially purified enzyme does not accept theobromine and
hypoxanthine as the substrates but accepts caffeine as substrate. This proves that the
enzyme was not a dehydrogenase as reported by Blecher and Lingens (1988). The
attempts were now made to identify the actual nature of the enzyme involved in
demethylation of caffeine with oxygenase activity but not producing the C-8 eP
rint@
CFTRI
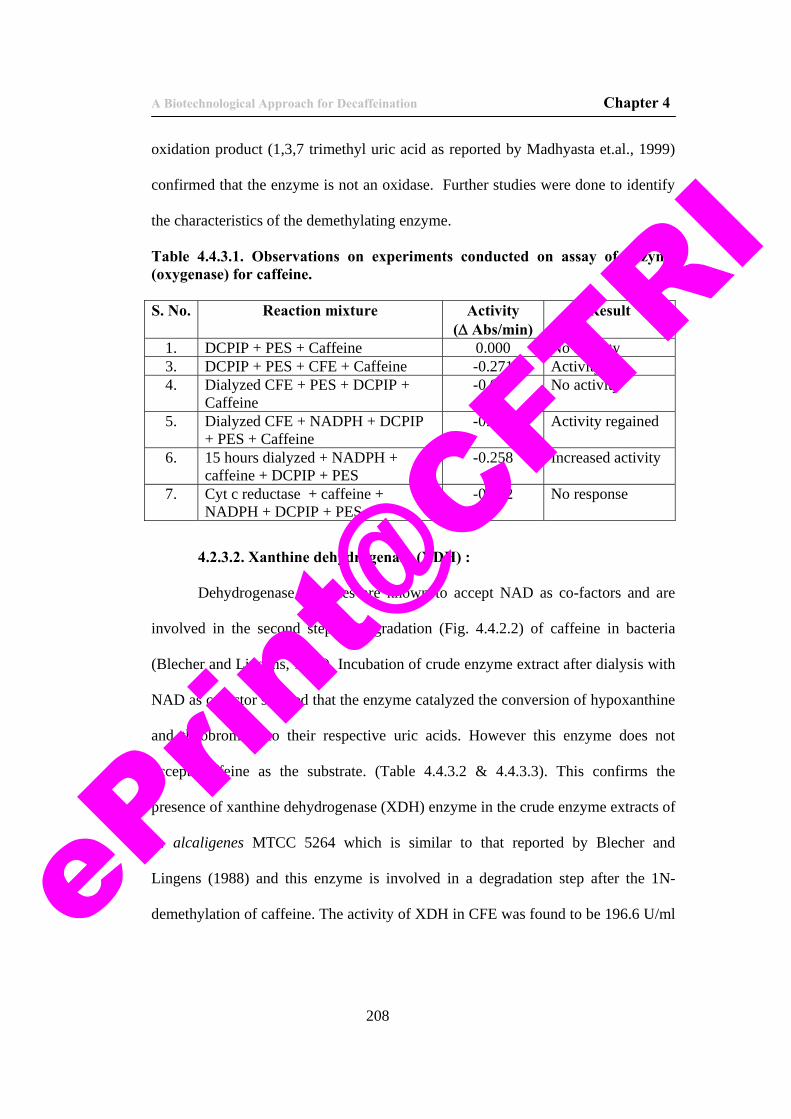
A Biotechnological Approach for Decaffeination Chapter 4
208
oxidation product (1,3,7 trimethyl uric acid as reported by Madhyasta et.al., 1999)
confirmed that the enzyme is not an oxidase. Further studies were done to identify
the characteristics of the demethylating enzyme.
Table 4.4.3.1. Observations on experiments conducted on assay of enzyme (oxygenase) for caffeine.
S. No. Reaction mixture Activity
(Δ Abs/min) Result
1. DCPIP + PES + Caffeine 0.000 No activity 3. DCPIP + PES + CFE + Caffeine -0.271 Activity 4. Dialyzed CFE + PES + DCPIP +
Caffeine -0.000 No activity
5. Dialyzed CFE + NADPH + DCPIP + PES + Caffeine
-0.028 Activity regained
6. 15 hours dialyzed + NADPH + caffeine + DCPIP + PES
-0.258
Increased activity
7. Cyt c reductase + caffeine + NADPH + DCPIP + PES
-0.002 No response
4.2.3.2. Xanthine dehydrogenase (XDH) :
Dehydrogenase enzymes are known to accept NAD as co-factors and are
involved in the second step of degradation (Fig. 4.4.2.2) of caffeine in bacteria
(Blecher and Lingens, 1988). Incubation of crude enzyme extract after dialysis with
NAD as cofactor showed that the enzyme catalyzed the conversion of hypoxanthine
and theobromine to their respective uric acids. However this enzyme does not
accept caffeine as the substrate. (Table 4.4.3.2 & 4.4.3.3). This confirms the
presence of xanthine dehydrogenase (XDH) enzyme in the crude enzyme extracts of
P. alcaligenes MTCC 5264 which is similar to that reported by Blecher and
Lingens (1988) and this enzyme is involved in a degradation step after the 1N-
demethylation of caffeine. The activity of XDH in CFE was found to be 196.6 U/ml ePrin
t@CFT
RI
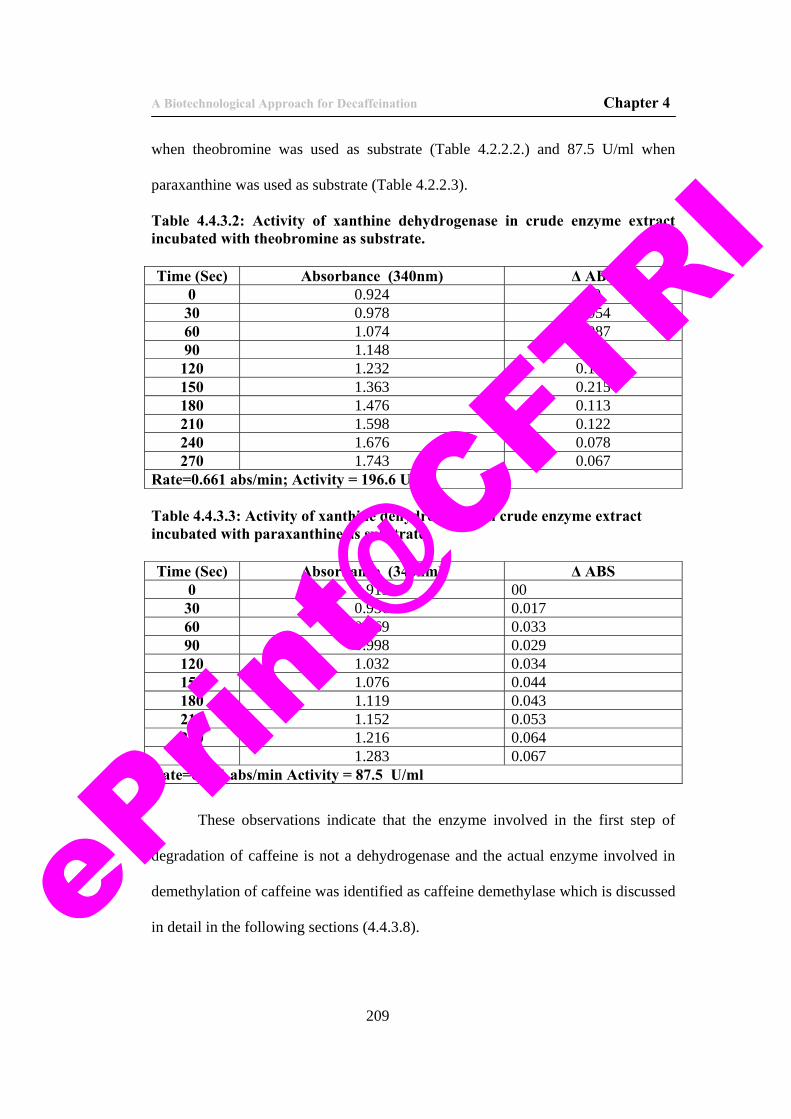
A Biotechnological Approach for Decaffeination Chapter 4
209
when theobromine was used as substrate (Table 4.2.2.2.) and 87.5 U/ml when
paraxanthine was used as substrate (Table 4.2.2.3).
Table 4.4.3.2: Activity of xanthine dehydrogenase in crude enzyme extract incubated with theobromine as substrate.
Table 4.4.3.3: Activity of xanthine dehydrogenase in crude enzyme extract incubated with paraxanthine as substrate.
These observations indicate that the enzyme involved in the first step of
degradation of caffeine is not a dehydrogenase and the actual enzyme involved in
demethylation of caffeine was identified as caffeine demethylase which is discussed
in detail in the following sections (4.4.3.8).
Time (Sec) Absorbance (340nm) Δ ABS 0 0.924 00 30 0.978 0.054 60 1.074 0.087 90 1.148 0.096
120 1.232 0.158 150 1.363 0.215 180 1.476 0.113 210 1.598 0.122 240 1.676 0.078 270 1.743 0.067
Rate=0.661 abs/min; Activity = 196.6 U/ml
Time (Sec) Absorbance (340nm) Δ ABS 0 0.919 00 30 0.936 0.017 60 0.969 0.033 90 0.998 0.029
120 1.032 0.034 150 1.076 0.044 180 1.119 0.043 210 1.152 0.053 240 1.216 0.064 270 1.283 0.067
Rate=0.231 abs/min Activity = 87.5 U/ml
ePrin
t@CFT
RI

A Biotechnological Approach for Decaffeination Chapter 4
210
4.4.3.3. Heteroxanthine demethylase:
Heteroxanthine demethylase activity in the crude extract was determined
and it was found that the enzyme acts upon the dimethyl xanthines Viz.,
theobromine and paraxanthine and converts them to monomethyl xanthine (7-
methyl xanthine) (Fig. 4.4.2.2). This enzyme is also involved in the demethylation
of 3,7- dimethyl uric acid and 1,7- dimethyl uric acid formed by the action of
xanthine oxidase on theobromine and paraxanthine converting them to 7-methyl
uric acid. This enzyme however does not accept caffeine as substrate. The
heteroxanthine demethylase activity in CFE was found to be 154.36U/ml.
4.4.3.4. Xanthine oxidase:
Xanthine oxidase is a ubiquitous enzyme involved in the degradation of
purines and is expressed in high levels in almost all the living systems, which along
with other enzymes acts as a recycling system of old and degraded genetic material
for the cells through the salvage pathways (Vitória and Mazzafera, 1999; Moriwaki,
et.al., 1999). Xanthine oxidase was found to be the enzyme involved in the
oxidation of the dimethyl and monomethyl xanthines formed during the degradation
of caffeine (Fig. 4.4.2.2., Table. 4.4.3.4.).
From our experiments it was found that xanthine oxidase was responsible
for the formation of uric acid in the caffeine degradation pathway of P. alcaligenes
MTCC 5264. The xanthine oxidase activity in the enzyme extract was found to be
522 U/ml. It accepts theobromine and paraxanthine as substrates to form the
respective methyl uric acids, which were detected by HPLC analysis of the reaction
mixtures of enzyme and caffeine. ePrin
t@CFT
RI
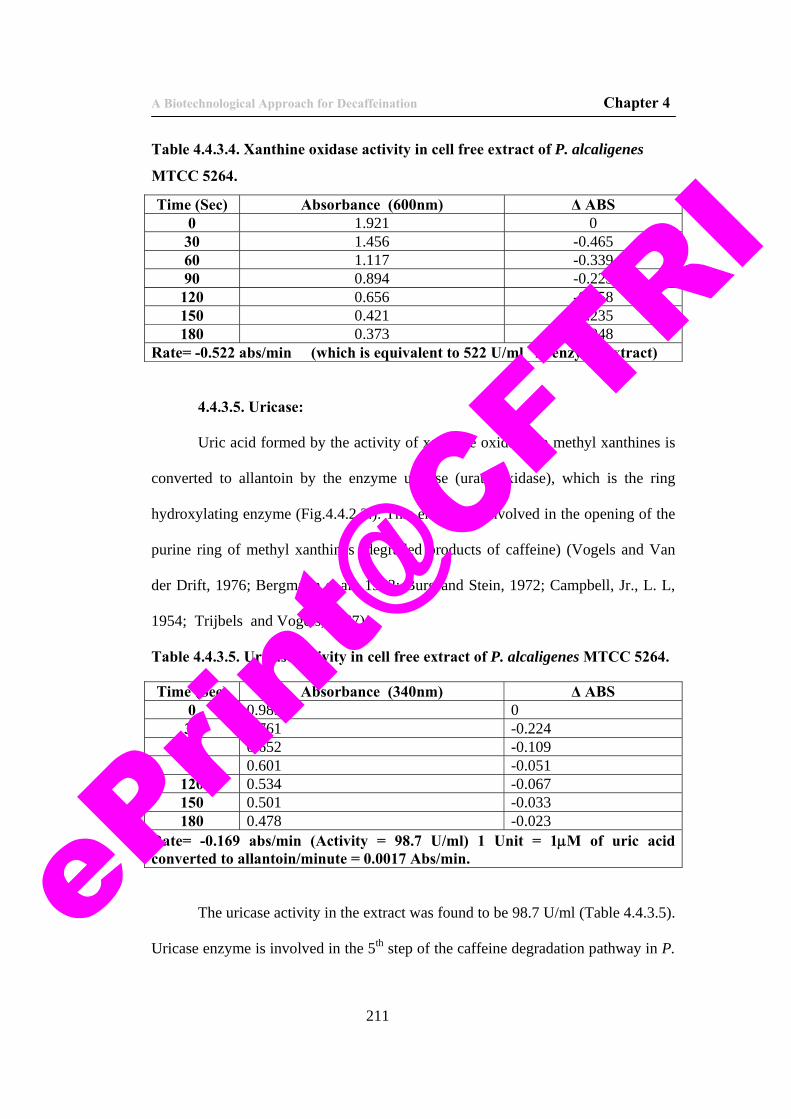
A Biotechnological Approach for Decaffeination Chapter 4
211
Table 4.4.3.4. Xanthine oxidase activity in cell free extract of P. alcaligenes
MTCC 5264.
4.4.3.5. Uricase:
Uric acid formed by the activity of xanthine oxidase on methyl xanthines is
converted to allantoin by the enzyme uricase (urate oxidase), which is the ring
hydroxylating enzyme (Fig.4.4.2.2.). This enzyme is involved in the opening of the
purine ring of methyl xanthines (degraded products of caffeine) (Vogels and Van
der Drift, 1976; Bergmann et.al., 1962; Burg and Stein, 1972; Campbell, Jr., L. L,
1954; Trijbels and Vogels, 1967).
Table 4.4.3.5. Uricase activity in cell free extract of P. alcaligenes MTCC 5264.
The uricase activity in the extract was found to be 98.7 U/ml (Table 4.4.3.5).
Uricase enzyme is involved in the 5th step of the caffeine degradation pathway in P.
Time (Sec) Absorbance (600nm) Δ ABS 0 1.921 0 30 1.456 -0.465 60 1.117 -0.339 90 0.894 -0.223
120 0.656 -0.258 150 0.421 -0.235 180 0.373 -0.048
Rate= -0.522 abs/min (which is equivalent to 522 U/ml in enzyme extract)
Time (Sec) Absorbance (340nm) Δ ABS 0 0.985 0 30 0.761 -0.224 60 0.652 -0.109 90 0.601 -0.051
120 0.534 -0.067 150 0.501 -0.033 180 0.478 -0.023
Rate= -0.169 abs/min (Activity = 98.7 U/ml) 1 Unit = 1μM of uric acid converted to allantoin/minute = 0.0017 Abs/min. ePrin
t@CFT
RI
A Biotechnological Approach for Decaffeination Chapter 4
212
alcaligenes MTCC 5264. The results of this study are also similar to that reported
by Vogels and Van der Drift, (1976); Blecher and Lingens, (1988) and several
others. Further studies were conducted on the identification of other enzyme
produced by P. alcaligenes MTCC 5264.
4.4.3.6. Allantoinase and Allantoicase:
Allantoin formed during the oxidation of uric acid is degraded to allantoic
acid by allantoinase. Allantoic acid is further degraded to urea and glyoxylic acid
by allantoicase. Glyoxylic acid formed is further converted to Urea by glyoxalate
dehydrogenase. Uricase activity was determined in the CFE and allantoin produced
by the above reaction was monitored by HPLC analysis of the reaction mixture
(Table 4.4.3.5, Table 4.4.2.1) and allantoin and allantoic acid were detected in the
reaction mixture. Allantoic acid produced during the degradation of allantoin is
further converted to ureidoglycolate which is believed to be brought about by
allantoicase. Ureidoglycolate is further degraded to urea and glyoxylic acid by the
action of glyoxylate dehydrogenase which was observed in the reaction mixture.
4.4.3.7. Urease:
Urea formed in the above reactions is further converted to ammonia and
carbon dioxide by the enzyme urease present in the enzyme extract from
P. alcaligenes MTCC 5264. The production of ammonia which was the end product
of caffeine degradation was monitored by Nessler’s reagent (Table 4.4.3.6). It was
also observed that the pH of the reaction mixture increased from 6.8 to 8.7. The
urease activity in CFE was found to be 48.4 U/ml.
ePrin
t@CFT
RI
A Biotechnological Approach for Decaffeination Chapter 4
213
Table 4.4.3.6. Assay for urease enzyme in cell free extract.
Time (Min) set 1 (Abs 490 nm) Set 2 (Abs 490 nm) 0 0.201 0.204 5 0.399 0.412 15 0.49 0.492 30 0.533 0.539 60 0.76 0.7772
(Activity = 48.4 U/ml)
4.4.3.8. Caffeine demethylase:
The first step of caffeine (containing 3 methyl groups) degradation includes
a demethylation reaction, which was confirmed by the product formation i.e.,
theobromine having 2 methyl groups. The enzyme activity in vitro has not been
conclusively reported earlier. It is also interesting to know that this enzyme is a
mono-oxygenase requiring NADPH as a cofactor and the characteristics of this
demethylase are described below. The oxygenase nature of this enzyme is
responsible for the positive result in the DCPIP assay in our earlier experiments.
However the HPLC analysis of the enzyme reaction mixture showed the formation
of theobromine which is a N-Demethylation product in contrast to the C-8 oxidation
product reported by Madhyasta et.al., (1998, 1999), and a demethylase fits more
into the reaction scheme than an oxidase as found in our observations. The oxidase
model does not fit into the caffeine degradation pathway of P. alcaligenes
MTCC 5264 (Fig. 4.4.2.2.). The monooxygenase activity was observed along with
the demethylating activity in the presence of NADPH as a cofactor confirming our
hypothesis.
ePrin
t@CFT
RI
A Biotechnological Approach for Decaffeination Chapter 4
214
a) Monooxygenase activity of caffeine demethylase:
The monooxygenase nature of the enzyme was determined by oximetry
(Fig. 4.4.3.1.). It was observed that the enzyme requires one mole of oxygen per
mole of caffeine converted. It was also found that the enzyme is oxygen dependent
and has a monooxygenase activity not an oxidase activity, indicating that the
enzyme is also a monooxygenase as described in literature (Asano et. al.. 1994).
From the results obtained in all the experiments so far we could conclude
that the enzyme involved in the first step of the caffeine degradation pathway is a
NADPH dependent monooxygenase (Fig. 4.4.2.2). There are a few reports available
Figure 4.4.3.1. Determination of caffeine demethylase activity in CFE from P . alcaligenes MTCC 5264 by oximetry.
40
45
50
55
60
65
70
75
80
85
0 100 200 300 400
Time (sec)
Dis
solv
ed O
xyge
n (%
)
Control Aeration + NADPH Non Aerated
ePrin
t@CFT
RI
A Biotechnological Approach for Decaffeination Chapter 4
215
in literature indicating the presence of a monooxygenase in the caffeine degradation
pathway (Middelhoven and Lommen, 1984).
Reports on the enzyme involved in caffeine degradation (Blecher and
Lingens, 1977; Asano et.al., 1994) indicate that a demethylating enzyme in the
caffeine degradation pathway which is a mixed function oxygenase, which requires
the presence of a cofactor (NAD(P)H).
The reaction scheme is as follows:
Caffeine + NAD(P)H + O2 CDM Enzyme Theobromine+ CH3OH + NAD(P)+
From the above experiments the enzymes involved in the caffeine
degradation pathway of P. alcaligenes MTCC 5264 have been identified and Figure
4.4.2.2 represents the caffeine degradation pathway in P. alcaligenes MTCC 5264.
The activity of caffeine demethylase enzyme from P. alcaligenes MTCC 5264 is
similar to the cytochrome P450 found in eukaryotes. The bacterial caffeine
demethylase differs from the cytochrome P450 as it is not membrane bound and
enzyme preparations from P. alcaligenes MTCC 5264 do not show the carbon
monoxide spectrum characteristic to cytochrome P450. Moreover, the enzyme does
not require a cytochrome c reductase as a co factor which is very essential for
Cytochrome P 450 and occurs as a single protein (Fig. 4.4.4.4, Section 4.4.4.) in the
cell free extracts of P alcaligenes MTCC 5264. Thus this enzyme is a novel protein
and has clear distinction from the cytochrome P450, caffeine oxidase (Madhyasta
et. al., 1999) and caffeine demethylase complex described by Sideso et.al., (2001). ePrin
t@CFT
RI
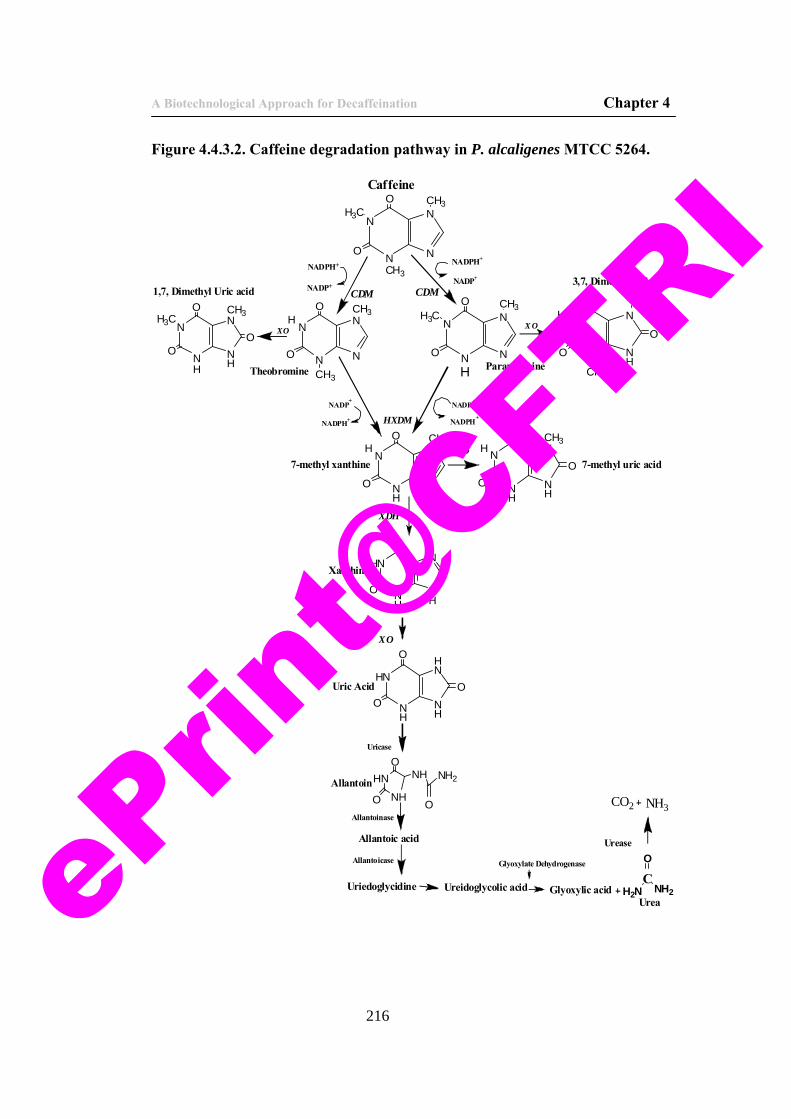
A Biotechnological Approach for Decaffeination Chapter 4
216
Figure 4.4.3.2. Caffeine degradation pathway in P. alcaligenes MTCC 5264.
N
N N
N
O
OH3C
CH3
CH3
Caffeine
N
N N
N
O
OH
CH3
CH3
Theobromine
N
N N
N
O
OH3C
H
CH3
Paraxanthine
N
N NH
N
O
OH
CH3
CH3
ON
N NH
N
O
OH3C
H
CH3
O
1,7, Dimethyl Uric acid3,7, Dimethyl Uric acid
N
NH
N
N
O
OH
CH3
7-methyl xanthineN
NH
NH
N
O
OH
CH3
O 7-methyl uric acid
HN
NH
NH
HN
O
O
OUric Acid
HN
NH
NH
N
O
O
Xanthine
Allantoin
CO
H2N NH2
Allantoic acid
Uriedoglycidine Ureidoglycolic acid Glyoxylic acidUrea
NH3CO2
CDM CDM
XO X O
X O
XO
HXDM
XDH
Uricase
Allantoinase
Allantoicase Glyoxylate Dehydrogenase
Urease
NADPH+
NADP+
NADPH+
NADP+
NADPH+
NADP+
NADPH+
NADP+
HN
NH
NH
O
ONH2
O
ePrin
t@CFT
RI
A Biotechnological Approach for Decaffeination Chapter 4
217
Figure 4.4.3.2., represents the caffeine degradation pathway in P.
alcaligenes MTCC 5264. Caffeine is converted to theobromine and paraxanthine by
a 1N and 3N-demethylase respectively. The dimethyl xanthines are then oxidized to
their respective uric acids by the action of xanthine oxidase. The dimethyl uric acids
undergo further demethylation by heteroxanthine demethylase to produce 7-methyl
xanthine. The 7-methyl xanthine is demethylated to xanthine dehydrogenase and by
the action of xanthine oxidase is converted to uric acid. Uricase further converts the
uric acid to allantoin which is degraded to allantoic acid, uriedoglycolate and urea
by the action of allantoinase, allantoicase and glyoxylate dehydrogenase
respectively. Urea is further converted to ammonia and CO2 by the action of urease.
The methyl groups removed by demethylases and the dehydrogenase are oxidized
to methanol which is further oxidized to formaldehyde. Formaldehyde is degraded
to CO2 and water by the action of formaldehyde dehydrogenase. The formaldehyde
oxidation was confirmed by monitoring the formation of formaldehyde in the
reaction mixture followed by its disappearance. Thus the products of caffeine
degradation are degraded to safe and simpler molecules like NH3 and CO2 (Figure
4.4.3.2).
4.4.4. Storage stability of caffeine demethylase:
It is generally known that the demethylases are unstable after extraction
from the cells and rapidly lose activity even after preservation at 40C (Gluck and
Lingens, 1988; Sideso et. al., 2001). Experiments conducted on the purification of
the enzyme showed a loss in the activity on storage at 40C over a period of 96 hours
(Fig. 4.4.4.1a) and thus the enzyme was not stable in pure form. ePrin
t@CFT
RI
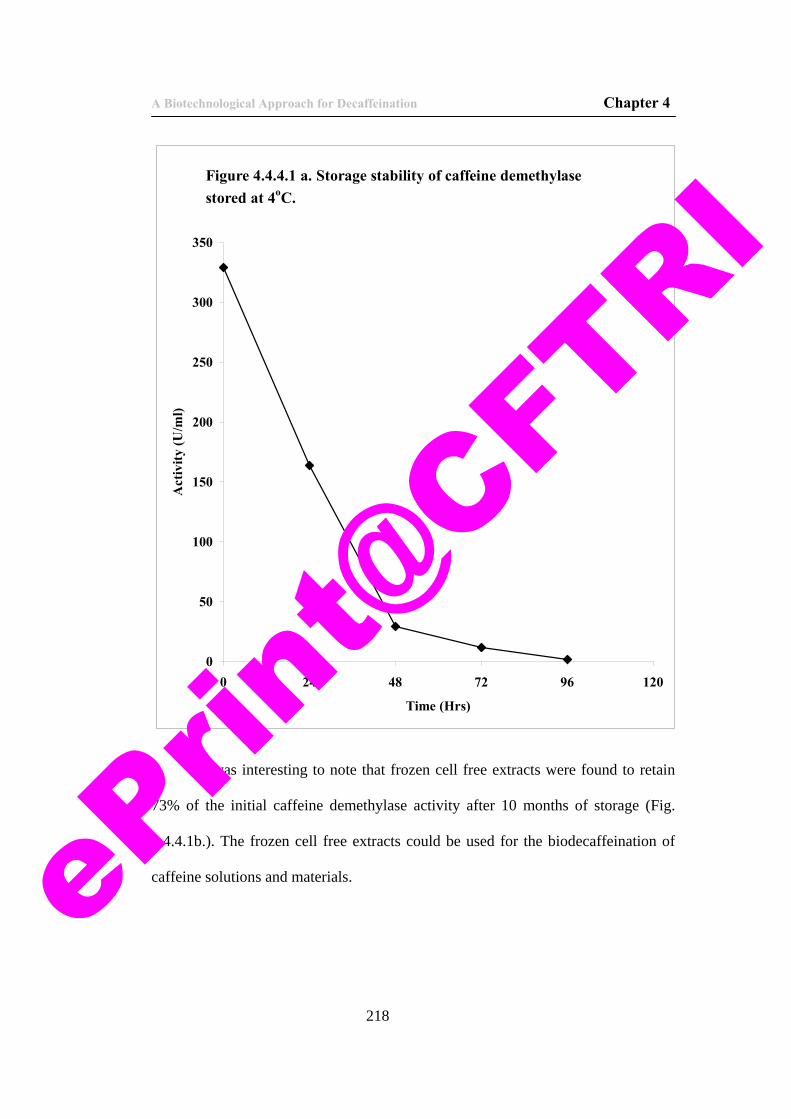
A Biotechnological Approach for Decaffeination Chapter 4
218
Figure 4.4.4.1 a. Storage stability of caffeine demethylase stored at 4oC.
0
50
100
150
200
250
300
350
0 24 48 72 96 120
Time (Hrs)
Act
ivity
(U/m
l)
It was interesting to note that frozen cell free extracts were found to retain
73% of the initial caffeine demethylase activity after 10 months of storage (Fig.
4.4.4.1b.). The frozen cell free extracts could be used for the biodecaffeination of
caffeine solutions and materials.
eP
rint@
CFTRI
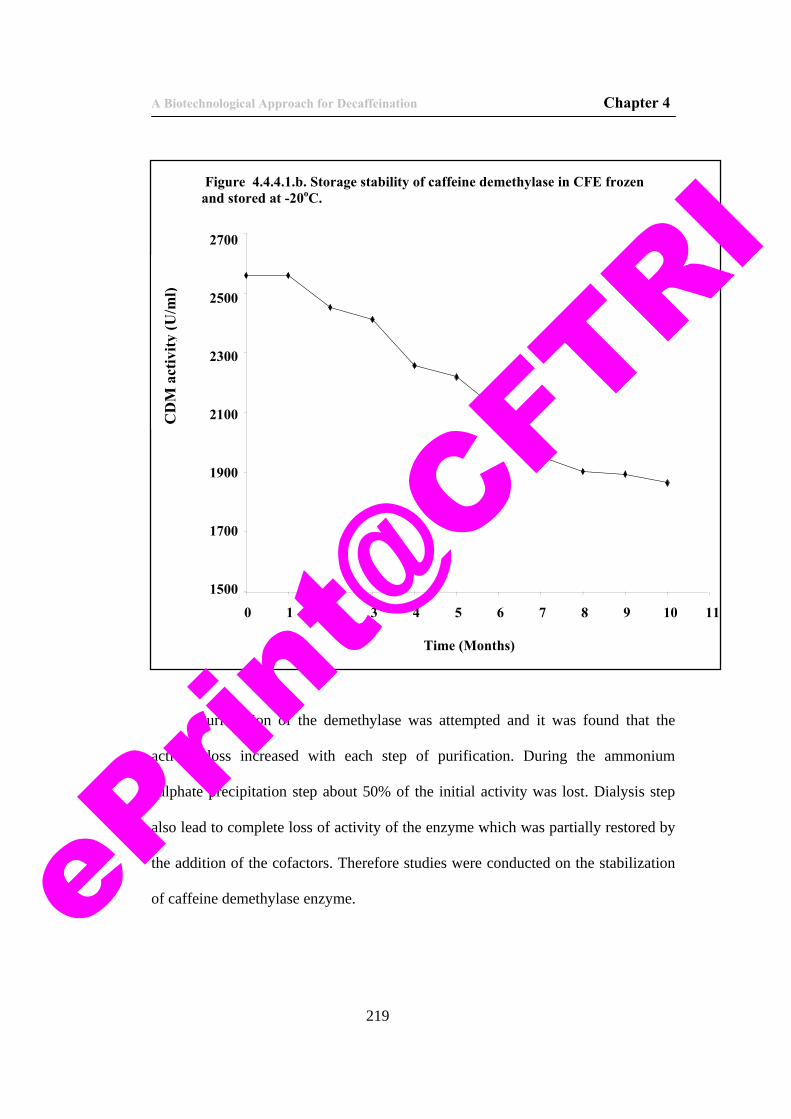
A Biotechnological Approach for Decaffeination Chapter 4
219
Purification of the demethylase was attempted and it was found that the
activity loss increased with each step of purification. During the ammonium
sulphate precipitation step about 50% of the initial activity was lost. Dialysis step
also lead to complete loss of activity of the enzyme which was partially restored by
the addition of the cofactors. Therefore studies were conducted on the stabilization
of caffeine demethylase enzyme.
1500
1700
1900
2100
2300
2500
2700
0 1 2 3 4 5 6 7 8 9 10 11
Time (Months)
Figure 4.4.4.1.b. Storage stability of caffeine demethylase in CFE frozen and stored at -20oC.
CD
M a
ctiv
ity (U
/ml)
ePrin
t@CFT
RI
A Biotechnological Approach for Decaffeination Chapter 4
220
4.4.4.1. Stabilization of caffeine demethylase: It is generally known that the demethylases are unstable after extraction
form the cells and rapidly lose activity even after preservation at 4oC (Gluck and
Lingens, 1987; Asano et. al., 1993, Sideso et. al., 2001). Initial experiments
conducted in our laboratory on the purification of the enzyme showed a loss in the
activity on storage at 4oC over a period of 96 hours. The enzymes extracted from
cells are known to be unstable in vitro and caffeine demethylase enzyme activity is
lost rapidly in solution. Therefore stabilization of caffeine demethylase a key
enzyme in the biodecaffeination process is very important. Several stabilizing
agents were used for the stabilization of caffeine demethylase enzyme.
Lysozyme, bovine serum albumin (BSA) and gelatin are known to stabilize
enzymes and are known as protein based stabilizing agents (PBSA). In our
laboratory at CFTRI, Gouda et. al., (2002, 2003) have reported the stabilization of
glucose oxidase, mutarotase and invertase by the use of these PBSAs for biosensor
application up to 1000 analyses. The effectiveness of these PBSAs along with
sorbose, mannose, and raffinose on the stabilization of the caffeine demethylase
enzyme in solution was tested. The stability of caffeine demethylase in solution in
the presence of PBSAs and Polyols improved. In the absence of stabilizing agents
the half life (T ½) of the enzyme was less than 24 hrs (Fig. 4.4.4.2.). Lysozyme at 2
mg/ml in the enzyme preparation was found to confer maximum stability to the
enzyme with a T ½ of 60 days, where as BSA and gelatin could stabilize the
enzyme for less than 20 days only (Fig. 4.4.4.2.). Lysozyme is a basic protein
(pI~11) may be interacting with the caffeine demethylase enzyme through ionic ePrin
t@CFT
RI
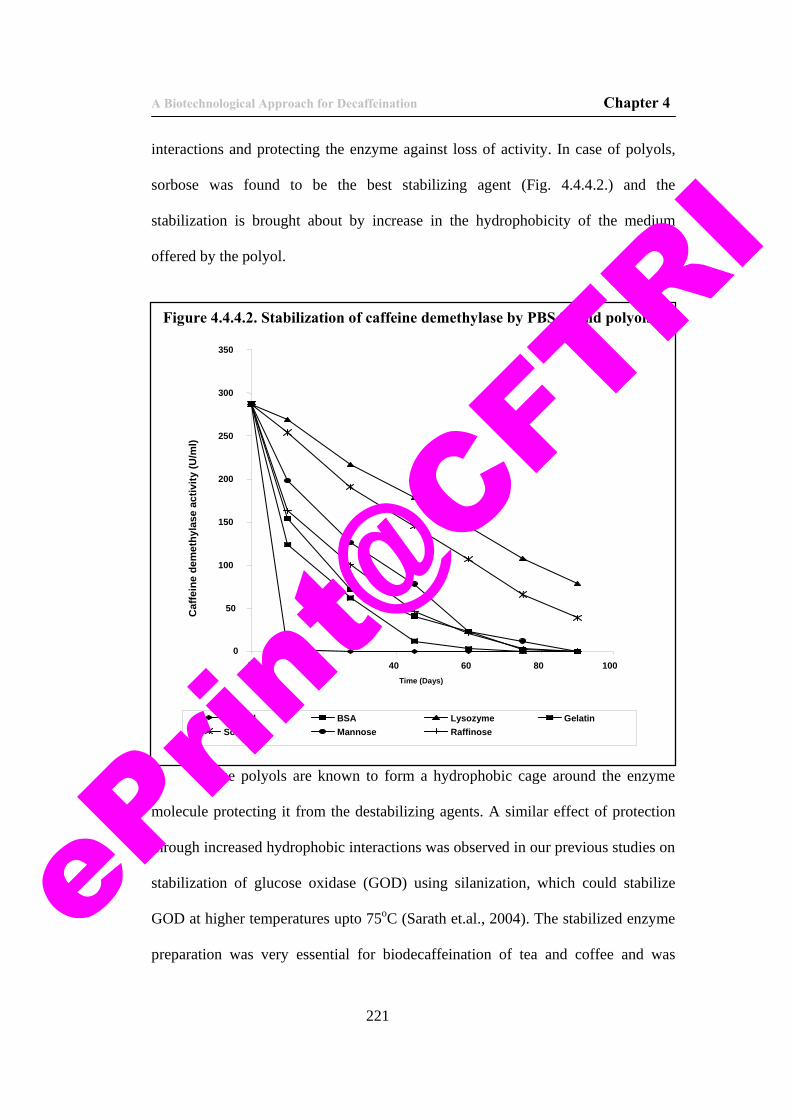
A Biotechnological Approach for Decaffeination Chapter 4
221
interactions and protecting the enzyme against loss of activity. In case of polyols,
sorbose was found to be the best stabilizing agent (Fig. 4.4.4.2.) and the
stabilization is brought about by increase in the hydrophobicity of the medium
offered by the polyol.
These polyols are known to form a hydrophobic cage around the enzyme
molecule protecting it from the destabilizing agents. A similar effect of protection
through increased hydrophobic interactions was observed in our previous studies on
stabilization of glucose oxidase (GOD) using silanization, which could stabilize
GOD at higher temperatures upto 75oC (Sarath et.al., 2004). The stabilized enzyme
preparation was very essential for biodecaffeination of tea and coffee and was
Figure 4.4.4.2. Stabilization of caffeine demethylase by PBSAs and polyols.
0
50
100
150
200
250
300
350
0 20 40 60 80 100Time (Days)
Caf
fein
e de
met
hyla
se a
ctiv
ity (U
/ml)
Control BSA Lysozyme GelatinSorbose Mannose Raffinose
ePrin
t@CFT
RI
A Biotechnological Approach for Decaffeination Chapter 4
222
found useful in the development of biodecaffeination process which is reported in
the next chapter of the thesis.
4.4.5. Purification of caffeine demethylase:
The protein content and caffeine demethylase activity in the crude CFE were
found to be 1.104 mg/ml and 329.1 U/ml respectively. Purification of caffeine
demethylase was carried out using different procedures and is described below.
4.4.5.1. Salting out:
The enzyme was salted out at an ammonium sulphate concentration of 30-60
% w/v. The activity however dropped by around 50 % (Fig.4.4.5.4). There was a
slight increase in the protein content after salting out may be due to the
concentrating effect. The protein content in the enzyme preparation after salting out
was 1.19mg/ml and caffeine demethylase activity was 163.26 U/ml.
4.4.5.2. Gel permeation chromatography:
Gel permeation chromatography on Sephadex G-100 column lead to a
further purification of caffeine demethylase. The activity was 156 U/ml and the
protein content was 0.56 mg/ml (Fig.4.4.5.1. and Fig.4.4.5.4.). The specific activity
of caffeine demethylase was 278.57 U/mg protein. From Fig. 4.4.5.1., it was
observed that the enzyme eluted from the gel in the fractions from 40-45 and a 2
fold increase in the purity was observed.
ePrin
t@CFT
RI
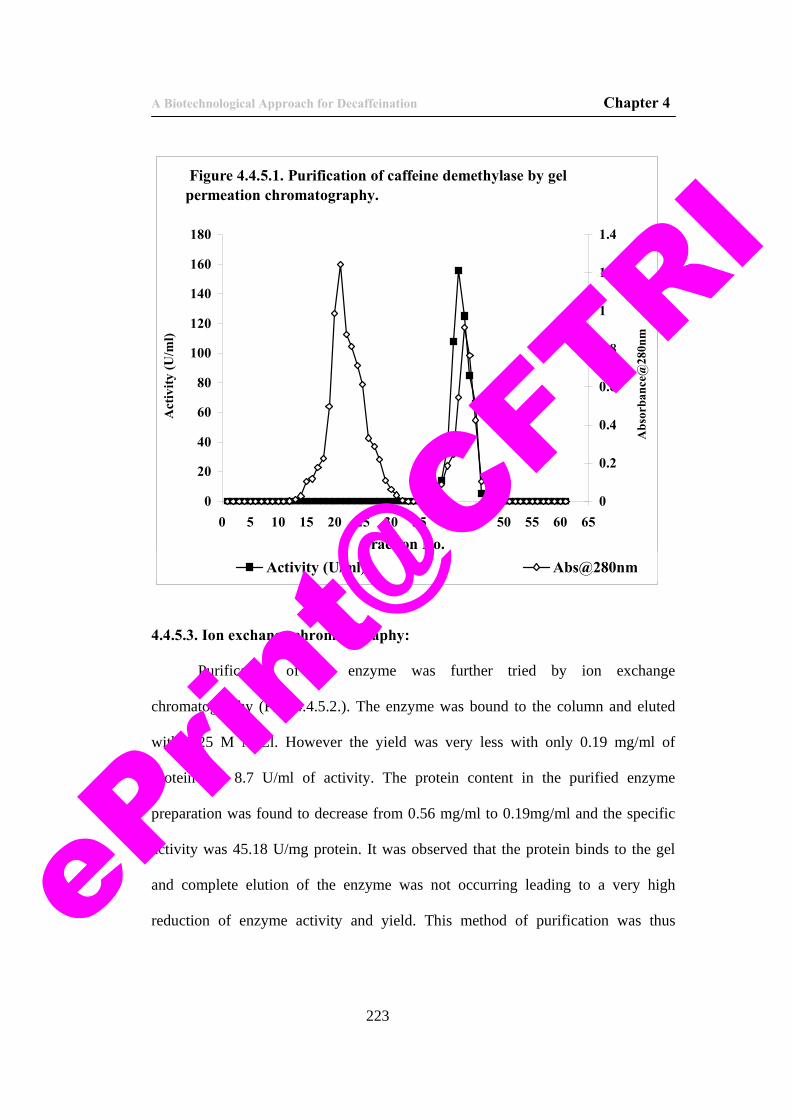
A Biotechnological Approach for Decaffeination Chapter 4
223
4.4.5.3. Ion exchange chromatography:
Purification of the enzyme was further tried by ion exchange
chromatography (Fig. 4.4.5.2.). The enzyme was bound to the column and eluted
with 0.25 M NaCl. However the yield was very less with only 0.19 mg/ml of
protein and 8.7 U/ml of activity. The protein content in the purified enzyme
preparation was found to decrease from 0.56 mg/ml to 0.19mg/ml and the specific
activity was 45.18 U/mg protein. It was observed that the protein binds to the gel
and complete elution of the enzyme was not occurring leading to a very high
reduction of enzyme activity and yield. This method of purification was thus
Figure 4.4.5.1. Purification of caffeine demethylase by gel permeation chromatography.
0
20
40
60
80
100
120
140
160
180
0 5 10 15 20 25 30 35 40 45 50 55 60 65Fraction No.
Act
ivity
(U/m
l)
0
0.2
0.4
0.6
0.8
1
1.2
1.4
Abs
orba
nce@
280n
m
Activity (U/ml) Abs@280nm
ePrin
t@CFT
RI
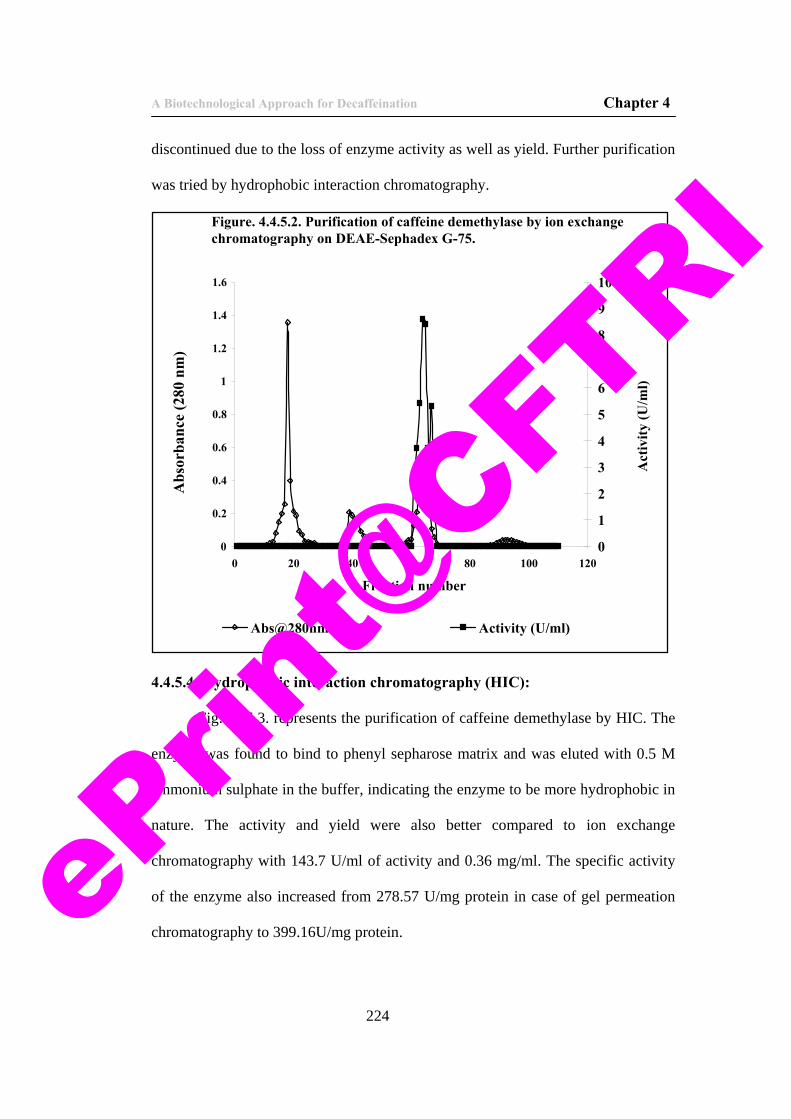
A Biotechnological Approach for Decaffeination Chapter 4
224
discontinued due to the loss of enzyme activity as well as yield. Further purification
was tried by hydrophobic interaction chromatography.
4.4.5.4. Hydrophobic interaction chromatography (HIC):
Fig.4.4.5.3. represents the purification of caffeine demethylase by HIC. The
enzyme was found to bind to phenyl sepharose matrix and was eluted with 0.5 M
ammonium sulphate in the buffer, indicating the enzyme to be more hydrophobic in
nature. The activity and yield were also better compared to ion exchange
chromatography with 143.7 U/ml of activity and 0.36 mg/ml. The specific activity
of the enzyme also increased from 278.57 U/mg protein in case of gel permeation
chromatography to 399.16U/mg protein.
Figure. 4.4.5.2. Purification of caffeine demethylase by ion exchange chromatography on DEAE-Sephadex G-75.
0
0.2
0.4
0.6
0.8
1
1.2
1.4
1.6
0 20 40 60 80 100 120
Fraction number
Abs
orba
nce
(280
nm
)
0
1
2
3
4
5
6
7
8
9
10
Act
ivity
(U/m
l)Abs@280nm Activity (U/ml)
ePrin
t@CFT
RI
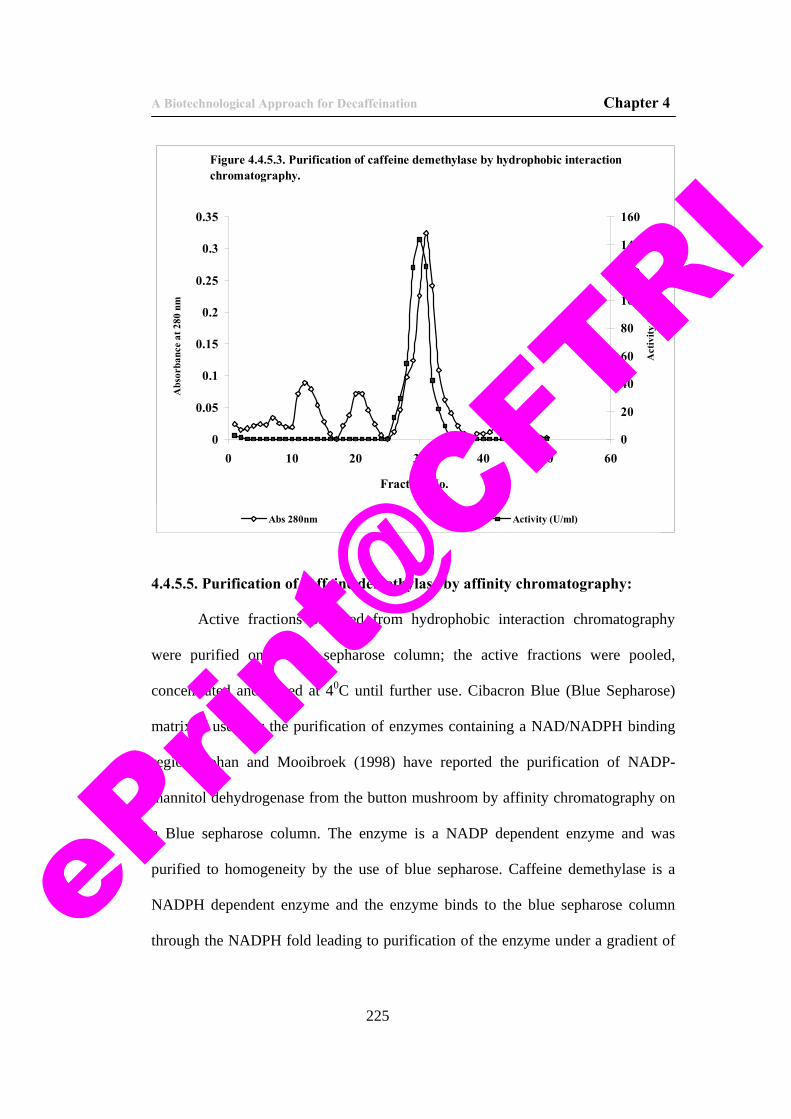
A Biotechnological Approach for Decaffeination Chapter 4
225
4.4.5.5. Purification of caffeine demethylase by affinity chromatography:
Active fractions obtained from hydrophobic interaction chromatography
were purified on a blue sepharose column; the active fractions were pooled,
concentrated and stored at 40C until further use. Cibacron Blue (Blue Sepharose)
matrix is used for the purification of enzymes containing a NAD/NADPH binding
region. Johan and Mooibroek (1998) have reported the purification of NADP-
mannitol dehydrogenase from the button mushroom by affinity chromatography on
a Blue sepharose column. The enzyme is a NADP dependent enzyme and was
purified to homogeneity by the use of blue sepharose. Caffeine demethylase is a
NADPH dependent enzyme and the enzyme binds to the blue sepharose column
through the NADPH fold leading to purification of the enzyme under a gradient of
Figure 4.4.5.3. Purification of caffeine demethylase by hydrophobic interaction chromatography.
0
0.05
0.1
0.15
0.2
0.25
0.3
0.35
0 10 20 30 40 50 60
Fraction No.
Abs
orba
nce
at 2
80 n
m
0
20
40
60
80
100
120
140
160
Act
ivity
(U/m
l)
Abs 280nm Activity (U/ml)
ePrin
t@CFT
RI
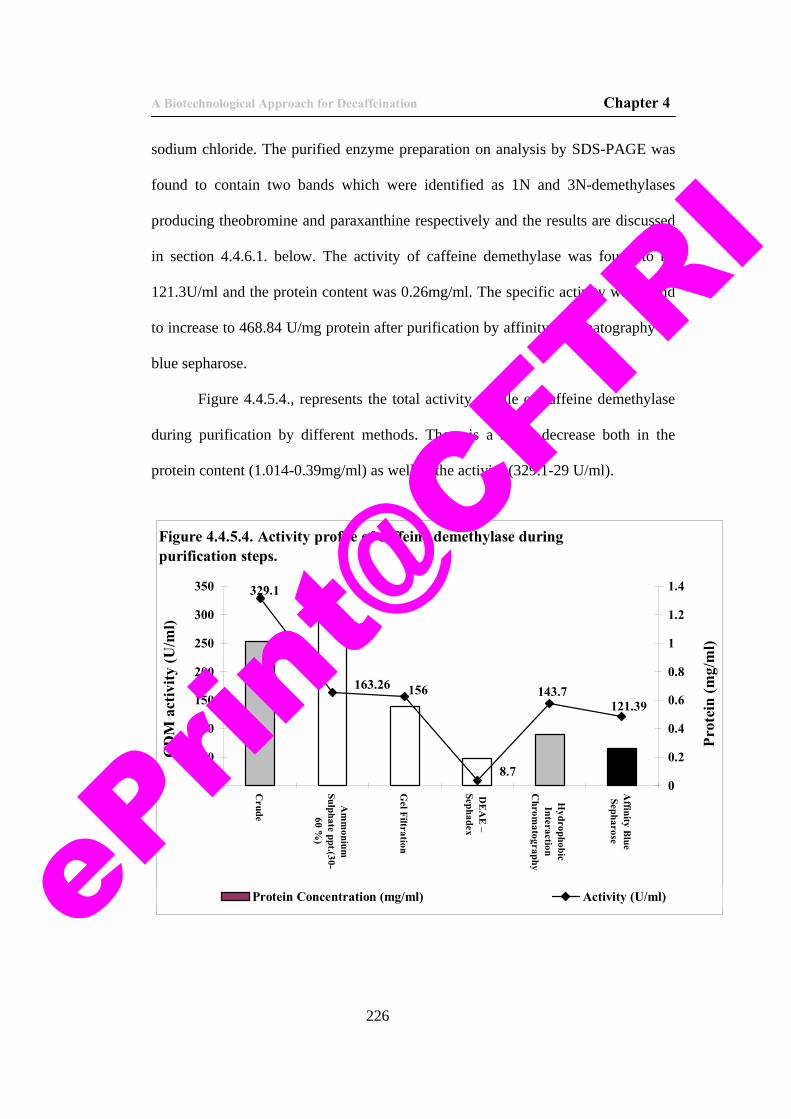
A Biotechnological Approach for Decaffeination Chapter 4
226
sodium chloride. The purified enzyme preparation on analysis by SDS-PAGE was
found to contain two bands which were identified as 1N and 3N-demethylases
producing theobromine and paraxanthine respectively and the results are discussed
in section 4.4.6.1. below. The activity of caffeine demethylase was found to be
121.3U/ml and the protein content was 0.26mg/ml. The specific activity was found
to increase to 468.84 U/mg protein after purification by affinity chromatography on
blue sepharose.
Figure 4.4.5.4., represents the total activity profile of caffeine demethylase
during purification by different methods. There is a noted decrease both in the
protein content (1.014-0.39mg/ml) as well as the activity (329.1-29 U/ml).
Figure 4.4.5.4. Activity profile of caffeine demethylase during purification steps.
121.39143.7
8.7
156
329.1
163.26
0
50
100
150
200
250
300
350
Crude
Am
monium
Sulphate ppt.(30-60 %
)
Gel Filtration
DE
AE
–Sephadex
Hydrophobic
InteractionC
hromatography
Affinity B
lueSepharose
CD
M a
ctiv
ity (U
/ml)
0
0.2
0.4
0.6
0.8
1
1.2
1.4
Prot
ein
(mg/
ml)
Protein Concentration (mg/ml) Activity (U/ml)
ePrin
t@CFT
RI
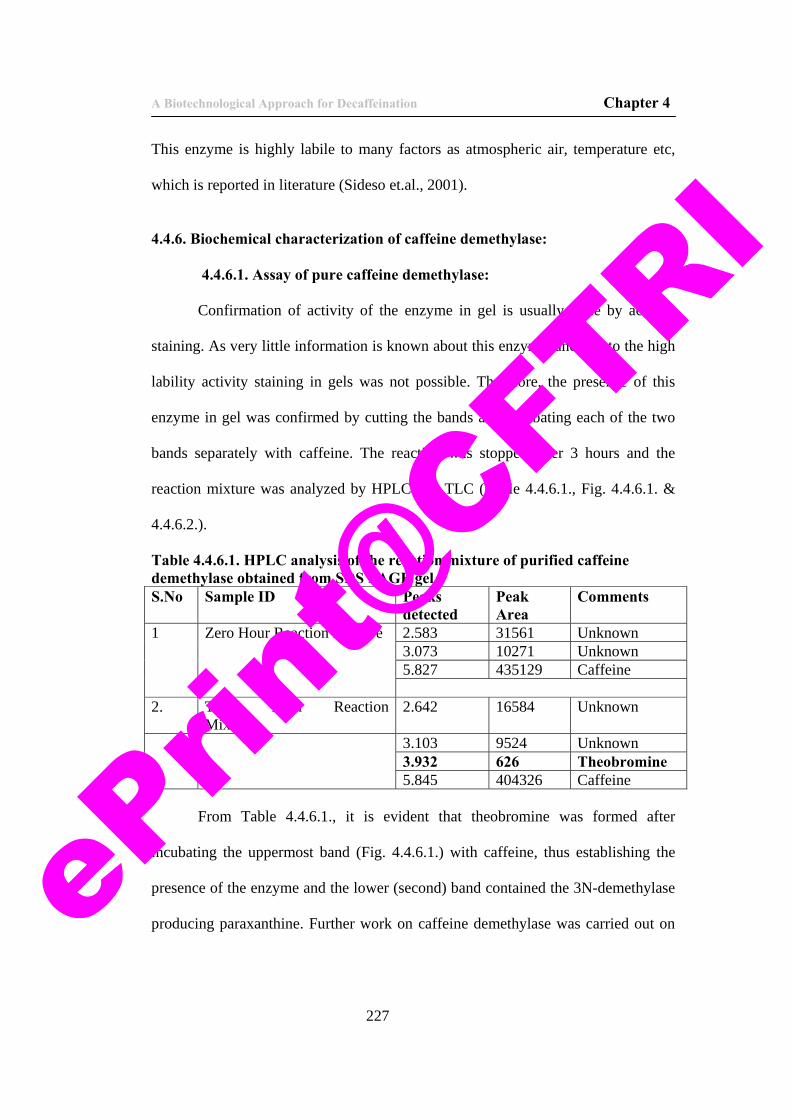
A Biotechnological Approach for Decaffeination Chapter 4
227
This enzyme is highly labile to many factors as atmospheric air, temperature etc,
which is reported in literature (Sideso et.al., 2001).
4.4.6. Biochemical characterization of caffeine demethylase:
4.4.6.1. Assay of pure caffeine demethylase:
Confirmation of activity of the enzyme in gel is usually done by activity
staining. As very little information is known about this enzyme, and due to the high
lability activity staining in gels was not possible. Therefore, the presence of this
enzyme in gel was confirmed by cutting the bands and incubating each of the two
bands separately with caffeine. The reaction was stopped after 3 hours and the
reaction mixture was analyzed by HPLC and TLC (Table 4.4.6.1., Fig. 4.4.6.1. &
4.4.6.2.).
Table 4.4.6.1. HPLC analysis of the reaction mixture of purified caffeine demethylase obtained from SDS PAGE gel. S.No Sample ID Peaks
detected Peak Area
Comments
1 Zero Hour Reaction Mixture 2.583 31561 Unknown 3.073 10271 Unknown 5.827 435129 Caffeine
2. Three Hour Reaction Mixture
2.642 16584 Unknown
3.103 9524 Unknown 3.932 626 Theobromine 5.845 404326 Caffeine
From Table 4.4.6.1., it is evident that theobromine was formed after
incubating the uppermost band (Fig. 4.4.6.1.) with caffeine, thus establishing the
presence of the enzyme and the lower (second) band contained the 3N-demethylase
producing paraxanthine. Further work on caffeine demethylase was carried out on ePrin
t@CFT
RI
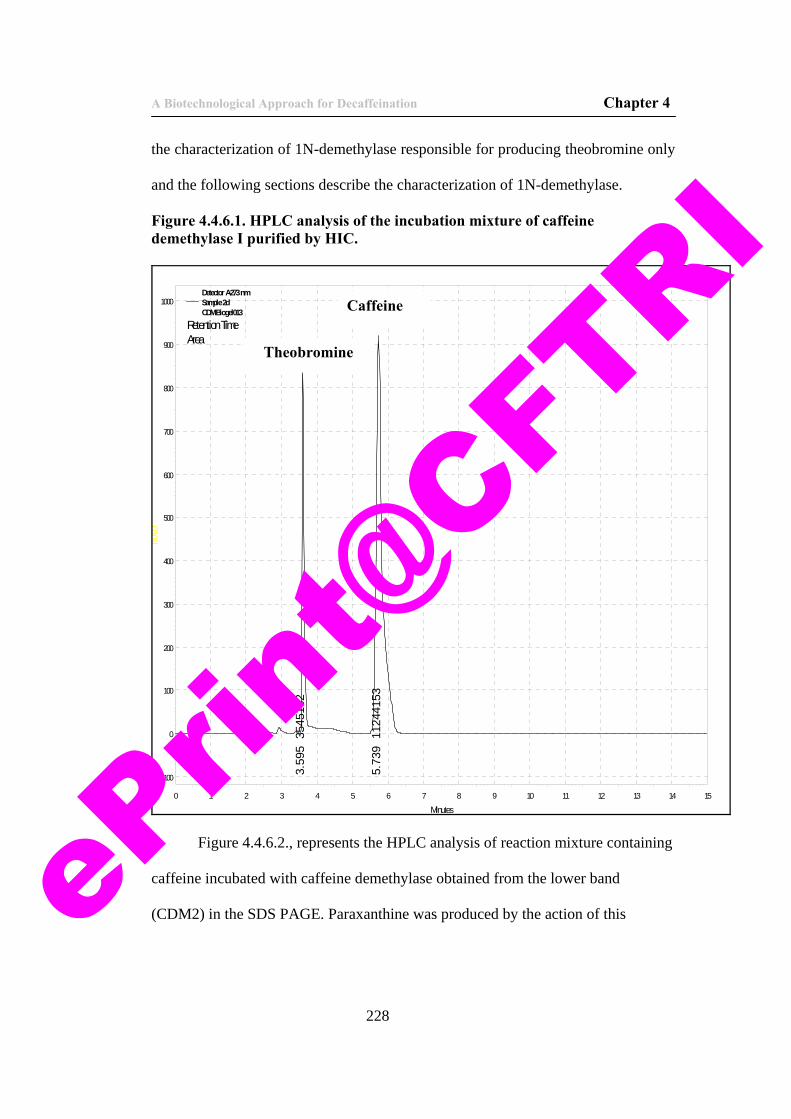
A Biotechnological Approach for Decaffeination Chapter 4
228
the characterization of 1N-demethylase responsible for producing theobromine only
and the following sections describe the characterization of 1N-demethylase.
Figure 4.4.6.1. HPLC analysis of the incubation mixture of caffeine demethylase I purified by HIC.
Minutes0 1 2 3 4 5 6 7 8 9 10 11 12 13 14 15
mA
U
-100
0
100
200
300
400
500
600
700
800
900
10003.
595
354
5162
5.73
9 1
1244
153
Detector A-273 nmSample 2dCDM Biogel013
Retention TimeArea
Figure 4.4.6.2., represents the HPLC analysis of reaction mixture containing
caffeine incubated with caffeine demethylase obtained from the lower band
(CDM2) in the SDS PAGE. Paraxanthine was produced by the action of this
Theobromine
Caffeine
ePrin
t@CFT
RI
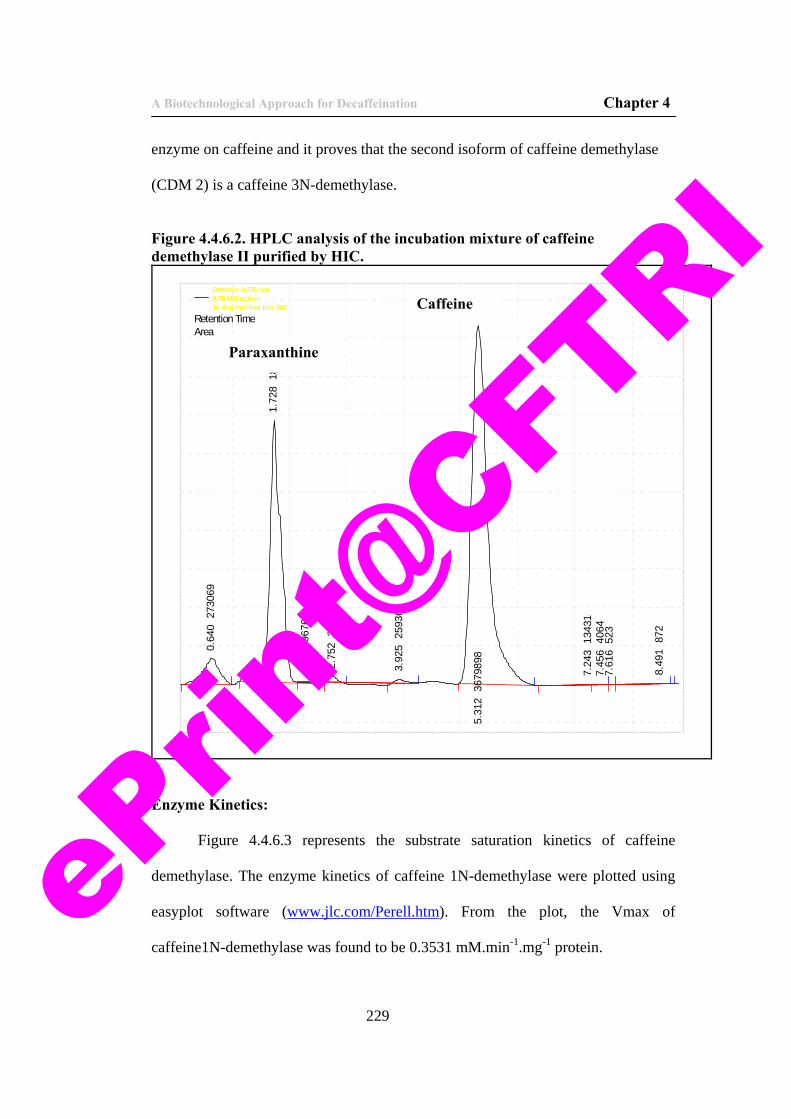
A Biotechnological Approach for Decaffeination Chapter 4
229
enzyme on caffeine and it proves that the second isoform of caffeine demethylase
(CDM 2) is a caffeine 3N-demethylase.
Figure 4.4.6.2. HPLC analysis of the incubation mixture of caffeine demethylase II purified by HIC.
Minutes
1 2 3 4 5 6 7 8
mAU
-20
0
20
40
60
80
100
120
140
160
180
200
mAU
-20
0
20
40
60
80
100
120
140
160
180
200
0.64
0 2
7306
9
1.72
8 1
8138
40
2.29
3 9
676
2.75
2 2
5829
3.92
5 2
5936
5.31
2 3
6798
98
7.24
3 1
3431
7.45
6 4
064
7.61
6 5
23
8.49
1 8
72
Detector A-276 nm0.75 M Farction 16 Aug Purified Enz 002
Retention TimeArea
Enzyme Kinetics:
Figure 4.4.6.3 represents the substrate saturation kinetics of caffeine
demethylase. The enzyme kinetics of caffeine 1N-demethylase were plotted using
easyplot software (www.jlc.com/Perell.htm). From the plot, the Vmax of
caffeine1N-demethylase was found to be 0.3531 mM.min-1.mg-1 protein.
Paraxanthine
Caffeine
ePrin
t@CFT
RI
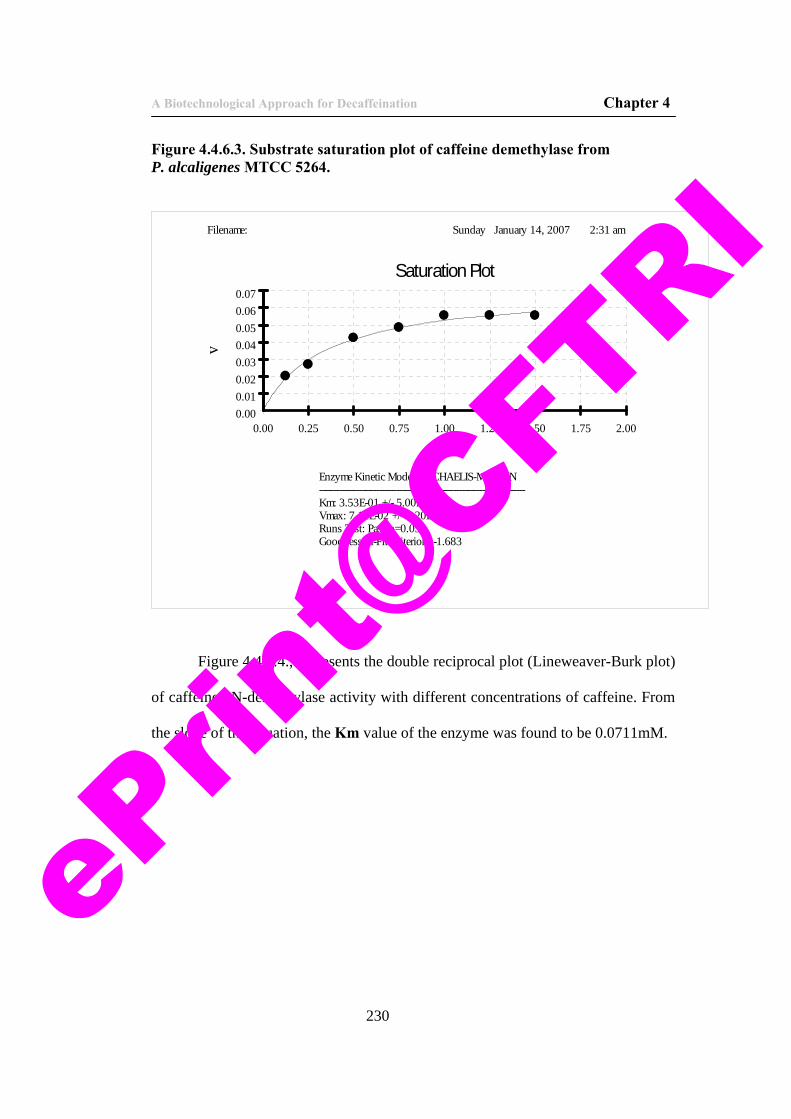
A Biotechnological Approach for Decaffeination Chapter 4
230
Figure 4.4.6.3. Substrate saturation plot of caffeine demethylase from P. alcaligenes MTCC 5264.
Sunday January 14, 2007 2:31 amFilename:
Enzyme Kinetic Model: MICHAELIS-MENTEN------------------------------------------------------------------------Km: 3.53E-01 +/- 5.00E-02Vmax: 7.11E-02 +/- 3.20E-03Runs Test: Pass p=0.05Goodness-of-Fit Criterion: -1.683
Saturation Plot
v
S
0.000.010.020.030.040.050.060.07
0.00 0.25 0.50 0.75 1.00 1.25 1.50 1.75 2.00
Figure 4.4.6.4., represents the double reciprocal plot (Lineweaver-Burk plot)
of caffeine 1N-demethylase activity with different concentrations of caffeine. From
the slope of the equation, the Km value of the enzyme was found to be 0.0711mM.
eP
rint@
CFTRI
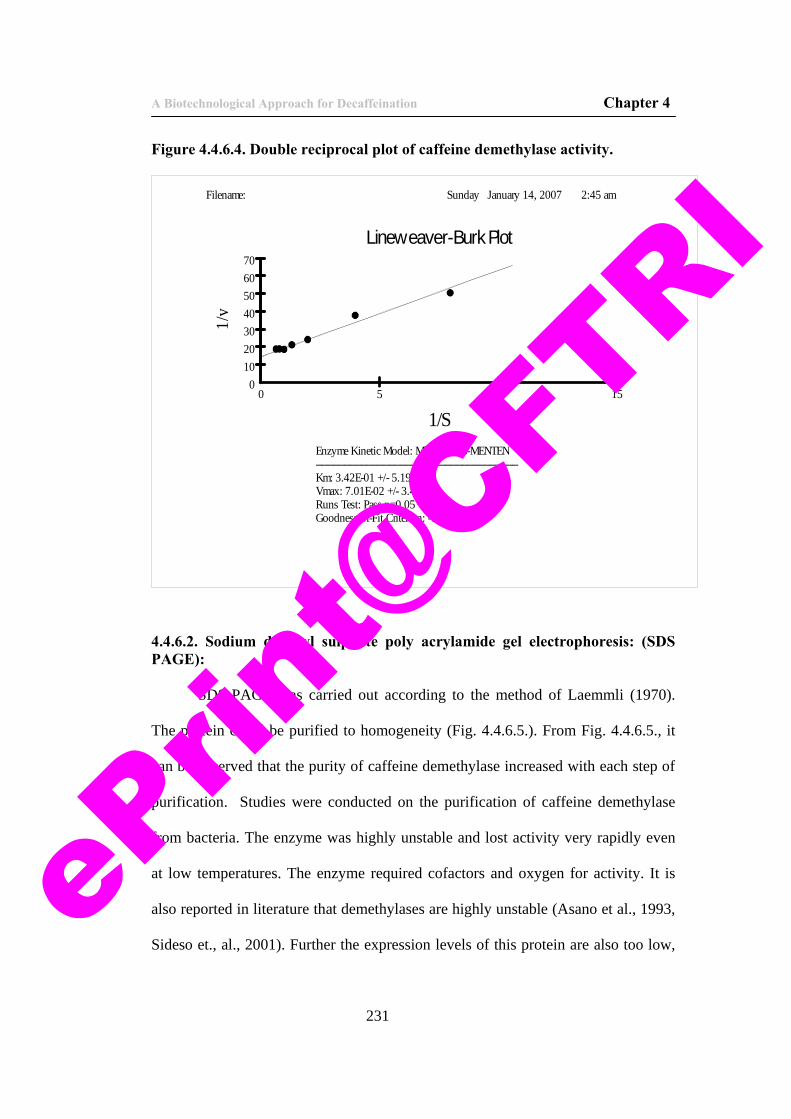
A Biotechnological Approach for Decaffeination Chapter 4
231
Figure 4.4.6.4. Double reciprocal plot of caffeine demethylase activity.
Sunday January 14, 2007 2:45 amFilename:
Enzyme Kinetic Model: MICHAELIS-MENTEN------------------------------------------------------------------------Km: 3.42E-01 +/- 5.19E-02Vmax: 7.01E-02 +/- 3.40E-03Runs Test: Pass p=0.05Goodness-of-Fit Criterion: -1.529
Lineweaver-Burk Plot1/
v
1/S
010203040506070
0 5 10 15
4.4.6.2. Sodium dodecyl sulphate poly acrylamide gel electrophoresis: (SDS PAGE):
SDS-PAGE was carried out according to the method of Laemmli (1970).
The protein could be purified to homogeneity (Fig. 4.4.6.5.). From Fig. 4.4.6.5., it
can be observed that the purity of caffeine demethylase increased with each step of
purification. Studies were conducted on the purification of caffeine demethylase
from bacteria. The enzyme was highly unstable and lost activity very rapidly even
at low temperatures. The enzyme required cofactors and oxygen for activity. It is
also reported in literature that demethylases are highly unstable (Asano et al., 1993,
Sideso et., al., 2001). Further the expression levels of this protein are also too low, eP
rint@
CFTRI
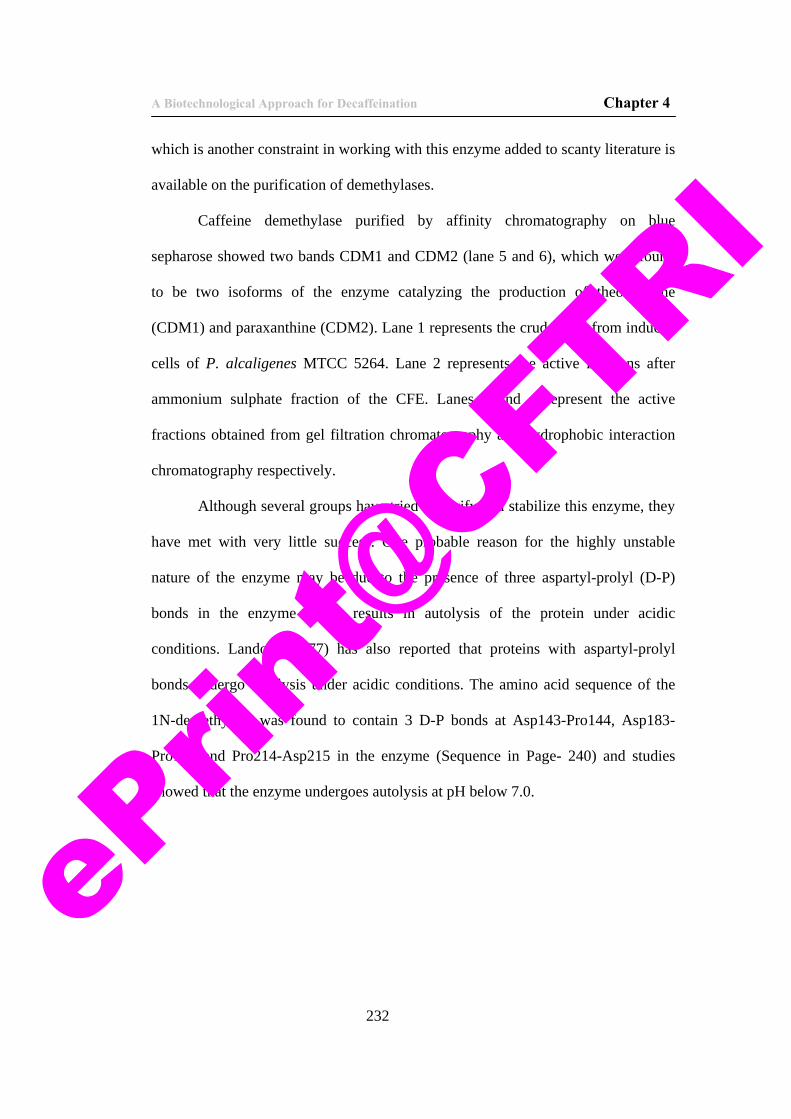
A Biotechnological Approach for Decaffeination Chapter 4
232
which is another constraint in working with this enzyme added to scanty literature is
available on the purification of demethylases.
Caffeine demethylase purified by affinity chromatography on blue
sepharose showed two bands CDM1 and CDM2 (lane 5 and 6), which were found
to be two isoforms of the enzyme catalyzing the production of theobromine
(CDM1) and paraxanthine (CDM2). Lane 1 represents the crude CFE from induced
cells of P. alcaligenes MTCC 5264. Lane 2 represents the active fractions after
ammonium sulphate fraction of the CFE. Lanes 3 and 4 represent the active
fractions obtained from gel filtration chromatography and hydrophobic interaction
chromatography respectively.
Although several groups have tried to purify and stabilize this enzyme, they
have met with very little success. One probable reason for the highly unstable
nature of the enzyme may be due to the presence of three aspartyl-prolyl (D-P)
bonds in the enzyme which results in autolysis of the protein under acidic
conditions. Landon, (1977) has also reported that proteins with aspartyl-prolyl
bonds undergo autolysis under acidic conditions. The amino acid sequence of the
1N-demethylase was found to contain 3 D-P bonds at Asp143-Pro144, Asp183-
Pro184 and Pro214-Asp215 in the enzyme (Sequence in Page- 240) and studies
showed that the enzyme undergoes autolysis at pH below 7.0.
ePrin
t@CFT
RI
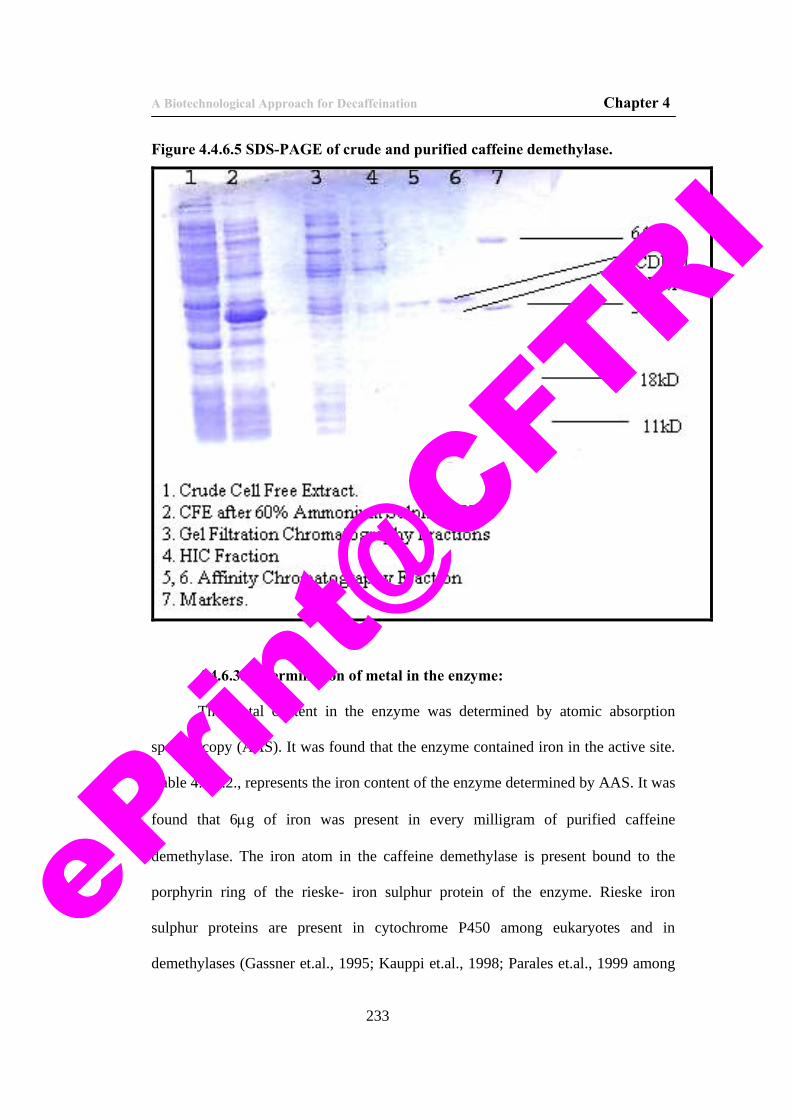
A Biotechnological Approach for Decaffeination Chapter 4
233
Figure 4.4.6.5 SDS-PAGE of crude and purified caffeine demethylase.
4.4.6.3. Determination of metal in the enzyme:
The metal content in the enzyme was determined by atomic absorption
spectroscopy (AAS). It was found that the enzyme contained iron in the active site.
Table 4.4.6.2., represents the iron content of the enzyme determined by AAS. It was
found that 6μg of iron was present in every milligram of purified caffeine
demethylase. The iron atom in the caffeine demethylase is present bound to the
porphyrin ring of the rieske- iron sulphur protein of the enzyme. Rieske iron
sulphur proteins are present in cytochrome P450 among eukaryotes and in
demethylases (Gassner et.al., 1995; Kauppi et.al., 1998; Parales et.al., 1999 among
ePrin
t@CFT
RI
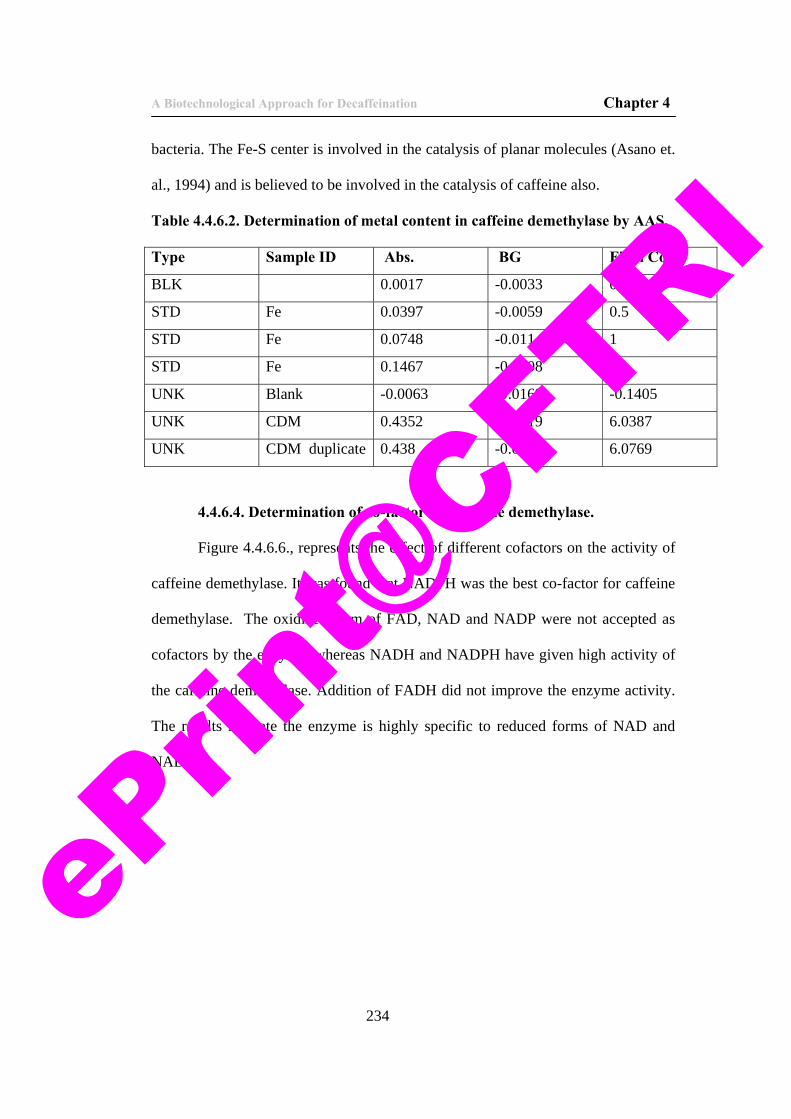
A Biotechnological Approach for Decaffeination Chapter 4
234
bacteria. The Fe-S center is involved in the catalysis of planar molecules (Asano et.
al., 1994) and is believed to be involved in the catalysis of caffeine also.
Table 4.4.6.2. Determination of metal content in caffeine demethylase by AAS.
Type Sample ID Abs. BG Final Conc.
BLK 0.0017 -0.0033 0
STD Fe 0.0397 -0.0059 0.5
STD Fe 0.0748 -0.0114 1
STD Fe 0.1467 -0.0108 2
UNK Blank -0.0063 -0.0169 -0.1405
UNK CDM 0.4352 -0.0219 6.0387
UNK CDM duplicate 0.438 -0.0226 6.0769
4.4.6.4. Determination of co-factor for caffeine demethylase.
Figure 4.4.6.6., represents the effect of different cofactors on the activity of
caffeine demethylase. It was found that NADPH was the best co-factor for caffeine
demethylase. The oxidized form of FAD, NAD and NADP were not accepted as
cofactors by the enzyme, whereas NADH and NADPH have given high activity of
the caffeine demethylase. Addition of FADH did not improve the enzyme activity.
The results indicate the enzyme is highly specific to reduced forms of NAD and
NADP.
ePrin
t@CFT
RI
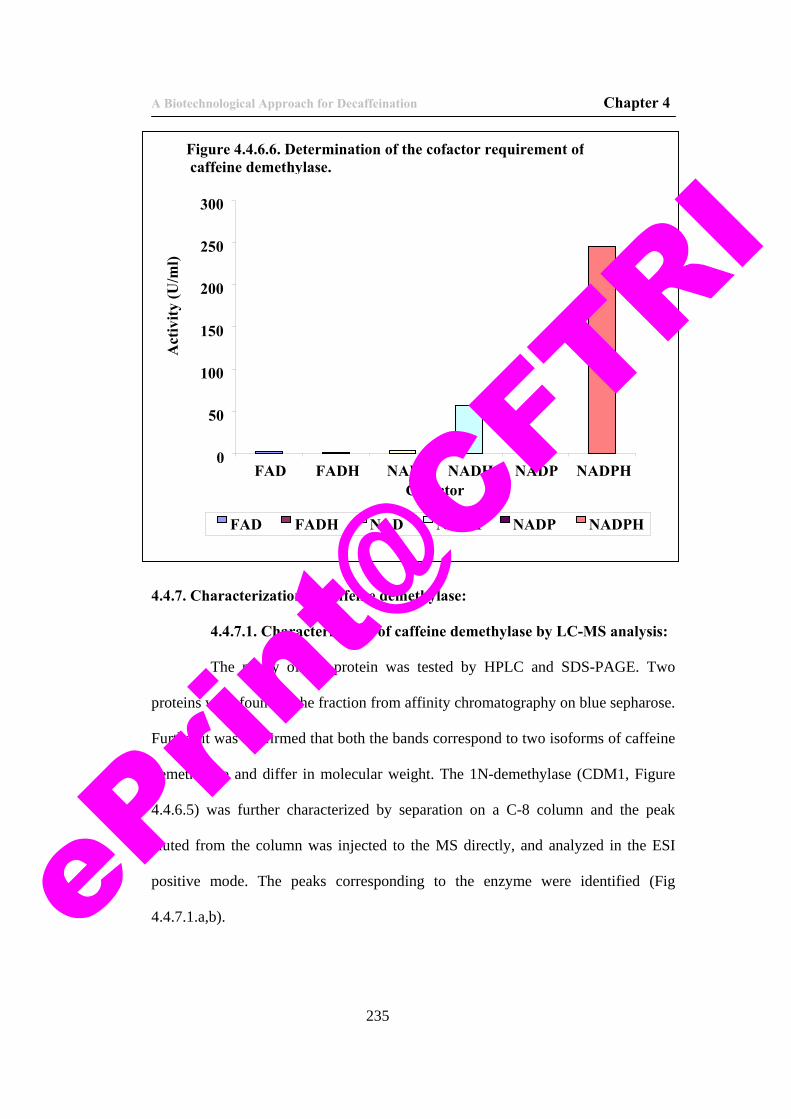
A Biotechnological Approach for Decaffeination Chapter 4
235
4.4.7. Characterization of caffeine demethylase:
4.4.7.1. Characterization of caffeine demethylase by LC-MS analysis:
The purity of the protein was tested by HPLC and SDS-PAGE. Two
proteins were found in the fraction from affinity chromatography on blue sepharose.
Further it was confirmed that both the bands correspond to two isoforms of caffeine
demethylase and differ in molecular weight. The 1N-demethylase (CDM1, Figure
4.4.6.5) was further characterized by separation on a C-8 column and the peak
eluted from the column was injected to the MS directly, and analyzed in the ESI
positive mode. The peaks corresponding to the enzyme were identified (Fig
4.4.7.1.a,b).
0
50
100
150
200
250
300
FAD FADH NAD NADH NADP NADPHCofactor
Act
ivity
(U/m
l)
FAD FADH NAD NADH NADP NADPH
Figure 4.4.6.6. Determination of the cofactor requirement of caffeine demethylase.
ePrin
t@CFT
RI
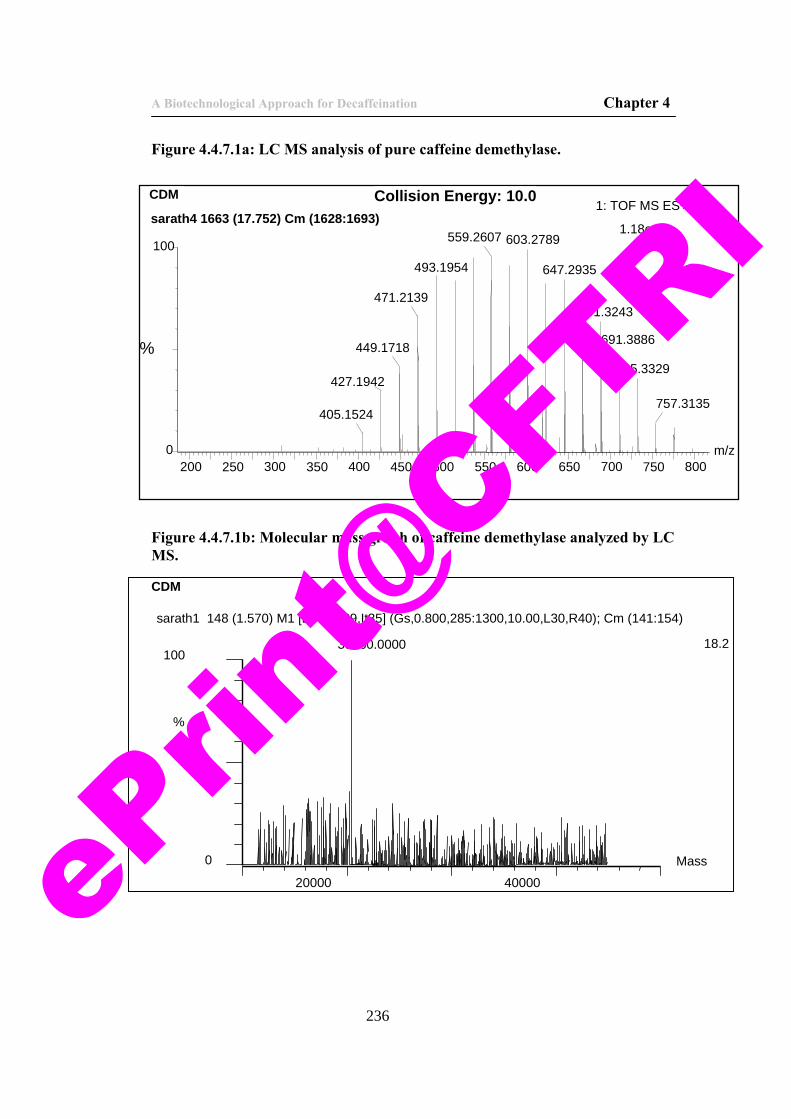
A Biotechnological Approach for Decaffeination Chapter 4
236
Figure 4.4.7.1a: LC MS analysis of pure caffeine demethylase.
Figure 4.4.7.1b: Molecular mass graph of caffeine demethylase analyzed by LC MS.
CDM
Mass
20000 40000
%
0
100
sarath1 148 (1.570) M1 [Ev-12389,It35] (Gs,0.800,285:1300,10.00,L30,R40); Cm (141:154)
18.2 39560.0000
Collision Energy: 10.0CDM
m/z200 250 300 350 400 450 500 550 600 650 700 750 800
%
0
100
sarath4 1663 (17.752) Cm (1628:1693)1: TOF MS ES+
1.18e-3603.2789559.2607
493.1954
471.2139
449.1718
427.1942
405.1524
647.2935
691.3243
691.3886
735.3329
757.3135
ePrin
t@CFT
RI
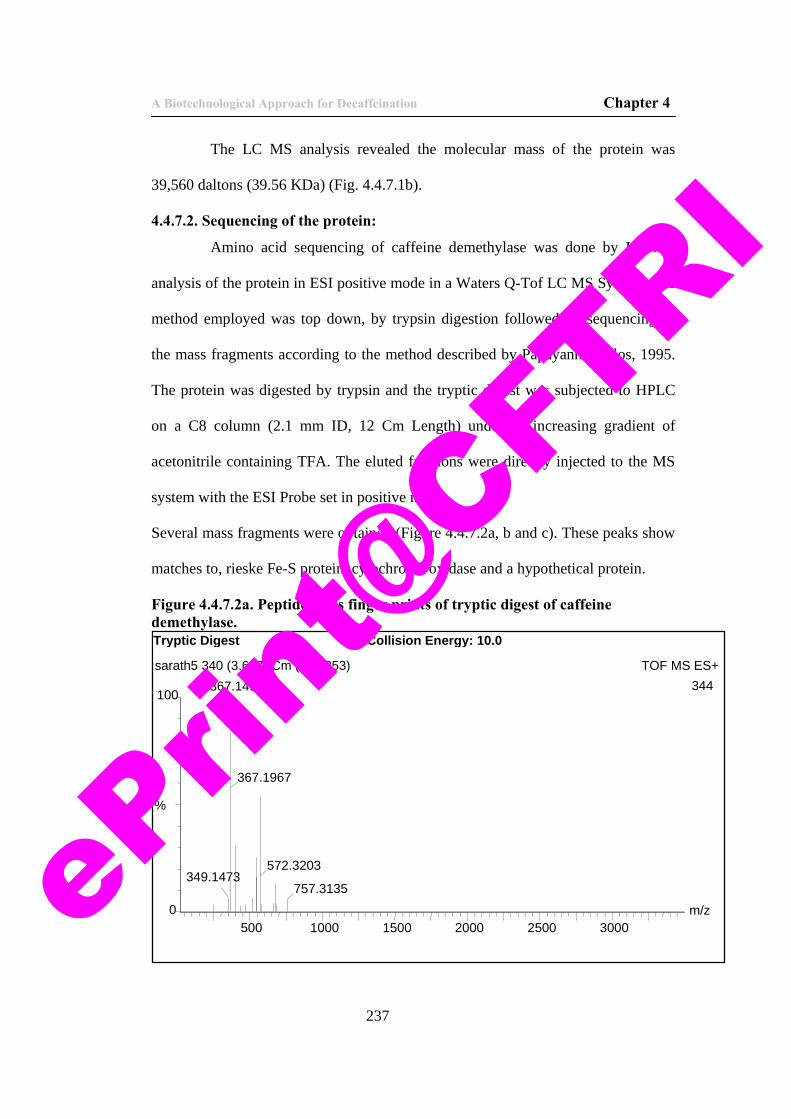
A Biotechnological Approach for Decaffeination Chapter 4
237
The LC MS analysis revealed the molecular mass of the protein was
39,560 daltons (39.56 KDa) (Fig. 4.4.7.1b).
4.4.7.2. Sequencing of the protein:
Amino acid sequencing of caffeine demethylase was done by LC MS
analysis of the protein in ESI positive mode in a Waters Q-Tof LC MS System. The
method employed was top down, by trypsin digestion followed by sequencing of
the mass fragments according to the method described by Papayannopoulos, 1995.
The protein was digested by trypsin and the tryptic digest was subjected to HPLC
on a C8 column (2.1 mm ID, 12 Cm Length) under an increasing gradient of
acetonitrile containing TFA. The eluted fractions were directly injected to the MS
system with the ESI Probe set in positive mode.
Several mass fragments were obtained (Figure 4.4.7.2a, b and c). These peaks show
matches to, rieske Fe-S protein, cytochrome oxidase and a hypothetical protein.
Figure 4.4.7.2a. Peptide mass finger prints of tryptic digest of caffeine demethylase.
Collision Energy: 10.0Tryptic Digest
m/z500 1000 1500 2000 2500 3000
%
0
100
sarath5 340 (3.607) Cm (324:353) TOF MS ES+ 344367.1498
349.1473
367.1967
572.3203
757.3135ePrin
t@CFT
RI
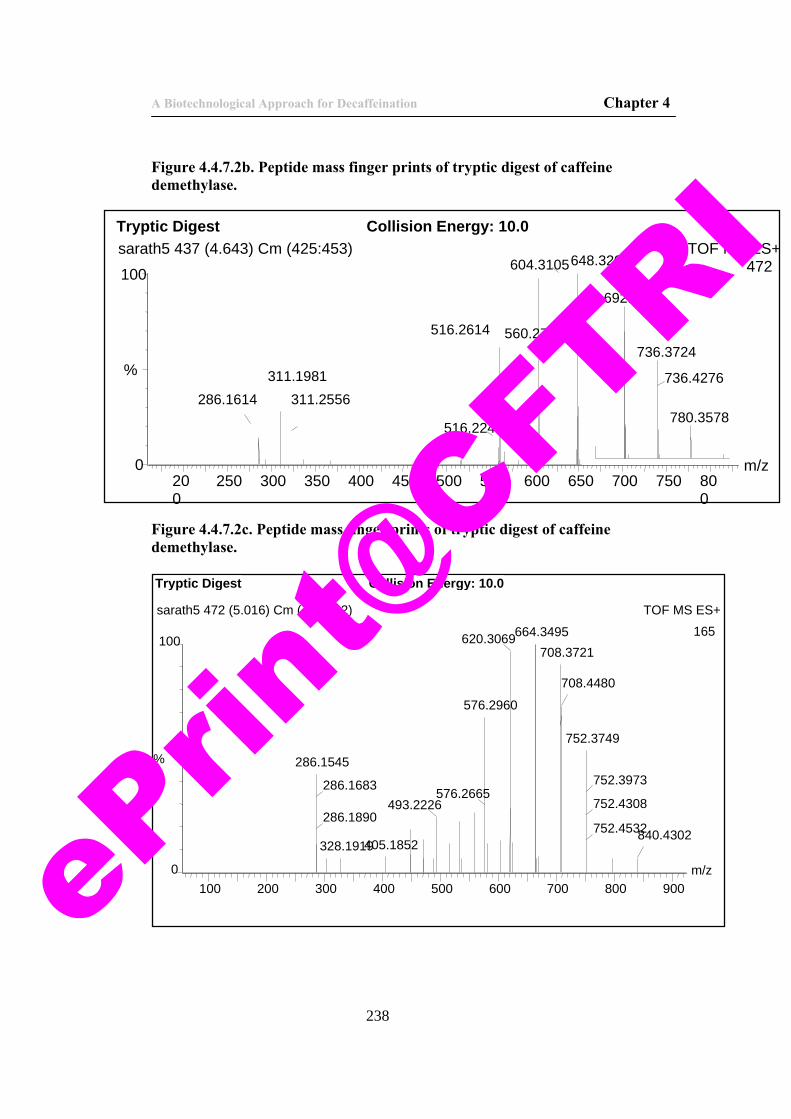
A Biotechnological Approach for Decaffeination Chapter 4
238
Figure 4.4.7.2b. Peptide mass finger prints of tryptic digest of caffeine demethylase.
Figure 4.4.7.2c. Peptide mass finger prints of tryptic digest of caffeine demethylase.
Collision Energy: 10.0Tryptic Digest
m/z100 200 300 400 500 600 700 800 900
%
0
100
sarath5 472 (5.016) Cm (462:482) TOF MS ES+ 165664.3495620.3069
576.2960
286.1545
286.1683 576.2665493.2226
286.1890
405.1852328.1919
708.3721
708.4480
752.3749
752.3973
752.4308
752.4532840.4302
648.3206604.3105
560.2733
311.1981286.1614
516.2614
516.2242
311.2556
692.3322
736.3724
736.4276
780.3578
Collision Energy: 10.0Tryptic Digest
m/z200
250 300 350 400 450 500 550 600 650 700 750 800
%
0
100
sarath5 437 (4.643) Cm (425:453) TOF MS ES+472
ePrin
t@CFT
RI
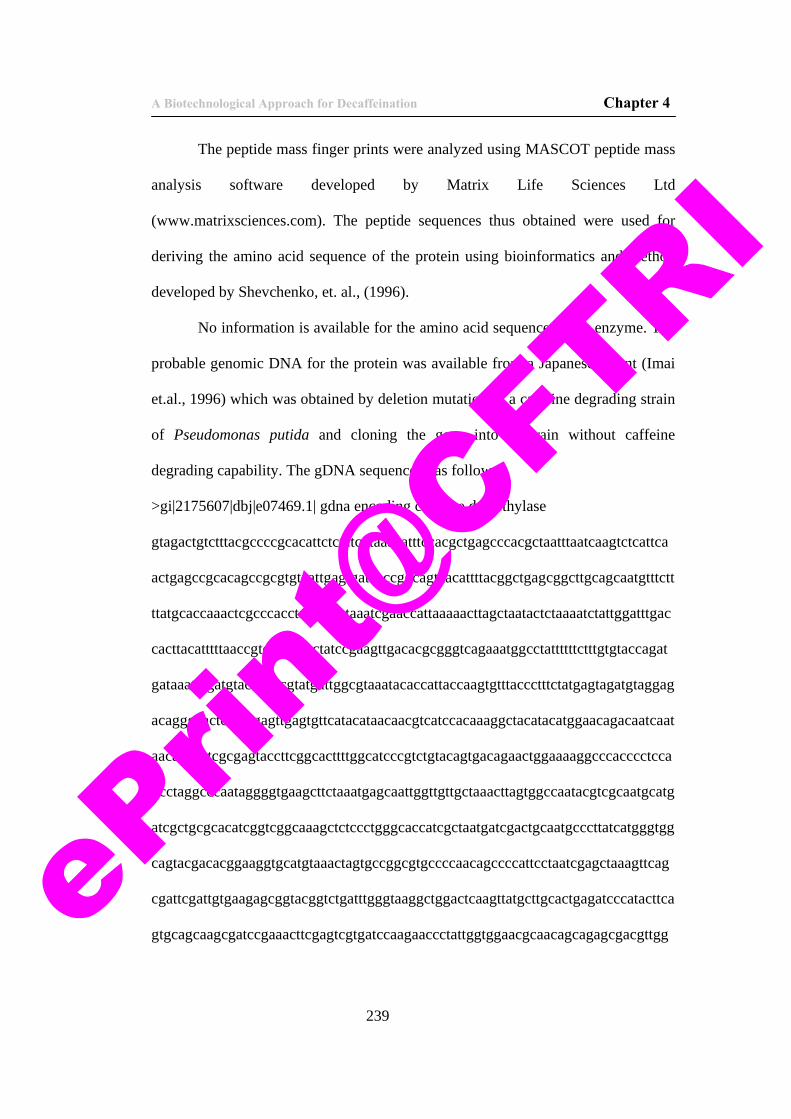
A Biotechnological Approach for Decaffeination Chapter 4
239
The peptide mass finger prints were analyzed using MASCOT peptide mass
analysis software developed by Matrix Life Sciences Ltd
(www.matrixsciences.com). The peptide sequences thus obtained were used for
deriving the amino acid sequence of the protein using bioinformatics and method
developed by Shevchenko, et. al., (1996).
No information is available for the amino acid sequence of the enzyme. The
probable genomic DNA for the protein was available from a Japanese patent (Imai
et.al., 1996) which was obtained by deletion mutation of a caffeine degrading strain
of Pseudomonas putida and cloning the gene into a strain without caffeine
degrading capability. The gDNA sequence is as follows:
>gi|2175607|dbj|e07469.1| gdna encoding caffeine demethylase
gtagactgtctttacgccccgcacattctctatcgtaaaaatttccacgctgagcccacgctaatttaatcaagtctcattca
actgagccgcacagccgcgtgtcattgagtgatcaccggcagtaacattttacggctgagcggcttgcagcaatgtttctt
ttatgcaccaaactcgcccacctaatgcactaaatcgaaccattaaaaacttagctaatactctaaaatctattggatttgac
cacttacatttttaaccgtccagagcctatccgaagttgacacgcgggtcagaaatggcctattttttctttgtgtaccagat
gataaatctgatgtaccagccgtatgattggcgtaaatacaccattaccaagtgtttaccctttctatgagtagatgtaggag
acagggcactcagctgagttgagtgttcatacataacaacgtcatccacaaaggctacatacatggaacagacaatcaat
aacaacgatcgcgagtaccttcggcacttttggcatcccgtctgtacagtgacagaactggaaaaggcccacccctcca
gcctaggcccaataggggtgaagcttctaaatgagcaattggttgttgctaaacttagtggccaatacgtcgcaatgcatg
atcgctgcgcacatcggtcggcaaagctctccctgggcaccatcgctaatgatcgactgcaatgcccttatcatgggtgg
cagtacgacacggaaggtgcatgtaaactagtgccggcgtgccccaacagccccattcctaatcgagctaaagttcag
cgattcgattgtgaagagcggtacggtctgatttgggtaaggctggactcaagttatgcttgcactgagatcccatacttca
gtgcagcaagcgatccgaaacttcgagtcgtgatccaagaaccctattggtggaacgcaacagcagagcgacgttggePrin
t@CFT
RI
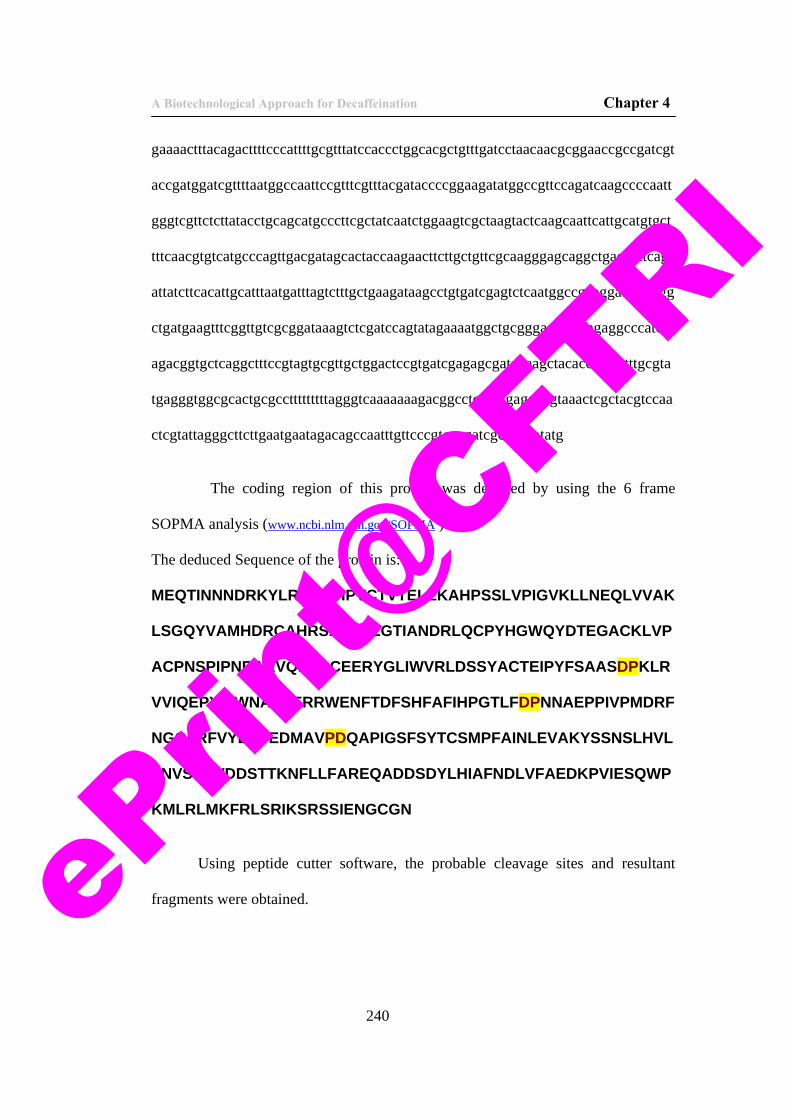
A Biotechnological Approach for Decaffeination Chapter 4
240
gaaaactttacagacttttcccattttgcgtttatccaccctggcacgctgtttgatcctaacaacgcggaaccgccgatcgt
accgatggatcgttttaatggccaattccgtttcgtttacgataccccggaagatatggccgttccagatcaagccccaatt
gggtcgttctcttatacctgcagcatgcccttcgctatcaatctggaagtcgctaagtactcaagcaattcattgcatgtgct
tttcaacgtgtcatgcccagttgacgatagcactaccaagaacttcttgctgttcgcaagggagcaggctgacgattcag
attatcttcacattgcatttaatgatttagtctttgctgaagataagcctgtgatcgagtctcaatggccgaaggatgctccgg
ctgatgaagtttcggttgtcgcggataaagtctcgatccagtatagaaaatggctgcgggaactgaaagaggcccatca
agacggtgctcaggctttccgtagtgcgttgctggactccgtgatcgagagcgatcgaagctacacctaacatttgcgta
tgagggtggcgcactgcgcctttttttttagggtcaaaaaaagacggcctcctaggaggccgtaaactcgctacgtccaa
ctcgtattagggcttcttgaatgaatagacagccaatttgttcccgtcgagatcgcgcacatatg
The coding region of this protein was deduced by using the 6 frame
SOPMA analysis (www.ncbi.nlm.nih.gov/SOPMA ).
The deduced Sequence of the protein is:
MEQTINNNDRKYLRHFWHPVCTVTELEKAHPSSLVPIGVKLLNEQLVVAK
LSGQYVAMHDRCAHRSAKLSLGTIANDRLQCPYHGWQYDTEGACKLVP
ACPNSPIPNRAKVQRFDCEERYGLIWVRLDSSYACTEIPYFSAASDPKLR
VVIQEPYWWNATAERRWENFTDFSHFAFIHPGTLFDPNNAEPPIVPMDRF
NGQFRFVYDTPEDMAVPDQAPIGSFSYTCSMPFAINLEVAKYSSNSLHVL
FNVSCPVDDSTTKNFLLFAREQADDSDYLHIAFNDLVFAEDKPVIESQWP
KMLRLMKFRLSRIKSRSSIENGCGN
Using peptide cutter software, the probable cleavage sites and resultant
fragments were obtained. ePrin
t@CFT
RI
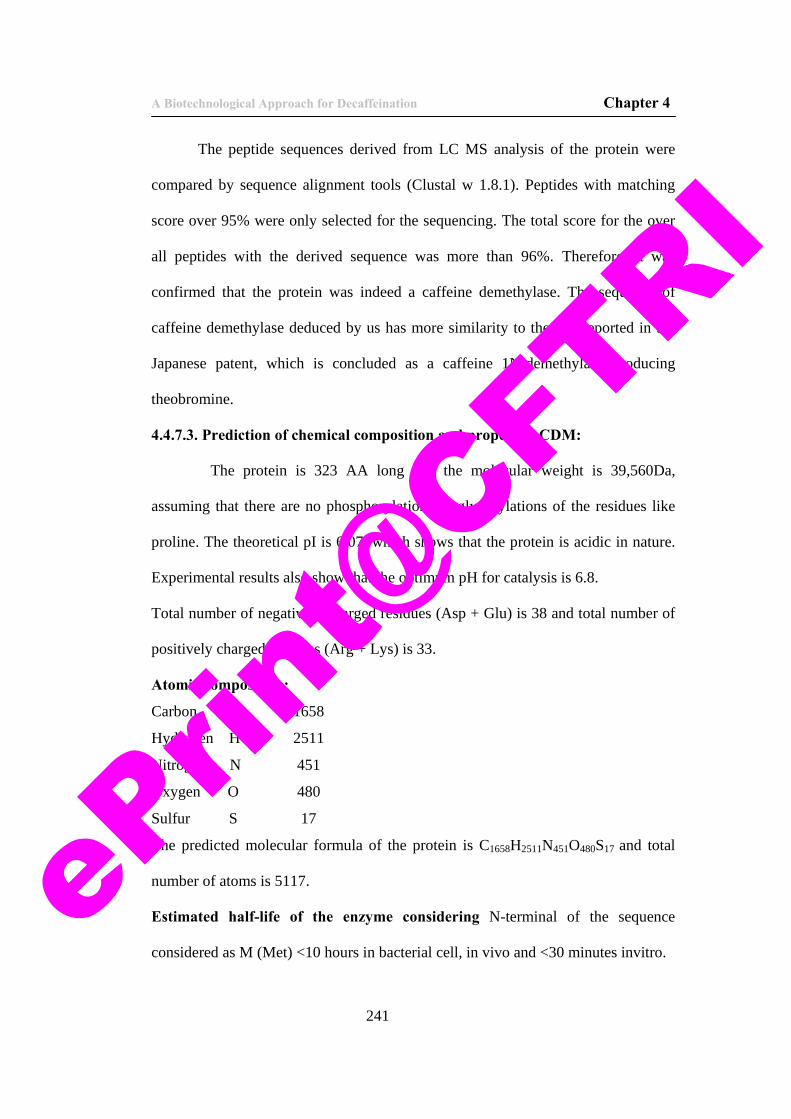
A Biotechnological Approach for Decaffeination Chapter 4
241
The peptide sequences derived from LC MS analysis of the protein were
compared by sequence alignment tools (Clustal w 1.8.1). Peptides with matching
score over 95% were only selected for the sequencing. The total score for the over
all peptides with the derived sequence was more than 96%. Therefore, it was
confirmed that the protein was indeed a caffeine demethylase. The sequence of
caffeine demethylase deduced by us has more similarity to the one reported in the
Japanese patent, which is concluded as a caffeine 1N-demethylase producing
theobromine.
4.4.7.3. Prediction of chemical composition and properties CDM:
The protein is 323 AA long and the molecular weight is 39,560Da,
assuming that there are no phosphorylations or glycosylations of the residues like
proline. The theoretical pI is 6.07, which shows that the protein is acidic in nature.
Experimental results also show that the optimum pH for catalysis is 6.8.
Total number of negatively charged residues (Asp + Glu) is 38 and total number of
positively charged residues (Arg + Lys) is 33.
Atomic composition:
Carbon C 1658
Hydrogen H 2511
Nitrogen N 451
Oxygen O 480
Sulfur S 17
The predicted molecular formula of the protein is C1658H2511N451O480S17 and total
number of atoms is 5117.
Estimated half-life of the enzyme considering N-terminal of the sequence
considered as M (Met) <10 hours in bacterial cell, in vivo and <30 minutes invitro. eP
rint@
CFTRI
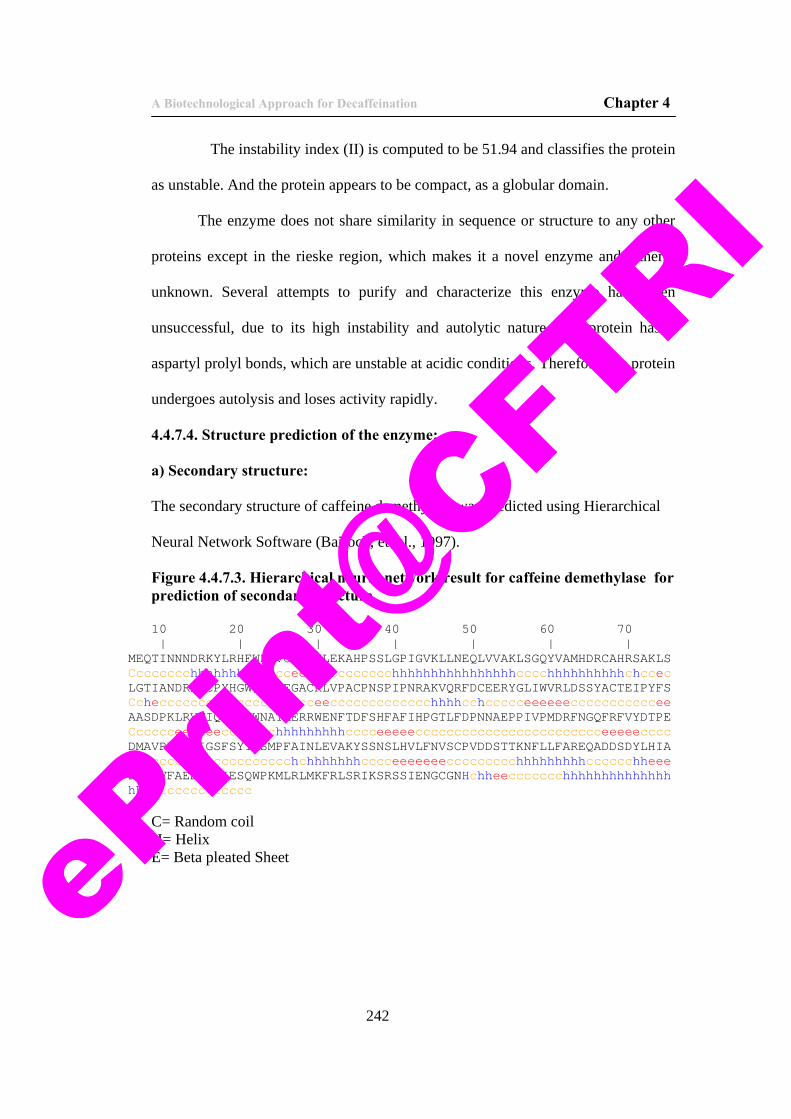
A Biotechnological Approach for Decaffeination Chapter 4
242
The instability index (II) is computed to be 51.94 and classifies the protein
as unstable. And the protein appears to be compact, as a globular domain.
The enzyme does not share similarity in sequence or structure to any other
proteins except in the rieske region, which makes it a novel enzyme and hitherto
unknown. Several attempts to purify and characterize this enzyme have been
unsuccessful, due to its high instability and autolytic nature. The protein has 3
aspartyl prolyl bonds, which are unstable at acidic conditions. Therefore, the protein
undergoes autolysis and loses activity rapidly.
4.4.7.4. Structure prediction of the enzyme:
a) Secondary structure:
The secondary structure of caffeine demethylase was predicted using Hierarchical
Neural Network Software (Bairoch, et. al., 1997).
Figure 4.4.7.3. Hierarchical neural network result for caffeine demethylase for prediction of secondary structure. 10 20 30 40 50 60 70 | | | | | | |
MEQTINNNDRKYLRHFWHPVCTVTELEKAHPSSLGPIGVKLLNEQLVVAKLSGQYVAMHDRCAHRSAKLSCccccccchhhhhhhhccccceeeeccccccccchhhhhhhhhhhhhhhhcccchhhhhhhhhhchccec LGTIANDRLQCPYHGWQYDTEGACKLVPACPNSPIPNRAKVQRFDCEERYGLIWVRLDSSYACTEIPYFSCchecccccccccccccccccccceeccccccccccccchhhhcchccccceeeeeeccccccccccceeAASDPKLRVVIQEPYWWNATAERRWENFTDFSHFAFIHPGTLFDPNNAEPPIVPMDRFNGQFRFVYDTPECccccceeeeeeccccccchhhhhhhhhcccceeeeecccccccccccccccccccccccceeeeeccccDMAVPDQAPIGSFSYTCSMPFAINLEVAKYSSNSLHVLFNVSCPVDDSTTKNFLLFAREQADDSDYLHIACcccccccccccccccccccchchhhhhhhcccceeeeeeeccccccccchhhhhhhhhcccccchheeeFNDLVFAEDKPVIESQWPKMLRLMKFRLSRIKSRSSIENGCGNHchheeccccccchhhhhhhhhhhhhhhhhecccccccccccc
C= Random coil H= Helix E= Beta pleated Sheet ePrin
t@CFT
RI
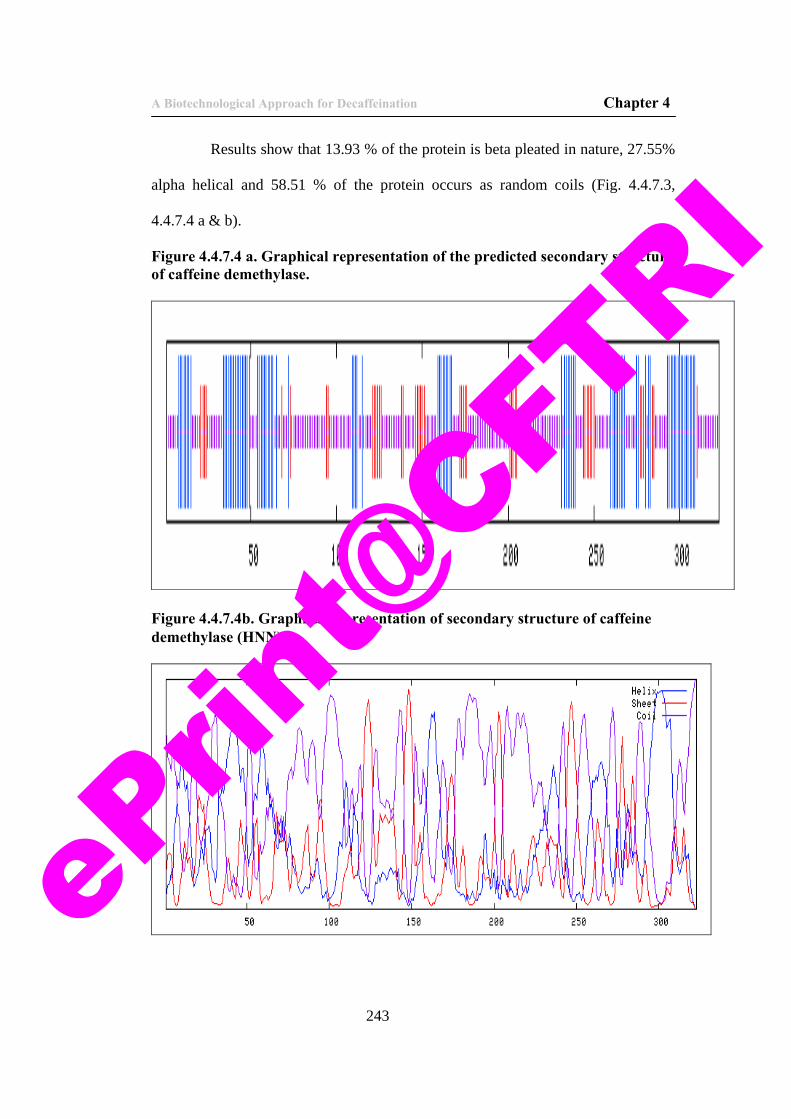
A Biotechnological Approach for Decaffeination Chapter 4
243
Results show that 13.93 % of the protein is beta pleated in nature, 27.55%
alpha helical and 58.51 % of the protein occurs as random coils (Fig. 4.4.7.3,
4.4.7.4 a & b).
Figure 4.4.7.4 a. Graphical representation of the predicted secondary structure of caffeine demethylase.
Figure 4.4.7.4b. Graphical representation of secondary structure of caffeine demethylase (HNN).
ePrin
t@CFT
RI
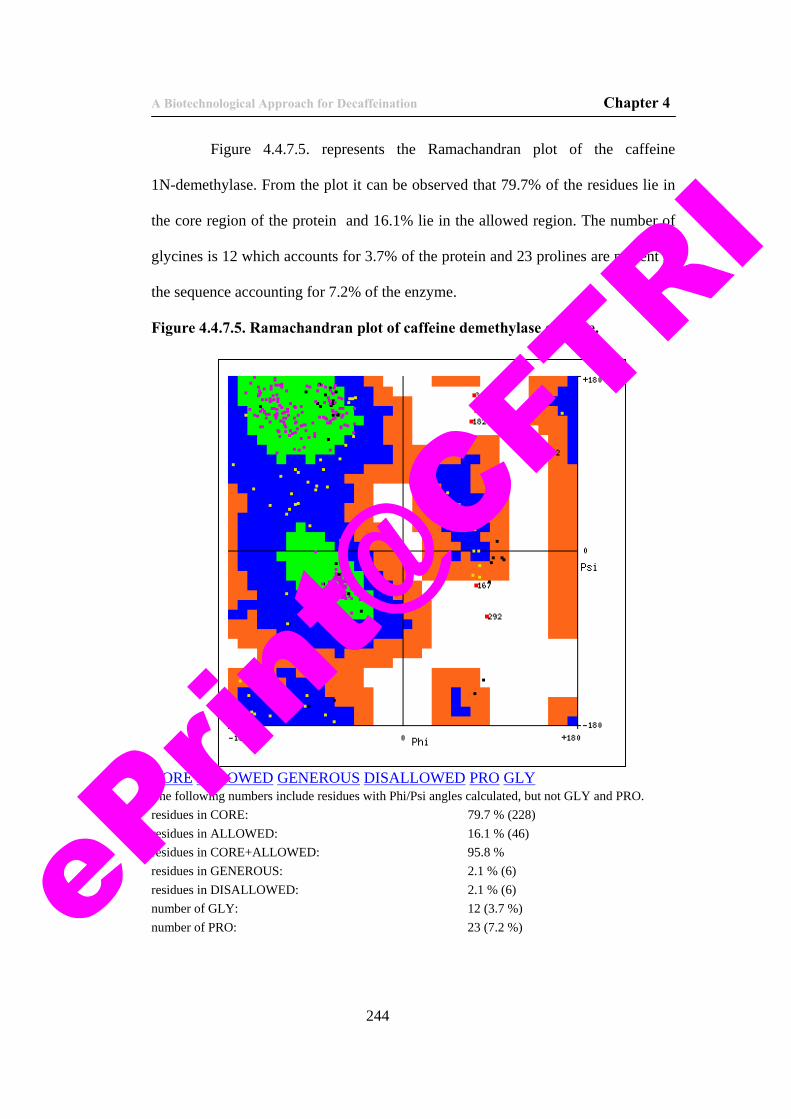
A Biotechnological Approach for Decaffeination Chapter 4
244
Figure 4.4.7.5. represents the Ramachandran plot of the caffeine
1N-demethylase. From the plot it can be observed that 79.7% of the residues lie in
the core region of the protein and 16.1% lie in the allowed region. The number of
glycines is 12 which accounts for 3.7% of the protein and 23 prolines are present in
the sequence accounting for 7.2% of the enzyme.
Figure 4.4.7.5. Ramachandran plot of caffeine demethylase enzyme.
CORE ALLOWED GENEROUS DISALLOWED PRO GLY The following numbers include residues with Phi/Psi angles calculated, but not GLY and PRO. residues in CORE: 79.7 % (228) residues in ALLOWED: 16.1 % (46) residues in CORE+ALLOWED: 95.8 % residues in GENEROUS: 2.1 % (6) residues in DISALLOWED: 2.1 % (6) number of GLY: 12 (3.7 %) number of PRO: 23 (7.2 %)
ePrin
t@CFT
RI
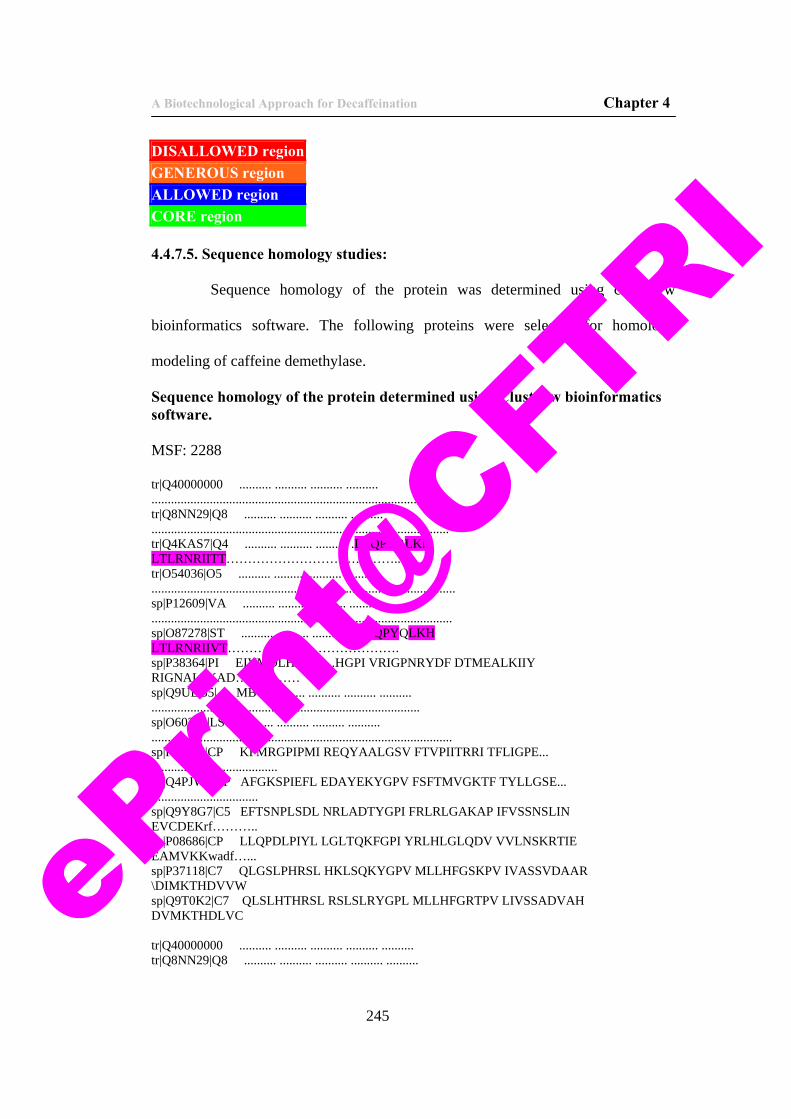
A Biotechnological Approach for Decaffeination Chapter 4
245
DISALLOWED region GENEROUS region ALLOWED region CORE region 4.4.7.5. Sequence homology studies: Sequence homology of the protein was determined using clustal w
bioinformatics software. The following proteins were selected for homology
modeling of caffeine demethylase.
Sequence homology of the protein determined using Clustal w bioinformatics software. MSF: 2288 tr|Q40000000 .......... .......... .......... .......... ............................................................................................. tr|Q8NN29|Q8 .......... .......... .......... .......... ............................................................................................ tr|Q4KAS7|Q4 .......... .......... .......... .LLQPYRLKH LTLRNRIITT………………………………….. tr|O54036|O5 .......... .......... .......... .......... .............................................................................................. sp|P12609|VA .......... .......... .......... .......... ............................................................................................. sp|O87278|ST .......... .......... .......... .LLQPYQLKH LTLRNRIIVT…………………………………. sp|P38364|PI EIVMDLHRc. ......HGPI VRIGPNRYDF DTMEALKIIY RIGNALPKAD…………… sp|Q9UBB5| MB .......... .......... .......... .......... ................................................................................... sp|O60341|LS .......... .......... .......... .......... ............................................................................................. sp|P93846|CP KFMRGPIPMI REQYAALGSV FTVPIITRRI TFLIGPE... ....................................... sp|Q4PJW3|CP AFGKSPIEFL EDAYEKYGPV FSFTMVGKTF TYLLGSE... ................................. sp|Q9Y8G7|C5 EFTSNPLSDL NRLADTYGPI FRLRLGAKAP IFVSSNSLIN EVCDEKrf……….. sp|P08686|CP LLQPDLPIYL LGLTQKFGPI YRLHLGLQDV VVLNSKRTIE EAMVKKwadf…... sp|P37118|C7 QLGSLPHRSL HKLSQKYGPV MLLHFGSKPV IVASSVDAAR \DIMKTHDVVW sp|Q9T0K2|C7 QLSLHTHRSL RSLSLRYGPL MLLHFGRTPV LIVSSADVAH DVMKTHDLVC tr|Q40000000 .......... .......... .......... .......... .......... tr|Q8NN29|Q8 .......... .......... .......... .......... ..........
ePrin
t@CFT
RI
A Biotechnological Approach for Decaffeination Chapter 4
246
tr|Q4KAS7|Q4 SHEPAYPEEG MPKKLYRAYH VERAKAGVAM TMTAGSAAI. ......SKDS tr|O54036|O5 .......... .......... .......... .......... .......... sp|P12609|VA .......... .......... .......... .......... .......... sp|O87278|ST SHEPAYPEEG MPKKLYRAYT VERARGGVAM TMTAGSAAV. ......SKDS sp|P38364|PI yyi....... .......... ..PFGlpssp nlfdvqnpar hsAMKK.QVA sp|Q9UBB5| MB .......... .......... .......... .......... .......... sp|O60341|LS .......... .......... .......... .......... .......... sp|P93846|CP .......... .....VSAHF FKGNEAEMSQ .......... ..QEVY.RFN sp|Q4PJW3|CP .......... .....AAALL FNSKNEDLNA .......... ..EEVYSRLT sp|Q9Y8G7|C5 KKTLKSVLS QVREGVHDGL FTAFEDEPNW .......... ..GKAH.RIL sp|P08686|CP AGRPEPLTYK LVSKNYPDLS LGDYSLLWKA .......... ..HKKL.TRS sp|P37118|C7 ASRPKSSIVD RLSYGSKDVG FSPFGEYWRR .......... ..AKSI.TVL sp|Q9T0K2|C7 ANRPKTKVVD KILSGGRDVA FAPYGEYWRQ .......... ..MKSI.CIQ tr|Q40000000 .......... .......... .......... .......... .......... tr|Q8NN29|Q8 .......... .......... .......... .......... .......... tr|Q4KAS7|Q4 PPVFNNILA. .......... .......... .......... .......... tr|O54036|O5 .......... .......... .......... .......... .......... sp|P12609|VA .......... .......... .......... .......... .......... sp|O87278|ST PPVFNNLLA. .......... .......... .......... .......... sp|P38364|PI SLYTMTALLS YEAGVDGQTI ILKEQLQRFC DQ.....KQV IDLPQFLQYY sp|Q9UBB5|MB .......... .......... .......... .......... .......... sp|O60341|LS .......... .......... .......... .......... .......... sp|P93846|CP VPTFGPGVV. .......... .......... .......... .......... sp|Q4PJW3|CP TPVFGKGVA. .......... .......... .......... .......... sp|Q9Y8G7|C5 VPAFGPLSIR .....GMFPE MHDIATQLCM KFARHGPRTP IDTSDNFTRL sp|P08686|CP ALL...LGIR .....DSMEP VVEQLTQEFC ERMRAQPGTP VAIEEEFSLL sp|P37118|C7 HLLSNTRVQS YRNVRAEETA NMIGKIRQGC D......SSV INLGEHLCSL sp|Q9T0K2|C7 NLLNNKMVRS YEKIREEEIK RMIEKLEKas csssp...SP VNLSQILMTL tr|Q40000000 LEKAHPSSLG PIGVKLLNEQ LVVAKLSGQY VA.MHDRCAH RSAKLSLG.. tr|Q8NN29|Q8 .......... .......... .......... .......... .......... tr|Q4KAS7|Q4 .......... .......... ....EVVGWM KD.LTDECHE HGAAVMIQLT tr|O54036|O5 Iadk...... PLGRQICGEK IVFYRGHENR VAAVEDFCrt r.APLSLG.. sp|P12609|VA .......... .....ICNER MVIYRGAGQR VAALEDFCPH RGAPLSLG.. sp|O87278|ST .......... .......... ....EIVPWI RE.MTDAVHE EGAVIMIQLT sp|P38364|PI .......... .......... .......... .......... .......... sp|Q9UBB5|MB .......... PGGGRCCPEQ .......... .......... .......... sp|O60341|LS .......... .......... .......... .......... .......... sp|P93846|CP EAEEYFSKWG ESGTVDLKYE L......... .......... .......... sp|Q4PJW3|CP ETKEYFKSWG ESGEKNLFEA L......... .......... .......... sp|Q9Y8G7|C5 .......... .......... ....ELHPFI EA.MGDFLTE SGnrnrrppf sp|P08686|CP .......... .......... .......... .......... .......... sp|P37118|C7 .......... .......... .......... .......... .......... sp|Q9T0K2|C7 .......... .......... .......... .......... .......... tr|Q40000000 AALFAGQHTS SITSTWTGA. .......... ...YMLRFKQ YFAEAVEEQK tr|Q8NN29|Q8 LRVGApeyvl vaggigitai rsmasllkkl GANYRIHFAA RSLDAMAYKD tr|Q4KAS7|Q4 .......... .......... .......... GANYCLDRIY NAGAAYCIHN tr|O54036|O5 .......... .......... .......... .......... .......... sp|P12609|VA .......... .......... .......... .......... .......... sp|O87278|ST .......... .......... .......... GANYCLDRIY QGGAAYCIHN sp|P38364|PI AALFAGQHTS SITSTWTGA. .......... ...YMLRFKQ YFAEAVEEQK sp|Q9UBB5|MB .......... .......... .......... .......... .......... sp|O60341|LS .......... .......... .......... .......... .......... sp|P93846|CP AALFAGQHTS SITSTWTGA. .......... ...YMLRFKQ YFAEAVEEQK sp|Q4PJW3|CP AALFAGQHTS SITSTWTGA. .......... ...YMLRFKQ YFAEAVEEQK
ePrin
t@CFT
RI
A Biotechnological Approach for Decaffeination Chapter 4
247
sp|Q9Y8G7|C5 AALFAGQHTS SITSTWTGA. .......... ...YMLRFKQ YFAEAVEEQK sp|P08686|CP AALFAGQHTS SITSTWTGA. .......... ...YMLRFKQ YFAEAVEEQK sp|P37118|C7 AALFAGQHTS SITSTWTGA. .......... ...YMLRFKQ YFAEAVEEQK sp|Q9T0K2|C7 DMFLAGTATT LSFLEWAMT. .......... ...ELMRNPK VMKKLQEEIR tr|Q40000000 PRGPRAT.. ESGKRMDCPA LPPGWKKEEV IRKSGLSAGK SDVyyfsp tr|Q8NN29|Q8 ELVAEH..GD KLhlhldseg t......... .......... .......... tr|Q4KAS7|Q4 .AATGR ETSMPHEVPK AAHPR..... .......... .......... tr|O54036|O5 .HRHRREV.. LSARHMENIM APPFWRMAL. .......... .......... sp|P12609|VA .......... .....MEGIL APPFWRAAL. .......... .......... sp|O87278|ST .....AATGR ELTMPHSIAK AhcrR..... .......... .......... sp|P38364|PI THVKED.... PIRFQQS... .......... .......... .......... sp|Q9UBB5|MB PRGPRAT.. ESGKRMDCPA LPPGWKKEEV IRKSGLSAGK SDVyyfsp.. sp|O60341|LS .PRGPRAT.. ESGKRMDCPA LPPGWKKEEV IRKSGLSAGK SDVyyfsp sp|P93846|CP DVMKRH..GD KIDHDIL... .......... .......... .......... sp|Q4PJW3|CP QKTVCGENLP PLTYDQL... .......... .......... .......... sp|Q9Y8G7|C5 EVVGRG.... PVLVEHL... .......... .......... .......... sp|P08686|CP HELGPGASSS RVPYKDR... .......... .......... .......... sp|P37118|C7 ...GLAQGKS EITEDDL... .......... .......... .......... sp|Q9T0K2|C7 SSSPQDlf.. .VTEKEA... .......... .......... .......... tr|Q40000000 N.....FLLF A......... .......... .......... REQADDSDYL tr|Q8NN29|Q8 FSP.EVF... .......... .......... .......... ....HI.... tr|Q4KAS7|Q4 GRNVLVYDDA GD...HAGLQ AAE.F.IARS GARTEIMTPD RSFAPE.... tr|O54036|O5 Y.....FWVL A......... .......... .......... CNFAAQDQAL sp|P12609|VA Y.....FWGM A......... .......... .......... RSFRPEDNEL sp|O87278|ST GTNVLIFDDA GD...HAALQ AAE.F.LATA GARVEIMTPD RSFAPE.... sp|P38364|PI GNDASVFRPE RWLETKGNLN igg....SFA FGAGSRSCIG KNISIL.... sp|Q9UBB5|MB LNT.SQPLCK AFIVTDEDIR k......... .......... .......... sp|O60341|LS GAp....... .......... .......... .......... .......... sp|P93846|CP KNP.DSYDPD RFgpgreedk aagaF.SYIS FGGGRHGCLG EPFAYL.... sp|Q4PJW3|CP VER.LDFNPD RYLEDSpas. GEK.F.AYVP FGAGRHRCIG ENFAYV.... sp|Q9Y8G7|C5 GNDADKFIPE RMLDDEfarl nkeypnCWKP FGNGKRACIG RPFAWQ.... sp|P08686|CP ERP.HEFWPD RFLEp..... GKN.S.RALA FGCGARVCLG EPLARL.... sp|P37118|C7 ENP.EEYQPE RFLNSDADVK GLN.F.KLLP FGAGRRGCPG SSFAIA.... sp|Q9T0K2|C7 GTDAEEFKPE RHLDTNLDFQ GQD.F.KFIP FGSGKRICPG IGFTSA.... tr|Q40000000 TANIREGQGK IFSEDLEMLE RQQQNLLAYP.......... .......... tr|Q8NN29|Q8 .......... .......QVP ELGLHATVNK .......... .......... tr|Q4KAS7|Q4 .......... .......VMG MNLVPYMRSL QQLDTTFTVT YRLKAVERQG tr|O54036|O5 TANIREGQGK IFSEDLEMLE RQQQNLLAYP .......... .......... sp|P12609|VA TARIREGQGT IFAEDLEMLE QQQRNLLAWP .......... .......... sp|O87278|ST .......... .......VMA MNLVPYMRCL QKLDVTFTVT YRLEAVEKSG sp|P38364|PI .......... .......EMS KAIPQIVRNF .......... .......... sp|Q9UBB5|MB .......... .......... .......... .......... .......... sp|O60341|LS .......... .......... .......... .......... .......... sp|P93846|CP .......... .......QIK AIWTHLLRNF .......... .......... sp|Q4PJW3|CP .......... .......QIK TIWSTMLRLY .......... .......... sp|Q9Y8G7|C5 .......... .......ESL LAMVVLFQNF .......... .......... sp|P08686|CP .......... .......ELF VVLTRLLQAF .......... .......... sp|P37118|C7 .......... .......VIE LALARLVHKF .......... .......... sp|Q9T0K2|C7 .......... .......LIG VTLANIVKRF .......... ..........
ePrin
t@CFT
RI
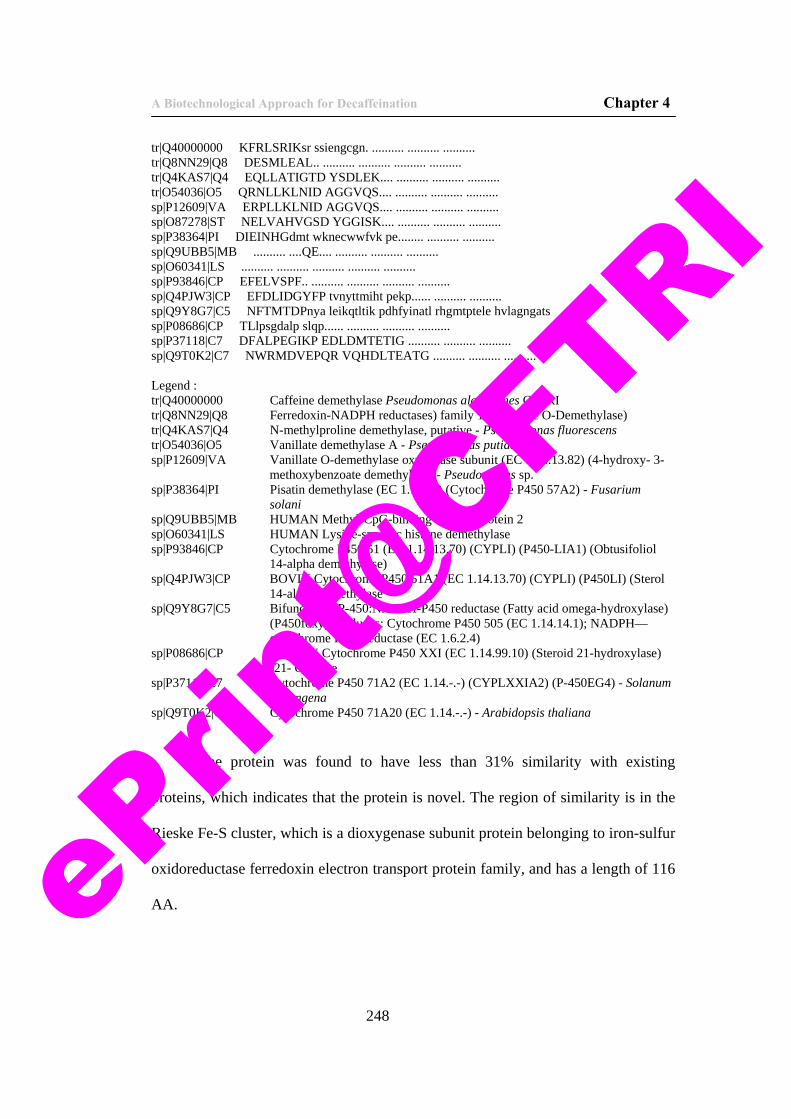
A Biotechnological Approach for Decaffeination Chapter 4
248
tr|Q40000000 KFRLSRIKsr ssiengcgn. .......... .......... .......... tr|Q8NN29|Q8 DESMLEAL.. .......... .......... .......... .......... tr|Q4KAS7|Q4 EQLLATIGTD YSDLEK.... .......... .......... .......... tr|O54036|O5 QRNLLKLNID AGGVQS.... .......... .......... .......... sp|P12609|VA ERPLLKLNID AGGVQS.... .......... .......... .......... sp|O87278|ST NELVAHVGSD YGGISK.... .......... .......... .......... sp|P38364|PI DIEINHGdmt wknecwwfvk pe........ .......... .......... sp|Q9UBB5|MB .......... ....QE.... .......... .......... .......... sp|O60341|LS .......... .......... .......... .......... .......... sp|P93846|CP EFELVSPF.. .......... .......... .......... .......... sp|Q4PJW3|CP EFDLIDGYFP tvnyttmiht pekp...... .......... .......... sp|Q9Y8G7|C5 NFTMTDPnya leikqtltik pdhfyinatl rhgmtptele hvlagngats sp|P08686|CP TLlpsgdalp slqp...... .......... .......... .......... sp|P37118|C7 DFALPEGIKP EDLDMTETIG .......... .......... .......... sp|Q9T0K2|C7 NWRMDVEPQR VQHDLTEATG .......... .......... .......... Legend : tr|Q40000000 Caffeine demethylase Pseudomonas alcaligenes CFTRI tr|Q8NN29|Q8 Ferredoxin-NADPH reductases) family 1 (Vanillate O-Demethylase) tr|Q4KAS7|Q4 N-methylproline demethylase, putative - Pseudomonas fluorescens tr|O54036|O5 Vanillate demethylase A - Pseudomonas putida sp|P12609|VA Vanillate O-demethylase oxygenase subunit (EC 1.14.13.82) (4-hydroxy- 3-
methoxybenzoate demethylase) - Pseudomonas sp. sp|P38364|PI Pisatin demethylase (EC 1.14.-.-) (Cytochrome P450 57A2) - Fusarium
solani sp|Q9UBB5|MB HUMAN Methyl-CpG-binding domain protein 2 sp|O60341|LS HUMAN Lysine-specific histone demethylase sp|P93846|CP Cytochrome P450 51 (EC 1.14.13.70) (CYPLI) (P450-LIA1) (Obtusifoliol
14-alpha demethylase) sp|Q4PJW3|CP BOVIN Cytochrome P450 51A1 (EC 1.14.13.70) (CYPLI) (P450LI) (Sterol
14-alpha demethylase sp|Q9Y8G7|C5 Bifunctional P-450:NADPH-P450 reductase (Fatty acid omega-hydroxylase) (P450foxy) [Includes: Cytochrome P450 505 (EC 1.14.14.1); NADPH— cytochrome P450 reductase (EC 1.6.2.4) sp|P08686|CP HUMAN Cytochrome P450 XXI (EC 1.14.99.10) (Steroid 21-hydroxylase)
(21- OH) ase sp|P37118|C7 Cytochrome P450 71A2 (EC 1.14.-.-) (CYPLXXIA2) (P-450EG4) - Solanum melongena sp|Q9T0K2|C7 Cytochrome P450 71A20 (EC 1.14.-.-) - Arabidopsis thaliana The protein was found to have less than 31% similarity with existing
proteins, which indicates that the protein is novel. The region of similarity is in the
Rieske Fe-S cluster, which is a dioxygenase subunit protein belonging to iron-sulfur
oxidoreductase ferredoxin electron transport protein family, and has a length of 116
AA.
eP
rint@
CFTRI
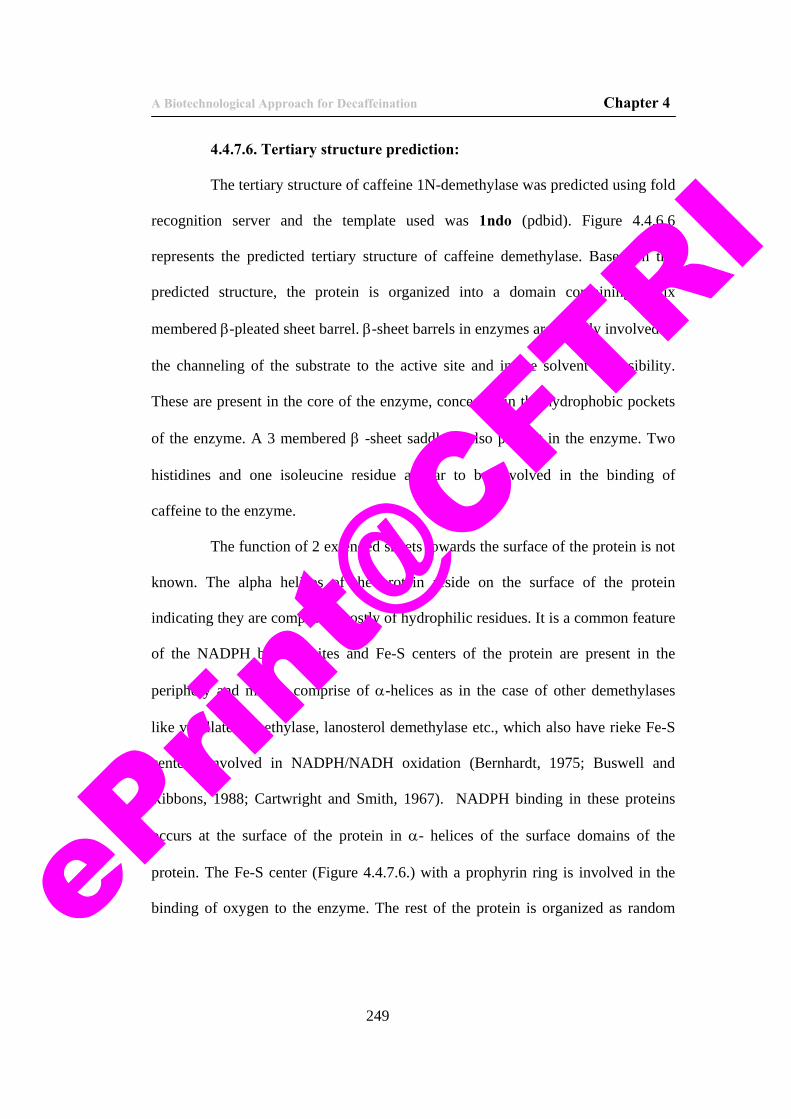
A Biotechnological Approach for Decaffeination Chapter 4
249
4.4.7.6. Tertiary structure prediction:
The tertiary structure of caffeine 1N-demethylase was predicted using fold
recognition server and the template used was 1ndo (pdbid). Figure 4.4.6.6
represents the predicted tertiary structure of caffeine demethylase. Based on the
predicted structure, the protein is organized into a domain containing a six
membered β-pleated sheet barrel. β-sheet barrels in enzymes are usually involved in
the channeling of the substrate to the active site and in the solvent accessibility.
These are present in the core of the enzyme, concealed in the hydrophobic pockets
of the enzyme. A 3 membered β -sheet saddle is also present in the enzyme. Two
histidines and one isoleucine residue appear to be involved in the binding of
caffeine to the enzyme.
The function of 2 extended sheets towards the surface of the protein is not
known. The alpha helices of the protein reside on the surface of the protein
indicating they are composed mostly of hydrophilic residues. It is a common feature
of the NADPH binding sites and Fe-S centers of the protein are present in the
periphery and mostly comprise of α-helices as in the case of other demethylases
like vanillate demethylase, lanosterol demethylase etc., which also have rieke Fe-S
centers, involved in NADPH/NADH oxidation (Bernhardt, 1975; Buswell and
Ribbons, 1988; Cartwright and Smith, 1967). NADPH binding in these proteins
occurs at the surface of the protein in α- helices of the surface domains of the
protein. The Fe-S center (Figure 4.4.7.6.) with a prophyrin ring is involved in the
binding of oxygen to the enzyme. The rest of the protein is organized as random ePrin
t@CFT
RI
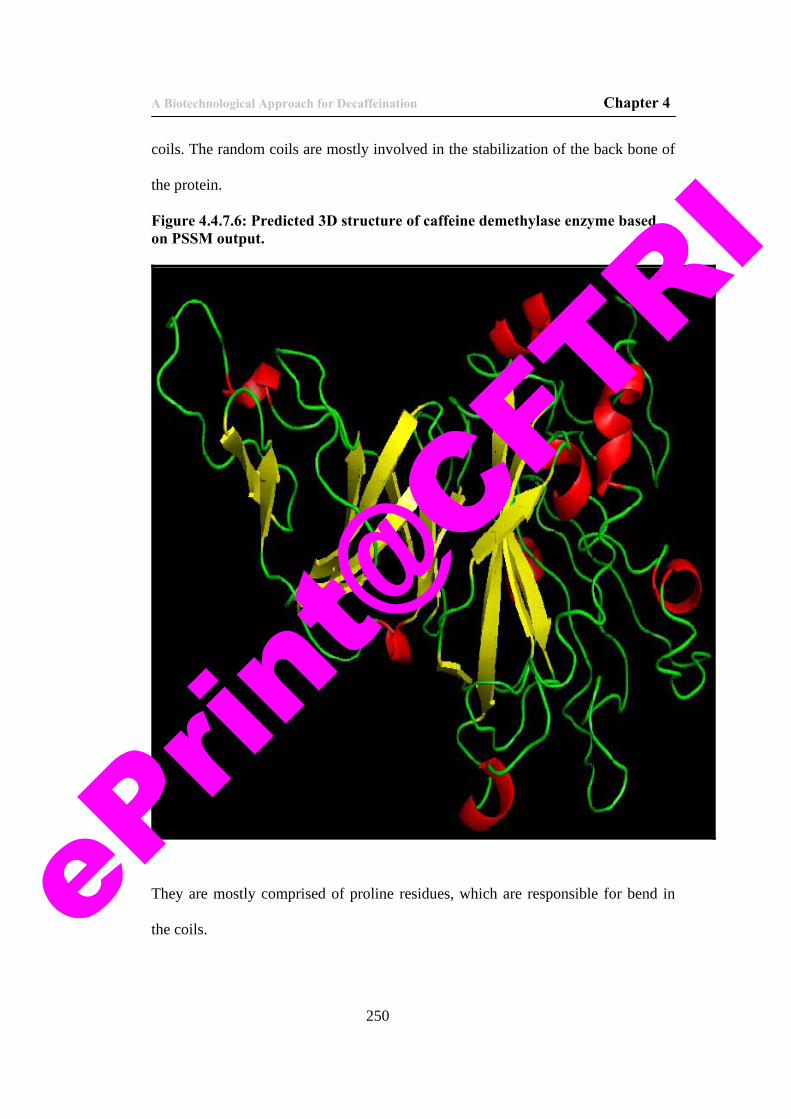
A Biotechnological Approach for Decaffeination Chapter 4
250
coils. The random coils are mostly involved in the stabilization of the back bone of
the protein.
Figure 4.4.7.6: Predicted 3D structure of caffeine demethylase enzyme based on PSSM output.
They are mostly comprised of proline residues, which are responsible for bend in
the coils. ePrin
t@CFT
RI
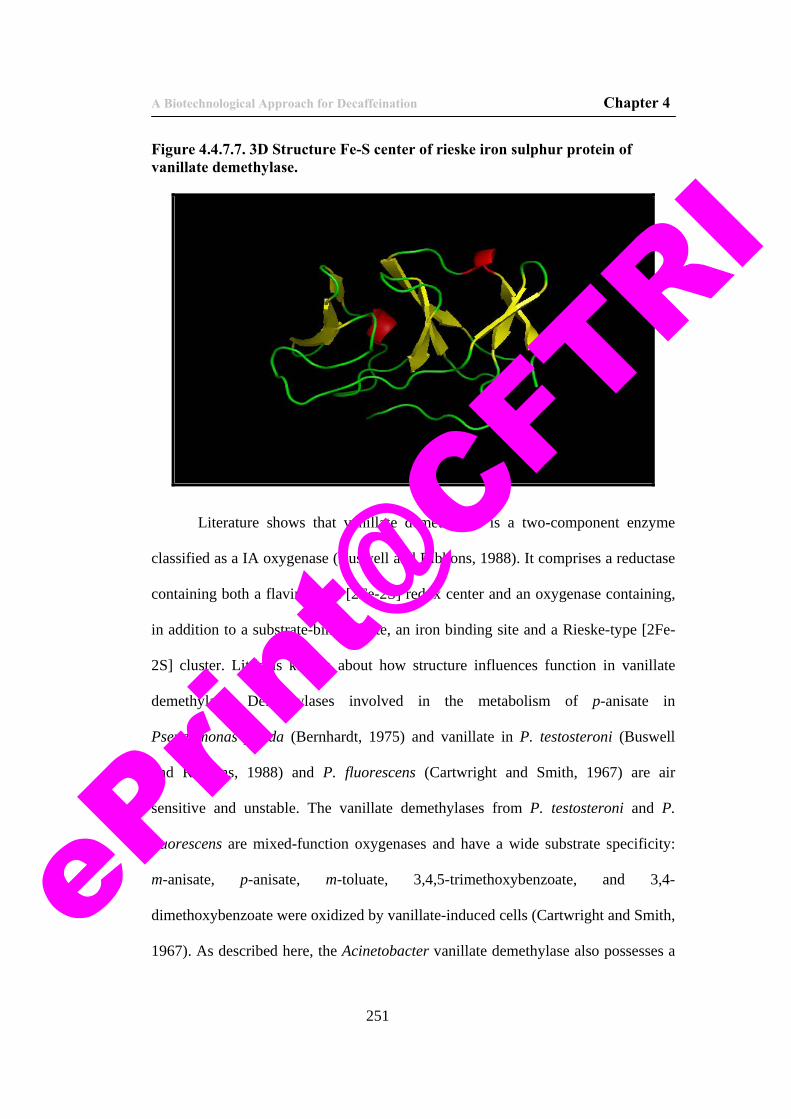
A Biotechnological Approach for Decaffeination Chapter 4
251
Figure 4.4.7.7. 3D Structure Fe-S center of rieske iron sulphur protein of vanillate demethylase.
Literature shows that vanillate demethylase is a two-component enzyme
classified as a IA oxygenase (Buswell and Ribbons, 1988). It comprises a reductase
containing both a flavin and a [2Fe-2S] redox center and an oxygenase containing,
in addition to a substrate-binding site, an iron binding site and a Rieske-type [2Fe-
2S] cluster. Little is known about how structure influences function in vanillate
demethylase. Demethylases involved in the metabolism of p-anisate in
Pseudomonas putida (Bernhardt, 1975) and vanillate in P. testosteroni (Buswell
and Ribbons, 1988) and P. fluorescens (Cartwright and Smith, 1967) are air
sensitive and unstable. The vanillate demethylases from P. testosteroni and P.
fluorescens are mixed-function oxygenases and have a wide substrate specificity:
m-anisate, p-anisate, m-toluate, 3,4,5-trimethoxybenzoate, and 3,4-
dimethoxybenzoate were oxidized by vanillate-induced cells (Cartwright and Smith,
1967). As described here, the Acinetobacter vanillate demethylase also possesses a eP
rint@
CFTRI

A Biotechnological Approach for Decaffeination Chapter 4
252
broad substrate range. Inferences can be drawn about the mechanism of vanillate
demethylase from results obtained with the evolutionarily related enzyme phthalate
dioxygenase (Gassner et.al., 1994). In this enzyme, electrons for hydroxylation flow
from NADH to flavin mononucleotide to [2Fe-2S] in the reductase and from the
Rieske-type [2Fe-2S] center to the Fe21 site in the oxygenase, where oxygen
binding and hydroxylation occur (Gassner et.al., 1995; Kauppi et.al., 1998; Parales
et.al., 1999). As recently shown for the naphthalene dioxygenase, another member
of this group of aromatic dioxygenases, Fe1 of the Rieske [2Fe-2S] center is
coordinated by two cysteinyl residues and Fe2 is coordinated by two histidyl
residues (Pavel et.al., 1994). The iron atom at the active site is coordinated by two
histidyl residues and one aspartyl residue. Aspartate 205 in the catalytic domain of
this enzyme has been shown to be essential for activity. The C-terminal regions of
the a subunit of the oxygenase component of 2-nitrotoluene 2,3-dioxygenase and
biphenyl dioxygenase were shown to be responsible for substrate specificity. Very
scanty literature is available on the exact docking of caffeine to the active site of the
caffeine demethylase enzyme. However, from the sequence similarity in the Fe-S
region of most of the demethylases with caffeine demethylase, it can be inferred
that the oxygen binding and NADPH oxidation is common to all the demethylases.
A report on caffeine demethylase (Sideso et.al., 2001) indicates a flexible active site
of the enzyme and the enzyme also accepts theobromine as a substrate. However
our experiments show that, the demethylase is specific for caffeine only and two
demethylases are involved in the degradation of caffeine in Pseudomonas
alcaligenes MTCC 5264. Further these enzymes are present as separate proteins in ePrin
t@CFT
RI
A Biotechnological Approach for Decaffeination Chapter 4
253
contrast to what has been reported in literature (Sideso et.al., 2001). The docking of
caffeine to human cytochrome p450 (CYP 1A2) shows that the active site is present
in the same plane as the heme group and caffeine is bound parallel to the iron in the
heme group (Regal and Nelson, 2000). The 1,3 and 7th methyl groups are oriented
6.7 Å, 6.5 Å and 6.7 Å apart from the Fe center in the heme and therefore a
preference to 3 N demethylation is shown by the enzyme followed by 1 N
demethylation and the least preference to 7 N demethylation. The caffeine
demethylases in the bacterial system also produce theobromine (3 N demethylation)
and 1 N demethylation (paraxanthine). The active site in CYP1A2 can fit two
caffeine molecules, one parallel to the heme and the other perpendicular to the
heme leading to the formation of theobromine and paraxanthine. This does not fit to
the bacterial demethylase because both the products are produced by different
enzymes. One probable explanation can be derived from the CYP 1A2 model,
where in the 1 N demethylase the caffeine molecule is oriented perpendicular to the
iron favouring the formation of paraxanthine and parallel in the 3 N demethylase
favouring theobromine production. This same model seems to apply to caffeine
demethylase from P. alcaligenes MTCC 5264.
Further, the exact docking of caffeine to the active site of the enzyme is being
studied and will be undertaken in future.
4.5. CONCLUSIONS:
The enzymes involved in caffeine degradation by P. alcaligenes MTCC 5264
were identified as caffeine 1N and 3N demethylases, xanthine oxidase,
heteroxanthine demethylase, xanthine denhydrogenase, uricase, allantoinase,
allantoicase and urease. Caffeine demethylase enzyme is found to be the key eP
rint@
CFTRI
A Biotechnological Approach for Decaffeination Chapter 4
254
enzyme in the pathway and it has not been purified and characterized earlier due to
its high instability. The use of protein based stabilizing agents and polyols conferred
stability to the enzyme and the enzyme was purified and characterized to
homogeneity. It was found that two demethylases (caffeine 1N and 3N
demethylase) are involved in the first step of caffeine degradation in P. alcaligenes
MTCC 5264. The enzyme involved in 1N-demethylation of caffeine was
characterized by LC MS analysis and bioinformatics tools. The tertiary structure of
the enzyme has been predicted using bioinformatics approach. The mode of binding
of caffeine to the active site of the enzyme has been proposed to be parallel to the
heme group similar to CYP 1A2 activity in humans. The enzyme is highly specific
to caffeine unlike a few models proposed in literature.
Further studies will be carried out in our laboratory on the cloning and hyper
expression of the gene coding for caffeine demethylase in a suitable expression
vector and the hyper production of caffeine demethylase enzyme in a suitable
expression system. Further work is required to be carried out on the stabilization of
the caffeine demethylase enzyme which is a very important aspect in the
development of biotechnological processes for decaffeination.
ePrin
t@CFT
RI
A Biotechnological Approach for Decaffeination Chapter 4
255
4.6. REFERENCES:
1. Asano, Y., Toshihiro, K. and Yamada, H. (1993). Microbial production of
theobromine from caffeine. Biosci. Biotech. Biochem.57:1286-1289.
2. Asano, Y., Toshihiro, K and Yamada, H. (1994). Enzymes involved in
theobromine production from caffeine by Pseudomonas putida No.352.
Biosci.Biotech.and Biochem. 58(12) : 2303-2304.
3. Ashihara, H., Monteiro, A.M., Moritz, T., Gillies, F.M., Crozier, A., (1996),
Catabolism of caffeine and related purine alkaloids in leafs in Coffee arabica L.
Planta. 198:334–39.
4. Ashihara, H., Gillies, F.M., Crozier, A., (1997), Metabolism of caffeine and
related purine alkaloids in leafs of tea (Camellia Sinensis). Plant Cell Physiol.
38:413–9.
5. Bairoch, A., Bucher, Hofmann, K., (1997), The PROSITE database, its status in
1997. Nucl. Acids Res., 25: 217-221.
6. Bergmann, F., Waron, U. H., Govrin, K.H., Goldberg, H., Leon, S., (1962),
Some specific reactions of the purine-oxidizing system of Pseudomonas
aeruginosa. Biochim. Biophys. Acta, 55: 512-22.
7. Bernhardt, F. H. P. H. S. H., (1975), A 4-methoxybenzoate O-demethylase from
Pseudomonas putida: a new type of monooxygenase system. Eur. J. Biochem.
57:241–256.
8. Blecher, R., Lingens, F., (1977), Metabolism of caffeine by Pseudomonas
putida. Hoppe Seyler’s Z. Physiol. Chem. 358:807–17.
9. Bradford, M. M., (1976), A rapid and sensitive method for the quantification of
microgram quantities of protein utilizing the principle of protein-dye binding.
Anal Biochem. 72:248–254.
10. Brand, D., Pandey, A., Roussos, S., Soccol, C.R., (2000), Biological
detoxification of coffee husk by filamentous fungi using a solid-state
fermentation system. Enzyme Microb. Technol. 27:127–33. eP
rint@
CFTRI
A Biotechnological Approach for Decaffeination Chapter 4
256
11. Bray, R.C., (1963), Xanthine oxidase. In : Boyer, P.D., Lardy, H. and Myrbäck,
K. (Eds.), The Enzymes, 2nd ed., vol. 7, Academic Press, New York, 533-556.
12. Burg, A.W., Stein, M.E., (1972), Urinary excretion of caffeine and its
metabolites in the mouse. Biochem Pharmacol. 21(7):909-922.
13. Buswell, J. A., Ribbons, D. W., (1988), Vanillate O-demethylase from
Pseudomonas spp. Methods. Enzymol. 161:294–301.
14. Campbell, Jr., L. L., (1954), The mechanism of allantoin degradation by a
Pseudomonas, J Bacteriol.; 68(5): 598–603.
15. Cartwright, N. J., Smith, A.R.W. (1967), Bacterial attack on phenolic esters: an
enzyme demethylating vanillic acid. Biochem. J. 102:826–841.
16. Caubet, M.S., Comte. B., Brazier. J.L., (2004), Determination of urinary
13Ccaffeine metabolites by liquid chromatography–mass spectrometry: the use
of metabolic ratios to assess CYP1A2 activity. J. Pharm. Biomed. Anal.
34:379–89.
17. Cornish, H.H., Christman, A.A., (1957), A study of the metabolism of
theobromine, theophylline and caffeine in man. J. Biol. Chem. 228:315–23.
18. Freedman J.H., Peisach, J., (1984), Determination of copper in biological
materials by atomic absorption spectroscopy: a reevaluation of the extinction
coefficients for azurin and stellacyanin. Anal. Biochem. 141(2):301-10.
19. Gassner, G. T., Ludwig, M. L., Gatti, D.L., Correll, C.C., Ballou, D.P., (1995),
Magnetic circular dichroism studies of exogenous ligand and substrate binding
to the non-heme ferrous active site in phthalate dioxygenase. Chem. Biol.
1:173–183.
20. Gassner, G., Wang, L., Batie, C., Ballou, D.P., (1994), Reaction of phthalate
dioxygenase reductase with NADH and NAD: kinetic and spectral
characterization of intermediates. Biochemistry 33:12184–12193. ePrin
t@CFT
RI
A Biotechnological Approach for Decaffeination Chapter 4
257
21. Gluck, M., Lingens, F., (1987), Studies on the microbial production of
thebromine and heteroxanthine from caffeine. Appl. Microbiol. Biotech. 25:
334-340.
22. Gluck, M., Lingens, F., (1988), Heteroxanthinedemethylase, a new enzyme in
the degradation of caffeine by Pseudomonas putida. Appl. Microbiol.
Biotechnol. 28: 59-62.
23. Gouda, M. D., Thakur, M. S., Karanth, N. G., (2001), Stability Studies on
Immobilized Glucose Oxidase Using an Amperometric Biosensor - Effect of
Protein Based Stabilizing Agents, Electroanalysis, 13 (10): 849-855.
24. Gouda M.D., Thakur M.S., Karanth N.G., (2002), Reversible Denaturation
Behavior of Immobilized Glucose Oxidase, Appl. Biochem. Biotechnol. 103(1-
3): 471-480.
25. Gouda, M.D., Singh, S.A., Rao, A.G.A., Thakur, M.S., Karanth, N.G., (2003),
Thermal Inactivation of Glucose-Oxidase - Mechanism and Stabilization Using
Additives, J. Biol. Chem. 278 (27): 24324-24333.
26. Hakil, M., Denis, S., Gonz´alez, G.V., Augur, C., (1998), Degradation and
product analysis of caffeine and related dimethyl xanthines by filamentous
fungi. Enzyme Microb. Technol. 22:355–9.
27. Hakil, M., Voisinet, F., Gonz´alez, G.V., Augur, C., (1999), Caffeine
degradation in solid-state fermentation by Aspergillus tamarii: effects of
additional nitrogen sources. Process. Biochem. 35:103–109.
28. Hohnloser, W., Osswalt, B., Lingens, F., (1980), Enzymological aspects of
caffeine demethylation and formaldehyde oxidation by Pseudomonas putida C1.
Hoppe seyler’s Z. Physiol. Chem. 361:1763– 1766.
29. Imai, Y., Nakane, S., Koide, Y., (1996), Caffeine demethylase gene-containing
DNA fragment and microbial process for producing 3-methyl-7-alkylxanthine,
United States Patent 5550041. ePrin
t@CFT
RI
A Biotechnological Approach for Decaffeination Chapter 4
258
30. Jakoby, W.B., (1971), Crystallization as a purification technique, Enzyme
Purification and Related Techniques, in Methods in Enzymology, Vol. 22,
Jakoby, W.B., Ed., Academic Press, London.
31. James, J.E., (1997), Is habitual caffeine use a preventable cardiovascular risk
factor? Lancet. 349:279–281.
32. Jayaraman, (1988), Laboratory manual in Biochemistry. 3rd edition. New Delhi.
Wiley Eastern Limited. pp. 114 - 115, 130 -131.
33. Johan M. H. S., Mooibroek, H., (1998), Cloning and Characterization of NADP-
Mannitol Dehydrogenase cDNA from the Button Mushroom, Agaricus
bisporus, and Its Expression in Response to NaCl Stress. Appl Environ
Microbiol. 64(12): 4689–4696.
34. Kauppi, B., Lee, K., Carredano, E., Parales, R. E., Gibson, D.T., Eklund, H.,
Ramaswamy, S., (1998), Structure of an aromatic-ring-hydroxylating
dioxygenase-naphthalene 1,2-dioxygenase. Structure 6:571–586.
35. Khanna, K.L., Rao, G.S., Cornish, H.H., (1972), Metabolism of caffeine-3H in
the rat. Toxicol. Appl. Pharmacol. 23:720–730.
36. Khilman, B.A., (1974), Effects of caffeine on the genetic material. Mutat. Res.
26:53–71.
37. Koyama. Y., Tomoda, Y., Kato, M., Ashihara, H., (2003), Metabolism of purine
bases, nucleosides and alkaloids in theobromine-forming Theobroma cacao
leaves. Plant Physiol. Biochem. 41:977–984.
38. Kurtzman, Jr. R.H., Schwimmer, S., (1971), Caffeine removal from growth
media by microorganism. Experientia 27:481–482.
39. Laemmli, U.K., (1970). Cleavage of structural proteins during the assembly of
the head of bacteriophage T4. Nature 227: 680-685.
40. Landon., (1977), Cleavage at aspartyl-prolyl bonds, Methods Enzymol. 47:145-
149. ePrin
t@CFT
RI
A Biotechnological Approach for Decaffeination Chapter 4
259
41. Leviton, A., Cowan, L., (2002), A review of the literature relating caffeine
consumption by women to their risk of reproductive hazards. Food. Chem.
Toxicol. 40:1271–1310.
42. Machold, C., Deinhofer, K., Hahn, R., Jungbauer, A., (2002), Hydrophobic
interaction chromatography of proteins - I. Comparison of selectivity, J.
Chromatog. A, 972(1): 3-19.
43. Madyastha, K.M., Sridhar, G.R., (1998), A Novel pathway for the metabolism
of caffeine by a mixed culture consortium. Biochem. Biophys. Res. Commun.
249:178–181.
44. Madyastha, K.M., Sridhar, G.R., Vadiraja, B.B., Madhavi, Y.S., (1999),
Purification and partial characterization of caffeine oxidase-A novel enzyme
from a mixed culture consortium. Biochem. Biophys. Res. Commun.263:460–
464.
45. Mahler, H.R., Hübscher, G., Baum, H., (1955), J. Biol. Chem. 216: 625-641.
46. Mazzaffera, P., (1993), 7-Methyl xanthine is not involved in caffeine catabolism
in Coffea dewevrei. J. Agric. Food Chem. 41:1541–1543.
47. Mazzaffera, P., Olsson, O., Sandberg, G., (1994), Degradation of caffeine and
related methyl xanthines by Serratia marcescens isolated from soil under coffee
cultivation. Microb. Ecol. 31:199–207.
48. Meyer, L., Caston, J., Lieberman, H.R., (2004), Stress alters caffeine action on
investigatory behaviour and behavioural inhibition in the mouse. Behav. Brain.
Res. 149:87–93.
49. Middelhoven, W.J., Lommen, A., (1984), Degradation of caffeine by
Pseudomonas putida C3024. Anton. van Leeuw.. 50:298-30.
50. Moriwaki, Y., Yamamoto, T., Higashino, K., (1999), Enzymes involved in
purine metabolism-a review of histochemical localization and functional
implications. Histol Histopathol. 14(4): 1321-1340. ePrin
t@CFT
RI

A Biotechnological Approach for Decaffeination Chapter 4
260
51. Papayannopoulos, I. A., (1995), The interpretation of collision-induced
dissociation tandem mass Spectra peptides. Mass Spectromet. Rev. 14: 49-73.
52. Parales, R. E., Parales, J. V., Gibson, D.T., (1999), Aspartate 205 in the
catalytic domain of naphthalene dioxygenase is essential for activity. J.
Bacteriol., 181:1831–1837.
53. Pavel, E. G., Martins, L. J., Ellis, Jr. W.R. Solomon, E.I., (1994), Magnetic
circular dichroism studies of exogenous ligand and substrate binding to the non-
heme ferrous active site in phthalate dioxygenase. Chem. Biol. 1:173–183.
54. Pincheira, J., L´opez-S´aez, J.F., Carrera, P., Navarreteb, M.H., Torre, C.D.L.,
(2003), Effect of caffeine on in vivo processing of alkylated bases in
proliferating plant cells. Cell. Biol. Int. 27:837–843.
55. Porres, C., Alvarez, D., Calzada, J., (1993), Caffeine reduction in coffee pulp
through silage. Biotechnol Adv . 11(3):519–523.
56. Putrament, A., Baranowska, H., Bilinsky, T., Prazmo, W., (1972), On the
specificity of caffeine effects. Mol. Gen. Genet. 118:373–379.
57. Ramarethinam, S., Rajalakshmi, N., (2004), Caffeine in tea plants [Camellia
sinensis (L.) O. Kuntze]: in situ lowering by Bacillus licheniformis (Weigmann)
Chester. Indian. J. Exp. Biol. 42(6):575–580.
58. Regal K. A., Nelson, S.D., (2000), Orientation of caffeine within the active site
of Human Cytochrome P450 1A2 based on NMR longitudinal (T1) relaxation
measurements, Arch. Biochim. Biophy. 384: 47-58.
59. Rojas, J.B.U., Verreth, J.A.J., Amato, S., Huisman, E.S., (2003), Biological
treatments affect the chemical composition of coffee pulp. Bioresour. Technol.
89:267–274.
60. Roussos, S., Hannibal, L., Aquiahuatl, M.A., Hernandes, M.R.T., Marakis S.,
(1994), Caffeine degradation by Penicillium verrucosum in solid-state
fermentation of coffee pulp: critical effects of additional inorganic and organic
nitrogen sources. J. Food Sci. Technol. 31:316–319. eP
rint@
CFTRI
A Biotechnological Approach for Decaffeination Chapter 4
261
61. Sarath Babu V.R., Kumar M.A., Karanth, N.G., Thakur, M.S., (2004),
Stabilization of immobilized glucose oxidase against thermal inactivation by
silanization for biosensor applications. Biosen. Bioelect. 19: 1337-1341.
62. Sarath Babu, V.R., Patra, S., Karanth, N.G., Varadaraj, M.C., Thakur, M.S.,
(2005), Degradation of caffeine by Pseudomonas alcaligenes CFR 1708. Enz.
Microb. Technol. 27:617-624.
63. Shevchenko, A., Wilm, M., Vorm, O., Mann, M., (1996), Mass spectrometric
sequencing of proteins from silver stained polyacrylamide gels. Anal. Chem. 68:
850-858.
64. Sideso, O.F.P., Marvier, A.C., Katerelos, N.A., Goodenough, P.W., (2001), The
characteristics and Stabilization of a caffeine demethylase enzyme complex. Int.
J. Food Sci. Technol. 36:693–698.
65. Silvarolla, M.B., Mazzafera, P., de Lima, M.M.A., (2000), Caffeine content of
ethiopian Coffea arabica beans. Genet. Mol. Biol. 23:213–215.
66. Stone, K.L., Williams, K.L., (1996), Enzymatic Digestion of Proteins in
Solution and in SDS Polyacrylamide Gels, in The Protein Protocols Handbook,
eds. J.M. Walker, Humana Press Inc., Totowa, NJ, pp.415 ff.
67. Sundarraj, C.V., Dhala, S., (1965), Effect of naturally occurring xanthines on
bacteria (I). Antimicrobial action and potentiating effect on antibiotic spectra.
Appl Microbiol. 13:432–436.
68. Tagliari, C.V., Sanson, R.K., Zanette, A., Franco, T.T., Soccol, C.R., (2003),
Caffeine degradation by Rhizopus delemar in packed bed column bioreactor
using coffee husk as substrate. Braz. J. Microbiol. 34:102–104.
69. Trijbels, F., Vogels, G.D., (1967), Allantoate and ureidoglycolate degradation
by Pseudomonas aeruginosa. Biochim Biophys Acta. 132(1):115–126.
70. Vit´oria, A.P., Mazzafera, P., (1998), Caffeine degradation in fruits and leaves
of Coffea arabica and Coffeea dewevrei. Pesq Agropec. Bras. 33:1957–1961. ePrin
t@CFT
RI

A Biotechnological Approach for Decaffeination Chapter 4
262
71. Vitória, A.P., Mazzafera, P., (1999), Xanthine Degradation and Related Enzyme
Activities in Leaves and Fruits of Two Coffea Species Differing in Caffeine
Catabolism, J. Agric. Food Chem. 47(5): 1851 – 1855.
72. Vogels, G. D., Van der Drift, C., (1976) Degradation of purines and
pyrimidines by microorganisms, Bacteriol Rev. 40(2): 403–468.
73. Ward, D.N., Arnott, M.S., (1965), Gel filtration of proteins, with particular
reference to the glycoprotein, luteinizing hormone. Anal. Biochem. 12:296-302.
74. Waring, W.S., Goudsmit, J., Marwick, J., Webb, D.J., Maxwell, S.R.J., (2003),
Acute caffeine intake influences central more than peripheral blood pressure in
young adults. Am. J. Hypertens. 16:919–924.
75. Woolfolk, C.A., (1975), Metabolism of M-methylpurines by a Pseudomonas
putida strain isolated by enrichment on caffeine as the sole source of carbon and
nitrogen. J. Bacteriol. 123:1088–1106.
76. Wreck-Reichhart, D., Feyereisen R., (2000), Cytochrome P-450 a success story.
Genome Biol. 6:3003. 1–9.
77. Yamamoto, S., Ishihara, T., (1999), Ion-exchange chromatography of proteins
near the isoelectric points. J. Chromatog. A. (852), 31-36.
78. Yano-Y.D.M., Mazzafera, P. (1999), Catabolism of caffeine and purification of
a xanthine oxidase responsible for methyluric acids Production in Pseudomonas
Putida L. Revista Microbiol. 30:62– 70.
79. Yano-Y.D.M., Mazzafera, P., (1998), Degradation of caffeine by
Pseudomonoas putida isolated from soil. Allel. J. 5:23–34.
ePrin
t@CFT
RI
CHAPTER 5 BIODECAFFEINATION
OF COFFEE & TEA
ePrin
t@CFT
RI
A Biotechnological Approach for decaffeination. Chapter 5
5.1. SCOPE OF THE WORK:
This chapter deals with the development of a biodecaffeination process for
coffee and tea using enzymes isolated from Pseudomonas alcaligenes MTCC 5264.
The first section of this chapter deals with an introduction to biodecaffeination, a
survey of literature on studies carried out by different groups around the world and
studies carried out in our laboratory. The later sections of the chapter deal with the
methods, and results of the studies on biodecaffeination of coffee and tea.
Biodecaffeination of green coffee beans was carried out using the
multienzyme system immobilized in calcium alginate beads and 98% of the caffeine
could be completely degraded in the beans. Cell free extract was used for the
biodecaffeination of tea during fermentation and 80% of the caffeine in the tea dhool
was degraded within 90 minutes of incubation. Inhibitory factors like caffeine
polyphenol complexes and polyphenol protein complexes which were hindering the
biodecaffeination were prevented by the use of glycine in the dhool.
The chapter ends with suggestions on future work to be carried out on
biodecaffeination and future prospects of biodecaffeination.
263
ePrin
t@CFT
RI
A Biotechnological Approach for decaffeination. Chapter 5
5.2. INTRODUCTION:
Biodecaffeination is defined as the complete removal of caffeine and related
methyl xanthines form caffeine containing materials like coffee, tea, cocoa etc., by
the use of enzymes/cells capable of degrading caffeine. It is a process in which
caffeine and its metabolites are removed from caffeine containing materials without
altering the taste, flavor and quality of the materials like tea and coffee.
Coffee, tea, chocolates and cola beverages are caffeine containing food stuffs
and beverages discovered by serendipity, have become a part of customs and
traditions in several countries. In course of time they have created history of their
own to become one of the largest consumed beverages only second to water. Caffeine
is a methylated xanthine alkaloid derivative (1,3,7-trimethylxanthine), structurally
related to purine and contains an imidazole and a purine ring. The presence of three
methyl groups imparts the stimulatory effects to caffeine. Apart from the stimulatory
effects, caffeine when consumed in excess is associated with several ill effects on
human health. Caffeine has deleterious effects on cardiac patients and women
(Camargo and Toledo, 1998; Krestschmar and Baumann, 1999; Caudle and Bell,
2000). Reports are also available on the effects of caffeine on health and of its toxic
effects to animals and plants (Landolt et.al., 1995; Shilo et.al., 2000). Therefore the
demand for decaffeinated products is increasing at a rate of 3% per annum, and
decaffeinated coffee and tea share 15% of the world market. Since the 1940’s several
processes for decaffeination have been developed using solvents such as methylene
chloride. These processes suffer from the disadvantages of stripping off the flavor and
aroma of the beverages, being expensive and use of solvents which are not safe to the
264
ePrin
t@CFT
RI
A Biotechnological Approach for decaffeination. Chapter 5
environment. Moreover, the presence of these solvents in traces also has been a
subject of concern to human health. Therefore the approach is towards a natural and
safe method of decaffeination.
Biotechnological routes of decaffeination are considered to be safe and green
alternatives for the chemical decaffeination processes. Literature survey indicates the
capability of several strains of bacteria and fungi for degrading caffeine and strains of
Pseudomonas are known to be the most potent in terms of caffeine degradation.
Woolfolk (1975) was the first to investigate caffeine degradation by Pseudomonas
putida. Since then, several caffeine degrading bacteria, such as Pseudomonas
cepacia, were isolated which demethylate caffeine to yield 3,7-dimethylxanthine,
which is further catabolised to NH3 and CO2. Biotechnological route of decaffeination
serves a better alternative both in terms of consumer health and sensory properties for
which these beverages are consumed. Studies in this area have since large been
concentrating on the production of caffeine free plants through genetic engineering
techniques like gene knock out, gene silencing etc (Keya et.al., 2003, Ogita et.al.,
2004). However these techniques have not reached a stage where they can be applied
at a massive scale. Even then a major question lies in the application of these
technologies on a scale of replacing at least a part of the 2.34 million hectares of tea
plantations around the world. Decaffeinated products have a niche market and
complete decaffeination is not revered by al the consumers. A low caffeine product
may be preferred to a no caffeine product for enjoying health benefits as well as the
refreshing effects of the caffeine in the beverages and food products. Enzymatic
biodecaffeination offers a control over the extent and scale of decaffeination.
265
ePrin
t@CFT
RI
A Biotechnological Approach for decaffeination. Chapter 5
Moreover this process does not include genetic modification of the caffeine
containing plants leaving the defense system of the plant intact.
Studies on the development of a biodecaffeination process using immobilized
cells of Pseudomonas alcaligenes MTCC 5264 isolated in our laboratory (Sarath et.
al., 2005) showed promising results. However, there was a detrimental effect of the
organism on the final product quality. Similarly Schwimmer and Kurtzman (1972)
have reported the decaffeination of coffee infusion by Penicillium roquefortii. Haas
and Stieglitz (1980) have reported the decaffeination of aqueous caffeine-containing
liquids, such as coffee extracts, with Pseudomonad microorganisms.
All these processes have been limited to laboratory scale studies and their
commercial exploitation is not possible as the live microbial cells would utilize
simple substrates present in the coffee or tea extracts leading to degradation of the
quality of the products. Therefore, enzymatic processes for decaffeination are
advantageous over whole cell based processes due to the specificity of the enzymes
only to caffeine and other methyl xanthines.
In bacteria (Pseudomonas), caffeine is initially converted into theobromine
and paraxanthine parallely by demethylases. Although the enzymes involved in the
degradation of caffeine by microorganisms have been reported in literature (Blecher
and Lingens, 1977), no enzymatic process has been successful as yet, owing to the
high instability of the caffeine demethylase, a rate limiting enzyme in the pathway of
caffeine degradation. The enzyme involved in the N-demethylation of caffeine, a
demethylase has not been characterized till date due to its very high lability even
under storage at 4-8oC. Yano and Mazzafera (1999), attempted to purify caffeine
266
ePrin
t@CFT
RI

A Biotechnological Approach for decaffeination. Chapter 5
demethylase but found that the purified enzyme was labile and it rapidly lost its
activity. It has been observed that the use of cryoprotectants and freeze drying to low
moisture contents improved the stability of the enzyme (Sideso et. al., 2001). In
general, the caffeine degrading enzymes are very labile and more studies are required
to improve the stability of the enzymes, which will help in developing a specific
process for caffeine degradation. In mixed culture consortium belonging to Klebsiella
sp. and Rhodococcus sp., caffeine was directly oxidized by the enzyme caffeine
oxidase at the C-8 position leading to the formation of 1,3,7-trimethyluric acid and
this process did not have demethylation steps. Only partial characterization of this
enzyme is available (Madhyasta and Sridhar 1998, Madhyasta et.al., 1999).
Though enzymes involved in degradation of caffeine are known, in vitro
enzymatic studies for caffeine degradation are not yet reported. Since demethylase
enzymes are not very stable more studies on enzyme stability and biochemical
characterization are to be carried out. The development of an enzymatic Bio-
decaffeination process for tea and coffee requires many inhibitory factors to be
overcome like protein-polyphenol complexes (Karl et. al., 1996; Elisabeth et. al.,
2004) and caffeine–polyphenol interactions (Nicola, et.al., 1996; Charlton et.al.,
2000) which tend to drastically limit the success of this process by inhibiting the
enzyme activities and the availability of caffeine to the enzymes. Therefore this area
of coffee biotechnology, towards the development of an enzymatic decaffeination
process thus still lies under explored.
During our studies on biodecaffeination, we have found that the demethylase
activities could be maintained in the cell free extracts (CFE) of P. alcaligenes MTCC
267
ePrin
t@CFT
RI
A Biotechnological Approach for decaffeination. Chapter 5
5264 by addition of stabilizing agents to the CFE. The successful isolation,
identification and stabilization of caffeine demethylase and the other enzymes
involved in caffeine degradation by P. alcaligenes MTCC 5264 is described in detail
in chapter 4 of this thesis resulted in the development of biodecaffeination processes
for coffee and tea during fermentation which are reported in this chapter.
268
ePrin
t@CFT
RI
A Biotechnological Approach for decaffeination. Chapter 5
5.3. MATERIALS AND METHODS:
Caffeine, theobromine, lysozyme, Tris, methyl xanthine standards and (+)
catechin were procured from M/s Sigma-Aldrich, St. Louis, USA. Caffeine (LR
Grade), uric acid standard, urea standard were purchased from Sisco Research
laboratories, Mumbai, India. Peptone and yeast extract were from HiMedia labs,
Mumbai, India. All other reagents were of the highest purity and were procured from
standard sources. Analytical grade glycine, glycerol, HPLC grade methanol,
magnesium oxide, ammonium sulphate, potassium dihydrogen orthophosphate and
other chemicals were procured from Qualigenes Fine Chemicals, Mumbai, India.
Coffee beans were procured from the local market. Black tea dhools were kind gifts
from Tantea Industries, Gudalur and AVT Natural Products, Chennai, India.
5.3.1. Biomass production:
A loop full of an actively growing culture of P. alcaligenes MTCC 5264 was
inoculated into sucrose growth medium (containing in g/L of the following
components: sucrose, 20.0; ammonium aulphate, 3.0; potassium dihydrogen ortho
phosphate, 1.5; yeast extract, 3.0 and peptone, 1.5 at a pH of 6.8) and incubated at
30± 2o C on a rotary shaker at 150 rpm. Caffeine was dosed after 48 hours of growth
and further incubated till 96 hours. Samples were drawn at every 12 hours and the
growth and enzyme production were checked. Growth was determined by recording
the absorbance of the culture broth against a sterile broth blank in a
spectrophotometer set at 600 nm. The induction of the biodecaffeinating enzymes in
the cells was determined by analysis of residual caffeine in the broth by HPLC. After
269
ePrin
t@CFT
RI
A Biotechnological Approach for decaffeination. Chapter 5
the caffeine was completely degraded in the medium, the biomass was harvested by
centrifugation at 12000 g for 30 minutes at 4oC to obtain a pellet of the biomass. The
biomass was washed in PBS to rid it off the media components.
5.3.2. Isolation of biodecaffeinating enzymes:
Induced cells of P. alcaligenes MTCC 5264 were harvested by centrifugation
at 12,000 g for 30 minutes at 4oC. The biomass pellet was washed several times with
ice cold buffer (Tris-Cl, 50 mM; pH 6.8) and frozen at –20oC. 10 grams of the frozen
pellet was thawed into 100 ml of Lysis buffer containing 2 mg/ml of lysozyme, 1mM
PMSF, 0.1mM DTT and 15%v/v of glycerol at 37oC in a water bath (Julabo,
Germany) for 1 hour. The lysate was then centrifuged at 12,000 g for 30 minutes at
4oC in a refrigerated centrifuge (Kubota, Japan) to separate the cell debris. The
supernatant obtained was designated as the cell free extract (CFE) was stored frozen
at -200C in 10ml aliquots till further use. Required amounts of the CFE was thawed
on ice before use and used for the experiments.
5.3.3. Biodecaffeination studies:
5.3.3.1. Biodecaffeination of pure caffeine solutions:
Biodecaffeination of pure caffeine solution by the enzymes was carried out by
incubating 1ml of the CFE with 1ml of caffeine (10mM) and 300µl of NADPH
(1mM) in 7.7ml of Tris-Cl Buffer (100mM, pH 6.8) and incubation at 30±2oC for 2
hours. Samples were drawn at every 30 minutes and analyzed for the metabolites by
HPLC.
270
ePrin
t@CFT
RI
A Biotechnological Approach for decaffeination. Chapter 5
5.3.3.2. Biodecaffeination with immobilized enzymes:
a) Immobilization of enzymes:
Sodium alginate was used for the immobilization of the enzymes. 10 ml of the
enzyme extract was mixed with 90 ml of the matrix prepared at 3% w/v concentration
and dropped into curing solutions consisting of calcium chloride (200mM). The beads
were washed off the curing solutions with buffer and packed into glass columns of
25 mm x 500 mm dimensions. The efficiency of biodecaffeination by the
immobilized enzymes was tested by passing pure caffeine solution (1g/L) and
determining the caffeine degradation at different time intervals. Several parameters
for decaffeination like flow rate, retention time, packed bed volume, extract to packed
bed volume ratio, temperature, pH and aeration which influence the caffeine
degradation were optimized.
b) Biodecaffeination of green coffee beans:
Green coffee beans were packed into an extractor and water heated to 800C
was dripped over the beans. The extract was collected after cooling over a cooling
coil and was passed through a bioreactor containing immobilized enzymes
(Fig.5.3.3.2). The caffeine content in the extract was checked at regular intervals by
HPLC analysis of the sample and the degradation products were also identified by
comparing with standards. The decaffeination process was terminated after 99% of
the initial caffeine was degraded. The extract was then concentrated and reabsorbed
into the beans after which the beans were dried and roasted.
271
ePrin
t@CFT
RI
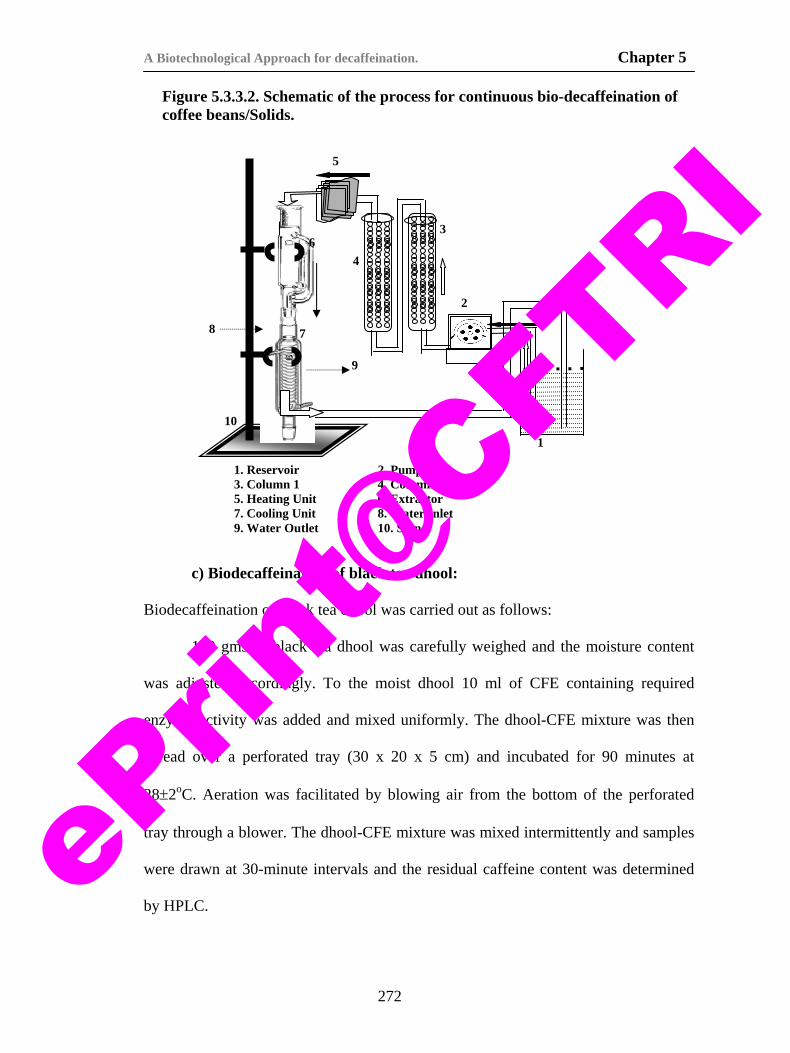
A Biotechnological Approach for decaffeination. Chapter 5
Figure 5.3.3.2. Schematic of the process for continuous bio-decaffeination of coffee beans/Solids.
10
8
9
6
7
5
4
1
3
2
1. Reservoir 2. Pump 3. Column 1 4. Column 2 5. Heating Unit 6. Extractor 7. Cooling Unit 8. Water Inlet 9. Water Outlet 10. Stand
c) Biodecaffeination of black tea dhool:
Biodecaffeination of black tea dhool was carried out as follows:
100 gms of black tea dhool was carefully weighed and the moisture content
was adjusted accordingly. To the moist dhool 10 ml of CFE containing required
enzyme activity was added and mixed uniformly. The dhool-CFE mixture was then
spread over a perforated tray (30 x 20 x 5 cm) and incubated for 90 minutes at
28±2oC. Aeration was facilitated by blowing air from the bottom of the perforated
tray through a blower. The dhool-CFE mixture was mixed intermittently and samples
were drawn at 30-minute intervals and the residual caffeine content was determined
by HPLC.
272
ePrin
t@CFT
RI
A Biotechnological Approach for decaffeination. Chapter 5
A flow chart of the Biodecaffeination of tea is given below.
Flow sheet for bio-decaffeination of tea during fermentation:
Fermentation (shake flask) (72-96 hrs)
Biomass pellet (Centrifugation)
Enzyme extraction (Lysis/Centrifugation)
Enzyme Addition (10000 U enzyme to 100 gm dhool)
Decaffeination (1-2 Hrs)
Bio-decaffeinated product
5.3.4. Optimization of parameters for biodecaffeination of tea:
Tea dhool is rich in polyphenols, proteins and caffeine apart from a variety of
biochemicals. We target the biodecaffeination of tea during the fermentation process
to synchronize tea fermentation with biodecaffeination to make the process natural.
Moreover, biodecaffeination during fermentation adds to the preservation of quality
of tea as well as the process economics to the tea manufacturers. Several factors
which tend to inhibit the biodecaffeination during this stage need to be overcome.
Therefore, parameters like moisture, aeration, intermittent enzyme addition and
mixing were optimized and inhibitory interactions of proteins with polyphenols,
caffeine-polyphenol interactions which directly influence the biodecaffeination
process were minimized using different approaches.
273
ePrin
t@CFT
RI
A Biotechnological Approach for decaffeination. Chapter 5
5.3.5. Analytical:
Sample preparation for caffeine analysis in the dhool was done according to
the ISO method of caffeine analysis. In brief, 10 grams of the moist dhool was
weighed carefully and dried in a hot air oven till the moisture content of the dhool is
reduced to below 5% w/w. The sample was then ground to a fine powder using a
mortar and pestle, sieved through a 100-mesh sieve and the finely powdered tea was
carefully weighed to the nearest 1 gram. This sample was placed in a sample bottle
and 300 ml of distilled water was added to the sample. 4.5-5.0 grams of magnesium
oxide was added to the bottle and the sample was heated at 90o C for 20 minutes. The
sample was allowed to cool and filtered through a 0.22μm filter. 20μl of the sample
was injected to HPLC and the peak area was recorded. Two caffeine standards
(0.1mg/ml and 1mg/ml) were also prepared and injected prior to analysis of the
sample. 20μl of the standard caffeine was injected to HPLC connected to a Luna C18
column (4.6 x 250 mm) set at a flow rate of 1ml/min with water and methanol in the
ratio of 70:30 as the mobile phase. The peak area of the caffeine was recorded with a
photo diode array detector set at 280 nm. Caffeine concentration in the sample was
calculated using the equation 1:
Ws x dilution factor x Ps x Ccf Cs= ------------------------------------ …….. Eqn:1. Pcf Where Cs= Concentration of caffeine in the sample Ws= Weight of sample Ps = Peak area of sample Ccf = Concentration of Standard Caffeine Pcf = Peak area of standard caffeine
274
ePrin
t@CFT
RI
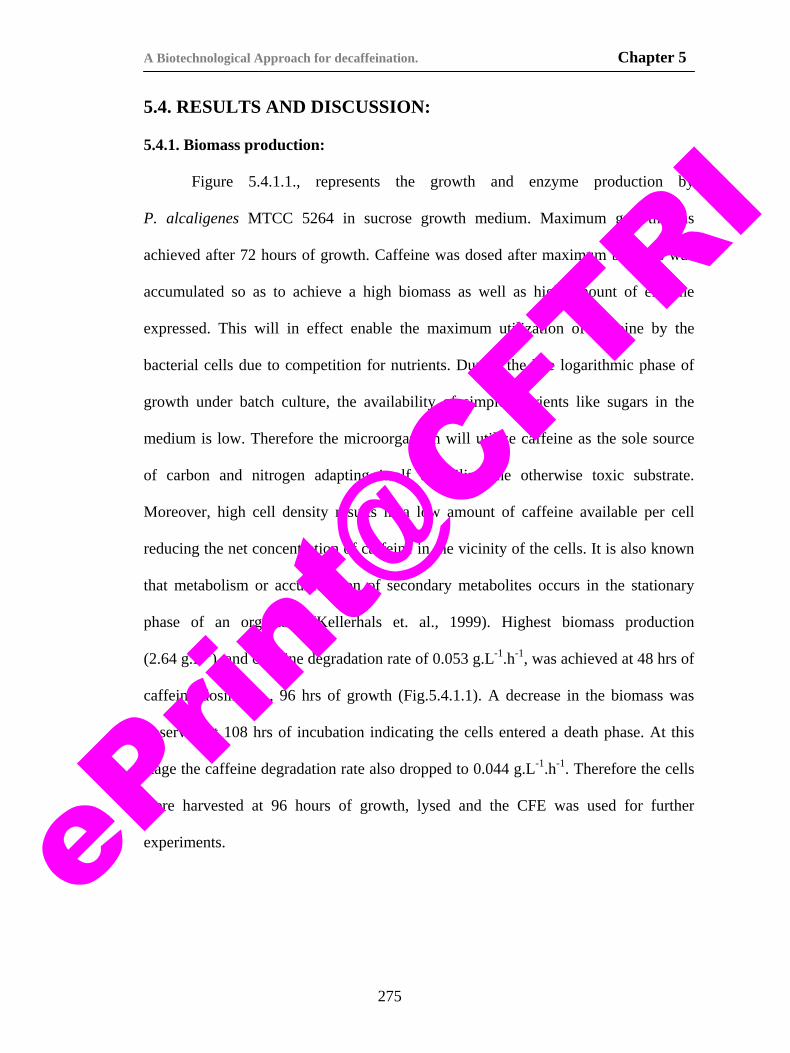
A Biotechnological Approach for decaffeination. Chapter 5
5.4. RESULTS AND DISCUSSION: 5.4.1. Biomass production:
Figure 5.4.1.1., represents the growth and enzyme production by
P. alcaligenes MTCC 5264 in sucrose growth medium. Maximum growth was
achieved after 72 hours of growth. Caffeine was dosed after maximum biomass was
accumulated so as to achieve a high biomass as well as high amount of enzyme
expressed. This will in effect enable the maximum utilization of caffeine by the
bacterial cells due to competition for nutrients. During the late logarithmic phase of
growth under batch culture, the availability of simple nutrients like sugars in the
medium is low. Therefore the microorganism will utilize caffeine as the sole source
of carbon and nitrogen adapting itself to utilize the otherwise toxic substrate.
Moreover, high cell density results in a low amount of caffeine available per cell
reducing the net concentration of caffeine in the vicinity of the cells. It is also known
that metabolism or accumulation of secondary metabolites occurs in the stationary
phase of an organism (Kellerhals et. al., 1999). Highest biomass production
(2.64 g.L-1) and caffeine degradation rate of 0.053 g.L-1.h-1, was achieved at 48 hrs of
caffeine dosing i.e., 96 hrs of growth (Fig.5.4.1.1). A decrease in the biomass was
observed at 108 hrs of incubation indicating the cells entered a death phase. At this
stage the caffeine degradation rate also dropped to 0.044 g.L-1.h-1. Therefore the cells
were harvested at 96 hours of growth, lysed and the CFE was used for further
experiments.
275
ePrin
t@CFT
RI
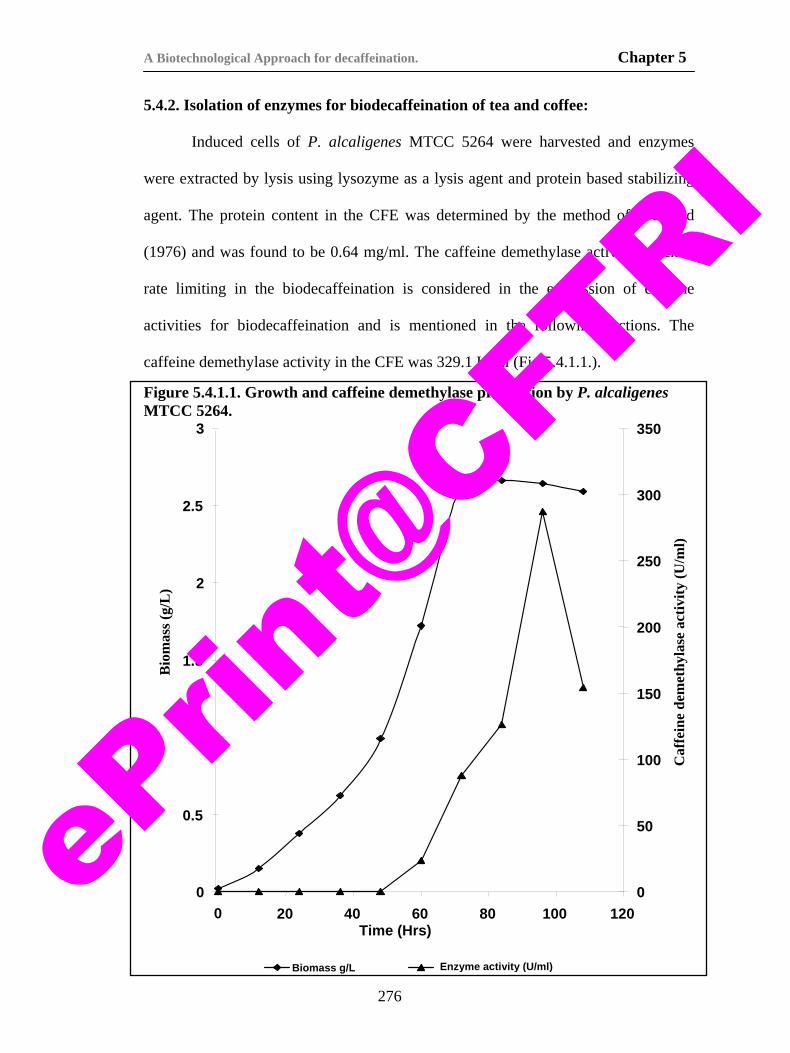
A Biotechnological Approach for decaffeination. Chapter 5
5.4.2. Isolation of enzymes for biodecaffeination of tea and coffee:
Induced cells of P. alcaligenes MTCC 5264 were harvested and enzymes
were extracted by lysis using lysozyme as a lysis agent and protein based stabilizing
agent. The protein content in the CFE was determined by the method of Bradford
(1976) and was found to be 0.64 mg/ml. The caffeine demethylase activity which is
rate limiting in the biodecaffeination is considered in the expression of enzyme
activities for biodecaffeination and is mentioned in the following sections. The
caffeine demethylase activity in the CFE was 329.1 U/ml (Fig.5.4.1.1.).
Enzyme activity (U/ml)Biomass g/L
Caf
fein
e de
met
hyla
se a
ctiv
ity (U
/ml)
300
250
200
150
100
50
0
Bio
mas
s (g/
L)
12040 60 80 100Time (Hrs)
200
2.5
2
1.5
1
0.5
0
Figure 5.4.1.1. Growth and caffeine demethylase production by P. alcaligenes MTCC 5264.
3503
276
ePrin
t@CFT
RI
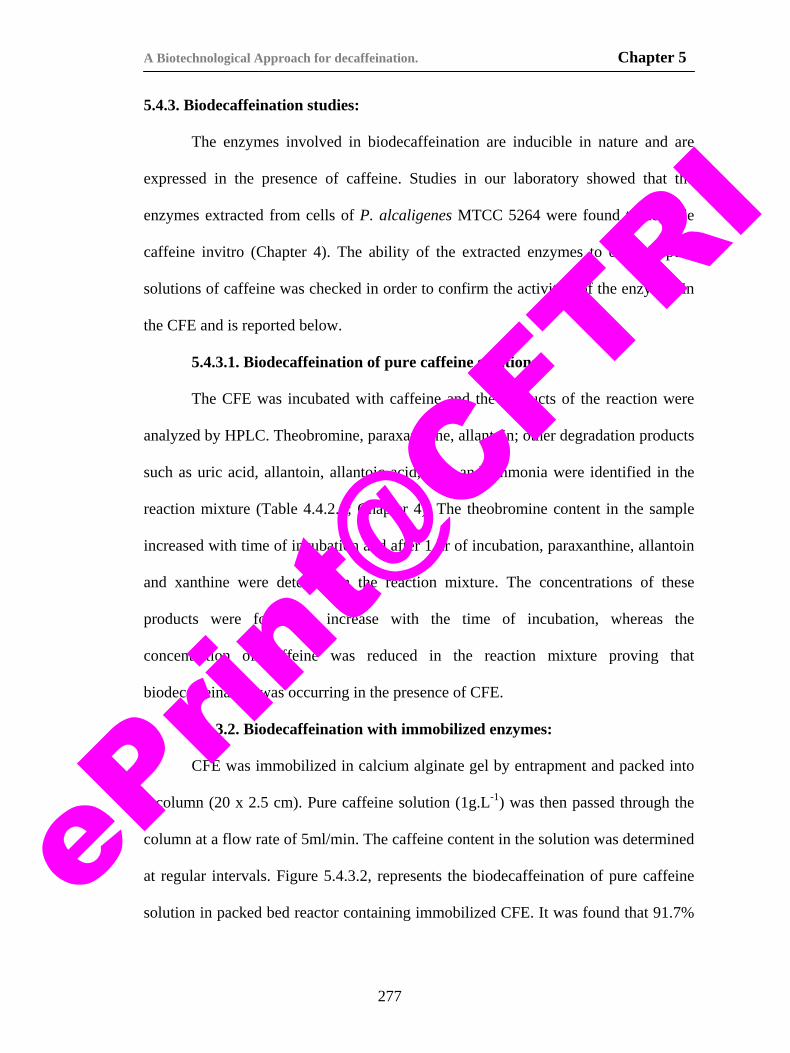
A Biotechnological Approach for decaffeination. Chapter 5
5.4.3. Biodecaffeination studies:
The enzymes involved in biodecaffeination are inducible in nature and are
expressed in the presence of caffeine. Studies in our laboratory showed that the
enzymes extracted from cells of P. alcaligenes MTCC 5264 were found to degrade
caffeine invitro (Chapter 4). The ability of the extracted enzymes to degrade pure
solutions of caffeine was checked in order to confirm the activities of the enzymes in
the CFE and is reported below.
5.4.3.1. Biodecaffeination of pure caffeine solutions:
The CFE was incubated with caffeine and the products of the reaction were
analyzed by HPLC. Theobromine, paraxanthine, allantoin; other degradation products
such as uric acid, allantoin, allantoic acid, urea and ammonia were identified in the
reaction mixture (Table 4.4.2.1; Chapter 4). The theobromine content in the sample
increased with time of incubation and after 1 hr of incubation, paraxanthine, allantoin
and xanthine were detected in the reaction mixture. The concentrations of these
products were found to increase with the time of incubation, whereas the
concentration of caffeine was reduced in the reaction mixture proving that
biodecaffeination was occurring in the presence of CFE.
5.4.3.2. Biodecaffeination with immobilized enzymes:
CFE was immobilized in calcium alginate gel by entrapment and packed into
a column (20 x 2.5 cm). Pure caffeine solution (1g.L-1) was then passed through the
column at a flow rate of 5ml/min. The caffeine content in the solution was determined
at regular intervals. Figure 5.4.3.2, represents the biodecaffeination of pure caffeine
solution in packed bed reactor containing immobilized CFE. It was found that 91.7%
277
ePrin
t@CFT
RI
A Biotechnological Approach for decaffeination. Chapter 5
biodecaffeination was achieved within 2 hours of incubation and 93.6%
biodecaffeination was achieved after 3 hours of incubation.
Res
idua
l Caf
fein
e (g
.L-1
)
Time (minutes)200150100500
100
90
80
70
60
50
40
30
10
20
0
Figure 5.4.3.2. Biodecaffeination of pure caffeine by immobilized CFE of P. alcaligenes MTCC 5264.
5.4.3.3. Biodecaffeination of green coffee beans:
Biodecaffeination of green coffee beans was carried out in an extraction and
biodecaffeination system shown in Figure 5.4.3.3. With the optimized conditions of
278
ePrin
t@CFT
RI
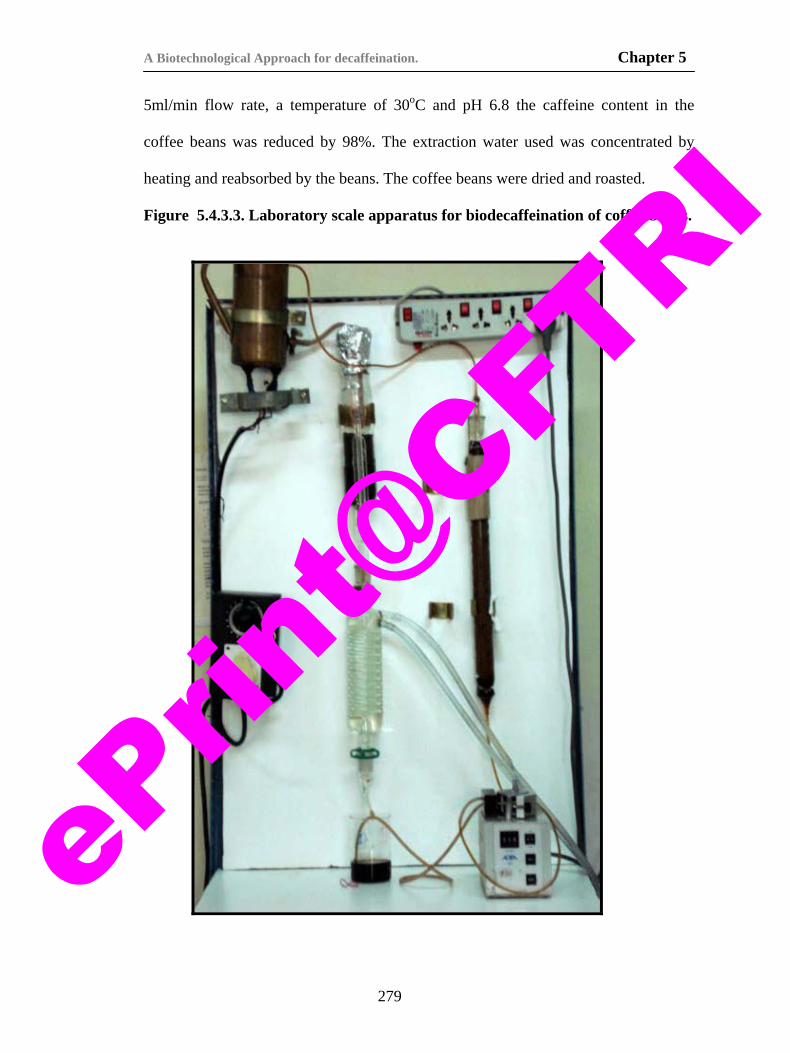
A Biotechnological Approach for decaffeination. Chapter 5
5ml/min flow rate, a temperature of 30oC and pH 6.8 the caffeine content in the
coffee beans was reduced by 98%. The extraction water used was concentrated by
heating and reabsorbed by the beans. The coffee beans were dried and roasted.
Figure 5.4.3.3. Laboratory scale apparatus for biodecaffeination of coffee beans.
279
ePrin
t@CFT
RI
A Biotechnological Approach for decaffeination. Chapter 5
5.4.4. Biodecaffeination of black tea dhool:
Tea dhool is a complex mixture of several components like polyphenols,
caffeine, fiber, condensed tannins, etc. which influence the enzyme activity, caffeine
availability to the enzymes and the degradation of caffeine in tea dhool. The color,
flavor and aroma of made tea are due to the formation of several complex mixtures
like theaflavins, thearubigins and caffeine-theaflavin complexes. Therefore, several
parameters need to be optimized for efficient biodecaffeination of tea dhool.
Parameters, which were considered crucial for caffeine removal by the enzymes, were
optimized for the development of the biodecaffeination process. Aeration, enzyme
concentration, caffeine availability in the dhool and prevention of the formation of
inhibitory factors like caffeine-polyphenol and protein polyphenol complexes in the
tea dhool during biodecaffeination were found to be important factors and were
optimized.
5.4.4.1. Optimization of parameters for biodecaffeination:
a) Effect of initial enzyme activity on biodecaffeination of tea dhool:
The activity of caffeine degrading enzymes is critical for achieving required
degree of biodecaffeination. It is known that caffeine demethylase is the rate-limiting
enzyme in the degradation of caffeine by bacteria (Asano et. al., 1993) and the
activity of caffeine demethylase in the CFE plays an important role in the
biodecaffeination. Therefore, caffeine demethylase enzyme activities in the CFE
largely control the whole process of decaffeination.
280
ePrin
t@CFT
RI
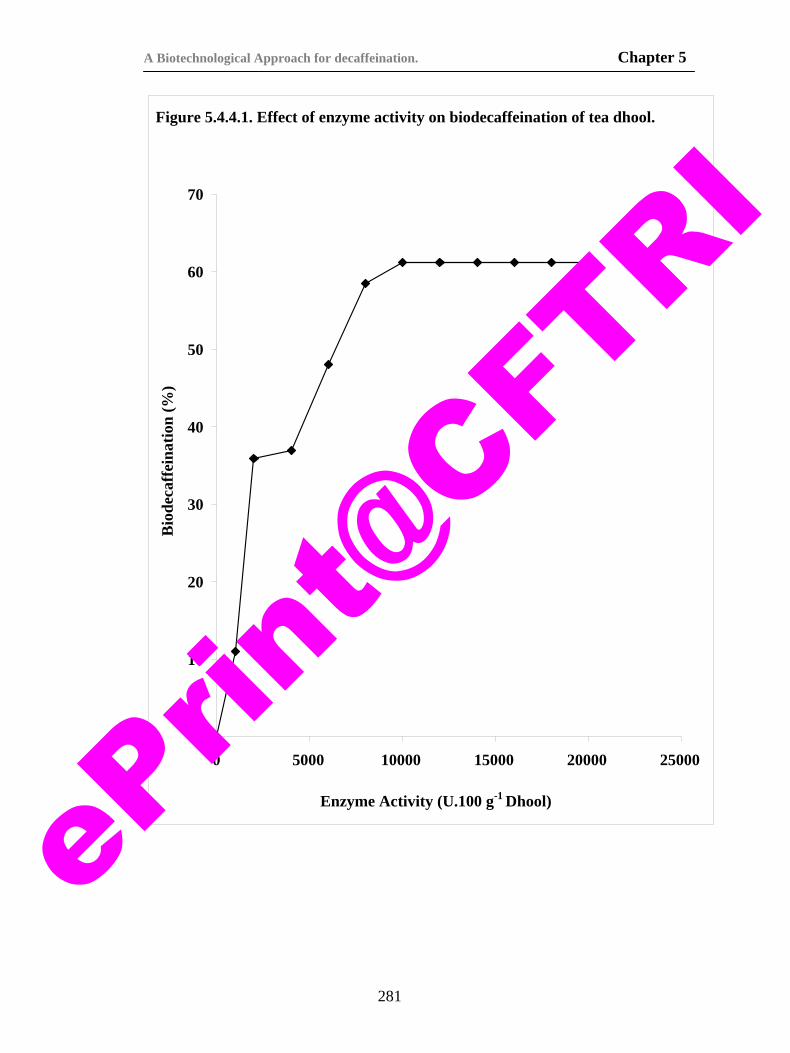
A Biotechnological Approach for decaffeination. Chapter 5
Bio
deca
ffei
natio
n (%
)
Enzyme Activity (U.100 g-1 Dhool)
2500020000150005000 100000
70
60
50
40
30
20
10
0
Figure 5.4.4.1. Effect of enzyme activity on biodecaffeination of tea dhool.
281
ePrin
t@CFT
RI
A Biotechnological Approach for decaffeination. Chapter 5
It was found that maximum decaffeination could be achieved by adding
caffeine demethylase at 10000 U/100 gms of dhool (Fig. 5.4.4.1.). The caffeine
content in the test dhool was found to be 2.986% w/w corresponding to 153.76mM of
caffeine.
With an enzyme activity of 1000 U/100 gms only 11.04% of the initial caffeine was
degraded in 90 minutes (Fig. 5.4.4.1.). Biodecaffeination increased to 35.86% as the
concentration of the enzyme was increased to 2000 U.100g-1 dhool. The
corresponding values for 4000, 6000 and 8000 U.100g-1 dhool were 36.92, 47.99 and
58.49% respectively.
A maximum of 61.21% biodecaffeination (corresponding to 76.78mM of
caffeine degraded) was observed within 90 minutes using an enzyme activity of
10000 U.100g-1 dhool. The reason for very low caffeine degradation in the dhool at
low enzyme concentrations might be attributed to the high caffeine concentration in
the sample requiring high enzyme activities. At enzyme activities above 10000 Units,
no further caffeine degradation was observed probably owing to the non availability
of caffeine to the enzyme.
By the end of 90 minutes most of the moisture in the dhool would be lost due
to aeration leading to a drought effect in the dhool. This usually reduces the activity
of polyphenol oxidase activity in the dhool in normal fermentation processes (Ritcher,
1934; Lipmann, 1943) and a similar effect is observed on caffeine demethylase
activity in the dhool.
282
ePrin
t@CFT
RI
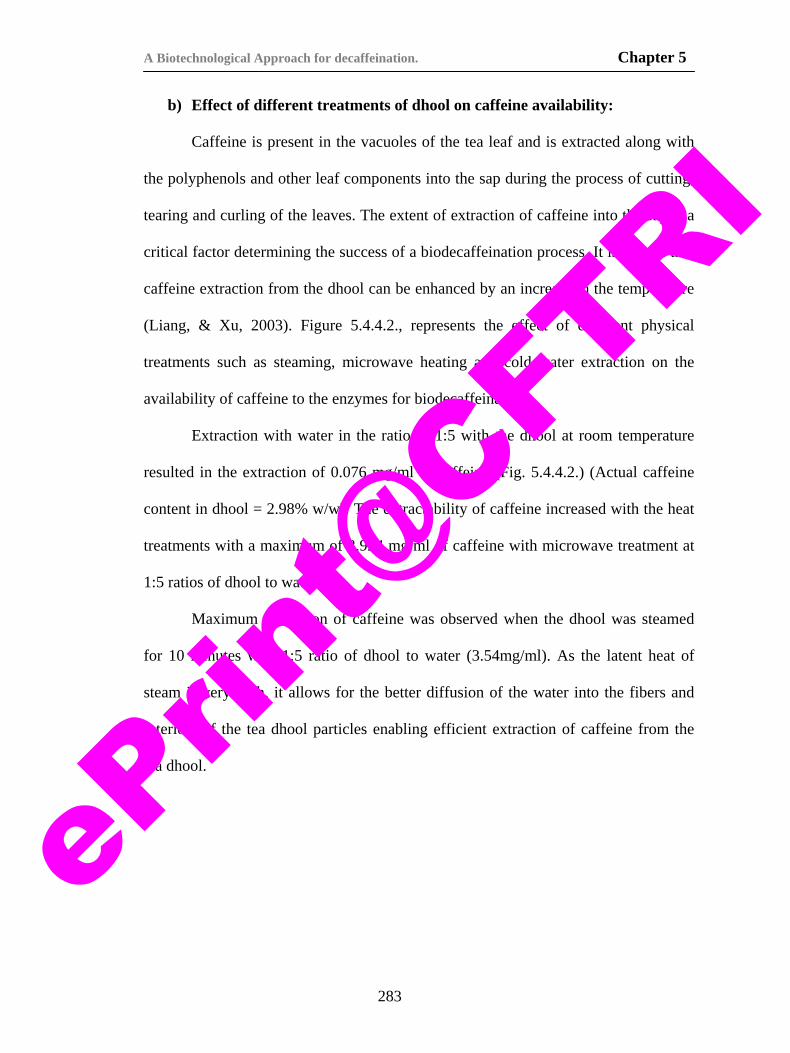
A Biotechnological Approach for decaffeination. Chapter 5
b) Effect of different treatments of dhool on caffeine availability:
Caffeine is present in the vacuoles of the tea leaf and is extracted along with
the polyphenols and other leaf components into the sap during the process of cutting,
tearing and curling of the leaves. The extent of extraction of caffeine into the sap is a
critical factor determining the success of a biodecaffeination process. It is known that
caffeine extraction from the dhool can be enhanced by an increase in the temperature
(Liang, & Xu, 2003). Figure 5.4.4.2., represents the effect of different physical
treatments such as steaming, microwave heating and cold water extraction on the
availability of caffeine to the enzymes for biodecaffeination.
Extraction with water in the ratio of 1:5 with the dhool at room temperature
resulted in the extraction of 0.076 mg/ml of caffeine (Fig. 5.4.4.2.) (Actual caffeine
content in dhool = 2.98% w/w). The extractability of caffeine increased with the heat
treatments with a maximum of 2.924 mg/ml of caffeine with microwave treatment at
1:5 ratios of dhool to water.
Maximum extraction of caffeine was observed when the dhool was steamed
for 10 minutes with 1:5 ratio of dhool to water (3.54mg/ml). As the latent heat of
steam is very high, it allows for the better diffusion of the water into the fibers and
interiors of the tea dhool particles enabling efficient extraction of caffeine from the
tea dhool.
283
ePrin
t@CFT
RI
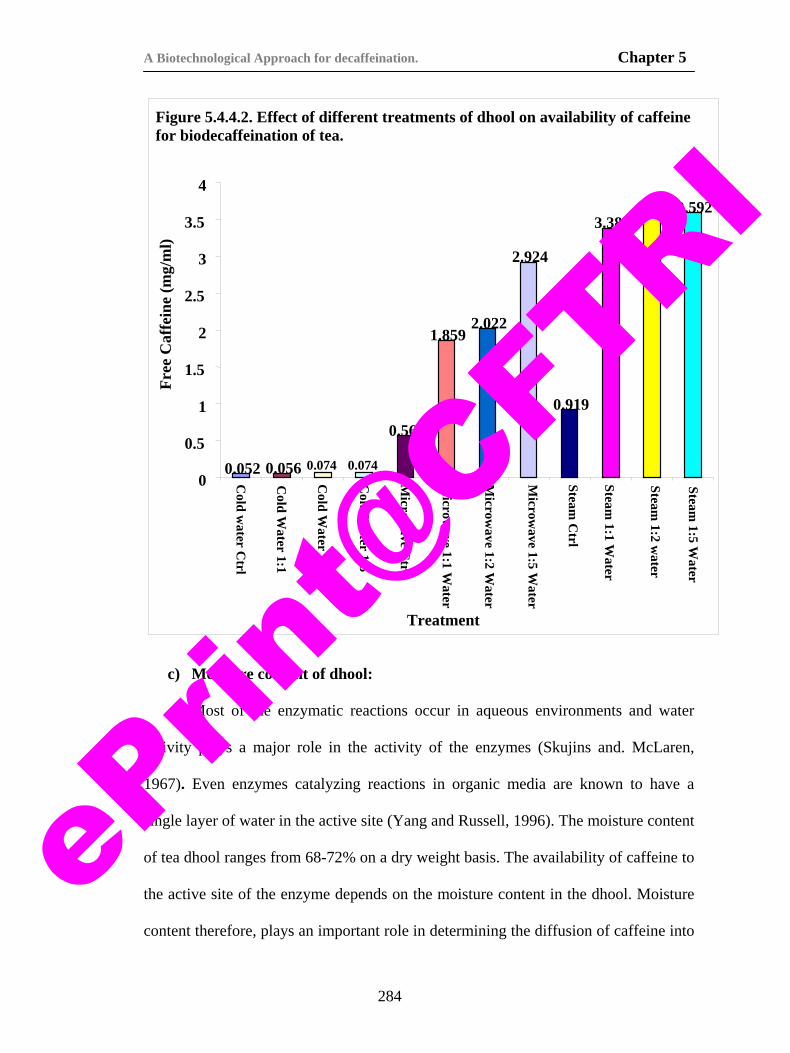
A Biotechnological Approach for decaffeination. Chapter 5
Figure 5.4.4.2. Effect of different treatments of dhool on availability of caffeine for biodecaffeination of tea.
0.052 0.056 0.074 0.074
0.564
1.8592.022
2.924
0.919
3.3833.543 3.592
0
0.5
1
1.5
2
2.5
3
3.5
4
Cold w
ater Ctrl
Cold W
ater 1:1
Cold W
ater 1:2
Cold W
ater 1:5
Microw
ave Ctrl
Microw
ave 1:1 Water
Microw
ave 1:2 Water
Microw
ave 1:5 Water
Steam C
trl
Steam 1:1 W
ater
Steam 1:2 w
ater
Steam 1:5 W
ater
Treatment
Free
Caf
fein
e (m
g/m
l)
c) Moisture content of dhool:
Most of the enzymatic reactions occur in aqueous environments and water
activity plays a major role in the activity of the enzymes (Skujins and. McLaren,
1967). Even enzymes catalyzing reactions in organic media are known to have a
single layer of water in the active site (Yang and Russell, 1996). The moisture content
of tea dhool ranges from 68-72% on a dry weight basis. The availability of caffeine to
the active site of the enzyme depends on the moisture content in the dhool. Moisture
content therefore, plays an important role in determining the diffusion of caffeine into
284
ePrin
t@CFT
RI
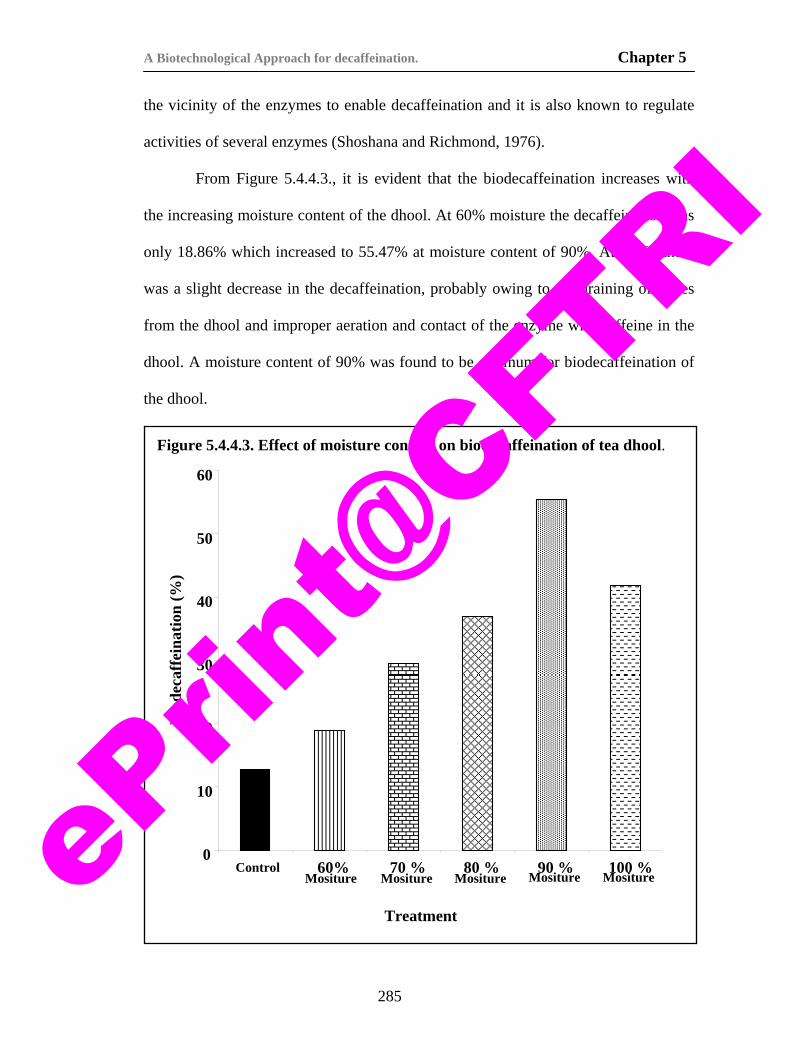
A Biotechnological Approach for decaffeination. Chapter 5
the vicinity of the enzymes to enable decaffeination and it is also known to regulate
activities of several enzymes (Shoshana and Richmond, 1976).
From Figure 5.4.4.3., it is evident that the biodecaffeination increases with
the increasing moisture content of the dhool. At 60% moisture the decaffeination was
only 18.86% which increased to 55.47% at moisture content of 90%. At 100% there
was a slight decrease in the decaffeination, probably owing to the draining of juices
from the dhool and improper aeration and contact of the enzyme with caffeine in the
dhool. A moisture content of 90% was found to be optimum for biodecaffeination of
the dhool.
Bio
deca
ffei
natio
n (%
)
Treatment
100 %Mositure
90 %Mositure
80 %Mositure
70 %Mositure
60%Mositure
Control
60
50
40
30
20
10
0
Figure 5.4.4.3. Effect of moisture content on biodecaffeination of tea dhool.
285
ePrin
t@CFT
RI
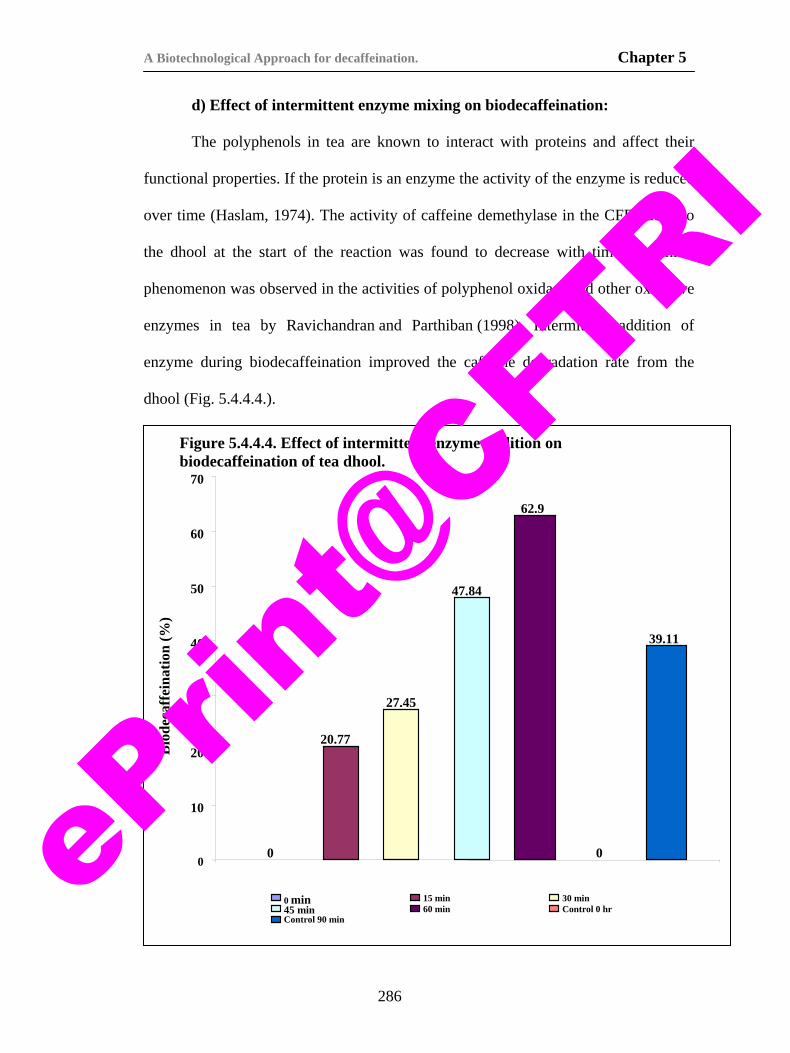
A Biotechnological Approach for decaffeination. Chapter 5
d) Effect of intermittent enzyme mixing on biodecaffeination:
The polyphenols in tea are known to interact with proteins and affect their
functional properties. If the protein is an enzyme the activity of the enzyme is reduced
over time (Haslam, 1974). The activity of caffeine demethylase in the CFE added to
the dhool at the start of the reaction was found to decrease with time. A similar
phenomenon was observed in the activities of polyphenol oxidase and other oxidative
enzymes in tea by Ravichandran and Parthiban (1998). Intermittent addition of
enzyme during biodecaffeination improved the caffeine degradation rate from the
dhool (Fig. 5.4.4.4.).
Figure 5.4.4.4. Effect of intermittent enzyme addition on biodecaffeination of tea dhool.
0
20.77
27.45
47.84
62.9
0
39.11
0
10
20
30
40
50
60
70
Bio
deca
ffei
natio
n (%
)
0 min 15 min 30 min45 min 60 min Control 0 hrControl 90 min
286
ePrin
t@CFT
RI
A Biotechnological Approach for decaffeination. Chapter 5
In the control experiment where CFE was added only at the start of the
biodecaffeination only 39.11% caffeine was degraded in 90 minutes. Addition of
enzyme at different time intervals showed an improved in the total caffeine removal
from the dhool with 47.9 % caffeine degraded within 60 minutes and 62.9 % caffeine
degraded in 90 minutes (Fig.5.4.4.4.). From the above results, it is evident that
enzyme addition at 30 and 60 minutes of incubation will enhance the
biodecaffeination of tea dhool.
287
ePrin
t@CFT
RI
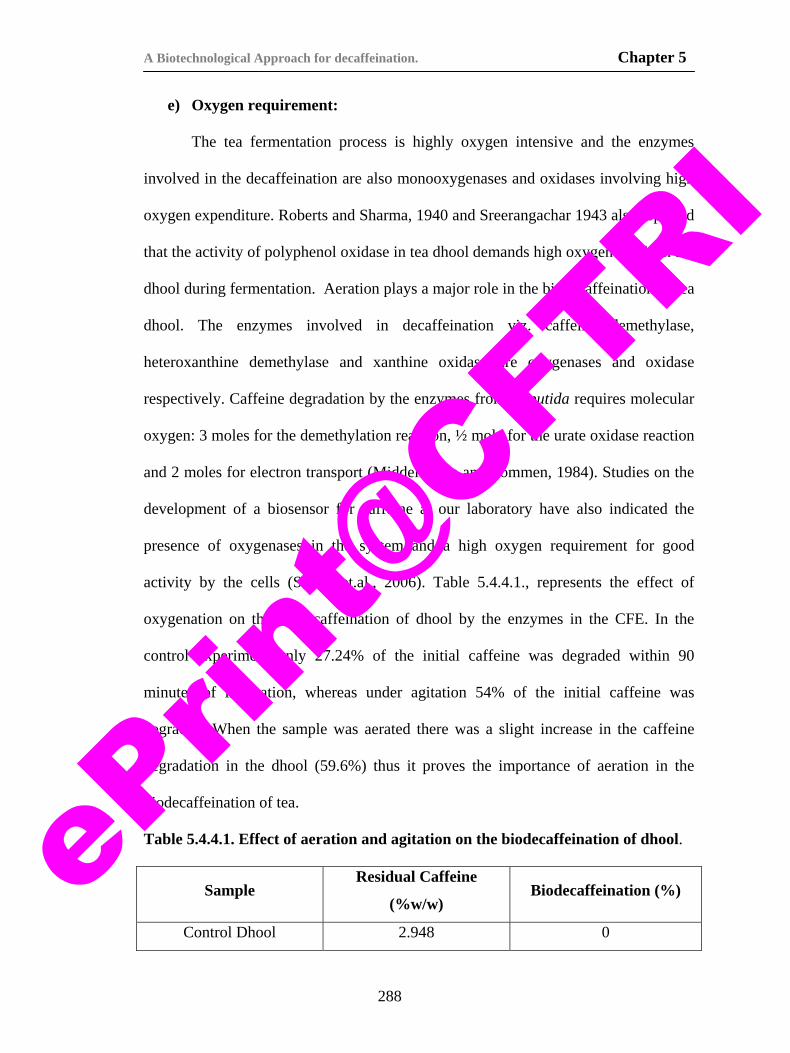
A Biotechnological Approach for decaffeination. Chapter 5
e) Oxygen requirement:
The tea fermentation process is highly oxygen intensive and the enzymes
involved in the decaffeination are also monooxygenases and oxidases involving high
oxygen expenditure. Roberts and Sharma, 1940 and Sreerangachar 1943 also reported
that the activity of polyphenol oxidase in tea dhool demands high oxygen levels in the
dhool during fermentation. Aeration plays a major role in the biodecaffeination of tea
dhool. The enzymes involved in decaffeination viz. caffeine demethylase,
heteroxanthine demethylase and xanthine oxidase are oxygenases and oxidase
respectively. Caffeine degradation by the enzymes from P. putida requires molecular
oxygen: 3 moles for the demethylation reaction, ½ mole for the urate oxidase reaction
and 2 moles for electron transport (Middelhoven and Lommen, 1984). Studies on the
development of a biosensor for caffeine at our laboratory have also indicated the
presence of oxygenases in the system and a high oxygen requirement for good
activity by the cells (Sarath et.al., 2006). Table 5.4.4.1., represents the effect of
oxygenation on the biodecaffeination of dhool by the enzymes in the CFE. In the
control experiment only 27.24% of the initial caffeine was degraded within 90
minutes of incubation, whereas under agitation 54% of the initial caffeine was
degraded. When the sample was aerated there was a slight increase in the caffeine
degradation in the dhool (59.6%) thus it proves the importance of aeration in the
biodecaffeination of tea.
Table 5.4.4.1. Effect of aeration and agitation on the biodecaffeination of dhool.
Sample Residual Caffeine
(%w/w) Biodecaffeination (%)
Control Dhool 2.948 0
288
ePrin
t@CFT
RI
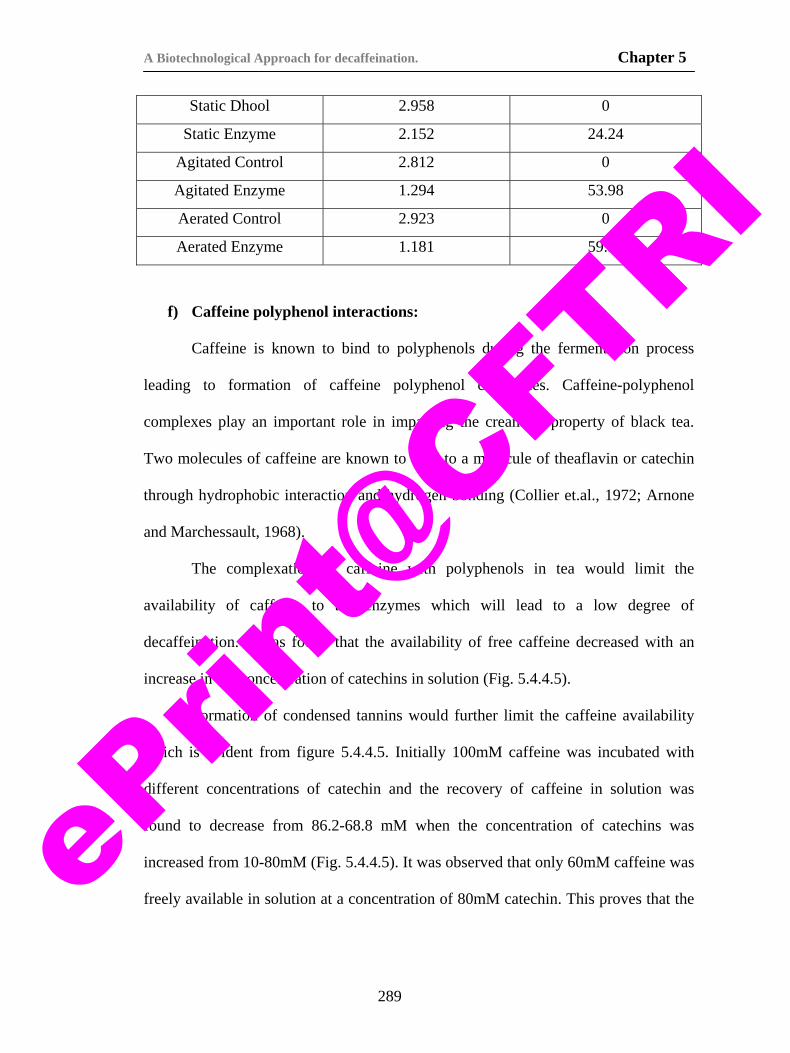
A Biotechnological Approach for decaffeination. Chapter 5
Static Dhool 2.958 0
Static Enzyme 2.152 24.24
Agitated Control 2.812 0
Agitated Enzyme 1.294 53.98
Aerated Control 2.923 0
Aerated Enzyme 1.181 59.59
f) Caffeine polyphenol interactions:
Caffeine is known to bind to polyphenols during the fermentation process
leading to formation of caffeine polyphenol complexes. Caffeine-polyphenol
complexes play an important role in imparting the creaming property of black tea.
Two molecules of caffeine are known to bind to a molecule of theaflavin or catechin
through hydrophobic interaction and hydrogen bonding (Collier et.al., 1972; Arnone
and Marchessault, 1968).
The complexation of caffeine with polyphenols in tea would limit the
availability of caffeine to the enzymes which will lead to a low degree of
decaffeination. It was found that the availability of free caffeine decreased with an
increase in the concentration of catechins in solution (Fig. 5.4.4.5).
Formation of condensed tannins would further limit the caffeine availability
which is evident from figure 5.4.4.5. Initially 100mM caffeine was incubated with
different concentrations of catechin and the recovery of caffeine in solution was
found to decrease from 86.2-68.8 mM when the concentration of catechins was
increased from 10-80mM (Fig. 5.4.4.5). It was observed that only 60mM caffeine was
freely available in solution at a concentration of 80mM catechin. This proves that the
289
ePrin
t@CFT
RI
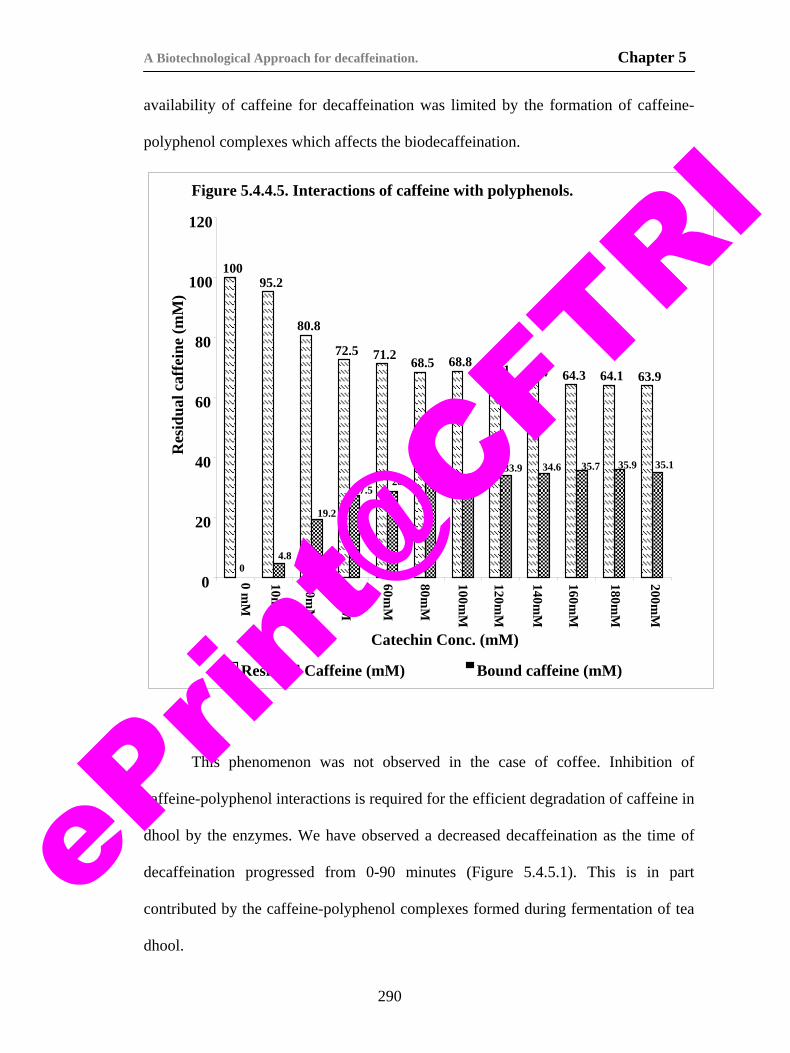
A Biotechnological Approach for decaffeination. Chapter 5
availability of caffeine for decaffeination was limited by the formation of caffeine-
polyphenol complexes which affects the biodecaffeination.
Figure 5.4.4.5. Interactions of caffeine with polyphenols.
10095.2
80.8
72.5 71.2 68.5 68.8 66.1 65.4 64.3 64.1 63.9
0
35.135.935.734.6 33.931.231.528.8
27.5
19.2
4.8
0
20
40
60
80
100
120
0 mM
10mM
20mM
40mM
60mM
80mM
100mM
120mM
140mM
160mM
180mM
200mM
Catechin Conc. (mM)
Res
idua
l caf
fein
e (m
M)
Residual Caffeine (mM) Bound caffeine (mM)
This phenomenon was not observed in the case of coffee. Inhibition of
caffeine-polyphenol interactions is required for the efficient degradation of caffeine in
dhool by the enzymes. We have observed a decreased decaffeination as the time of
decaffeination progressed from 0-90 minutes (Figure 5.4.5.1). This is in part
contributed by the caffeine-polyphenol complexes formed during fermentation of tea
dhool.
290
ePrin
t@CFT
RI
A Biotechnological Approach for decaffeination. Chapter 5
g) Protein polyphenol interactions
Proteins interact with tannins and polyphenols present in foods leading to the
formation of complexes, which inhibit the enzyme activities (Haslam, 1974). The
effect of catechin concentration and the rate of fermentation of tea govern the
activities of externally added enzymes.
Fast fermenting clones of tea have a high rate of inhibition of the enzymes
whereas slow fermentors show a lower inhibition of the enzymes. Biodecaffeination
of tea dhool obtained from two different clones of tea (obtained from Tamilnadu and
Kerala) varying in their fermentation ability showed that biodecaffeination was higher
in the slow fermenting tea whereas the fast fermentor showed a lower
biodecaffeination (Data not shown).
Studies also indicate that the formation of protein-polyphenol complexes is
dependent on the size of the protein, the residues on the protein and also the size of
the condensation products. Haslam (1974) showed that the enzyme α-glucosidase was
inhibited by polyphenols due to complexation and that the inhibition increased as a
function of the size of the condensation products. Small polyphenols like catechins
had little effect compared to larger polyphenols like tannins and theaflavin gallates.
Figure 5.4.4.6., represents the effect of protein polyphenol interactions on the activity
of caffeine degrading enzymes. It was found that as the enzymatic oxidation of the tea
progressed, the caffeine degradation rate slowed down (Fig. 5.4.4.6.). As the time of
incubation progressed the amount of free catechin decreased from 10 mg/ml to 3.23
mg/ml.
291
ePrin
t@CFT
RI
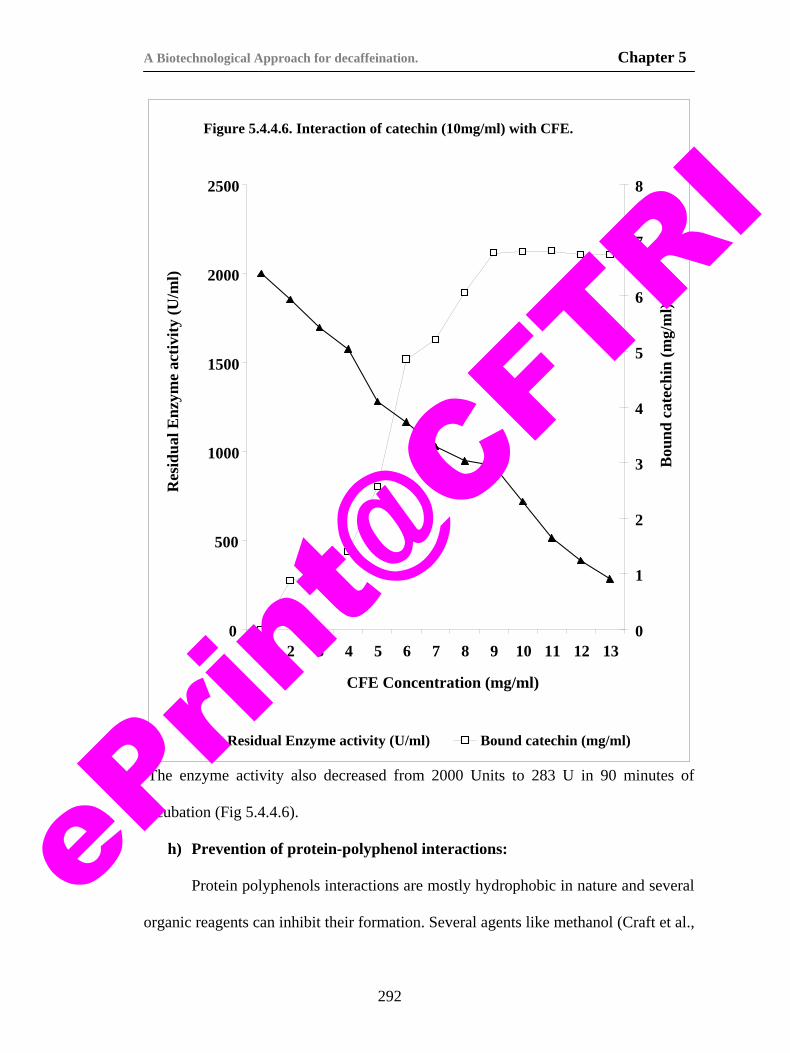
A Biotechnological Approach for decaffeination. Chapter 5
Figure 5.4.4.6. Interaction of catechin (10mg/ml) with CFE.
0
500
1000
1500
2000
2500
1 2 3 4 5 6 7 8 9 10 11 12 13
CFE Concentration (mg/ml)
Res
idua
l Enz
yme
activ
ity (U
/ml)
0
1
2
3
4
5
6
7
8
Bou
nd c
atec
hin
(mg/
ml)
Residual Enzyme activity (U/ml) Bound catechin (mg/ml)
The enzyme activity also decreased from 2000 Units to 283 U in 90 minutes of
incubation (Fig 5.4.4.6).
h) Prevention of protein-polyphenol interactions:
Protein polyphenols interactions are mostly hydrophobic in nature and several
organic reagents can inhibit their formation. Several agents like methanol (Craft et al.,
292
ePrin
t@CFT
RI
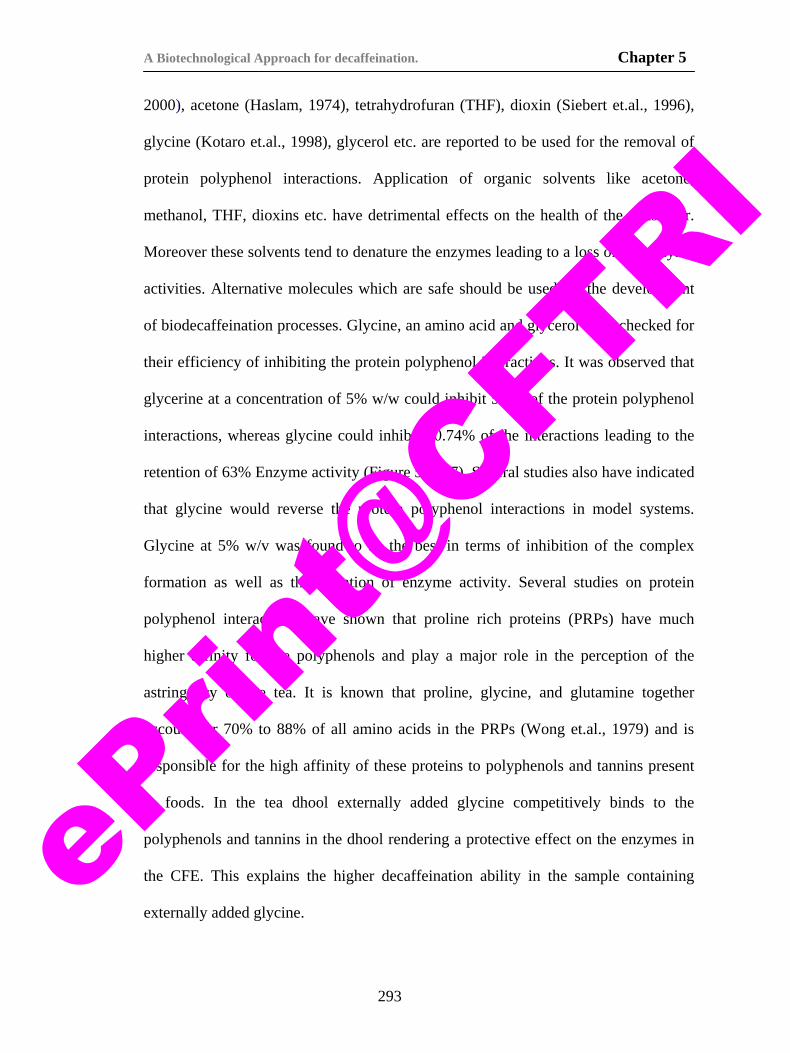
A Biotechnological Approach for decaffeination. Chapter 5
2000), acetone (Haslam, 1974), tetrahydrofuran (THF), dioxin (Siebert et.al., 1996),
glycine (Kotaro et.al., 1998), glycerol etc. are reported to be used for the removal of
protein polyphenol interactions. Application of organic solvents like acetone,
methanol, THF, dioxins etc. have detrimental effects on the health of the consumer.
Moreover these solvents tend to denature the enzymes leading to a loss of the enzyme
activities. Alternative molecules which are safe should be used for the development
of biodecaffeination processes. Glycine, an amino acid and glycerol were checked for
their efficiency of inhibiting the protein polyphenol interactions. It was observed that
glycerine at a concentration of 5% w/w could inhibit 56 % of the protein polyphenol
interactions, whereas glycine could inhibit 60.74% of the interactions leading to the
retention of 63% Enzyme activity (Figure 5.4.4.7). Several studies also have indicated
that glycine would reverse the protein polyphenol interactions in model systems.
Glycine at 5% w/v was found to be the best in terms of inhibition of the complex
formation as well as the retention of enzyme activity. Several studies on protein
polyphenol interactions have shown that proline rich proteins (PRPs) have much
higher affinity for the polyphenols and play a major role in the perception of the
astringency of the tea. It is known that proline, glycine, and glutamine together
account for 70% to 88% of all amino acids in the PRPs (Wong et.al., 1979) and is
responsible for the high affinity of these proteins to polyphenols and tannins present
in foods. In the tea dhool externally added glycine competitively binds to the
polyphenols and tannins in the dhool rendering a protective effect on the enzymes in
the CFE. This explains the higher decaffeination ability in the sample containing
externally added glycine.
293
ePrin
t@CFT
RI
A Biotechnological Approach for decaffeination. Chapter 5
0
19.86
25.73
56.24
54.21
23.62
27.99
60.7462.32
12.27
15.45
26.38
54.59 53.67
19.87
27.64
63.31 63.52
0
10
20
30
40
50
60
70
% Inhibition Residual Enzyme activity (%)
Figure 5.4.4.7. Effect of glycine and glycerol on inhibition of protein-polyphenol interactions in tea dhool.
Control Glycerol (1%) Glycerol (2%) Glycerol (5%) Glycerol (10%)
Glycine (1%) Glycine (2%) Glycine (5%) Glycine (10%)
5.4.5. Biodecaffeination of black tea under optimum conditions:
With the optimized conditions (as above) 80% of the initial caffeine could be
degraded from the tea dhool within 90 minutes (Fig. 5.4.5.1.). The residual caffeine in
the dhool was found to be 0.633% w/w. Maximum enzyme activities and
biodecaffeination (45.52 %) occurred within the first 15 minutes of addition of the
294
ePrin
t@CFT
RI
A Biotechnological Approach for decaffeination. Chapter 5
enzymes. The rate of removal of caffeine decreased as the reaction progressed with
57.31% caffeine degraded at the end of 30 minutes. The reaction slowed down further
and reached a plateau at 90 minutes of incubation and the biodecaffeination was 80%.
This decrease in activity after 90 minutes of incubation is due to the formation
of caffeine-polyphenol complexes and protein polyphenol complexes in the dhool. As
tea fermentation progresses theaflavins and thearubigins are formed which have
higher affinity of binding to caffeine and proteins present in the dhool (Brown, 1966;
Chao and Chiang, 1999, Haslam, 2003). This would limit the efficiency of
biodecaffeination through two major phenomena, one limiting the availability of
caffeine and the other limiting the enzyme activity. These two phenomena were also
observed during the biodecaffeination of black tea and account for the decreasing rate
of biodecaffeination with time.
295
ePrin
t@CFT
RI
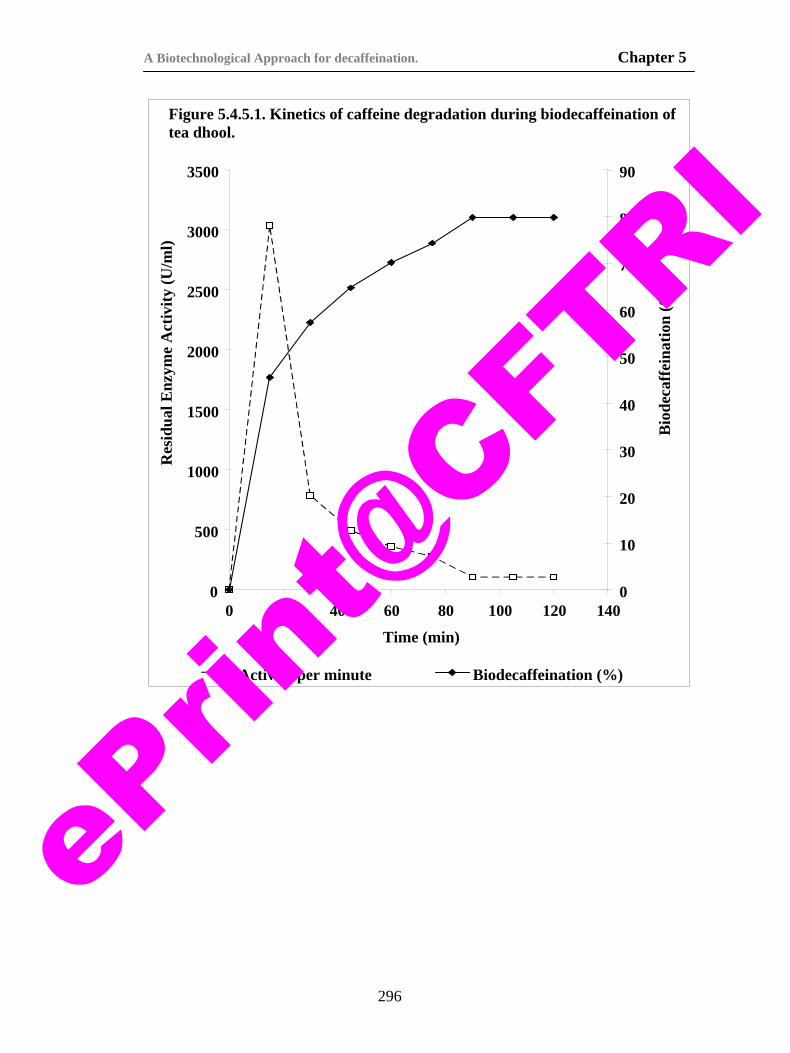
A Biotechnological Approach for decaffeination. Chapter 5
Figure 5.4.5.1. Kinetics of caffeine degradation during biodecaffeination of tea dhool.
0
500
1000
1500
2000
2500
3000
3500
0 20 40 60 80 100 120 140
Time (min)
Res
idua
l Enz
yme
Act
ivity
(U/m
l)
0
10
20
30
40
50
60
70
80
90
Bio
deca
ffei
natio
n (%
) Activity per minute Biodecaffeination (%)
296
ePrin
t@CFT
RI
A Biotechnological Approach for decaffeination. Chapter 5
5. 5. CONCLUSIONS:
You can't teach old dog new tricks (so the adage goes). But it is not always
true in the case of microorganisms. They appear to be constantly on a learning spree
adapting themselves to utilize different substrates and adapting to new environments.
Enzymes isolated from the induced cells of P. alcaligenes MTCC 5264 were found to
decaffeinate a solution of caffeine completely. This discovery led to an in-depth quest
into the possibility of developing a biodecaffeination process. Interest in the
production of decaffeinated tea and coffee arose more than 50 years ago, stimulated
by research on the ill effects of caffeine when these beverages were consumed in
excess. Since then several processes on decaffeination using solvents and other
chemicals were developed. Each of these processes has limitations such as loss of
flavor, adverse effects of the solvents on health etc.
In the present work, we succeeded in decaffeinating tea dhool by using
enzymes isolated from P. alcaligenes MTCC 5264 and defined this process as a
“Biodecaffeination Process” for the first time. This work builds on previous studies
by us in which P. alcaligenes MTCC 5264 was induced to produce the enzymes
involved in degradation of caffeine. A major breakthrough is the ability of these
enzymes to decaffeinate tea invitro. A major bottle neck in this process is that the
enzymes themselves are highly unstable invitro. Application of these enzymes in the
biodecaffeination process was limited by many factors such as protein polyphenol
interactions, caffeine-polyphenol complexes and the inactivation of the enzymes. An
integrated approach of controlling the adverse reactions on the enzymes and the
297
ePrin
t@CFT
RI
A Biotechnological Approach for decaffeination. Chapter 5
availability of caffeine to the enzymes was effective in achieving 80%
biodecaffeination.
In sum, this work represents an in-depth study on the development of
new routes for the decaffeination of caffeine containing materials like tea and coffee
through the biotechnological route. This process is safe both to the consumer as well
as the environment. Hayashibara International Inc.’s GRAS panel considers the
enzyme from P. amylodermosa, a soil isolate can be safely used for the production of
isoamylase enzyme for food applications (www.FDA.org/CFSAN: Agency response
letter: GRAS Notice No. GRN 000085) and also isoamylase from the fore said isolate
is approved by the Japanese Food Additive Regulations, 1998. P. alcaligenes is a soil
isolate from coffee and tea garden soils. It is not a known opportunistic pathogen and
the enzymes produced by P. alcaligenes may be considered safe inline with
Hayashibara International Inc.’s isoamylase for food applications.
Achieving 80% decaffeination by using enzymes under so many adverse
conditions was not easy. A few challenges still lie ahead. Achieving 90% or more
decaffeination is required and an in-depth study into this is being carried out.
298
ePrin
t@CFT
RI
A Biotechnological Approach for decaffeination. Chapter 5
5.6. REFERENCES:
1. Arima, K., Nose, K., (1968), Studies on Bacterial Urate-Oxygen Oxidoreductase. I. Purification and Properties of the Enzyme, Biochim Biophys Acta. 151: 54.
2. Asano, Y., Komeda. T., Yamada. H., (1993). Microbial production of theobromine from caffeine. Biosci. Biotechnol. Biochem. 57:1286-1289.
3. Asano, Y., Komeda T., Yamada, H., (1994), Enzymes involved in theobromine production from caffeine by Pseudomonas putida No. 352, Biosci. Biotechnol. Biochem., 58(12): 2303-2304.
4. Baxter N.J., Michael P. W., Terence H. L., Haslam, E., (1996), Stacking interactions between caffeine and methyl gallate, J. Chem. Soc., Faraday Trans., 92: 231 – 234.
5. Bergmeyer, H.U., Gawehn, K., Grassl, M., (1974), in Methods of Enzymatic Analysis (Bergmeyer, H.U. ed.) Second Edition, Volume I, 521-522, Academic Press Inc., New York.
6. Blecher, R.; Lingens, F., (1977), The metabolism of caffeine by a Pseudomonas putida strain. Hoppe-Seyler's Zeitschrift fuer Physiologische, 358: 807-817.
7. Bradford, M. (1976), A Rapid and Sensitive Method for the Quantitation of Microgram Quantities of Protein Utilizing the Principle of Protein-Dye Binding" Anal. Biochem. 72: 248-254.
8. Camargo, M.C.R., Toledo, M.C.F., (1998), Caffeine content of commercial Brazilian coffee. Cienc Technol Aliment. 18: 421–424.
9. Caudle, A.G., Bell, L.N., (2000), Caffeine and theobromine content of ready to eat chocolate cereals. J Am Diet Assoc. 100: 690–692.
10. Charlton, A. J., Davis, A. L., Jones, D. P., Lewis, J. R., Davies, A. P., Haslam, E., Williamson, M. P., (2000), The self-association of the black tea polyphenol theaflavin and its complexation with caffeine. J. Chem. Soc., Perkin Trans. 2: 317-322.
11. Elisabeth, J., John, O'C.J., Patrick, A. F., Mike, P.W., (2004), Molecular Model for Astringency Produced by Polyphenol/Protein Interactions, Biomacromolecules, 5 (3): 942 -949.
12. Gluck, M.; Lingens, F. (1987), Studies on the microbial production of theobromine and heteroxanthine from caffeine. Appl. Microbiol. Biotechnoll., 25: 25334-253340.
13. Haas, G., Stieglitz, B., (1980), Microbiological decaffeination of aqueous solutions. Canadian Patent, 1086553.
14. Haslam E., (1974), Polyphenol–protein interactions. Biochem. J., 139(1): 285–288.
15. Kaplan, A. V., (1960), Deterrmination of Urease Activity, Methods Biochem Anal. 17: 320.
16. Karl J. S., Nataliia V.T., Penelope, Y. L., (1996), Nature of Polyphenol-Protein Interactions, J. Agric. Food Chem. 44 (1): 80 -85.
17. Kellerhals, M., Hazenberg, W., Witholt, B., (1999), High Cell Density Fermentations of Pseudomonas oleovorans for the Production of mcl-PHAs in Two Liquid-Phase Media, Enz. Microb. Technol. 24: 111-116.
299
ePrin
t@CFT
RI
A Biotechnological Approach for decaffeination. Chapter 5
300
18. Keya, C.A., Crozier, A., Ashihara, H., (2003), Inhibition of caffeine biosynthesis in tea (Camellia sinensis) and coffee (Coffea arabica) plants by ribavirin. FEBS Lett. 554: 473-477.
19. Kretschmar JA, Baumann TW. (1999), Caffeine in citrus flowers. Phytochem., 52: 19–23.
20. Kusuda, M., Hatano, T., Yoshida,T., (2006), Water-Soluble Complexes Formed by Natural Polyphenols and Bovine Serum Albumin: Evidence from Gel Electrophoresis, Biosci. Biotechnol. Biochem., 70(1): 152-160.
21. Landolt HP, Dijk D-J, Gauss SE, Borb´ely AA. (1995), Caffeine reduces, low-frequency delta activity in the human sleep EEG. Neuropsychopharmacol. 12: 229–238.
22. Madyastha, K.M., Sridhar, G.R., (1998), A Novel pathway for the metabolism of caffeine by a mixed culture consortium. Biochem. Biophys. Res. Commun. 249:178–81.
23. Madyastha, K, M., Sridhar, G.R., Vadiraja, B.B., Madhavi, Y.S., (1999), Purification and partial characterization of caffeine oxidase-A novel enzyme from a mixed culture consortium. Biochem Biophys Res Commun. 263:460–464.
24. Middelhoven, W.J., Lommen, A., (1984), Degradation of caffeine by Pseudomonas putida C3024; the effect of oxygen concentration. Antonie van Leeuwenhoek 50:298-300.
25. Ogita, S., Uefuj, H., Yamaguchi, Y., Koizumi, N., Sano, H., (2003), Producing decaffeinated coffee plants. Nature 423: 823.
26. Sarath Babu V.R., Patra, S., Thakur, M.S., Karanth, N.G., Varadaraj, M.C., (2005), Degradation of caffeine by Pseudomonas alcaligenes CFR 1708, Enz. Microb. Technol. 37(6): 617-624.
27. Schwimmer, S., Kurtzman, R., (1972), Fungal decaffeination of roasted coffee infusions. J. Food Sci. 37: 921-924.
28. Shilo, L., Sabbah, H., Hadari, R., Kovatz, S,, Weinberg, U., Dolevm S., (2002), The effects of coffee consumption on sleep and melatonin sectretion. Sleep Med. 3: 271–273.
29. Sideso, O. F. P., Marvier, A. C., Katerelos, N. A., Goodenough, P.W., (2001), The characteristics and stabilization of a caffeine demethylase enzyme complex. Int. J. Food Sci. Tech 36(6): 693-698.
30. Trijbels, F., Vogels, G.D., (1966a), Degradation of allantoin by Pseudomonas acidovorans, Biochim Biophys Acta. 113(2): 292-301.
31. Trijbels, F., Vogels, G.D., (1966b) Allantoinase and uriedoglycolase in Pseudomonas and Penicillium Species. Biochim Biophys. Acta. 118 (2): 387-95.
32. Woolfolk, C.A., (1975), Metabolism of N-methylpurines by a Pseudomonas putida strain isolated by enrichment on caffeine as the sole source of carbon and nitrogen. J. Bacteriol. 123: 1088-1106.
33. Woolfolk, C.A., (1985), Purification and properties of a novel ferricyanidelinked xanthine dehydrogenase from Pseudomonas putida 40. J. Bacteriol. 163: 600-609.
34. Yano, Y.D.M., Mazzafera, P., (1999), Catabolism of caffeine and purification of a xanthine oxidase responsible for methyluric acids production in Pseudomonas Putida L. Rev Microbiol. 30: 62–70.
ePrin
t@CFT
RI
CHAPTER 6 DEVELOPMENT OF A
BIOSENSOR FOR CAFFEINE.
ePrin
t@CFT
RI

A Biotechnological Approach for Decaffeination Chapter 6
PREAMBLE TO CHAPTER 6:
Caffeine determination in tea, coffee, cola drinks, pharmaceutical preparations
and other caffeine containing materials is highly important in determining the quality
of the beverages and in determining the caffeine intakes. In our laboratory we have
isolated microorganisms capable of degrading caffeine and the enzymes involved in
biodecaffeination were identified and characterized. With the leads obtained in our
research on enzymes involved in caffeine degradation and with the expertise available
on the development of biosensors in our laboratory, added with the lack of existing
biosensors for caffeine, we had an inquisition into the development of a biosensing
method for determination of caffeine and have developed a whole cell based
biosensor which is described in this chapter.
6.1. SCOPE OF THE WORK:
Coffee and tea are the most popular beverages across the world and their
caffeine content has an important role of the caffeine in determining the quality of
coffee and tea beverages. Further, on account of the harmful effects of caffeine its
efficient measurement is relevant. In this context, the development of a sensitive,
rapid and cost effective method for monitoring caffeine is greatly needed. Although a
few biosensing methods for caffeine are reported, they have limitations in application
for commercial samples. The development and application of new caffeine detection
methods remains an active area of investigation, particularly in food and clinical
chemistry. Caffeine biosensor has wide applications in determination of caffeine in
tea, coffee, chocolates, cola beverages, sports drinks, energy drinks, pharmaceutical
preparations and in determining the health of the liver (where caffeine is used as a
301
ePrin
t@CFT
RI
A Biotechnological Approach for Decaffeination Chapter 6
marker for Cytochrome P450 activity in humans) and in the determination of caffeine
in waste waters as an indicator of pollution.
An amperometric biosensor based on immobilized cells of P. alcaligenes
MTCC 5264 was developed and is described in detail in this chapter. The
physicochemical parameters for efficient operation of the biosensor were optimized
and are described in detail in this chapter. Studies on interferences due to other
metabolites like sugars were also carried out and the efficiency of the biosensor in
analysis of real samples like coffee and tea was checked by analysis by HPLC and are
described in detail in this chapter. The chapter ends with recommendations and future
perspectives of the caffeine biosensor.
302
ePrin
t@CFT
RI

A Biotechnological Approach for Decaffeination Chapter 6
6.2. INTRODUCTION:
Demand for biosensors has increased markedly in recent years, driven by
needs in many commercial and research sectors for specific sensors that are capable
of rapid, reliable measurements (Keusgen, 2002). Development of biosensors is of
interest for diverse applications ranging from biochemical profiling of normal and
diseased cells (metabolomics), clinical diagnostics, drug discovery and biodefense, to
more straightforward analyses such as fermentation, process monitoring,
environmental testing, and quality control of foods and beverages.
Coffee and tea are the most popular beverages across the world and their caffeine
content has an important role of the caffeine in determining the quality of coffee and
tea beverages. Further, on account of the harmful effects of caffeine (described in
chapter 1 of this thesis) its efficient measurement is relevant. In this context, the
development of a sensitive, rapid and cost effective method for monitoring caffeine is
greatly needed.
Conventionally, high-performance liquid chromatography (HPLC) separation
(Moriyasu et al., 1996; Kunagi and Tabei 1997) and UV-spectrophotometric detection
(Turk and Guzin, 2002), methods are applied to coffee beans, tea and other caffeine
containing materials for caffeine content determinations. Other methods such as
capillary electrophoresis, (Zhao and Lunte, 1997), thin layer chromatography (TLC)
(Kunagi and Tabei, 1997) and gas chromatography (GC) (Statheropoulos et.al.,
1996), are used for separation of caffeine in the analysis of mixtures, combined with
detection methods such as mass spectroscopy (Statheropoulos et. al., 1996) and FTIR
spectrophotometry (Norton and Griffith, 1995). However, expensive instrumentation,
303
ePrin
t@CFT
RI

A Biotechnological Approach for Decaffeination Chapter 6
highly skilled technicians and complicated and time-consuming procedures are
required for such methods.
Another possible technique is flow injection immunoassay using a solid
phase reactor, which makes the assay faster because no separation step is needed
(Rico et al., 1991). However the time and cost difficulty in raising monoclonal
antibody for low molecular weight compound such as caffeine, antibody purification,
and the need for their manipulation with extreme care, are the disadvantages of this
approach. A biosensor based on inhibition of 3,5-cyclic phosphodiesterase (CPDE)
from bovine heart in combination with a pH electrode for the detection of caffeine in
coffee was reported by Pizzariello et. al., (1999). This work is limited to academic
interest due to the costs and difficulty in obtaining the enzyme. Moreover this
biosensor also suffers from the disadvantage of interference due to other compounds
in real samples.
The development and application of new caffeine detection methods
remains an active area of investigation, particularly in food and clinical chemistry.
Significant research and development activity has been devoted to preparing compact
analytical devices comprising a bioactive sensing element integrated with a suitable
transducing system, known as biosensors, for determination of various inorganic,
organic and biological substances in our laboratory at CFTRI. The main advantages
of these devices are their specificity, sensitivity and ease of sample preparation, and
the fact that no other reagents besides a buffer and a standard are usually required
(Thakur and Karanth, 2003). With these advantages in view, investigations have been
304
ePrin
t@CFT
RI
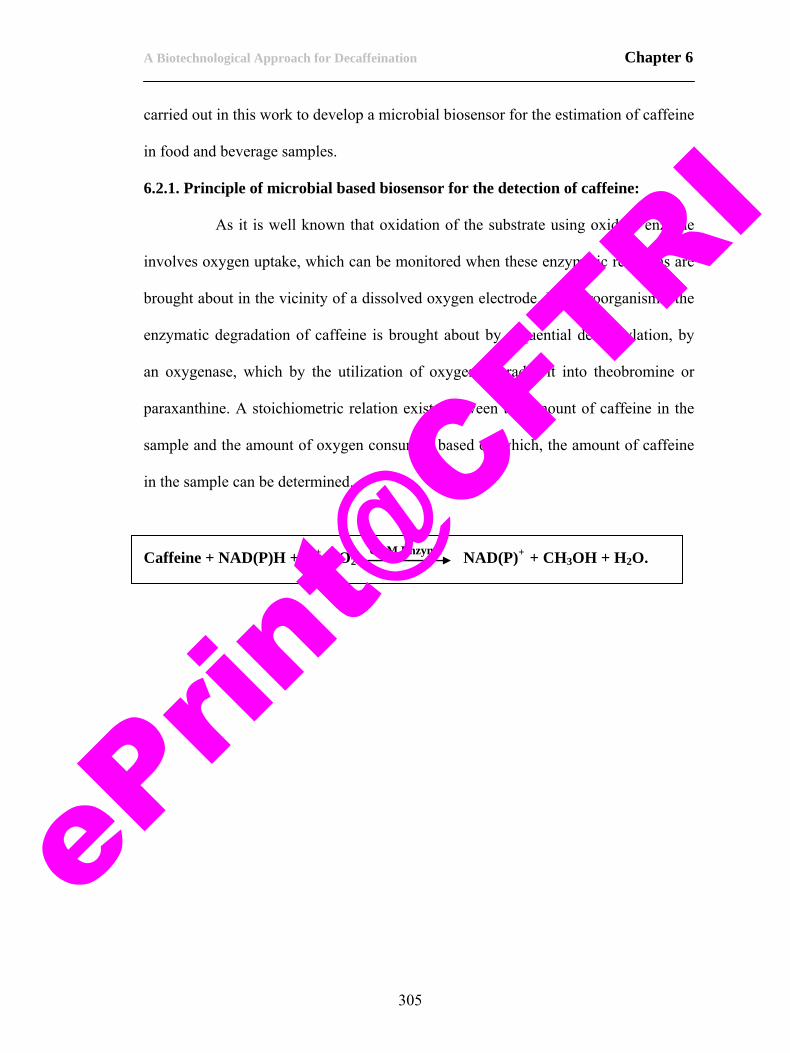
A Biotechnological Approach for Decaffeination Chapter 6
carried out in this work to develop a microbial biosensor for the estimation of caffeine
in food and beverage samples.
6.2.1. Principle of microbial based biosensor for the detection of caffeine:
As it is well known that oxidation of the substrate using oxidase enzyme
involves oxygen uptake, which can be monitored when these enzymatic reactions are
brought about in the vicinity of a dissolved oxygen electrode. In microorganisms, the
enzymatic degradation of caffeine is brought about by sequential demethylation, by
an oxygenase, which by the utilization of oxygen degrades it into theobromine or
paraxanthine. A stoichiometric relation exists between the amount of caffeine in the
sample and the amount of oxygen consumed based on which, the amount of caffeine
in the sample can be determined.
Caffeine + NAD(P)H + H+ + O2 CDM Enzyme
NAD(P)+ + CH3OH + H2O.
305
ePrin
t@CFT
RI
A Biotechnological Approach for Decaffeination Chapter 6
6.3. MATERIALS AND METHODS:
Caffeine, theophylline, theobromine, gelatin, glutaraldehyde and para chloro
mercuri benzoic acid (Ultra Pure) were obtained from Sigma Chemicals, St. Louis,
U.S.A. Analytical grade, di-nitro phenyl hydrazine, polyvinyl alcohol, and polyvinyl
pyrrollidone were procured from Sisco Research Laboratory Chemicals, Mumbai,
India. κ-carrageenan, dehydrated nutrient agar and nutrient broth (AR) were obtained
from M/s HiMedia Labs, Mumbai, India. All other chemicals were of high purity and
were procured from standard sources.
A microbe previously isolated and characterized in our laboratory as
Pseudomonas alcaligenes MTCC 5264 (Sarath et.al., 2005), which was found to have
potent caffeine degradation capability was used for the studies. The isolate was
cultivated in a modified nutrient broth containing caffeine (0.03% w/v) to obtain
biomass. The microbial cells were induced according to the method described in
Chapter 2.
6.3.1. Construction of the caffeine biosensor:
The biosensor comprises a biological sensing element (immobilized cells of P.
alcaligenes MTCC 5264), transducer (amperometric elctrode), amplification and
detector systems (dissolved oxygen probe, EDT instruments, UK) as shown in Figure
6.3.1.1, which was earlier reported (Gouda et. al. 2000) and is described as follows.
6.3.1.1. Immobilization of whole cells:
Immobilization of microbial cells was done according to the method of Gouda
et. al., (1997, 2001, 2002) with slight modifications. Three immobilizing agents viz.,
306
ePrin
t@CFT
RI
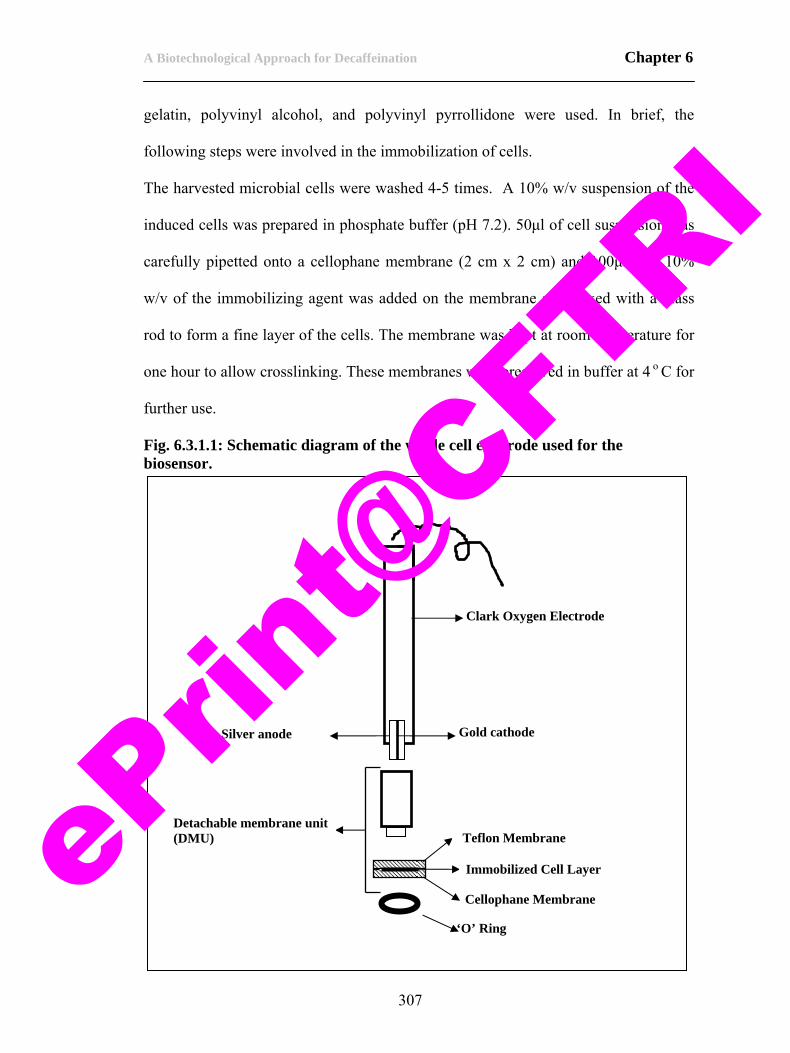
A Biotechnological Approach for Decaffeination Chapter 6
gelatin, polyvinyl alcohol, and polyvinyl pyrrollidone were used. In brief, the
following steps were involved in the immobilization of cells.
The harvested microbial cells were washed 4-5 times. A 10% w/v suspension of the
induced cells was prepared in phosphate buffer (pH 7.2). 50μl of cell suspension was
carefully pipetted onto a cellophane membrane (2 cm x 2 cm) and 100μl of a 10%
w/v of the immobilizing agent was added on the membrane and mixed with a glass
rod to form a fine layer of the cells. The membrane was kept at room temperature for
one hour to allow crosslinking. These membranes were preserved in buffer at 4 o C for
further use.
Fig. 6.3.1.1: Schematic diagram of the whole cell electrode used for the biosensor.
Cellophane Membrane
Clark Oxygen Electrode
Gold cathode Silver anode
Teflon Membrane
Immobilized Cell Layer
Detachable membrane unit (DMU)
‘O’ Ring
307
ePrin
t@CFT
RI
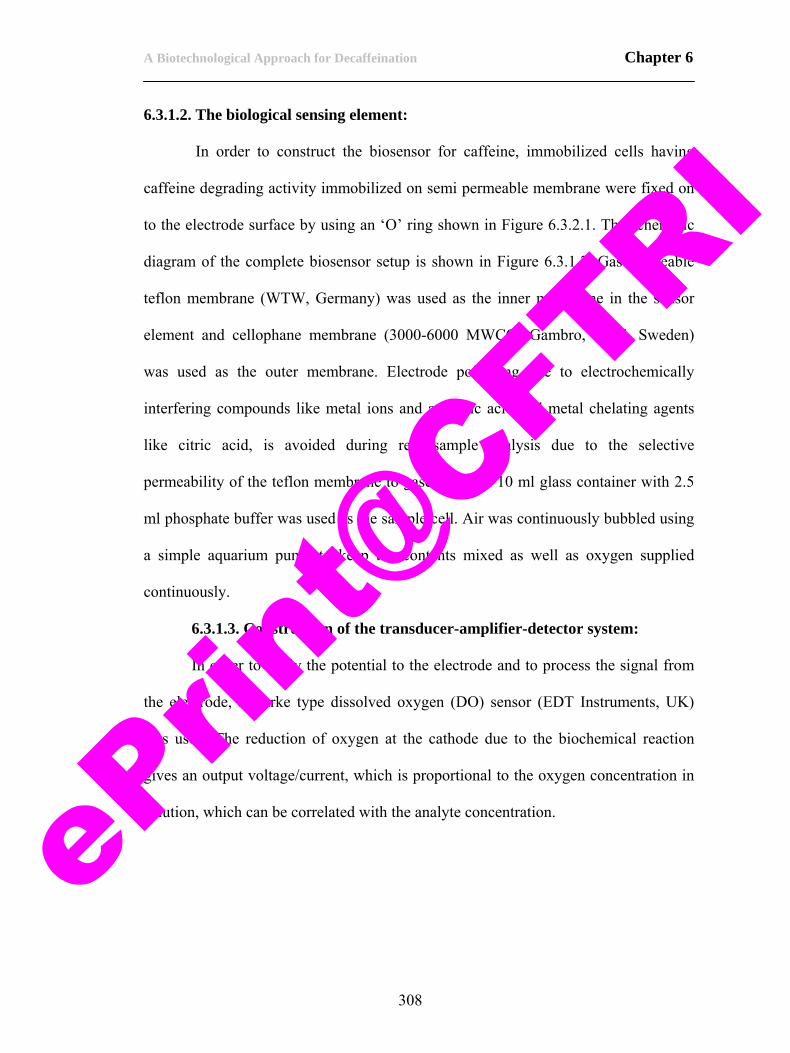
A Biotechnological Approach for Decaffeination Chapter 6
6.3.1.2. The biological sensing element:
In order to construct the biosensor for caffeine, immobilized cells having
caffeine degrading activity immobilized on semi permeable membrane were fixed on
to the electrode surface by using an ‘O’ ring shown in Figure 6.3.2.1. The schematic
diagram of the complete biosensor setup is shown in Figure 6.3.1.2. Gas permeable
teflon membrane (WTW, Germany) was used as the inner membrane in the sensor
element and cellophane membrane (3000-6000 MWCO; Gambro, Lund, Sweden)
was used as the outer membrane. Electrode poisoning due to electrochemically
interfering compounds like metal ions and ascorbic acid and metal chelating agents
like citric acid, is avoided during real sample analysis due to the selective
permeability of the teflon membrane to gases only. A 10 ml glass container with 2.5
ml phosphate buffer was used as the sample cell. Air was continuously bubbled using
a simple aquarium pump to keep the contents mixed as well as oxygen supplied
continuously.
6.3.1.3. Construction of the transducer-amplifier-detector system:
In order to apply the potential to the electrode and to process the signal from
the electrode, a clarke type dissolved oxygen (DO) sensor (EDT Instruments, UK)
was used. The reduction of oxygen at the cathode due to the biochemical reaction
gives an output voltage/current, which is proportional to the oxygen concentration in
solution, which can be correlated with the analyte concentration.
308
ePrin
t@CFT
RI
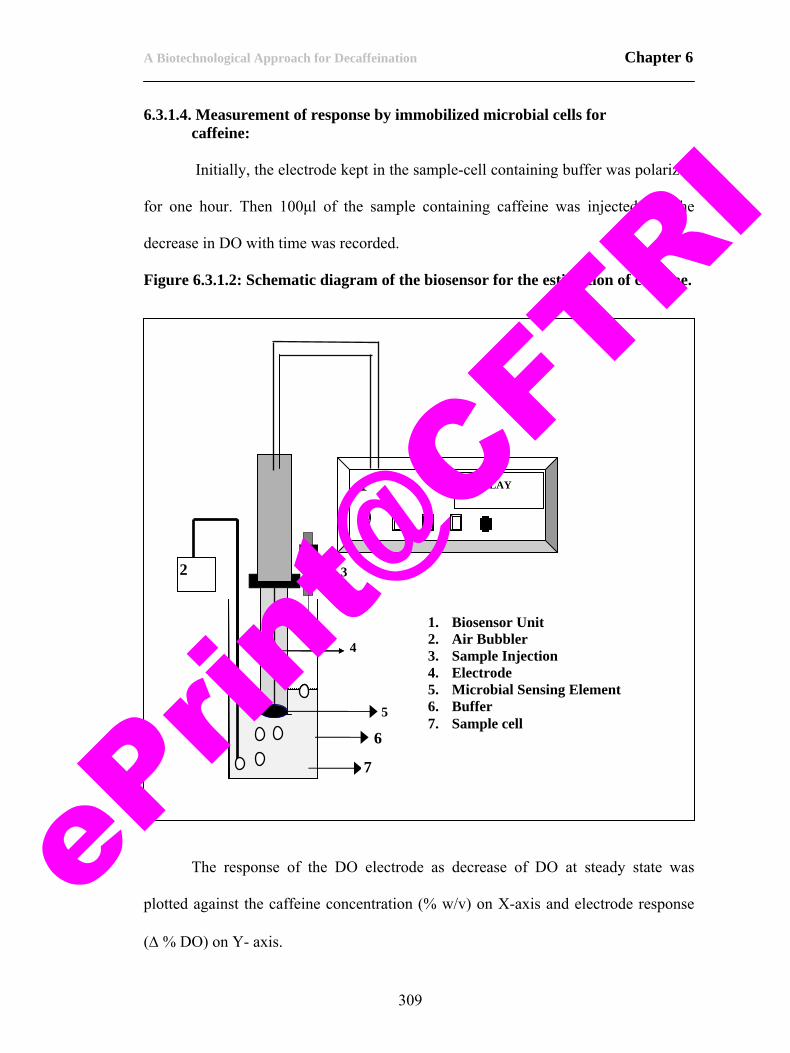
A Biotechnological Approach for Decaffeination Chapter 6
6.3.1.4. Measurement of response by immobilized microbial cells for caffeine:
Initially, the electrode kept in the sample-cell containing buffer was polarized
for one hour. Then 100μl of the sample containing caffeine was injected and the
decrease in DO with time was recorded.
Figure 6.3.1.2: Schematic diagram of the biosensor for the estimation of caffeine.
The response of the DO electrode as decrease of DO at steady state was
plotted against the caffeine concentration (% w/v) on X-axis and electrode response
(Δ % DO) on Y- axis.
3
6
1
2
4
DISPLAY
7
5
1. Biosensor Unit 2. Air Bubbler 3. Sample Injection 4. Electrode 5. Microbial Sensing Element 6. Buffer 7. Sample cell
309
ePrin
t@CFT
RI
A Biotechnological Approach for Decaffeination Chapter 6
6.3.1.5. Response of xanthine oxidase to caffeine:
The enzyme involved in the first step of degradation of caffeine has not been
characterized, but reports are available on the further degradation of caffeine to
xanthine, by xanthine oxidase, uricase, allantiocase, allantoinase, glyoxylate
dehydrogenase and urease. To check for the interference of xanthine oxidase activity
(XOD) in the determination of caffeine, XOD was immobilized and its response to
caffeine, theobromine, and paraxanthine (0.1% w/v) was recorded.
6.3.1.6. Preparation of real samples for biosensor analysis:
Instant coffee and tea were prepared by dissolving 0.5 g of each in 125 ml
boiling water (Blauch and Stanley, 1983) and were kept for 30 minutes on a magnetic
stirrer and filtered using a Whatman filter Paper No.1. 25 µl of the sample was then
injected and the response was recorded.
310
ePrin
t@CFT
RI
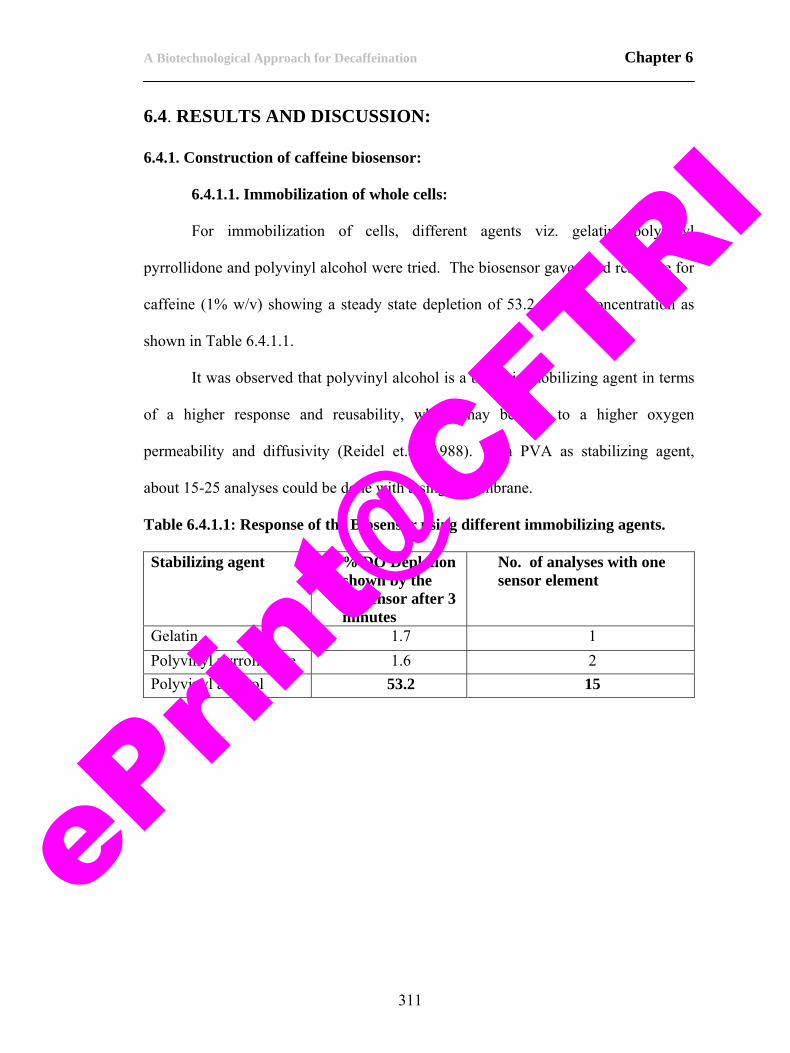
A Biotechnological Approach for Decaffeination Chapter 6
6.4. RESULTS AND DISCUSSION:
6.4.1. Construction of caffeine biosensor:
6.4.1.1. Immobilization of whole cells:
For immobilization of cells, different agents viz. gelatin, polyvinyl
pyrrollidone and polyvinyl alcohol were tried. The biosensor gave good response for
caffeine (1% w/v) showing a steady state depletion of 53.2 % DO concentration as
shown in Table 6.4.1.1.
It was observed that polyvinyl alcohol is a better immobilizing agent in terms
of a higher response and reusability, which may be due to a higher oxygen
permeability and diffusivity (Reidel et.al, 1988). With PVA as stabilizing agent,
about 15-25 analyses could be done with a single membrane.
Table 6.4.1.1: Response of the Biosensor using different immobilizing agents. Stabilizing agent % DO Depletion
shown by the biosensor after 3 minutes
No. of analyses with one sensor element
Gelatin 1.7 1 Polyvinyl pyrrollidone 1.6 2 Polyvinyl alcohol 53.2 15
311
ePrin
t@CFT
RI
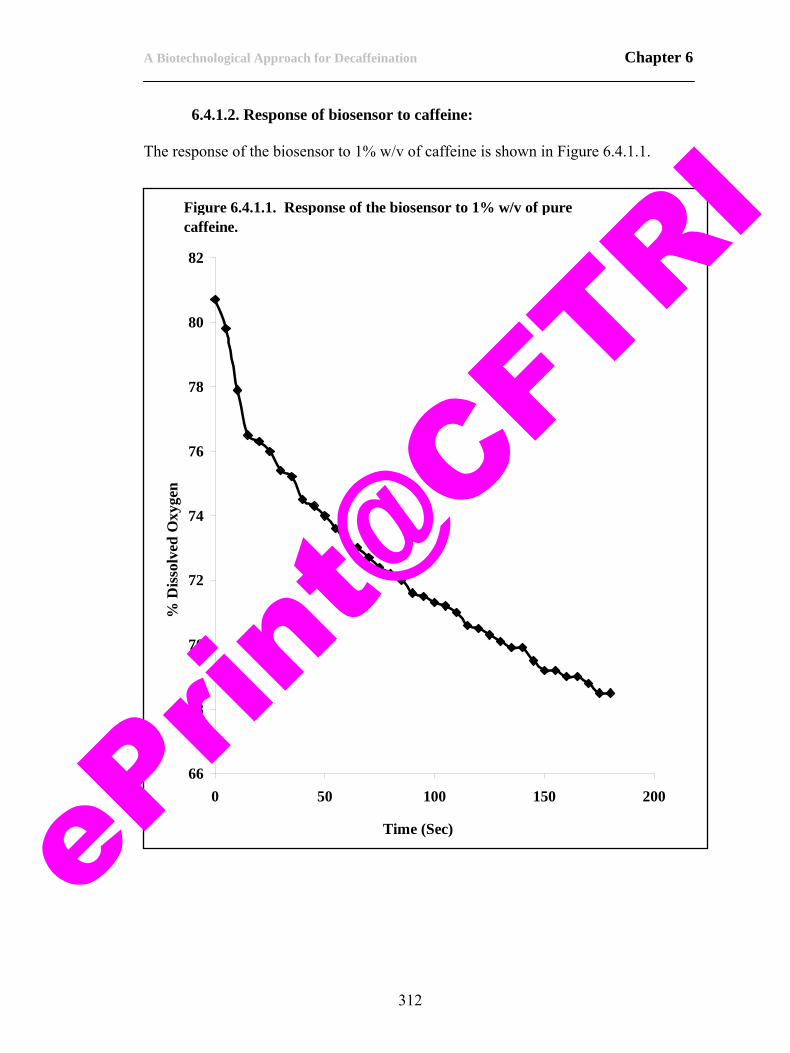
A Biotechnological Approach for Decaffeination Chapter 6
6.4.1.2. Response of biosensor to caffeine:
The response of the biosensor to 1% w/v of caffeine is shown in Figure 6.4.1.1.
Figure 6.4.1.1. Response of the biosensor to 1% w/v of pure caffeine.
66
68
70
72
74
76
78
80
82
0 50 100 150 200
Time (Sec)
% D
isso
lved
Oxy
gen
312
ePrin
t@CFT
RI
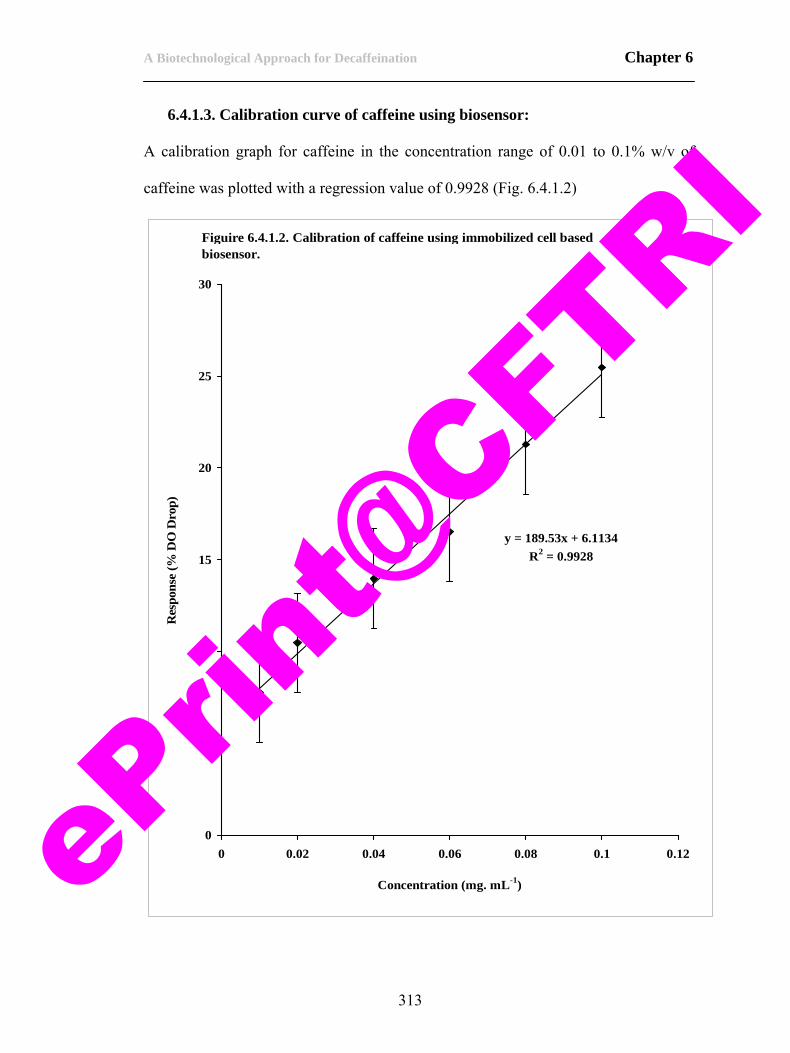
A Biotechnological Approach for Decaffeination Chapter 6
6.4.1.3. Calibration curve of caffeine using biosensor:
A calibration graph for caffeine in the concentration range of 0.01 to 0.1% w/v of
caffeine was plotted with a regression value of 0.9928 (Fig. 6.4.1.2)
Figuire 6.4.1.2. Calibration of caffeine using immobilized cell based biosensor.
y = 189.53x + 6.1134R2 = 0.9928
0
5
10
15
20
25
30
0 0.02 0.04 0.06 0.08 0.1 0.12
Concentration (mg. mL-1)
Res
pons
e (%
DO
Dro
p)
313
ePrin
t@CFT
RI
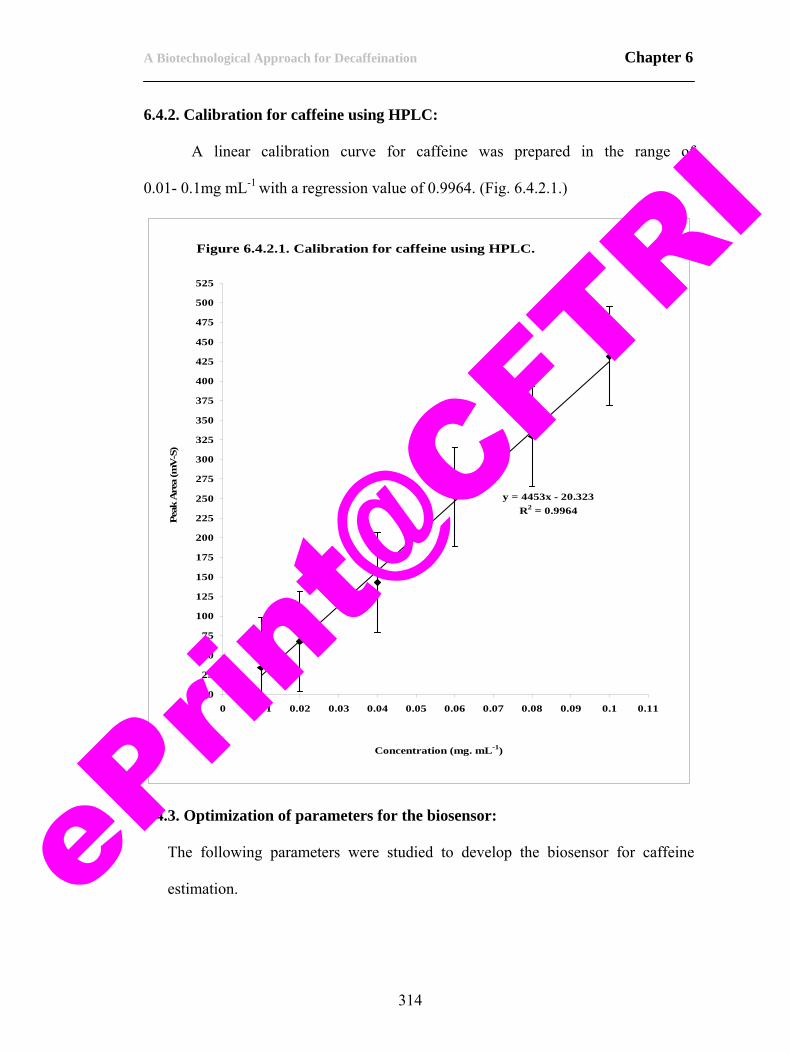
A Biotechnological Approach for Decaffeination Chapter 6
6.4.2. Calibration for caffeine using HPLC:
A linear calibration curve for caffeine was prepared in the range of
0.01- 0.1mg mL-1 with a regression value of 0.9964. (Fig. 6.4.2.1.)
Figure 6.4.2.1. Calibration for caffeine using HPLC.
y = 4453x - 20.323R2 = 0.9964
0
25
50
75
100
125
150
175
200
225
250
275
300
325
350
375
400
425
450
475
500
525
0 0.01 0.02 0.03 0.04 0.05 0.06 0.07 0.08 0.09 0.1 0.11
Concentration (mg. mL-1)
Peak
Are
a (m
V-S
)
6.4.3. Optimization of parameters for the biosensor:
The following parameters were studied to develop the biosensor for caffeine
estimation.
314
ePrin
t@CFT
RI
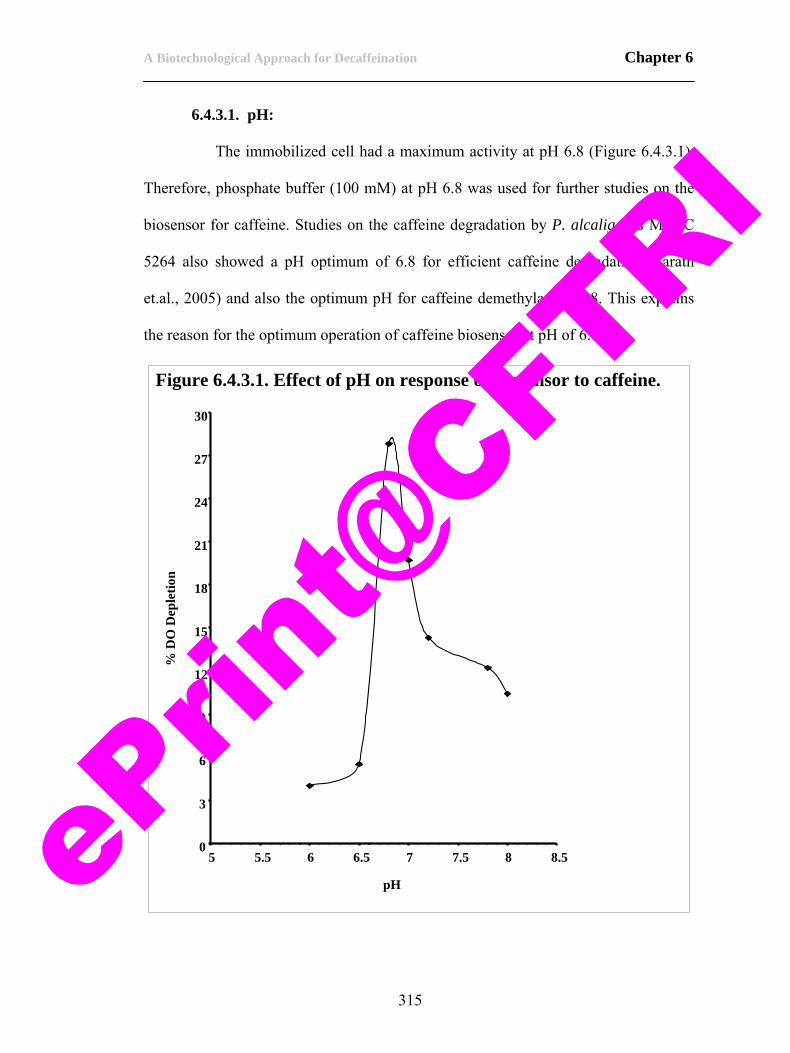
A Biotechnological Approach for Decaffeination Chapter 6
6.4.3.1. pH:
The immobilized cell had a maximum activity at pH 6.8 (Figure 6.4.3.1).
Therefore, phosphate buffer (100 mM) at pH 6.8 was used for further studies on the
biosensor for caffeine. Studies on the caffeine degradation by P. alcaligenes MTCC
5264 also showed a pH optimum of 6.8 for efficient caffeine degradation (Sarath
et.al., 2005) and also the optimum pH for caffeine demethylase is 6.8. This explains
the reason for the optimum operation of caffeine biosensor at pH of 6.8.
Figure 6.4.3.1. Effect of pH on response of biosensor to caffeine.
30
27
24
21
% D
O D
eple
tion
18
15
12
9
6
3
0 5 5.5 6 6.5 7 7.5 8 8.5
pH
315
ePrin
t@CFT
RI
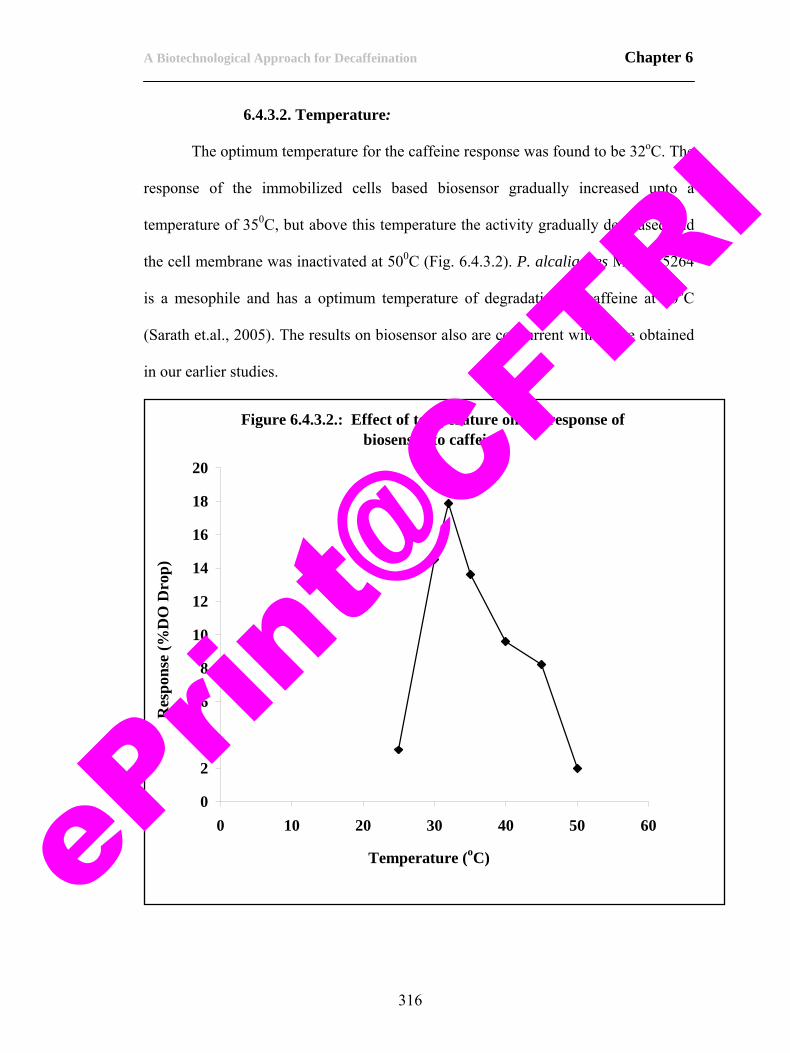
A Biotechnological Approach for Decaffeination Chapter 6
6.4.3.2. Temperature:
The optimum temperature for the caffeine response was found to be 32oC. The
response of the immobilized cells based biosensor gradually increased upto a
temperature of 350C, but above this temperature the activity gradually decreased and
the cell membrane was inactivated at 500C (Fig. 6.4.3.2). P. alcaligenes MTCC 5264
is a mesophile and has a optimum temperature of degradation of caffeine at 30oC
(Sarath et.al., 2005). The results on biosensor also are concurrent with those obtained
in our earlier studies.
Figure 6.4.3.2.: Effect of temperature on the response of biosensor to caffeine
0
2
4
6
8
10
12
14
16
18
20
0 10 20 30 40 50 60
Temperature (oC)
Res
pons
e (%
DO
Dro
p)
316
ePrin
t@CFT
RI
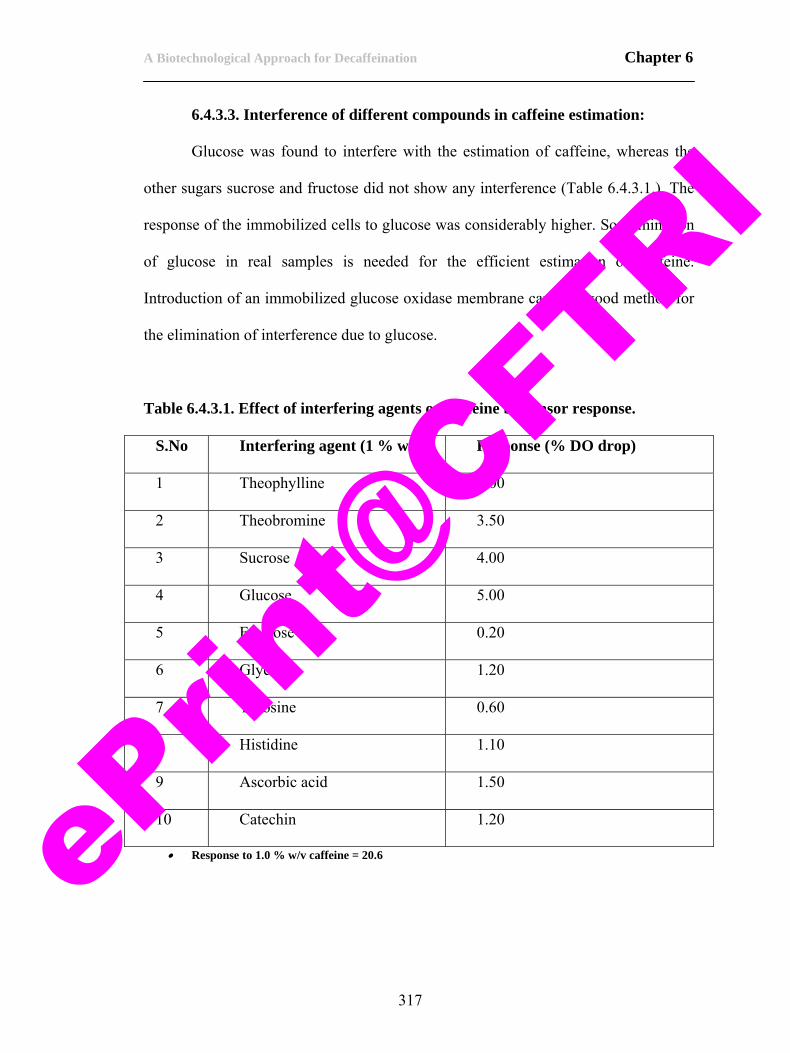
A Biotechnological Approach for Decaffeination Chapter 6
6.4.3.3. Interference of different compounds in caffeine estimation:
Glucose was found to interfere with the estimation of caffeine, whereas the
other sugars sucrose and fructose did not show any interference (Table 6.4.3.1.). The
response of the immobilized cells to glucose was considerably higher. So elimination
of glucose in real samples is needed for the efficient estimation of caffeine.
Introduction of an immobilized glucose oxidase membrane can be a good method for
the elimination of interference due to glucose.
Table 6.4.3.1. Effect of interfering agents on caffeine biosensor response.
S.No Interfering agent (1 % w/v) Response (% DO drop)
1 Theophylline 2.00
2 Theobromine 3.50
3 Sucrose 4.00
4 Glucose 5.00
5 Fructose 0.20
6 Glycine 1.20
7 Tyrosine 0.60
8 Histidine 1.10
9 Ascorbic acid 1.50
10 Catechin 1.20
• Response to 1.0 % w/v caffeine = 20.6
317
ePrin
t@CFT
RI
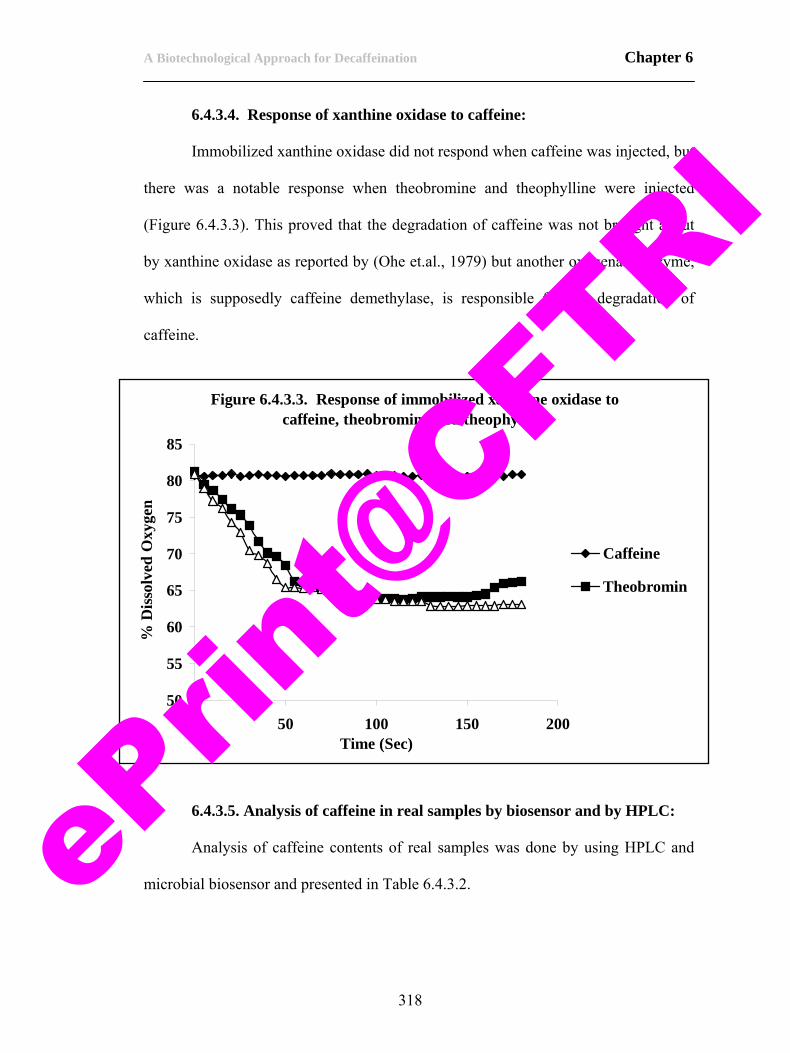
A Biotechnological Approach for Decaffeination Chapter 6
6.4.3.4. Response of xanthine oxidase to caffeine:
Immobilized xanthine oxidase did not respond when caffeine was injected, but
there was a notable response when theobromine and theophylline were injected
(Figure 6.4.3.3). This proved that the degradation of caffeine was not brought about
by xanthine oxidase as reported by (Ohe et.al., 1979) but another oxygenase enzyme,
which is supposedly caffeine demethylase, is responsible for the degradation of
caffeine.
Figure 6.4.3.3. Response of immobilized xanthine oxidase to caffeine, theobromine and theophylline
50
55
60
65
70
75
80
85
0 50 100 150 200Time (Sec)
% D
isso
lved
Oxy
gen
Caffeine
Theobromin
6.4.3.5. Analysis of caffeine in real samples by biosensor and by HPLC:
Analysis of caffeine contents of real samples was done by using HPLC and
microbial biosensor and presented in Table 6.4.3.2.
318
ePrin
t@CFT
RI
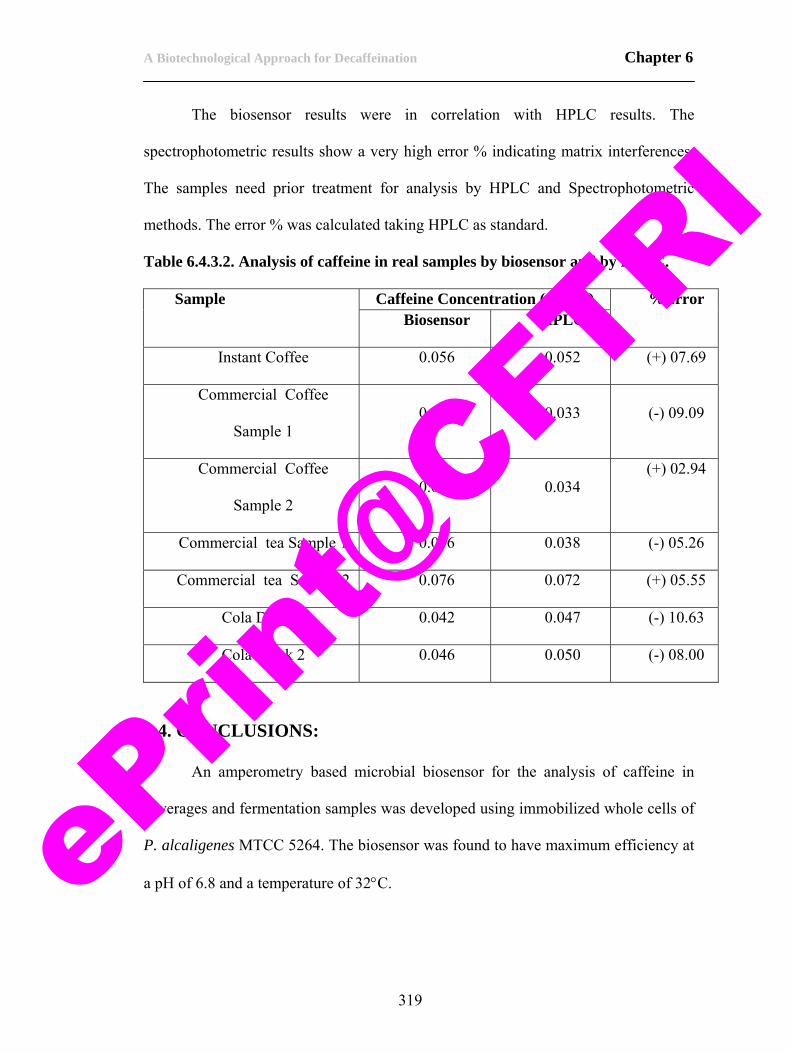
A Biotechnological Approach for Decaffeination Chapter 6
The biosensor results were in correlation with HPLC results. The
spectrophotometric results show a very high error % indicating matrix interferences.
The samples need prior treatment for analysis by HPLC and Spectrophotometric
methods. The error % was calculated taking HPLC as standard.
Table 6.4.3.2. Analysis of caffeine in real samples by biosensor and by HPLC.
Sample Caffeine Concentration (% w/v) %Error Biosensor HPLC
Instant Coffee 0.056 0.052 (+) 07.69
Commercial Coffee
Sample 1 0.030 0.033 (-) 09.09
Commercial Coffee
Sample 2 0.035 0.034
(+) 02.94
Commercial tea Sample 1 0.036 0.038 (-) 05.26
Commercial tea Sample 2 0.076 0.072 (+) 05.55
Cola Drink 1 0.042 0.047 (-) 10.63
Cola Drink 2 0.046 0.050 (-) 08.00
6.4. CONCLUSIONS:
An amperometry based microbial biosensor for the analysis of caffeine in
beverages and fermentation samples was developed using immobilized whole cells of
P. alcaligenes MTCC 5264. The biosensor was found to have maximum efficiency at
a pH of 6.8 and a temperature of 32°C.
319
ePrin
t@CFT
RI
A Biotechnological Approach for Decaffeination Chapter 6
Sugars like glucose and sucrose were tested for interference in the results and
were found to interfere in the analysis. An approach for the removal of these sugars
prior to injection in the biosensor was tested by passing the sample through a packed
column of immobilized glucose oxidase enzyme. Tests on the use of glucose uptake
inhibitors were carried out and it was found that the inhibitors also inhibited the
analysis of caffeine. Further work is to be carried out on increasing the selectivity of
the immobilized system to caffeine.
6.5. PERSPECTIVES:
Caffeine biosensor has lot of potential applications in tea, coffee and other
beverages along with pharmaceutical caffeine based products and in clinical
applications for determining the health status of humans (as a marker for
Cytochromoe P450 activity in Liver). The biosensor devised for the analysis of
caffeine with a working range of 0.01% -0.1 % w/v of caffeine is found to have large
number of commercial applications. Industries such as coffee, tea and soft drinks
where the concentration of the caffeine is to be monitored for safety of human health
and the level of caffeine is of critical importance. In view of these facts caffeine
biosensor will have potential market world over.
This device helps overcome the problem of time consuming and tedious
sample preparation and analytical procedures commonly involved in conventional
analysis methods. The main advantage of this method is the fast response time, which
enables the quick estimation of caffeine in real samples. However, the whole cell
system may respond to substrates such as Theophylline, Theobromine and other
methyl xanthines which usually are present in real samples. This tends to give rise to
320
ePrin
t@CFT
RI

A Biotechnological Approach for Decaffeination Chapter 6
some inaccuracy in the analysis of real samples. Although this effect was minimum in
the present biosensor, this problem can be avoided by the use of pure caffeine
demethylase enzyme for highly selective analysis of caffeine.
Future work would be carried out on the development of an enzyme based
biosensor for the determination of caffeine. The proposed enzyme biosensor is
anticipated to be free of interferences and enable more analyses in a shorter time.
321
ePrin
t@CFT
RI
A Biotechnological Approach for Decaffeination Chapter 6
6.6. REFERENCES:
1. Alpdogan, G., Karabina, K. Sungur, S. (2002), Derivative spectrophotometric determination of caffeine in some beverages. Turk. J. Chem. 26(2): 295-302.
2. Asano, Y., Komeda, T., Yamada, H., (1993), Microbial production of theobromine from caffeine. Biosci. Biotech. Biochem. 57: 1286–1289.
3. Blauch, J.L., Tarka J.R., Stanley, M., (1983), HPLC determination of caffeine and theobromine in coffee, tea and instant hot cocoa mixes. J. Food Sci. 48: 745-748.
4. Blecher, R,, Lingens, F., (1977), Metabolism of caffeine by Pseudomonas putida. Hoppe Seyler’s Z Physiol Chem. 358:807–817.
5. Europaisches, A., Coffeinum, (1978) p 670: Theophyllinum, (1978) p 1213; Deutscher Apotheker Verlag Stuttgart.
6. Gouda, M.D., Thakur, M.S., Karanth, N.G., (1997), A dual enzyme amperometric biosensor for monitoring organophosphorous pesticides. Biotechnol. Tech. 11(9): 653-655.
7. Gouda, M.D., Thakur, M.S., Karanth, N.G., (2001), Optimization of the multienzyme system for sucrose biosensor by response surface methodology. World J. Microbiol. Biotech. .17(6): 595-600’
8. Gouda, M.D., Thakur, M.S., Karanth, N.G., (2001), Stability studies on immobilized glucose oxidase Using an amperometric biosensor - Effect of protein based Stabilizing agents. Electroanalysis. 13(10): 849-855.
9. Kalmar, J. M. and Cafarelli, E., (1999), Effects of caffeine on neuromuscular function. J Appl Physiol. , 87: 801-808.
10. Keusgen, M., (2002), Biosensors: new approaches in drug discovery. Naturwissenschaften, 89: 433–444.
11. Kunugi A and Tabei K, (1997), Simultaneous determination of purine alkaloids in daily foods by high performance thin layer chromatography. HCR J High Resol Chromatogr 20: 456-458.
12. Moriyasu, Saito, K., Nakazato,M., Ishikawa,F., Fujinuma,K., Nishima,T., Kunagi, A. Norton, K.L. and Griffith, P.R., (1995), simultaneous determination of caffeine, theobromine and theophylline in foods by HPLC. J. Chromatog. A, 703: 503-522.
13. Ohe, T., Watanabe, Y., (1979), Purification and properties of xanthine dehydrogenase from Streptomyces cyanogenus . J. Biochem (Tokyo); 86: 45-53.
14. Pizzariello, A., Svorc, J., Stredansky, M., Miertus, S., (1999) A biosensing method for detection of caffeine in coffee. J. Sci. Food Agri., 79 (8): 1136 – 1140.
15. Pons, F.W., and Muller, P., (1990), Induction of frameshift mutations by caffeine in Escherichia coli K12, Mutagenesis, 5: 173-177.
16. Rico, C.M., Fenandez, M.D., Gutirrez, A.M., Golovela, L.A., Stein, H.J and Scheller, F., (1995), Development of a flow fluoroimmunosensor for determination of theophylline. Analyst , 120: 2589-2591.
322
ePrin
t@CFT
RI
A Biotechnological Approach for Decaffeination Chapter 6
323
17. Ritchie, J.M.. (1975) The xanthines. The pharmacological Basis of therapeutics, 5th Edn. Mac Millan, New York. pp 367-368.
18. Riedel, K., M. Lehmann, K. Tag, R. Renneberg, and G. Kunze, (1998), Arxula adeninivorans based sensor for the estimation of BOD. Anal. Lett. 31: 1-12.
19. Srisuphan, W., Bracken, M.B., (1986), Caffeine consumption during pregnancy and association with late spontaneous abortion. Am J Obstet Gynecol 154:14–20.
20. Statheropoulos, M., Samargadi, E., Tzamtzis, N and Geogakopoulous, C., (1996), Principal component analysis for resolving coeluting substances in gas chromatography mass spectrometry doping control analysis. Anal. Chim. Acta, 331: 53-61.
21. Sambrook, J., Fritsch, E .F. and Maniatis, T., (1989), Bacterial Cell Maintenance. In Molecular Cloning: A laboratory manual, Vol.1, Cold Spring Harbor laboratory Press, New York.
22. Thakur, M.S. and Karanth, N.G., (2003) Research and development of Biosensors for food analysis in India, in Advances in Biosensors, Vol. 5, Perspectives in Biosensors. Ed. Malhotra, B.D. and Turner, A.P.F, Elsevier science, Amsterdam, ISBN: 0-444-51337-X, 131-160.
23. Zhao, Y.P. and Lunte, C.E., (1997) Detemination of caffeine and its metabolites by micellar electrokinetic capillary electrophoresis. J. Chromatog.B, 628: 265-274.
ePrin
t@CFT
RI
List of Publications: Patents: 1. A process for the bio- decaffeination of solutions containing caffeine
(428/Del/03, Columbia Patent applied, US 4171411). 2. A biosensor device for the determination of caffeine (Patent Applied). 3. A process for the production of caffeine demethylase enzyme for use in
biodecaffeination and biotransformation of Caffeine to methyl xanthines. (Patent Applied).
4. An improved enzymatic process for the Decaffeination of caffeine containing liquid systems (Patent Applied).
5. A Process for the biodecaffeination of tea during fermentation (Patent Applied).
6. A Bioreactor Design for Enzymatic Decaffeination (Patent Applied). Publications:
1) Sarath Babu, V.R., Patra, S., Karanth, N.G., Thakur, M.S., Varadaraj, M.C.,
(2005), Degradation of caffeine by Pseudomonas alcaligenes CFR 1708.
Enzyme and Microbial Technology. 27, 617-624).
2) Sarath Babu, V.R., Patra, S., Karanth, N.G., Thakur, M.S., Kumar, M.A.,
(2007), Development of a biosensor for Caffeine. Analytica Chimica Acta.
582(2): 329-334. 3) Sarath Babu, V.R., Thakur, M.S., Enzymatic biodecaffeination of tea:
Effects of different physicochemical parameters. (MS under preparation)
4) Sarath Babu, V.R., Thakur, M.S., Biodecaffeination of tea during
fermentation: Technological challenges and opportunities. (MS under
preparation)
5) Sarath Babu, V.R., Thakur, M.S., Studies on effect of physicochemical
parameters on biodecaffeination by Pseudomonas alcaligenes MTCC 5264.
(MS under preparation)
6) Sarath Babu, V.R., Thakur, M.S., Biodecaffeination of coffee beans:
Development of an immobilized enzyme based bioreactor system. (MS
under Preparation)
7) Sarath Babu, V.R., Thakur, M.S., Studies on Stabilization of caffeine
demethylase. (MS under preparation).
8) Sarath Babu, V.R., Thakur, M.S., Studies on quality improvement of tea by
external addition of enzymes. (MS under preparation).
ePrin
t@CFT
RI