Embed Size (px)
Citation preview

A BERNOULLI INVESTIGATIONAuthor(s): Jay GrossSource: The Mathematics Teacher, Vol. 93, No. 9 (December 2000), pp. 756-757Published by: National Council of Teachers of MathematicsStable URL: http://www.jstor.org/stable/27971578 .
Accessed: 12/05/2014 16:01
Your use of the JSTOR archive indicates your acceptance of the Terms & Conditions of Use, available at .http://www.jstor.org/page/info/about/policies/terms.jsp
.JSTOR is a not-for-profit service that helps scholars, researchers, and students discover, use, and build upon a wide range ofcontent in a trusted digital archive. We use information technology and tools to increase productivity and facilitate new formsof scholarship. For more information about JSTOR, please contact [email protected].
.
National Council of Teachers of Mathematics is collaborating with JSTOR to digitize, preserve and extendaccess to The Mathematics Teacher.
http://www.jstor.org
This content downloaded from 84.199.96.129 on Mon, 12 May 2014 16:01:40 PMAll use subject to JSTOR Terms and Conditions
Algebra is
presented
through an
insightful approach
that is enriched by reflection,
analysis, and
synthesis
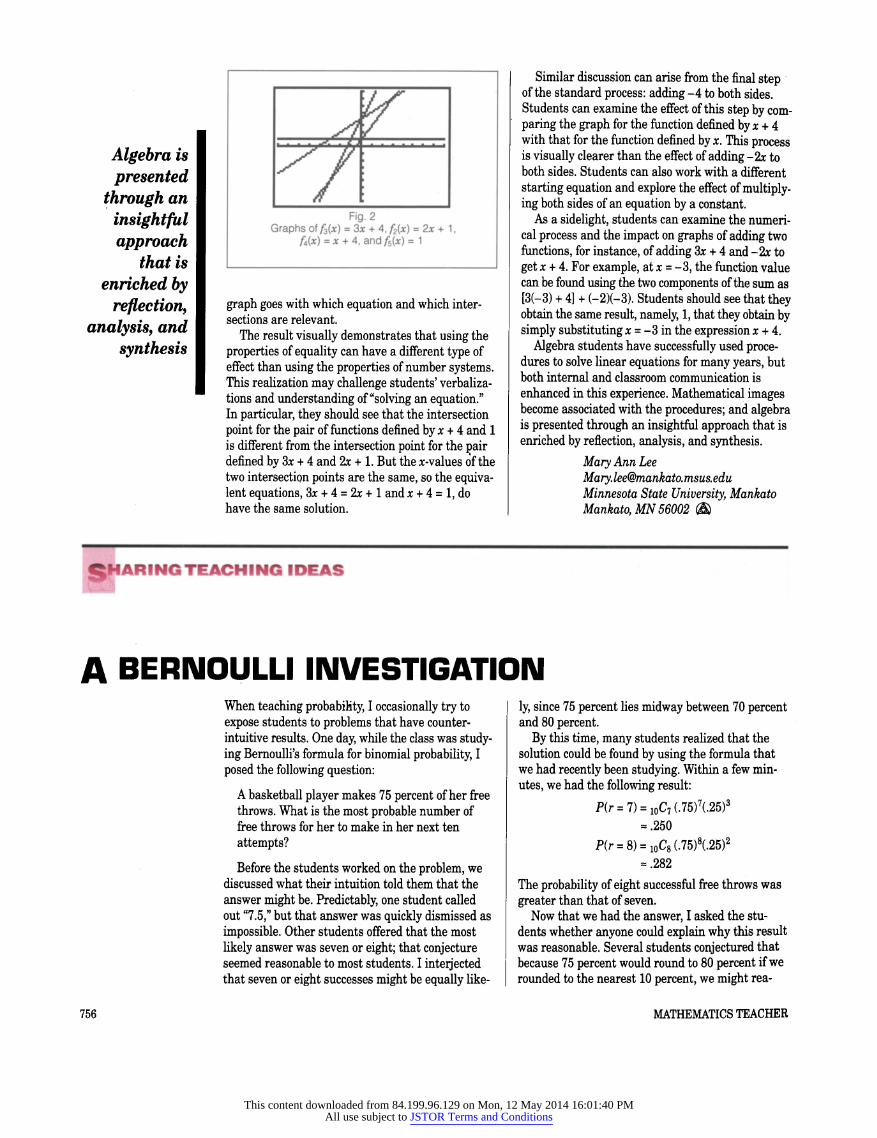
Fig. 2
Graphs of f3(x) = 3s + 4, f2(x) = 2x + 1, f4(x) =x + 4, and f5(x) = 1
graph goes with which equation and which inter sections are relevant.
The result visually demonstrates that using the
properties of equality can have a different type of effect than using the properties of number systems. This realization may challenge students' verbaliza tions and understanding of "solving an equation." In particular, they should see that the intersection
point for the pair of functions defined by x + 4 and 1 is different from the intersection point for the nair defined by 3s + 4 and 2x + 1. But the x-values of the two intersection points are the same, so the equiva lent equations, Sx + 4 = 2x + 1 and x + 4 = 1, do have the same solution.
Similar discussion can arise from the final step of the standard process: adding -4 to both sides. Students can examine the effect of this step by com
paring the graph for the function defined by x + 4 with that for the function defined by x. This process is visually clearer than the effect of adding -2x to both sides. Students can also work with a different
starting equation and explore the effect of multiply ing both sides of an equation by a constant.
As a sidelight, students can examine the numeri cal process and the impact on graphs of adding two
functions, for instance, of adding 3x + 4 and-2x to
get x + 4. For example, at x = -3, the function value can be found using the two components of the sum as [3(-3) + 4] + (-2X-3). Students should see that they obtain the same result, namely, 1, that they obtain by simply substituting x = -3 in the expression x + 4.
Algebra students have successfully used proce dures to solve linear equations for many years, but both internal and classroom communication is enhanced in this experience. Mathematical images become associated with the procedures; and algebra is presented through an insightful approach that is enriched by reflection, analysis, and synthesis.
Mary Ann Lee
Mary. lee@mankato. msus. eda Minnesota State University, Mankato
Mankato, MN 56002
I ARING TEACHING IDEAS
A BERNOULLI INVESTIGATION When teaching probability, I occasionally try to
expose students to problems that have counter intuitive results. One day, while the class was study ing Bernoulli's formula for binomial probability, I
posed the following question:
A basketball player makes 75 percent of her free throws. What is the most probable number of free throws for her to make in her next ten
attempts?
Before the students worked on the problem, we discussed what their intuition told them that the answer might be. Predictably, one student called out "7.5," but that answer was quickly dismissed as
impossible. Other students offered that the most
likely answer was seven or eight; that conjecture seemed reasonable to most students. I interjected that seven or eight successes might be equally like
ly, since 75 percent lies midway between 70 percent and 80 percent.
By this time, many students realized that the solution could be found by using the formula that we had recently been studying. Within a few min
utes, we had the following result:
P(r = 7) = 10C7(.75)7(.25)3 = .250
P(r = 8) = 10C8(.75)8(.25)2 .282
The probability of eight successful free throws was
greater than that of seven. Now that we had the answer, I asked the stu
dents whether anyone could explain why this result was reasonable. Several students conjectured that because 75 percent would round to 80 percent if we
rounded to the nearest 10 percent, we might rea
756 MATHEMATICS TEACHER
This content downloaded from 84.199.96.129 on Mon, 12 May 2014 16:01:40 PMAll use subject to JSTOR Terms and Conditions
sonably believe that eight successful free throws were more probable than seven. The agreement was almost unanimous that the correct explanation had been unearthed.
I next revised the question, as follows:
A basketball player makes 73 percent of her free throws. What is the most probable number of free throws for her to make in her next ten
attempts?
The solution is shown in the following:
P(r = 7) = 10C7(.73)7(.27)3 .261
P(r = 8) = 10C8(.73)8(.27)2 .265
Surprisingly, P(r = 8) is still greater than P(r = 7). If the success rate is changed to 72 percent, however, P(r = 7) is greater than P(r = 8).
The class discussion took an interesting detour. Could anyone find the value of p that would make P(r = 7) equal to P{r = 8)? What equation would need to be solved? After some discussion, the class arrived at the following:
P(r = 7) = P(r = 8) if
10C7P7d-p)3 =
10C8p8(l-p)2.
Solving for p, we find that
Multiplying by (8! 2!)/10!, we get
|/(l-p)3=p8(l-p)2.
Dividing by p\l - pf, we obtain
i(l-p)=A
P = _8_ ll'
The result is equivalent to 72.72 percent, confirm ing the class's earlier result.
The class ended, and I was satisfied that we had explored the question thoroughly. I was pleasantly surprised when a student submitted the following generalization the next day:
In a binomial experiment with n trials, the prob ability of r successes will be equal to the proba bility of r + 1 successes when
r+1 71 + 1
'
The derivation follows:
P(r) = P(r + l)
if
ncrpra-prr=nC iPr+la-p)n -r-1
n!
r!(n-r)!
Multiplying by
/(l-p)"-r = (r+l)\(n-r-l)\
(r + l)!(n-r-l)! -^
we get r+1
n-r pra-Prr=pr+la-py ,\n-r-l
Dividing by pr(l -p)n~r~l, we obtain
r + 1 _ p n-r~\-p
r-pr + 1-p =pn-pr,
r + 1 = pn + p, r + 1 = p(n + 1), r + 1
What began as an attempt to challenge students to question their intuition regarding probability led to a lively discussion and developed a result that was previously unknown, at least to the students. The class received a lesson not only about the work ings of Bernoulli's formula but about the ways that
mathematicians work and think.
Jay Gross
[email protected] Manhasset Senior High School
Manhasset, NY 10030
The class received a
lesson about the ways that
mathemati cians work and think
Download a fully-functional evaluation copy of GrafEq
y\ Pedagoguery Software has been producing quality
educational programs since 1988.
Have you ever wondered about the graph ofy=x*l Don't reach for your graphing calculator or graphing program - they're likely to mislead you. First try plotting a few points by hand: (-3/5,(-3/5)'3/5), (-2/5,(-2/5)"2/5), (-l/5,(-l/5)"1/5),... After you've plotted the graph yourself, you can evaluate the graph produced by your graphing utility. Don't be too surprised if it isn't correct. Most graphing utilities take short-cuts that compromise reliability.
Of course, if you're using L GrafEq, you won't be
surprised that it gets it right. GrafEq, produced by Pedagoguery Software
Inc. (www.peda.com), is the only graphing utility that rigorously
proves that its graphs are correct.
Vol. 93, No. 9 . December 2000 757
This content downloaded from 84.199.96.129 on Mon, 12 May 2014 16:01:40 PMAll use subject to JSTOR Terms and Conditions