Embed Size (px)
Citation preview
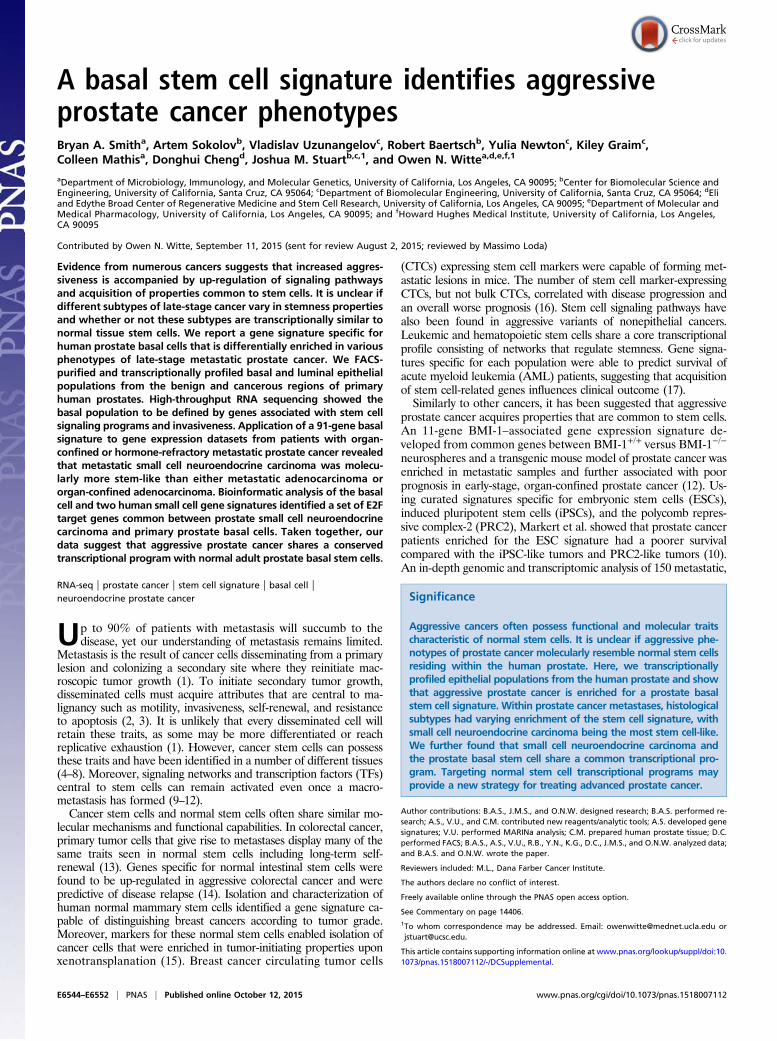
A basal stem cell signature identifies aggressiveprostate cancer phenotypesBryan A. Smitha, Artem Sokolovb, Vladislav Uzunangelovc, Robert Baertschb, Yulia Newtonc, Kiley Graimc,Colleen Mathisa, Donghui Chengd, Joshua M. Stuartb,c,1, and Owen N. Wittea,d,e,f,1
aDepartment of Microbiology, Immunology, and Molecular Genetics, University of California, Los Angeles, CA 90095; bCenter for Biomolecular Science andEngineering, University of California, Santa Cruz, CA 95064; cDepartment of Biomolecular Engineering, University of California, Santa Cruz, CA 95064; dEliand Edythe Broad Center of Regenerative Medicine and Stem Cell Research, University of California, Los Angeles, CA 90095; eDepartment of Molecular andMedical Pharmacology, University of California, Los Angeles, CA 90095; and fHoward Hughes Medical Institute, University of California, Los Angeles,CA 90095
Contributed by Owen N. Witte, September 11, 2015 (sent for review August 2, 2015; reviewed by Massimo Loda)
Evidence from numerous cancers suggests that increased aggres-siveness is accompanied by up-regulation of signaling pathwaysand acquisition of properties common to stem cells. It is unclear ifdifferent subtypes of late-stage cancer vary in stemness propertiesand whether or not these subtypes are transcriptionally similar tonormal tissue stem cells. We report a gene signature specific forhuman prostate basal cells that is differentially enriched in variousphenotypes of late-stage metastatic prostate cancer. We FACS-purified and transcriptionally profiled basal and luminal epithelialpopulations from the benign and cancerous regions of primaryhuman prostates. High-throughput RNA sequencing showed thebasal population to be defined by genes associated with stem cellsignaling programs and invasiveness. Application of a 91-gene basalsignature to gene expression datasets from patients with organ-confined or hormone-refractory metastatic prostate cancer revealedthat metastatic small cell neuroendocrine carcinoma was molecu-larly more stem-like than either metastatic adenocarcinoma ororgan-confined adenocarcinoma. Bioinformatic analysis of the basalcell and two human small cell gene signatures identified a set of E2Ftarget genes common between prostate small cell neuroendocrinecarcinoma and primary prostate basal cells. Taken together, ourdata suggest that aggressive prostate cancer shares a conservedtranscriptional programwith normal adult prostate basal stem cells.
RNA-seq | prostate cancer | stem cell signature | basal cell |neuroendocrine prostate cancer
Up to 90% of patients with metastasis will succumb to thedisease, yet our understanding of metastasis remains limited.
Metastasis is the result of cancer cells disseminating from a primarylesion and colonizing a secondary site where they reinitiate mac-roscopic tumor growth (1). To initiate secondary tumor growth,disseminated cells must acquire attributes that are central to ma-lignancy such as motility, invasiveness, self-renewal, and resistanceto apoptosis (2, 3). It is unlikely that every disseminated cell willretain these traits, as some may be more differentiated or reachreplicative exhaustion (1). However, cancer stem cells can possessthese traits and have been identified in a number of different tissues(4–8). Moreover, signaling networks and transcription factors (TFs)central to stem cells can remain activated even once a macro-metastasis has formed (9–12).Cancer stem cells and normal stem cells often share similar mo-
lecular mechanisms and functional capabilities. In colorectal cancer,primary tumor cells that give rise to metastases display many of thesame traits seen in normal stem cells including long-term self-renewal (13). Genes specific for normal intestinal stem cells werefound to be up-regulated in aggressive colorectal cancer and werepredictive of disease relapse (14). Isolation and characterization ofhuman normal mammary stem cells identified a gene signature ca-pable of distinguishing breast cancers according to tumor grade.Moreover, markers for these normal stem cells enabled isolation ofcancer cells that were enriched in tumor-initiating properties uponxenotransplanation (15). Breast cancer circulating tumor cells
(CTCs) expressing stem cell markers were capable of forming met-astatic lesions in mice. The number of stem cell marker-expressingCTCs, but not bulk CTCs, correlated with disease progression andan overall worse prognosis (16). Stem cell signaling pathways havealso been found in aggressive variants of nonepithelial cancers.Leukemic and hematopoietic stem cells share a core transcriptionalprofile consisting of networks that regulate stemness. Gene signa-tures specific for each population were able to predict survival ofacute myeloid leukemia (AML) patients, suggesting that acquisitionof stem cell-related genes influences clinical outcome (17).Similarly to other cancers, it has been suggested that aggressive
prostate cancer acquires properties that are common to stem cells.An 11-gene BMI-1–associated gene expression signature de-veloped from common genes between BMI-1+/+ versus BMI-1−/−
neurospheres and a transgenic mouse model of prostate cancer wasenriched in metastatic samples and further associated with poorprognosis in early-stage, organ-confined prostate cancer (12). Us-ing curated signatures specific for embryonic stem cells (ESCs),induced pluripotent stem cells (iPSCs), and the polycomb repres-sive complex-2 (PRC2), Markert et al. showed that prostate cancerpatients enriched for the ESC signature had a poorer survivalcompared with the iPSC-like tumors and PRC2-like tumors (10).An in-depth genomic and transcriptomic analysis of 150 metastatic,
Significance
Aggressive cancers often possess functional and molecular traitscharacteristic of normal stem cells. It is unclear if aggressive phe-notypes of prostate cancer molecularly resemble normal stem cellsresiding within the human prostate. Here, we transcriptionallyprofiled epithelial populations from the human prostate and showthat aggressive prostate cancer is enriched for a prostate basalstem cell signature. Within prostate cancer metastases, histologicalsubtypes had varying enrichment of the stem cell signature, withsmall cell neuroendocrine carcinoma being the most stem cell-like.We further found that small cell neuroendocrine carcinoma andthe prostate basal stem cell share a common transcriptional pro-gram. Targeting normal stem cell transcriptional programs mayprovide a new strategy for treating advanced prostate cancer.
Author contributions: B.A.S., J.M.S., and O.N.W. designed research; B.A.S. performed re-search; A.S., V.U., and C.M. contributed new reagents/analytic tools; A.S. developed genesignatures; V.U. performed MARINa analysis; C.M. prepared human prostate tissue; D.C.performed FACS; B.A.S., A.S., V.U., R.B., Y.N., K.G., D.C., J.M.S., and O.N.W. analyzed data;and B.A.S. and O.N.W. wrote the paper.
Reviewers included: M.L., Dana Farber Cancer Institute.
The authors declare no conflict of interest.
Freely available online through the PNAS open access option.
See Commentary on page 14406.1To whom correspondence may be addressed. Email: [email protected] [email protected].
This article contains supporting information online at www.pnas.org/lookup/suppl/doi:10.1073/pnas.1518007112/-/DCSupplemental.
E6544–E6552 | PNAS | Published online October 12, 2015 www.pnas.org/cgi/doi/10.1073/pnas.1518007112
castration-resistant prostate cancers (CRPCs) revealed that 18%of patients had alterations in the developmental Wnt signal-ing pathway (18). Murine models overexpressing key componentsof developmental signaling pathways alone or with other geneticalterations can drive a phenotype reminiscent of late-stageprostate cancer (19–22). Although these studies provide evidenceof a relationship between stem-like qualities and an aggressivephenotype, no studies to our knowledge have shown a molecularrelationship between aggressive prostate cancer and unculturedstem-like cells from the human prostate.The vast majority of prostate cancers have a glandular, ade-
nocarcinoma phenotype; however, a subset manifests a phenotypewith neuroendocrine differentiation termed neuroendocrineprostate cancer (NEPC). These tumors display many of the samemarkers found on neuroendocrine cells within the normal prostatesuch as positivity for synaptophysin, chromogranin, neuron-spe-cific enolase, and CD56 (23). De novo, these tumors make up lessthan 1% of organ-confined prostate cancers; however, 20–25% ofpatients with CRPC exhibit an NEPC phenotype. Many believethat is an underestimate, as it is not common practice to biopsymetastases. A morphological variant of NEPC termed small cellneuroendocrine carcinoma (SCNC) is highly aggressive, has littleto no response to androgen deprivation therapy, metastasizesreadily, and has limited treatment options (24). Due to the relativedifficulty of obtaining human tissue containing NEPC, our mo-lecular understanding of this disease is limited. A recent importantpaper identified NEPC to have alterations in genes regulating cellcycling, specifically a large number with AURKA and MYCNamplifications (25). Two morphological variants of NEPC (SCNCand prostate adenocarcinoma with neuroendocrine differentiation)were grouped together in this study for bioinformatic analyses. Thus,it is unclear how NEPC morphological subtypes are molecularlydifferent and how this compares to CRPC with an adenocarcinomaphenotype.We have previously identified a basal cell population within
the mouse and human prostate that has stem cell characteristics(26, 27). This population can give rise to all three epithelialpopulations and act as a tumor-initiating cell when modified toexpress oncogenes commonly altered in prostate cancer. In thisstudy, we sought to molecularly characterize the Trop2+ CD49fHi human basal stem cell population and determine if aggressivecancer reverts back to a stem cell state seen in the humanprostate. We show that the functionally identified Trop2+ CD49fHi human basal stem cell population is enriched for stem anddevelopmental pathways. We defined a basal stem cell genesignature and showed that metastatic prostate cancer wasenriched for this signature. Using a dataset comprised of dif-ferent metastatic prostate cancer phenotypes, we show thatmetastatic small cell carcinoma was the most enriched for thissignature and shared a transcriptional program with the basalstem cell population.
ResultsTissue Acquisition and RNA Sequencing Flow-Through. We acquiredprostate tissue from eight patients that had undergone radicalprostatectomy. These patients ranged in Gleason score from 6 to9. A pathologist outlined the benign and malignant regions on anH&E slide, and a trained technician separated the benign andmalignant regions of the tissue based on the outline. The tissueswere digested into single cell suspensions and sorted based onTrop2 and CD49f staining as described previously (27). Weaimed to collect four populations for each patient; however, dueto low numbers of certain populations, we were not able to collectall four populations for each patient. We were able to collectall four populations in two patients. In total, we acquired fivesamples for each of the four populations. Each sample was sub-jected to paired-end RNA sequencing (RNA-seq) and averaged
1.0 × 10⁸ paired reads that uniquely mapped to the human genome(Table S1 and Dataset S1).
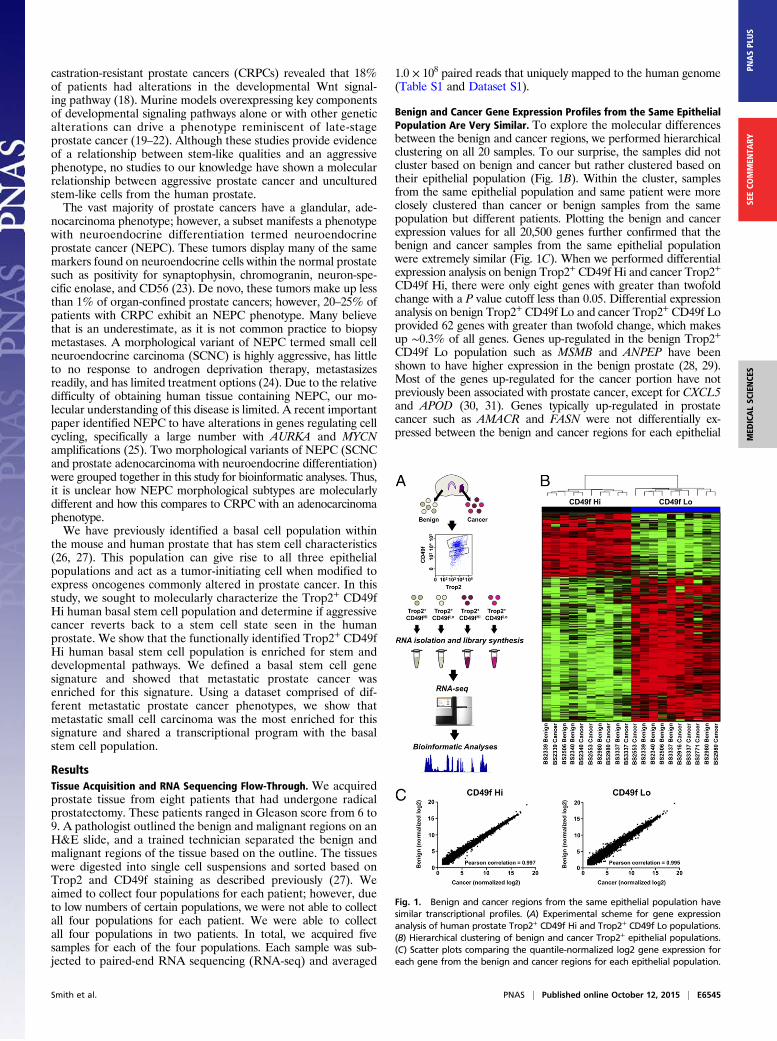
Benign and Cancer Gene Expression Profiles from the Same EpithelialPopulation Are Very Similar. To explore the molecular differencesbetween the benign and cancer regions, we performed hierarchicalclustering on all 20 samples. To our surprise, the samples did notcluster based on benign and cancer but rather clustered based ontheir epithelial population (Fig. 1B). Within the cluster, samplesfrom the same epithelial population and same patient were moreclosely clustered than cancer or benign samples from the samepopulation but different patients. Plotting the benign and cancerexpression values for all 20,500 genes further confirmed that thebenign and cancer samples from the same epithelial populationwere extremely similar (Fig. 1C). When we performed differentialexpression analysis on benign Trop2+ CD49f Hi and cancer Trop2+
CD49f Hi, there were only eight genes with greater than twofoldchange with a P value cutoff less than 0.05. Differential expressionanalysis on benign Trop2+ CD49f Lo and cancer Trop2+ CD49f Loprovided 62 genes with greater than twofold change, which makesup ∼0.3% of all genes. Genes up-regulated in the benign Trop2+
CD49f Lo population such as MSMB and ANPEP have beenshown to have higher expression in the benign prostate (28, 29).Most of the genes up-regulated for the cancer portion have notpreviously been associated with prostate cancer, except for CXCL5and APOD (30, 31). Genes typically up-regulated in prostatecancer such as AMACR and FASN were not differentially ex-pressed between the benign and cancer regions for each epithelial
Fig. 1. Benign and cancer regions from the same epithelial population havesimilar transcriptional profiles. (A) Experimental scheme for gene expressionanalysis of human prostate Trop2+ CD49f Hi and Trop2+ CD49f Lo populations.(B) Hierarchical clustering of benign and cancer Trop2+ epithelial populations.(C) Scatter plots comparing the quantile-normalized log2 gene expression foreach gene from the benign and cancer regions for each epithelial population.
Smith et al. PNAS | Published online October 12, 2015 | E6545
MED
ICALSC
IENCE
SPN
ASPL
US
SEECO
MMEN
TARY
population. We cannot rule out that the similarities in expressionprofiles may be due to contaminating normal cells within the regionoutlined as cancerous. The similarities in expression profiles couldbe also attributed to field effects. This occurs when histologicallynormal tissue adjacent to cancerous tissue acquires many of thesame genetic alterations seen in the malignant region. Field effectshave been seen in numerous epithelial cancers including head andneck, stomach, lung, and prostate (32–35).
Trop2+ CD49f Hi and Trop2+ CD49f Lo Subpopulations Are Enrichedfor Different Gene Sets/Pathways and Master Regulators. Becausethe benign and cancer transcriptional profiles for each populationwere extremely similar, we combined the samples from each sub-population to increase the statistical power for our comparison.Using linear models for microarray analysis (LIMMA), we
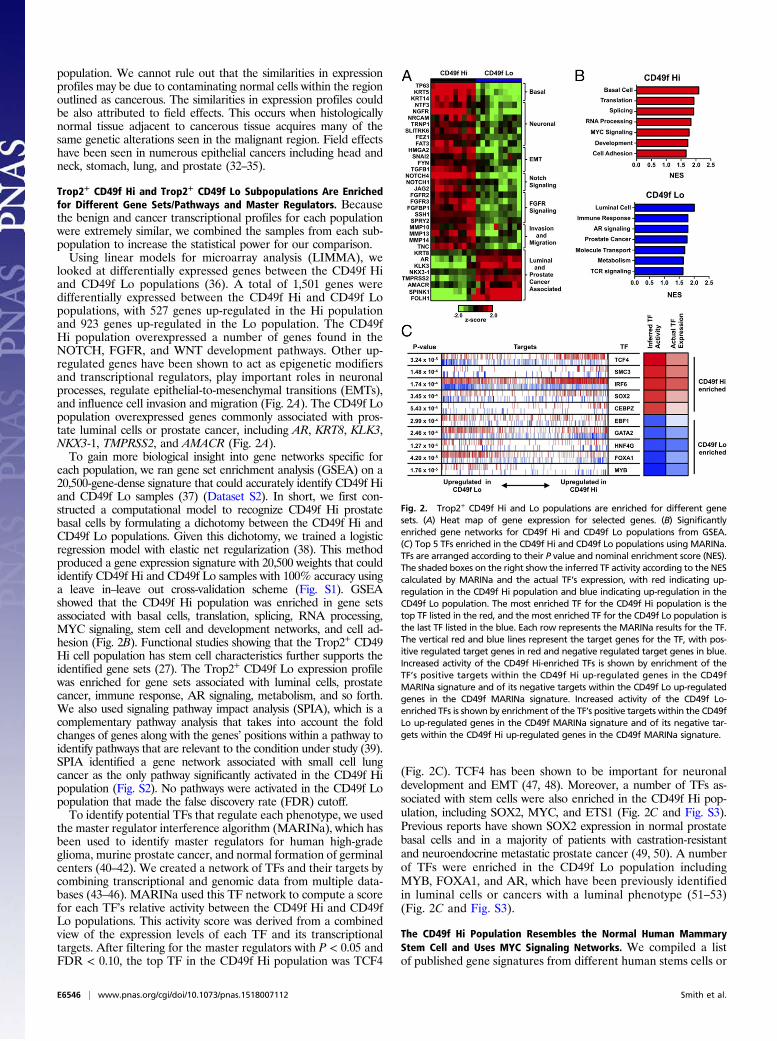
looked at differentially expressed genes between the CD49f Hiand CD49f Lo populations (36). A total of 1,501 genes weredifferentially expressed between the CD49f Hi and CD49f Lopopulations, with 527 genes up-regulated in the Hi populationand 923 genes up-regulated in the Lo population. The CD49fHi population overexpressed a number of genes found in theNOTCH, FGFR, and WNT development pathways. Other up-regulated genes have been shown to act as epigenetic modifiersand transcriptional regulators, play important roles in neuronalprocesses, regulate epithelial-to-mesenchymal transitions (EMTs),and influence cell invasion and migration (Fig. 2A). The CD49f Lopopulation overexpressed genes commonly associated with pros-tate luminal cells or prostate cancer, including AR, KRT8, KLK3,NKX3-1, TMPRSS2, and AMACR (Fig. 2A).To gain more biological insight into gene networks specific for
each population, we ran gene set enrichment analysis (GSEA) on a20,500-gene-dense signature that could accurately identify CD49f Hiand CD49f Lo samples (37) (Dataset S2). In short, we first con-structed a computational model to recognize CD49f Hi prostatebasal cells by formulating a dichotomy between the CD49f Hi andCD49f Lo populations. Given this dichotomy, we trained a logisticregression model with elastic net regularization (38). This methodproduced a gene expression signature with 20,500 weights that couldidentify CD49f Hi and CD49f Lo samples with 100% accuracy usinga leave in–leave out cross-validation scheme (Fig. S1). GSEAshowed that the CD49f Hi population was enriched in gene setsassociated with basal cells, translation, splicing, RNA processing,MYC signaling, stem cell and development networks, and cell ad-hesion (Fig. 2B). Functional studies showing that the Trop2+ CD49Hi cell population has stem cell characteristics further supports theidentified gene sets (27). The Trop2+ CD49f Lo expression profilewas enriched for gene sets associated with luminal cells, prostatecancer, immune response, AR signaling, metabolism, and so forth.We also used signaling pathway impact analysis (SPIA), which is acomplementary pathway analysis that takes into account the foldchanges of genes along with the genes’ positions within a pathway toidentify pathways that are relevant to the condition under study (39).SPIA identified a gene network associated with small cell lungcancer as the only pathway significantly activated in the CD49f Hipopulation (Fig. S2). No pathways were activated in the CD49f Lopopulation that made the false discovery rate (FDR) cutoff.To identify potential TFs that regulate each phenotype, we used
the master regulator interference algorithm (MARINa), which hasbeen used to identify master regulators for human high-gradeglioma, murine prostate cancer, and normal formation of germinalcenters (40–42). We created a network of TFs and their targets bycombining transcriptional and genomic data from multiple data-bases (43–46). MARINa used this TF network to compute a scorefor each TF’s relative activity between the CD49f Hi and CD49fLo populations. This activity score was derived from a combinedview of the expression levels of each TF and its transcriptionaltargets. After filtering for the master regulators with P < 0.05 andFDR < 0.10, the top TF in the CD49f Hi population was TCF4
(Fig. 2C). TCF4 has been shown to be important for neuronaldevelopment and EMT (47, 48). Moreover, a number of TFs as-sociated with stem cells were also enriched in the CD49f Hi pop-ulation, including SOX2, MYC, and ETS1 (Fig. 2C and Fig. S3).Previous reports have shown SOX2 expression in normal prostatebasal cells and in a majority of patients with castration-resistantand neuroendocrine metastatic prostate cancer (49, 50). A numberof TFs were enriched in the CD49f Lo population includingMYB, FOXA1, and AR, which have been previously identifiedin luminal cells or cancers with a luminal phenotype (51–53)(Fig. 2C and Fig. S3).
The CD49f Hi Population Resembles the Normal Human MammaryStem Cell and Uses MYC Signaling Networks. We compiled a listof published gene signatures from different human stems cells or
Fig. 2. Trop2+ CD49f Hi and Lo populations are enriched for different genesets. (A) Heat map of gene expression for selected genes. (B) Significantlyenriched gene networks for CD49f Hi and CD49f Lo populations from GSEA.(C) Top 5 TFs enriched in the CD49f Hi and CD49f Lo populations using MARINa.TFs are arranged according to their P value and nominal enrichment score (NES).The shaded boxes on the right show the inferred TF activity according to the NEScalculated by MARINa and the actual TF’s expression, with red indicating up-regulation in the CD49f Hi population and blue indicating up-regulation in theCD49f Lo population. The most enriched TF for the CD49f Hi population is thetop TF listed in the red, and the most enriched TF for the CD49f Lo population isthe last TF listed in the blue. Each row represents the MARINa results for the TF.The vertical red and blue lines represent the target genes for the TF, with pos-itive regulated target genes in red and negative regulated target genes in blue.Increased activity of the CD49f Hi-enriched TFs is shown by enrichment of theTF’s positive targets within the CD49f Hi up-regulated genes in the CD49fMARINa signature and of its negative targets within the CD49f Lo up-regulatedgenes in the CD49f MARINa signature. Increased activity of the CD49f Lo-enriched TFs is shown by enrichment of the TF’s positive targets within the CD49fLo up-regulated genes in the CD49f MARINa signature and of its negative tar-gets within the CD49f Hi up-regulated genes in the CD49f MARINa signature.
E6546 | www.pnas.org/cgi/doi/10.1073/pnas.1518007112 Smith et al.
signaling modules to determine if the CD49f Hi population re-sembled stem cells from other human tissues (14, 15, 54–58). Weused GSEA to apply each stem cell signature against the CD49fHi 20,500-gene-dense signature. The CD49f Hi population wasmost similar to normal mammary stem cell signatures from twodifferent datasets but not stem cells from any other tissue (Fig.S4). The CD49f Hi population was also associated with a MYCsignaling network and a human ESC-like signature. Integrationof protein–protein and DNA–protein studies has shown that thetranscription factor MYC constitutes a signaling network that isdistinct from a core ESC transcriptional program, and this MYCsignaling is responsible for the similarities between ESCs andcancer (57). Moreover, MYC can induce an ESC-like transcrip-tional profile when transduced into keratinocytes expressing knownoncogenes (58). The CD49f Lo population was enriched for thenormal mammary luminal mature signature and PRC2 targets,suggesting that this population is more differentiated. Interestingly,the CD49f Lo population was also enriched for the normal mam-mary luminal progenitor signature (Fig. S4). Using an organoidculture system, it has been shown that a small subset of human
prostate luminal cells have progenitor-like capabilities (59). Geneontology analysis of the leading-edges genes from the mammaryluminal progenitor signature showed that these genes were associ-ated with immune response, response to wounding, and defenseresponse, but none of the terms were associated with developmentalor stem cell gene networks. Although unable to form human pros-tate glands in the in vivo regeneration assay (27), it is possible that asubset of progenitor cells reside within the CD49f Lo population asmeasured by a different functional assay.
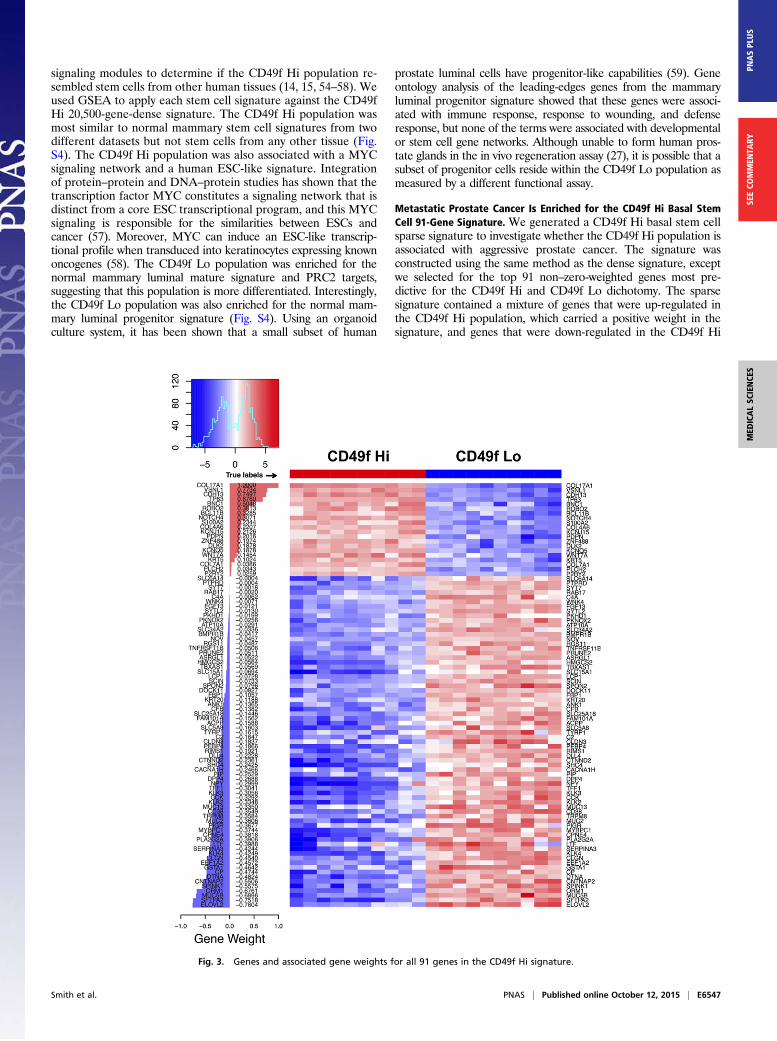
Metastatic Prostate Cancer Is Enriched for the CD49f Hi Basal StemCell 91-Gene Signature. We generated a CD49f Hi basal stem cellsparse signature to investigate whether the CD49f Hi population isassociated with aggressive prostate cancer. The signature wasconstructed using the same method as the dense signature, exceptwe selected for the top 91 non–zero-weighted genes most pre-dictive for the CD49f Hi and CD49f Lo dichotomy. The sparsesignature contained a mixture of genes that were up-regulated inthe CD49f Hi population, which carried a positive weight in thesignature, and genes that were down-regulated in the CD49f Hi
Fig. 3. Genes and associated gene weights for all 91 genes in the CD49f Hi signature.
Smith et al. PNAS | Published online October 12, 2015 | E6547
MED
ICALSC
IENCE
SPN
ASPL
US
SEECO
MMEN
TARY
population, which carried a negative weight (Fig. 3). A number ofgenes carrying a positive weight have been associated with stemcells including NOTCH4, WNT7A, and PDPN. The majority of thegenes carried a negative weight, and these genes were associatedwith epithelial structure maintenance, response to extracellularstimuli, and acute inflammatory responses.We applied the signature to organ-confined prostate adeno-
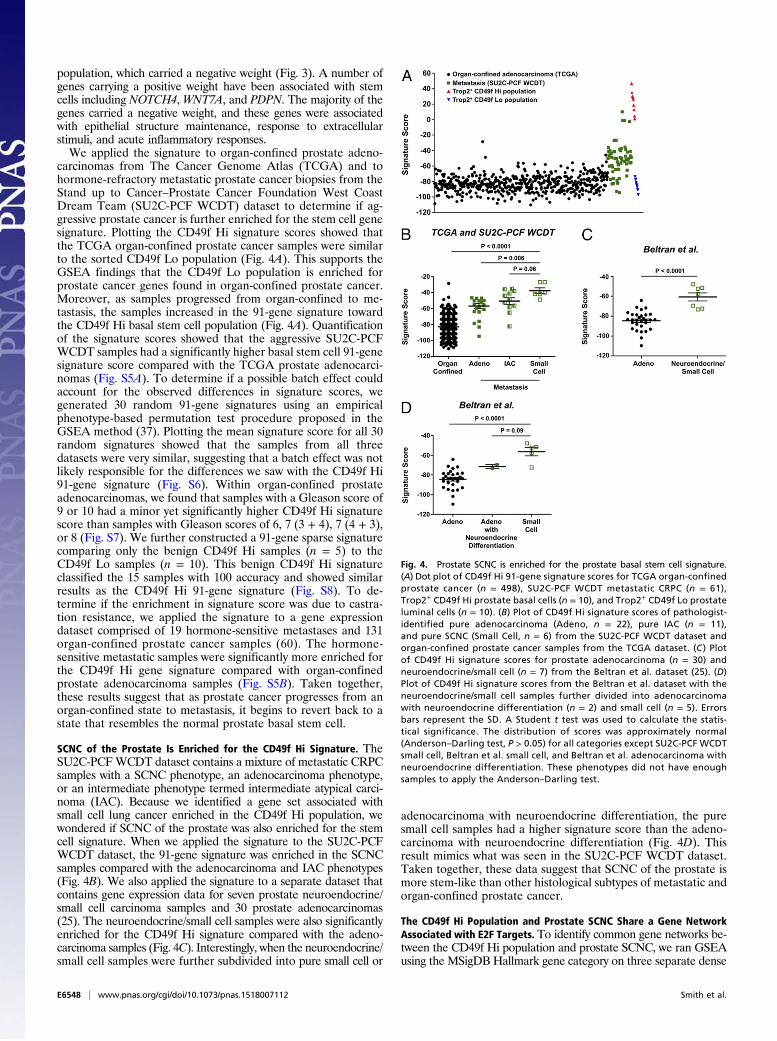
carcinomas from The Cancer Genome Atlas (TCGA) and tohormone-refractory metastatic prostate cancer biopsies from theStand up to Cancer–Prostate Cancer Foundation West CoastDream Team (SU2C-PCF WCDT) dataset to determine if ag-gressive prostate cancer is further enriched for the stem cell genesignature. Plotting the CD49f Hi signature scores showed thatthe TCGA organ-confined prostate cancer samples were similarto the sorted CD49f Lo population (Fig. 4A). This supports theGSEA findings that the CD49f Lo population is enriched forprostate cancer genes found in organ-confined prostate cancer.Moreover, as samples progressed from organ-confined to me-tastasis, the samples increased in the 91-gene signature towardthe CD49f Hi basal stem cell population (Fig. 4A). Quantificationof the signature scores showed that the aggressive SU2C-PCFWCDT samples had a significantly higher basal stem cell 91-genesignature score compared with the TCGA prostate adenocarci-nomas (Fig. S5A). To determine if a possible batch effect couldaccount for the observed differences in signature scores, wegenerated 30 random 91-gene signatures using an empiricalphenotype-based permutation test procedure proposed in theGSEA method (37). Plotting the mean signature score for all 30random signatures showed that the samples from all threedatasets were very similar, suggesting that a batch effect was notlikely responsible for the differences we saw with the CD49f Hi91-gene signature (Fig. S6). Within organ-confined prostateadenocarcinomas, we found that samples with a Gleason score of9 or 10 had a minor yet significantly higher CD49f Hi signaturescore than samples with Gleason scores of 6, 7 (3 + 4), 7 (4 + 3),or 8 (Fig. S7). We further constructed a 91-gene sparse signaturecomparing only the benign CD49f Hi samples (n = 5) to theCD49f Lo samples (n = 10). This benign CD49f Hi signatureclassified the 15 samples with 100 accuracy and showed similarresults as the CD49f Hi 91-gene signature (Fig. S8). To de-termine if the enrichment in signature score was due to castra-tion resistance, we applied the signature to a gene expressiondataset comprised of 19 hormone-sensitive metastases and 131organ-confined prostate cancer samples (60). The hormone-sensitive metastatic samples were significantly more enriched forthe CD49f Hi gene signature compared with organ-confinedprostate adenocarcinoma samples (Fig. S5B). Taken together,these results suggest that as prostate cancer progresses from anorgan-confined state to metastasis, it begins to revert back to astate that resembles the normal prostate basal stem cell.
SCNC of the Prostate Is Enriched for the CD49f Hi Signature. TheSU2C-PCFWCDT dataset contains a mixture of metastatic CRPCsamples with a SCNC phenotype, an adenocarcinoma phenotype,or an intermediate phenotype termed intermediate atypical carci-noma (IAC). Because we identified a gene set associated withsmall cell lung cancer enriched in the CD49f Hi population, wewondered if SCNC of the prostate was also enriched for the stemcell signature. When we applied the signature to the SU2C-PCFWCDT dataset, the 91-gene signature was enriched in the SCNCsamples compared with the adenocarcinoma and IAC phenotypes(Fig. 4B). We also applied the signature to a separate dataset thatcontains gene expression data for seven prostate neuroendocrine/small cell carcinoma samples and 30 prostate adenocarcinomas(25). The neuroendocrine/small cell samples were also significantlyenriched for the CD49f Hi signature compared with the adeno-carcinoma samples (Fig. 4C). Interestingly, when the neuroendocrine/small cell samples were further subdivided into pure small cell or
adenocarcinoma with neuroendocrine differentiation, the puresmall cell samples had a higher signature score than the adeno-carcinoma with neuroendocrine differentiation (Fig. 4D). Thisresult mimics what was seen in the SU2C-PCF WCDT dataset.Taken together, these data suggest that SCNC of the prostate ismore stem-like than other histological subtypes of metastatic andorgan-confined prostate cancer.
The CD49f Hi Population and Prostate SCNC Share a Gene NetworkAssociated with E2F Targets. To identify common gene networks be-tween the CD49f Hi population and prostate SCNC, we ran GSEAusing the MSigDB Hallmark gene category on three separate dense
Fig. 4. Prostate SCNC is enriched for the prostate basal stem cell signature.(A) Dot plot of CD49f Hi 91-gene signature scores for TCGA organ-confinedprostate cancer (n = 498), SU2C-PCF WCDT metastatic CRPC (n = 61),Trop2+ CD49f Hi prostate basal cells (n = 10), and Trop2+ CD49f Lo prostateluminal cells (n = 10). (B) Plot of CD49f Hi signature scores of pathologist-identified pure adenocarcinoma (Adeno, n = 22), pure IAC (n = 11),and pure SCNC (Small Cell, n = 6) from the SU2C-PCF WCDT dataset andorgan-confined prostate cancer samples from the TCGA dataset. (C ) Plotof CD49f Hi signature scores for prostate adenocarcinoma (n = 30) andneuroendocrine/small cell (n = 7) from the Beltran et al. dataset (25). (D)Plot of CD49f Hi signature scores from the Beltran et al. dataset with theneuroendocrine/small cell samples further divided into adenocarcinomawith neuroendocrine differentiation (n = 2) and small cell (n = 5). Errorsbars represent the SD. A Student t test was used to calculate the statis-tical significance. The distribution of scores was approximately normal(Anderson–Darling test, P > 0.05) for all categories except SU2C-PCF WCDTsmall cell, Beltran et al. small cell, and Beltran et al. adenocarcinoma withneuroendocrine differentiation. These phenotypes did not have enoughsamples to apply the Anderson–Darling test.
E6548 | www.pnas.org/cgi/doi/10.1073/pnas.1518007112 Smith et al.
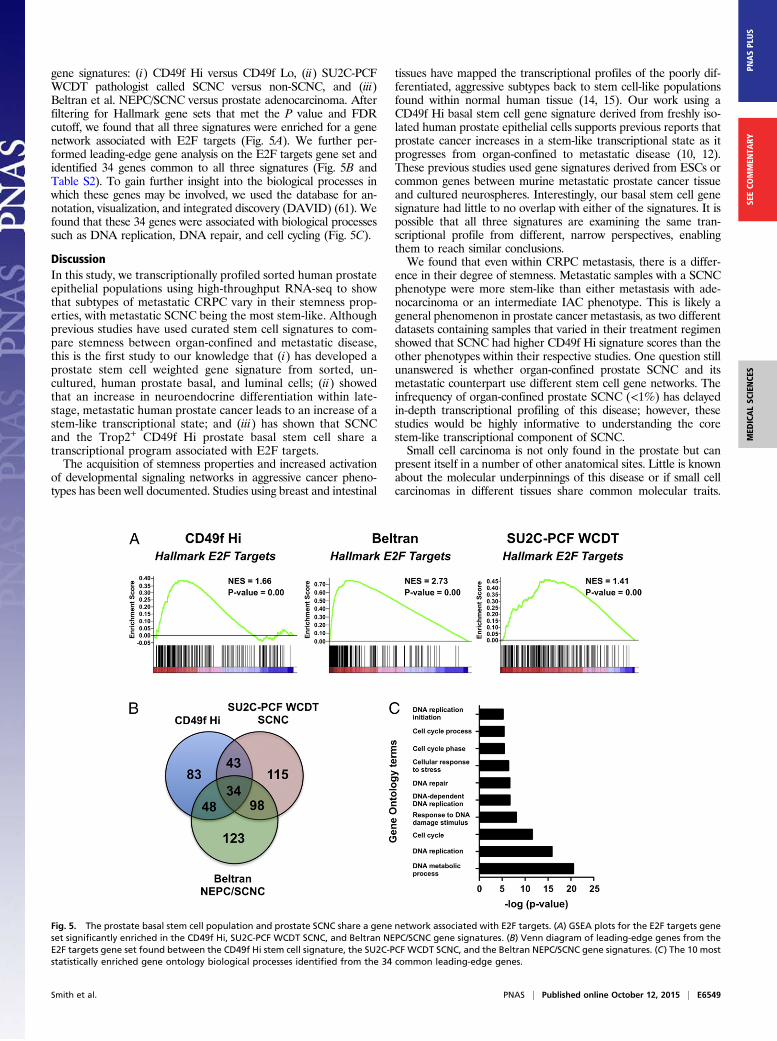
gene signatures: (i) CD49f Hi versus CD49f Lo, (ii) SU2C-PCFWCDT pathologist called SCNC versus non-SCNC, and (iii)Beltran et al. NEPC/SCNC versus prostate adenocarcinoma. Afterfiltering for Hallmark gene sets that met the P value and FDRcutoff, we found that all three signatures were enriched for a genenetwork associated with E2F targets (Fig. 5A). We further per-formed leading-edge gene analysis on the E2F targets gene set andidentified 34 genes common to all three signatures (Fig. 5B andTable S2). To gain further insight into the biological processes inwhich these genes may be involved, we used the database for an-notation, visualization, and integrated discovery (DAVID) (61). Wefound that these 34 genes were associated with biological processessuch as DNA replication, DNA repair, and cell cycling (Fig. 5C).
DiscussionIn this study, we transcriptionally profiled sorted human prostateepithelial populations using high-throughput RNA-seq to showthat subtypes of metastatic CRPC vary in their stemness prop-erties, with metastatic SCNC being the most stem-like. Althoughprevious studies have used curated stem cell signatures to com-pare stemness between organ-confined and metastatic disease,this is the first study to our knowledge that (i) has developed aprostate stem cell weighted gene signature from sorted, un-cultured, human prostate basal, and luminal cells; (ii) showedthat an increase in neuroendocrine differentiation within late-stage, metastatic human prostate cancer leads to an increase of astem-like transcriptional state; and (iii) has shown that SCNCand the Trop2+ CD49f Hi prostate basal stem cell share atranscriptional program associated with E2F targets.The acquisition of stemness properties and increased activation
of developmental signaling networks in aggressive cancer pheno-types has been well documented. Studies using breast and intestinal
tissues have mapped the transcriptional profiles of the poorly dif-ferentiated, aggressive subtypes back to stem cell-like populationsfound within normal human tissue (14, 15). Our work using aCD49f Hi basal stem cell gene signature derived from freshly iso-lated human prostate epithelial cells supports previous reports thatprostate cancer increases in a stem-like transcriptional state as itprogresses from organ-confined to metastatic disease (10, 12).These previous studies used gene signatures derived from ESCs orcommon genes between murine metastatic prostate cancer tissueand cultured neurospheres. Interestingly, our basal stem cell genesignature had little to no overlap with either of the signatures. It ispossible that all three signatures are examining the same tran-scriptional profile from different, narrow perspectives, enablingthem to reach similar conclusions.We found that even within CRPC metastasis, there is a differ-
ence in their degree of stemness. Metastatic samples with a SCNCphenotype were more stem-like than either metastasis with ade-nocarcinoma or an intermediate IAC phenotype. This is likely ageneral phenomenon in prostate cancer metastasis, as two differentdatasets containing samples that varied in their treatment regimenshowed that SCNC had higher CD49f Hi signature scores than theother phenotypes within their respective studies. One question stillunanswered is whether organ-confined prostate SCNC and itsmetastatic counterpart use different stem cell gene networks. Theinfrequency of organ-confined prostate SCNC (<1%) has delayedin-depth transcriptional profiling of this disease; however, thesestudies would be highly informative to understanding the corestem-like transcriptional component of SCNC.Small cell carcinoma is not only found in the prostate but can
present itself in a number of other anatomical sites. Little is knownabout the molecular underpinnings of this disease or if small cellcarcinomas in different tissues share common molecular traits.
Fig. 5. The prostate basal stem cell population and prostate SCNC share a gene network associated with E2F targets. (A) GSEA plots for the E2F targets geneset significantly enriched in the CD49f Hi, SU2C-PCF WCDT SCNC, and Beltran NEPC/SCNC gene signatures. (B) Venn diagram of leading-edge genes from theE2F targets gene set found between the CD49f Hi stem cell signature, the SU2C-PCF WCDT SCNC, and the Beltran NEPC/SCNC gene signatures. (C) The 10 moststatistically enriched gene ontology biological processes identified from the 34 common leading-edge genes.
Smith et al. PNAS | Published online October 12, 2015 | E6549
MED
ICALSC
IENCE
SPN
ASPL
US
SEECO
MMEN
TARY
Molecular profiling of the most common small cell carcinoma, smallcell lung cancer, suggests that there is a stem cell component to thedisease. Small cell lung cancer exhibits SOX2 amplification in 34%of patients and activation of hedgehog signaling (62, 63). Similarly,immunohistochemistry has identified SOX2 expression in a majorityof patients with metastatic NEPC (50). Deregulation of the E2F-Rbpathway, which is commonly altered in small cell carcinoma, canlead to overexpression of PRC2 genes (64, 65). These genes arevital for maintaining self-renewal capacity in embryonic and adultstem cells (66). Recent evidence has also shown Rb alterationscan facilitate reprogramming of fibroblasts to a pluripotent statethrough derepression of pluripotency factors such as SOX2 (67). Inthe CD49f Hi population, we found enrichment of both E2F andSOX2 targets, further supporting that these networks may be partof a stem-like component common to small cell carcinomas.Cellular plasticity is another hallmark characteristic of stem cells
that is also seen in small cell carcinomas. Studies in the lung,bladder, and prostate have shown that small cell carcinomas canshare genetic alterations with a different coexisting carcinoma (68–70). These results can be explained by transdifferentiation, de-dif-ferentiation, or outgrowth of both phenotypes from a common stem-like clone. Our laboratory has shown that lentiviral introduction ofNMYC and myristoylated AKT into human benign prostate CD49fHi cells can initiate the formation of biphenotypic tumors that havean adenocarcinoma and SCNC component. This supports the ideathat a tissue stem cell may be predisposed to forming biphenotypictumors when challenged with the correct combination of oncogenicinsults. In vitro, the prostate adenocarcinoma cell line LNCaP candisplay neuroendocrine differentiation when exposed to numerousstimuli including hormone-depleted media (71). This observationalong with the increased incidence of SCNC in metastatic CRPC hasled many to believe that the appearance of neuroendocrine differ-entiation or SCNC may be a resistance mechanism to androgendeprivation therapy and AR-targeted drugs. It is possible thatmultiple mechanisms may lead to the appearance of SCNC, andfuture work is needed to elucidate the pathways or gene networksresponsible for this observed phenotypic plasticity. Moreover, fur-ther investigation is needed into the therapeutic targeting of thesemolecular programs that govern the stem-like component of SCNC.
Experimental ProceduresTissue Procurement. The acquisition of primary human prostate tissue fromradical prostatectomy, dissociation into single cells, and FACS purification haspreviously been described (27).
Library Construction and RNA-seq of Epithelial Populations. RNA was isolatedusing RNeasy Mini Kit (QIAGEN), and RNA quality was tested using an AgilentBioanalyzer 2100 Eukaryote Total RNA Pico assay. Samples with a RNA in-tegrity number (RIN) > 8 were used for construction of RNA-seq libraries.RNA-seq libraries were constructed using the Nugen kit. The RNA-seq li-braries, after a final purification and after adapter ligation, were quanti-tated using both the Agilent 2100 Bioanalyzer High Sensitivity DNA assayand Qubit dsDNA HS assay (Thermo Fisher), per the manufacturer’s recom-mended protocols. The pooled multiplexed libraries were sequenced to gen-erate 100-bp paired-end reads on an Illumina HiSEq 2000 platform. Raw RNA-seq files were mapped to the hg19 human genome using MapSplice, andtranscripts were quantified using RNA-seq by expectation-maximization (RSEM).
Unsupervised Clustering, Differential Expression Analysis, and SPIA. Sampleswere clustered based on genes that had expression values greater or equal to1 SD from the mean expression value for all samples. Unsupervised hierarchicalclustering was performed using Cluster 3.0 with Pearson correlation and com-plete linkage analysis and visualized using Jave TreeView. Differentially ex-pression analysis was performed using the LIMMA R/Bioconductor package (72,73). We kept genes with greater than or equal to twofold differential expres-sion between the CD49f Hi and CD49f Lo populations with a P value greaterthan or equal to 0.05. SPIA was performed using the Graphite Web interfacewith an input of genes with twofold differential expression between the CD49fHi and CD49f Lo populations and the KEGG pathway database (74). We filteredfor pathways with a FDR lower than 0.05.
MARINa Analysis. We created a compendium of TFs and their targets (TFregulons) by combining information from four databases: SuperPathway (43),Literome (44), Multinet (45), and ChEA (46). We ran MARINa master regu-lator analysis using the previously described TF compendium. MARINa TFscores capture each TF’s relative activity between two cohorts of interest.The activity score is derived from a combined view of the expression levels ofeach TF’s regulon, based on the following steps: (i) The TF regulon is splitinto positively and negatively regulated sets by measuring the Spearmancorrelation between the expression of the TF and that of each of its targets.(ii) A t statistic derived from the difference in gene expression between thetwo classes of interest is computed for each gene. All genes are rankedbased on their t statistics to produce a CD49f MARINa gene signature.(iii) Each TF’s activation and inhibition regulons are examined for enrich-ment in the high or low end of the ranked gene list. The rankings of thepositively and negatively regulated genes are then combined and examinedsimultaneously. A TF whose two target sets show consistent enrichment (i.e.,the activated set is enriched for highly ranked genes and the inhibited set isenriched for lowly ranked ones, or vice versa) receives the highest/lowestactivity scores, respectively. MARINa activity scores are therefore more ro-bust measures of activity than differences in the individual expression of theTF or its targets. We compared relative TF activity between the CD49f Hi (n =10) and CD49 Lo (n = 10) samples. We ran MARINa with its default settings,which scored TFs with a minimum of 25 targets.
Development of CD49f Hi Basal Stem Cell Gene Signatures. We constructed acomputational model to recognize CD49f Hi prostate basal stem cells byformulating a dichotomy between CD49f Hi and CD49f Lo cells. Given thisdichotomy, we trained a logistic regressionmodelwith elastic net regularization(38). The elastic net regularization is characterized by two parameters: one forthe ridge regression term, and one for the LASSO term. For the 20,500-gene-dense signature, we set the LASSO term penalty coefficient to 0.0 and leavingthe ridge regression term coefficient at 1.0. For the 91-gene-sparse signature,we fixed the ridge regression term coefficient at 1.0 and the LASSO term pa-rameter at 0.1. We validated our model in silico through leave-pair-out cross-validation. This cross-validation scheme iterates over all possible pairs of oneCD49f Hi sample and one CD49f Lo sample, withholding each pair in turn fromtraining. The model is then trained using all other samples and applied back tothe withheld pair for evaluation. In our experiments, we found that the modelwas able to identify CD49f Hi and CD49f Lo samples with 100% accuracy. GSEAwas performed on the 20,500-dense weighted gene signature using GSEA v2.2with 1,000 gene set permutations. A gene set was considered to be significantlyenriched in one of the two groups when the P value was lower than 0.05 andthe FDR was lower than 0.25 for the corresponding gene set.
Comparing CD49f Hi Gene Signature to Other Stem Cell Signatures. Weobtained human stem cell signatures and stem cell-associate gene modulesfrom Merlos-Suárez et al. (14), Pece et al. (15), Ben-Porath et al. (54), Creightonet al. (55), Lim et al. (56), Kim et al. (57), and Wong et al. (58). For each curatedsignature, we selected genes that were up-regulated for the signature in-dicated and had an associated Human Genome Organization (HUGO) ID. Thename of the signature and the number of genes associated with each stem cellsignature are as follows: Lim Mammary Stem Cell (899 genes), Lim MammaryLuminal Progenitor (342 genes), Lim Mammary Luminal Mature (534genes), Kim Myc Module (355 genes), Kim Core Module (75 genes), WongESC-like (1,242 genes), Pece Mammary Stem Cell (818 genes), Creighton BreastCancer Stem Cell (111 genes), Ben-Porath NOS Targets (179 genes), Ben-PorathMyc Targets 1 (228 genes), Ben-PorathMyc Targets 2 (774 genes), Ben-Porath ESExp 1 (380 genes), Ben-Porath ES Exp 2 (40 genes), Ben-Porath PRC2 Targets(642 genes), Merlos-Suarez Intestinal Stem Cell (52 genes), Eppert LeukemicStem Cell (41 genes), and Eppert Hematopoietic Stem Cell (125 genes). Tocompare the CD49f Hi signature to curated stem cell signatures, we ran GSEAusing 1,000 permutations.
CD49f Hi Signature Scores for Prostate Cancer Phenotypes. We downloadedthe level 3 TCGA prostate adenocarcinoma RNA-seq from the TCGA Dataportal (June 2015 data freeze). The gene expression data for hormone-sensitive organ-confined and metastatic prostate cancer was downloadedfrom GSE20134. CD49f Hi signature scores were computed for each samplewithin the sorted epithelial populations and prostate cancer subtypes bymultiplying the weight for each gene in the signature by the normalized log2expression value for that gene within the sample and summing the values forall 91 genes from the signature. All samples including the Trop2+ CD49f Hisamples, Trop2+ CD49f Lo samples, SU2C-PCF WCDT metastatic samples, andthe TCGA prostate adenocarcinoma samples went through the same map-ping and expression pipeline. A scaling value was added to the sum for all of
E6550 | www.pnas.org/cgi/doi/10.1073/pnas.1518007112 Smith et al.
the samples. To assess the robustness of signature scores and investigate thepresence of a batch effect, we generated 30 random 91-gene signatures usingan empirical phenotype-based permutation test procedure proposed in theGSEAmethod (37). Specifically, we randomly permuted the CD49f Hi and CD49fLo labels and reran our method using this new permutation to produce abackground weighted gene signature. The random 91-gene signature scoresfor each sample were computed using the same method as the CD49f Hi 91-gene signature. A Student t test was used to calculate the statistical significancewhen comparing two prostate cancer phenotypes.
Identification of Common Stem Cell and SCNC Gene Networks. Dense genesignatures were constructed for pathologist-identified small cell (SCNC)versus non-small cell (non-SCNC) samples from the SU2C-PCF WCDT datasetand NEPC/SCNC versus prostate adenocarcinoma from Beltran et al. using thesame method described for the CD49f Hi 20,500-gene-dense signature. Thisgave an 18,935-gene SU2C-PCF SCNC versus non-SCNC weighted signatureand a 20,500-gene Beltran NEPC/SCNC versus prostate adenocarcinoma genesignature. GSEA was run on the 20,500-gene CD49f Hi versus CD49f Lo,18,935-gene SU2C-PCF SCNC versus non-SCNC, and 20,500-gene Beltran NEPC/SCNC versus prostate adenocarcinoma gene signatures using the Hallmarkscategory in MSigDB. A cutoff of P ≤ 0.05 and FDR ≤ 0.25 was applied to
identify statistically enriched gene sets. Leading-edge genes analysis wasused to identify genes that drove a signature’s enrichment for each specificgene network. The common leading-edge genes found within all threesignatures were uploaded to the DAVID website (david.abcc.ncifcrf.gov/).Gene Ontology terms for biological processes were then identified.
ACKNOWLEDGMENTS. We thank members of the O.N.W. and J.M.S. labo-ratories for helpful comments and discussion on the manuscript. We thankthe Tissue Procurement Core Laboratory at University of California, LosAngeles (UCLA) for assistance on tissue processing and H&E staining, UCLAClinical Microarray Core for construction of the RNA-seq barcoded libraries,and the High Throughput Sequencing Core at the Eli and Edythe Broad StemCell Research Center for performing RNA-seq. This work was supported byUCLA Tumor Immunology Training Program T32 CA009120 (to B.A.S.). J.M.S.is supported by NIH Grant U24-CA143858. O.N.W. is an investigator ofthe Howard Hughes Medical Institute and partially supported by the Eliand Edythe Broad Center of Regenerative Medicine and Stem Cell Research.O.N.W. and J.M.S. are supported by Stand up to Cancer/American Associa-tion for Cancer Research/Prostate Cancer Foundation Grant SU2C-AACR-DT0812 (O.N.W. co-principal investigator). This research grant is made pos-sible by the generous support of the Movember Foundation. Stand up toCancer is a program of the Entertainment Industry Foundation administeredby the American Association for Cancer Research.
1. Oskarsson T, Batlle E, Massagué J (2014) Metastatic stem cells: Sources, niches, andvital pathways. Cell Stem Cell 14(3):306–321.
2. Chaffer CL, Weinberg RA (2011) A perspective on cancer cell metastasis. Science331(6024):1559–1564.
3. Vanharanta S, Massagué J (2013) Origins of metastatic traits. Cancer Cell 24(4):410–421.
4. Bonnet D, Dick JE (1997) Human acute myeloid leukemia is organized as a hierarchythat originates from a primitive hematopoietic cell. Nat Med 3(7):730–737.
5. Chen J, et al. (2012) A restricted cell population propagates glioblastoma growthafter chemotherapy. Nature 488(7412):522–526.
6. Mani SA, et al. (2008) The epithelial-mesenchymal transition generates cells withproperties of stem cells. Cell 133(4):704–715.
7. Driessens G, Beck B, Caauwe A, Simons BD, Blanpain C (2012) Defining the mode oftumour growth by clonal analysis. Nature 488(7412):527–530.
8. Hermann PC, et al. (2007) Distinct populations of cancer stem cells determine tumorgrowth and metastatic activity in human pancreatic cancer. Cell Stem Cell 1(3):313–323.
9. Santagata S, Ligon KL, Hornick JL (2007) Embryonic stem cell transcription factorsignatures in the diagnosis of primary and metastatic germ cell tumors. Am J SurgPathol 31(6):836–845.
10. Markert EK, Mizuno H, Vazquez A, Levine AJ (2011) Molecular classification ofprostate cancer using curated expression signatures. Proc Natl Acad Sci USA 108(52):21276–21281.
11. Shats I, et al. (2011) Using a stem cell-based signature to guide therapeutic selectionin cancer. Cancer Res 71(5):1772–1780.
12. Glinsky GV, Berezovska O, Glinskii AB (2005) Microarray analysis identifies a death-from-cancer signature predicting therapy failure in patients with multiple types ofcancer. J Clin Invest 115(6):1503–1521.
13. Dieter SM, et al. (2011) Distinct types of tumor-initiating cells form human coloncancer tumors and metastases. Cell Stem Cell 9(4):357–365.
14. Merlos-Suárez A, et al. (2011) The intestinal stem cell signature identifies colorectalcancer stem cells and predicts disease relapse. Cell Stem Cell 8(5):511–524.
15. Pece S, et al. (2010) Biological and molecular heterogeneity of breast cancers corre-lates with their cancer stem cell content. Cell 140(1):62–73.
16. Baccelli I, et al. (2013) Identification of a population of blood circulating tumor cellsfrom breast cancer patients that initiates metastasis in a xenograft assay. NatBiotechnol 31(6):539–544.
17. Eppert K, et al. (2011) Stem cell gene expression programs influence clinical outcomein human leukemia. Nat Med 17(9):1086–1093.
18. Robinson D, et al. (2015) Integrative clinical genomics of advanced prostate cancer.Cell 161(5):1215–1228.
19. Karhadkar SS, et al. (2004) Hedgehog signalling in prostate regeneration, neoplasiaand metastasis. Nature 431(7009):707–712.
20. Acevedo VD, et al. (2007) Inducible FGFR-1 activation leads to irreversible prostateadenocarcinoma and an epithelial-to-mesenchymal transition. Cancer Cell 12(6):559–571.
21. Yu X, Wang Y, DeGraff DJ, Wills ML, Matusik RJ (2011) Wnt/β-catenin activationpromotes prostate tumor progression in a mouse model. Oncogene 30(16):1868–1879.
22. Stoyanova T, et al. (2013) Prostate cancer originating in basal cells progresses toadenocarcinoma propagated by luminal-like cells. Proc Natl Acad Sci USA 110(50):20111–20116.
23. Terry S, Beltran H (2014) The many faces of neuroendocrine differentiation in pros-tate cancer progression. Front Oncol 4(60):60.
24. Nadal R, Schweizer M, Kryvenko ON, Epstein JI, Eisenberger MA (2014) Small cellcarcinoma of the prostate. Nat Rev Urol 11(4):213–219.
25. Beltran H, et al. (2011) Molecular characterization of neuroendocrine prostate cancerand identification of new drug targets. Cancer Discov 1(6):487–495.
26. Goldstein AS, et al. (2008) Trop2 identifies a subpopulation of murine and humanprostate basal cells with stem cell characteristics. Proc Natl Acad Sci USA 105(52):20882–20887.
27. Goldstein AS, Huang J, Guo C, Garraway IP, Witte ON (2010) Identification of a cell oforigin for human prostate cancer. Science 329(5991):568–571.
28. Whitaker HC, Warren AY, Eeles R, Kote-Jarai Z, Neal DE (2010) The potential value ofmicroseminoprotein-beta as a prostate cancer biomarker and therapeutic target.Prostate 70(3):333–340.
29. Sørensen KD, et al. (2013) Prognostic significance of aberrantly silenced ANPEP ex-pression in prostate cancer. Br J Cancer 108(2):420–428.
30. Rodríguez JC, et al. (2000) Apolipoprotein D expression in benign and malignantprostate tissues. Int J Surg Investig 2(4):319–326.
31. Begley LA, et al. (2008) CXCL5 promotes prostate cancer progression. Neoplasia 10(3):244–254.
32. Chai H, Brown RE (2009) Field effect in cancer-an update. Ann Clin Lab Sci 39(4):331–337.
33. Yu YP, et al. (2004) Gene expression alterations in prostate cancer predicting tumoraggression and preceding development of malignancy. J Clin Oncol 22(14):2790–2799.
34. Cooper CS, et al.; ICGC Prostate Group (2015) Analysis of the genetic phylogeny ofmultifocal prostate cancer identifies multiple independent clonal expansions inneoplastic and morphologically normal prostate tissue. Nat Genet 47(4):367–372.
35. Risk MC, et al. (2010) Differential gene expression in benign prostate epithelium ofmen with and without prostate cancer: Evidence for a prostate cancer field effect.Clin Cancer Res 16(22):5414–5423.
36. Seyednasrollah F, Laiho A, Elo LL (2015) Comparison of software packages for de-tecting differential expression in RNA-seq studies. Brief Bioinform 16(1):59–70.
37. Subramanian A, et al. (2005) Gene set enrichment analysis: A knowledge-based ap-proach for interpreting genome-wide expression profiles. Proc Natl Acad Sci USA102(43):15545–15550.
38. Friedman J, Hastie T, Tibshirani R (2010) Regularization paths for generalized linearmodels via coordinate descent. J Stat Softw 33(1):1–22.
39. Tarca AL, et al. (2009) A novel signaling pathway impact analysis. Bioinformatics25(1):75–82.
40. Carro MS, et al. (2010) The transcriptional network for mesenchymal transformationof brain tumours. Nature 463(7279):318–325.
41. Aytes A, et al. (2014) Cross-species regulatory network analysis identifies a synergisticinteraction between FOXM1 and CENPF that drives prostate cancer malignancy.Cancer Cell 25(5):638–651.
42. Lefebvre C, et al. (2010) A human B-cell interactome identifies MYB and FOXM1 asmaster regulators of proliferation in germinal centers. Mol Syst Biol 6(377):377.
43. Cancer Genome Atlas Research Network (2014) Integrated genomic characterizationof papillary thyroid carcinoma. Cell 159(3):676–690.
44. Poon H, Quirk C, DeZiel C, Heckerman D (2014) Literome: PubMed-scale genomicknowledge base in the cloud. Bioinformatics 30(19):2840–2842.
45. Khurana E, Fu Y, Chen J, Gerstein M (2013) Interpretation of genomic variants using aunified biological network approach. PLOS Comput Biol 9(3):e1002886.
46. Lachmann A, et al. (2010) ChEA: Transcription factor regulation inferred from in-tegrating genome-wide ChIP-X experiments. Bioinformatics 26(19):2438–2444.
47. Forrest MP, Waite AJ, Martin-Rendon E, Blake DJ (2013) Knockdown of human TCF4affects multiple signaling pathways involved in cell survival, epithelial to mesenchy-mal transition and neuronal differentiation. PLoS One 8(8):e73169.
48. Flora A, Garcia JJ, Thaller C, Zoghbi HY (2007) The E-protein Tcf4 interacts with Math1to regulate differentiation of a specific subset of neuronal progenitors. Proc NatlAcad Sci USA 104(39):15382–15387.
49. Ugolkov AV, Eisengart LJ, Luan C, Yang XJ (2011) Expression analysis of putative stemcell markers in human benign and malignant prostate. Prostate 71(1):18–25.
50. Yu X, et al. (2014) SOX2 expression in the developing, adult, as well as, diseasedprostate. Prostate Cancer Prostatic Dis 17(4):301–309.
Smith et al. PNAS | Published online October 12, 2015 | E6551
MED
ICALSC
IENCE
SPN
ASPL
US
SEECO
MMEN
TARY
51. Cancer Genome Atlas Network (2012) Comprehensive molecular portraits of humanbreast tumours. Nature 490(7418):61–70.
52. Badve S, et al. (2007) FOXA1 expression in breast cancer–Correlation with luminalsubtype A and survival. Clin Cancer Res 13(15 Pt 1):4415–4421.
53. Bernardo GM, et al. (2013) FOXA1 represses the molecular phenotype of basal breastcancer cells. Oncogene 32(5):554–563.
54. Ben-Porath I, et al. (2008) An embryonic stem cell-like gene expression signature inpoorly differentiated aggressive human tumors. Nat Genet 40(5):499–507.
55. Creighton CJ, et al. (2009) Residual breast cancers after conventional therapy displaymesenchymal as well as tumor-initiating features. Proc Natl Acad Sci USA 106(33):13820–13825.
56. Lim E, et al.; kConFab (2009) Aberrant luminal progenitors as the candidate targetpopulation for basal tumor development in BRCA1 mutation carriers. Nat Med 15(8):907–913.
57. Kim J, et al. (2010) A Myc network accounts for similarities between embryonic stemand cancer cell transcription programs. Cell 143(2):313–324.
58. Wong DJ, et al. (2008) Module map of stem cell genes guides creation of epithelialcancer stem cells. Cell Stem Cell 2(4):333–344.
59. Karthaus WR, et al. (2014) Identification of multipotent luminal progenitor cells inhuman prostate organoid cultures. Cell 159(1):163–175.
60. Taylor BS, et al. (2010) Integrative genomsic profiling of human prostate cancer.Cancer Cell 18(1):11–22.
61. Huang W, Sherman BT, Lempicki RA (2009) Systematic and integrative analysis oflarge gene lists using DAVID bioinformatics resources. Nat Protoc 4(1):44–57.
62. Rudin CM, et al. (2012) Comprehensive genomic analysis identifies SOX2 as a fre-quently amplified gene in small-cell lung cancer. Nat Genet 44(10):1111–1116.
63. Park KS, et al. (2011) A crucial requirement for Hedgehog signaling in small cell lungcancer. Nat Med 17(11):1504–1508.
64. Coe BP, et al. (2013) Genomic deregulation of the E2F/Rb pathway leads to activationof the oncogene EZH2 in small cell lung cancer. PLoS One 8(8):e71670.
65. Bracken AP, et al. (2003) EZH2 is downstream of the pRB-E2F pathway, essential forproliferation and amplified in cancer. EMBO J 22(20):5323–5335.
66. Sparmann A, van Lohuizen M (2006) Polycomb silencers control cell fate, develop-ment and cancer. Nat Rev Cancer 6(11):846–856.
67. Kareta MS, et al. (2015) Inhibition of pluripotency networks by the Rb tumor sup-pressor restricts reprogramming and tumorigenesis. Cell Stem Cell 16(1):39–50.
68. Sequist LV, et al. (2011) Genotypic and histological evolution of lung cancers ac-quiring resistance to EGFR inhibitors. Sci Transl Med 3(75):75ra26.
69. Cheng L, et al. (2005) Molecular genetic evidence for a common clonal origin ofurinary bladder small cell carcinoma and coexisting urothelial carcinoma. Am J Pathol166(5):1533–1539.
70. Williamson SR, et al. (2011) ERG-TMPRSS2 rearrangement is shared by concurrentprostatic adenocarcinoma and prostatic small cell carcinoma and absent in small cellcarcinoma of the urinary bladder: Evidence supporting monoclonal origin. ModPathol 24(8):1120–1127.
71. Shen R, et al. (1997) Transdifferentiation of cultured human prostate cancer cells to aneuroendocrine cell phenotype in a hormone-depleted medium. Urol Oncol 3(2):67–75.
72. Smith GK (2004) Linear models and empirical bayes methods for assessing differentialexpression in microarray experiments. Stat Appl Genet Mol Biol 3(1):Article 3.
73. Ritchie ME, et al. (2015) limma powers differential expression analyses for RNA-sequencing and microarray studies. Nucleic Acids Res 43(7):e47.
74. Sales G, Calura E, Martini P, Romualdi C (2013) Graphite Web: Web tool for gene setanalysis exploiting pathway topology. Nucleic Acids Res 41(Web Server Issue, W1):W89–W97.
E6552 | www.pnas.org/cgi/doi/10.1073/pnas.1518007112 Smith et al.