Embed Size (px)
Citation preview

Vol.:(0123456789)
SN Bus Econ (2021) 1:43https://doi.org/10.1007/s43546-021-00042-z
ORIGINAL ARTICLE
A barrier real option approach to evaluate public–private partnership projects and prevent moral hazard
Antonio Di Bari1
Received: 30 May 2020 / Accepted: 9 January 2021 / Published online: 15 February 2021 © The Author(s), under exclusive licence to Springer Nature Switzerland AG part of Springer Nature 2021
AbstractWhen governments contend with financial restrictions, they may form public–pri-vate partnerships (PPPs) to help fund projects. In these types of investments, private firms (i.e. concessionaires) develop public projects. The government supports the funding of these public projects by sharing the risk of future potential losses. To implement the risk-sharing mechanism, public administration could adopt a Mini-mum Revenues Guarantee (MRG) option for the concessionaire in the agreement. On the other hand, the government should monitor possible opportunistic morally hazardous behavior by private firms derived by fraudulent exercise of this option. This paper aims to evaluate a MRG option while considering both moral hazard and an adjusted version of the Real Option Approach (ROA). A threshold (i.e. barrier) to the project profitability evolution is applied, below which the concessionaire would lose their right to exercise the option. Identifying these factors should encourage private firms to pursue the best possible management performance and avoid moral hazard. This paper also proposes a numerical example to validate that private firms would have no advantage in conducting opportunistic behavior because such behav-ior would reduce the project value.
Keywords Barrier real option · Down-and-out barrier option · Public–private partnership projects · Moral hazard
Introduction
Public investments are often challenged by a lack of financial resources; for this reason the Public–Private Partnership (PPP) system is overstretched. The inten-tion of this type of project is that a concessionaire (consortium of private firms that operate in different areas including design, construction, financing, operations and
* Antonio Di Bari [email protected]
1 Department of Economics and Finance, University of Bari, Largo Abbazia S. Scolastica, 53, 70124 Bari, Italy
SN Bus Econ (2021) 1:4343 Page 2 of 19
maintenance) should provide the funds and management know-how for the project construction. On the other hand, the government could incentivize the program by sharing the inherent risks of PPP projects (see Ashuri et al. 2012). Public invest-ments are characterized by uncertainty and they do not always achieve expected results. This happens for two main reasons. The first is the inclusion of poor and/or unrealistic assumptions in estimated revenues, which are used in build operate transfer (BOT) financial analyses, and the second is the presence of inefficient rev-enue risk sharing mechanisms between the public and private sectors (see Queiroz 2007 and Cuttaree 2008). The BOT is a common method of implementing PPP projects. In BOT projects the concessionaire recovers costs using revenues gener-ated by infrastructure assets. The concessionaire operates the facility for a speci-fied period of time according to the concession contract and transfers the facility to the agency at the end of the concession lifetime. Moreover, it is responsible and financially liable for performing all or a significant number of functions related to the project. To incentivize the concessionaire to participate in PPP projects, gov-ernment could adopt measures such as non-competition rights, Minimum Revenues Guarantee (MRG) and a Revenues Cap. This paper focuses on the cases in which the government shares the risks of PPP project failures with the concessionaire by ensuring a minimum level of revenues if future revenues do not compensate for the expenses. This is made possible by including a MRG option in the agreement that the concessionaire could exercise if the actual revenues are lower than anticipated. By adding a MRG option value to Net Present Value (NPV) of the project, we obtain the Expanded Net Present Value (ENPV), which represents a useful valuation of this type of investment. Using only NPV (based on the discounted cash flows method) cannot take into account the optionality and flexibility of the project that could change its value over time as a result of uncertain factors, such as unpredictable market demand and volatility of the project (see Yeo and Qiu 2003 and Ross 1995). For this reason, we combine NPV with ROA to have an extensive valuation that overcomes the limitations of NPV. Although the MRG option is a useful and incen-tivizing risk-sharing mechanism, it could encourage the concessionaire to engage in opportunistic behavior, known as moral hazard, since it has to be compensated in any case (see Liu et al. 2016). The moral hazard happens when an economic player, i.e. agent, acts on behalf of another economic player, i.e. principal, that is unable to verify the efforts of the agent. The result could be post-contractual opportunism given that the principal has no way of verifying the presence of fraud or negligence. Despite substantial progress regarding MRG valuation (see Ashuri et al. 2012 and Carbonara et al. 2014), the problem of incorporating moral hazard into this valua-tion has proven extremely difficult in the literature.
This paper contributes to the existing literature by embedding moral hazard in the MRG valuation. To make this valuation, we used an adjusted version of Real Option Approach (ROA) that applies a threshold (also called “barrier”) to the pro-ject profitability evolution during its lifetime, below which the concessionaire would lose their right to exercise the option as a consequence of poor management perfor-mance. This is the down-and-out barrier option model and it is applied to encourage the concessionaire to attain the best possible management performance and avoid moral hazard. In fact, the loss of the MRG option as a result of moral hazard implies
SN Bus Econ (2021) 1:43 Page 3 of 19 43
a depreciated overall project value, since the value of the MRG option should be added to the NPV of the project. Since this work presents challenging managerial issues with regard to moral hazard, this valuation approach could be applied to PPP projects that have a strong relation with managerial performance. A common case concerns the urban redevelopment actions, implemented by public and private sec-tors, to redevelop dilapidated buildings into structures able to generate cash flows, such as a theatre. A numerical example is also provided that practically demon-strates that without opportunistic behavior, an MRG option valuation increases the project value. Results of this analysis confirm that the barrier ROA is a reliable method to evaluate the MRG option when considering possible opportunistic behav-ior and, that in a PPP context, moral hazard placed into practice by the concession-aire could damage the overall project value. The remainder of the paper is organized as follows: “Literature review” provides a literature review. “Basic model” provides the infrastructure valuation using the real option model with down-and-out barrier option. “Numerical example” provides a numerical example with sensitivity analy-sis. Finally, the conclusion is given in “Conclusion”.
Literature review
Infrastructure projects are characterized by the risk related to the uncertain actual market demand of products or services (see Liu et al. 2014). There are different mechanisms to manage uncertainty and share risks. Government and the conces-sionaire could share risks in different ways using different types of options in the agreement. Some examples of these options are Non-competition rights, Minimum Revenues Guarantee and Revenues cap. Non-competition or exclusivity rights is an option where the government provides support by sharing the competition risk. The concessionaire makes claims to the government when new competition damages future revenues (see Liu et al. 2014). Minimum Revenue Guarantee (MRG) is an option to make claims to the government when the actual revenues are lower than anticipated. In this case, the government provides support by sharing the financial risk of a project overestimation (see Ashuri et al. 2012 and Carbonara et al. 2014 ). Revenue Cap is an option for the public administration to make claims when the concessionaire makes surplus profits; thus, it is a sharing of benefits (see Ashuri et al. 2012). Previous studies also combined different types of options, such as a risk-sharing mechanism. For example, Wibowo et al. (2012), conducting a study on Indonesian BOT/PPP Toll Roads, presented the methodologies of quantifying con-tingent liabilities of three types of guarantee, and fair compensation guarantee in the event of nationalization. Iyer and Sagheer (2011), considering BOT highway pro-jects in India, adopted the combination of traffic floor and traffic cap that ensured certain revenues for private investors. At the same time, if the traffic demand had become higher than expected, a risk-sharing mechanism would have been triggered.
The relevant issue in the literature is how to evaluate uncertain infrastruc-ture projects that embed the risk-sharing mechanisms. In general, the static NPV approach based on discounted cash flows is inadequate to assess uncertain invest-ments because it fails to sufficiently capture management’s flexibility (see Yeo
SN Bus Econ (2021) 1:4343 Page 4 of 19
and Qiu 2003). Ross (1995) showed that an undesirable outcome of the NPV is that it could lead to the rejection of an investment that should be accepted. This is because it considers a project just a one-time investment without taking into account the evolution of its volatility over its lifetime. For these reasons NPV has been replaced with ROA (see Yeo and Qiu 2003; Villani 2012; Trigeorgis 1993). The ROA is a valuation methodology that consists of the application of option theory to analyze real investment projects incorporating uncertainty. This technique uses a binomial lattice model to quantify the elusive elements of mana-gerial operating flexibility and strategic interactions that are otherwise ignored or underestimated by conventional analysis. Previous studies applied ROA to dif-ferent types of uncertain investment. For example, Kellogg and Charnes (2000) and Hauschild et al. (2015) showed that the ROA can be used to value a biotech-nology company, while (Trigeorgis 1993) applied a multi-stage ROA to valuate Information Technology Infrastructure.
In the case of a PPP project, Carbonara and Pellegrino (2018) present the ROA as a proper methodology to assess MRG and revenue sharing rights related to the concessionaire and government, respectively, to reach a successful partnership. Moreover, Carbonara et al. (2014) found that government support is often needed to make the project attractive to private investors; to define a fair value of the mini-mum amount of revenue, they adopted the MRG model, taking into account a Monte Carlo simulation. Marzouk and Ali (2018) proposed a guarantee evaluation algo-rithm in the wastewater field. They found minimum flow guarantee a suitable risk mitigation strategy after proposing a new stochastic model utilizing ROA. Although previous studies faced the MRG valuation problem using ROA, monitoring the opportunistic behavior of the concessionaire has proven extremely difficult in the literature. In fact, private firms could create moral hazard by exercising the MRG option. The moral hazard happens when an economic player (i.e. agent) acts on behalf of another economic player (i.e. principal) that is not able to verify the efforts of the agent. The latter could bring about post-contractual opportunism taking into account the principal’s inability to verify the presence of fraud or negligence. In this situation, it is necessary to create contracts in which the interests of both parties coincide. For example, ( Jensen and Meckling (1976)) used principal-agent theory to explain the structure of enterprise’s capital, namely the optimal ratio between equity and debt. Wang et al. (2018) introduced the reciprocal preference theory to analyze the risk-sharing ratio most suitable for the government. They showed that by setting a different guarantee strategy for different participants, the government can utilize reciprocal preferences to incentivize investors to make more effort during a partner-ship and avoid moral hazard.
This paper offers a reliable methodology to embed the moral hazard insight into a MRG valuation, to monitor possible opportunistic behavior and to encour-age the concessionaire to pursue the best possible management performance. We used an adjusted version of the ROA that embeds a threshold, i.e. barrier, to evo-lution of the project’s cash inflows below which the concessionaire loses his MRG right as a result of moral hazard. The barrier insight derives from financial “bar-rier options,” which are a type of derivative where the payoff depends on whether or not the underlying asset has reached or exceeded a predetermined price (see

SN Bus Econ (2021) 1:43 Page 5 of 19 43
Rambaud and Prez 2016). Moreover, (Van Zee and Spinler (2014)) demonstrated a barrier option application to evaluate R&D investment.
The concessionaire can also assess the overall project value by adding a MRG option to the NPV of the project. This approach is called Expanded Net Present Value (ENPV) and it has also been used in previous studies. For example, (Durica et al. (2018)) used an ENPV approach to evaluate a specific real estate investment project in the capital city of the Czech Republic, Prague, using the options to expand, to contract, and to abandon the project. In this way, the uncertainty due to managerial flexibility is embedded with the classical financial analysis.
In all of the reviewed papers, the analyses were made without considering the moral hazard aspect in the project valuation. In our view it is necessary to con-sider moral hazard to monitor possible opportunistic behaviors of the concession-aire and drive them to attain their best management performance.
Basic model
In this section we show the methodology for valuating PPP infrastructure projects with a MRG option. To implement this, we combine the NPV of the project with a MRG option calculated by using a barrier ROA, which gives the ENPV. The analysis starts by calculating the NPV that allows the APV of net profits to be extrapolated. The APV represents the underlying asset to insert into the binomial lattice model of the ROA to evaluate the MRG option. In this way, the evolu-tion, including the volatility, of the underlying asset is assessed. The MRG option value is calculated by comparing the APV to the expected present value of net profits (EPV) derived by the study of market demand. In other words, EPV repre-sents the most likely estimated net profits that the concessionaire and government forecast in years j = n + 1, n + 2,… ,N . Therefore, if the actual value is lower than forecast value, then the concessionaire could exercise its MRG right. How-ever, by implementing the MRG option the concessionaire could adopt oppor-tunistic or negligent behavior derived by the risk coverage in any case. For this reason, the agreement effectively acts as a barrier (B) preventing the evolution of APV values through the binomial lattice model. The purpose of introducing the barrier is to identify poor management by the concessionaire, indicated with an APV level at or below a certain minimum value of B. Consequently, if APV inter-sects B, the concessionaire will lose its right to exercise the MRG option. This poor management could be characterized as moral hazard behavior by the private firms. Thus, the down-and-out barrier option model is used to evaluate the MRG barrier option, then we can assess PPP infrastructural project with ENPV.
Following the above-mentioned order, we start by conducting a NPV analysis that represents an ex-ante phase before proceeding to evaluate the MRG option.
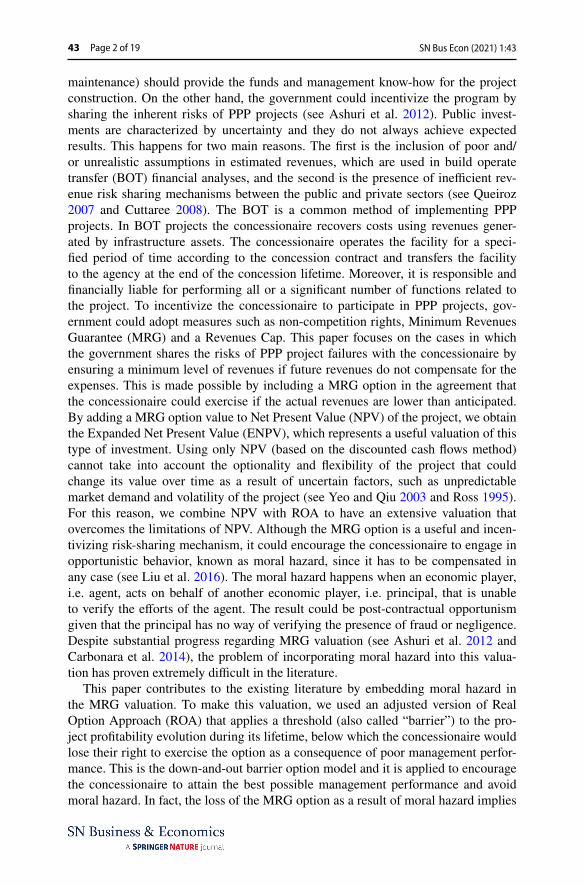
The NPV analysis of an infrastructure project is made by considering that net profits start appearing during the operating period, so only after the construction of infrastructure (see Fig. 1).

SN Bus Econ (2021) 1:4343 Page 6 of 19
Since the construction period ( i = 0, 1,… , n ) is successive to the operating period ( j = n + 1, n + 2,… ,N ), we evaluate NPV of infrastructure with the assumption that t0 = 0 (see Eq. 1).
where:
– OCj = operating costs for each j = n + 1, n + 2…;– CCi = construction costs for each i = 1, 2,… , n;– Revj = revenues for each j = n + 1, n + 2…;– WACC = weighted average cost of capital.
In this analysis, we used the Weighted Cost of Capital (WACC) to identify the dis-count rate for a PPP project. It represents the risk-adjusted cost of capital for the concessionaire.
where E and Ce are equity and cost of equity respectively, and D and Cd are debt and cost of debt, respectively. T indicates the tax rate. According to the standard NPV rule, the infrastructure investment is realized at initial time t0 if NPV is positive; oth-erwise the concessionaire will prefer to abandon its realization.
MRG right as down‑and‑out barrier real option
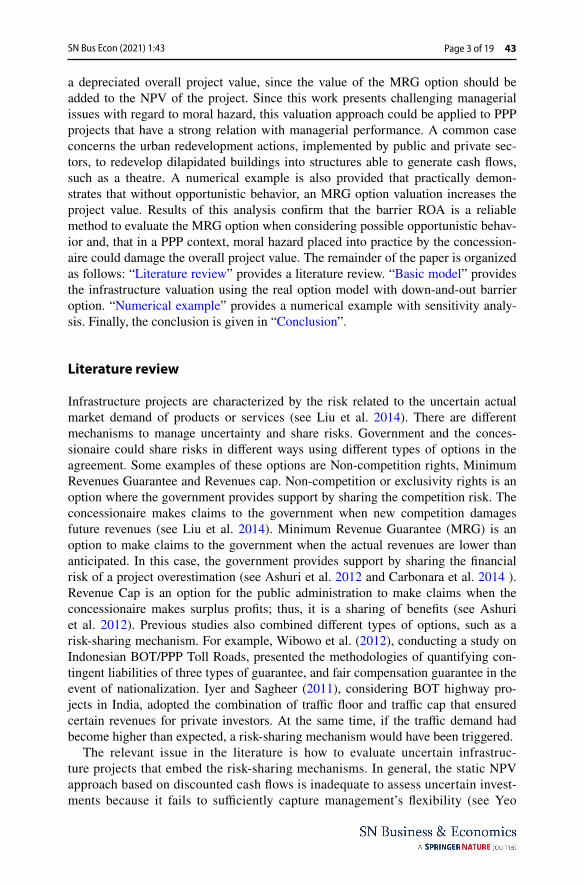
The barrier options are derivatives that will be implemented if the underlying asset reaches a pre-set barrier level during a certain period of time. If it does, the condi-tional option becomes a simple call or put option or a knock-in option. Alternatively, it is a knock-out option, and as such cease to exist from the moment the barrier level is reached (see Rambaud and Prez 2016).
The knock-in option is a type of contract that is not an option until a certain price is met. So, if the price is never reached, the contract is never actuated. On the other hand, if the underlying asset reaches a specified barrier level, the knock-in option comes into existence. Knock-in options are categorized as: up-and-in barrier options (Fig. 2a) and down-and-in barrier options (Fig. 2b).
(1)NPV = −
n∑
i=0
CCi
(1 +WACC)ti+
N∑
j=n+1
Revj − OCj
(1 +WACC)tj
(2)WACC = Ce ⋅E
E + D+ Cd ⋅ (1 − T) ⋅
D
D + E
Fig. 1 Life period of project

SN Bus Econ (2021) 1:43 Page 7 of 19 43
However, the knock-out option is a type of contract that could only be exer-cised if the underlying asset price does not reach the barrier limit. That is to say, the right to exercise the option is rescinded if the underlying asset price intersects the barrier at any time during the option’s life. Knock-out options are catego-rized as: up-and-out barrier options (Fig. 2c) and down-and-out barrier options (Fig. 2d).
The difference between a knock-in and a knock-out option is that a knock-in option comes into existence only when the underlying asset reaches a barrier, while a knock-out option ceases to exist when the underlying asset reaches a barrier.
In this model, we consider MRG as a real down-and-out barrier option because the right to exercise the option disappears when APV intersects barrier B as a con-sequence of moral hazard from private firms. To evaluate the MRG barrier real option, we apply the binomial lattice model used by Cox et al. (1979). The asset value evolves as a binary random walk with two movements: up (uAPV) with a risk neutral probability q, and down (dAPV) with a risk neutral probability (1 − q) , as follows:
where � represents the volatility of investment. Thus, it follows that the risk-neutral probability q is:
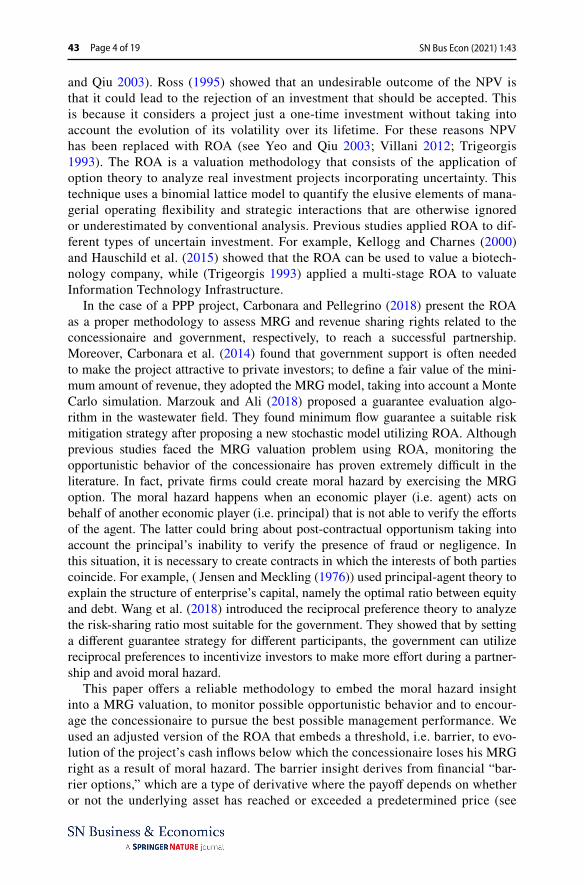
Assuming three instances in time, the analysis proceeds to evaluate the underlying evolution along the binomial lattice model (see Fig. 3). In quantitative finance, the binomial lattice model is a technique applied to evaluate derivatives in discrete time.
Government and concessionaire could set a percentage of a MRG option, denoted by X, by which the government will compensate the concessionaire if APVt is lower than EPV. If the concessionaire does not reach the minimum revenues represented by EPV, it could exercise the MRG real option and the government will then com-pensate for missing cash flows.
(3)u = e�
√
Δt
d = e−�√
Δt
(4)q =(1 + rf )
Δt − d
u − d
Fig. 2 Types of barrier options

SN Bus Econ (2021) 1:4343 Page 8 of 19
This situation could generate opportunistic behavior by the concessionaire that may not encourage its maximum performance. To avoid opportunistic and morally hazardous behavior by the concessionaire, the government could decide to insert a minimum level of net profits (B) below which the MRG barrier real option becomes invalid and the concessionaire cannot exercise the option. In fact, if APV intersects this barrier, then it means that a low net profit was caused by poor management rather than exogenous factors, such as low market demand for products or services. This poor performance by the concessionaire makes the pro-ject riskier and, consequently, it will produce a higher value of � . For these rea-sons, we apply the down-and-out barrier real option method to evaluate our MRG real option (see Eq. 5).
with t = n + 1,… ,N . Figure 4 shows the valuation of the down-and-out barrier real option using the binomial pricing model after assuming that APVd3 goes below B. We note that MRGt,z is the value of the MRG option in correspondence with each z-node at each instance in time t. The values of the MRG real option in each node are calculated as follows.
(5)MRGt,z =
{
max[0;X(EPV − APVt,z)] if min APVt,z > B
0 if min APVt,z ≤ B
Fig. 3 Evolution of underlying asset APV
Fig. 4 Evolution of the MRG barrier real option considering barrier intersection

SN Bus Econ (2021) 1:43 Page 9 of 19 43
At this point, we know that, because APVd3 < B at time n + 4 , the value MRG option disappears. This situation exists because when the option is knocked-out, the contract is nullified and the MRG agreement will not reactivate itself if APV falls below B. This is a feature of the knock-out barrier option: once it is out, it’s out for good.
However, if the underlying asset never intersects the barrier ( APV > B ), we can work backward considering the possibility that the concessionaire could exercise the option in each instance in time, like the American style option, assuming rf is the annual risk-free interest rate. Clearly, the MRG option will assume different values depending on each instance in time t and each z-node calculated in the following equations (see Fig. 5).
For the time instance N = n + 4 , the concessionaire decides to invest based on whether the option exercise value is positive and the following payoffs:
For the previous z-nodes corresponding with previous time instances n + 3, n + 2, n + 1 we compute the maximum among the payoffs obtained exercis-ing the MRG barrier real option and the value obtained by keeping the option alive. Thus, the investors obtain, for each node, the maximum value that falls between the exercised value of MRG barrier real option and its non-exercise value as follows:
(6)
MRGn+4,1 = max[0;X(EPV − APVu3)]
MRGn+4,2 = max[0;X(EPV − APVu2d)]
MRGn+4,3 = max[0;X(EPV − APVud2)]
MRGn+4,4 = 0
...
MRGn+1 = 0
(7)
MRGn+4,1 = max[0;X(EPV − APVu3)]
MRGn+4,2 = max[0;X(EPV − APVu2d)]
MRGn+4,3 = max[0;X(EPV − APVud2)]
MRGn+4,4 = max[0;X(EPV − APVd3)]
Fig. 5 Evolution of the MRG barrier real option considering absence of barrier intersection

SN Bus Econ (2021) 1:4343 Page 10 of 19
Finally, adding the MRG barrier real option to the classical NPV, we are able to determine the project value. In this way, we obtain the Expanded Net Present Value (ENPV).
So, MRG option affects discounted cash flows by adding value to NPV. Thus, the risk related to uncertainty is embedded in the project valuation. Since risks are mit-igated, the PPP project value assumes a higher value compared to the case with-out the MRG option. The factor that leads to the underlying value landing above or below the barrier (B) is the volatility ( � ): when the value � increases, APV is more likely to go below the barrier. In “Sensitivity analysis” a sensitivity analysis of the MRG barrier real option to variation of � is proposed.
Numerical example
In this section we implement a numerical example that represents the valuation of a PPP infrastructure project related to the redevelopment of an investment.
This simulation assumes the creation of a theatre able to generate cash inflows from a dilapidated building. The analysis starts with the evaluation of classical NPV and then it proceeds with the valuation of an infrastructure investment using MRG rights as a down-and-out barrier option. Finally, a sensitivity analysis is proposed that shows the change of a MRG barrier real option to the variation of volatility �.
NPV analysis
The first step is to outline the concessionaire’s cash inflows and outflows as shown in Table 1. The construction period goes from t0 to t2 and the operating period goes from t3 to t13 . These net cash flows are discounted back to the starting point t0 using
(8)
MRGn+3,1 = max
[
X(EPV − APVu2);
MRGn+4,1 ⋅ q +MRGn+4,2 ⋅ (1 − q)
1 + rf
]
MRGn+3,2 = max
[
X(EPV − APVud);MRGn+4,2 ⋅ q +MRGn+4,3 ⋅ (1 − q)
1 + rf
]
MRGn+3,3 = max
[
X(EPV − APVd2);
MRGn+4,3 ⋅ q +MRGn+4,4 ⋅ (1 − q)
1 + rf
]
MRGn+2,1 = max
[
X(EPV − APVu);MRGn+3,1 ⋅ q +MRGn+3,2 ⋅ (1 − q)
1 + rf
]
MRGn+2,2 = max
[
X(EPV − APVd);MRGn+3,2 ⋅ q +MRGn+3,3 ⋅ (1 − q)
1 + rf
]
MRGn+1 = max
[
X(EPV − APV);MRGn+2,1 ⋅ q +MRGn+2,2 ⋅ (1 − q)
1 + rf
]
(9)ENPV = NPV +MRGn+1

SN Bus Econ (2021) 1:43 Page 11 of 19 43
WACC as the discount rate for the PPP project. Assuming that Equity and Debt are E = 500, 000 and D = 800, 000 respectively, and Cost of Equity and Cost of Debt are Ce = 0.12 and Cd = 0.05 respectively, and the tax rate is equal to T = 0.35 , the obtained WACC is equal to 6.54%.
At this point we proceed to evaluate NPV as follows:
where
APVt0 represents the discounted cash flow approximation of the true financial mar-
ket value of a project’s incremental future cash flows and CCt0 represents the dis-
counted cash flow of construction costs. Based on the conventional use of the NPV approach, the private investor should not invest in this public project, since the NPV is negative and consequently, according to this static method, he should abandon the investment. However, as shown in the previous section, the government cooperates by sharing the risks and agreeing on the MRG real option. Thus, to obtain a more reliable result which could lead the concessionaire to make an aware decision while also considering potential opportunistic behavior, we adopt the real option approach with a down-and-out barrier option.
(10)NPV = APVt0− CCt0
= −47 027.57
(11)APVt0=
N∑
j=n+1
Revj − OCj
(1 +WACC)tj= 1 638 977.90
(12)CCt0=
n∑
i=0
CCi
(1 +WACC)ti= 1 686 005.47
Table 1 Input data for NPV analysis
The infrastructure starts producing cash inflows (net profits) once construction is completed
Years (t) Const. costs (CC) Revenues Op. costs (OC) Net profits Net cash flows
0 −600, 000 – – – −600, 000
1 −500, 000 – – – −500, 000
2 −700, 000 – – – −700, 000
3 – 500,000 −300, 000 200,000 200,0004 – 400,000 −100, 000 300,000 300,0005 – 150,000 −50, 000 100,000 100,0006 – 400,000 −100, 000 300,000 300,0007 – 300,000 −50, 000 250,000 250,0008 – 300,000 −100, 000 200,000 200,0009 – 500,000 −200, 000 300,000 300,00010 – 450,000 −50, 000 400,000 400,00011 – 200,000 −50, 000 150,000 150,00012 – 300,000 −100, 000 200,000 200,00013 – 400,000 −100, 000 300,000 300,000

SN Bus Econ (2021) 1:4343 Page 12 of 19
Valuation of an infrastructure investment using a down‑and‑out barrier option model
In this section we provide an example outlining how to evaluate the MRG option with a down-and-out barrier option model. Two cases are analyzed: the first in which the underlying asset (APV) does not intersect the barrier (B) and the second in which APV intersects B.
The present value of the PPP project discounted at time t0 is APVt0
= 1, 638, 977.90 . We assume that the concessionaire can exercise its MRG option starting at time t3 , essentially only when the operating period starts. For this reason APVt0
should be capitalized at time t3 using the same rate of interest used for NPV analysis ( WACC = 0.0654 ) and it becomes APVt3
= 1, 982, 034.34 . It is assumed that the government and private firms agree on EPV = 2, 000, 000.00 . The threshold (B) below which it is assumed that the concessionaire could adopt morally hazardous behavior is set at 400, 000.00.
In this example the volatility of investment is equal to � = 0.15 , the risk-free dis-counted rate is equal to rf = 0.022 and time-variation is Δt = 1 . Consequently, it is possible to calculate u = e�
√
Δt = 1.1618 and d = e−�√
Δt = 0.8607.Firstly the underlying asset evolution is created using the binomial multi-period
model as shown in Table 2. It is clear that in this case, using � = 0.15 , APV never intersects B. Consequently, it is possible to work backwards from t13 to t3 [(adopt-ing the same methodology we have seen in Eqs. (7) and (8)] knowing that investors decide to exercise the MRG real option when the exercised value is higher than the waiting value. Thus, a new binomial lattice model is created (Table 3) that repre-sents the valuation of the MRG real option, and note that MRG = 232, 836.86.
On the other hand, APV could intersect the barrier. This situation happens if the projects become riskier due to poor management as a consequence of morally haz-ardous behavior by the concessionaire. The poor performance causes a higher value of � that could lead APV to intersect B. It is hypothesized that � increases from 0.15 to 0.20 without changing the barrier level. Therefore, the evolution of APV changes and APVt13,11
< B because 268, 239.18 < 400, 000.00 (Table 4). This implies that the MRG barrier real option ceases to exist, i.e. MRG = 0 (see Table 5).
In this way the concessionaire will be encouraged to practice efficient manage-ment, resulting in a low volatility with APV > B , and the right to exercise the MRG barrier real option when necessary is maintained. In fact the value of infrastructure without opportunistic behavior of the concessionaire ( ENPV1 ) is higher than the value with moral hazard ( ENPV2).
In this case the possibility to exercise the MRG real option significantly changes the concessionaire’s decision to invest in public infrastructure. This is because, in the first case, the concessionaire should decide to invest as a result of a positive ENPV, whereas in the second case, the concessionaire should reject the investment based
(13)ENPV1 = −47 027.56 + 232 836.86 = 185 809.30
(14)ENPV2 = −47 027.56 + 0 = −47 027.56

SN Bus Econ (2021) 1:43 Page 13 of 19 43
Tabl
e 2
Exa
mpl
e of
APV
evo
lutio
n ab
ove
B
Ass
et e
volu
tion
cons
ider
ing
the
abse
nce
of o
ppor
tuni
stic
beha
vior
alo
ng th
e bi
nom
ial l
attic
e m
odel
in th
e op
erat
ing
perio
d
t3
45
67
89
1011
1213
APV
1,98
2,03
4.34
2,30
2,79
5.37
2,67
5,46
6.52
3,10
8,44
8.61
3,61
1,50
2.04
4,19
5,96
6.74
4,87
5,01
7.84
5,66
3,96
2.66
6,58
0,58
5.77
7,64
5,54
9.88
8,88
2,86
1.66
1,70
5,95
2.77
1,98
2,03
4.34
2,30
2,79
5.37
2,67
5,46
6.52
3,10
8,44
8.61
3,61
1,50
2.04
4,19
5,96
6.74
4,87
5,01
7.84
5,66
3,96
2.66
6,58
0,58
5.77
1,46
8,32
7.16
1,70
5,95
2.77
1,98
2,03
4.34
2,30
2,79
5.37
2,67
5,46
6.52
3,10
8,44
8.61
3,61
1,50
2.04
4,19
5,96
6.74
4,87
5,01
7.84
1,26
3,80
0.90
1,46
8,32
7.16
1,70
5,95
2.77
1,98
2,03
4.34
2,30
2,79
5.37
2,67
5,46
6.52
3,10
8,44
8.61
3,61
1,50
2.04
1,08
7,76
3.51
1,26
3,80
0.90
1,46
8,32
7.16
1,70
5,95
2.77
1,98
2,03
4.34
2,30
2,79
5.37
2,67
5,46
6.52
936,
246.
731,
087,
763.
511,
263,
800.
901,
468,
327.
161,
705,
952.
771,
982,
034.
3480
5,83
5.03
936,
246.
731,
087,
763.
511,
263,
800.
901,
468,
327.
1669
3,58
8.64
805,
835.
0393
6,24
6.73
1,08
7,76
3.51
596,
977.
2769
3,58
8.64
805,
835.
0351
3,82
3.10
596,
977.
2744
2,25
1.64
B

SN Bus Econ (2021) 1:4343 Page 14 of 19
Tabl
e 3
Exa
mpl
e of
MRG
bar
rier r
eal o
ptio
n ev
olut
ion
with
out i
nter
sect
ion
of B
MRG
opt
ion
valu
atio
n co
nsid
erin
g th
e ab
senc
e of
opp
ortu
nisti
c be
havi
or p
roce
edin
g ba
ckw
ard
alon
g th
e bi
nom
ial l
attic
e m
odel
in th
e op
erat
ing
perio
d
t3
45
67
89
1011
1213
MRG
232,
836.
8613
5,05
7.38
67,3
40.9
326
,224
.11
6333
.17
243.
560
00
00
356,
651.
6221
9,56
3.49
117,
957.
5350
,409
.74
13,6
57.2
753
6.04
00
00
531,
672.
8434
7,16
3.07
201,
458.
9895
,190
.13
29,4
39.0
111
79.7
30
00
736,
199.
1153
1,67
2.84
333,
579.
2617
5,54
0.58
63,4
29.4
125
96.3
90
091
2,23
6.49
736,
199.
1153
1,67
2.84
31,3
171.
7913
6,60
2.38
5,71
4.20
01,
063,
753.
2791
2,23
6.49
736,
199.
1153
1,67
2.84
294,
047.
2312
,575
.96
1,19
4,16
4,97
1,06
3,75
3,27
912,
236,
4973
6,19
9,11
372,
170,
991,
306,
411.
361,
194,
164.
971,
063,
753.
2763
8,56
5.54
1,40
3,02
2.73
1,30
6,41
1.36
835,
915.
481,
486,
176.
9098
2,11
5.91
1,09
0,42
3.85
B

SN Bus Econ (2021) 1:43 Page 15 of 19 43
Tabl
e 4
Exa
mpl
e of
APV
evo
lutio
n be
low
B
Ass
et e
volu
tion
cons
ider
ing
the
pres
ence
of o
ppor
tuni
stic
beha
vior
alo
ng th
e bi
nom
ial l
attic
e m
odel
in th
e op
erat
ing
perio
d
t3
45
67
89
1011
1213
APV
1,98
2,03
4,34
2,42
0,86
2,21
2,95
6,84
7,79
3,61
1,50
2,04
4,41
1,09
8,55
5,38
7,72
7,94
6,58
0,58
5,77
8,03
7,54
5,60
9,81
7,08
0,37
11,9
90,6
09,0
414
,645
,362
,96
1,62
2,75
2,47
1,98
2,03
4,34
2,42
0,86
2,21
2,95
6,84
7,79
3,61
1,50
2,04
4,41
1,09
8,55
5,38
7,72
7,94
6,58
0,58
5,77
8,03
7,54
5,60
9,81
7,08
0,37
1,32
8,59
7,35
1,62
2,75
2,47
1,98
2,03
4,34
2,42
0,86
2,21
2,95
6,84
7,79
3,61
1,50
2,04
4,41
1,09
8,55
5,38
7,72
7,94
6,58
0,58
5,77
1,08
7,76
3,51
1,32
8,59
7,35
1,62
2,75
2,47
1,98
2,03
4,34
2,42
0,86
2,21
2,95
6,84
7,79
3,61
1,50
2,04
4,41
1,09
8,55
890,
585.
441,
087,
763.
511,
328,
597.
351,
622,
752.
471,
982,
034.
342,
420,
862.
212,
956,
847.
7972
9,14
9.69
890,
585.
441,
087,
763.
511,
328,
597.
351,
622,
752.
471,
982,
034.
3459
6,97
7.27
729,
149.
6989
0,58
5.44
1,08
7,76
3.51
1,32
8,59
7.35
488,
763.
6559
6,97
7.27
729,
149.
6989
0,58
5.44
400,
165.
8348
8,76
3.65
596,
977.
2732
7,62
8.07
400,
165.
83B
268,
239.
18

SN Bus Econ (2021) 1:4343 Page 16 of 19
on the negative ENPV. So, this insight highlights the importance of the concession-aire’s maintaining behavior conducive to generating a low and stable � in order to have APV > B . Although the significant change in investment decision (due to the change of signs between ENPV1 and ENPV2 ) indicates that these results are improb-able for cases different from our application, this example demonstrates that, in all cases, the absence of moral hazard will always produce a higher project valuation due to the positive value of the MRG barrier real option.
Sensitivity analysis
We introduce a sensitivity analysis that shows how a MRG barrier real option responds to variation of volatility, � . The volatility is a relevant factor of infrastruc-ture valuation because it affects the up and down movements of APV evolution through the binary random-walk. A high value of � implies major fluctuations of underlying asset values along a binomial lattice model. Consequently, the growth of � increases the risk of obtaining an APV value that intersects or goes below the barrier, B.
The numerical simulations shown in Table 6 consider the same previous barrier ( B = 400, 000.00 ). The sensitivity analysis helps determine the range of � values that enable exercising the MRG barrier real option value. In this specific case we can say that:
These results show that an increase in volatility implies a growth of MRG barrier real option value; however, if the infrastructure project becomes too risky it could go
(15)if 𝜎 ≤ 0.1600, then MRG > 0
Table 5 Example of MRG barrier real option evolution with intersection of B
MRG option valuation considering the presence of opportunistic behavior proceeding backward along the binomial lattice model in the operating period
t 3 4 5 6 7 8 9 10 11 12 13
MRG 0 0 0 0 0 0 0 0 0 0 00 0 0 0 0 0 0 0 0 0
0 0 0 0 0 0 0 0 00 0 0 0 0 0 0 0
0 0 0 0 0 0 00 0 0 0 0 12,575.96
0 0 0 0 469,981.850 0 0 776,590.19
0 0 982,115.910 1,119,883,92
B0

SN Bus Econ (2021) 1:43 Page 17 of 19 43
below the barrier level. In this case the concessionaire loses the right to exercise the option and its value becomes equal to MRG = 0.
For this reason, the concessionaire should adopt efficient management and meas-ures to contain the riskiness of the infrastructure project.
Conclusion
The problem of scarcity of financial resources may lead governments to adopt the PPP solution to build public infrastructures. To incentivize the concessionaire to invest in PPP projects, governments can adopt a risk-sharing mechanism. However, the use of risk-sharing mechanisms could elicit opportunistic behavior, i.e. moral hazard, by the concessionaire. After considering a MRG option, as the risk-shar-ing mechanism, this paper proposed an innovative method for the option valuation that, by applying a minimum threshold barrier to the project profitability, manages to encourage the concessionaire to avoid morally hazardous behavior. After evalu-ation of the MRG option, the analysis continues by adding the option value to the infrastructure NPV to extrapolate the overall project value. This addition increases the project value because of the optionality embedded in the financial valuation and, thus, private firms could find PPP investment more attractive. However, a MRG option value is positive only if the concessionaire ensures that the project APV does not drop below the barrier B; otherwise the MRG option is invalidated. For this rea-son, the concessionaire should avoid opportunistic behavior because this would nul-lify the option value in the financial assessment. A numerical example has also been presented to implement the theoretical model. Results show that the presence of a moral hazard devalues the project more than in the absence case, furthermore, the additional value of the MRG option would change the investment decision. Namely, the NPV of a project without the MRG option is negative and so the concessionaire should reject the investment instead by adding the MRG option to the NPV, which then obtains a positive result. Therefore, results suggest that the concessionaire should aim to preserve the MRG option value by performing at its best in terms of management and avoiding moral hazard. We have also proposed a sensitivity analy-sis to show how the MRG barrier option changes with the variation of the project
Table 6 Sensitivity of MRG barrier real option to variation of �
If the project becomes too risky because of increasing � , the conces-sionaire can lose their MRG right (in this case this happens in cor-respondence with � = 0.1625)
� MRG � MRG
0.1400 212,315.56 0.1550 243,079.660.1425 217,449.95 0.1575 248,196.090.1450 222,581.74 0.1600 253,309.030.1475 227,710.77 0.1625 00.1500 232,836.86 0.1650 00.1525 237,959.87 0.1675 0

SN Bus Econ (2021) 1:4343 Page 18 of 19
volatility, � . The results confirm that an increase in � implies greater fluctuations of APV movements. These wider underlying movements could imply the intersection of the barrier and consequently the loss of the MRG right. Furthermore, these wider variations cause greater and smaller values of MRG options, and so it is possible to confirm that an increase of � implies a growth of MRG option until a certain level of riskiness is reached, at which point the barrier is intersected by the APV and the concessionaire could lose the MRG right. This happens because an excessive vola-tility implies a less stable investment as a result of morally hazardous behavior or, in wider terms, poor management. This article shows that a down-and-out barrier real option model combined with a NPV offers a more reliable PPP project valua-tion that considers moral hazard and encourages private firms to implement the best possible management performance. The barrier ROA can thus be used as a policy recommendation for PPP investment in the field of urban redevelopment, such as a theatre construction to redevelop a dilapidated building.
Funding No fund.
Data availability Data sharing is not applicable to this paper. Any datasets analysed or generated are con-tained in the paper.
Compliance with ethical standards
Conflict of interest Author Antonio Di Bari declares that he has no conflicts of interests.
Ethical standards and informed consent No human studies were carried out by the author, there is no private information of people involved in this article. Author Antonio Di Bari declares that this article is compliant with ethical standards and ethical approval.
References
Ashuri B, Kashani H, Molenaar KR, Lee S, Lu J (2012) Risk-neutral pricing approach for evaluating BOT highway project with Government minimum revenue guarantee Options. J Constr Eng Manag 138:545–557
Carbonara N, Costantino N, Pellegrino R (2014) Revenue guarantee in public-private partnerships: a fair risk allocation model. Constr Manag Econ 32(4):403–41
Carbonara N, Pellegrino R (2018) Revenue guarantee in public–private partnerships: a win–win model. Constr Manag Econ 36(10):584–598
Cox JC, Ross SA, Rubinstein M (1979) Option pricing: a simplified approach. J Financ Econ 7(3):229–263
Cuttaree V (2008) Successes and failures of PPP projects. The World Bank, WashingtonDurica M, Guttenova D, Pinda L, Svabova L (2018) Sustainable value of investment in real estate: real
options approach. Sustainability 10:46–65Hauschild B, Reimsbach D (2015) Modeling sequential R & D investments: a binomial compound option
approach. Bus Res 8:39–59Iyer KC, Sagheer M (2011) A real-options based traffic risk mitigation model for build-operate transfer
highway projects in India. Constr Manag Econ 29(8):771–779Jensen M, Meckling WH (1976) Theory of the firm: managerial behavior, agency costs and ownership
structure. J Financ Econ 3:305–360

SN Bus Econ (2021) 1:43 Page 19 of 19 43
Kellogg D, Charnes JM (2000) Real-options valuation for a biotechnology company. Financ Anal J 56:76–84
Liu J, Gao R, Cheah CYJ, Luo J (2016) Incentive mechanism for inhibiting investors’ opportunistic behavior in PPP projects. Int J Proj Manag 34:1102–1111
Liu J, Yu X, Cheah CYJ (2014) Evaluation of restrictive competition in PPP projects using real option approach. Int J Proj Manag 32:473–481
Marzouk M, Ali M (2018) Mitigating risks in wastewater treatment plant PPPs using minimum revenue guarantee and real options. Util Policy 53:121–133
Queiroz C (2007) International experience with transport PPP projects. In: The World Bank regional workshop on public–private partnership (PPP) on highways, Rivia, Latvia
Rambaud SC, Prez AMS (2016) Valuation of barrier options with the binomial pricing model. Ratio Math 31:25–35
Ross AS (1995) Uses, abuses and alternatives to the net-present-value rule. Financ Manag 24(3):96–102Trigeorgis L (1993) Real options and interactions with financial flexibility. Financ Manag 22(3):202–224Van Zee RD, Spinler S (2014) Real option valuation of public sector R & D investments with a down-
and-out barrier option. Technovation 34:477–484Villani G (2012) Valuation of R & D investment opportunities with the threat of competitors entry in real
option analysis. Comput Econ 43(3):331–355Wang Y, Peng C, Liu J (2018) Analysis of the risk-sharing ratio in PPP projects based on government
minimum revenue guarantees. Int J Proj Manag 36(6):899–909Wibowo A, Permana A, Kochendörfer B, Kiong R, Jacob D, Neunzehn D (2012) Modeling contingent
liabilities arising from government guarantees in Indonesian BOT/PPP toll Roads. J Constr Eng Manag 138(12):1403–1410
Yeo KT, Qiu F (2003) The value of management flexibility—a real option approach to investment evalua-tion. Int J Proj Manag 21:243–250