Embed Size (px)
Citation preview


A-4
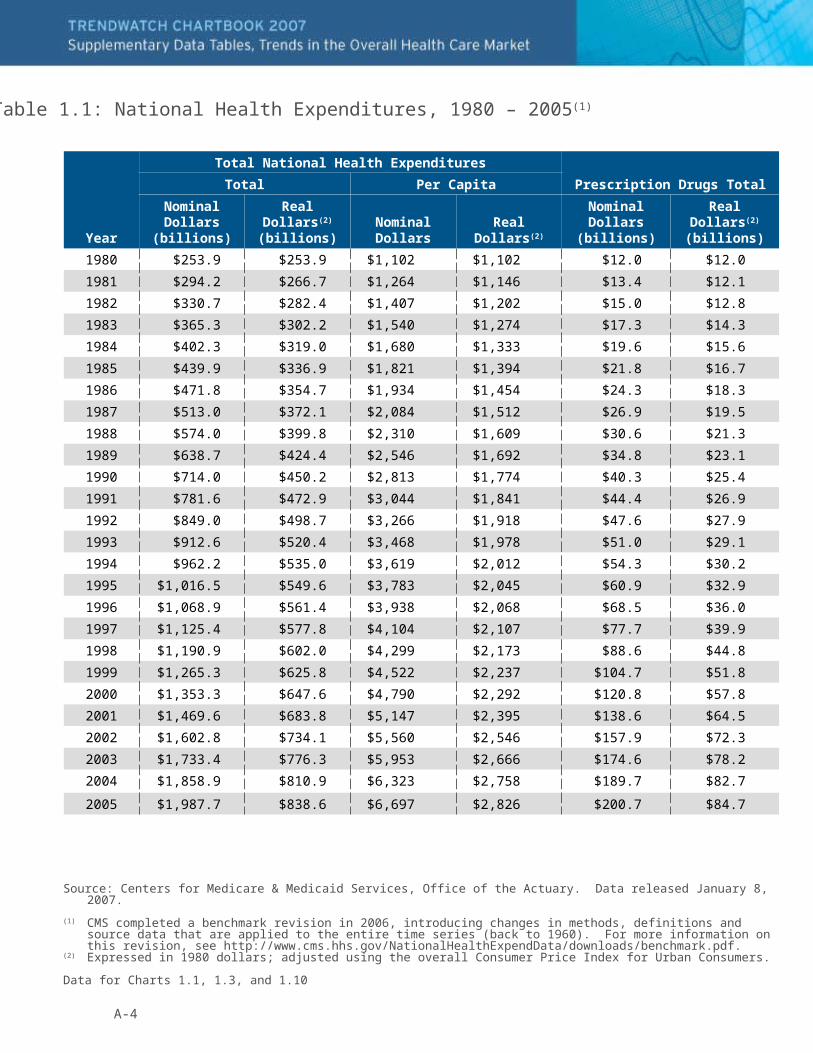
Table 1.1: National Health Expenditures, 1980 – 2005(1)
Source: Centers for Medicare & Medicaid Services, Office of the Actuary. Data released January 8, 2007.
(1) CMS completed a benchmark revision in 2006, introducing changes in methods, definitions and source data that are applied to the entire time series (back to 1960). For more information on this revision, see http://www.cms.hhs.gov/NationalHealthExpendData/downloads/benchmark.pdf.
(2) Expressed in 1980 dollars; adjusted using the overall Consumer Price Index for Urban Consumers.
Data for Charts 1.1, 1.3, and 1.10
Year
Total National Health Expenditures
Prescription Drugs TotalTotal Per Capita
Nominal Dollars
(billions)Real Dollars(2)
(billions)Nominal Dollars Real Dollars(2)
Nominal Dollars
(billions)Real Dollars(2)
(billions)
1980 $253.9 $253.9 $1,102 $1,102 $12.0 $12.0
1981 $294.2 $266.7 $1,264 $1,146 $13.4 $12.1
1982 $330.7 $282.4 $1,407 $1,202 $15.0 $12.8
1983 $365.3 $302.2 $1,540 $1,274 $17.3 $14.3
1984 $402.3 $319.0 $1,680 $1,333 $19.6 $15.6
1985 $439.9 $336.9 $1,821 $1,394 $21.8 $16.7
1986 $471.8 $354.7 $1,934 $1,454 $24.3 $18.3
1987 $513.0 $372.1 $2,084 $1,512 $26.9 $19.5
1988 $574.0 $399.8 $2,310 $1,609 $30.6 $21.3
1989 $638.7 $424.4 $2,546 $1,692 $34.8 $23.1
1990 $714.0 $450.2 $2,813 $1,774 $40.3 $25.4
1991 $781.6 $472.9 $3,044 $1,841 $44.4 $26.9
1992 $849.0 $498.7 $3,266 $1,918 $47.6 $27.9
1993 $912.6 $520.4 $3,468 $1,978 $51.0 $29.1
1994 $962.2 $535.0 $3,619 $2,012 $54.3 $30.2
1995 $1,016.5 $549.6 $3,783 $2,045 $60.9 $32.9
1996 $1,068.9 $561.4 $3,938 $2,068 $68.5 $36.0
1997 $1,125.4 $577.8 $4,104 $2,107 $77.7 $39.9
1998 $1,190.9 $602.0 $4,299 $2,173 $88.6 $44.8
1999 $1,265.3 $625.8 $4,522 $2,237 $104.7 $51.8
2000 $1,353.3 $647.6 $4,790 $2,292 $120.8 $57.8
2001 $1,469.6 $683.8 $5,147 $2,395 $138.6 $64.5
2002 $1,602.8 $734.1 $5,560 $2,546 $157.9 $72.3
2003 $1,733.4 $776.3 $5,953 $2,666 $174.6 $78.2
2004 $1,858.9 $810.9 $6,323 $2,758 $189.7 $82.7
2005 $1,987.7 $838.6 $6,697 $2,826 $200.7 $84.7
A-5
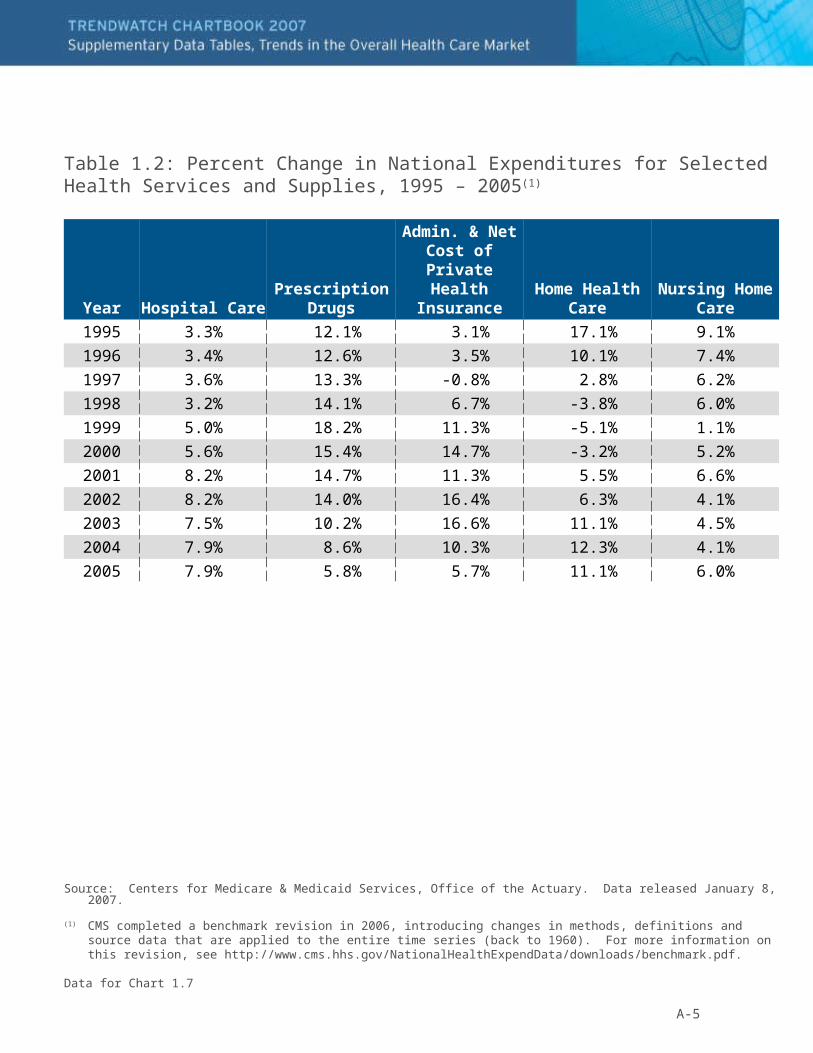
Table 1.2: Percent Change in National Expenditures for Selected Health Services and Supplies, 1995 – 2005(1)
Source: Centers for Medicare & Medicaid Services, Office of the Actuary. Data released January 8, 2007.
(1) CMS completed a benchmark revision in 2006, introducing changes in methods, definitions and source data that are applied to the entire time series (back to 1960). For more information on this revision, see http://www.cms.hhs.gov/NationalHealthExpendData/downloads/benchmark.pdf.
Data for Chart 1.7
Year Hospital CarePrescription
Drugs
Admin. & Net Cost of Private
Health Insurance
Home Health Care
Nursing Home Care
1995 3.3% 12.1% 3.1% 17.1% 9.1%
1996 3.4% 12.6% 3.5% 10.1% 7.4%
1997 3.6% 13.3% -0.8% 2.8% 6.2%
1998 3.2% 14.1% 6.7% -3.8% 6.0%
1999 5.0% 18.2% 11.3% -5.1% 1.1%
2000 5.6% 15.4% 14.7% -3.2% 5.2%
2001 8.2% 14.7% 11.3% 5.5% 6.6%
2002 8.2% 14.0% 16.4% 6.3% 4.1%
2003 7.5% 10.2% 16.6% 11.1% 4.5%
2004 7.9% 8.6% 10.3% 12.3% 4.1%
2005 7.9% 5.8% 5.7% 11.1% 6.0%
A-6
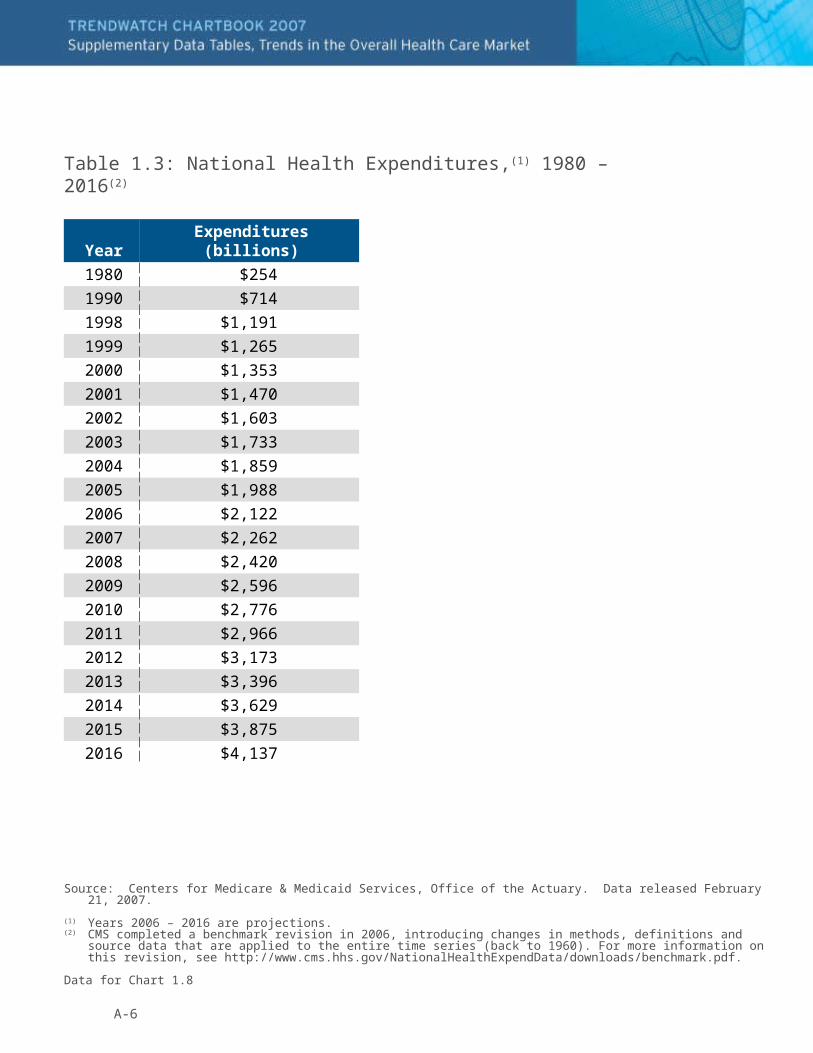
Table 1.3: National Health Expenditures,(1) 1980 – 2016(2)
Source: Centers for Medicare & Medicaid Services, Office of the Actuary. Data released February 21, 2007.
(1) Years 2006 – 2016 are projections.(2) CMS completed a benchmark revision in 2006, introducing changes in methods, definitions and source data that are applied to
the entire time series (back to 1960). For more information on this revision, see http://www.cms.hhs.gov/NationalHealthExpendData/downloads/benchmark.pdf.
Data for Chart 1.8
Year Expenditures (billions)
1980 $254
1990 $714
1998 $1,191
1999 $1,265
2000 $1,353
2001 $1,470
2002 $1,603
2003 $1,733
2004 $1,859
2005 $1,988
2006 $2,122
2007 $2,262
2008 $2,420
2009 $2,596
2010 $2,776
2011 $2,966
2012 $3,173
2013 $3,396
2014 $3,629
2015 $3,875
2016 $4,137
A-7
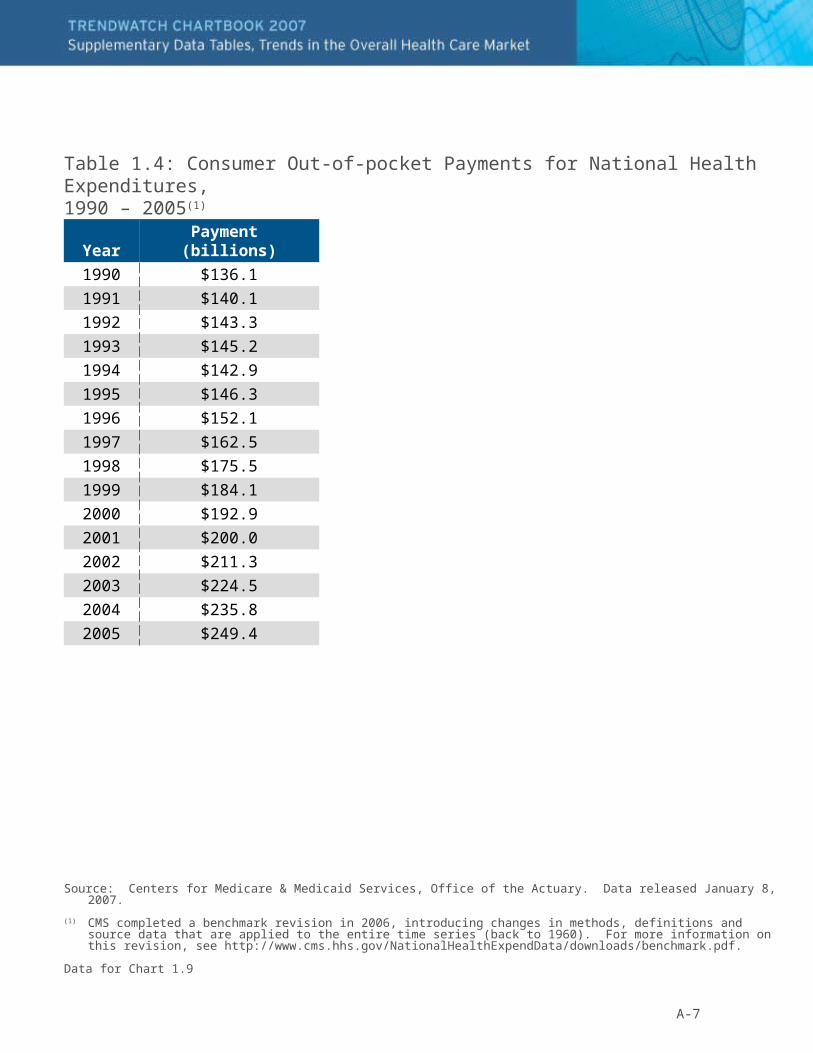
Table 1.4: Consumer Out-of-pocket Payments for National Health Expenditures, 1990 – 2005(1)
Source: Centers for Medicare & Medicaid Services, Office of the Actuary. Data released January 8, 2007.
(1) CMS completed a benchmark revision in 2006, introducing changes in methods, definitions and source data that are applied to the entire time series (back to 1960). For more information on this revision, see http://www.cms.hhs.gov/NationalHealthExpendData/downloads/benchmark.pdf.
Data for Chart 1.9
YearPayment (billions)
1990 $136.1
1991 $140.1
1992 $143.3
1993 $145.2
1994 $142.9
1995 $146.3
1996 $152.1
1997 $162.5
1998 $175.5
1999 $184.1
2000 $192.9
2001 $200.0
2002 $211.3
2003 $224.5
2004 $235.8
2005 $249.4
A-8
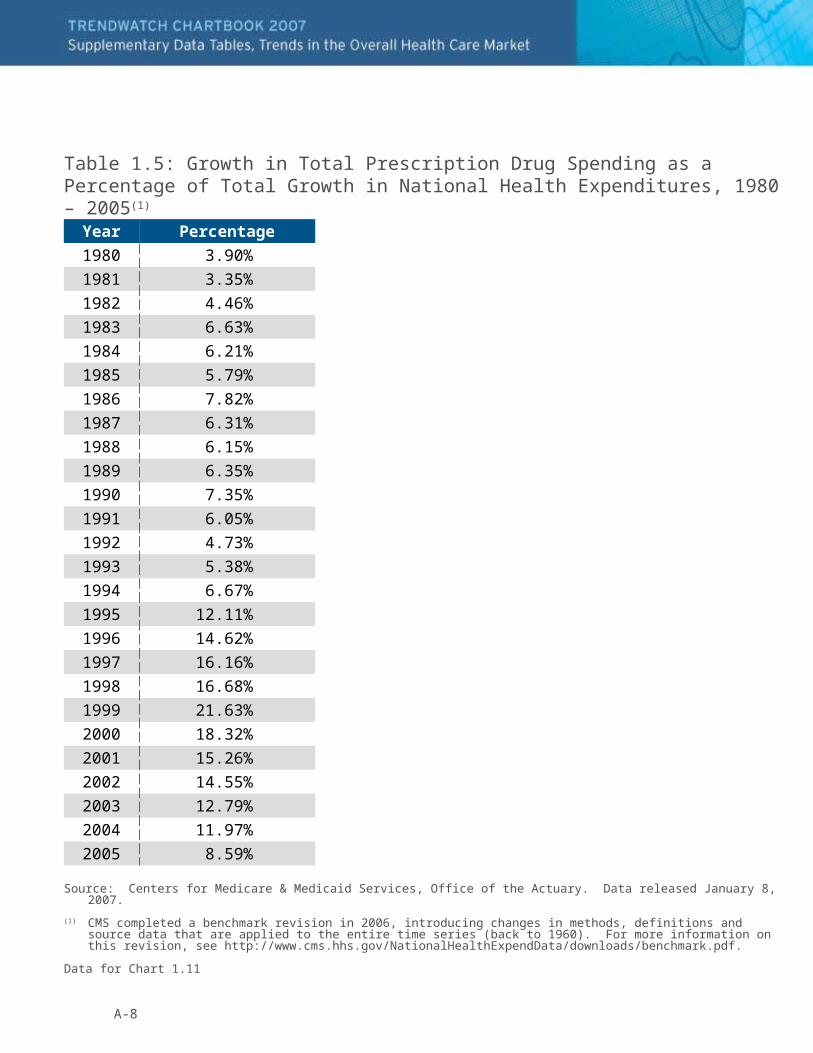
Table 1.5: Growth in Total Prescription Drug Spending as a Percentage of Total Growth in National Health Expenditures, 1980 – 2005(1)
Source: Centers for Medicare & Medicaid Services, Office of the Actuary. Data released January 8, 2007.
(1) CMS completed a benchmark revision in 2006, introducing changes in methods, definitions and source data that are applied to the entire time series (back to 1960). For more information on this revision, see http://www.cms.hhs.gov/NationalHealthExpendData/downloads/benchmark.pdf.
Data for Chart 1.11
Year Percentage
1980 3.90%
1981 3.35%
1982 4.46%
1983 6.63%
1984 6.21%
1985 5.79%
1986 7.82%
1987 6.31%
1988 6.15%
1989 6.35%
1990 7.35%
1991 6.05%
1992 4.73%
1993 5.38%
1994 6.67%
1995 12.11%
1996 14.62%
1997 16.16%
1998 16.68%
1999 21.63%
2000 18.32%
2001 15.26%
2002 14.55%
2003 12.79%
2004 11.97%
2005 8.59%
A-9
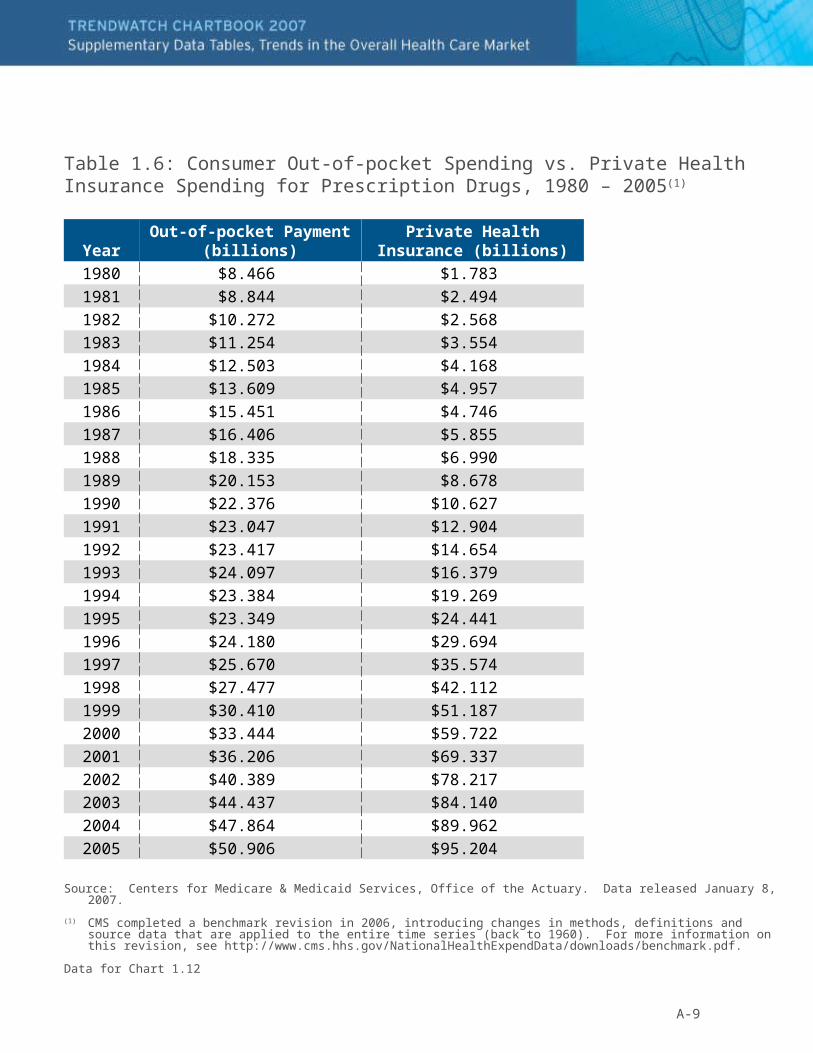
Table 1.6: Consumer Out-of-pocket Spending vs. Private Health Insurance Spending for Prescription Drugs, 1980 – 2005(1)
Source: Centers for Medicare & Medicaid Services, Office of the Actuary. Data released January 8, 2007.
(1) CMS completed a benchmark revision in 2006, introducing changes in methods, definitions and source data that are applied to the entire time series (back to 1960). For more information on this revision, see http://www.cms.hhs.gov/NationalHealthExpendData/downloads/benchmark.pdf.
Data for Chart 1.12
YearOut-of-pocket Payment
(billions)Private Health Insurance
(billions)
1980 $8.466 $1.783
1981 $8.844 $2.494
1982 $10.272 $2.568
1983 $11.254 $3.554
1984 $12.503 $4.168
1985 $13.609 $4.957
1986 $15.451 $4.746
1987 $16.406 $5.855
1988 $18.335 $6.990
1989 $20.153 $8.678
1990 $22.376 $10.627
1991 $23.047 $12.904
1992 $23.417 $14.654
1993 $24.097 $16.379
1994 $23.384 $19.269
1995 $23.349 $24.441
1996 $24.180 $29.694
1997 $25.670 $35.574
1998 $27.477 $42.112
1999 $30.410 $51.187
2000 $33.444 $59.722
2001 $36.206 $69.337
2002 $40.389 $78.217
2003 $44.437 $84.140
2004 $47.864 $89.962
2005 $50.906 $95.204
A-10
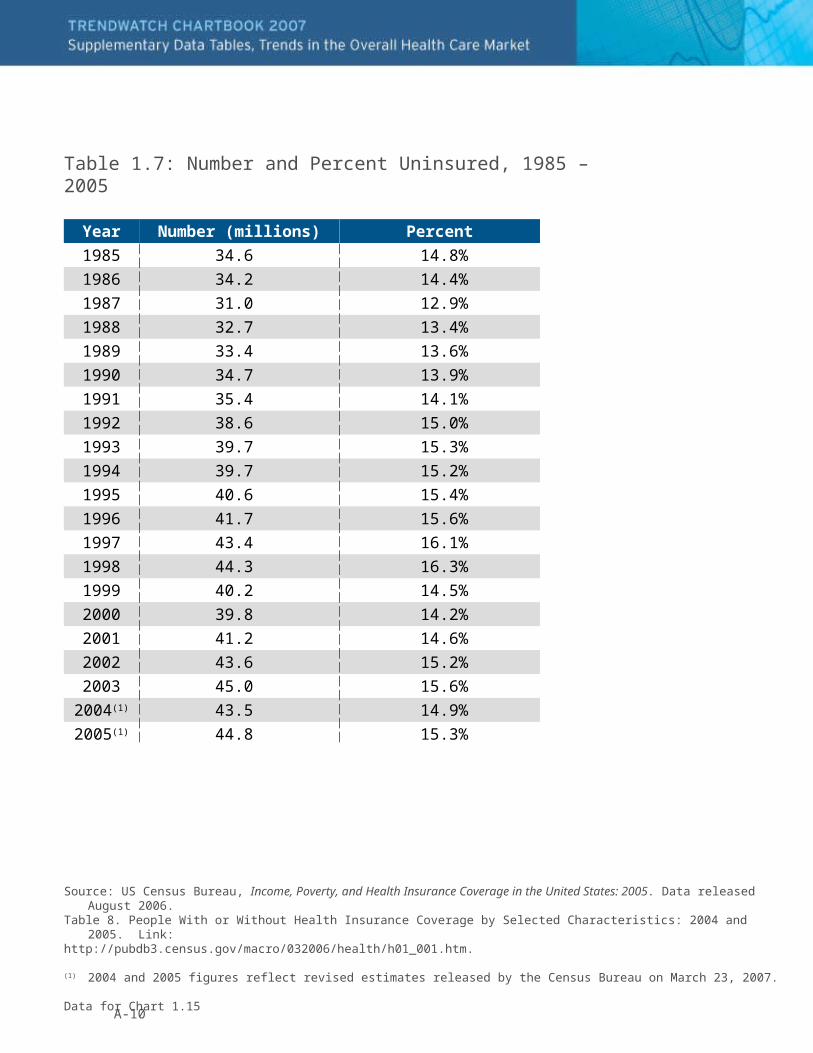
Table 1.7: Number and Percent Uninsured, 1985 – 2005
Source: US Census Bureau, Income, Poverty, and Health Insurance Coverage in the United States: 2005. Data released August 2006.
Table 8. People With or Without Health Insurance Coverage by Selected Characteristics: 2004 and 2005. Link:http://pubdb3.census.gov/macro/032006/health/h01_001.htm.
(1) 2004 and 2005 figures reflect revised estimates released by the Census Bureau on March 23, 2007.
Data for Chart 1.15
Year Number (millions) Percent
1985 34.6 14.8%
1986 34.2 14.4%
1987 31.0 12.9%
1988 32.7 13.4%
1989 33.4 13.6%
1990 34.7 13.9%
1991 35.4 14.1%
1992 38.6 15.0%
1993 39.7 15.3%
1994 39.7 15.2%
1995 40.6 15.4%
1996 41.7 15.6%
1997 43.4 16.1%
1998 44.3 16.3%
1999 40.2 14.5%
2000 39.8 14.2%
2001 41.2 14.6%
2002 43.6 15.2%
2003 45.0 15.6%
2004(1) 43.5 14.9%
2005(1) 44.8 15.3%
A-11
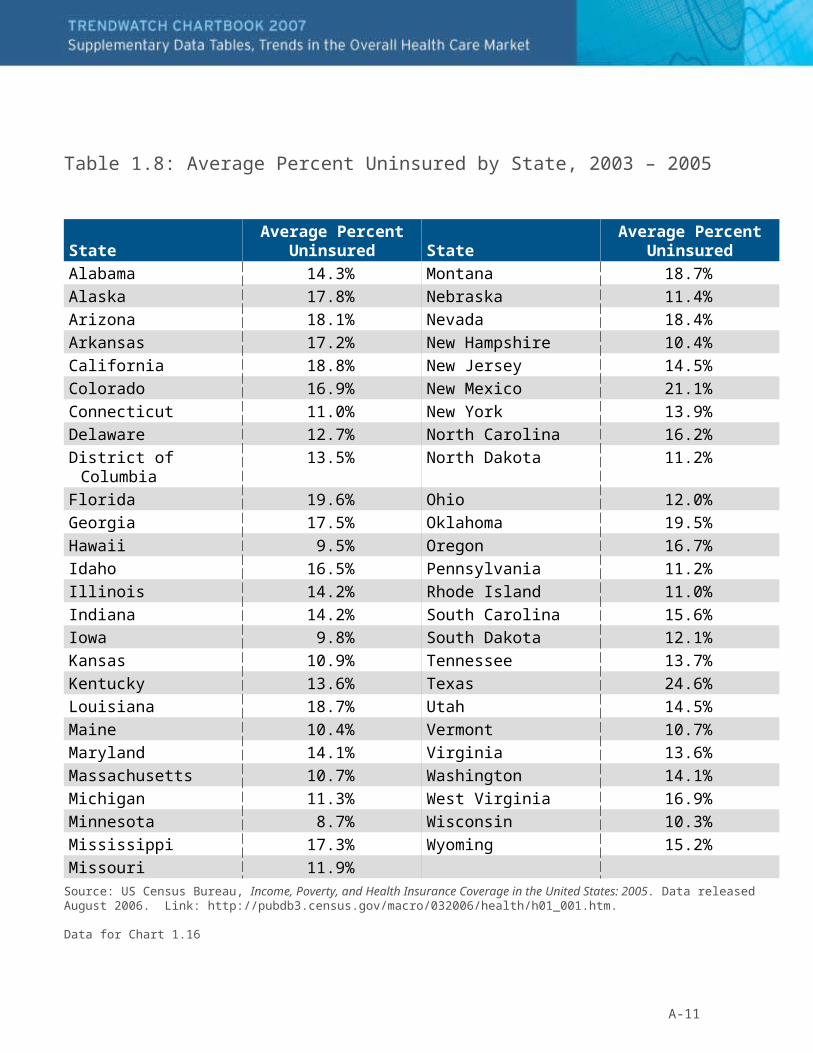
Table 1.8: Average Percent Uninsured by State, 2003 – 2005
Source: US Census Bureau, Income, Poverty, and Health Insurance Coverage in the United States: 2005. Data released August 2006. Link: http://pubdb3.census.gov/macro/032006/health/h01_001.htm.
Data for Chart 1.16
StateAverage Percent
Uninsured StateAverage Percent
Uninsured
Alabama 14.3% Montana 18.7%
Alaska 17.8% Nebraska 11.4%
Arizona 18.1% Nevada 18.4%
Arkansas 17.2% New Hampshire 10.4%
California 18.8% New Jersey 14.5%
Colorado 16.9% New Mexico 21.1%
Connecticut 11.0% New York 13.9%
Delaware 12.7% North Carolina 16.2%
District of Columbia 13.5% North Dakota 11.2%
Florida 19.6% Ohio 12.0%
Georgia 17.5% Oklahoma 19.5%
Hawaii 9.5% Oregon 16.7%
Idaho 16.5% Pennsylvania 11.2%
Illinois 14.2% Rhode Island 11.0%
Indiana 14.2% South Carolina 15.6%
Iowa 9.8% South Dakota 12.1%
Kansas 10.9% Tennessee 13.7%
Kentucky 13.6% Texas 24.6%
Louisiana 18.7% Utah 14.5%
Maine 10.4% Vermont 10.7%
Maryland 14.1% Virginia 13.6%
Massachusetts 10.7% Washington 14.1%
Michigan 11.3% West Virginia 16.9%
Minnesota 8.7% Wisconsin 10.3%
Mississippi 17.3% Wyoming 15.2%
Missouri 11.9%
A-12
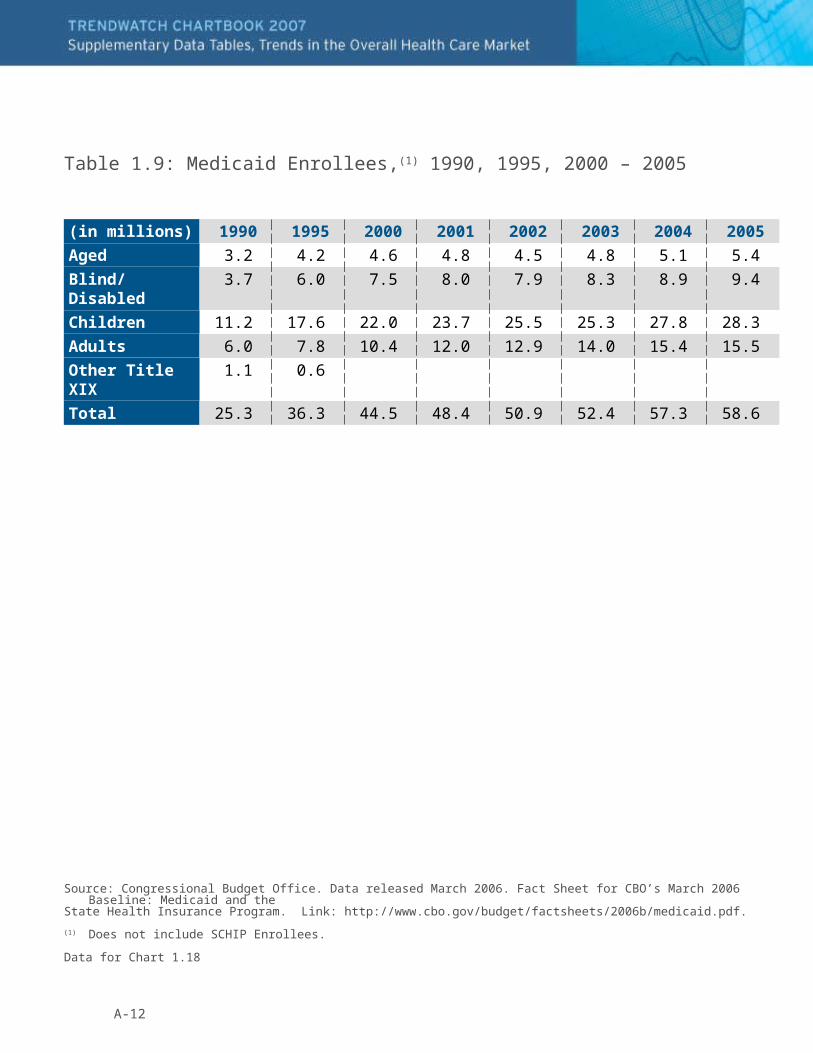
Table 1.9: Medicaid Enrollees,(1) 1990, 1995, 2000 – 2005
Source: Congressional Budget Office. Data released March 2006. Fact Sheet for CBO’s March 2006 Baseline: Medicaid and theState Health Insurance Program. Link: http://www.cbo.gov/budget/factsheets/2006b/medicaid.pdf.
(1) Does not include SCHIP Enrollees.
Data for Chart 1.18
(in millions) 1990 1995 2000 2001 2002 2003 2004 2005
Aged 3.2 4.2 4.6 4.8 4.5 4.8 5.1 5.4
Blind/Disabled 3.7 6.0 7.5 8.0 7.9 8.3 8.9 9.4
Children 11.2 17.6 22.0 23.7 25.5 25.3 27.8 28.3
Adults 6.0 7.8 10.4 12.0 12.9 14.0 15.4 15.5
Other Title XIX 1.1 0.6
Total 25.3 36.3 44.5 48.4 50.9 52.4 57.3 58.6
A-13
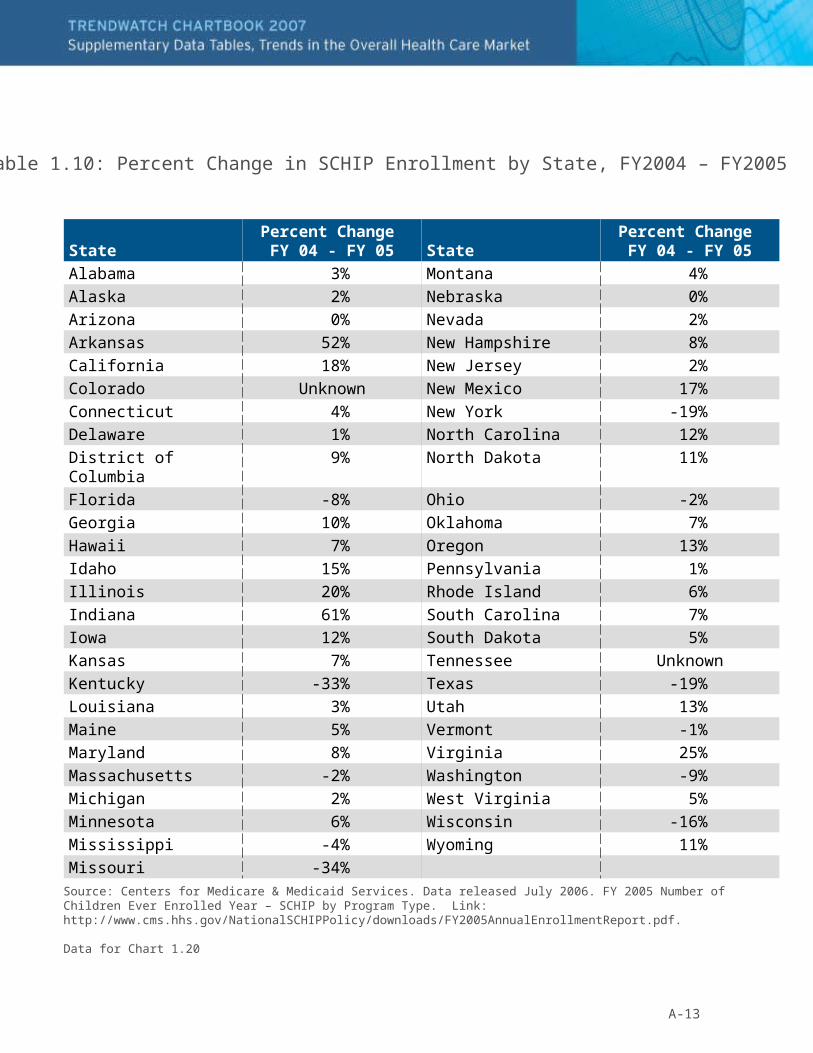
Table 1.10: Percent Change in SCHIP Enrollment by State, FY2004 – FY2005
Source: Centers for Medicare & Medicaid Services. Data released July 2006. FY 2005 Number of Children Ever Enrolled Year – SCHIP by Program Type. Link: http://www.cms.hhs.gov/NationalSCHIPPolicy/downloads/FY2005AnnualEnrollmentReport.pdf.
Data for Chart 1.20
StatePercent Change
FY 04 - FY 05 StatePercent Change
FY 04 - FY 05
Alabama 3% Montana 4%
Alaska 2% Nebraska 0%
Arizona 0% Nevada 2%
Arkansas 52% New Hampshire 8%
California 18% New Jersey 2%
Colorado Unknown New Mexico 17%
Connecticut 4% New York -19%
Delaware 1% North Carolina 12%
District of Columbia 9% North Dakota 11%
Florida -8% Ohio -2%
Georgia 10% Oklahoma 7%
Hawaii 7% Oregon 13%
Idaho 15% Pennsylvania 1%
Illinois 20% Rhode Island 6%
Indiana 61% South Carolina 7%
Iowa 12% South Dakota 5%
Kansas 7% Tennessee Unknown
Kentucky -33% Texas -19%
Louisiana 3% Utah 13%
Maine 5% Vermont -1%
Maryland 8% Virginia 25%
Massachusetts -2% Washington -9%
Michigan 2% West Virginia 5%
Minnesota 6% Wisconsin -16%
Mississippi -4% Wyoming 11%
Missouri -34%
A-14
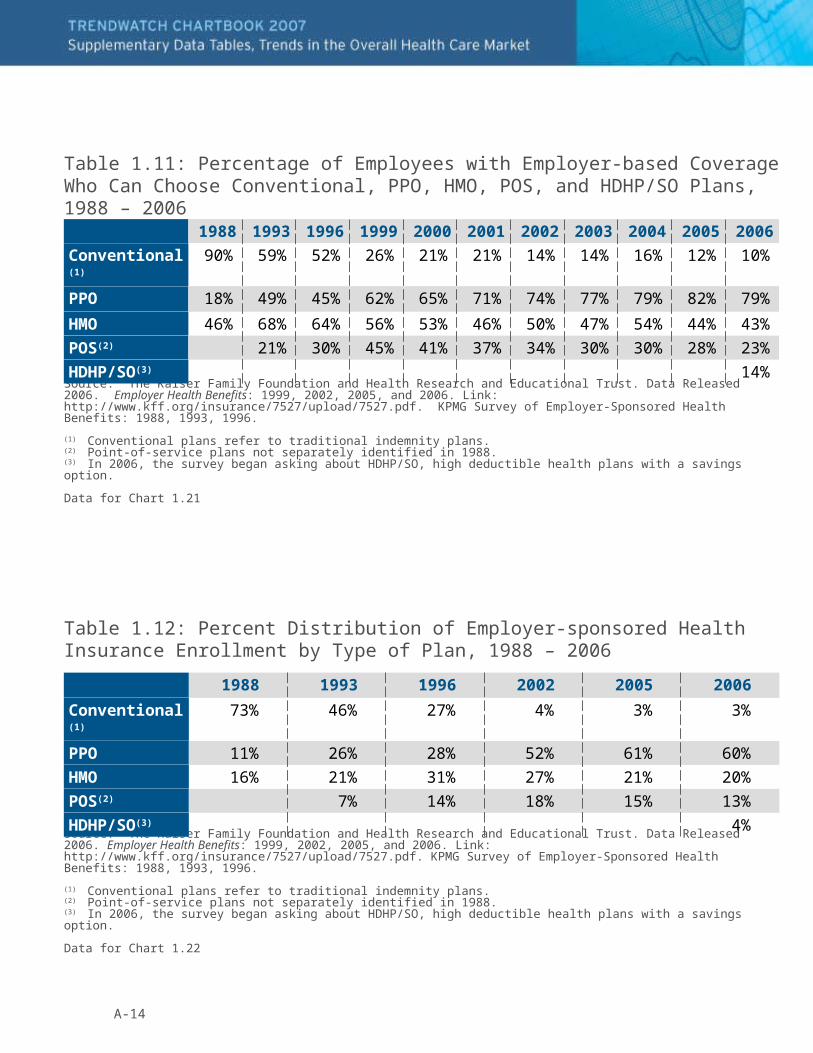
Table 1.11: Percentage of Employees with Employer-based Coverage Who Can Choose Conventional, PPO, HMO, POS, and HDHP/SO Plans, 1988 – 2006
Table 1.12: Percent Distribution of Employer-sponsored Health Insurance Enrollment by Type of Plan, 1988 – 2006
Source: The Kaiser Family Foundation and Health Research and Educational Trust. Data Released 2006. Employer Health Benefits: 1999, 2002, 2005, and 2006. Link: http://www.kff.org/insurance/7527/upload/7527.pdf. KPMG Survey of Employer-Sponsored Health Benefits: 1988, 1993, 1996.
(1) Conventional plans refer to traditional indemnity plans.(2) Point-of-service plans not separately identified in 1988. (3) In 2006, the survey began asking about HDHP/SO, high deductible health plans with a savings option.
Data for Chart 1.21
Source: The Kaiser Family Foundation and Health Research and Educational Trust. Data Released 2006. Employer Health Benefits: 1999, 2002, 2005, and 2006. Link: http://www.kff.org/insurance/7527/upload/7527.pdf. KPMG Survey of Employer-Sponsored Health Benefits: 1988, 1993, 1996.
(1) Conventional plans refer to traditional indemnity plans.(2) Point-of-service plans not separately identified in 1988. (3) In 2006, the survey began asking about HDHP/SO, high deductible health plans with a savings option.
Data for Chart 1.22
1988 1993 1996 1999 2000 2001 2002 2003 2004 2005 2006
Conventional(1) 90% 59% 52% 26% 21% 21% 14% 14% 16% 12% 10%
PPO 18% 49% 45% 62% 65% 71% 74% 77% 79% 82% 79%
HMO 46% 68% 64% 56% 53% 46% 50% 47% 54% 44% 43%
POS(2) 21% 30% 45% 41% 37% 34% 30% 30% 28% 23%
HDHP/SO(3) 14%
1988 1993 1996 2002 2005 2006
Conventional(1) 73% 46% 27% 4% 3% 3%
PPO 11% 26% 28% 52% 61% 60%
HMO 16% 21% 31% 27% 21% 20%
POS(2) 7% 14% 18% 15% 13%
HDHP/SO(3) 4%
A-15
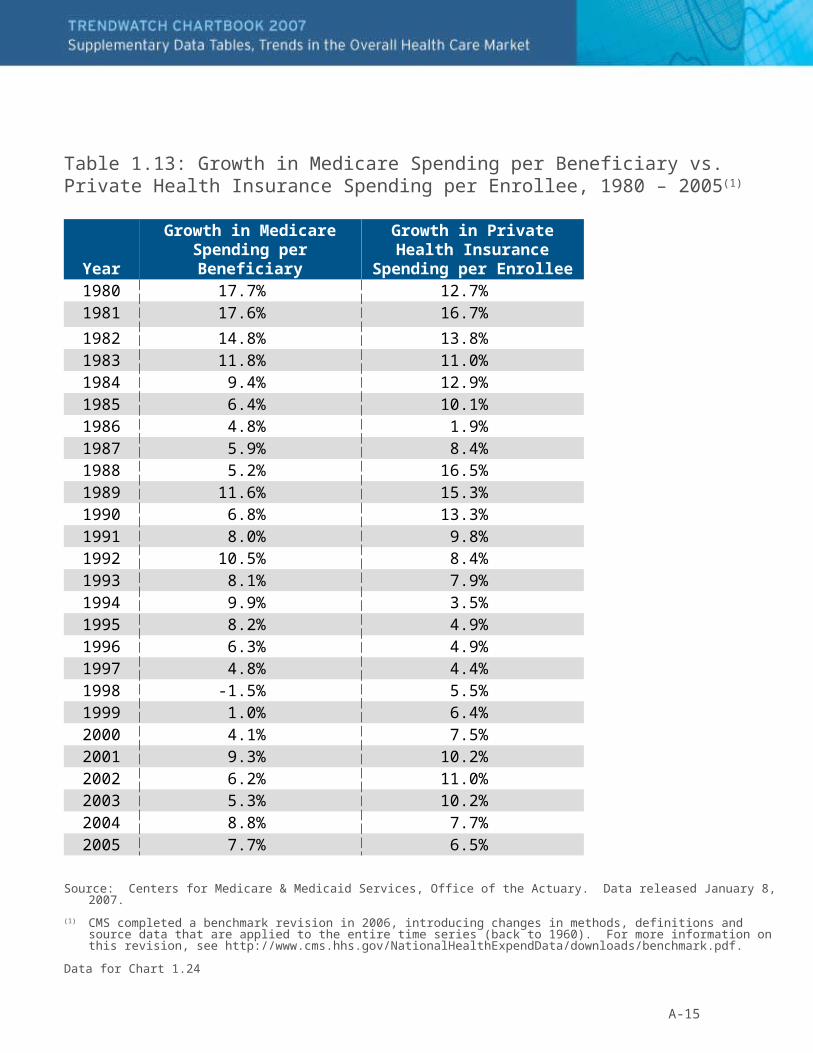
Table 1.13: Growth in Medicare Spending per Beneficiary vs. Private Health Insurance Spending per Enrollee, 1980 – 2005(1)
Source: Centers for Medicare & Medicaid Services, Office of the Actuary. Data released January 8, 2007.
(1) CMS completed a benchmark revision in 2006, introducing changes in methods, definitions and source data that are applied to the entire time series (back to 1960). For more information on this revision, see http://www.cms.hhs.gov/NationalHealthExpendData/downloads/benchmark.pdf.
Data for Chart 1.24
YearGrowth in Medicare
Spending per Beneficiary
Growth in Private Health Insurance Spending per
Enrollee1980 17.7% 12.7%1981 17.6% 16.7%
1982 14.8% 13.8%1983 11.8% 11.0%1984 9.4% 12.9%1985 6.4% 10.1%1986 4.8% 1.9%1987 5.9% 8.4%1988 5.2% 16.5%1989 11.6% 15.3%1990 6.8% 13.3%1991 8.0% 9.8%1992 10.5% 8.4%1993 8.1% 7.9%1994 9.9% 3.5%1995 8.2% 4.9%1996 6.3% 4.9%1997 4.8% 4.4%1998 -1.5% 5.5%1999 1.0% 6.4%2000 4.1% 7.5%2001 9.3% 10.2%2002 6.2% 11.0%2003 5.3% 10.2%2004 8.8% 7.7%2005 7.7% 6.5%
A-16
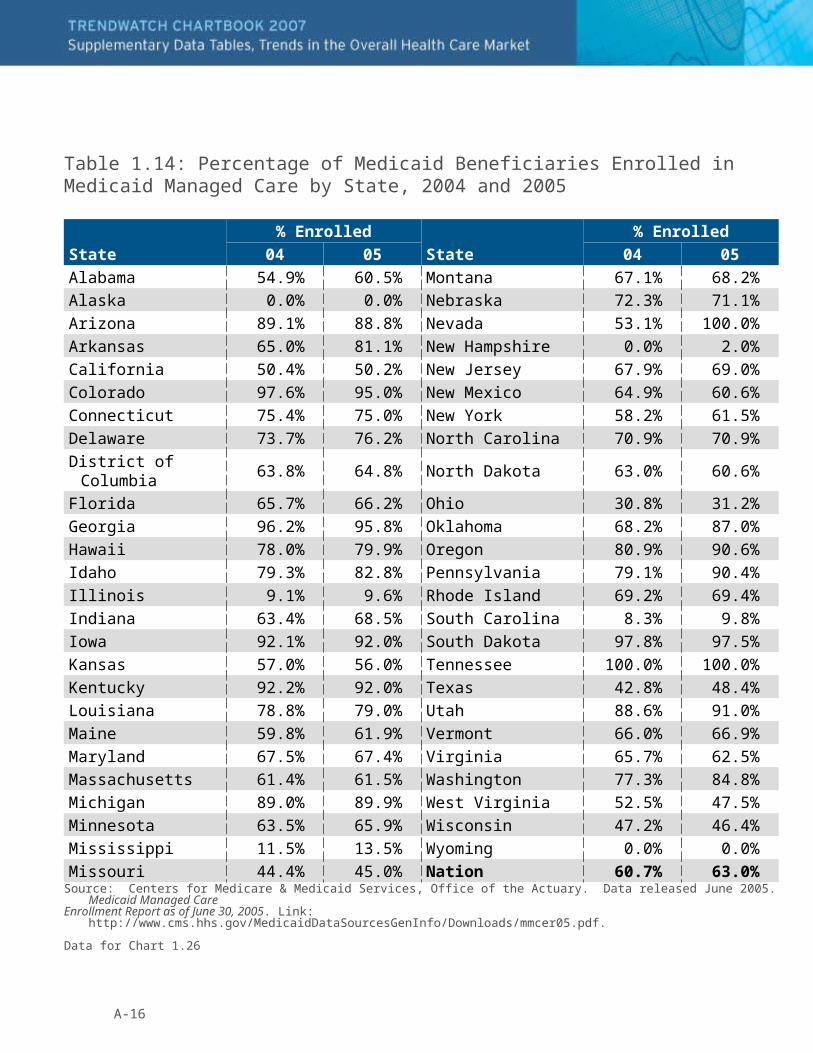
Table 1.14: Percentage of Medicaid Beneficiaries Enrolled in Medicaid Managed Care by State, 2004 and 2005
Source: Centers for Medicare & Medicaid Services, Office of the Actuary. Data released June 2005. Medicaid Managed Care Enrollment Report as of June 30, 2005. Link: http://www.cms.hhs.gov/MedicaidDataSourcesGenInfo/Downloads/mmcer05.pdf.
Data for Chart 1.26
State
% Enrolled
State
% Enrolled
04 05 04 05
Alabama 54.9% 60.5% Montana 67.1% 68.2%
Alaska 0.0% 0.0% Nebraska 72.3% 71.1%
Arizona 89.1% 88.8% Nevada 53.1% 100.0%
Arkansas 65.0% 81.1% New Hampshire 0.0% 2.0%
California 50.4% 50.2% New Jersey 67.9% 69.0%
Colorado 97.6% 95.0% New Mexico 64.9% 60.6%
Connecticut 75.4% 75.0% New York 58.2% 61.5%
Delaware 73.7% 76.2% North Carolina 70.9% 70.9%
District of Columbia 63.8% 64.8% North Dakota 63.0% 60.6%
Florida 65.7% 66.2% Ohio 30.8% 31.2%
Georgia 96.2% 95.8% Oklahoma 68.2% 87.0%
Hawaii 78.0% 79.9% Oregon 80.9% 90.6%
Idaho 79.3% 82.8% Pennsylvania 79.1% 90.4%
Illinois 9.1% 9.6% Rhode Island 69.2% 69.4%
Indiana 63.4% 68.5% South Carolina 8.3% 9.8%
Iowa 92.1% 92.0% South Dakota 97.8% 97.5%
Kansas 57.0% 56.0% Tennessee 100.0% 100.0%
Kentucky 92.2% 92.0% Texas 42.8% 48.4%
Louisiana 78.8% 79.0% Utah 88.6% 91.0%
Maine 59.8% 61.9% Vermont 66.0% 66.9%
Maryland 67.5% 67.4% Virginia 65.7% 62.5%
Massachusetts 61.4% 61.5% Washington 77.3% 84.8%
Michigan 89.0% 89.9% West Virginia 52.5% 47.5%
Minnesota 63.5% 65.9% Wisconsin 47.2% 46.4%
Mississippi 11.5% 13.5% Wyoming 0.0% 0.0%
Missouri 44.4% 45.0% Nation 60.7% 63.0%
A-17
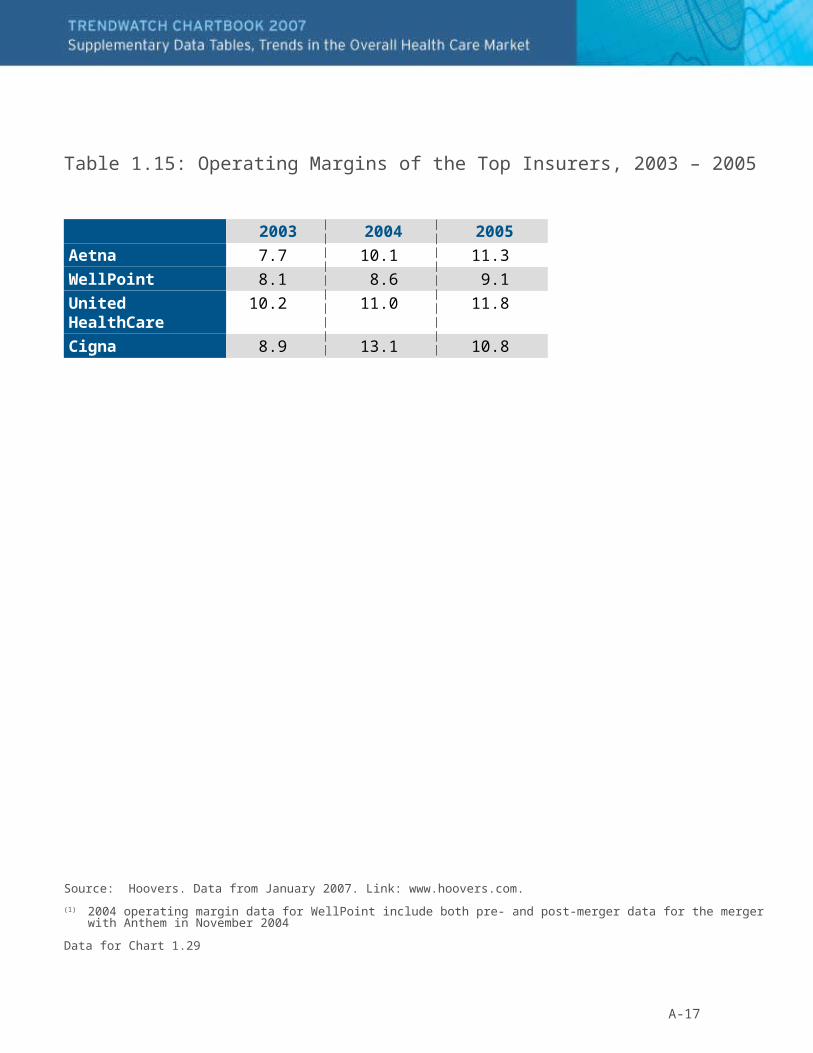
Table 1.15: Operating Margins of the Top Insurers, 2003 – 2005
Source: Hoovers. Data from January 2007. Link: www.hoovers.com.
(1) 2004 operating margin data for WellPoint include both pre- and post-merger data for the merger with Anthem in November 2004
Data for Chart 1.29
2003 2004 2005
Aetna 7.7 10.1 11.3
WellPoint 8.1 8.6 9.1
United HealthCare 10.2 11.0 11.8
Cigna 8.9 13.1 10.8