Embed Size (px)
Citation preview
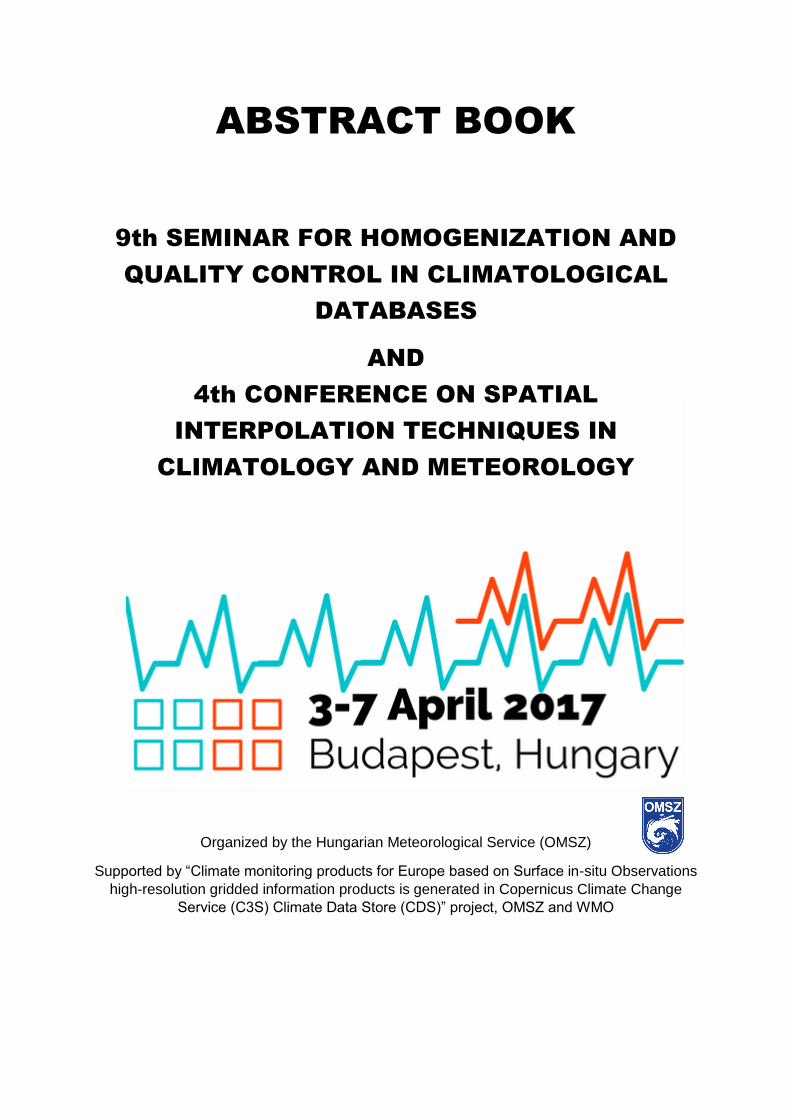
ABSTRACT BOOK
9th SEMINAR FOR HOMOGENIZATION AND
QUALITY CONTROL IN CLIMATOLOGICAL
DATABASES
AND
4th CONFERENCE ON SPATIAL
INTERPOLATION TECHNIQUES IN
CLIMATOLOGY AND METEOROLOGY
Organized by the Hungarian Meteorological Service (OMSZ)
Supported by “Climate monitoring products for Europe based on Surface in-situ Observations
high-resolution gridded information products is generated in Copernicus Climate Change
Service (C3S) Climate Data Store (CDS)” project, OMSZ and WMO
2
9th Seminar for Homogenization and Quality Control in Climatological Databases and
4th Conference on Spatial Interpolation Techniques in Climatology and Meteorology
Budapest, Hungary 3- 7 April 2017
Edited by
Tamás SZENTIMREY
Lilla HOFFMANN
Mónika LAKATOS
Published by
Hungarian Meteorological Service
www.met.hu
ISBN 978-963-7702-96-9
DOI: 10.21404/9.SemHQC4.ConfSI.2017

3
PROGRAMME
Budapest, Hungary
03-07 April 2017
Venue:
The Headquarters of the Hungarian Meteorological Service (1 Kitaibel Pál street, Budapest)
Homogenization sessions: 03 April Monday-05 April Wednesday
Interpolation session: 05 April Wednesday-06 April Thursday
Software session: 07 April Friday
MONDAY, 03 APRIL
8:30 9:00 Registration
9:00 12:00
Opening addresses by
President of HMS
Delegate of WMO
Organizers
Introductory Presentations
Hechler, P., Baddour, O.: Underpinning Climate Services
Coffee break
Szentimrey, T.: Introduction on homogenization, quality control, spatial interpolation,
gridding
Venema, V., Lindau, R.: Global temperature trend biases and statistical
homogenization methods
Lunch break
14:00 17:00 Homogenization and quality control
Aguilar, E., Asín, J., Azorín, C., Gilabert, A., Guijarro, J. A., Lopez, J. A., Prohom, M.,
Rasilla, M., Solé, G.: Evaluation of the Impact over temperature series of the
transitions between observation systems (IMPACTRON)
Guijarro, J.A., Cuxart, J., Simó, G., Martínez-Villagrasa, D., López, A., Picos, R., Martí,
B., Jiménez, M.A., Gilabert A., Aguilar, E.: Small scale surface heterogeneities and
impact on station relocations
Hannak, L.: Analysis of the impacts of the automatization of measurement systems
using parallel measurements from German Climate Reference Stations
Coffee break
Domonkos, P.: Time series homogenisation with optimal segmentation and ANOVA
correction: past, present and future

4
Guijarro, J. A., Lopez, J. A., Aguilar, E., Domonkos, P., Venema, V.K.C., Sigró, J.,
Brunet, M.: Comparison of homogenization packages applied to monthly series of
temperature and precipitation: the MULTITEST project
18:00 Welcome party (Hungarian Meteorological Service, 1 Kitaibel Pál street, Budapest)
TUESDAY, 04 APRIL
9:00 12:00 Homogenization and quality control
9:00 10:30 New WMO Guidance on homogenisation: Introductory presentation by Victor
Venema, followed by an open discussion seeking feedback from seminar
participants
Coffee break
Szentimrey, T.: Some theoretical questions and development of MASH for
homogenization of standard deviation
Lundstad, E., Stepanek, P., Zahradníček, P.: Long-term homogenised precipitation data
sets for Norway
Motrøen Gjelten, H., Lundstad, E., Tveito, O. E.: Homogeneity testing of seasonal
precipitation series in Norway
Lunch break
14:00 17:00 Homogenization and quality control
Chimani, B., Ganekind, M.: Differences in Climate Evolution Analyses depending on
the choice o by homogenization method and time span
Shelton, K., Warren, S., Davis, R., Faulkner, D.: Homogenisation of daily station data
in England and Wales
Squintu, A.: Homogenization of ECA&D temperature series
Coffee break
Vint, K., Keevallik, S., Meitern, H.: Inhomogenieties in Estonian air temperature series
with CLIMATOL and HOMER
Yosef, Y., Aguilar, E., Alpert, P.: Comparison of different daily adjustment methods for
the maximum and minimum temperature in Israel
Mateus, C., Potito, A., Curley, M.: Digitisation and homogenisation of the long term
daily (max/min) summer and winter air temperature records in Ireland
WEDNESDAY, 05 APRIL
9:00 12:00 Homogenization and quality control
Rustemeier, E., Kapala, A., Meyer-Christoffer, A., Finger, P., Schneider, U., Venema,
V., Ziese, M., Simmer, C., Becker, A.: HOMPRA Europe - A gridded precipitation
data set from European homogenized time series
Zahradníček, P., Petr, S.: Homogenization of the wind speed time series in Czech
Republic

5
Rasol, D.: Modernisation of Croatian Meteorological Measurements Network
Coffee break
Bertrand, C., Journée, M.: Data QC within the Belgian synoptic and climatological
networks: an overview
Michel A, P.: A machine learning perspective towards fully automated quality control
in daily weather time series
Delvaux, C.: Quality Control and Homogenization of the Belgian Historical Weather
Data
Lunch break
14:00 15:20 Homogenization and quality control
Graw, K., Schröder, M., Andersson, A., Kinzel, J., Fennig, K., Hollmann, R.: Stability
of satellite based climate data records (CDRs) retrieved by CM SAF
Van Malderen, R., Pottiaux, E., Klos, A., Bock, O., Bogusz, J., Chimani, B., Elias, M.,
Gruszczynska, M., Guijarro, J. A., Zengin Kazancı, S., Ning, T.: The homogenization
of GPS Integrated Water Vapour time series: methodology and benchmarking the
algorithms on synthetic datasets
Schröder, M., Lockhoff, M., Shi, L., Graw, K.: The GEWEX water vapor assessment
(G-VAP) – results from inter-comparisons and stability analysis
Coffee break
15:40-17:00 Spatial interpolation, gridded datasets
Szentimrey, T.: New developments of interpolation method MISH: modelling of
interpolation error RMSE, automated real time Quality Control
Peña-Angulo, D., Celia, S. S., Rodrigues, M., Azucena, J. C., Brunetti, M., González-
Hidalgo, J. C.: Comparison of different interpolation methods for the generation of a
climatology with maximum and minimum monthly temperatures
19:00 Seminar banquet
THURSDAY, 06 APRIL
9:00 12:00 Spatial Interpolation, gridded datasets
Isotta, F., Begert, M., Frei, C.: Temperature and precipitation grid datasets for climate
monitoring based on homogeneous time series in Switzerland
Frei, C., Isotta, F.: Uncertainty in the interpolation of daily precipitation – Insights from
an ensemble analysis for the Alps
Lussana, C., Tveito, O. E.: Nordic gridded climate data set, status and plans
Coffee break
Tveito, O. E, Lussana, C.: Ensemble approaches to assess uncertainties in observation
gridding
6
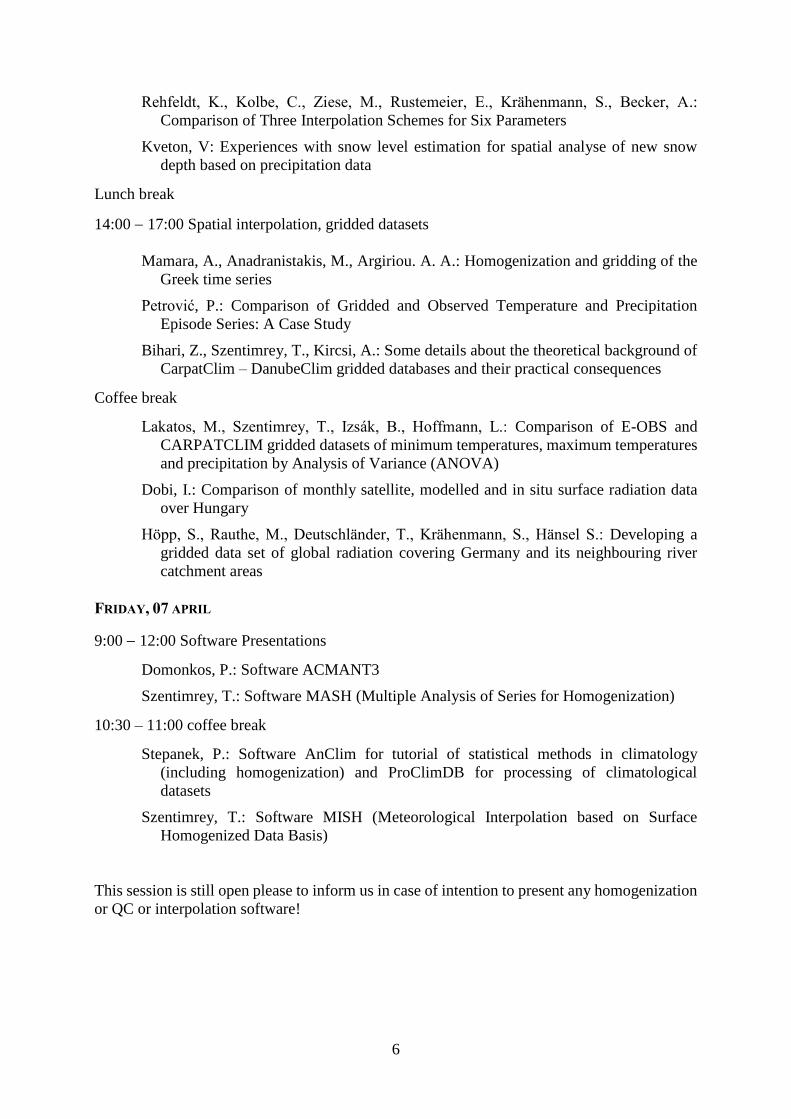
Rehfeldt, K., Kolbe, C., Ziese, M., Rustemeier, E., Krähenmann, S., Becker, A.:
Comparison of Three Interpolation Schemes for Six Parameters
Kveton, V: Experiences with snow level estimation for spatial analyse of new snow
depth based on precipitation data
Lunch break
14:00 17:00 Spatial interpolation, gridded datasets
Mamara, A., Anadranistakis, M., Argiriou. A. A.: Homogenization and gridding of the
Greek time series
Petrović, P.: Comparison of Gridded and Observed Temperature and Precipitation
Episode Series: A Case Study
Bihari, Z., Szentimrey, T., Kircsi, A.: Some details about the theoretical background of
CarpatClim – DanubeClim gridded databases and their practical consequences
Coffee break
Lakatos, M., Szentimrey, T., Izsák, B., Hoffmann, L.: Comparison of E-OBS and
CARPATCLIM gridded datasets of minimum temperatures, maximum temperatures
and precipitation by Analysis of Variance (ANOVA)
Dobi, I.: Comparison of monthly satellite, modelled and in situ surface radiation data
over Hungary
Höpp, S., Rauthe, M., Deutschländer, T., Krähenmann, S., Hänsel S.: Developing a
gridded data set of global radiation covering Germany and its neighbouring river
catchment areas
FRIDAY, 07 APRIL
9:00 12:00 Software Presentations
Domonkos, P.: Software ACMANT3
Szentimrey, T.: Software MASH (Multiple Analysis of Series for Homogenization)
10:30 – 11:00 coffee break
Stepanek, P.: Software AnClim for tutorial of statistical methods in climatology
(including homogenization) and ProClimDB for processing of climatological
datasets
Szentimrey, T.: Software MISH (Meteorological Interpolation based on Surface
Homogenized Data Basis)
This session is still open please to inform us in case of intention to present any homogenization
or QC or interpolation software!

7
LIST OF PARTICIPANTS 2017
AUSTRIA
BARBARA CHIMANI
Central Institute for Meteorology and
Geodynamics
BELGIUM
CEDRIC BERTRAND
Royal Meteorological Institute of Belgium
CHARLES DELVAUX
Royal Meteorological Institute of Belgium
PEREZ MICHEL A.
Royal Meteorological Institute of
Belgium& ETRO-VUB
ROELAND VAN MALDEREN
Royal Meteorological Institute of Belgium
ROMAIN INGELS
Royal Meteorological Institute of Belgium
CROATIA
ANA WEISSENBERGER
Meteorological and Hydrological Service,
Croatia
DUBRAVKA RASOL
Meteorological and Hydrological Service,
Croatia
KUZMIC JOSIPA
Meteorological and Hydrological Service,
Croatia
SLAVICEK LASTA
Meteorological and Hydrological Service,
Croatia
CZECH REPUBLIC
PETR STEPANEK
Global Change Research Centre AS CR, v.
v. i.
PAVEL ZAHRADNÍCEK
Global Change Research Institute, AS CR,
v.v.i, Brno, Czech Republic/ Czech
Hydrometeorological Institute, Brno,
Czech Republic
VÍT KVĚTOŇ
Czech Hydrometeorological Institute
ESTONIA
KAIRI VINT
Estonian Environment Agency
FRANCE
OLIVIER BOCK
IGN (French National Geographic
Institute)
GERMANY
ELKE RUSTEMEIER
Global Precipitation Climatology Centre /
Deutscher Wetterdienst
KARSTEN FRIEDRICH
Deutscher Wetterdienst

8
KATHRIN GRAW
Deutscher Wetterdienst
KIRA REHFELDT
Deutscher Wetterdienst
LISA HANNAK
Deutscher Wetterdienst
SIMONA HÖPP
Deutscher Wetterdienst
VICTOR VENEMA
Meteorological Institute of University
Bonn
GREECE
ATHANASSIOS ARGIRIOU
Laboratory of Atmospheric Physics,
University of Patras
HUNGARY
TAMÁS SZENTIMREY
Hungarian Meteorological Service
ZITA BIHARI
Hungarian Meteorological Service
MÓNIKA LAKATOS
Hungarian Meteorological Service
ILDIKÓ DOBI
Hungarian Meteorological Service
SÁNDOR SZALAI
Szent István University
LILLA HOFFMANN
Hungarian Meteorological Service
ANDREA KIRCSI
Hungarian Meteorological Service
BEATRIX IZSÁK
Hungarian Meteorological Service
IRELAND
CARLA PATRÍCIA PEDROSO MATEUS
National University of Ireland Galway
MARY CURLEY
Met Eireann
ISRAEL
YIZHAK YOSEF
Israel Meteorological Service and Tel-
Aviv University
ITALY
GUIDO FIORAVANTI
ISPRA
LATVIA
SVETLANA ANISKEVICH
Latvian Environment, Geology and
Meteorology Centre
MONTENEGRO
VANJA RAJOVIC
Institute of Hydrometeorology and
Seismology of Montenegro

9
NETHERLAND
ANTONELLO SQUINTU
KNMI - The Royal Netherlands
Meteorological Institute
NORWAY
ELIN LUNDSTAD
Norwegian Meteorological Institute
HERDIS M. GJELTEN
Norwegian Meteorological Institute
OLE EINAR TVEITO
Norwegian Meteorological Institute
POLAND
AGNIESZKA WYPYCH
Jagiellonian University & Institute of
Meteorology and Water Management –
National Research Institute
ZBIGNIEW USTRNUL
Institute of Meteorology and Water
Management – National Research Institute
SERBIA
PREDRAG PETROVIĆ
Republic Hydrometeorological Service of
Serbia
SLOVAKIA
KATARÍNA MIKULOVÁ
Slovak Hydrometeorological Institute
PETER KAJABA
Slovak Hydrometeorological Institute
SPAIN
CELIA SALINAS-SOLE
Department of Geography, University of
Zaragoza
ENRIC AGUILAR
Center for Climate Change, C3, Universitat
Rovira i Virgili, Tarragona
JIMÉNEZ CASTANEDA AZUCENA
University of Zaragoza
JOSÉ A. GUIJARRO
AEMET (Spanish State Meteorological
Agency)
PÉTER DOMONKOS
SWITZERLAND
CHRISTOPH FREI
Federal Office of Meteorology and
Climatology MeteoSwiss
FRANCESCO ISOTTA
Federal Office of Meteorology and
Climatology MeteoSwiss
RETO STÖCKLI
MeteoSwiss
UNITED KINGDOM
KAY SHELTON
JBA Consulting
WMO
PEER HECHLER
10
LIST OF PRESENTATIONS
Aguilar, E., Asín, J., Azorín, C., Gilabert, A., Guijarro, J. A., López-Díaz, J. A., Prohom, M.,
Rasilla, D., Solé, G.: Evaluation of the Impact over temperature series of the transitions between
observation systems (IMPACTRON)
Angulo, D. P., Celia, S. S., Rodrigues, M., Azucena, J. C., Brunetti, M., González-Hidalgo, J. C.:
Comparison of different interpolation methods for the generation of a climatology with
maximum and minimum monthly temperatures
Bertrand, C., Journée, M.: Data QC within the Belgian synoptic and climatological networks: an
overview
Bihari, Z., Szentimrey, T., Kircsi, A.: Some details about the theoretical background of CarpatClim
– DanubeClim gridded databases and their practical consequences
Chimani, B., Ganekind, M.: Differences in Climate Evolution Analyses depending on the choice o
by homogenization method and time span
Delvaux, C.: Quality Control and Homogenization of the Belgian Historical Weather Data
Dobi, I.: Comparison of monthly satellite, modelled and in situ surface radiation data over Hungary
Domonkos, P.: Time series homogenisation with optimal segmentation and ANOVA correction:
past, present and future
Frei, C., Isotta, F.: Uncertainty in the interpolation of daily precipitation – Insights from an
ensemble analysis for the Alps
Motrøen Gjelten, H., Lundstad, E., Tveito, O. E.: Homogeneity testing of seasonal precipitation
series in Norway
Graw, K., Schröder, M., Andersson, A., Kinzel, J., Fennig, K., Hollmann, R.: Stability of satellite
based climate data records (CDRs) retrieved by CM SAF
Guijarro, J. A., Lopez, J. A., Aguilar, E., Domonkos, P., Venema, V.K.C., Sigró, J., Brunet, M.:
Comparison of homogenization packages applied to monthly series of temperature and
precipitation: the MULTITEST project
Guijarro, J.A., Cuxart, J., Simó, G., Martínez-Villagrasa, D., López, A., Picos, R., Martí, B.,
Jiménez, M.A., Gilabert A., Aguilar, E.: Small scale surface heterogeneities and impact on
station relocations
Hannak, L.: Analysis of the impacts of the automatization of measurement systems using parallel
measurements from German Climate Reference Stations
Hechler, P., Baddour, O.: Underpinning Climate Services

11
Höpp, S., Rauthe, M., Deutschländer, T., Krähenmann, S., Hänsel S.: Developing a gridded data
set of global radiation covering Germany and its neighbouring river catchment areas
Isotta, F., Begert, M., Frei, C.: Temperature and precipitation grid datasets for climate monitoring
based on homogeneous time series in Switzerland
Kveton, V: Experiences with snow level estimation for spatial analyse of new snow depth based
on precipitation data
Lakatos, M., Szentimrey, T., Izsák, B., Hoffmann, L.: Comparison of E-OBS and CARPATCLIM
gridded datasets of minimum temperatures, maximum temperatures and precipitation by
Analysis of Variance (ANOVA)
Lundstad, E., Stepanek, P., Zahradníček, P.: Long-term homogenised precipitation data sets for
Norway
Lussana, C., Tveito, O. E.: Nordic gridded climate data set, status and plans
Van Malderen, R., Pottiaux, E., Klos, A., Bock, O., Bogusz, J., Chimani, B., Elias, M.,
Gruszczynska, M., Guijarro, J. A., Zengin Kazancı, S., Ning, T.: The homogenization of GPS
Integrated Water Vapour time series: methodology and benchmarking the algorithms on
synthetic datasets
Mamara, A., Anadranistakis, M., Argiriou. A. A.: Homogenization and gridding of the Greek time
series
Mateus, C., Potito, A., Curley, M.: Digitisation and homogenisation of the long term daily
(max/min) summer and winter air temperature records in Ireland
Michel A, P.: A machine learning perspective towards fully automated quality control in daily
weather time series
Petrović, P.: Comparison of Gridded and Observed Temperature and Precipitation Episode Series:
A Case Study
Rasol, D.: Modernisation of Croatian Meteorological Measurements Network
Rehfeldt, K., Kolbe, C., Ziese, M., Rustemeier, E., Krähenmann, S., Becker, A.: Comparison of
Three Interpolation Schemes for Six Parameters
Rustemeier, E., Kapala, A., Meyer-Christoffer, A., Finger, P., Schneider, U., Venema, V., Ziese,
M., Simmer, C., Becker, A.: HOMPRA Europe - A gridded precipitation data set from European
homogenized time series
Schröder, M., Lockhoff, M., Shi, L., Graw, K.: The GEWEX water vapor assessment (G-VAP) –
results from inter-comparisons and stability analysis
12
Shelton, K., Warren, S., Davis, R., Faulkner, D.: Homogenisation of daily station data in England
and Wales
Squintu, A.: Homogenization of ECA&D temperature series
Szentimrey, T.: Introduction on homogenization, quality control, spatial interpolation, gridding
Szentimrey, T.: Some theoretical questions and development of MASH for homogenization of
standard deviation
Szentimrey, T.: New developments of interpolation method MISH: modelling of interpolation error
RMSE, automated real time Quality Control
Tveito, O. E, Lussana, C.: Ensemble approaches to assess uncertainties in observation gridding
Venema, V., Lindau, R.: Global temperature trend biases and statistical homogenization methods
Venema, V., Trewin, B., Wang, X., Szentimrey, T., Aguilar, E., Brunet, M., Likeba Louamba, W.
S. R., Rasul, G., Oria, C., Menne, M., Guijarro, J. A.: New WMO Guidance on homogenisation
Vint, K., Keevallik, S., Meitern, H.: Inhomogenieties in Estonian air temperature series with
CLIMATOL and HOMER
Yosef, Y., Aguilar, E., Alpert, P.: Comparison of different daily adjustment methods for the
maximum and minimum temperature in Israel
Zahradníček, P., Štěpánek, P.: Homogenization of the wind speed time series in Czech Republic
LIST OF POSTERS
Fioravanti, G.: A national dataset of temperature and precipitation daily series for Italy
Guijarro, J. A.: Daily series homogenization and gridding with Climatol v. 3
Kajaba, P., Bochníček, O., Mikulová, K.: Climate Atlas of Slovakia
Josipa K., Lasta, S.: Overview of Parallel Meteorological Measurements in Croatia
Venema, V., Auchmann, R., Aguilar, E., Auer, I., Azorin-Molina, C., Brandsma, T., Brunetti, M.,
Delitala, A., Dienst, M., Domonkos, P., Erell, E., Gilabert, A., Lin, X., Lindén, J., Lundstad, E.,
Milewska, E., Nordli, O, Prohom, M., Rennie, J., Petr, S., Trewin, B., Vincent, L., Willett, K.,
Wolff, M: A global database with parallel measurements to study non-climatic changes
Weissenberger, A., Rasol, D., Andreis, H. L.: Temperature series quality analysis based on the
number of corrected values

13
ABSTRACTS

14
Evaluation of the Impact over temperature series of the transitions between
observation systems (IMPACTRON)
Enric Aguilar1, Jesús Asín2, César Azorín3, Alba Gilabert1, José Antonio Guijarro4, José
Antonio López-Díaz5, Marc Prohom6, Domingo Rasilla7 and Germán Solé8 1Center for Climate Change, C3, Univ. Rovira i Virgili, Tarragona, Spain
2University of Zaragoza, Spain 3University of Gottemburg, Sweden 4AEMET, Palma de Mallorca, Spain
5AEMET; Madrid, Spain 6Servei Meteorològic de Catalunya, Barcelona, Spain
7Universidad de Cantabria, Santander, Spain 8Observatori de l’Ebre, Roquetes, Spain
In the framework of the network IMPACTRON (CGL2015-70192-REDT), funded by the Spanish
government, a group of Spanish scientists is working on understanding the impact of the transitions
in air temperature series.
We define a transition as a change between observing systems involving a large part of an
observation network, and having an impact over the derived time series, which is difficult to adjust
with relative homogenization approaches. IMPACTRON has identified three transitions affecting
the Spanish climate records: (i) the transition from open stands to Stevenson screens (which
occurred between the last decade of the XIX century and 1920); (ii) the transition from the city
centers to aviation fields or airports, clustered in two periods, 1940s and 1970s; and (ii) the
replacement of manual observatories by AWSs, initiated in the late 1980s and still ongoing. The
network has been working in documenting those transitions and locating parallel measurements
during the last year.
In this contribution, we present and describe the biases introduced by the selected transitions, based
on the set of statistics recommended by the Parallel Observations Scientific Team (POST, ISTI),
and discuss the result of the application of different approaches to adjust daily maximum and
minimum air temperature series.
15
Some details about the theoretical background of CarpatClim – DanubeClim
gridded databases and their practical consequences
Zita Bihari, Tamás Szentimrey, Andrea Kircsi
Hungarian Meteorological Service
A daily gridded database was established for the Carpathian Region and later for some additional
areas in the Danube catchment area (1961-2010, 0.1° spatial resolution, 16 variables). Considering
the strict data policy of participating countries, the homogenization – gridding procedures were
executed on national level, but applying the same MASH (Multiple Analysis of Series for
Homogenization; Szentimrey) and MISH (Meteorological Interpolation based on Surface
Homogenized Data Bases; Szentimrey and Bihari) methods and with near border data exchange.
Finally the national grids were merged in one common grid.
The essential results of the calculations are the gridded data series but in addition the applied MISH
method has other benefits derived from the theoretical structure of the algorithm. MISH consists
of two parts: the modelling and the gridding subsystems. The modelling part based on the
spatiotemporal data determines the necessary statistical parameters (spatial trend, covariance
structure) for the interpolation, gridding procedure, resulting some parameter files. One of the main
advantages of MISH is that this modelling process has to be done only once. It means in the practice
that an extension of the CarpatClim – DanubeClim data series either in time or for other grid
resolution can be realised easily because the statistical parameters are already calculated.
16
Comparison of different interpolation methods for the generation of a
climatology with maximum and minimum monthly temperatures
Dhais Peña-Angulo1-2, Celia Salinas Solé1-2, Marcos Rodrigues1-2, Azucena Jiménez
Castalleda1, Michele Brunetti3, José Carlos González-Hidalgo1-2
1Department of Geography, Zaragoza University, Zaragoza, Spain 2Institute University of Research in Sciences Environmental (IUCA), University of
Zaragoza, Zaragoza, Spain 3Institute of Atmospheric Sciences and Climate (ISAC-CNR), Bologna, Italy
This study presents a new climatology of high spatial resolution for average monthly maximum
and minimum temperatures in mainland Spain. This new climatology has been generated using
information from archieves of the Spanish State Meteorological Agency (AEMet), after carrying
out a quality control and reconstruction process with the original data.
In order to obtain a high spatial resolution grid, different interpolation methods are compared. From
this comparison it is observed that the Local Weithing Lineal Regression (LWLR) is the most
optimal solution (Brunetti et al. 2014). The LWLR uses a local interpolation considering
geographic variables (altitude, orientation, latitude, longitude, slope and distance to the coast), and
it estimates temperatures based on a linear regression model. Compared to other tested methods
(namely the Regression Kriging and the Regression Kriging with stepwise methods), LWLR
provides the best results when applying a crossvalidation procedure both in terms of the obtained
spatial variability (with different altitudes) and temporal variability (along all months).
The final results are presented with a monthly high-resolution cartography (~1 Km latitude) of the
averages of maximum and minimum temperatures. The results generated are expected to provide
a valuable resource to other research fields.
17
DATA QC WITHIN THE BELGIAN SYNOPTIC AND CLIMATOLOGICAL
NETWORKS: AN OVERVIEW
Cédric Bertrand and Michel Journée
Royal Meteorological Institute of Belgium
The presentation will provide an overview of the ground surface networks managed by the Royal
Meteorological Institute of Belgium (RMI) and the quality control (QC) processes
implemented at the various stages.
No measuring technique is perfect and errors can occur in meteorological observations for a wide
variety of reasons, the most common being instrument faults, observer errors, errors in data
transmission and clerical error in data processing. A distinction is drawn here between short term
issues which affect observations over a finite period (most commonly a single observation, but
sometimes persisting over several days or weeks) and longer term influences
on a climate record (inhomogeneities) which are not considered here.
From a previously purely manual and time-consuming QC system, the QC procedures are being
automated and additional information such as derived from meteorological radars or satellite
imageries are progressively integrated in the system. The purpose of this automated data screening
is to objectively identify abnormal data values for subsequent review by an experienced data
analyst. The review is necessary to determine whether an anomaly results from a problem with
instrumentation or whether it accurately reflects unusual meteorological conditions.
Differences in Climate Evolution Analyses depending on the choice o by
homogenization method and time span
Barbara Chimani, Manfred Ganekind
Zentralanstalt für Meteorologie und Geodynamik (ZAMG)
HISTALP is a database for longterm homogenized climate data in the Alpine region. It consists
of about 200 stations and several parameters. The data are used in numerous scientific
publications concerning climate and climate change. The dataset was first published in 2007. Due
to improvements of the homogenisation methods and the meanwhile available additional most
recent years of data included into the HISTALP-Dataset, a new homogenization run was done.
The presentation will provide some basic information on HISTALP, compare the two
homogenization methods (HOCLIS and HOMER) and show some analyses of the
homogenization results. A first comparison of the two resulting datasets and resulting differences
in the climate evolution will be shown.
18
Quality Control and Homogenization of the Belgian Historical Weather Data
Charles Delvaux
Royal Meteorological Institute of Belgium
Thanks to a recent digitization project (data from 1880 to 1950), time series of daily temperature
and precipitation data are now available since 1880 for a number of climatological stations in
Belgium. Before analysing the climate change, two steps are necessary to have reliable data : the
data quality control and the data homogenization.
For the data digitization (1880-1950), classical quality control procedures were not suitable
because of the overall low data quality, the low data density, the uncommon errors and the lack of
metadata. Specific test procedures have been developed to identify the typical and the most
frequent errors of the digitization which can be of a wide variety. When it was possible, the
mistakes in data digitization were corrected. This work allowed to create corrected and consistent
'long series' from 1880 to nowadays with a reasonable level of quality. In addition of that project,
'short series' have been created from 1950 to nowadays. For the long and the short series, standard
quality control procedures have been applied in order to provide a quality index (validated,
suspicious or corrected) to each daily data of precipitation and temperature.
The homogenization of the series is then carried out to remove the non-climatic factors affecting
the meteorological records. To do this, the HOMER software is used. The process is ongoing for
the temperature data (short series and long series) and will be soon started for precipitation.
19
Comparison of monthly satellite, modelled and in situ surface radiation data
over Hungary
Ildikó Dobi
Hungarian Meteorological Service
Knowledge of accurate surface incoming solar radiation is important for both climate studies and
solar power applications. Three kind of radiation data sets are available for Hungary: satellite data
from EUMETSAT Climate SAF, modelled data from CarpatClim project, and in situ surface
observations. The aim of this paper to compare this parallel sets of data and to determine their
accuracy.
Satellite retrievals give high resolution data in space and time. The longest radiation data set
dedicated for solar application for Europe is the Surface Solar Radiation Data Set - Heliosat
(SARAH) developed by EUMETSAT Climate SAF. This includes a satellite-based climatology of
the solar Surface Incoming Shortwave radiation (SIS) from 1983 to 2013 with a spatial resolution
of 0.05° x 0.05°.
The other source is the outcomes of the CarpatClim Project (http://www.carpatclim-eu.org/) which
produced uniformly harmonized and interpolated gridded climate data set for the whole Basin.
Carrying out the project was based on the data homogenization method MASH (Multiple Analysis
of Series for Homogenization,) and the interpolating method MISH (Meteorological Interpolation
based on Surface Homogenized Data Basis). Monthly meteorological data are available in 0.1°
spatial resolution from 1961 to 2010. The monthly global radiation characterizing the incoming
solar energy is one of the 53 parameters. In absence of long-range surface global radiation data, it
was used sunshine duration calculated by Ångström and Prescott methods.
Remote sensed and modelled data sets are validated with set of eight surface measurements (OBS)
from the network of Hungarian Meteorological Service. Comparisons were made by pairs of data
sets between 2001 and 2010. The Mean Absolute Difference between parallel data set are between
5.5 and 5.5 W/m2, anomaly corrections are above 0.9 in all cases.

20
Time series homogenisation with optimal segmentation and ANOVA
correction: past, present and future
Peter Domonkos
Spain
A bit more than 40 years ago, US statistician Douglas M. Hawkins found out the dynamic
programming algorithm for the fast identification of the optimal segmentation among all possible
segmentations of a time series. That was an important step towards the feasible and mathematically
correct solution of multiple change point problem.
Nowadays two homogenisation methods are based on this technique: one is the COST ES0601
(HOME) recommended interactive method, HOMER, and the other is the fully automatic
ACMANT, which also received good critics during HOME and later.
In the presentation we recall the past development of this methodology, analyse the still existing
related problems with higher focus on ACMANT, as its creator is the same as the author of the
presentation.
In 2016 the third generation of ACMANT software package “ACMANT3” was published. Its
improvement relative to earlier versions will be briefly discussed along with some ideas of possible
future developments.
21
A national dataset of temperature and precipitation daily series for Italy
Guido Fioravanti, Emanuela Piervitali, Franco Desiato
ISPRA, Institute for Environmental Protection and Research – ITALY
We report on the development of a new dataset of daily observations of temperature (maximum
and minimum) and precipitation for Italy. The purpose is to provide final users a databank of daily
series and derived products with consistent format, checked through standardized quality control
routines. The data were retrieved from several sources, ranging from the national synoptic network
to the regional meteorological, agrometeorological and hydrographic networks. The HIS Central
hydrological catalogue is the main source of the historical data series, previously available only in
hard copy.
The daily data were quality checked with absolute (basic integrity checks, outlier tests, internal and
temporal consistency checks) and relative (spatial) controls. The routines were written in R and
implement the quality procedures described by Durre et al. (2010) for the Global Historical
Climatology Network (GHCN)-Daily dataset. In order to avoid data degradation, the quality
algorithms were carefully tested and the test thresholds properly tuned. As most of the data sources
underwent quality controls at the home institutions, a low percentage of erroneous value was
detected. Nonetheless, these controls allowed to identify systematic errors (e.g, switch of tmax and
tmin series), bad coded missing observations, sequences of repeated values and so on. The spatial
controls (regression and corroboration tests) for temperature series were particularly effective in
identifying anomalous values not detected by the absolute methods. Because of the its high spatial
variability, automated spatial controls were not applied to precipitation series.
The homogeneity of temperature and precipitation series was firstly assessed using the method
proposed by Wijngaard et al. (2003), based on four absolute tests: the Standard Normal
Homogeneity test, the Buishand Range test, the Pettitt test and the Von Neumann ratio test. This
step was useful to identify obvious inhomogeneities, especially in areas with low density of
stations. As absolute methods can worsen the series, no adjustment attempt was made.
The homogenization of monthly and daily data is still a work in process. At this purpose we are
testing two methods based on the recommendations of the HOME Cost Action (Venema et al.,
2012): HOMER (HOMogenization softwarE in R, Mestre et al., 2013) and SPLIDHOM Mestre et
al., 2011).
Part of the daily dataset is already available through the national system of climate data SCIA
(www.scia.isprambiente.it). As an example of its application, the set of “useful” series identified
through the Wijngaard's approach has been used to produce WMO-standard precipitation normals,
recently included into the WMO RCC RA VI national products. Finally, the SCIA daily dataset
represents a relevant source for the calculation of WMO-CCl indices of temperature and
precipitation extremes for Italy.
22
Uncertainty in the interpolation of daily precipitation – Insights from an
ensemble analysis for the Alps
Christoph Frei and Francesco Isotta Federal Office of Meteorology and Climatology MeteoSwiss, Zürich, Switzerland
With increasing spatial and temporal resolution, gridded climate datasets must be expected to
become in a degree erroneous (uncertain) that may be relevant in practical applications.
Proficient use of such datasets, therefore, calls for quantitative information about uncertainties.
The traditional method for uncertainty estimation, cross-validation, is of limited value. It delivers
summary statistics that may, or may not be representative for a concrete use case. Moreover, it is
valid strictly at the point scale, whereas the datasets are commonly interpreted at a larger support
(e.g. the average over a gridbox).
In this study, we propose a probabilistic spatial analysis of daily precipitation that delivers an
ensemble of equally probable realizations, capable of describing uncertainties explicitly on a day-
by-day basis, in relation to local rain-gauge density, and as a function of the spatial support
(averaging scale). The method was developed within project UERRA (FP7, Uncertainties in
Ensembles of Regional ReAnalyses) and is applied, with data from several thousand rain gauges,
in the entire Alpine region. Our presentation shall introduce the ensemble technique, illustrate its
application, test its reliability, and discuss some findings from our application.
The results point to remarkable variations in the uncertainty of precipitation analyses. It is larger
for convective compared to stratiform conditions, not merely as a seasonal pattern, but clearly
between individual days. There are cases when the ensemble spread for a 20x20 km2 area mean
precipitation is more than a factor of 5 even for intense precipitation (> 10 mm per day). In other
cases, at a similar intensity, the uncertainty is smaller than a factor of 1.5. Generally, the spread
of our probabilistic ensemble is found to be considerably larger than that of a “multi-model”
ensemble using different deterministic interpolation methods, suggesting that comparison of
methods alone bares little information on true uncertainty. One key advantage of a probabilistic
analysis is that users can trace uncertainties through their applications. We will illustrate this by
deriving uncertainty measures for classical climate indices and at various space scales.
Obviously, this offers much more robust observational information for the evaluation of climate
models than is available from deterministic datasets.

23
Homogeneity testing of seasonal precipitation series in Norway
Herdis Motrøen Gjelten, Elin Lundstad & Ole Einar Tveito
Norwegian Meteorological Institute
Long-term high quality time series are crucial in climate analyses. However, long-term series are
often inhomogeneous, that is, containing artificial shifts and trends due to changes in
instrumentation, observation practices or environment. To account and adjust for such shifts,
homogenization procedures have been developed.
At the Norwegian Meteorological Institute a homogeneity analysis of precipitations series of length
> 80 years from about 250 stations has started. The series are tested on a seasonal basis using
primarily the software MASH, but other softwares such as HOMER will also be used for
comparison.
A previous homogeneity analysis of 165 precipitation series was performed in the early 1990s, then
using the SNHT-method. There have been many changes in the station network since then. In
particular many automatic weather stations have been introduced and replaced old manual stations
in the network. There has also been a development in homogenization methods since then. It is
therefore important to perform a new analysis.
24
Stability of satellite based climate data records (CDRs) retrieved by CM SAF
Kathrin Graw1, Marc Schröder1, Axel Andersson2, Julian Kinzel1, Karsten Fennig1, Rainer
Hollmann1 1Deutscher Wetterdienst, Offenbach, Germany 2Deutscher Wetterdienst, Hamburg, Germany
Reliable and high-quality long term climate data records (CDRs) are of fundamental importance
for the analysis of climate variability and change. To enhance the availability of high-quality long
term climate data sets the EUMETSAT Satellite Application Facility on Climate Monitoring (CM
SAF) provides satellite-derived geophysical parameter data records of currently nearly 30 years
suitable for climate monitoring. Parameters based on remote sensing offer global scale and
continuous coverage.
To analyze climate variability and change the measured satellite data need to be homogeneous over
several decades and should not contain artificial heterogeneities masking natural trends. Abruptly
appearing mean value instationarities or sudden variance changes can occur for example due to
instrument changes or due to changes in orbit characteristics.
The recent fundamental climate data record (FCDR) provided by CM SAF and available at
http://www.cmsaf.eu/EN/Products/DOI/Doi_node.html among other CDRs contains carefully
inter-calibrated brightness temperatures (TBs) from the instruments SMMR, SSM/I and SSMIS
aboard various satellites of the Defense Meteorological Satellite Program (DMSP). This FCDR
facilitates the derivation of essential climate variables (ECVs) eligible for the analysis of climate
variability in a homogeneous way.
This presentation will demonstrate the long-term temporal stability of CM SAF CDRs and the
method used to derive the decadal stability of monthly mean gridded parameters derived over the
global ice free ocean. In addition the spatial differences to independent and partly independent
reference data sets will be presented. The results highlight the need for reliable and high quality
global reference data.

25
Comparison of homogenization packages applied to monthly series
of temperature and precipitation: the MULTITEST project
J.A. Guijarro1, J.A. López1, E. Aguilar2, P. Domonkos, V.K.C. Venema3, J. Sigró2 and M.
Brunet2 1State Meteorological Agency, Spain
2Universitat Rovira i Virgili, Spain 3Meteorological Institute, University of Bonn, Germany
The MULTITEST project, funded by the Spanish Ministry of Economy and Competitiveness, aims
at comparing the results of several publicly available homogenization packages for monthly
synthetic series of temperature and precipitation. This intercomparison exercise is launched to
update the successful COST Action ES0601 (HOME), since many methods have improved their
algorithms after the Action’s conclusion. However, in order to base the comparisons on a high
number of tests, only computer packages that can be run automatically have been tested.
The synthetic databases consists of three master temperature networks of 100 series containing 720
values (equivalent to 60 years of data). They are built with different degrees of cross-correlations
between them in order to simulate a range of station densities or climatic spatial variabilities. Also
three other similar master networks were developed with precipitation values, this time simulating
the characteristics of three different climates: Atlantic temperate, Mediterranean and monsoonal.
From each of these six master series, 100 samples of 10 series each were extracted. After inserting
inhomogeneities the homogenization programs were applied to them. Their resulting homogenized
series were compared with the original homogeneous series by computing Root Mean Squared
Errors and trend biases. The tested computer packages were: ACMANT 3.0, Climatol 3.0, MASH
3.03, RHTestV4, USHCN v52d and HOMER 2.6.
In a first stage, inhomogeneities were applied to the synthetic homogeneous series. We used five
different settings with increasing difficulty and realism:
i) big shifts in half of the series;
ii) the same with a strong seasonality;
iii) short term platforms and local trends;
iv) random number of shifts with random size and location in all series; and
v) the same plus seasonality of random amplitude.
The shifts were additive for temperature and multiplicative for precipitation.
A second round was done with increasing number of series in each sample (20, 40 and 80), to check
the influence of varying network sizes. More tests will be performed with seasonalities other than
sinusoidal, and with simultaneous shifts in a high proportion of series. Finally, tests will be
performed on a longer and more realistic benchmark, with varying number of missing data along
time, similar to that used in the COST Action ES0601.
Although some of the packages were tested with different settings, not all their capabilities could
be tested. These benchmarking experiments are therefore mostly intended to test the performance
26
of the programs in their default configurations and better results may be obtained with a careful
tuning of the settings for every problem network. These intercomparisons will be valuable not only
for users, but also to the developers of the tested packages, who can see how their algorithms
behave under varied climate conditions.
Small scale surface heterogeneities and impact on station relocations
J.A. Guijarro1, J. Cuxart2, G. Simó2, D. Martínez-Villagrasa2, A. López2, R. Picos2,
B. Martí2, M.A. Jiménez2, A. Gilabert3 and E. Aguilar3 1State Meteorological Agency, Spain
2University of the Balearic Islands, Physics, Palma de Mallorca, Spain 3Universitat Rovira i Virgili, Tarragona, Spain
The department of physics of the University of the Balearic Islands is leading the project
ATMOUNT, aiming at studying the influence of topography on atmospheric and surface variables,
but these also present some variability on relatively flat terrain due to the heterogeneity of the
surface. In order to assess this surface variability, an observing site is maintained at the Campus
consisting in a standard automatic weather station (AWS) plus other micro-meteorological
instrumentation, and nine secondary sites observing air temperature at 1 and 2 m heigth and at a
mean distance of 200 m between them. This observing network is complemented with another
AWS operated by the Spanish Meteorological Agency which is located at a similar distance.
Although the simultaneous records of this high density experimental network covers 42 days only
days (from June 16 to July 26 of 2016), this period is characterized by a high solar radiation and
low to moderate wind, and therefore provide a unique set of data to study the spatial climatic
heterogeneity in a Mediterranean site. Absolute daily temperature differences between the sites
range between 0.02 and 1.57 °C with an average of 0.53 °C for maximum temperature and from
0.03 to 3.61 °C with an average of 1.35 °C for the minimum.
The differences do not show a dependence on the distances between sites. Dependences on daily
temperature range (DTR), mean relative humidity (RH) and daily wind run (WR) have also been
checked, with significant results only for the minimum temperatures on DTR and RH.
These differences between sites located at such short distances illustrate the changes expected in
summer in the case of small scale relocations, which many times would be thought to have a
negligible effect on the temperature series. Therefore, the need to document any changes in the
observing conditions and locations of the stations will never be stressed enough.
The impact of transitions between different thermometric screens and between conventional and
automatic observations on the temperature series in Spain is the object of study of the research net
IMPACTRON, leaded by the University of Tarragona, and the assessment of these small scale
variability will serve to quantify the uncertainty in the attribution of the temperature differences
caused by those transitions when the parallel measurements have not been taken in exactly the
27
same location.
Daily series homogenization and gridding with Climatol v. 3
José A. Guijarro
State Meteorological Agency, Spain
POSTER
The need to homogenize observational series before its use to assess climate variability emerged
long time ago. Efforts were initially focused on annual, seasonal and monthly series, and the
successful COST Action ES0601 allowed the exchange of ideas between homogenization
specialists and the improvement of the their methodologies. But now the stress is put on the
homogenization of daily series, since the study of the variability of indexes and extreme values
depends on them. The new version 3 of the R Climatol package (Guijarro, 2016) provides functions
to facilitate the homogenization of climatological variables at any temporal scale, as long as the
data in the series may be considered synchronous (which is doubtful in the case of sub-daily data).
A further improvement incorporated in this version has consisted in enabling the use of the break
points detected at the monthly scale to split the daily series into their homogeneous sub-periods,
which are then reconstructed by means of a missing data attribution algorithm, thus avoiding the
problems previously encountered when trying to interpolate monthly corrections into daily series
of variables with a strong bias in their frequency probability distribution. More over, the missing
data estimation is based on the Reduced Major Axis (RMA) regression model, which when both
the dependent (y) and independent (x) variables are standardized can be expressed as ŷ=x, and
therefore do not experiment the reduction of the dependent variable variance that happens in the
Ordinary Least Squares regression ŷ=r·x when the correlation coefficient (r) is significantly lower
than 1. Another important advantage of the RMA regression is that it can be applied even when
there are no common observation period between the stations, therefore allowing the use of short
nearby series.
Another novelty of this version is a function that allows the automatic generation of grids from the
homogenized series, which are saved in NetCDF format, also in normalized form. Grids of means
and standard deviations are also produced that can be used to unstandardize the daily or monthly
grids, but the suggested procedure for this is to generate better rasters of means and standard
deviations through geostatistic procedures, introducing the effects of orography and other
geographical features that modify the spatial distribution of climatic variables.
28
Analysis of the impacts of the automatization of measurement systems using
parallel measurements from German Climate Reference Stations
Lisa Hannak
Deutscher Wetterdienst
Meteorological parameters were measured systematically since a long time. During this time,
measurement systems were changed for example from manual observations to automatic
measurements. Changing the measurement system can potentially affect the homogeneity of time
series. To study the effects of the automatization of measurements, the German Meteorological
Service (Deutscher Wetterdienst) operates parallel measurements at Climate Reference Stations
since 2008. Observed meteorological parameters are air temperature, extreme temperatures, soil
temperature, air pressure, relative humidity, sunshine duration, and precipitation. This presentation
shows first results of the statistical analysis of the differences between the measurement systems
and their effects on the homogeneity of time series.
Underpinning Climate Services
Peer Hechler, Omar Baddour
World Meteorological Organization, WMO
The provision of climate services is among the key priorities of WMO and partners. Building
capacities for efficient climate service generation requires basic capabilities in collecting and
processing climate related data and information. WMO’s Commission for Climatology coordinates
and assists in a multitude of activities to underpin climate services including data rescue, Climate
Data Management Systems (CDMS), climate data management practice, definition and generation
of climate (extremes) indices, homogenisation practices, use of remote sensing data for climate
monitoring etc. The talk will provide examples of recent achievements as well as work in progress,
such as guidelines, tool developments and project implementation. Keywords of the talk include
the International Data Rescue portal I-DARE, WMO CDMS specifications, Climate Services
Information System (CSIS), definition of extremes, national climate monitoring products,
homogenisation, centennial observing stations etc. Most of the above activities need, generate,
support or relate to homogeneous time series and interpolated data fields.
29
Developing a gridded data set of global radiation covering Germany and its
neighbouring river catchment areas
S. A. Höpp*, M. Rauthe, T. Deutschländer, S. Krähenmann, S. Hänsel
Deutscher Wetterdienst, Offenbach, Germany
Due to the increasing impact of climate change and related extreme events an enhanced resilience
of transport infrastructure and operating traffic in Germany is required. The adaptation to the
increasing impacts of climate change like for instance landslides, wind throw or floods is
formalized in the German Strategy for Adaptation to Climate Change (DAS). To counter these
negative impacts, the Federal Ministry of Transport and Digital Infrastructure (BMVI) founded a
comprehensive national research program on safe and sustainable transport in Germany
(www.bmvi-expertennetzwerk.de). Several participating research institutes and agencies operate
as a network between science and practice, with the goal of providing effective knowledge transfer
and advice for decision makers in government and industry.
One topic of this project is the “Adaptation of the German transport infrastructure towards climate
change and extreme events”. The examinations are performed by using data of regional climate
models (RCM) as well as impact model scenarios to develop suitable adaptation strategies. To
adjust biases of RCM data and quantify the impact of climate change a well defined climatological
reference is needed. Thus the GermanMeteorological Service provides gridded reference data sets
from station data relevant for hydrological applications in high spatial (5 km) and temporal (daily)
resolution from 1951 to 2010. For this, the HYRAS data (hydro meteorological gridded data set),
developed by the German Meteorological Service within the research program KLIWAS
(www.kliwas.de) and already available for precipitation, mean temperature and relative humidity,
will be revised and extended by additional parameters like global radiation, minimum and
maximum temperature.
The presentation will consist of two parts to demonstrate the current status of the gridded reference
data in the project: Part one will show a short outline of the existing HYRAS data set and its
gridding methods. Part two will give an overview of the database of global radiation, the method
to enhancethe spatial station distribution with sunshine duration data (Ångström relationship) and
the basic approach of the gridding method ofglobal radiation.
*Simona Andrea Höpp, Deutscher Wetterdienst, Abteilung Hydrometeorologie, Frankfurter Str.
135, D-63067 Offenbach am Main, Germany, E-Mail: [email protected]

30
Temperature and precipitation grid datasets for climate monitoring based on
homogeneous time series in Switzerland
Francesco Isotta, Michael Begert and Christoph Frei
Federal Office of Meteorology and Climatology MeteoSwiss, Zurich, Switzerland
The lack of long-term climate consistency is a frequent caveat of currently available grid datasets.
Changes in the density of station networks over time, together with inhomogeneities in the
underlying station series jeopardize their utility for climate monitoring and the analysis of long-
term trends.
In this study we present a methodology to derive a monthly grid dataset for Switzerland, dating
back as far as 1864, and targeted for applications with a need in long-term consistency. To this end,
data is incorporated from a non-varying station network that includes only series that have been
carefully examined and corrected for inhomogeneities and extend over the whole time period. The
restrictive selection results in a very coarse station density (average spacing 40-80 km). To recover
spatial patterns not explicitly resolved by the stations, we combine the measurements with
statistical information from a high-resolution temperature/precipitation analysis over a limited
recent period and from a much denser station network. For this purpose, RSOI (reduced space
optimal interpolation) is adopted, a combination of Principal Component Analysis and Optimum
Interpolation.
We demonstrate – for the mountainous region of Switzerland – that the technique can remedy
artifacts common to interpolation with variable station densities and that it is capable to reproduce
more spatial detail than simple interpolation from the coarse high-quality stations only. We also
investigate to what extent spatial variations in long-term temperature trends can actually be
reproduced by gridding. This is a critical test for assessing the utility of long-term grid datasets for
trend analysis.
31
Overview of Parallel Meteorological Measurements in Croatia Josipa Kuzmić, Lasta Slaviček
Meteorological and Hydrological Service, Croatia
POSTER
Meteorological stations network of the Meteorological and Hydrological Service of Croatia
(DHMZ) consists of automatic weather stations (AWS) and conventional stations. Most of them
are situated at the same location, but as in many other places and countries, some AWS are the only
source of surface observations at the sites which are inhospitable or difficult to access. Also, for
manned stations, AWS provide data outside the crew's working hours as well as measuring and
reporting with higher frequency. This is why it is important to have both conventional and
automatic measurements at a location. In Croatia, there is a large number of stations with more
than 5 years of parallel measurements of air temperature, relative humidity, wind and precipitation.
These parallel measurements will enable us to compare data and eliminate non-climatic factors.
In our stations network, AWS report the objective elements of air and soil temperature, relative
humidity, wind (speed and direction), pressure, global and diffuse irradiance, sunshine duration,
UVB radiation, precipitation, etc. Data measured at these stations are stored as 10-minute records
in internal memory at the location. These records are switched through the GPRS or GSM
connections to the pooling computer at the MHSC headquarters, where they are used in real time
(raw data) for inputs in local area numerical model (ALADIN), and stored for quality control (to
be done at the end of each month). QC consists of logical control (contradiction of coexistence),
internal checking (consistency with previous measurements and weather situation at the time), and
spatial control.
All of these are mostly subjective methods, i.e. it is left for the individuals to decide whether some
data is acceptable or not. Spatial control is often done through comparison with nearby
conventional stations, but there isn't any form of systematic comparison.
Some basic comparison of temperature datasets from AWS and conventional stations were done
for several locations and the results are shown here.
Keywords: meteorological measurements, automatic weather stations

32
CLIMATE ATLAS OF SLOVAKIA
Peter Kajaba, Oliver Bochníček, Katarína Mikulová
Slovenský Hydrometeorologický ústav, Jeséniova 17, Bratislava,
POSTER
The Climatological service of the Slovak Hydrometeorological Institute successfully finished the
project “The development of spatial data processing technologies of climate system“. One of the
results of this project was also a new Climate Atlas of Slovakia. This Atlas is a comprehensive
cartographic work which contains 175 maps of climatological elements and characteristics and
over 200 graphs and tables as an additional source of spatial and temporal information. Graphical
information is supplemented by texts in Slovak and English.
In the Climate Atlas of Slovakia there are processed characteristics of air temperature, atmospheric
precipitation, snow cover, humidity, evaporation, sunshine, cloudiness, global radiation, air
pressure, wind, soil temperature and some of dangerous meteorological phenomena. Further
characteristics of the upper layers of the atmosphere and selected phenological characteristics in
Slovakia supplement the basic climatological parameters.
There are some variables were homogenized by the MASH v3.03 method (T.Szentimrey). This
program enables to homogenize monthly as well as daily data series and also to fulfill limited data
gaps. The measurements from 75 temperature, 500 precipitation measuring stations and next
chosen elements had to be homogenized this software, which required adequate software for an
automatic implementation of the needed steps.
The following tree meteorological elements were selected to make presentation for ilustratuion.
The air temperature was homogenized for period 1961-2010 for 75 time series. Next element was
relative humidity. The measurements for period 1961-2010 from 62 meteorological stations which
met the homogenization criteria. In the analysed period the 1981-2010 the number of 500
precipitation time series with a length of 30 years has been available from the precipitation station
network of SHMI, which were homogenized using MASH software.
In this presentation we show these results of Climate Atlas of Slovakia.

33
Experiences with snow level estimation for spatial analyse of new snow depth
based on precipitation data
Vit Kveton
Czech Hydrometeorological Institute
Department of General Climatology of the Czech Hydrometeorological Institute issues special
winter road maintenance index since 2004. Knowledge of new snow depth is essential for
computation of this index. But, new snow depth values are in CHMI’s central database available
around 10th of the next month for all stations measuring snow data. During actual month snow
values are available from limited stations (so called “INTER” stations), only. This can lead to
discrepancies between results of preliminary and final spatial analysis of daily snow depths.
Department of general climatology of CHMI realizes preliminary spatial analysis of new snow
depth based not only on measured snow data but using precipitation totals from automatic weather
stations and snow level estimation, too. This presentation shows contemporary stat of these
analyses.
34
Comparison of E-OBS and CARPATCLIM gridded datasets of minimum
temperatures, maximum temperatures and precipitation by Analysis of
Variance (ANOVA)
Mónika Lakatos, Tamás Szentimrey, Beatrix Izsák, Lilla Hoffmann
HUNGARIAN METEOROLOGICAL SERVICE
Gridded climate data derived from measurements of meteorological stations are used in climate
research, validation of global and regional climate models, in many applications in climate change
impacts assessments and derivation of different climate products. Several observational datasets
are available to provide background for climate studies and for derivation of climate information
for a specific area.
Gridded data sets derived through interpolation of station data. A high-resolution gridded data set
of daily climate data over Europe E-OBS is based on the largest available pan-European data set.
The E-OBS gridded data set was derived through interpolation of the ECA&D (European Climate
Assessment and Data) station data. One of the source of uncertainty of a gridded data is related to
the available station data and the other is the interpolation method were used for estimation of the
grid values from the underlying station network.
Beside the pan European datasets a high resolution climate dataset is available for the Carpathian
Region. The CARPATCLIM (2013) dataset consists of a 0.1° spatial resolution homogenized
(MASH, Szentimrey), harmonized and gridded (MISH, Szentimrey and Bihari) dataset on daily
scale for basic meteorological variables and several climate indicators, 37 in total, on different time
scales from 1961 to 2010. The area of CARPATCLIM partly includes the territory of the Czech
Republic, Slovakia, Poland, Ukraine, Romania, Serbia, Croatia, Austria and Hungary. 415 climate
stations and 904 precipitation stations were homogenized and interpolated to a grid covering the
Carpathian Region.
In this paper the statistical properties of the CARPATCLIM and E-OBS gridded datasets are
compared for the Carpathian Region on different time scales. In this work the seasonal, annual
average maximum temperatures, minimum temperatures and precipitation sums are examined for
the overlapping regions of E-OBS and CARPATCLIM in the period of 1961-2010. For the
comparison of these datasets we applied the general statistical methodology of Analysis of
Variance (ANOVA). This methodology can be used and developed effectively for the
characterization of the statistical properties of several spatiotemporal datasets like CARPATCLIM
and E-OBS. Station data or gridded datasets with different spatial resolution can be compared by
analysing the spatiotemporal means and variances. This methodology also has been built in the
modelling part of method MISH in order to evaluate the modelling results.

35
Nordic gridded climate data set, status and plans
Cristian Lussana and Ole Einar Tveito
Norwegian Meteorological Institute
The Norwegian Meteorological Institute has provided daily gridded observation products since
2004. Within the FP7 UERRA project the analysis domain has been extended to cover the entire
Fennoscandia and the new dataset has been named Nordic Gridded Climate Dataset (NGCD).
Currently, the two operational gridding systems at MET Norway have been applied to establish
NGCD experimental datasets for daily mean temperature and daily precipitation sums covering the
period 1981-2010 on a grid having 1x1 Km spacing. The dataset is based on input from ECA&D
and the MET Norway climate database (eklima.met.no). The NGCD main objective is to allow
evaluation and uncertainty assessment of regional reanalysis output by means of high-resolution
conventional climatological dataset in Fennoscandia.
In the future we plan to extend the data sets to cover the period 1971 to present as a part of the
planned operational C3S service C3Surf. The plans also include to extend the number of variables,
e.g. daily minimum and maximum temperatures.
Furthermore, a Long Term Nordic Gridded Climate Dataser (NGCD_Rec) will be established in
the context of C3Surf and in collaboration with MeteoSwiss, which has developed a similar dataset
for the Alps. (The rest is taken from C3surf final proposal)
The NGCD_Rec will be a gridded dataset of monthly precipitation for the Fennoscandia with a
grid spacing of 5 km and it will extend back into the first half of the 20th century, depending on
available long-term high-quality station series in the region. NGCD_Rec is designed for users with
a need in long-term time series and high standards in climate consistency. This dataset will be
developed in C3Surf with the same methodological approach described in the previous paragraph
for HISTALP_Rec.
36
Long-term homogenised precipitation data sets for Norway
Elin Lundstad1, Petr Stepanek2, Pavel Zahradníček2
1Department of climate services, Norwegian Meteorological institute 2Global Change Research Institute, Czech Academy of Sciences
Homogeneity is important when analysing climatic long-term time series. This is to ensure that
the variability in the time series is not affected by changes such as station relocations,
instrumentation changes, changes in the surroundings etc.. The objective for this study is to
establish methods and to homogenize monthly precipitation data in Norway.
The Norwegian Meteorological institute has developed a number of long-term homogenised
climate data sets for Norway. The most prominent of these was for air temperature, which includes
231 stations in Norway with minimum length of 30 years in the years 1861 to 2010 (Andresen,
2011). In the past, this dataset was homogenized by means of AnClim and ProClimDB software.
Another data set have been developed for precipitation. The standard normal homogeneity test was
applied to 165 Norwegian precipitation series of 75 years or more (Bauer-Hansen & Førland,
1994). Of these series, 50 were found to be homogeneous, while 79 became homogeneous after
being adjusted for a single inhomogeneity. In 2012, we have got back to the task of homogenizing
precipitation in Norway again. We tested the series with Home.R, but the results obtained were not
satisfying. One of the reasons was a lack of monthly adjustment factor. Then, we tried applying
MASH. In this homogenization analysis we applied 248 Norwegian Precipitation Series of 80 years
or more. In average, this gives a result of over 5 breaks per precipitation station. This was not quite
right with the metadata. By the end of 2016, Pavel Zahradníček and Petr Stepanek tested the
precipitation series with Home.R again (connected with other ProClimDB software functionality).
It gave the results of 307 found breaks and 22 outliers.
In this seminar, we will discuss these data sets, the methods used in the development, and the
different homogenization result.
37
THE HOMOGENIZATION OF GPS INTEGRATED WATER VAPOUR TIME SERIES:
METHODOLOGY AND BENCHMARKING THE ALGORITHMS ON SYNTHETIC DATASETS
Roeland Van Malderen1, Eric Pottiaux2, Anna Klos3, Olivier Bock4, Janusz Bogusz2,
Barbara Chimani5, Michal Elias6, Marta Gruszczynska1, José Guijarro7, Selma Zengin
Kazancı8, Tong Ning9 1Royal Meteorological Institute of Belgium (RMI), Brussels, Belgium
2Royal Observatory of Belgium (ROB), Brussels, Belgium 3Military University of Technology, Warsaw, Poland
4IGN LAREG, University Paris Diderot, Sorbonne Paris, France 5Central Institute for Meteorology and Geodynamics, Austria
6Research Institute of Geodesy, Topography and Cartography, Czech Republic 7AEMET (Spanish Meteorological Agency), Spain
8Karadeniz Technical University, Turkey 9Lantmäteriet, Sweden
Within the COST Action ES1206 “Advanced Global Navigation Satellite Systems tropospheric
products for monitoring severe weather events and climate” (GNSS4SWEC), there was a clear
interest and need to homogenize a worldwide Integrated Water Vapour (IWV) dataset retrieved
with Global Positioning System (GPS), by correcting (artificial) break points due to e.g.
instrumental changes. The first activity concentrated on a worldwide GPS dataset covering 100+
stations, with a homogeneous data processing from 1995 to March 2011. As at most of these
stations, the ERA-interim reanalysis IWV field output correlates well with the IWV retrieved by
GPS, the ERA-interim IWV time series are used as reference and the IWV differences between
both sets are considered. The characterization of these IWV differences provided us with typical
trend values, seasonal oscillations and noise models, to build a synthetic benchmark IWV dataset
of differences. As a matter of fact, three different synthetic datasets have been generated, with
different levels of complexity (w/o autoregressive noise, w/o gaps and trends), to assess the impact
of these different factors on the performance of homogenization algorithms.
In this presentation, we will show the results of different homogenization algorithms on those 3
different sets of synthetic time series. We present their detection scores and compare the estimated
trends (and uncertainties) from their homogenized time series with the true input trends. We
analyze the sensitivity of each detection method w.r.t. the complexity of the synthetic datasets.
Finally, an outlook of the future activities and a call for participating in our activity will be given.
38
HOMOGENIZATION AND GRIDDING OF THE GREEK TIME SERIES
A. Mamara1, M.Anadranistakis1, A.A Argiriou2
1Hellenic National Meteorological Service 2Department of Physics, Laboratory of Atmospheric Physics, University of Patras
Weather observations are frequently exposed to artificial influences caused by station relocations,
changes in the instrumentation, etc. introducing inhomogeneities. Data series of temperature,
precipitation and sunshine duration were homogenized on a monthly time scale basis using the
HOMER software, a recently developed method for homogenizing monthly and annual climate
time series. The data sets cover a climatological normal period of 30 years (1971-2000) and come
from the Hellenic National Meteorological Service station network, which is part of the WMO
Global Observing System. The temperature data come from 52 meteorological stations and the
sunshine duration data from 44 meteorological stations of the HNMS’s network. The precipitation
data come from 157 meteorological stations, 89 stations belong at the Public Power Corporation
S.A. Hellas and 68 stations at the HNMS.
The homogenized derived data series were used to create a high resolution
(0.0083333ox0.0083333o) gridded data set. The method MISH (Meteorological Interpolation based
on Surface Homogenized Data Basis) developed at the Hungarian Meteorological Service was used
for the spatial interpolation of homogenized monthly values. The potential to use the elevation and
the first 15 AURELHY principal components as temperature predicators was investigated. It was
found that in the Mediterranean with an important coastline, the use only of elevation and the
AURELHY variables cannot describe temperature. Additional topographical and geographical
variables, namely the land to sea percentage and the expected solar irradiance are required. The
results revealed that elevation, land to sea percentage and solar irradiance should be used as
independent model variables. The work done revealed also that the east-west slopes seem to be
associated with mean temperature during all months except between April to July. Also, latitude
seems to affect mean temperature as well. Finally, north-south saddles were found to be related to
mean temperature only during the winter months. Compared to previous climatologies, the
proposed database has the following improvements: data are provided at a higher spatial resolution,
temperature data were homogenized, improved geographical and topographical data were used, an
interpolation method appropriate for meteorological parameters was applied and the statistical
results of the observed versus predicted values were better.
39
Digitisation and homogenisation of the long term daily (max/min) summer and
winter air temperature records in Ireland
Carla Mateus1, Aaron Potito1, Mary Curley2
1Department of Geography, National University of Ireland Galway, Ireland 2Met Éireann, Glasnevin Hill, Dublin, Ireland
This research is the first to attempt data recovery, digitisation and homogenisation of all available
summer and winter long-term instrumental daily maximum and minimum air temperature records
since the beginning of meteorological observations in Ireland. The ten long-term records of daily
meteorological observations, dating back to the 19th century, are one of the most complete daily
time series in Ireland: Botanic Gardens (1848 - 2016), Phoenix Park (1831 - 2016), Armagh
Observatory (1844 - 2016), NUI Galway (1861 - 2016), Markree Observatory (1875 - 2016), Birr
Observatory (1872 - 2016), Roches Point (1872 - 2016), Valentia Observatory (1872 - 2016),
Blacksod Point/Belmullet (1885 - 2016) and Malin Head (1885 - 2016).
It is an important project as most of the daily air temperature records have not been digitised prior
to the 1940/50s, and existed in the original observations logs and scattered publications in
extremely fragile journals and books stored in various archives across Ireland. The final
homogenised series will be used in this PhD project to reconstruct past climate extremes such as
heat and cold waves, extreme temperature indices, climate variability and temperature trend
analysis.
In this work the maximum and minimum daily air temperature data and available metadata has
been recovered and digitised. Gaps in records have been filled using data from other nearby
stations. The Irish instrumental records are well-distributed with respect to different geographical
influences on local temperatures, such as distance to the Atlantic Ocean, latitude or altitude and
orography. In order to determine reference stations for each candidate station, Pearson correlation
and first difference correlation coefficients (PETERSON and EASTERLING, 1994) have been
calculated. Preliminary work has been carried out to determine the best method to homogenise the
data on a daily basis. Due to time constraints and interest in constructing extreme temperature
events, only summer and winter seasons have been digitised rather than the full annual series.
The aim of this presentation is to discuss the results of this preliminary study and share experiences
of daily homogenisation.
References:
PETERSON, Thomas C. and EASTERLING, David R. (1994) Creation of homogeneous
composite climatological reference series. International Journal of Climatology, vol.14, Iss.6,
pp.671 – 679.

40
A machine learning perspective towards fully automated quality control in
daily weather time series
Perez Michel A.
Institute Royale Meteorologique (IRM) & ETRO-VUB
Quality control (QC) in weather time series is of fundamental importance since it increases data
reliability and paves the way for more robust and accurate analyses. This process is usually
performed by humans with certain degree of expertise and can be very time consuming. One of the
main challenges of making it completely automatic is that errors present in the signals are difficult
to distinguish from natural variations, in particular at daily data resolution level. Machine learning
techniques have been extremely successful in finding complex patterns to solve a wide range of
problems, especially where historical data or context plays an important role. Examples can be seen
in stocks markets forecasting, Chess or Go adversarial games, multi-target tracking in surveillance
systems, with outstanding results that exceed human capabilities. In this work, we present a
machine learning perspective to the QC problem in daily weather time series. Our approach relies
in historical raw and corrected data of a station and its neighboring peers, to train a machine
learning model by “showing it” errors and corrections; once the training is complete, it is then used
to predict corrections in newly/unseen raw data. This approach allows both detecting errors and
correcting them with predicted values, which is a step towards fully automated QC systems.
Preliminary experiments performed with min/max daily temperature records from Belgian
climatological stations show encouraging results.
41
Comparison of Gridded and Observed Temperature and Precipitation
Episode Series: A Case Study
Predrag Petrović
Republic Hydrometeorological Institute of Serbia, Belgrade, Serbia
As a continuation of the CARPATCLIM project, the DanubeClim project extends gridded
meteorological datasets towards south, covering the whole territory of Serbia. Additionally covered
region features presence of short episode series in areas with sparse station network with long
series. Due to their length, episode series are no suitable for use in the DanubeClim project.
With an idea of enhancing gridded datasets with additional input from more locations, an effort to
include episode series into the present station network has been made. A comparison of temperature
and precipitation series for the nearest grid point and the exact location of the episode series is
performed on different temporal scales.
The results of the comparison reveal possibilities and limitations for including episode series into
a long-term gridded series, especially taking temporal scales into account.

42
Modernisation of Croatian Meteorological Measurements Network
Dubravka Rasol
Meteorological and Hydrological Service of Croatia
e-mail: [email protected]
Demands for the real-time weather data are growing in all fields of meteorology but
especially in modelling, forecasting and alerting tasks. The Meteorological and Hydrological
Service of Croatia (DHMZ) is about to start the project of Modernisation of Croatian
Meteorological Measurements Network (METMONIC) funded by the European Regional
Development Fund. The modernisation consists of automation of most surface stations,
introduction of new upper-air measurements with a wind profiler and microwave radiometer at one
location and a lidar at another location. The remote measurements are going to be improved with
modernisation of existing weather radars and three new radars are going to be placed along the
Adriatic coast. Oceanographic measurements will also be modernised with installation of four
marine data buoys.
Modernisation of measurements will hugely increase the flow of data coming to the
headquarters of DHMZ on daily basis, so the databases for storing and working with all the data
should be improved. New sensors and measurements of meteorological elements that had never
been measured before will require new methods of data management and quality control. Great
challenges will appear in a few years as the new data should be merged with the old data series,
but hopefully we will have enough metadata and parallel measurements for producing the climate
data series of the highest quality.

43
COMPARISON OF THREE INTERPOLATION SCHEMES FOR SIX PARAMETERS
Kira Rehfeldt1, Christine Kolbe1, Markus Ziese1, Elke Rustemeier1, Stefan Krähenmann²
and Andreas Becker1
1Deutscher Wetterdienst, Global Precipitation Climatology Centre, 63067 Offenbach/M.,
Germany 2Deutscher Wetterdienst, Zentrales Klimabüro, 63067 Offenbach/M., Germany
The European Commission has funded the Copernicus Emergency Management Service (EMS), which
up to now includes the European Flood Awareness System (EFAS) and the European Forest Fire
Information System (EFFIS). Within this framework, the Meteorological Data Collection Center
(Copernicus MDCC) collects and processes data from European data providers and supplies regularly
gridded and station related analyses as resulting input data for the EMS’s EFAS and EFFIS. To identify
the optimum interpolation scheme for the currently six EMS relevant parameters (precipitation total,
maximum temperature, minimum temperature, mean vapor pressure, daily mean wind speed, daily total
radiation) a comparison of three different interpolation methods using European station observation
data on a daily basis covering May 2014 has been conducted. This month featured high precipitation
amounts in some areas of Europe, especially in the Balkan states and Italy. Such periods of high
precipitation amounts across topographically structured terrain are a challenge for interpolation
schemes to represent the entire variability actually taking place, thus most suitable for the comparison.
We compared Inverse Distance Weighting (IDW) (Ntegeka et al., 2013), SPHEREMAP (Willmott et
al., 1985) and Ordinary Kriging (Krige, 1966). Furthermore, the uncertainty information of the gridded
product is provided. A leave-one-out cross validation was utilized to assess the quality of the
interpolation schemes and different error metrics were calculated, as they focus on different aspects of
uncertainties. For this calculation we used the mean error (ME), the mean absolute error (MAE) and
the mean square error (MSE) to compare the results of each method per parameter. The error metrics
shows small differences between the three schemes and depends on the respective parameter.
Yamamoto’s approach was used to determine the uncertainty of the gridded fields in order to find the
best interpolation scheme (Yamamoto, 2000). This analysis revealed that IDW is the best performing
scheme regarding the computational effort. However, SPHEREMAP is more robust against spatially
inhmogeneous density of input data. Furthermore the grids generated by SPHEREMAP are more
reliable and the overall uncertainty is lower than in the other tested interpolation schemes comparing
all parameters. Therefore our recommendation for operational services is this interpolation technique.
Yamamoto’s approach performs better than the leave-one-out cross validation to assess the uncertainty
of gridded fields, as it is used for the generation of near-real-time grids and is applicable also to other
gridded data sets.
V. Ntegeka, P. Salamon, G. Gomes, H. Sint, V. Lorini, M. Zambrano-Bigiarini, J. Thielen;
2013; EFAS-Meteo: A European daily high-resolution gridded meteorological data set for
1990 – 2011; DOI: 10.2788/51262
C.J. Willmott, C.M. Rowe, W.D. Philpot; 1985; Small-scale climate maps: A sensitivity
analysis of some common assumptions associated with grid-point interpolation and
contouring; The American Carthographer; Vol. 12; pp. 5-16
D.G. Krige; 1966; Two-dimensional weighted moving average trend surfaces for ore
valuation; Proceedings of the Symposium on Mathematical Statistics and Computer
Applications in Ore Valuation; pp. 13-38
J. K. Yamamoto; 2000; An Alternative Measure of the Reliability of Ordinary Kriging
Estimates; Mathematical Geology; DOI: 10.1023/A:1007577916868

44
HOMPRA Europe - A gridded precipitation data set from European
homogenized time series
Elke Rustemeier1, Alice Kapala2, Anja Meyer-Christoffer1, Peter Finger1, Udo Schneider1,
Victor Venema2, Markus Ziese1, Clemens Simmer2 and Andreas Becker1 1Deutscher Wetterdienst, Hydrometeorology, Offenbach am Main, Germany
2Meteorological Institute, University of Bonn, Bonn, Germany
For the understanding and analysis of long-term trends in precipitation, a robust data base is
essential. Changes in the measuring conditions, but also errors made during the data recording, can
lead to breaks and outliers in the data.
The new product of the Global Precipitation Climatology Center - HOMPRA Europe
(HOMogenized PRecipitation Analysis of European in situ data) is a BIAS-corrected monthly
rainfall data set with 1° spatial resolution. The data set consists of 5373 carefully selected
precipitation time series held by the GPCC, which have been quality controlled and homogenized.
The time series cover the period 1951-2005 with less than 10% of missing values.
Due to the high number of series, an automatic algorithm had to be developed that can cope with
the different rainfall distributions in Europe and months without precipitation. The algorithm
basically consists of three parts:
*Selection of overlapping station networks in the same precipitation regime, based on partial rank
correlation and Ward's method of minimal variance. Since the underlying time series should be as
homogeneous as possible, the station selection is carried out by deterministic first derivation in
order to reduce artificial influences.
* The natural variability and trends were temporally removed by means of highly correlated
neighboring time series to detect artificial break-points in the annual totals. This ensures that only
artificial changes can be detected. The method is based on the algorithm of Caussinus and Mestre
(2004).
* In the last step, the detected breaks are corrected monthly by means of a multiple linear regression
(Mestre, 2003).
Since the homogenization algorithm is automated, its validation is essential. The performance of
the method was tested using artificial data sets. In addition, a sensitivity study was applied by
varying the reference stations. If available in digitized form, the station history was also used to
search for systematic errors in the jump detection.
Finally, the actual HOMPRA Europe product is produced by interpolation of the homogenized
series onto a 1° grid using one of the interpolation schemes operationally at GPCC (Becker et al.,
2013 and Schamm et al., 2014).
Caussinus, H., und O. Mestre, 2004: Detection and correction of artificial shifts in climate series,
Journal of the Royal, Statistical Society. Series C (Applied Statistics), 53(3), 405–425.
Mestre, O., 2003: Correcting climate series using ANOVA technique, Proceedings of the fourth
seminar on homogenization and quality control.
45
Becker, A.; Finger, P.; Meyer-Christoffer, A.; Rudolf, B.; Schamm, K.; Schneider, U. & Ziese, M.,
2013: A description of the global land-surface precipitation data products of the Global
Precipitation Climatology Centre with sample applications including centennial (trend) analysis
from 1901-present Earth System Science Data, 5, 71-99.
Schamm, K.; Ziese, M.; Becker, A.; Finger, P.; Meyer-Christoffer, A.; Schneider, U.; Schröder,
M. & Stender, P., 2014: Global gridded precipitation over land: a description of the new GPCC
First Guess Daily product, Earth System Science Data, 6, 49-60.
The GEWEX water vapor assessment (G-VAP) – results from inter-
comparisons and stability analysis
Marc Schröder1, Maarit Lockhoff1, Lei Shi2, Kathrin Graw1 1 DWD, Offenbach, Germany
2 NOAA/NESDIS/NCEI, Asheville, USA
A large variety of water vapour data records is available to date. Without proper background
information and understanding of the limitations of available data records, these data may be
incorrectly utilised or misinterpreted. The overall goal of assessments of climate data records
(CDRs) is to conduct objective and independent evaluations and inter-comparisons in order to point
out strengths, differences and limitations and, if possible, to provide reasons for them. The need
for such assessments is part of the GCOS guidelines for the generation of data products. The
GEWEX Data and Assessments Panel (GDAP) has initiated the GEWEX water vapor assessment
(G-VAP) which has the major purpose to quantify the current state of the art in water vapour
products (upper tropospheric humidity, specific humidity and temperature profiles as well as total
column water vapour) being constructed for climate applications. In order to support GDAP and
the general climate analysis community G-VAP intends to answer, among others, the following
questions:
a) How large are the differences in observed temporal changes in long-term satellite data records
of water vapour on global and regional scales?
b) Are the differences in observed temporal changes within uncertainty limits?
c) What is the degree of homogeneity (break points) of each long-term satellite data record?
A general overview of G-VAP will be given. The focus of the presentation will be on observed
inconsistencies among the long-term satellite data records as observed by inter-comparisons,
comparisons to in-situ observations and the stability analysis. On basis of consistently applied tools
major differences in state-of-art CDRs have been identified, documented and to a large extend
explained. The results and the answers for TCWV are summarized as follows: On global ice-free
ocean scale the trend estimates among long-term data records were generally found to be
significantly different. Maxima in standard deviation among the data records are found over, e.g.,
tropical rain forests. These and other noticeable regions coincide with maxima in mean absolute
differences among trend estimates. These distinct features can be explained with break points
which manifest on regional scale and which typically do not appear in stability analysis relative to

46
ground-based observations. Results from profile inter-comparisons will also be shown and exhibit,
among others, that the observed break points are not only a function of region but also of parameter.
Homogenisation of daily station data in England and Wales
Kay Shelton1, Sarah Warren1, Richard Davis2, Duncan Faulkner1
1JBA Consulting, Skipton, UK 2Environment Agency, Reading, UK
The Environment Agency (EA) in England is developing a gridded dataset of historical potential
evapotranspiration (PET) across England and Wales for the period 1961 onwards, based on
observed climate data. The dataset will be used to validate and calibrate existing surface exchange
schemes that provide inputs to operational hydrological models.
The calculation of PET, using the Penman-Monteith equation, requires temperature, humidity,
radiation and wind speed information. Spatial and temporal discontinuities have been identified in
PET calculated using standard methodologies within the UK. For example, inhomogeneities have
been identified in the wind speed observations currently used within these calculations.
The first step in deriving the gridded PET dataset is the generation of homogeneous time series of
relevant meteorological data for each available station across England and Wales. To ensure
robustness and reproducibility of the final homogenised dataset, the fully-automatic
homogenisation package MASH is used. The use of an automatic homogenisation package reduces
the subjectivity in the homogenisation process and reduces the possibility for the introduction of
errors due to inexperienced data homogenisers. MASH also allows daily data, both additive and
cumulative, to be homogenised using a single consistent process.
The following meteorological station data are homogenised: 0900 UTC 2m air temperature, 0900
UTC 2m dewpoint temperature, 24-hour maximum 2m air temperature, 24-hour minimum 2m air
temperature, 24-hour average 10m wind speed, and 24-hour sunshine duration. Complete calendar
year data are available for the period 1961 to 2013. For each variable, network coverage varies
greatly throughout this period, with a mixture of record lengths across the network for each
variable. Due to the frequent presence of missing data, and the existence of numerous sites with
short records, the networks selected for homogenisation are limited to stations with record lengths
of at least 15 years (or 20 years for some variables). This yields network sizes of 300-400 stations
for each of the temperature variables, 250 for sunshine and 150 for wind speed.
Results from the homogenisation of completed variables will be presented using the verification
scores determined within the MASH process, along with some of the challenges faced and lessons
learned during the experience.
Questions will also be posed regarding how best to proceed with integrating future updates of
meteorological data into the homogenised time series, and how to handle the homogenisation of
shorter record sites.
47
Homogenization of ECA&D temperature series
ANTONELLO SQUINTU
KNMI - The Royal Netherlands Meteorological Institute
Homogenization of temperature series is a fundamental step in climatological analysis. This is of
great importance due to artificial signals introduced by changing features of the stations throughout
the years. Relocation, replacement of the instrument or changes in the surroundings introduce step-
like or more complicated signals that can deeply affect the quality of indices and trend calculations.
Such errors may lead to erroneous estimates of climate change. For these reasons, the change
points need to be recognized and corrected, which requires identifying their timing and amplitude.
Metadata can be present to help in this process, but most of the times statistical methods are
required to identify these breaks, because metadata is often absent. A large set of break detection
methods have been developed and published in recent years. These have been compared and
combined to find the most efficient procedure for the identification of change points in the
temperature series. Once the breaks have been found, the series need to be corrected by calculating
the amplitude of the change points. This can be done looking at changes in the (yearly or monthly)
means or in the higher orders (such as percentile values) of the temperature distribution. Analysis
shows that The latter method better approaches the chosen benchmark (manually homogenized)
series in terms of indices and trends. This method has been applied to the European ECA&D
dataset. The homogenized series have then been blended with data from nearby station, in order to
produce longer series. After this step a new homogenization procedure has been performed to avoid
step-like changes due to the blending “joints”. Finally, in order to provide an homogenized data-
set with the highest quality, a second iteration of break detection, adjustment calculation and
blending has been performed using the outcomes of the first iteration as input and as references
(longer, higher quality and thus better results). The new homogenized data-set has then been
compared with the original one, looking at changes in extremes, trends and climate indices.
48
Introduction on homogenization, quality control, spatial interpolation,
gridding
Tamás Szentimrey
Hungarian Meteorological Service
Theoretically there is a strong connection between these topics since the homogenization of climate
data series and the data quality control procedures need spatial statistics and interpolation
techniques for spatial comparison of data. On the other hand the spatial interpolation procedures
(e.g. gridding) require homogeneous, high quality data series to obtain good results.
The main topics of homogenization and quality control are the following:
Theoretical, mathematical questions. There is not any exact mathematical theory of the
homogenization.
Methods for homogenization and quality control (QC) of monthly data series, missing data
completion.
Spatial comparison of series, inhomogeneity detection, correction of series.
Methods for homogenization and quality control (QC) of daily data series, missing data
completion, examination of parallel measurements.
Relation of monthly and daily homogenization, mathematical formulation of homogenization
for climate data series generally.
Usage of metadata.
Manual versus automatic methods.
Theoretical evaluation and benchmark for methods, validation statistics.
Applications of different homogenization and quality control methods, experiences with
different meteorological variables.
The main topics of spatial interpolation are the following:
Theoretical, mathematical questions.
Temporal scales: from synoptic situations to climatological mean values.
Interpolation formulas and loss functions depending on the spatial probability distribution
of climate variables.
Estimation and modelling of statistical parameters (e.g.: spatial trend, covariance or
variogram) for interpolation formulas using spatiotemporal sample and auxiliary model
variables (topography).
Characterization, modelling of interpolation error.
Use of auxiliary co-variables, background information (e.g.: dynamical model results,
satellite, radar data) for spatial interpolation, relation with data assimilation, reanalysis.
Applications of different interpolation methods for the meteorological and
climatological fields, experiences with different meteorological variables.
Gridded databases.
Real time data quality control (QC) procedures based on spatial comparison, interpolation.
49
Some theoretical questions and development of MASH for homogenization of
standard deviation
Tamás Szentimrey
Hungarian Meteorological Service
There are several methods and software for homogenization of climate data series but there is not
any exact mathematical theory of the homogenization. Therefore we have to formulate some
questions of homogenization in accordance with the mathematical conventions. The basic question
is the mathematical definition of the inhomogeneity and the aim of homogenization. It is necessary
to clarify that the homogenization of climate data series is a distribution problem instead of a
regression one. Another problem is the relation of monthly and daily data series homogenization.
The theme of homogenization can be divided into two subgroups, such as monthly and daily data
series homogenization. These subjects are in strong connection with each other of course, for
example the monthly results can be used for the homogenization of daily data. In the practice the
monthly series are homogenized in the mean only, while there exist some trials to homogenize the
daily series also in higher order moments. These procedures are based on a popular assumption
that is the correction of mean is sufficient for monthly series, and the correction of higher order
moments is necessary only in the case of daily data series. In general, it is tacitly assumed that the
averaging is capable to filter out the inhomogeneity in the higher order moments. However, this
assumption is false, since it can be proved if there is a common inhomogeneity in the standard
deviation of daily data then we have the same inhomogeneity in monthly data. Therefore we
develop a mathematical procedure for the homogenization of mean and standard deviation together.
Building of this procedure in our software MASH (Multiple Analysis of Series for
Homogenization; Szentimrey) is ongoing and it is based on the examination of monthly series and
the monthly results are applied for the homogenization of daily series. We remark if the data are
normally distributed then the homogenization of mean and standard deviation is sufficient since in
case of normal distribution if the first two moments are homogenous then the higher order moments
are also homogeneous.
Software MASH (Multiple Analysis of Series for Homogenization; Szentimrey) can be
downloaded from the webpage:
http://www.met.hu/en/omsz/rendezvenyek/homogenization_and_interpolation/software/
50
New developments of interpolation method MISH: modelling of interpolation
error RMSE, automated real time Quality Control
Tamás Szentimrey
Hungarian Meteorological Service
The main difference between MISH and the geostatistical interpolation methods can be found in
the amount of information used for modelling the necessary statistical parameters. In general at the
geostatistical methods built in GIS the sample for modelling is only the predictors, which is a single
realization in time. At MISH method we use the spatiotemporal data for modelling since the long
data series form a sample in time and space as well. The long data series is such a specialty of the
meteorology that makes possible to model efficiently the statistical parameters in question.
The new developments of the new version MISHv2.01 are connected with modelling of climate
statistical parameters and the interpolation error moreover a real time data quality procedure has
been also built in the system.
At MISH method modelling of the climate statistical parameters is a cornerstone and the
interpolation system is based on this one. The earlier modelling system was elaborated for the
monthly and daily expected values and the spatial correlations. These are the basic statistical
parameters of the interpolation procedures. At the new version the monthly and daily standard
deviations and the daily temporal correlations also can be modelled. Consequently the modelling
subsystem of MISH is completed for all the first two spatiotemporal moments. If the joint
spatiotemporal probability distribution of the given variable is normal then the above
spatiotemporal moments determined uniquely this distribution that is the mathematical model of
the climate.
The next development is modelling of the interpolation error RMSE (Root Mean Square Error) in
order to characterize quantitatively the uncertainties of the interpolation. This procedure is based
on the earlier representativity modelling and the present standard deviation and temporal
autocorrelation modelling together.
The last novelty of the new MISH version is an automated real time Quality Control (QC)
procedure for observed daily and monthly data. According to the test scheme, the observed values
are compared to certain interpolated values using modelled optimal parameters and the modelled
interpolation error. During the procedure multiple spatial comparison is tested similarly to the QC
procedure built in our MASH (Multiple Analysis of Series for Homogenization; Szentimrey)
method. The main difference between the MASH and MISH QC procedures is, while at MASH it
is developed for time series and the statistical parameters are estimated from the series in classic
statistical way, at MISH it is a real time test and modelled statistical parameters are used.
Software MISH (Meteorological Interpolation based on Surface Homogenized Data Basis;
Szentimrey and Bihari) can be downloaded from the webpage:
http://www.met.hu/en/omsz/rendezvenyek/homogenization_and_interpolation_2017/software

51
Ensemble approaches to assess uncertainties in observation gridding
Ole Einar Tveito and Cristian Lussana
Norwegian Meteorological Institute
Gridded representations of climate observations have become important for a large number of
applications. The Norwegian Meteorological Institute has provided daily gridded observation data
sets with a 1x1 km spatial resolution since 2004. Since last year we also provide hourly data.
Currently we are running two gridding models; (i) the original model applying residual kriging for
temperature where the external trend parameterization is based on climatology and triangulation
with an elevation dependence for precipitation, and (ii) Bayesian optimum interpolation where the
the background fields are defined by a smoothed regional analysis of the observed field. The data
sets are updated in real-time.
Both these models are deterministic by nature and provide only one realisation of the estimations.
The uncertainty is addressed by cross-validation at the observation points. To better assess the
uncertainty ensemble methods in observation gridding have become an interesting approach.
There are several ways to set up ensemble estimation systems for observation gridding. The two
principal challenges in such analysis are the representativity of observation network and
descriptions of vertical and horizontal gradients in complex terrain. We have investigated the
gradients and the station representativity in a residual kriging interpolation for temperature
applying a locally weighted regression approach to create ensemble members. The analysis is done
on a daily scale, and reveal large temporal and spatial variations in the influence of the predictors
in the spatial trend field. We will present the results of this preliminary study and discuss different
approaches for ensemble gridding.
52
Global temperature trend biases and statistical homogenization methods
Victor Venema and Ralf Lindau
University of Bonn
The global land temperature trend may be biased due to remaining inhomogeneities. Well-
homogenized national datasets on average clearly show more warming than global collections
(GHCN, CRUTEM, GISTEMP, etc.) when averaged over the region of common coverage. We will
present the temperature trend differences for several dozen national temperature series.
This finding makes research into statistical homogenization more pressing. We have estimates for
the uncertainties due to remaining inhomogeneities from numerical validation studies. We
urgently need analytic work on the uncertainties in a certain dataset or station that is based on the
inhomogeneities found and the network characteristics.
There are several possible causes of cooling biases, which have not been studied much. Siting could
have improved. Increases in irrigation could lead to a spurious cooling trend. Early thermometer
screen have a warm bias compared to Stevenson screens. Currently we are in a transition to
Automatic Weather Stations. The net global effect of this transition is not clear at this moment.
The latter two transitions are difficult to homogenize using relative statistical homogenization
because the entire network is affected. In the Global Historical Climate Network (GHCNv3),
homogenization does not change the global mean temperature much in these periods.
Previous validation studies of statistical homogenizations unfortunately have some caveats. The
main problem is that the used artificial datasets had a relatively large and too optimistic signal to
noise ratio (SNR). Our recent work on multiple breakpoint detection methods shows that real-world
SNRs may be as small as about 0.5. For these realistic cases, statistically significant breaks are
identified, but the corresponding segmentation is about as good as a random segmentation.
The joint correction method using a decomposition approach (ANOVA) can remove the bias when
all breaks (predictors) are known. Any error in the predictors will, however, lead to a systematic
undercorrection of any large-scale trend bias.
53
New WMO Guidance on homogenisation
Victor Venema, Blair Trewin, Xiaolan Wang, Tamás Szentimrey, Enric Aguilar,
Manola Brunet, Wilfrid Serge Raoul Likeba Louamba, Ghulam Rasul, Clara Oria,
Matthew Menne and Jose Antonio Guijarro
The Task Team on Homogenisation (TT-HOM) is writing the next WMO guidance on
homogenization, which is mainly aimed at helping National Meteorological and Hydrological
Services (NMHSs) to produce better quality datasets to study climate, climate variability and
climate change.
There are two fundamental types of homogenization: 1) homogenization of the means and
2) homogenization of the distribution that also adjusts the variability around the mean. The former
is typically used to homogenize annual and monthly data, while the latter is mostly used for daily
data. The focus of this guidance will be on the homogenisation of the means; this type is understood
best and most commonly applied in operational practise. This guidance will explain the limitations
of only homogenizing the means, but the adjustment of the distribution is difficult and not
sufficiently well understood at this time and considered to be beyond the scope of this guidance.
The guidance is furthermore limited to the homogenization of instrumental land station data.
The homogenization guidance of TT-HOM will have three parts.
1. A traditional report with the basic information on the homogenization of monthly data, including
its mathematical basis, a discussion on the available methods and how to apply them and needs for
further research. This part is structured in a way that can offer advice for individuals / institutions
starting with homogenisation, as well as for more advanced practitioners and developers. See
below for details.
2. A Frequently Asked Questions (FAQ) on the internet. This way we can stay up to date. The
answers will be shorter and more informal and link to relevant information sources for details,
including our report.
3. A list with the publically available software packages, their capabilities, strengths and
weaknesses. This list of software packages will be kept up to date on the internet, it is currently at:
http://www.meteobal.com/climatol/tt-hom/
Part I of the traditional report is aimed at getting new people started with homogenization. It
discusses the prerequisites, focussing on why they are important for homogenization: data rescue
of the observations themselves and of information on the history of the measurements, as well as
quality control and network selection. It lists most reasons for inhomogeneities to illustrate the kind
of problems a homogenizer may encounter and explains the various approaches to homogenization
and how to select the data for homogenisation. It provides guidance for the selection of adequate
homogenisation software packages for the task at hand.
Part II of this report discusses more advanced background topics and is intended for advanced users
and developers of homogenisation methods. It gives a short historical overview of homogenization
methods. It has a chapter with a mathematical description of the homogenization problems, which
aims to support designers of homogenization algorithms. It gives guidance on interacting with
operational departments on questions of the station network management. The overview provided
by the guidance also makes clear what we do not know well enough yet. Thus in the last chapter
ideas for future homogenization research are given.

54
A global database with parallel measurements to study non-climatic changes
Victor Venema, Renate Auchmann, Enric Aguilar, Ingeborg Auer, Cesar Azorin-Molina,
Theo Brandsma, Michele Brunetti, Alessandro Delitala, Manuel Dienst, Peter Domonkos,
Evyatar Erell, Alba Gilabert, Xiaomao Lin, Jenny Lindén, Elin Lundstad, Ewa Milewska,
Øyvind Nordli, Marc Prohom, Jared Rennie, Petr Stepanek, Blair Trewin, Lucie Vincent,
Kate Willett, Mareile Wolff
In this work we introduce the rationale behind the ongoing compilation of a parallel measurements
database, in the framework of the International Surface Temperatures Initiative (ISTI) and with the
support of the World Meteorological Organization. We intend this database to become instrumental
for a better understanding of inhomogeneities affecting the evaluation of long-term changes in daily
climate data.
Long instrumental climate records are usually affected by non-climatic changes, due to, e.g.,
(i) station relocations, (ii) instrument height changes, (iii) instrumentation changes, (iv) observing
environment changes, (v) different sampling intervals or data collection procedures, among others.
These so-called inhomogeneities distort the climate signal and can hamper the assessment of long-
term trends and variability of climate. Thus to study climatic changes we need to accurately
distinguish non-climatic and climatic signals.
The most direct way to study the influence of non-climatic changes on the distribution and to
understand the reasons for these biases is the analysis of parallel measurements representing the
old and new situation (in terms of e.g. instruments, location, different radiation shields, etc.).
According to the limited number of available studies and our understanding of the causes of
inhomogeneity, we expect that they will have a strong impact on the tails of the distribution of air
temperatures and most likely of other climate elements. Our abilities to statistically homogenize
daily data will be increased by systematically studying different causes of inhomogeneity replicated
through parallel measurements.
Current studies of non-climatic changes using parallel data are limited to local and regional
case studies. However, the effect of specific transitions depends on the local climate and the most
interesting climatic questions are about the systematic large-scale biases produced by transitions
that occurred in many regions. Important potentially biasing transitions are the adoption of
Stevenson screens, relocations (to airports) efforts to reduce undercatchment of precipitation or the
move to automatic weather stations. Thus a large global parallel dataset is highly desirable as it
allows for the study of systematic biases in the global record.
We are interested in data from all climate variables at all time scales; from annual to sub-daily.
High-resolution data is important for understanding the physical causes for the differences between
the parallel measurements. For the same reason, we are also interested in other climate variables
measured at the same station. For example, in case of parallel air temperature measurements, the
influencing factors are expected to be global radiation, wind, humidity and cloud cover; in case of
parallel precipitation measurements, wind and wet-bulb temperature are potentially important.
Metadata that describe the parallel measurements is as important as the data itself and will be
collected as well. For example, the types of the instruments, their siting, height, maintenance, etc.
Because they are widely used to study moderate extremes, we will compute the indices of the
Expert Team on Climate Change Detection and Indices (ETCCDI). In case the daily data cannot
be shared, we would appreciate contributions containing these indices from parallel measurements.

55
For more information: http://tinyurl.com/ISTI-Parallel
Inhomogenieties in Estonian air temperature series with CLIMATOL and
HOMER
K. Vint1, S. Keevallik2, H. Meitern1 1Estonian Environment Agency (ESTEA), Mustamäe tee 33, 10616 Tallinn, Estonia;
2Marine Systems Institute at TUT, Akadeemia tee 15a, 12618 Tallinn, Estonia;
This study presents results of the application of the two tools: HOMER software and “Climatol”
package to the air temperature series in Estonia. HOMER (HOMogenization softwarE in R) is a
software designed for homogenisation of essential climate variables at monthly scale. “Climatol”
is a contributed R package holding functions for climatological series homogenisation and it is
coded to produce also climatological summaries and grids from homogenised results. “Climatol”
is able to deal with monthly and daily data. However, also HOMER “basic checks” already contain
adaptations from “Climatol”, in a present study “Climatol” package is applied also separately, to
get more detailed results.
The datasets of monthly mean air temperature as well as monthly absolute maxima and minima for
HOMER and daily mean, daily absolute maxima and minima for “Climatol” were obtained from
Estonian Environment Agency (ESTEA). Data from 22 locations over Estonia were used, 8
locations having data from 1925 to 2016 and 14 location having data for the period 1961-2016.
The focus on the homogeneity of Estonian air temperatures with three purposes using HOMER
software: 1) to run fast quality control - detecting outliers and checking outlier validity; 2)
homogeneity testing with HOMER software – to determine which change points are significant
and to give a review on significant breakpoints (also using information from metadata); 3) to detect
and correct eventual inhomogeneities in the dataset.
The focus on the homogeneity of Estonian air temperatures with three purposes using “Climatol”:
1) to find binary splits on whole series with SNHT (also using explanations from metadata); 2) to
calculate anomalies after missing data recalculation; 3) apply corrections and adjust series.
The results of both tools to Estonian temperature series are explained and presented here.

56
TEMPERATURE SERIES QUALITY ANALYSIS
BASED ON THE NUMBER OF CORRECTED VALUES
Ana Weissenberger, Dubravka Rasol and Helena Lebo Andreis
Meteorological and Hydrological Service of Croatia (MHSC),
Grič 3, HR-10000 Zagreb
POSTER
At MHSC a relational database was introduced in 2008. Until that year all original climate data
exist in paper form only, while to the data in electronic form corrections were applied without
keeping an untouched electronic copy of the original. Since 2008, the original data are saved
separately, while corrections are only applied to a copy of the dataset, thus making a
comparison of the two datasets possible.
Using the 2008-2015 dataset, the aim was to find the percentage of data that were corrected in
each series, and use it to analyse the quality of the series. The results can be used in practice to
evaluate the quality of an observer's work, taken into account in climate analyses of the ser ies
or explain inhomogeneities in certain periods.
The analysed parameters are: air temperature (from the three main daily observations), daily
maximum and minimum temperature and wet-bulb temperature, usually being the most
corrected or deleted parameter. The percentage of corrected data in each series is determined,
and from it the quality of the series itself is assessed.
57
Comparison of different daily adjustment methods for the maximum and
minimum temperature in Israel
Yizhak Yosef1,2, Enric Aguilar3 and Pinhas Alpert1
1Department of Geosciences, Tel-Aviv University, Tel-Aviv, Israel 2Israel Meteorological Service, Bet-Dagan, Israel
3Center on Climate Change (C3), Universitat Rovira i Virgili, Tarragona, Spain
Break-point detection is mainly done through monthly means although there are few methods that
can detect breaks on daily resolution (CLIMATOL, ACMANT). The daily adjustment can be done
usually after this stage by some approaches such as interpolating the monthly values to the dailies
or by fitting the distribution of sub homogeneous period to the other sub homogeneous period.
Based on these approaches, several methods were developed in order to deal with daily
adjustments. Each method generates the daily correction factors differently which affects the higher
order distribution moments and as a consequence may even change the general means and trends.
In our study, the break-point detection is based on monthly resolution applying jointly relative
homogenization methods (HOMER, ACMANT, CLIMATOL), accompanied by metadata gathered
from the comprehensive Israel Meteorological Service archive.
Among the several daily adjustments techniques, we have choose to apply HOM, SPLIDHOM,
VINCENT, CLIMATOL methods to the database. Our integrated model defined the monthly
breaks and just then, we applied the different techniques.
By comparing these common methods, we will stress their influence both on the shape of the
distributions and on some extreme indices trends recommended by the Expert Team on Climate
Change Detection and Indices (ETCCDI) for few Israeli case study stations.

58
Homogenization of the wind speed time series in Czech Republic
Pavel Zahradníček1, Petr Štěpánek2
1Global Change Research Institute, AS CR, v.v.i, Brno, Czech Republic/ Czech
Hydrometeorological Institute, Brno, Czech Republic 2Global Change Research Institute, Czech Academy of Sciences
Wind speed is one of the most problematic meteorological elements in a sense of its reliability.
Problems were caused mainly by change of a way of measurements – the automation of the
meteorological network. This changes of instruments – switching from observations in Beaufort
scale to measurements by means of automated cup anemometers and later ultrasonic instrument –
together with need of frequent calibration of automated cup anemometers (easy to fail), are a few
examples of problems that have to be faced. Together with the fact that wind speed has weak spatial
relationship and thus problem finding proper reference series, makes the homogenization (and data
quality control) quite difficult. Even though the time series of average wind speeds were
successfully homogenized and daily values are shows to be homogeneous by various statistical
tests (e.g. in Štěpánek et al 2013), it did not eliminate the problem with significant inhomogeneities
in the number of days above a certain threshold. For example, we observe significant decrease in
the number of days with a maximum wind gust above 20 m/s after 1997 when the automation of
the meteorological stations began in the Czech Republic.
Acknowledgements: The authors acknowledge the financial support