Embed Size (px)
Citation preview

9M19
Company Updates
PT MitraBahtera Segara Sejati
October 20191
Table of Contents
1
2
3
Company’s Profile
04 About MBSS
05 The Management
07 Our Fleets
08 Operational Area
09 Our Clients
10 Financial Summary
Company’s Performance
12 Indonesia Coal Market Forecast
13 Macroeconomics Forecast
14 9M19 Performance Highlights
15 Barging Highlights
16 FC Highlights
17 Direct Cost Overview
Appendix
19 Summary Financial Statement
20 Shareholding Structure
21 Shares Performance and Dividend
Disclaimer:
These materials have been prepared by PT Mitrabahtera Segara Sejati Tbk (the “Company”)
solely for information purposes and are not an offer to sell or an invitation to buy any securities.
Neither these materials nor anything herein forms the basis for any contract or commitment
whatsoever. These do not purport to be all-inclusive or to contain all of the information a
prospective or existing investor may desire. By retaining these materials, you acknowledge and
represent to the Company that you have read, understood and accepted the terms of this notice.
These materials have not been independently verified. No representation or warranty, expressed
or implied, is made and no reliance should be placed on the fairness or completeness of the
information presented or contained in these materials. The opinion that is expressed in these
materials are subject to change without notice. To the extent maximum limitation permitted by law,
the Company or the Directors, employees, advisors, affiliates or agents of the Company do not
assume any responsibility, whatsoever for any loss arising from or in connection with the use of
this presentation or arising from anything expressly or implicitly contained or referred to in these
materials.
These materials may contain statements that constitute forward-looking statements and that
forward-looking statements are subject to various risks and uncertainties, many of which are
difficult to predict and generally beyond the control of the Company. Such statements, estimates
and projections reflect various assumptions by management concerning possible anticipated
results, which assumptions may or may not be correct. Neither the Company, its affiliates nor any
other person assumes responsibility for the accuracy and completeness of the forward-looking
statements in these materials. The materials are property of the Company and any use and
dissemination of the information is prohibited without the express written consent from the
Company. 2

PART 1. COMPANY’S PROFILE
3

About MBSS
• PT Mitrabahtera Segara Sejati Tbk (MBSS) is a leading Indonesian provider of integrated one-stop sea logistics and transportation
solutions for bulk materials, particularly coal. With more than 25 years of experience in the business, MBSS has earned a reputation for
high quality, reliable service. Our customers consist of first and second-tier coal producers, as well as end users.
• MBSS was founded in Jakarta, Indonesia in 1994 as a shipping company. Over time, we expanded our facilities, fleet and overall
services to become a premier provider capable of consistently meeting client requirements. In 2011, MBSS successfully listed on the
Jakarta Stock Exchange (now the Indonesia Stock Exchange). In the same year, MBSS also became a member of the Indika Energy
group.
• Applying international operating standards and industry best practices to ensure efficient and reliable service for customers, MBSS is
committed to sustainable growth and excellence through strategic decision making and operations.
Barging
• Transport from loading port to unloading port (direct barging).
• Transport from loading port to anchorage point for transshipment.
Transshipment
• Transfer of coal from barge to mother vessel, which can be executed by using geared
vessel or intermediate facilities such as floating crane.
Integrated Solutions
4
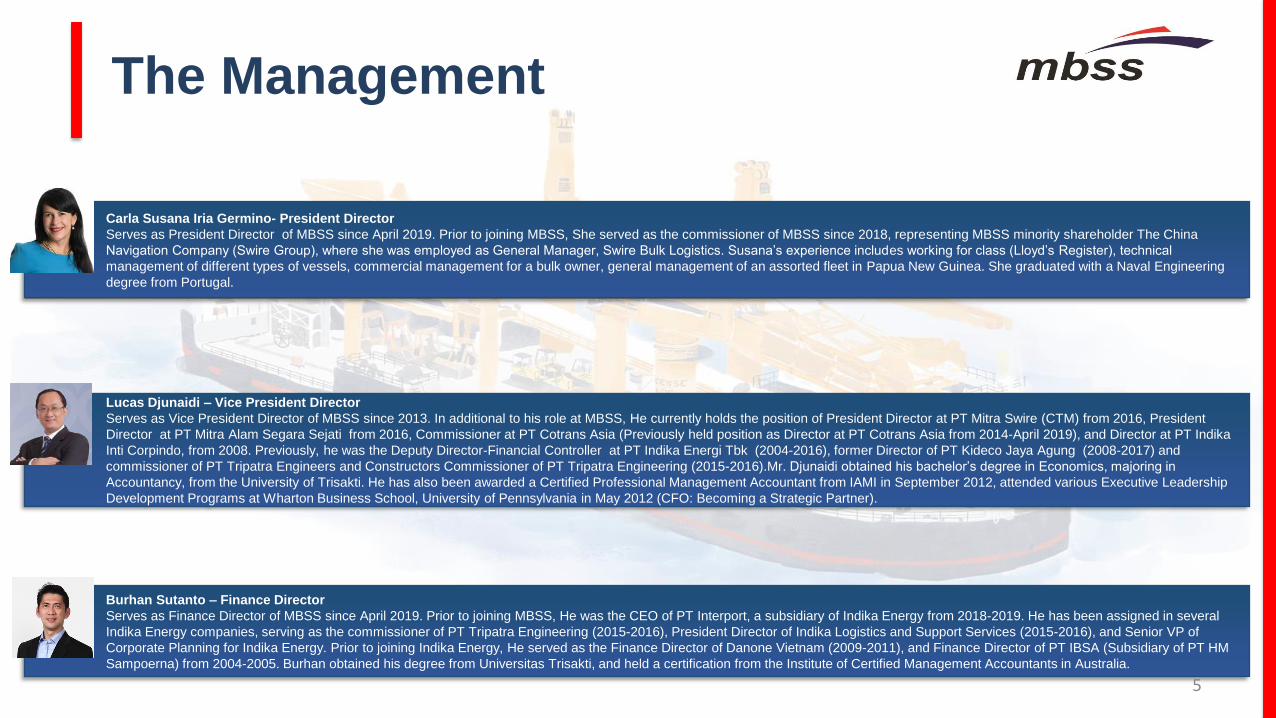
The Management
Carla Susana Iria Germino- President Director
Serves as President Director of MBSS since April 2019. Prior to joining MBSS, She served as the commissioner of MBSS since 2018, representing MBSS minority shareholder The China
Navigation Company (Swire Group), where she was employed as General Manager, Swire Bulk Logistics. Susana’s experience includes working for class (Lloyd’s Register), technical
management of different types of vessels, commercial management for a bulk owner, general management of an assorted fleet in Papua New Guinea. She graduated with a Naval Engineering
degree from Portugal.
Lucas Djunaidi – Vice President Director
Serves as Vice President Director of MBSS since 2013. In additional to his role at MBSS, He currently holds the position of President Director at PT Mitra Swire (CTM) from 2016, President
Director at PT Mitra Alam Segara Sejati from 2016, Commissioner at PT Cotrans Asia (Previously held position as Director at PT Cotrans Asia from 2014-April 2019), and Director at PT Indika
Inti Corpindo, from 2008. Previously, he was the Deputy Director-Financial Controller at PT Indika Energi Tbk (2004-2016), former Director of PT Kideco Jaya Agung (2008-2017) and
commissioner of PT Tripatra Engineers and Constructors Commissioner of PT Tripatra Engineering (2015-2016).Mr. Djunaidi obtained his bachelor’s degree in Economics, majoring in
Accountancy, from the University of Trisakti. He has also been awarded a Certified Professional Management Accountant from IAMI in September 2012, attended various Executive Leadership
Development Programs at Wharton Business School, University of Pennsylvania in May 2012 (CFO: Becoming a Strategic Partner).
Burhan Sutanto – Finance Director
Serves as Finance Director of MBSS since April 2019. Prior to joining MBSS, He was the CEO of PT Interport, a subsidiary of Indika Energy from 2018-2019. He has been assigned in several
Indika Energy companies, serving as the commissioner of PT Tripatra Engineering (2015-2016), President Director of Indika Logistics and Support Services (2015-2016), and Senior VP of
Corporate Planning for Indika Energy. Prior to joining Indika Energy, He served as the Finance Director of Danone Vietnam (2009-2011), and Finance Director of PT IBSA (Subsidiary of PT HM
Sampoerna) from 2004-2005. Burhan obtained his degree from Universitas Trisakti, and held a certification from the Institute of Certified Management Accountants in Australia.
5

The Management
Surya Aribowo - Director
Serves as Director since September 2016. He has spent close to 30 years in the coal mining industry, then he was invited to join PT Mitrabahtera Segara Sejati as the GM of Operations.
He graduated from Jayabaya University, Jakarta, majoring economics, specializing in management.
Adhitya Nugroho– Director
Serves as Director of MBSS since April 2019. Prior to joining MBSS, he was the Country Manager of American Bureau of Shipping (ABS) Indonesia and President Director of PT ABS Indoclass
Pratama (Subsidiary of ABS in Indonesia). He has a wealth of experience working in the shipping industry, working for Lloyd Register in London from 1999 to 2002, and Lloyd Register Singapore
from 2002-2014 working as a Surveyor in Charge in the South Asia Technical Support Office. He graduated from Sepuluh November Institute of Technology (ITS), Surabaya and the University
of Newcastle upon Tyne, England. In addition, he is also registered as a Chartered Engineer (CEng) at the UK Engineering Council, a Fellow of the Institute of Marine Engineering Science and
Technology (FIMAREST) and a Member of the Royal Institution of Naval Architects (MRINA).
6

Our Fleet
2018
Addition
Disposal
9M19
87
-
(2)
85
2018
Addition
Disposal
9M19
78
-
(9)
69
2018
Addition
Disposal
9M19
4
-
-
4
Support vessel
2018
Addition
Disposal
9M19
1
-
-
1
Tugboats Barges
Floating
Cranes (FC)Others
Number of fleetSets & Units
2018
Addition
Disposal
9M19
2
-
-
2
Floating Loading
Facilities (FLF)
Floating cranes loading rate per day
18,000 TPD (1 units)
20,000 TPD (2 units)
24,000 TPD (1 units)
50,000 TPD (2 units)
Total 6 FCs capacity *)
18,000 t
40,000 t
24,000 t
100,000 t
182,000 t
*) Consisting of 4 FCs & 2 FLFs
Barging loading capacity per trip
270ft (6 sets)
300ft (45 sets)
330ft (7 sets)
365ft (11 sets)
Total barging capacity
30,000 t
337,500 t
70,000 t
137,500 t
575,000 t
78 76 7569
78
69
7 6 6 6 6 6
FY14 FY15 FY16 FY17 FY18 9M19
Barging (sets) FC (units)
7

Operational Area
8

Our Clients
9
Client Type of Service Contract
Adaro Indonesia Barging *) 7-years with 2-years extension contract (2010-2019)
Kideco Jaya Agung Barging
Floating Crane
3-years with 2-years and 4-years extension contract (2014-2023)
5-years with 5-years extension contract (2013-2023)
Berau Coal Floating Crane + Barging 5-years with 5-years extension contract (2012-2022)
CSTS Joint Operation Floating Crane 1-year with 1-year extension contract (2017-2019)
Atlas Resources Barging 5-years contract (2017-2022)
Pelayaran Bahtera Adhiguna (BAG) Barging 9.5-months with 1-year extension contract (2017-2019)
Galley Adhika Arnawama (VDNI) Barging 1-year with 1-year extension contract (2018-2020)
Prolindo Cipta Nusantara Barging 6-months with 6-months extension contract (2019-2019)
Titan Infra Energi Barging 1-year contract (2019-2020)
Barging 6-months contract (2019-2019)
Floating Crane 6+6-months extension contract (2018-2019)
Bumiraya Utama Lines Barging 1-year contract (2019-2020)
Bukit Prima Bahari Barging 1-year contract (2019-2020)
Asian Bulk Logistics (ABL) Floating Crane 1+1+1-year contract (2019-2022)
*) In the process of extension
Transcoal Pacific

3.6 6.3
17.7
43.9 48.2
41.7
33.7 34.6
40.0
51.9
FY10 FY11 FY12 FY13 FY14 FY15 FY16 FY17 FY18 9M19
76.7
121.6 141.4
151.1
135.3
89.8
65.8 68.5 75.4
51.8 60.6
FY10 FY11 FY12 FY13 FY14 FY15 FY16 FY17 FY18 9M18 9M19
34.4
53.2
64.2 71.5
53.0
29.5
14.8 18.4
23.8
14.4
22.0
FY10 FY11 FY12 FY13 FY14 FY15 FY16 FY17 FY18 9M18 9M19
211.2
304.2
345.3 352.7 353.1
307.8
260.5 240.1 239.7 236.7
FY10 FY11 FY12 FY13 FY14 FY15 FY16 FY17 FY18 9M19
Financial Summary
RevenueUS$m
EBITDAUS$m
AssetsUS$m
CashUS$m
10

PART 2. COMPANY’S PERFORMANCE
11

Indonesia Coal Market Forecast
• Source: ESDM, Asosiasi Pertambangan Batubara Indonesia (APBI), and team analysis
458 416548 548
2016A
461
2017A2014A 2015A 2019F2018A
434
Indonesia coal productionExport
433Mt
TransshipmentInland coal terminal
Domestic sale
Domestic
115Mt
Direct barge
shipment inter
island
Indonesia Coal Flow
Top Tier
Non – top tier
Total National
Add. Transshipment
Less. Inland terminal
Potential market
Coal production (Mt)
278.2
154.8
433.0
2018A
115.0
Domestic
433.0
Export
115.0
316.0
(112.0)
319.0
Barging
433.0
(115.0)
318.0
FC
458416
434461
548 548
2019F2018A2014A 2017A2016A2015A
4.1%
4.1%
Export
117Mt
Export
316Mt
12

Macroeconomic Forecast
Source: ESDM, Indonesia Coal Book, Bank of Indonesia, news publication and team analysis
40.7
37.3
30.7 32.0
42.8 42.0
35.3
9M192017A2013A 2014A 2015A 2018A2016A
ICI-4
382327 344 364
433 433
7689 90 97
115 115
Domestic
2016A
416
2019F2014A 2017A2015A
548
2018A
Export
458434
461
548
US$ to IDRKCoal Index
Indonesia Coal Production
12.2 12.413.8 13.4 13.5 14.3 14.1
10.511.9
13.4 13.3 13.4
2013A 2014A
Avr Rate
2015A 2016A 2017A
14.2
2018A 9M19
Mid Rate
98.192.5
49.6
44.151.3
64.656.3
2018A2015A2013A 2014A 2017A2016A 9M19
WTI
Fuel Price
14.2
13

9M19 Performance Highlights
*) exclude volume in Time Charter (TC) Contract
Description 2018A LTM 2019 9M19 9M18 % Change
Barging Volume (Mt) *) 22.1 25.3 19.1 16.0 19.8
FC Volume (Mt) 11.8 12.0 8.6 8.3 3.1
Description
(In US$m)2018A LTM 2019 9M19 9M18 %Change
Revenue 75.4 84.1 60.6 51.8 16.9
Gross Profit 4.9 14.4 11.7 2.1 446.3
Operating Profit (4.8) 3.9 3.8 (4.9) 175.9
Net Interest (3.4) (3.4) (2.3) (2.3) (0.0)
NPAT (17.1) (6.2) 0.6 (10.4) 105.3
EBITDA 23.8 31.4 22.0 14.4 52.5
Capex 17.5 7.4 5.7 15.8 (64.1)
Cash 40.0 51.9 51.9 34.5 50.6
Total Assets 239.7 236.7 236.7 249.2 (5.0)
Total Debt 54.2 52.1 52.1 54.8 (4.9)
Total Equity 171.4 170.6 170.6 177.8 (4.0)
Debt to Equity (x) 0.3 0.3 0.3 0.3
Debt to EBITDA (x) 2.3 1.7 2.4 3.8
EBITDA to Interest (x) 6.9 9.1 9.4 6.1 14

Barging Highlights
Revenue (%)
Description (in US$m
unless indicated)9M19 9M18 % Change
Revenue 42.8 38.3 11.8
Cost 34.6 37.8 (8.5)
Gross Profit 8.2 0.2 3,813.1
Gross Profit (%) 19.1 0.5 3,399.3
Volume (Mt) 19.1 16.0 19.8
# Sets 69.0 74.0 (6.8)9.5 9.8
90.5 90.2
9M19
Contract
9M18
Spot
42.8 38.3
Revenue(In US$m)
9M19 9M18 % Change
Adaro 7.7 8.4 (8.5)
Cotrans 8.2 7.7 5.9
PCN 2.1 - 100.0
BAG 2.9 3.6 (19.2)
Titan 1.8 0.4 330.0
TCP 1.8 1.1 66.7
BPB 1.3 - 100.0
Others (inc TC) 13.0 13.4 (2.7)
Spot 4.1 3.7 8.6
Total 42.8 38.3 11.8
Contracts DurationBacklog
(US$m)Remarks
Adaro 2010-2019 0.7 In the process of extension
Cotrans 2014-2023 26.2
BPB 2019-2020 1.4
Atlas 2017-2022 5.1
Berau 2017-2022 2.0 TC Basis
Titan Infra Energi 2019-2020 1.5
Galley Adhika Arnawama
(VDNI) 2018-2020 0.6 TC Basis
Bumiraya Utama Lines 2019-2020 1.8
Muji Lines (Bayan Wahana) 2019-2019 0.7
Prolindo Cipta Nusantara 2019-2019 0.5
40.6 Total 15

FC Highlights
Revenue (%)Description (in US$m
unless indicated)9M19 9M18 % Change
Revenue 17.8 13.6 31.3
Cost 14.3 11.9 20.2
Gross Profit 3.5 1.6 111.1
Gross Profit (%) 19.5 12.1 60.9
Volume (Mt) 8.6 8.3 3.1
# Sets 6.0 6.0 -
34.0 34.8
66.0 65.2
17.8
9M19
Contract
9M18
Spot
13.6
Revenue(In US$m)
9M19 9M18 % Change
Kideco 5.5 5.2 7.2
Berau 2.5 2.5 1.4
Asia Bulk Logistics 2.4 - 100.0
CSTS 1.4 1.2 9.5
Others - Spot 6.1 4.7 28.1
Total 17.8 13.6 31.3
16
Contracts DurationBacklog
(US$m)Remarks
Berau 2010-2019 9.3 TC Basis
Kideco 2014-2023 22.8
CSTS 2017-2019 0.2 TC Basis
Transcoal Pacific 2018-2019 9.8
42.0 Total

Fuel 22.9%
Labor 12.0%
R&M 6.3%
Depreciation 38.3%
Vessel Rental 0.2%
Others 20.4%
Fuel 18.3%
Labor 13.1%
R&M 9.2%
Depreciation 36.6%
Vessel Rental 4.2%
Others 18.6%
Direct Costs
9M19 9M18
Cost Barging – FC (%)9M19 vs 9M18
Description
(in US$m)9M19 9M18 % Change
Fuel 9.0 11.4 (21.2)
Labor 6.4 5.9 7.6
R&M 4.5 3.1 43.2
Depreciation 17.9 19.0 (5.9)
Vessel Rental 2.0 0.1 1,657.1
Others 9.1 10.1 (9.9)
Total 48.9 49.7 (1.6)
29.324.0
70.776.0
9M19 9M18
Barging
100.0
FC
100.0
17
PART 3. APPENDIX
18
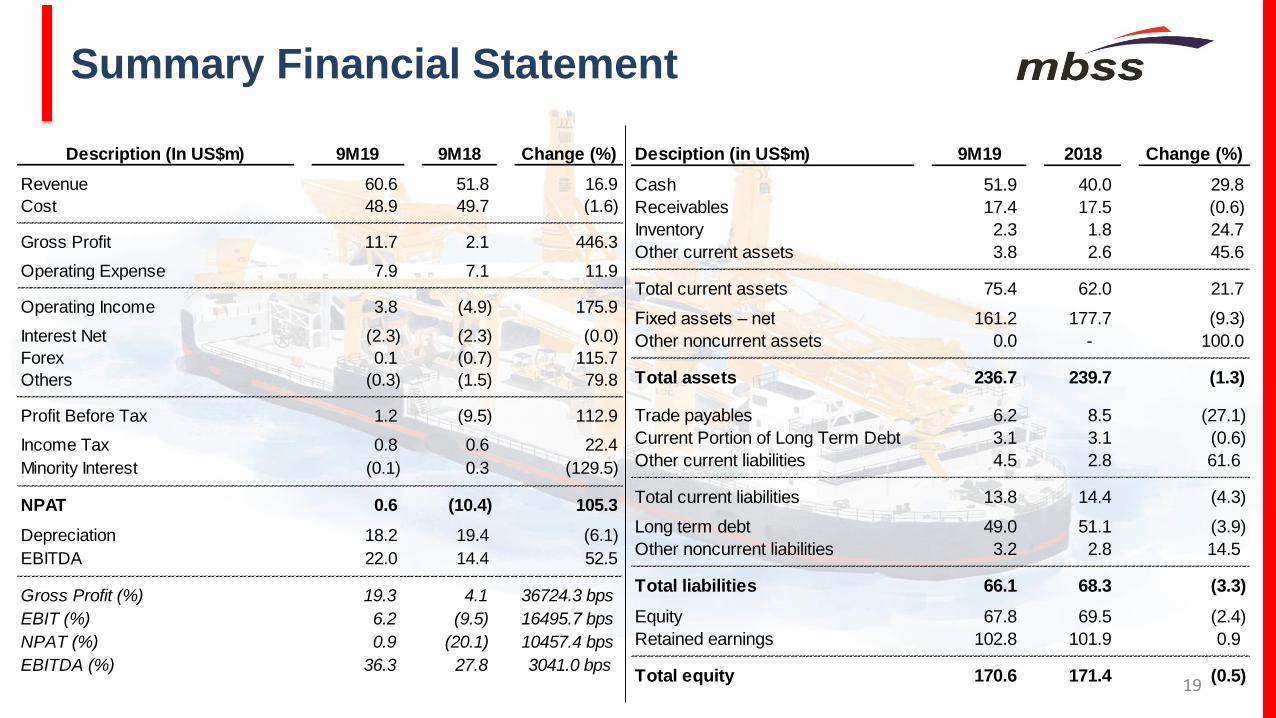
Summary Financial Statement
Description (In US$m) 9M19 9M18 Change (%)
Revenue 60.6 51.8 16.9
Cost 48.9 49.7 (1.6)
Gross Profit 11.7 2.1 446.3
Operating Expense 7.9 7.1 11.9
Operating Income 3.8 (4.9) 175.9
Interest Net (2.3) (2.3) (0.0)
Forex 0.1 (0.7) 115.7
Others (0.3) (1.5) 79.8
Profit Before Tax 1.2 (9.5) 112.9
Income Tax 0.8 0.6 22.4
Minority Interest (0.1) 0.3 (129.5)
NPAT 0.6 (10.4) 105.3
Depreciation 18.2 19.4 (6.1)
EBITDA 22.0 14.4 52.5
Gross Profit (%) 19.3 4.1 36724.3 bps
EBIT (%) 6.2 (9.5) 16495.7 bps
NPAT (%) 0.9 (20.1) 10457.4 bps
EBITDA (%) 36.3 27.8 3041.0 bps
Desciption (in US$m) 9M19 2018 Change (%)
Cash 51.9 40.0 29.8
Receivables 17.4 17.5 (0.6)
Inventory 2.3 1.8 24.7
Other current assets 3.8 2.6 45.6
Total current assets 75.4 62.0 21.7
Fixed assets – net 161.2 177.7 (9.3)
Other noncurrent assets 0.0 - 100.0
Total assets 236.7 239.7 (1.3)
Trade payables 6.2 8.5 (27.1)
Current Portion of Long Term Debt 3.1 3.1 (0.6)
Other current liabilities 4.5 2.8 61.6
Total current liabilities 13.8 14.4 (4.3)
Long term debt 49.0 51.1 (3.9)
Other noncurrent liabilities 3.2 2.8 14.5
Total liabilities 66.1 68.3 (3.3)
Equity 67.8 69.5 (2.4)
Retained earnings 102.8 101.9 0.9
Total equity 170.6 171.4 (0.5) 19
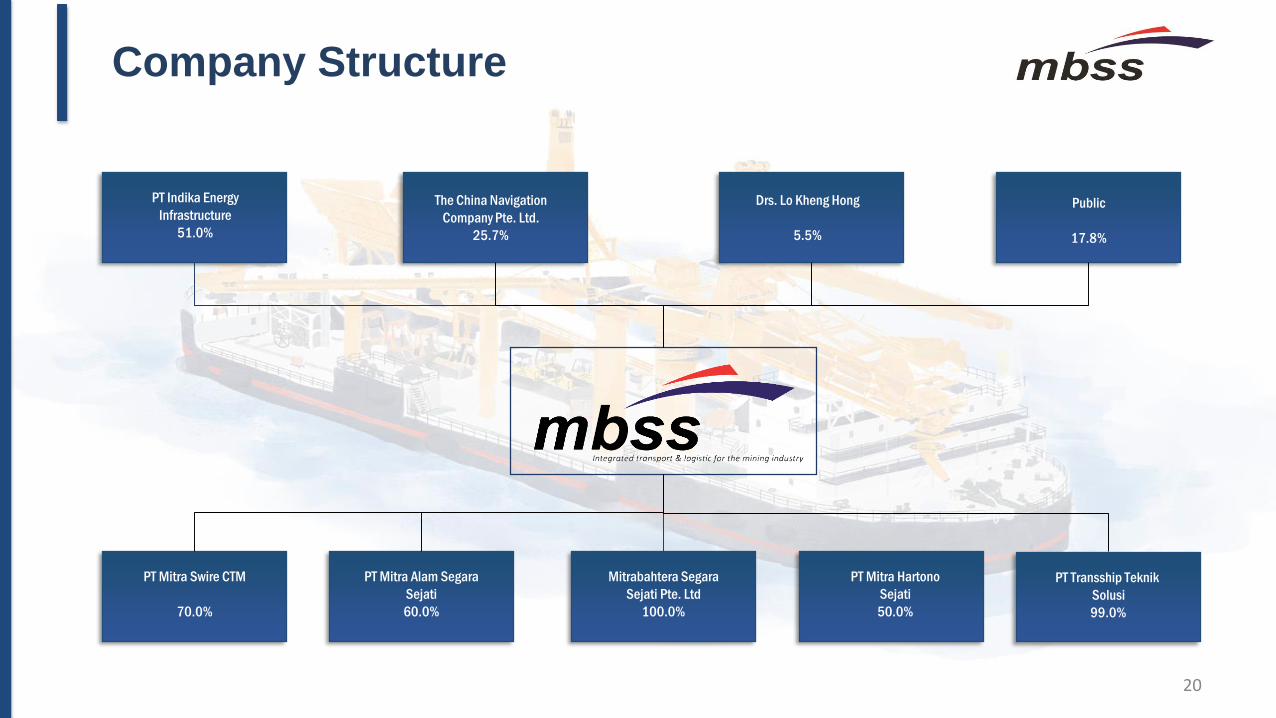
Company Structure
Drs. Lo Kheng Hong
5.5%
PT Mitra Swire CTM
70.0%
PT Mitra Alam Segara
Sejati
60.0%
Mitrabahtera Segara
Sejati Pte. Ltd
100.0%
PT Mitra Hartono
Sejati
50.0%
PT Indika Energy
Infrastructure
51.0%
Public
17.8%
PT Transship Teknik
Solusi
99.0%
The China Navigation
Company Pte. Ltd.
25.7%
20

Shares Performance and Dividend Payment History
52-week share performance (Sep’18- Sep’19)
HighestLowestAverageAvg. Vol.
725470586
1.683K
Dividend payment
Payment date18 Jul. 201231 Jul. 201319 Jun. 201427 May 2015
Dividend distributedRp43 per shareRp50 per share
US$0.0055 per shareUS$0.00920275/share
Payout ratio30.5%24.6%25.0%80.0%
21
0
200
400
600
800
1000
1200
1400
1600
1800
Jan-12 Jan-13 Jan-14 Jan-15 Jan-16 Jan-17 Jan-18 Jan-19
Thank You
PT Mitrabahtera Segara Sejati Tbk
Menara Karya 12th Floor
JL. H.R. Rasuna Said block X-5
Kav. 1-2
Jakarta, Indonesia 22