Embed Size (px)
Citation preview
8/4/2019 9798 Warm Event in the South China Sea
http://slidepdf.com/reader/full/9798-warm-event-in-the-south-china-sea 1/7
The 19971998 warm event
in the South China Sea
WANG Dongxiao1, XIE Qiang
1, DU Yan
1,2,
WANG Weiqiang1,2 & CHEN Ju1
1. Laboratory of Tropical Marine Environmental Dynamics, South China
Sea Institute of Oceanology, Chinese Academy of Sciences, Guang-zhou 510301, China;
2. College of Marine Environment, Ocean University of Qingdao,
Qingdao 266003, China
Correspondence should be addressed to Wang Dongxiao (e-mail:[email protected])
Abstract A strong warm event happens during spring
1997 to spring 1999 in the South China Sea. Its intensity and
duration show that it is the strongest event on the record
over the past decades. It also corresponds with the severe
flood over the valley of the Yangtze River and a couple of
marine environmental events. This note addressed the evolu-
tion process by using several data sets, such as sea surfacetemperature, height and wind stress in addition to subsur-
face temperature. The onset of the warm event almost
teleconnects with the El Niño event in the tropical Pacific
Ocean. Summer monsoon is stronger and winter monsoon is
weaker in 1997 so that there are persistent westerly
anomalies in the South China Sea. During the development
phase, the warm advection caused by southerly anomalies is
the major factor while the adjustment of the thermocline is
not obvious. Subsequently, the southerly anomalies decay
and even northerly anomalies appear in the summer of 1998
resulting from the weaker than normal summer monsoon in
1998 in the South China Sea. The thermocline develops
deeper than normal, which causes the downwelling pattern
and the start of the maintaining phase of the warm event.
Temperature anomalies in the southern South China Sea
begin to decay in the winter of 19981999 and this warm
event ends in the May of 1999.
Keywords: South China Sea, advection mode, downwelling mode,
prolonged warm event.
The interannual variability of the monsoon system isan important topic in the climate variability and predict-ability program (CLIVAR), because the monsoon hassome effects on the other important climate events. For example, the Asian monsoon system, especially the EastAsian monsoon that includes the monsoon of the SouthChina Sea (SCS) holds the interaction with the ENSO
events
[1]
. The SCS is a tropical marginal sea with prevail-ing monsoon, and water exchanges occur between theSCS and the western Pacific Ocean and the IndianOcean[2]. Since oceanic and atmospheric circulations inthese regions have obvious interannual variability, thelocal air-sea system in the SCS certainly will be involved.It is proved by much observational evidence that the cli-mate change in the South China Sea synchronizes with therhythm of the tropical climate system, such as the ENSOevent in the tropical Pacific Ocean
[3]. Wang et al.
[4]studied
the sea surface temperature (SST) interannual variabilityin the SCS, from which the sea temperature oscillationwith a period of 40 months was obtained. It was con-cluded that the SST interannual variability in the SCS is aresponse of the wind stress anomalies, e. g. when south-erly anomalies are prevailing in the SCS, SSTs show posi-
tive anomalies; when northerly anomalies are prevailing,SSTs show negative anomalies.
SST, wind stress, sea surface height and the thermo-cline in the SCS are studied in this note by qualitativeanalysis and quantitative diagnosis regarding the 19971998 warm event. It is found that during the 19971998SCS warm event, the positive correlation between SSTAand meridional anomalies come into existence only on theonset phase and development phase. When the warmevent turns into the maintaining phase, owing to the endof the El Niño event, the southerly anomalies decay, andeven northerly anomalies can be seen. The result fromquantitative diagnosis shows that the prolonged maintain-ing of the warm event is because of the occurrence of thedownwelling pattern, that is, abnormal downwellingmakes the thermocline deepen and therefore the positiveSSTA can be extremely maintained in the SCS till thewinter of 19981999.
1 Data sets
() SST data. The interpolation global weeklySST dataset from in situ SST data and satellite SST re-trievals on a 11 grid are analyzed. The monthlyanomalies can be obtained by removing the climatologicmonthly based on the 18 years’ dataset (19821999)
[5].
() Wind data. 11 pseudo-wind stress mon-thly data are provided by FSU, USA
[6].
(
) Heat flux comes from NCEP reanalyzed data-set[7]
.() 52 long grid XBT data on the upper ocean
(0400 m), monthly sea temperature data on 11 standardlevels
[8].
() Sea surface height anomalies (SSHAs) datafrom TOPEX remote sensing. SSHAs on along track areinterpolated to the 0.5°0.5° resolution. Those data arealso used to retrieve the geostrophic current.
2 Evolution of the warm event
In order to reduce the uncertainty of analyses of the
interannual variability in the SCS, the averaged SSTA
over the entire SCS is defined as the SCS temperature
index. It can be found from the figure of the SCS tem- perature index and southern oscillation index (SOI) during
19821999 that a local event with the same sign always
happens in the SCS in a certain period after each warm or
cold event in the tropical Pacific Ocean. Wang et al.[4]
analyzed the lag correlation between the SSTA in the cen-
tral SCS and SOI during 19451989, and the results
showed that the interannual variability in the SCS lags 5
months behind SOI. Although different SST data are
Chinese Science Bulletin Vol. 47 No. 14 July 2002 1221
8/4/2019 9798 Warm Event in the South China Sea
http://slidepdf.com/reader/full/9798-warm-event-in-the-south-china-sea 2/7
NOTES
adopted here, 5 months lag can be found obviously from
fig. 1(a). From the SCS temperature index during 1982
1999, however, there is no firmly corresponding relation-ship on intensity between the warm events in the SCS and
ENSO events. For example, no warm event of SCS hap-
pened after the strong ENSO event of 19821983, while
a warm event happened after the ENSO of 19861987.
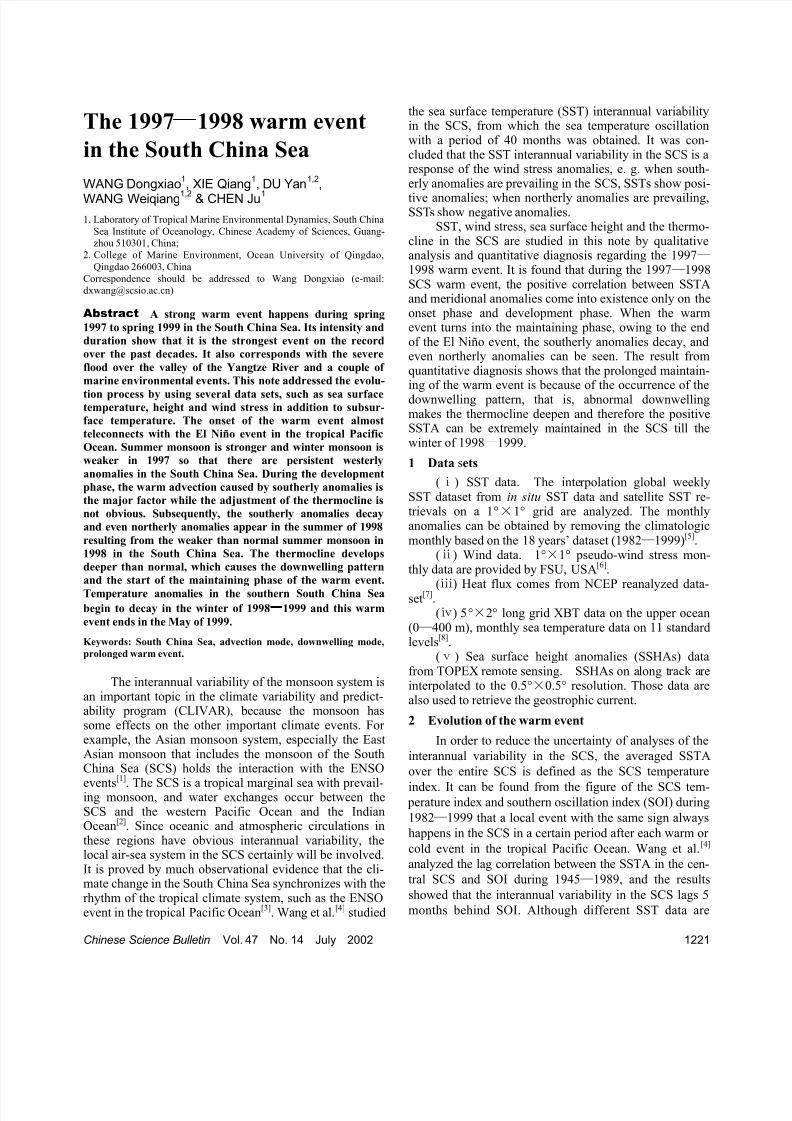
Fig. 1. Time series of SSTA and the net heat fluxes (both averaged over the entire SCS), SOI. (a) Long duration from Jan. 1982 to Dec. 1999; (b)short duration from Jan. 1996 to Dec. 1999. SOI is the normalized pres-
sure difference between Tahiti and Darwin. Net heat fluxes provided
NCEP reanalysis data. The curve with open cycle denotes SOI. The bar is for SSTA. The solid line shows the net heat flux (w/m2, scaled by 10,
positive values mean ocean gains heat).
The 19971998 warm event is the strongest on re-
cord over the past decades. The duration when the mean
SSTA of the whole region is above 0.5 maintains
nearly 18 months, while the regional SSTAs in the SCS
that are more than 0.5 last more than two years. The
onset and development of 19971998 warm event in the
SCS are corresponding with the development of theENSO event in the tropical Pacific Ocean. Both of themreach the peak nearly at the same time in the winter of
19971998 (actually January of 1998, fig. 1(b)).
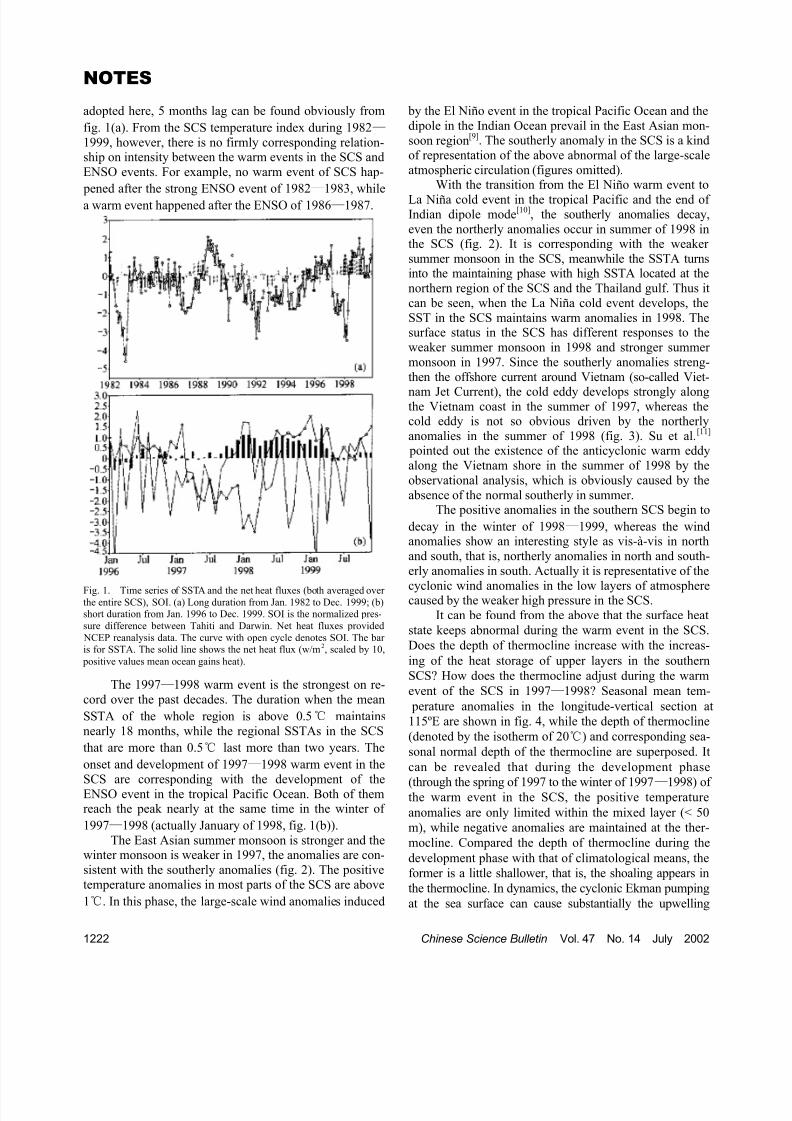
The East Asian summer monsoon is stronger and thewinter monsoon is weaker in 1997, the anomalies are con-
sistent with the southerly anomalies (fig. 2). The positive
temperature anomalies in most parts of the SCS are above
1. In this phase, the large-scale wind anomalies induced
by the El Niño event in the tropical Pacific Ocean and the
dipole in the Indian Ocean prevail in the East Asian mon-
soon region[9]. The southerly anomaly in the SCS is a kind
of representation of the above abnormal of the large-scale
atmospheric circulation (figures omitted).With the transition from the El Niño warm event to
La Niña cold event in the tropical Pacific and the end of Indian dipole mode
[10], the southerly anomalies decay,
even the northerly anomalies occur in summer of 1998 inthe SCS (fig. 2). It is corresponding with the weaker
summer monsoon in the SCS, meanwhile the SSTA turnsinto the maintaining phase with high SSTA located at the
northern region of the SCS and the Thailand gulf. Thus it
can be seen, when the La Niña cold event develops, the
SST in the SCS maintains warm anomalies in 1998. Thesurface status in the SCS has different responses to the
weaker summer monsoon in 1998 and stronger summer
monsoon in 1997. Since the southerly anomalies streng-
then the offshore current around Vietnam (so-called Viet-
nam Jet Current), the cold eddy develops strongly alongthe Vietnam coast in the summer of 1997, whereas thecold eddy is not so obvious driven by the northerly
anomalies in the summer of 1998 (fig. 3). Su et al.[11]
pointed out the existence of the anticyclonic warm eddy
along the Vietnam shore in the summer of 1998 by the
observational analysis, which is obviously caused by the
absence of the normal southerly in summer.The positive anomalies in the southern SCS begin to
decay in the winter of 19981999, whereas the windanomalies show an interesting style as vis-à-vis in north
and south, that is, northerly anomalies in north and south-
erly anomalies in south. Actually it is representative of the
cyclonic wind anomalies in the low layers of atmospherecaused by the weaker high pressure in the SCS.
It can be found from the above that the surface heat
state keeps abnormal during the warm event in the SCS.
Does the depth of thermocline increase with the increas-
ing of the heat storage of upper layers in the southern
SCS? How does the thermocline adjust during the warm
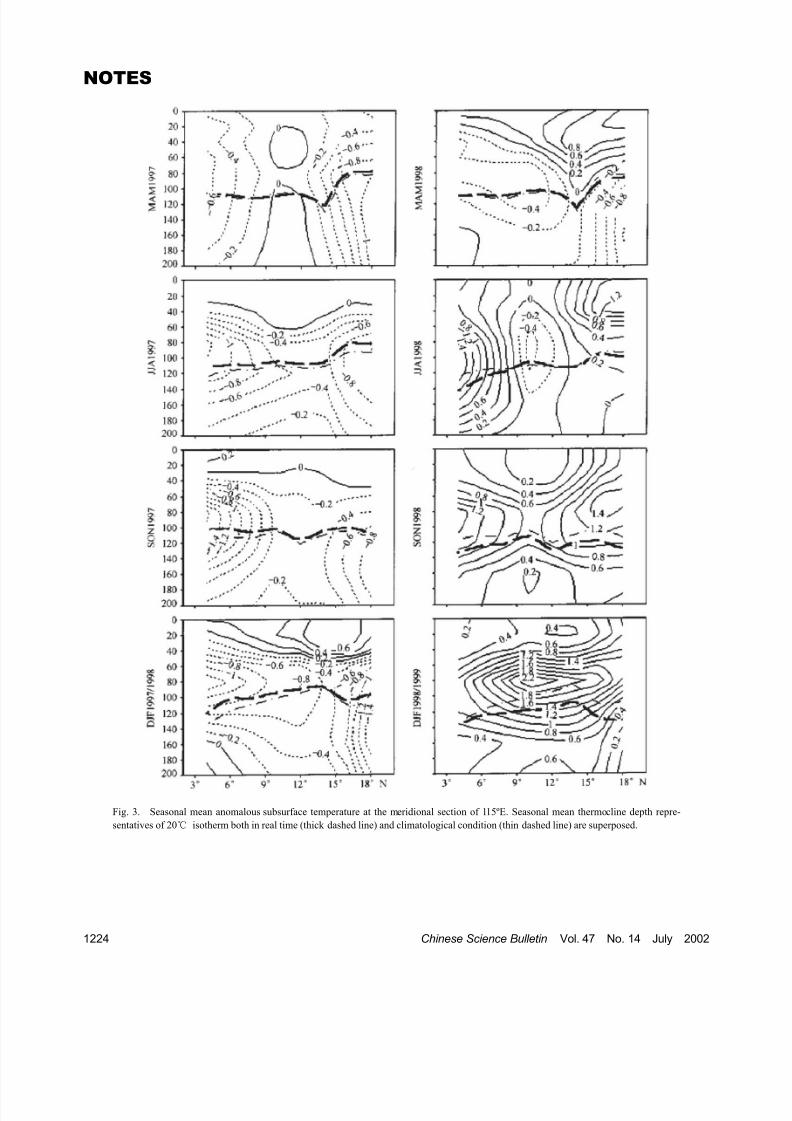
event of the SCS in 19971998? Seasonal mean tem-
perature anomalies in the longitude-vertical section at
115ºE are shown in fig. 4, while the depth of thermocline
(denoted by the isotherm of 20) and corresponding sea-
sonal normal depth of the thermocline are superposed. It
can be revealed that during the development phase
(through the spring of 1997 to the winter of 19971998) of the warm event in the SCS, the positive temperature
anomalies are only limited within the mixed layer (< 50
m), while negative anomalies are maintained at the ther-
mocline. Compared the depth of thermocline during the
development phase with that of climatological means, the
former is a little shallower, that is, the shoaling appears in
the thermocline. In dynamics, the cyclonic Ekman pumping
at the sea surface can cause substantially the upwelling
1222 Chinese Science Bulletin Vol. 47 No. 14 July 2002
8/4/2019 9798 Warm Event in the South China Sea
http://slidepdf.com/reader/full/9798-warm-event-in-the-south-china-sea 3/7
F i g . 2
.
S e a s o n a l m e a n S S T A a n d w i n d s t r e s s a n o m a l i e s i n t h e S C S i n 1 9 9 7 / 1 9 9 8 .
W i n d s t r e s s e s a r e
p r o v i d e d b y F S U ,
U S A .
Chinese Science Bulletin Vol. 47 No. 14 July 2002 1223
8/4/2019 9798 Warm Event in the South China Sea
http://slidepdf.com/reader/full/9798-warm-event-in-the-south-china-sea 4/7
NOTES
Fig. 3. Seasonal mean anomalous subsurface temperature at the meridional section of 115ºE. Seasonal mean thermocline depth repre-
sentatives of 20 isotherm both in real time (thick dashed line) and climatological condition (thin dashed line) are superposed.
1224 Chinese Science Bulletin Vol. 47 No. 14 July 2002
8/4/2019 9798 Warm Event in the South China Sea
http://slidepdf.com/reader/full/9798-warm-event-in-the-south-china-sea 5/7
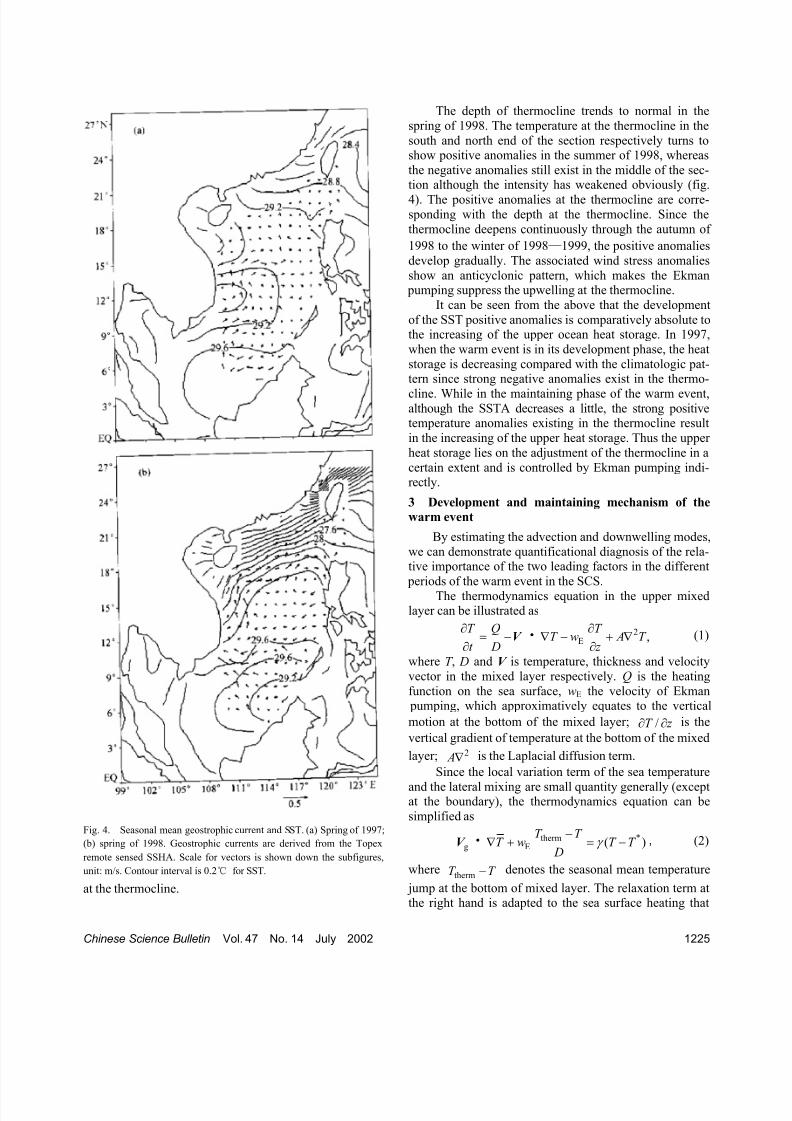
Fig. 4. Seasonal mean geostrophic current and SST. (a) Spring of 1997;
(b) spring of 1998. Geostrophic currents are derived from the Topex
remote sensed SSHA. Scale for vectors is shown down the subfigures,
unit: m/s. Contour interval is 0.2 for SST.
at the thermocline.
The depth of thermocline trends to normal in the
spring of 1998. The temperature at the thermocline in the
south and north end of the section respectively turns toshow positive anomalies in the summer of 1998, whereas
the negative anomalies still exist in the middle of the sec-tion although the intensity has weakened obviously (fig.
4). The positive anomalies at the thermocline are corre-sponding with the depth at the thermocline. Since the
thermocline deepens continuously through the autumn of
1998 to the winter of 19981999, the positive anomalies
develop gradually. The associated wind stress anomalies
show an anticyclonic pattern, which makes the Ekman pumping suppress the upwelling at the thermocline.
It can be seen from the above that the development
of the SST positive anomalies is comparatively absolute tothe increasing of the upper ocean heat storage. In 1997,
when the warm event is in its development phase, the heat
storage is decreasing compared with the climatologic pat-tern since strong negative anomalies exist in the thermo-
cline. While in the maintaining phase of the warm event,although the SSTA decreases a little, the strong positivetemperature anomalies existing in the thermocline result
in the increasing of the upper heat storage. Thus the upper
heat storage lies on the adjustment of the thermocline in a
certain extent and is controlled by Ekman pumping indi-rectly.
3 Development and maintaining mechanism of the
warm event
By estimating the advection and downwelling modes,
we can demonstrate quantificational diagnosis of the rela-tive importance of the two leading factors in the different
periods of the warm event in the SCS.
The thermodynamics equation in the upper mixedlayer can be illustrated as
T Q
t D
V
2E ,
T T w A T
z
(1)
where T , D and V is temperature, thickness and velocity
vector in the mixed layer respectively. Q is the heating
function on the sea surface, wE the velocity of Ekman pumping, which approximatively equates to the vertical
motion at the bottom of the mixed layer; is the
vertical gradient of temperature at the bottom of the mixed
layer;
/T z
2 A is the Laplacial diffusion term.
Since the local variation term of the sea temperature
and the lateral mixing are small quantity generally (exceptat the boundary), the thermodynamics equation can be
simplified as
gV
*thermE (
T T T w T T
D
)
T
(2)
wherethermT denotes the seasonal mean temperature
jump at the bottom of mixed layer. The relaxation term atthe right hand is adapted to the sea surface heating that
Chinese Science Bulletin Vol. 47 No. 14 July 2002 1225
8/4/2019 9798 Warm Event in the South China Sea
http://slidepdf.com/reader/full/9798-warm-event-in-the-south-china-sea 6/7
NOTES
probably gets involved in complex physics. T *
is the cli-
matological value of the sea surface temperature, so
is SSTA.*(T T )
Is the advection mode dominant in the development phase of the warm event in the SCS?
The SSTA develops fast in the spring, summer andautumn of 1997, while the southerly anomalies maintain
the same at the sea surface. This relationship between the
wind anomalies and SSTA in the SCS has been discussed
by many previous studies. Since the air-sea heat flux var-
ies with the season in this phase, it could not become the
major factor that drives the development of SSTA con-
tinuously (fig. 1(b)); decreasing of the wind stirring has
the same situation. At the same time, the rising of the
thermocline reveals that the downwelling factor has no
positive contribution to the development of the warm
event. Therefore, the warm advection induced by the
southerly anomalies may be the dominant factor of the
development of the warm event.Taking the spring of 1997 for example, the geostro-
phic current in which the climatological mean has been
removed can be derived from the TOPEX remote sensed
SSHA. Since the northward geostrophic current is pre-
vailing at that time, the structure of the basin-wide en-
closed cyclonic or anticyclonic circulation is not obvious
(fig. 3). Calculated from fig. 5(a), the zonal averaged me-
ridional component of the geostrophic current is about 0.2
m/s. Figs. 4 and 5 display the meridional gradient of SST,
which is 1 per 4 longitude degrees in the spring of
1997, and SSTA is 1. If the relaxation time scale of SST
is 50 days,*
g ~ ( ( ))T
O V O T T y
. (3)
Therefore, in the development phase of the warm
event in the SCS (through the spring in 1997 to the winter
of 19971998), the sea temperature status is controlled
by the horizontal advection mode. Another evidence is
that the adjusting of thermocline is not significant in this
phase (fig. 4) and there is no systematic sea surface height
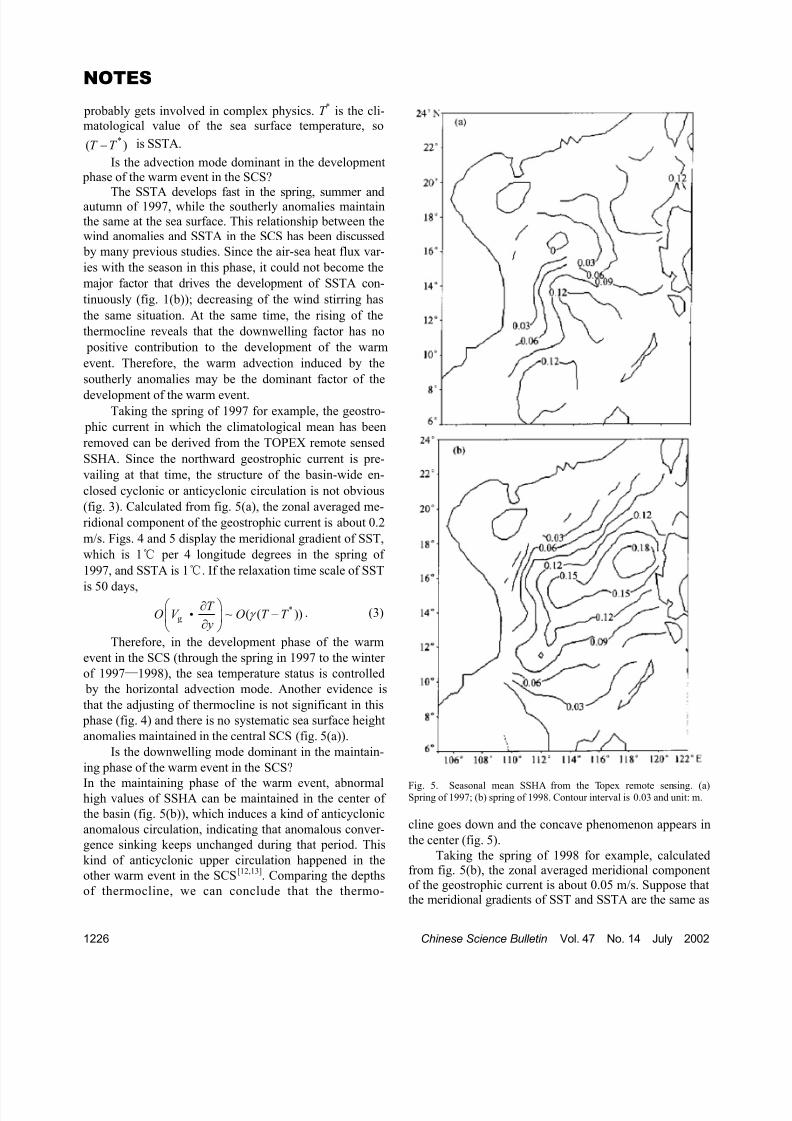
anomalies maintained in the central SCS (fig. 5(a)).
Is the downwelling mode dominant in the maintain-
ing phase of the warm event in the SCS?
In the maintaining phase of the warm event, abnormalhigh values of SSHA can be maintained in the center of
the basin (fig. 5(b)), which induces a kind of anticyclonic
anomalous circulation, indicating that anomalous conver-
gence sinking keeps unchanged during that period. This
kind of anticyclonic upper circulation happened in the
other warm event in the SCS[12,13]
. Comparing the depths
of thermocline, we can conclude that the thermo-
Fig. 5. Seasonal mean SSHA from the Topex remote sensing. (a)Spring of 1997; (b) spring of 1998. Contour interval is 0.03 and unit: m.
cline goes down and the concave phenomenon appears in
the center (fig. 5).
Taking the spring of 1998 for example, calculatedfrom fig. 5(b), the zonal averaged meridional component
of the geostrophic current is about 0.05 m/s. Suppose thatthe meridional gradients of SST and SSTA are the same as
1226 Chinese Science Bulletin Vol. 47 No. 14 July 2002
8/4/2019 9798 Warm Event in the South China Sea
http://slidepdf.com/reader/full/9798-warm-event-in-the-south-china-sea 7/7
those in 1997. Ekman pumping can be calculated from
wind stress curl, which is 8107m/s.
therm( )T T / D is
0.7/10 m based on fig. 4. Thus,
*g
*thermE
( ( )),
~ ( ( )).
T O V O T T
y
T T O w O T T
D
(4)
Therefore, the sea temperature is controlled by the
downwelling mode in the maintaining phase (from the
spring of 1998 to the winter of 19981999) of the warm
event in the SCS.
4 Conclusions
Possible interpretation can be approached about the
19971998 warm event in the SCS based on the above
analysis on the SST, SSH, thermocline depth and the de-
rived geostrophic current and Ekman pumping.
The summer monsoon is stronger in the summer of
1997 in the SCS induced by the El Niño event in the
tropical Pacific Ocean and Indian dipole. There are south-
erly anomalies occurring at the sea surface of the SCS, so
the resulting warm advection makes the SCS warmer than
normal. The monsoon in the winter of 19971998 re-
laxes, and the warm event continues to develop. Thereaf-
ter the El Niño event ends and La Niña event onsets the
wind anomalies at sea surface decay continuously while
the positive SSHA maintains the same in the basin center,
which induces the large-scale circulation convergence and
downwelling. The process restrains the upwelling at the
thermocline and favorites positive SSTA remaining in the
SCS. In a certain phase of the warm event, the significant
adjustment occurs at the thermocline. Since the thermo-
cline has long memory of thermal signals, the warm event
can be maintained for a long time. The discussion above
answers why the 19971998 warm event in the SCS is a
special one. Further investigation on the biological effect
caused by the warm event may cast a piece of light to the
scientific issue that is relevant to the marine environ-
mental abnormal events in the SCS in 1998. For example,
observational evidence shows that the warm status off
Guangdong Province probably contributes to the red tide
occurring near Hong Kong[14]
. The puzzle whether there
exists any relationship between the warm event in the SCS
and the bleaching coral which happened off the Hainan
Island in 1998 still remains open.Since the intrusion of Kuroshio has important effect
on the northern circulation in the SCS, interannual vari-
ability of Kuroshio caused by ENSO event has some ef-
fect to a certain extent on the warm event. The local
air-sea interaction in the SCS has pronounced feedback on
seasonal and interannual climate changing in the SCS[4]
.
The discussion of these two factors has been beyond this
note, and it should be analyzed later.
Acknowledgements This work was supported by the Knowledge
Innovation Project of the Chinese Academy of Sciences (Grant No.KZCX2-205), the Ministry of Science and Technology (Grant Nos.
G1999043806 and 2001DIA50041) and National Natural Science Foun-
dation of China (Grant No. 40106002).
References
1. Webster, P. J., Yang, S., Monsoon and ENSO: Selectively interac-
tive systems, Q. J. R. Meteorol. Soc., 1992, 118: 877.
2. Qu, T., Mitsudera, H., Yamagata, T., The intrusion of the North
Pacific waters into the South China Sea, J. Geophys. Res., 2000,
105: 6415.
3. Xie, Q., Yan, L. N., Hou, Y. J. et al., Long-term oscillations in sea
surface temperatures in Nansa Islands and the warm pool and their
coupling process, Oceanologia et Limnologia Sinica (in Chinese),
1999, 30(1): 88.
4. Wang, D. X., Zhou, F. X., Qin, Z. H., Study on air-sea interaction
on the interannual timescale in the South China Sea, Acta Meteo-
rologica Sinica (in Chinese), 1997, 11(1): 45.5. Reynolds, R. W., Smith, T. M., Improved global sea surface tem-
perature analyses using optimum interpolation, J. Climate, 1994,
7: 929.
6. Legler, D. M., Navon, I. M., O’Brien, J. J., Objective analysis of
pseudo-stress over the Indian Ocean using a direct-minimization
approach, Mon. Wea. Rev., 1989, 117: 709.
7. Kalnay, E., The NCEP/NCAR 40-year reanalysis project, Bull.
Amer. Meteor. Soc., 1996, 77: 437.
8. White, W. B., Design of a global observing system for gyre-scale
upper ocean temperature variability, Prog. Oceanogr., 1995, 36:
169.
9. Wu, G. X., Meng, W., Gearing between the Indo-monsoon circula-
tion and the Pacific-Walker circulation and the ENSO, Part I: Data
analyses, Chinese J. Atmos. Sci. (in Chinese), 1998, 22(4): 470.
10. Saji, N. H., Goswami, B. N., Vinayachandran, P. N. et al., A dipole
mode in the tropical Indian Ocean, Nature, 1999, 401(6751): 360.
11. Su, J. L., Xu, J. P., Cai, S. Q. et al., Circulation and Eddies in the
South China Sea, Onset and Evolution of the South China Sea
Monsoon and Its Interaction with Oceans (eds. Ding Yihui & Li
Chongyin), Beijing: China Meteorological Press, 1999, 6672.
12. Wu, C. R., Shaw, P. T., Chao, S. Y., Seasonal and interannual
variations in the velocity field of the South China Sea, Journal of
Oceanography, 1999, 54: 361.
13. Wang Weiqiang, Wang Dongxiao, Shi Ping, Annual and interan-
nual variabilities of dynamic fields in the South China Sea, J.
Tropical Oceanograpgy (in Chinese), 2001, 20(1): 61.
14. Yin, K., Harrison, P. J., Chen, J. et al., Red tides during spring in
Hong Kong: is El Niño responsible? Mar. Ecol. Prog. Ser., 1999,
187: 289.
(Received February 5, 2002)
Chinese Science Bulletin Vol. 47 No. 14 July 2002 1227


![[RTF]goaprintingpress.gov.ingoaprintingpress.gov.in/downloads/9798/9798-45-SI-SUG-1.rtfBrij Pradesh Nirman Sangh Sri Aurobindo Bhavan, 28/352, Gudri M,msoor Khan 149. Democratic Party](https://img.pdfslide.us/doc/110x75/5ad45d247f8b9a0d2d8c4a2a/rtf-pradesh-nirman-sangh-sri-aurobindo-bhavan-28352-gudri-mmsoor-khan-149.jpg)