Embed Size (px)
Citation preview

ANNUAL REPORT 2 0 0 8


A N N U A L R E P O R T 2 0 0 8FISCAL YEAR ENDED DECEMBER 31, 2008

All pictures in this Annual Report are from OneSight and are portraits of some of the thousands ofpeople worldwide who received free eyecare from this Luxottica Group Foundation in 2008. Furtherinformation on the OneSight Foundation can be found in the section dedicated to it on page 31 andon www.onesight.org.

3 <SUMMARY
Chairman’s letter to shareholders 5
Financial highlights 6
Luxottica Group 7Profile 9History 10Mission and strategy 12Operations 14Brand portfolio 17Wholesale distribution 24Retail distribution 25Structure of the Group 28OneSight, Luxottica Group Foundation 31
Annual review 2008 33Key events 35Financial overview 36Outlook 41Risk management 43Human resources 45
Consolidated financial statements under US GAAP 49Consolidated statement of income 51Consolidated balance sheet 52Consolidated statement of shareholders’ equity 54Consolidated statement of cash flows 56Notes to consolidated financial statements 59Statement of the officer responsible for preparing Company’s financial reports 99Independent Auditor’s Report 100
Annexes 1032004-2008 financial highlights 1042007-2008 quarterly results 104Statement of changes in net financial position 105Share capital and dividend per ordinary share (ADS) 1062000-2008 evolution of number of stores 1071990-2008 Luxottica ADS and ordinary share performances 1081995-2008 average Euro/US$ exchange rate 110Non US GAAP measures 111Reconciliation of consolidated income statement prepared according to US GAAP and IAS/IFRS 114
Key contacts and addresses 116


Shareholders,
In 2008, our Company once again posted excellent results: with record sales of Euro 5.2 billion and netincome of around Euro 400 million, Luxottica continued to be a world leader, even in times as difficult aslast year.
Credit for this goes above all to the undisputed force of our business model, based on integrationbetween efficient manufacturing platforms, a brand portfolio of the very first order, a highly structured andextensive distribution system, a network of over 6,250 retail locations worldwide and, not least, thesuccessful integration with Oakley, which has already begun, after only one year, to yield major synergiesthat demonstrate the soundness of the operation.
These are strengths that we continued to develop, even in a year as difficult as 2008, which started withgrowth and ended in a slowdown. It’s worth noting, however, that we operate in an industry that’s provingresilient: in 2008, in fact, we did not see high growth rates, but neither did we see any unexpected negativeswings. Above all, the prescription eyewear business, in which we are a world leader, did not show evidentsigns of slowing down.
Over the year, Luxottica managed to react effectively and rapidly. As macro-economic conditionschanged, the Group promptly took measures designed on one hand to boost sales and on the other toimprove efficiency by adapting our cost structure to the new environment.
2008 was a challenging year but we are convinced that we made our Company even stronger and laidthe foundations for further long-term growth, and this without compromising Luxottica’s commitment tohelping the needy, for whom we launched OneSight, the global foundation that combined the Group’sexisting charity structures.
With 20 years of experience, during which nearly seven million people have been helped, OneSight isengaged in recovering and recycling used eyewear, organizing international and local missions clinics todistribute eyewear free of charge, and in the prevention of eye diseases and support for research. Theseare priority objectives that reflect our deep sense of social responsibility and help us move closer to ourultimate aim: people’s visual well-being and satisfaction.
April, 2009
CHAIRMAN’SLETTER TOSHAREHOLDERS
Chairman
5 <
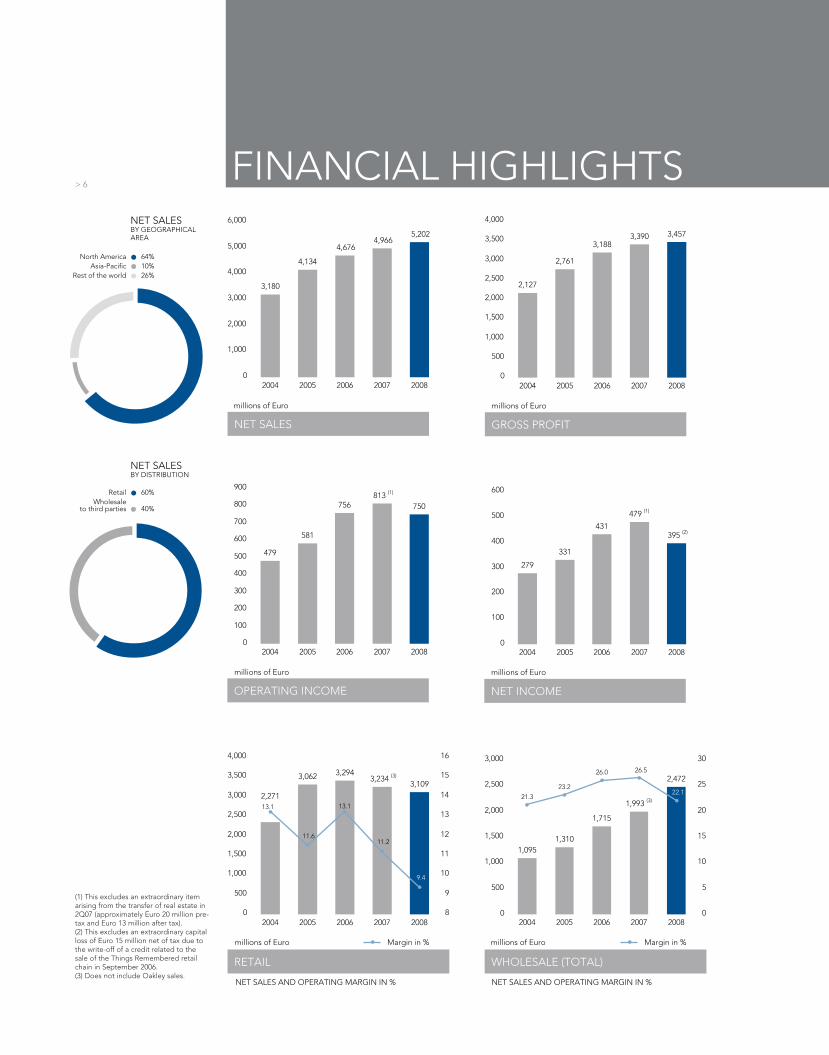
FINANCIAL HIGHLIGHTS
3,180
2004 2005 2006 2007 2008
4,134
4,6764,966
5,202
0
1,000
2,000
3,000
4,000
5,000
6,000
millions of Euro
2004 2005 2006 2007 2008
3,062 3,2943,234 (3)
3,109
13.1
11.6
13.1
11.2
9.4
0
500
1,000
1,500
2,000
2,500
3,000
3,500
4,000
8
9
10
11
12
13
14
15
16
2,271
millions of Euro Margin in %
2004 2005 2006 2007 2008
1,0951,310
1,715
1,993 (3)
2,472
21.3
23.2
26.0 26.5
22.1
0
500
1,000
1,500
2,000
2,500
3,000
0
5
10
15
20
25
30
millions of Euro
NET SALES AND OPERATING MARGIN IN % NET SALES AND OPERATING MARGIN IN %
Margin in %
NET SALES
2004 2005 2006 2007 2008
millions of Euro
479
581
756813 (1)
750
0
100
200
300
400
500
600
700
800
900
OPERATING INCOME
2004 2005 2006 2007 2008
279
331
431
479 (1)
395 (2)
0
100
200
300
400
500
600
millions of Euro
NET INCOME
RETAIL WHOLESALE (TOTAL)
2004 2005 2006 2007 2008
2,127
2,761
3,1883,390 3,457
0
500
1,000
1,500
2,000
2,500
3,000
3,500
4,000
millions of Euro
GROSS PROFIT
NET SALESBY GEOGRAPHICAL AREA
North AmericaAsia-Pacific
Rest of the world
64%10%26%
NET SALESBY DISTRIBUTION
RetailWholesale
to third parties
60%
40%
> 6
(1) This excludes an extraordinary itemarising from the transfer of real estate in2Q07 (approximately Euro 20 million pre-tax and Euro 13 million after tax).(2) This excludes an extraordinary capitalloss of Euro 15 million net of tax due tothe write-off of a credit related to thesale of the Things Remembered retailchain in September 2006.(3) Does not include Oakley sales.

LUXOTTICA GROUP


9 <
With net sales of Euro 5.2 billion in 2008, over 60,000 employees and a solid global presence, Luxottica isa world leader in premium, luxury and sports eyewear.
Founded in 1961 by Leonardo Del Vecchio, the Group is now a vertically integrated organization whosemanufacturing of prescription and sun frames is backed by a wide-reaching wholesale distribution networkand a retail distribution network comprising over 6,250 retail locations, mostly in North America, Asia-Pacific and China.
Product design, development and manufacturing takes place in six production facilities in Italy, two wholly-owned factories in the People’s Republic of China and a sports sunglasses production facility in California,USA. Luxottica also has a small plant in India, serving the local market. In 2008, production reachedapproximately 50 million units, of which around 10 million were produced by the newly acquired Oakleyproduction facility.
Luxottica products are outstanding in terms of design and quality and are known all around the worldthanks to a strong and well-balanced brand portfolio. House brands include Ray-Ban, the world’s bestknown sun brand, Oakley, Vogue, Persol, Oliver Peoples, Arnette and REVO, while its license brandsinclude Bvlgari, Burberry, Chanel, Dolce & Gabbana, Donna Karan, Polo Ralph Lauren, Prada, SalvatoreFerragamo, Tiffany and Versace.
The Group’s wholesale distribution, comprising 130 countries across five continents, has 23 logisticscenters and 30 commercial branches providing direct operations in key markets. Penetration in emergingmarkets and in new channels of distribution, such as shopping centers, airports and railway stations, isparticularly significant.
Direct wholesale operations are complemented by one of the world’s most extensive optical retailnetworks. Luxottica is a leader in the prescription eyewear business in North America with its LensCraftersand Pearle Vision chains, in Asia-Pacific with OPSM, Laubman & Pank and Budget Eyewear, and in Chinawith LensCrafters. In the sun business, the Group operates around 2,300 retail locations in North America,Asia-Pacific, South Africa, Europe and the Middle East, mainly through the Sunglass Hut brand.
In North America, the world’s largest prescription eyewear market in terms of sales, Luxottica also operateslicensed brand points of sale, with over 1,200 stores under the Target Optical and Sears Optical brands.In addition, Luxottica is one of the primary managed vision care operators in North America, throughEyeMed, and the second biggest lens finisher, having a network of seven central laboratories and over 900labs inside LensCrafters stores.
Lastly, control of the Oakley brand, a global icon in optics for performance, provides a powerful presencein both the market as a whole and in the sport channel, in which Luxottica Group operates at both awholesale level and through the single-brand O Stores retail chain.
PROFILE
FOUNDINGLuxottica Group originated in 1961, when Leonardo Del Vecchio set up Luxottica di Del Vecchio e C. S.a.S.,which subsequently became a joint-stock company under the name of Luxottica S.p.A.Having started out as a small workshop, the Company operated until the end of the ‘60s as a contractproducer of dies, metal components and semi-finished goods for the optical industry.Leonardo Del Vecchio gradually widened the range of processes until he had an integrated manufacturingstructure capable of producing a finished pair of glasses.In 1971, Luxottica’s first collection of prescription eyewear was presented at Milan’s MIDO (an internationaloptics trade fair), thus marking Luxottica’s definitive transition from contract manufacturer to successfulindependent producer.
EXPANSION IN WHOLESALE DISTRIBUTIONIn the early ’70s, the Company sold its frames exclusively through wholesale dealers. In 1974, after fiveyears of sustained development of its manufacturing capacity, Del Vecchio understood the importance ofdirectly controlling distribution and started to pursue a strategy of vertical integration, with the goal ofdistributing frames directly onto the market. The first step was to acquire Scarrone S.p.A., which broughtwith it vital knowledge of the Italian market.
International expansion began in the ‘80s with the acquisition of independent distributors, the opening ofbranches and the forming of joint-ventures in key foreign markets. Having started with the opening of thefirst commercial subsidiary in Germany in 1981, the Company’s international wholesale developmentculminated in the acquisition of Avant-Garde Optics Inc., a wholesale distributor in the United Statesmarket.
EYEWEAR: A NEW FRONTIER OF FASHIONIn the meantime, Luxottica continued to invest in its products. The acquisition of La MeccanopticaLeonardo, owner of the Sferoflex brand and an important flexible hinge patent, enabled the Company toboost the image of its products’ quality and increase its market share.
But it wasn’t until the end of the ’80s that eyeglasses, until then perceived as mere sight-correctinginstruments, underwent the crucial evolution into “eyewear.” Continual aesthetic focus on everydayobjects and interest on the part of designers in the emerging accessories industry led Luxottica, in 1988,to embark on its first collaboration with the world of fashion, entering a licensing agreement with GiorgioArmani. The Company followed up that initial experience (terminated in 2003) with numerous others,gradually building a world-class brand portfolio featuring names like Bvlgari (1996), Salvatore Ferragamo(1998), Chanel (1999), Prada and Versace (2003), Donna Karan (2005), Dolce & Gabbana and Burberry(2006), Polo Ralph Lauren (2007) and Tiffany (2008).
As for house brands, the Company slowly expanded in the sun business by buying Vogue (1990) and thefamous Persol (1995), a brand with a glorious tradition and a mid- to high-end positioning.
FINANCIAL MARKETSIn 1990, Luxottica listed its ADS (American Depositary Shares) on the New York Stock Exchange, thusraising its public profile and accelerating its growth. In 2000, Luxottica’s stock was listed on Borsa Italiana’selectronic share market and has been in Italy’s top 30 equities index since 2003.
HISTORY> 10

HISTORY | 11 <
RETAIL DISTRIBUTIONIn the ’90s, the Company continued to develop its distribution network by opening new commercialsubsidiaries, the Japanese Mirari being the most significant during this time period.
In 1995, Del Vecchio once again broke the mold by acquiring The United States Shoe Corporation, ownerof LensCrafters, one of North America’s largest optical retail chains. Luxottica thus became the world’s firsteyewear manufacturer to enter the retail market, thereby exploiting its synergies with its production andwholesale distribution and boosting penetration of its products through LensCrafters stores.
RAY-BANIn 1999, Luxottica definitively claimed global status by acquiring Ray-Ban, the world’s best knownsunglasses. Previously specializing in prescription frames, the Company thus assured itself a crystalsunglass technology, and the manufacturing capacity to go with it, and upgraded its portfolio with brandslike Arnette, REVO and Killer Loop.
A brand that had been waning for some years but still had enormous unexpressed potential, Ray-Ban wassuccessfully relaunched thanks to rapid integration and a powerful advertising campaign to restore itsformer prestige.
A DECADE OF STRONG GROWTHAfter quickly and efficiently integrating the businesses acquired from Bausch & Lomb, Luxottica resumedits growth across its businesses and in their respective geographical regions. Helping in this growth werenew managers from the outside, especially CEO Andrea Guerra, who has led the Group since 2004,together with Leonardo Del Vecchio, who remained as chairman.
On the retail front, the Company became a world leader in just a few years by acquiring a number ofchains, including Sunglass Hut (2001) a leading global retailer of premium sunglasses, OPSM Group (2003),a leading optical player in the Asia-Pacific region, and finally Cole National (2004), bringing with it one ofNorth America’s other leading optical retail chains, Pearle Vision, and an extensive licensed brand storebusiness. In 2005, the Company began its retail expansion into China, where LensCrafters immediatelybecame a leading brand in the high-end market. In the meantime, the Group started to expand in highpotential markets like the Middle East, South Africa, Thailand and India.
In its wholesale distribution segment, prestigious new licensing agreements were supported by anincreasing commitment to research, product quality and manufacturing excellence, while distributiondeveloped in the direction of customer differentiation and emerging sales channels, such as largeshopping centers and travel retail.
OAKLEYIn 2007, Luxottica acquired California-based Oakley, the world’s leading performance optical brand, forUS$ 2.1 billion. The potential of this combination is enormous: Oakley is not only a brand known andappreciated worldwide but it also brought with it an impressive portfolio including Oliver Peoples and thePaul Smith license, not to mention its own retail network. Rapid integration of Oakley confirmed Luxotticaas a world leader and laid the foundation for a major new process of long-term growth.

Luxottica produces and distributes sun and prescription eyewear of high technical and stylistic quality toimprove the well-being and satisfaction of its customers and at the same time create value forshareholders, employees and the communities in which the Group operates.Every collection, every pair of glasses, is the result of an ongoing process of research and developmentwhose aim is to anticipate and interpret the needs, desires and aspirations of consumers all over the world.The achievement of high standards of quality reflects the Group’s world-class technical and manufacturingknow-how - the fruit of over 45 years of experience - and its constant commitment to technologicalinnovation, style and design, the study of changing lifestyles and interpretation of fashion trends.Quality and customer satisfaction are also the objectives of the wholesale distribution network and theretail chains. These structures are organized to offer high quality after-sales service, always andeverywhere, that is homogeneous but not standardized, being specially tailored to specific local needs.Manufacturing excellence and the focus on service levels form just one of the strengths that Luxotticaleverages to achieve its main corporate objectives, which are shareholder remuneration, customersatisfaction, the well-being of its employees and economic and social development wherever the Groupoperates.In general, the Company’s long-term strategy is to strengthen its global leadership and continue to growin all its businesses. Growth, whether organic or through acquisitions, is thus the main driver for creationof value, thanks also to Luxottica’s unparalleled capacity to integrate and enhance the businesses itacquires.
VERTICAL INTEGRATIONOne of the competitive advantages underpinning the Group’s past and future successes is the verticallyintegrated structure that Luxottica has built over the decades.
The Group’s present structure, covering the entire chain of value, is the result of a far-sighted choice madeby the Company’s founder and current chairman, who had understood the potential of the “vertical”strategy ever since deciding to make entire frames rather than just components. Vertical integration ofmanufacturing was gradually accompanied by expansion of distribution, first wholesale and, from 1995,retail also, and without forgetting its key presence in the high value-added business of lens finishing.In terms of manufacturing, the Company has, over decades, vertically integrated all the phases of theproduction process to attain a level of efficiency in line with the quality of products and services it intendsto offer. Direct control of the entire production platform makes it possible to verify the quality of productsand processes, introduce innovations, discover synergies and new operating methods, and optimize timesand costs at the same time. The Group also has a centralized warehouse management and orders systemthat processes data from the wholesale and retail structures to make demand projections and planproduction in advance, thereby reducing raw materials inventories and purchasing.
Direct control of distribution thus enables Luxottica to stay in touch with end users and understand theirtastes and tendencies, but it is also perceived as a strength by the stylists and fashion houses who cometo Luxottica to produce their eyewear collections and who are guaranteed genuinely global and capillarydistribution.
Further key synergies between production and retail distribution stem from assortment choices in stores,which tend where possible to privilege Luxottica products and increase their degree of penetration farmore than is normally seen in business between manufacturers and independent retailers.
MISSION AND STRATEGY
> 12

Over 6,250 retail locations worldwide
In-house control of lens finishing
Global leadership in manufacturing
One of the strongest and most balanced
brand portfolios in the industry
Wholesale distribution spanning
130 countries
Technological supremacy in
sunglass lenses
Leadership in the prescription eyewear
business and sport channel
MISSION AND STRATEGY | 13 <
STRENGTHSLuxottica’s success lies in its perfect combination of and interaction between the following main factors:
MANUFACTURINGLuxottica Group’s manufacturing system has two main platforms: in Italy and China. Alongside these, theFoothill Ranch facility in California manufactures and assembles most of Oakley’s eyewear products, whileOakley’s second manufacturing center in Dayton, Nevada, produces the frames used in its X Metal® (aproprietary alloy) eyewear products. Lastly, there is a small plant in India, serving the local market.
Luxottica has six manufacturing facilities in Italy: five in northeast Italy, the area in which most of thecountry’s optical industry is based, and one near Turin. All of these facilities are highly automated, whichhas made it possible to maintain a high level of production without excessive capital outlay.The Laurianofacility also makes sunglass crystal lenses and polycarbonate lenses.
The Dongguan plants, in China’s Guangdong province, make both plastic and metal frames.
Over the years, the Group has consolidated its manufacturing processes by concentrating a specificproduction technology in each of the Italian facilities. This consolidation enabled both the productivity andquality of manufacturing operations to be improved.
Plastic frames are made in the Agordo, Sedico, Pederobba and Lauriano facilities, while metal frames areproduced in Agordo and Rovereto. Certain metal frame parts are produced in the Cencenighe plant.
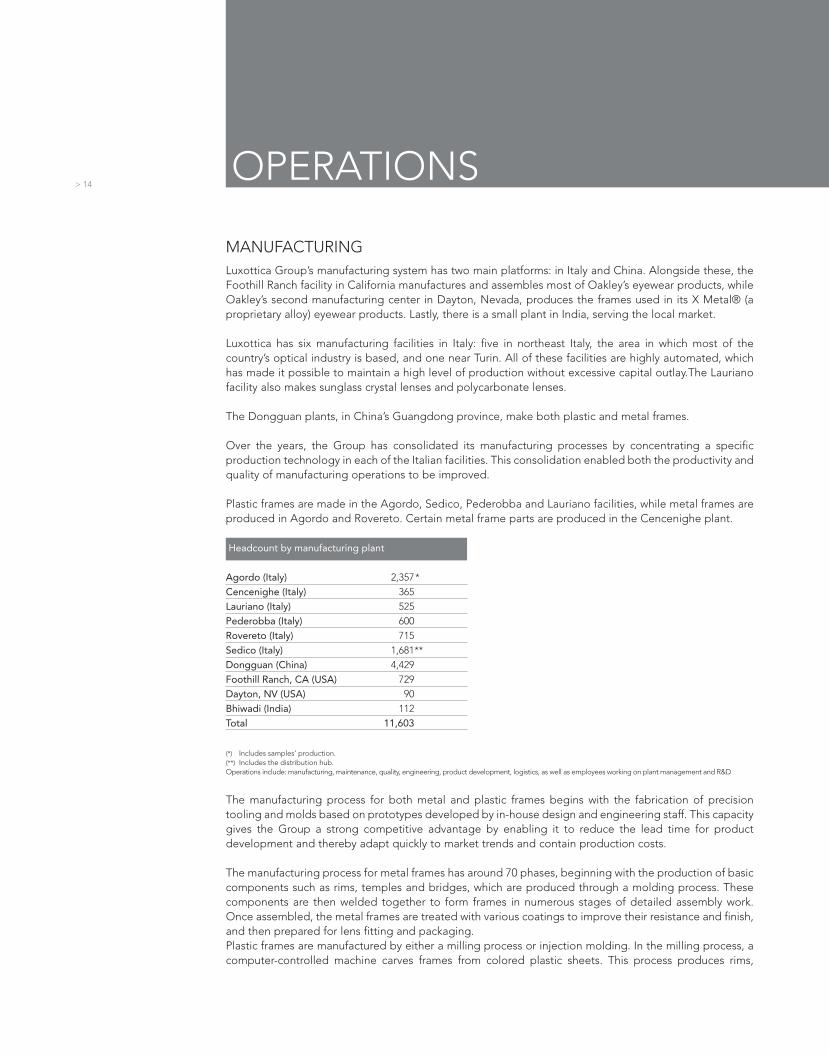
Headcount by manufacturing plant
Agordo (Italy) 2,357*Cencenighe (Italy) 365Lauriano (Italy) 525Pederobba (Italy) 600Rovereto (Italy) 715Sedico (Italy) 1,681**Dongguan (China) 4,429Foothill Ranch, CA (USA) 729Dayton, NV (USA) 90Bhiwadi (India) 112Total 11,603
(*) Includes samples’ production.(**) Includes the distribution hub.Operations include: manufacturing, maintenance, quality, engineering, product development, logistics, as well as employees working on plant management and R&D
The manufacturing process for both metal and plastic frames begins with the fabrication of precisiontooling and molds based on prototypes developed by in-house design and engineering staff. This capacitygives the Group a strong competitive advantage by enabling it to reduce the lead time for productdevelopment and thereby adapt quickly to market trends and contain production costs.
The manufacturing process for metal frames has around 70 phases, beginning with the production of basiccomponents such as rims, temples and bridges, which are produced through a molding process. Thesecomponents are then welded together to form frames in numerous stages of detailed assembly work.Once assembled, the metal frames are treated with various coatings to improve their resistance and finish,and then prepared for lens fitting and packaging.Plastic frames are manufactured by either a milling process or injection molding. In the milling process, acomputer-controlled machine carves frames from colored plastic sheets. This process produces rims,
OPERATIONS> 14

OPERATIONS | 15 <
temples and bridges that are then assembled, finished and packaged. In the injection molding process,plastic resins are liquefied and injected into molds. The plastic parts are then assembled, coated, finishedand packaged.
The California facility produces high performance sunglasses and prescription frames and lenses. Theequipment used is specially designed and adapted for Oakley’s manufacturing processes. This makes itpossible to respond quickly to customer demand, offer protection against piracy and adhere to strictquality-control standards. Throughout the development process, Oakley optics products undergoextensive testing against standards established specifically for eyewear by ANSI and ASTM. Thesestandards relate to product safety and performance and provide quantitative measures of optical quality -UV protection, light transmission and impact resistance. Oakley also performs a broad range of durabilityand mechanical integrity tests on its lens coatings, involving extremes of exposure to UV light, heat,condensation and humidity.
LOGISTICSThe Group’s distribution system is globally integrated and fed by a centralized manufacturingprogramming structure. The network linking the logistics and sales centers to the production facilities inItaly and China also provides daily monitoring of global sales performance and inventory levels so thatmanufacturing resources can be programmed and warehouse stocks promptly re-allocated to meet localmarket demand.This integrated system serves both the retail and wholesale businesses and is based on one of the mostefficient and advanced logistics organizations in the industry, with 23 distribution centers worldwide.There are three main distribution centers (hubs) in strategic locations serving the major markets: Sedico inEurope, Atlanta in the Americas and Dongguan in the Asia-Pacific region. They operate as centralizedfacilities, offering customers a highly automated order management system that reduces delivery timesand keeps stock levels low.
The Sedico Hub was opened in 2001 and updated with a new automated system in 2006. It currentlymanages over 22,000 orders a day, including eyeglasses and spare parts. Everyday, Sedico sends out over150,000 units coming from the manufacturing plants and going, on one hand, direct to Europe, MiddleEast and Africa customers and, on the other, to the Group’s distribution centers in the rest of the world,from which they are then shipped to local customers.The Sedico Hub is the result of a strategic project that enabled the closure of the local warehousesthroughout Europe that characterized the previous distribution system. Cutting out the intermediate stagethat those warehouses represented required major investments but it was decisive in improving the speedand efficiency of Luxottica’s distribution, as well as eliminating the overheads and increasing workingcapital typical of unnecessarily decentralized organizations.
The Atlanta Hub is the pride of Luxotica’s retail logistics operation. Located in the main logistics area ofAmerica, this hub has a highly advanced cross-belt sorting system that can move up to 140,000 pieces aday at a conveyor belt speed of 1.5 meters a second.
Of the Group’s 23 logistics centers, seven were acquired with Oakley, whose distribution system is currentlybeing integrated with Luxottica’s. In North America, the Oakley brand’s most important market in terms ofvolumes, products are distributed through the Ontario distribution center located in California.

QUALITYProduct quality is the critical factor in the premium and luxury markets for both opticians and endconsumers. It has always been Luxottica’s main focus and was the reason for undertaking full integrationof every phase of production. Quality and process control teams regularly inspect semi-finished productsduring the various phases of production, verifying the feasibility of prototypes in the design phase,controlling standards across the spectrum of products in the production phase, and subsequentlychecking for resistance to wear and tear and reviewing optical properties in relation to type of use. Themanufacturing processes and materials used by primary suppliers are also controlled and certified. Thanksto ongoing verification of precision and expertise in all phases of production, the quality of Luxottica’s endproduct is of the highest level. This vitally important aspect of production is reflected by both therelationship of trust that the Group continues to enjoy with independent optical store operators, bothlarge and small, and the low levels of returns for defective merchandise.
ANTI-COUNTERFEITING POLICYThe only strategy capable of countering the widespread phenomenon of counterfeit goods is to attack thesources of supply of the thousands of purveyors of pirated goods. Luxottica Group concentrates its effortson identifying the main flows of fraudulent goods and to organize brand protection strategies accordingly.In 2008, brand protection activities were successfully continued, leading to the destruction of over 1.1million pairs of counterfeit eyewear. This was the result of consolidating and strengthening programsinitiated in previous years, focusing on monitoring the production and trafficking of pirated goods throughconstant investigations in China and tight Customs control. 2008 also saw the start up of a program tomonitor the more popular on-line auction platforms. This allowed approximately 17,500 offers ofcounterfeit eyewear to be removed.Intellectual property being one of its most important assets (Oakley alone holds over 600 patents and1,200 trademarks), Luxottica Group is inevitably committed to maintaining, indeed strengthening, its anti-counterfeiting operations.
> 16 | ANNUAL REPORT 2008

BRAND PORTFOLIO
Luxottica’s brand portfolio is one of the richest and most prestigious in the industry, as its major globalbrands are backed by leading brands at a regional level and in particular segments and niche markets. Italso has an optimal balancing of house and license brands, thus combining the stability and volumesassured by the former with the prestige and high margins of the big names in fashion and luxury.
The presence of Ray-Ban, the world’s best selling brand of sun and prescription eyewear, and Oakley, anundisputed leader in the performance category, gives the portfolio unparalleled strength. And there is alsothe potential of Persol and Oliver Peoples in the high-end of the market, the relaunching of the Arnetteand REVO sport brands now in progress, and the notoriety recognition of Vogue and K&L (formerly KillerLoop).
Alongside the house brands, which now account for over 60% of all units sold following the acquisition ofOakley, the portfolio has over 20 license brands, including some of the best known and most prestigiousnames in the global fashion and luxury industries. With its manufacturing know-how, capillary distributionand direct retail operations supported by well-calibrated advertising and deep understanding ofinternational markets, Luxottica is the ideal partner for fashion houses and stylists seeking to translate theirstyle and values into successful premium quality eyewear collections, all the while differentiating eachdesigner’s offering as much as possible, meticulously segmenting it by type of customer and geographicalmarket, to produce a broad range of models capable of satisfying the most diverse tastes and tendenciesand to respond to the demands and characteristics of widely differing markets. Another big priority is thecontinual improvement of the product mix to guarantee coverage and differentiation of the entirepremium market and minimize the risk of brand dilution.
The Luxottica portfolio is a dynamic reality in continual evolution. Its make up is gradually modified by theacquisition of new brands, the stipulation of new licensing agreements and the renewal of existing onesand the withdrawal of brands no longer deemed strategic, but the long-term objectives remain the same:to focus on leader brands, balance house and license brands, avoid brand dilution, and lengthen theaverage term of licensing agreements.
In 2008, the Group renewed its important partnership with Chanel, whose eyewear has always been madeby Luxottica, ever since its first licensing agreement in 1999. The new agreement will make it possible totake up new opportunities offered by this prestige brand, whose exclusivity and positioning in the eyewearmarket are guaranteed by Luxottica’s ongoing commitment. Meanwhile, the license portfolio has beenenriched by the emerging Stella McCartney brand, whose first sun collection, manufactured anddistributed exclusively by Luxottica, will be launched onto the market in summer 2009.The Stella McCartney license, running for six years and renewable for a further five, also helped Luxotticaextend the average term of its licenses, which is now approaching ten years. Such long-term partnershipswith maisons and stylists mean improved investment planning and fuller realization of the value ofcollections.
17 <

> 18 | ANNUAL REPORT 2008
HOUSE BRANDS
Style, tradition and freedom of expression are the key values underpinning the philosophy of Ray-Ban, forgenerations the undisputed world leader in sun and prescription eyewear.Debuting in 1937 with the Aviator model created for American Air Force pilots, Ray-Ban joined Luxottica’sbrand portfolio in 1999.Unaffected by the conceptual transience of fashion, Ray-Ban immediately made a name for itself thanks tothe absolute quality and authenticity of its eyewear, now more “modern” than ever and worn by countlessmovie celebrities and trendsetters all over the world.
Acquired by Luxottica in 2007, Oakley is the world’s leading sports eyewear brand, unique and inimitablein its blend of technology, design and art across all its products. In addition to its sun and prescriptioneyewear and ski goggles, it offers branded apparel, footwear and accessories in collections addressingspecific consumer categories: Sport/Active, Lifestyle and Women.Oakley is also famed for its unbeatable lens technologies, and its High Definition Optics® (HDO®) in particular.
Launched in California in 1992, Arnette was acquired by Luxottica in 1999. It quickly became the eyewearof choice, and lifestyle icon, of the 3S generation - surf, skateboard and snowboard. Arnette’s designcaptivates, bringing together the levels of comfort and functionality demanded by people drawn toextreme sports.
Created in 1989, Killer Loop joined Luxottica’s brand portfolio in 1999. It gradually evolved from a generalsports style to embody a more “urban” spirit. In 2008 it took on a new name, K&L, and launched a projectfor collections specifically addressing the needs of emerging markets, but maintaining global distribution.K&L is a fresh, vital brand for a dynamic young public who are careful about their look.
On the scene since 1967, Luxottica’s first line is still the one that best conveys the experience and traditionthat are its essence. Luxottica is the ideal eyewear for those seeking contemporary style and premiumquality. The brand broadened its range with Luxottica Titanium, a collection for people who prefer super-lightweight frames of elegant design.
Launched in 2005 and part of Luxottica’s brand portfolio since 2007, Mosley Tribes combines design andaesthetics with a vision of the urban lifestyle and sports performance worlds. The sleek and stylish framesuse titanium and injected plastic for a lightweight design, ideal for active individuals. Most frames featureVFX lenses (Visual Effects), the ultimate in lens technology. Only three years on the market, Mosley Tribesis popular among fashion-forward trendsetters.
Oliver Peoples began in 1987 with the introduction of a retro-inspired eyewear collection created by designerand optician Larry Leight. All eyewear is hand-crafted of the finest quality materials, in colors exclusive toOliver Peoples. Frames are manufactured in limited quantity and with deliberate anti-logo labeling so thatonly people “in the know” will recognize them. Oliver Peoples is the eyewear choice for many Hollywoodelite and fashion photographers who appreciate its perfect combination of style and function.
Making its debut in 1917 and acquired by Luxottica in 1995, Persol is a living legend of “Made in Italy”

eyewear. With its evocative name, signifying “for sun”, it is the proud heir to a culture of excellence andcraftsmanship, a perfect alchemy of aesthetics and technology. The irresistible appeal of timeless designand high quality make the brand a veritable badge of distinction, one chosen by celebrities from show-business and the worlds of art and design.
Created in 1985 and acquired by Luxottica in 1999, REVO is characterized by an innovative lens based ona technology that NASA developed for satellite portholes, offering maximum protection against ultravioletand infrared light.REVO eyewear is perfect for those needing perfect vision for outdoor sports or specific protection of the eyes.
Sferoflex joined Luxottica’s portfolio in 1981. It takes its name from the patented flexible hinge enablingthe temples to conform to the shape and size of the face, thus increasing the resilience of the frame itselfand ensuring perfect fit. With its classic design and instantly recognizable flexi-hinge, Sferoflexprescription frames enjoy wide consensus in the optical sector and are designed for people demandingreliability and top quality.
Launched in 1973 under the same name as the famous fashion magazine, the Vogue brand was acquiredby Luxottica in 1990.Vogue models speak through their innovative designs, their dazzling variety of colors and frames and thedetailing on the temples that makes them highly coveted fashion accessories. The brand addresses apredominantly female public, women who track the trends and love experimenting with new styles.
LICENSE BRANDS
Adrienne Vittadini launched her sportswear brand in 1979, drawing inspiration from travels, art and popculture to provide consumers with fresh and feminine styling appropriate for the office or more casualsettings. The Adrienne Vittadini optical and sun eyewear collections show the same inspiration, addressingwomen with a sophisticated sense of style who love expressing themselves through fashion.
This product line targets successful professional women who place an emphasis on quality and image. Thelicense dates back to 2002.
Characterized by lightweight materials and a slender line, the Brooks Brothers collections reflect theunique features of the style of this American brand. This is an affordable product line with classic style thatdelivers functionality, lightness and high quality. The original license agreement was entered in 1992.
Under license since 1997, Bvlgari eyewear is distinguished by the high quality of its materials, attention todetail and elegant design. This product line addresses a clientele who seek a distinctive and exclusiveproduct.
The Burberry license agreement was signed in 2005, with the launch of the first eyewear collection inOctober 2006. This collection features the brand’s core values of form and function, innovation and theessence of classic style.
BRAND PORTFOLIO | 19 <
> 20 | ANNUAL REPORT 2008
In 1999, Luxottica was the first company licensed to produce Chanel eyewear products. The Chanelproduct line, targeting luxury-oriented consumers, reflects the essential characteristics of the brand: style,elegance and class.
Chaps features easy-to-wear designs in the classic tradition of Polo Ralph Lauren. The line offers a designername to the young consumer of competitively priced sportswear. Since its introduction, Chaps has cometo represent classic design, excellent quality and value.
Club Monaco offers quality eyewear of uncompromising style and affordable luxury. The styling targetsmen and women between 20 and 40 who are urban professionals and other style enthusiasts whoappreciate design at mid-level prices.
Under license since 2005, Dolce & Gabbana eyewear collections are an expression of ultimate luxury. Theyare characterized by modern, fashionable shapes, prestige materials and sumptuous detailing, such aslogos in Swarovski crystals or elegant metal circles.
The D&G eyewear collection has a youthful, innovative and unconventional spirit. The eyewear collectionemphasizes the spirit of the brand: innovative, provocative and cosmopolitan.
This product line reflects the design sensibility and spirit of the Donna Karan collection, offering men andwomen sophisticated styling in modern and lightweight materials.
DKNY is easy to wear fashion with an urban mindset, the New York City street-smart look. DKNY eyewearcaters to modern, urban, fashion-conscious women and men with multifaceted lifestyles: international,eclectic, fun and real.
Fox Eyewear collections are the result of a multi-year licensing agreement with Fox Head, Inc., a leadingmotocross and action sport brand based in California. Fox eyewear and ski goggles have been on themarket for over five years and are currently the only brand other than Oakley to use High DefinitionOptics® (HDO®) technology. Fox Eyewear joined Luxottica’s brand portfolio at the end of 2007.
The Miu Miu brand addresses a sophisticated, free-and-easy clientele particularly attentive to new trendsand expresses Miuccia Prada’s vision of an alternative style, always characterized by a strong personality.The Miu Miu brand is urban, young, sophisticated and sensual, an alternative vision, a “new classic”.
The Paul Smith Spectacles brand, which launched in 1994, includes prescription and sun eyewear featuringthe whimsical yet classic designs and attention to detail that are synonymous with one of Britain’s leadingfashion designers.
The Polo collection focuses on refined designs, inspired by the heritage of Polo Ralph Lauren apparel. Thiscollection features emblematic models that are classic and never out of style. Polo is the ideal collection

for men who appreciate quality and tradition and are seeking classic styles with a fresh design.
The Prada license agreement was signed in 2003. Prada collections offer a range of optical frames andsunglass collections, as well as a series of models created for leisure time, identified by the brand’sunmistakable red stripe. Prada collections have always been distinctive not only in their high quality butalso in their forward-thinking approach and style, enabling the brand to anticipate and often inspire trendsacross all sectors. Sophisticated, elegant and refined, Prada products are identified by their strongcharacter and unique style.
This line is an expression of the Ralph Lauren spirit at an accessible price point. It features the latest looksand trends, as well as some more classic looks, and vibrant colors for a feminine, flirty and fun look.
The exclusive Purple Label eyewear collection combines the elegance of tradition with the requirementsof the modern gentleman: high quality, precious materials, details and style.
The Ralph Lauren eyewear collection embraces a youthful sophisticated elegance that mixes refined luxurywith cinematic glamour and an air of mystery. For the fashion-conscious woman seeking timeless stylingwith a modern attitude.
Salvatore Ferragamo collections are characterized by lavish attention to detail, original use of materialsand creative choice of colors. The eyewear collection is inspired by the tradition of craftsmanship of thisfashion house, reinterpreted in a contemporary mode.
Stella McCartney eyewear reflects the sense of modernity and innovation that the stylist shows in hercreation of desirable fashion. Combining everyday functionality with a strong fashion sensibility, theeyewear collection offers contemporary femininity with a sense of modern luxury.
For 169 years, Tiffany & Co. has designed and produced standard-setting jewelry and accessories. The firstcollection of Tiffany & Co. eyewear, launched exclusively by Luxottica in early 2008, remains true to thebrand’s highest standards.
Versace is a lifestyle brand for modern men and women who choose to express strength, confidence anduniqueness through a bold and distinctive personal style. Versace represents the ideal of a sophisticated,free and highly desirable lifestyle.
While staying true to the essence of the Versace brand, Versus embodies a younger, edgier take on thosethemes. Filled with spirit and energy, Versus challenges convention, always in the vanguard of modernurban style.
BRAND PORTFOLIO | 21 <

RETAIL
6,255 stores managed in the world(of which 559 in franchising and 10 in joint venture)
NORTH AMERICA 4,826
Prescrition LensCrafters 966Pearl Vision 809 (of which 379 in franchising)Sears Optical 879Target Optical 325The Optical Shop of Aspen 24
Prescrition/Sun Oliver Peoples 6 (of which 1 in franchising)
Sun Sunglass Hut, Sunglass Icon 1,703 (of which 11 in franchising)ILORI 16
Sun/Clothing Oakley Stores & Vaults 98
CENTRAL & SOUTH AMERICA 8
Sun/Clothing Oakley Stores & Vaults 8 (of which 6 in franchising)
North America Central America
WHOLESALE
Direct operations in 30 countries in the world
EUROPEItalyAustriaBelgiumCroatiaFranceGermanyGreecePolandPortugalSpainSwedenSwitzerlandThe NetherlandsTurkeyUnited Kingdom
THE AMERICASUSAArgentinaBrazilCanadaMexico
ASIA-PACIFICAustralia ChinaIndiaJapanKoreaSingapore
MIDDLE EASTDubaiIsrael
AFRICASouth Africa
LUXOTTICA: A WORLDWIDEDISTRIBUTION NETWORK

Europe South Africa Middle East China Asia-Pacific
CHINA 244
PrescriptionLensCrafters 170Other retail brands 68
SunSunglass Hut 6
EUROPE 161
Prescrition David Clulow 42 (of which 5 in franchising and 10 in joint venture)
Sun Sunglass Hut 82David Clulow 22
Sun/Clothing Oakley Stores e Vaults 15 (of which 5 in franchising)
AFRICA & MIDDLE EAST 39
SunSunglass Hut 38 (in franchising)
Sun/Clothing Oakley Stores & Vaults 1 (in franchising)
SOUTH AFRICA 70
Sun Sunglass Hut 68
Sun/Clothing Oakley Stores & Vaults 2
ASIA-PACIFIC 907
PrescriptionOPSM 319Laubman&Pank 131Budget Eyewear 89 (of which 18 in franchising)
Prescription/SunOliver Peoples 1 (in franchising)
SunSunglass Hut 210 (of which 1 in franchising)Bright Eyes 141 (of which 92 in franchising)
Sun/ClothingOakley Stores & Vaults 16 (of which 1 in franchising)

Luxottica Group’s distribution structure, unparalleled in the industry, is one of the Group’s most importantcompetitive advantages. It is one of the most extensive and effective in the industry, embracing retailstores and serving a wholesale distribution network of third party stores and chains.
The distribution structure covers more than 130 countries, with directly controlled operations in the mainmarkets. Customers are mostly retailers of mid- to premium-priced eyewear, such as independentopticians, optical retail brands, specialty sun retailers and duty-free shops. In North America and otherareas, the main customers also include independent optometrists and ophthalmologists and premiumdepartment stores.
Direct distribution in the key markets gives the Group a considerable competitive edge, making it possibleto maintain close contact with customers and maximize the image and visibility of the Group’s brands.Further, the Group’s experience in direct operation of stores in certain of its more important countries hasgiven it a unique understanding of the world’s optical markets. All this makes it possible to achieve tightcontrol and strategic optimization of both house and licensed brands.In addition to making some of the best brands, with a broad array of models tailored to the needs of eachmarket, Luxottica also provides its wholesale customers with the assistance and services needed to enabletheir business to be successful.
One of Luxottica Group’s main strengths is its ability to offer pre- and post-sale services which have beendeveloped and continuously improved over decades. These high-quality services are designed to providecustomers with the best product and in a timeframe and manner that best enhance their value.
The distribution system is connected at the international level to a central production planning functionthrough a network linking logistics and sales functions and outlets to the manufacturing plants in Italy andChina. Through this network, global sales and inventory are monitored daily so that production resourcesand inventory levels can be adjusted in response to information from the market.This integrated logistics system is one of the most efficient and fastest in the industry. In Asia, Europe andthe United States, orders are processed by centralized centers that significantly improve distribution speedand efficiency.
Luxottica Group is thus able to provide its customers with a highly automated order management systemthat reduces delivery times and minimizes inventory.
WHOLESALEDISTRIBUTION
> 24

25 <
OPTICAL RETAIL
Luxottica Group’s optical retail operations are through leading brands such as LensCrafters and PearleVision, leaders in North America, and OPSM, Laubman & Pank and Budget Eyewear, which are activethroughout Australia and New Zealand. The Group also has a major retail presence in China, where it is atop operator in the premium eyewear market with LensCrafters. Due to the fragmented nature of theEuropean retail market, the Company does not operate optical retail stores in Europe outside of theUnited Kingdom, where it recently bought the remaining stake in the David Clulow optical chain, whichsells both prescription and sun products.As of December 31, 2008, Luxottica’s optical retail business consisted of approximately 3,800 retaillocations globally.
As of December 31, 2008, the Group operated a retail network of 1,136 LensCrafters stores, of which 966are in North America and the other 170 stores in China. LensCrafters is currently the largest optical retailchain in North America in terms of sales.LensCrafters stores offer a wide selection of prescription frames and sunglasses, mostly made by Luxottica,but also a wide range of lenses and optical products made by other suppliers. Points of sale are normallyin high-traffic commercial malls and shopping centers and have an optometrist (sometimes a Luxotticaemployee) so that customers can have eye examinations on site. Most LensCrafters stores in NorthAmerica also include a lens finishing laboratory, which dramatically improves the customer service level.During the last few years, Luxottica has invested in the premium aspects of the LensCrafters brand, addingadditional elements such as an exclusive new store concept now being adopted in store remodelingacross North America, associate training and advertising and marketing, which together represent thepremium brand and future direction of LensCrafters. These new initiatives have also helped increase theaverage transaction per customer value, as LensCrafters becomes the retailer of choice for fashionable,designer prescription frames and sunglasses. The aim of this new focus on prescription frames as fashionobjects and not mere instruments is also to shorten the consumer’s purchase cycle of typically two to threeyears.Luxottica continues to evaluate potential retail expansion opportunities in North America throughacquisition of retail chains and store openings in areas where LensCrafters is not already heavilyrepresented.
In 2006, Luxottica began to expand the LensCrafters brand in China by rebranding most of its stores there,which were acquired through the acquisition of three retail chains. As of December 31, 2008, the Companyoperated 238 retail stores in China and Hong Kong, of which 170 carry the LensCrafters name while theothers retain their original brand names.Hong Kong is one of the most significant Chinese luxury markets and is very popular with affluent mainlandChinese. Launching LensCrafters as a premium brand in Hong Kong was therefore important for increasingawareness and consumer demand for Luxottica products and services.
With the acquisition of Cole National in October 2004, Luxottica acquired Pearle Vision, one of the largestoptical retail chains in North America after LensCrafters. Although both brands address the mid- to high-end customer bracket, their positioning is complementary. Pearle Vision focuses on the factors that madethe brand a success: customers’ trust in the doctor’s experience and the quality of service they receive.Pearle Vision stores are mostly located in strip malls instead of the conventional malls where mostLensCrafters and Sunglass Hut stores are located.The successful relaunching of the Pearle Vision brand in 2004 and 2005 was centered on a return to itsoriginal values, which had made Pearle Vision the “Home of Trusted Eyecare” for generations ofAmericans. A product mix increasingly geared to high quality has helped restore strong customerrelationships, as has the emphasis on doctors in advertising campaigns. At the same time, a significantreduction in sales promotions and discounts helped improve the chain’s positioning.
RETAILDISTRIBUTION

> 26 | ANNUAL REPORT 2008
In order to centralize services and achieve economies of scale, all in-store labs were closed and their workwas transferred to nearby LensCrafters labs or to one of Luxottica’s eight central lens finishing facilities.As of December 31, 2008, Pearle Vision operated 449 corporate store locations and had 390 franchiselocations throughout North America. The brand has significant growth opportunities in both the UnitedStates and especially in Canada, where the brand was strengthened in 2006 and is now the only opticalchain represented in all provinces.
With the acquisition of Cole National, Luxottica also acquired a network of distribution outlets operatingunder the brand names of certain American department stores. These “licensed brands” are Sears Opticaland Target Optical (a third license acquired with Cole, “BJ’s Optical”, expired in March 2008 and was notrenewed). These points of sale are located in stores that bear the names of the hosts and offer consumersthe convenience of taking care of their optical needs where they do their shopping.Both brands have a precise market positioning that Luxottica intends to build on by improving servicelevels and strengthening their fashion reputation by offering brands such as Ray-Ban and Vogue.As of December 31, 2008, Luxottica operated 879 Sears Optical and 325 Target Optical locationsthroughout North America.
In Australia and New Zealand, Luxottica operates three chains specializing in the optical business: OPSM,Australia’s top eyewear brand for luxury and fashion-minded customers; Laubman & Pank, famed for its high-quality assortment and services; and Budget Eyewear, focused on price-conscious consumers.Though addressing different customer categories, all three brands have continued since their acquisition in2003 to extend further into the fashion business through innovative store formats, personnel training andproduct assortment programs tailored to their respective markets and leveraging Luxottica’s vast brandportfolio. As of December 31, 2008, Luxottica owned 500 stores throughout Australia: 280 OPSM, 131 Laubman& Pank and 89 Budget Eyewear, of which 18 were under franchise.OPSM is also the market leader in New Zealand, with 39 corporate-owned stores, mainly in large urban areas.
EyeMed Vision CareEyeMed Vision Care is one of the largest managed vision care operators in the United States and is the resultof the integration of EyeMed’s previous business (dating back to 1988) and Cole National Managed Vision.EyeMed Vision Care serves over 23 million subscribers in large and medium size companies, publicadministrations and insurance programs and has a network of over 17,000 points of sale, includingopticians, ophthalmologists, optometrists and stores in chains operated by Luxottica.EyeMed Vision Care is also a recognized leader in terms of quality, choice, value for money and serviceexcellence - all priority concerns for managers shopping for vision care programs, especially for large groups.Customers using such services benefit from the quality of the products and the wide reach of thedistribution network, thus enjoying a vast choice amongst the numerous stores in the Group’s chains andindependent optical retailers.
Lens LaboratoriesTogether with LensCrafters’ 900 in-store labs, Luxottica operates seven central lens finishing labs that areof strategic importance to the Group’s North American retail business. By combining its broad presencein the market with additional capacity for lens finishing work, the Company can improve quality of service(while reducing the times and costs of finishing work otherwise done externally) and increase margins atthe same time.All the labs use highly advanced technologies to meet growing demand, follow new products and stayfocused on quality and customer service.The seven central laboratories serve all the Pearle Vision stores, the licensed brand stores and a numberof franchises. The labs in LensCrafters stores have been upgraded to help Sears and Pearle Vision stores(including those under franchise) to handle peak demand.In Australia, most of the Group’s local needs are covered by the central Eyebiz laboratory.

SUN RETAIL
Since the acquisition of Sunglass Hut in 2001, Luxottica has become the world leader in the sun retailbusiness.As of December 31, 2008, the Group operated 2,286 retail locations worldwide, mostly under theSunglass Hut brand.
Sunglass Hut is the world’s leading specialty retailer of sunglasses. As of December 31, 2008, SunglassHut had 1,969 retail locations worldwide.In addition to 1,565 retail locations in North America, Sunglass Hut now has 216 stores in Asia-Pacific, 82in Europe, 68 in South Africa and 38 in the Middle East, the latter operated by a local franchise partner.The chain has recently entered two important emerging markets, Thailand and India, where the Grouphas major plans for medium- to long-term growth.Founded in the United States in 1971 to operate in department stores, Sunglass Hut gradually expandedits base of stores and kiosks in shopping malls to new retail locations on city shopping streets and inairports.While it was phasing out its stand-alone watch business, Sunglass Hut focused increasingly on sellingpremium sunglasses, a market in which it is now a recognized leader, partly due to its exclusive new storeconcept, which is being extended to all its prime locations around the world. This repositioning was alsomade possible by substantial changes to the product mix allowing the chain to focus on fashion andluxury brands, especially for women. As a result, sales of Luxottica products in Sunglass Hut stores in 2008rose strongly against pre-acquisition levels, from around 14% of net sales in April 2001 to around 80% ofnet sales, including Oakley products.
ILORI is Luxottica Group’s brand new high-end fashion sunwear retail brand, with 16 stores in the UnitedStates as of December 31, 2008, including flagship stores in the SoHo neighborhood of New York Cityand in Beverly Hills, California.ILORI caters to a different, more exclusive clientele than Sunglass Hut’s, offering a richer purchasingexperience in prestige locations, featuring sophisticated luxury collections, exclusive niche brands andhighly personalized service.
First established in 1985, Bright Eyes is one of Australia’s largest and fastest growing sunglass chains, withover 140 sunglass stores across the continent.As of December 31, 2008, Bright Eyes operated 49 corporate store locations and 92 franchise locations,mostly in tourists resort and high-traffic areas.
As of December 31, 2008, the Group operated 140 Oakley “O” stores and Vaults worldwide, offering afull range of Oakley products including sunglasses, apparel, footwear and accessories. These stores aredesigned and merchandised to immerse consumers in the Oakley brand through innovative use ofproduct presentation, graphics and original audio and visual elements. In the United States, Oakley “O” stores are in major shopping centers and usually Oakley’s retailoperations outside the US are mostly franchised and are located in Mexico, Europe and Asia-Pacific.
Another important sales channel is the Oakley website (www.oakley.com), which is complementary to itsretail operations and international distribution. It allows consumers to purchase Oakley products asefficiently as possible, increasing awareness of the Oakley brand, improving customer service andcommunicating the brand’s values and essence.
RETAIL DISTRIBUTION | 27 <

STRUCTURE OF THE GROUP
> 28 | ANNUAL REPORT 2008
OWNERSHIP
SHARE CAPITAL
Luxottica Group S.p.A.’s capital is made up exclusively of fully paid up ordinary shares entitled to votingrights at both ordinary and extraordinary shareholders’ meetings. As of February 28, 2009, the share capital was Euro 27,809,887.98, with 463,498,133 shares outstanding,each having a nominal value of Euro 0.06.The Company does not hold treasury shares directly. However, a US subsidiary, Arnette Optics IllusionsInc., owns 6,434,786 Luxottica Group shares.The shareholders’ meeting on May 13, 2008 authorised, for a period of 18 months after such date, thepurchase and subsequent placement - the latter with no time restraints - of treasury shares for up to amaximum number of 18,500,000 ordinary shares. Under such authorisation, it will also be possible topurchase the 6,434,786 Luxottica Group shares held by the subsidiary Arnette Optics Illusions Inc. As of April 25, 2009, the Company has not initiated any buy back operations.
MAIN SHAREHOLDERS
According to the Shareholders register, legal disclosures and other information available as of February 28,2009, Company shareholders with an equity interest of at least 2% of Luxottica Group S.p.A.’s share capitalare as follows:
CORPORATE BOARDS
Luxottica Group’s governance system is based on a traditional management and control system with:
- shareholders who vote in ordinary and extraordinary meetings on, among other things, (i) theappointment and revocation of directors and statutory auditors and their fees, (ii) the approval of financialstatements and allocation of profits, and (iii) changes to the by-laws.
- a board of directors whose duty is to create shareholder value; from among its members it appoints anInternal Control Committee, which also assists the board in its internal control functions, and a HumanResources Committee, which provides consulting and recommendations on emoluments for topmanagement positions and incentive plans and the composition of management structures for the mainsubsidiaries);
Delfin S.àr.l. (Del Vecchio Family)Free float (2)
Giorgio Armani (1)
Treasury shares
67.8%25.9%4.9%1.4%
(1) of which 13,514,000 ADRs are held in thename of Deutsche Bank Trust CompanyAmericas.(2) includes Harris Associates L.P., with 2.04%of the share capital, and Deutsche BankTrust Company Americas, with 7.63% of theshare capital on behalf of third parties. Theshares owned by Deutsche Bank TrustCompany Americas represent the shares onthe US financial market, through issuance,by the Bank itself, of a corresponding num-ber of American Depositary Shares; suchshares are lodged at Deutsche Bank S.p.A.,which in turn issues the certificates for theparticipation and vote at the meetings rela-tive to the shares themselves.

STRUCTURE OF THE GROUP | 29 <
Board of Directors Leonardo Del Vecchio Chairmanin office until the approval Luigi Francavilla Vice chairmanof the Financial Statements Andrea Guerra Chief Executive Officeras of December 31, 2008 Roger Abravanel
Tancredi Bianchi Mario CattaneoEnrico Cavatorta Roberto ChemelloClaudio Costamagna Claudio Del VecchioSergio Erede Sabina Grossi Gianni MionLucio Rondelli
Internal Control Committee Lucio Rondelli ChairmanTancredi BianchiMario Cattaneo
Human Resources Committee Gianni Mion ChairmanRoger AbravanelClaudio CostamagnaSabina Grossi
- a Board of Auditors, responsible for, among other things, overseeing compliance with the law and withthe Company by-laws, its principles of governance and organizational model. The board of auditors alsoacts as an audit committee under the Sarbanes Oxley Act;
Board of Auditors Marco Reboa Chairmanin office until the approval Giorgio Silva Auditorof the Financial Statements Enrico Cervellera Auditoras of December 31, 2008
Mario Magenes Alternate auditorFrancesco Nobili Alternate auditor
The Company’s accounts are audited by a firm of accountants registered with CONSOB and appointed bythe Shareholders’ Meeting.
Auditing Company in office until the approval of the Financial Statementsas of December 31, 2011 Deloitte & Touche
More information on Luxottica Group’s Corporate Governance are available in the Annual Report onCorporate Governance 2008, available on the website www.luxottica.com.
> 30 | ANNUAL REPORT 2008
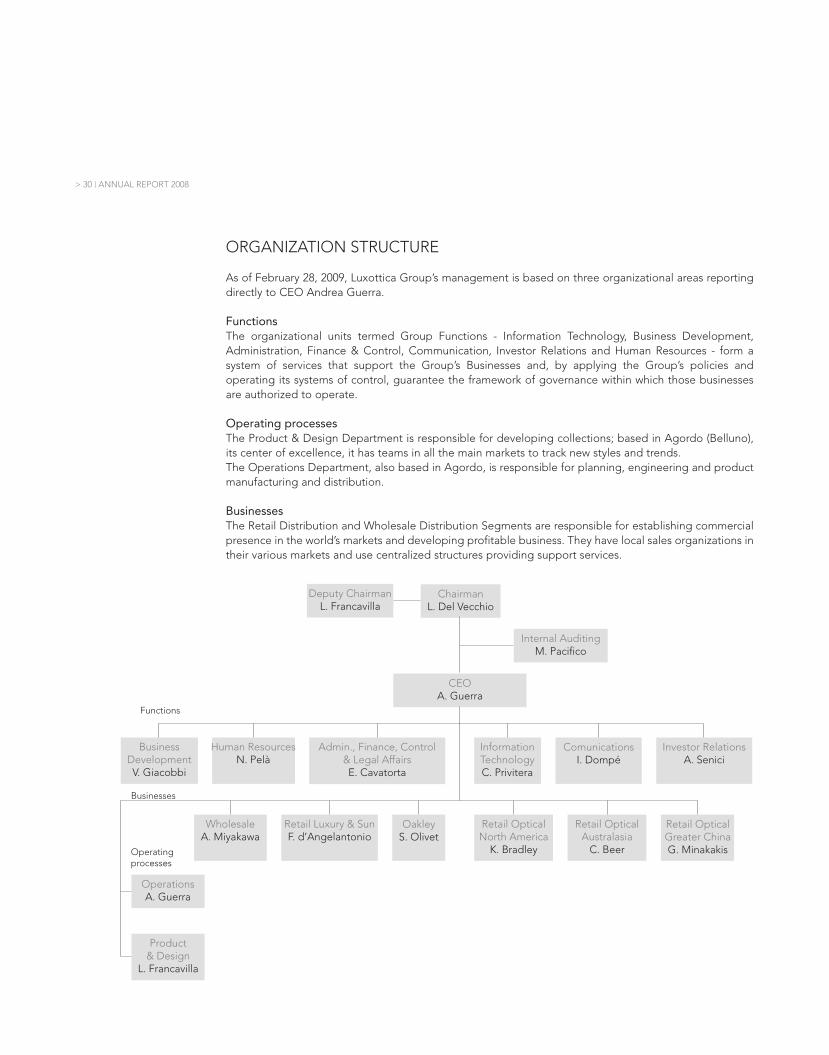
ORGANIZATION STRUCTURE
As of February 28, 2009, Luxottica Group’s management is based on three organizational areas reportingdirectly to CEO Andrea Guerra.
FunctionsThe organizational units termed Group Functions - Information Technology, Business Development,Administration, Finance & Control, Communication, Investor Relations and Human Resources - form asystem of services that support the Group’s Businesses and, by applying the Group’s policies andoperating its systems of control, guarantee the framework of governance within which those businessesare authorized to operate.
Operating processesThe Product & Design Department is responsible for developing collections; based in Agordo (Belluno),its center of excellence, it has teams in all the main markets to track new styles and trends.The Operations Department, also based in Agordo, is responsible for planning, engineering and productmanufacturing and distribution.
BusinessesThe Retail Distribution and Wholesale Distribution Segments are responsible for establishing commercialpresence in the world’s markets and developing profitable business. They have local sales organizations intheir various markets and use centralized structures providing support services.
ChairmanL. Del Vecchio
CEOA. Guerra
Business DevelopmentV. Giacobbi
Functions
Businesses
Operatingprocesses
OperationsA. Guerra
Internal AuditingM. Pacifico
Deputy ChairmanL. Francavilla
Human ResourcesN. Pelà
Admin., Finance, Control & Legal AffairsE. Cavatorta
InformationTechnologyC. Privitera
ComunicationsI. Dompé
Investor RelationsA. Senici
Product& Design
L. Francavilla
WholesaleA. Miyakawa
Retail Luxury & SunF. d’Angelantonio
OakleyS. Olivet
Retail OpticalNorth America
K. Bradley
Retail OpticalAustralasia
C. Beer
Retail Optical Greater ChinaG. Minakakis

| 31 <
In December 2008, Luxottica introduced the Group’s new global foundation, OneSight, a family ofcharitable vision care programs dedicated to improving vision through outreach, research and education.
OneSight is based on three regional programs previously operated independently within the Group – Givethe Gift of Sight, Pearle Vision Foundation and Community I-Care – and now combined under a new,global umbrella. Since 1988, Luxottica’s charitable efforts have provided free vision care and eyewear tomore than six million people worldwide and funded research and training. This operation will enableLuxottica to expand our worldwide reach and help even more people.
OneSight espouses three core values:
One World - Over 250 million adults and children worldwide suffer from poor vision because they don’thave access to eye exams or glasses. OneSight is global, as are the problems it has to deal with.
One Company - Luxottica has over 60,000 employees in 130 different countries across five continents andspeaking 55 different languages. OneSight can leverage the force and multi-cultural nature of the entireGroup to help people who are seriously in need.
One Passion - Despite geographical and cultural differences, all Luxottica employees share the sameobjective everyday: to offer the best eyewear and best service to every customer. OneSight takes theGroup’s passion for eyewear and eye care to a new level, giving additional meaning to employee’severyday work.
OneSight operates four programs:
• Global Eye Care, whereby volunteers carry out eye tests and deliver free recycled and newlymanufactured eyewear to thousands of adults and children in the poorest parts of the world.
• Regional Eye Care, in which volunteers work together with local partners to help those in need in theirregions by opening temporary clinics and using Vision Vans; this currently operates in North America,Australia and China.
• Community Eye Care, whereby Luxottica’s North American and Australian employees improve theircommunities’ quality of life by means of programs operating in stores, schools, rest homes and othercommunity centers.
• Preventative Eye Care, in which OneSight funds research into treatments and cures for vision-threatening diseases and disorders and invests in developing the next generation of optometricprofessionals through the Dr. Stanley Pearle Scholarship Fund.
ASSOCIATE BENEFITS
OneSight connects Luxottica Group employees worldwide as they work together towards a common goalof providing clear vision to those in need.
Participation in OneSight clinics requires intense teamwork to optimize the use of scant resources and timeand, as a result, multi-cultural teams form relationships and learn that diversity may unite rather thandivide. This collaboration accelerates inclusion and serves as an integrating influence on the differentcultures brought into the Group through acquisitions and geographical expansion.

> 32 | ANNUAL REPORT 2008
2008
368,812 people were helped during 20 international clinics across 11 countries, including India for the firsttime, by teams comprising over 700 volunteers. Glasses were distributed to over a million people in 2008,thanks in part to work by the new recycling centres in Pederobba (Treviso) and North Ryde (Australia),which were opened in 2008 in addition to the three existing structures in Cincinnati (USA), Agordo (Italy)and Port Washington (USA).
The 20 regional clinics in North America, Australia and China enabled 195 volunteers to help 33,807people; their operations were backed up in 2008 by Vision Vans which worked for 81 days. OneSightvolunteers for the first time reached Tianjing in China, where 1,001 people benefited from our services.
Initiatives in communities in North America and Australia helped 240,084 people in optical stores and localmissions.
Lastly, OneSight gave US$ 298,875 to 11 research organizations in the United States and Italy, as well asgranting 20 optometry degree scholarships in North America.
2009 GOALSHaving launched its new global organization, OneSight aims to raise public awareness and appeal amongits employees and Luxottica partners, provide opportunities to help the needy and foster strongerinterpersonal relations.
The Foundation will seek to leverage Luxottica’s global dimensions to extend its reach, especially inEurope and the Asia-Pacific region.
Program goals include 20 global clinics in 15 countries, with first-time visits to Brazil and South Africa, and25 weeks of regional clinics across North America, Australia and China.
OneSight will grant US$ 200,000 to support research projects related to diabetic retinopathy and pediatricvision disorders and award ten optometry degree scholarships.

ANNUAL REVIEW 2008


35 <
JanuaryLuxottica Group renewed its license agreement with Chanel, thus extending an already solid relationshipdating back to 1999, when Chanel’s first prescription and sun collections were launched. The newagreement aims to exploit new growth opportunities for this luxury brand.
AprilThe Group entered an exclusive license agreement to design, produce and globally distribute sun eyewearfor the Stella McCartney brand. Commencing on January 1, 2009, the agreement has an initial term of sixyears and automatic renewal for another six. The first collection will be launched in summer 2009.
MayThe Group signed a franchising agreement with the privately owned Diethelm Keller Limited enablingSunglass Hut to begin operations in Thailand’s promising sun eyewear market. The partnership will open15 new stores to add to the existing 216 Sunglass Hut retail locations in the Asia-Pacific region.
JuneLuxottica US Holdings, a subsidiary, made a private placement of three series of bonds, totaling US$ 275million, maturing in 2013, 2015 and 2018 respectively. The proceeds of the issue were used to repay partof a bridge loan that was used to finance a portion of the Oakley acquisition.
JulySuccessful conclusion of Oakley’s integration in Europe. Following Italy, Spain, Portugal, Scandinavia, TheNetherlands and Belgium, operations in Germany, Austria, Switzerland and France also became fullyintegrated. A new headquarters was opened in Zurich to manage the sports distribution channel inEurope.
NovemberThanks to the new franchising agreement with DLF, a leading property developer in India, Sunglass Hutmade a start in the Indian retail market. The agreement provides for the opening of over 100 storesthroughout the country, mostly in premium shopping malls and other prestige locations.
DecemberLaunch of OneSight, the new foundation who integrate the experience of Luxottica Group’s variousphilanthropy programs. OneSight will channel resources and energy into aid for the needy, throughrecycling, reconditioning and distribution of used eyewear by international and local missions, communityassistance and support for vision-related research.
KEY EVENTS

> 36 | ANNUAL REPORT 2008
Luxottica’s 2008 fiscal year was characterized by three factors: the first year of integration with Oakley, thedepreciation of the US dollar and other currencies used by the Group against the Euro, and the drasticslowdown first in the American and then the European markets.Despite the sudden deterioration in the second half, sales grew at sustained levels to top Euro 5 billion forthe first time in the Group’s history. This was mainly due to the contribution made by Oakley’s sales.The fourth quarter saw a significant contraction of demand, reflected in an erosion of margins in bothsegments.In this situation, Luxottica reacted with all the flexibility and efficacy of its integrated business model, whichenabled it to maintain a high level of free cash flow(1) in 2008 (Euro 302 million). Luxottica also benefitedfrom the effects of the merger with Oakley, ongoing capital investments (around Euro 300 million) andmeasures designed to boost sales and improve efficiency. The Group expects these measures to bear fruitin the coming quarters, helping to strengthen Luxottica’s balance sheet and optimize costs so that newopportunities can be taken up.In the second half, the Group launched a program to improve efficiency in the North American retaildivision, followed in the fourth quarter with a series of measures to adjust the industrial and logisticsinfrastructure to bring the Group in line with shrinking demand as quickly as possible.In 2008, Luxottica Group posted sales of Euro 5,201.6 million, up 4.7% from Euro 4,966.1 million in 2007.The consolidation of Oakley’s sales resulted in an increase to net sales of Euro 638.4 million, which waspartially offset by the combined effect of the following three factors:• exchange rates, and in particular the weakening of the US dollar, causing a negative impact of Euro
294.2 million, mostly at the retail level;• the slowdown in the retail distribution segment, which saw its sales decline by Euro 95.9 million; and• a slight contraction in sales (Euro 12.7 million) by the wholesale distribution segment, net of Oakley.
Pro forma(2) net sales decreased by Euro 337.4 million, or 6.1%, compared to 2007. A decrease in net salesin the retail distribution segment (down 2.1% on a pro forma basis(2) and at constant exchange rates) andthe strengthening of the Euro were the main causes of this contraction: their combined effect more thanoffset the increase in wholesale net sales to third parties (+1.3% at constant exchange rates in 2008).The consolidation of Oakley, which is a predominantly wholesale business, and the appreciation of theEuro, which had a bigger impact on the retail distribution segment, significantly changed the Group’srevenue breakdown. Sales for the retail distribution segment decreased from 65.7% of total sales in 2007to 59.8% of total sales in 2008; conversely, wholesale sales to third parties rose from 34.3% of total sales in2007 to 40.2% of total sales in 2008.
Analysis of costs and profitability shows that the cost of sales rose 10.7% to Euro 1,744.9 million from Euro1,575.6 million in 2007, mainly due to the growth in sales. As a percentage of sales, cost of sales rose from31.7% to 33.5%, above all due to the depreciation of the US dollar against the Euro: net sales are primarilyin US dollars, while costs are primarily in Euro. Gross profit in 2008 rose 2.0% to Euro 3,456.7 million fromEuro 3,390.4 million in 2007. Despite the increase in gross profit, gross profit decreased as a percentageof sales from 68.3% to 66.5%, due to a proportionately greater increase in the cost of sales.Total operating expenses increased by 5.9% to Euro 2,706.9 million from Euro 2,557.1 million in 2007,representing 52.0% of sales in 2008 against 51.5% of sales in 2007. Sales and advertising expenses, including royalties, also grew, by 4.5%, from Euro 2,069.3 million in 2007to Euro 2,161.4 million in 2008, mainly due to a Euro 53.9 million increase in sales force compensation. Asa percentage of sales, selling and advertising expenses were more or less stable at 41.5% (41.7% in 2007).General and administrative expenses, including amortization of intangible fixed assets, increased by 11.8%in 2008, to Euro 545.6 million from Euro 487.8 million in 2007, which was mainly due to a non-recurringcapital gain of Euro 20.0 million (before tax) relating to the disposal of a property in Milan in May 2007, an
FINANCIAL OVERVIEW
(1) Free cash flow and EPS before trademark amortization are not measures in accordance with US GAAP. For additional disclosures regarding non-USGAAP measures and a reconciliation to US GAAP measures, see Annex.(2) Pro forma data reflects the inclusion of results by Oakley, Inc., a subsidiary that was acquired in November 2007, as if it had been acquired onJanuary 1, 2007.

FINANCIAL OVERVIEW | 37 <
increase in the general and administrative expenses of the wholesale distribution segment arising fromproduction and distribution by the new Oakley business and Euro 26.5 million in amortization of Oakleyintangible fixed assets. These increases were partially offset by the completion of amortization of a numberof minor trade names (around Euro 6.3 million) and cost cutting over the year. As a percentage of sales,general and administrative expenses rose from 9.8% in 2007 to 10.5% in 2008.For the reasons described above, the Group’s income from operations decreased 10.0% to Euro 749.8million, from Euro 833.3 million in 2007. As a percentage of sales, income from operations decreased from16.8% in 2007 to 14.4% in 2008. Excluding the non-recurring capital gain from the sale of a property inMilan in 2007, income from operations would have decreased by 7.8%. On a pro forma basis(1), theoperating margin for 2007 would have been 15.5%.Net interest expense increased to Euro 122.0 million in 2008 from Euro 72.4 million in 2007, mainly due tothe increased indebtedness arising from the Oakley acquisition.
Net income in 2008 was Euro 379.7 million, down from Euro 492.2 million in 2007. Net of an extraordinarycapital loss of approximately Euro 15 million (after taxes) arising from the sale of a note receivable in 2008acquired as part of our sale of the Things Remembered business and the non-recurring capital gain fromthe sale of a property in Milan in 2007, net income in 2008 would have been Euro 395.0 million comparedto Euro 479.1 million in 2007. Earnings per share in 2008 was Euro 0.83 (at an average Euro/dollar exchangerate of 1:1.47). Net of the non-recurring events mentioned above, EPS was Euro 0.87, down 17.8% from2007. On a comparable basis, i.e. considering EPS in US dollars before trademark amortization(2), thedecrease would have been 9.2%. The decrease in EPS before trademark amortization was almost entirelydue to greater financial charges than in the previous year and to exchange rate fluctuations.
In a difficult year marked by the emergence of a huge financial and economic crisis, Luxottica nonethelessproduced solid results, in which the successful integration of Oakley undoubtedly played an importantrole. In particular, with respect to Oakley’s integration, we completed organizational restructuring inEurope and the emerging markets for the wholesale distribution segment as well as the integration of theAmerican and Australian retail chains, and the Group is starting to see the synergies it expected. Sharingof resources and cost savings in procurement, logistics and IT have also been achieved. On the productand marketing front, there were brand relaunches by REVO, assigned to a team in Foothill Ranch,California and Oliver Peoples, whose primary production is to be located in Agordo. There are alsointeresting opportunities in the sunglass lens business, stemming mainly from the power and recognitionof the Oakley brand, whose as yet unexpressed potential at a global level is considerable.
WHOLESALE
The economic slowdown in the second half of 2008 impacted significantly the wholesale business, mainlybecause of a drastic reduction by customers of stock levels in warehouses leading to a decline in orders inthe last quarter.Despite this, net sales to third parties in the manufacturing and wholesale distribution segment increasedby Euro 388.8 million (22.8%) to Euro 2,092.5 million in 2008 from Euro 1,703.7 million in 2007. Contributingto this net increase was Euro 467.4 million from the inclusion of additional net sales generated by Oakleyin 2008 and increased sales of house brands. These increases were partially offset by the decrease in netsales of license brands and by unfavorable currency fluctuations, due mainly to the US dollar’s weaknessagainst the Euro, which adversely affected net sales to third parties by Euro 66.0 million. Pro forma(1) net
(1) Pro forma data reflects the inclusion of results by Oakley, Inc., a subsidiary that was acquired in November 2007, as if it had been acquired onJanuary 1, 2007.(2) Free cash flow and EPS before trademark amortization are not measures in accordance with US GAAP. For additional disclosures regarding non-USGAAP measures and a reconciliation to US GAAP measures, see Annex.

> 38 | ANNUAL REPORT 2008
sales to third parties in 2008 would have been down by 1.8% from 2007 due again to the strengthening ofthe Euro. At constant exchange rates, the decrease would have been Euro 65.9 million (1.3%).
Geographically speaking, net sales to third parties in Europe in 2008 were Euro 1,077.2 million (up 5.5%,from 2007). Despite the increase in net sales to third parties in Europe, such sales decreased to 51.5% ofthe segment’s total net sales in 2008 from 59.9% in 2007, due primarily to the inclusion of the Oakleybusiness, which caused a proportionately greater increase in net sales to third parties in North America.In the United States and Canada, net sales to third parties was US$ 716.9 million, representing 23.3% ofthe segment’s total net sales in 2008 as compared to 18.1% in 2007. The 67.8% increase was driven by theinclusion of Oakley’s results and a good performance by house brands (especially Ray-Ban and Vogue). InEuro terms, net sales in North America rose by a more modest 57.7% because the increase due to theinclusion of the dollar-denominated Oakley business was diminished by the strong Euro.In the rest of the world, net sales to third parties were up 41.3% to Euro 527.8 million in 2008, representing25.2% of the segment’s total net sales in 2008 compared to 21.9% in 2007.
The segment’s operating income in 2008 was Euro 545.6 million, up 3.3% from Euro 528 million in 2007thanks to the Oakley business. Pro forma(2) operating margin declined to 22.1% from 23% in 2007.
It should be noted that Ray-Ban continued to drive the segment with double-digit growth in both sun andoptical products, confirming itself the global leader in terms of market share and brand equity.Authenticity, iconoclastic cool, quality and function are the brand values that have written the brand’shistory of success and continued to inspire its strategies and product launches in 2008, ever in line with the“Forever Ray-Ban” brand mission: continuous brand re-invention around a constant set of core values.The key event in 2008 was the Wayfarer launch. Luxottica gave the market a genuine reproduction of theoriginal 1952 model, recreated down to the smallest details with the latest manufacturing technology andwith an explosion of fashion colors in both frames and lenses. A full product offering, a dedicatedadvertising and PR plan and visibility in all points of sale confirmed Wayfarer as today's edgiest icon ineyewear.Ray-Ban has always stood for quality and function, yet 2008 marked a highly important new stage in itsgrowth. In the sun business, polarized lens sales saw global growth thanks to an expansion of the crystalrange, offering improved clarity and protection. In the optical business, the launch of the Titanium andMemorize styles scored worldwide success with their appeal to consumers looking for comfort, lightnessand design.In November 2008, as part of the same high-value strategy, Ray-Ban made its second limited editionlaunch: the “Caravan Ultra Limited Edition”. After the success of Aviator in 2007, another key icon,Caravan, was released in precious materials like gold and titanium, with ultra high quality polarized lensesand special color enhancement. Caravan Ultra was distributed to strictly selected retailers and soldexcellently worldwide.High satisfaction was also delivered by the Oakley brand. Despite organizational discontinuities, Luxotticamanaged to considerably develop the brand’s sales and visibility in European and emerging markets, thusdemonstrating the enormous value, current and future, of the 2007 acquisition created by thecomplementary strengths of the merged businesses.Sales of Oakley brand sunglasses were up from 2007 across all categories (sport/active, lifestyle, men’s andwomen’s), partly due to massive presence at the 2008 Beijing Games, which boosted brand awareness andsales.Oakley’s lifestyle collection continued to garner worldwide attention thanks to styles such as Hijinx and thenewly released Antix. Oakley’s sport line showed strong growth with the introduction of Enduring, Oakley’sfirst women’s sport-specific piece, and with continuing success by Flak Jacket and Radar.
(1) Pro forma data reflects the inclusion of results by Oakley, Inc., a subsidiary that was acquired in November 2007, as if it had been acquired onJanuary 1, 2007.

FINANCIAL OVERVIEW | 39 <
Oakley stepped up its commitment to the women’s eyewear business by doubling the number of stylesreleased in 2008.Awareness of Oakley’s superior lens technologies has also helped increase sales of Oakley’s polarizedeyewear. Oakley enthusiasts continue to flock to the premium priced Exclusive Eyewear collection, whichincludes signature models such as LiveStrong and Ducati and the highly successful Major League Baseball(MLB).Oakley goggle sales were up from 2007. The Shaun White and Gretchen Bleiler models in the snow lineand the James Stewart MX line were the key contributors in 2008, along with strong sales in militarygoggles. Exposure in the 2008 X-Games created increased awareness that helped to drive sales. ESSbrand military goggles were similarly successful.Oakley’s Custom Eyewear Program grew in 2008 driven by an expanded style and color offering, channelpresence in Oakley retail doors and a re-designed Oakley.com website. In 2008, Oakley goggles were alsoadded to the Oakley Custom Program, which allows consumers to choose frame, lens and customizablestrap combinations to fit their personal preferences.Lastly, the license brand portfolio was enriched by the emerging Stella McCartney brand, whose suncollections will start being distributed in summer 2009, and by the renewal of the Chanel license, one ofthe world’s most prestigious luxury brands whose collaboration with Luxottica has been an asset to theGroup for years.
RETAIL
For fiscal year 2008, net sales by the retail distribution segment were Euro 3,109.1 million compared to Euro3,262.3 million in 2007. The 4.7% decrease was largely due to the strengthening of the Euro against the USdollar (reducing net sales by Euro 228.3 million) and to a 6.8% decrease in comparable store sales(1) in NorthAmerica. The negative effect of exchange rates was partially offset by the inclusion of Oakley’s retail results(Euro 170.9 million).
Pro forma(2) retail net sales in 2008 was down by 8.8% from 2007 due to both the strengthening of the Euro,with a negative impact of Euro 228.3 million, and to poor performance overall in the retail distributionsegment, which lost Euro 70.5 million (2.1%) as demand contracted.
Geographically, the contraction in sales in North America, where traffic through stores had begun to slackenat the beginning of the year, was offset by a substantially positive performance by the segment in all otherregions.Net sales by the North American retail division accounted for 83.6% of total retail net sales worldwideagainst 84.1% in 2007. In US dollars, net sales in North America rose 1.6% from US$ 3,763.7 million in 2007to US$ 3,822.3 million in 2008 thanks primarily to the inclusion of the Oakley business. In euros, on the otherhand, performance was negative, with net sales falling 5.3% due to the strengthening of the Euro againstthe dollar.
In the optical business, comparable store sales(1) by LensCrafters and Pearle Vision were down 6.5%, whilesales by licensed brand chains fell 9.1% in 2008. The sun business, on the other hand, proved less cyclical. Comparable store sales by Sunglass Hut acrossthe globe were down 4.9% year over year in 2008, with a marked difference between results in NorthAmerica and other regions, such as Australia and New Zealand (which grew by around 4.5%).
(1) Comparable store sales reflects the change in sales from one period to another that, for comparison purposes, includes in the calculation onlystores open in the more recent period that also were open during the comparable prior period, and applies to both periods the average exchangerate for the prior period and the same geographic area(2) Pro forma data reflects the inclusion of results by Oakley, Inc., a subsidiary that was acquired in November 2007, as if it had been acquired onJanuary 1, 2007.

> 40 | ANNUAL REPORT 2008
The operating income for the retail distribution segment in 2008 was Euro 291.5 million, down 19.4% fromEuro 361.8 million in 2007. The pro forma(1) operating margin dropped to 9.4% in 2008 from 11.1% in 2007.
The expansion of the retail distribution segment proceeded without interruption, especially in terms ofopportunities in emerging markets. The Sunglass Hut brand began operations in 2008 in Thailand and Indiaunder two franchising agreements with high profile local partners. In Thailand, the Group plans to launchits initial operations in this important tourist destination by opening 15 new retail locations with DiethelmKeller Limited. In India, it is planning to have 100 retail locations, at full capacity to be operated underfranchise by DLF, and these, like the new Sunglass Huts in Thailand, will be added to the 216 retail locationsalready operating in the Asia-Pacific region (which includes Australia, New Zealand, Hong Kong andSingapore).
In the meantime, retail presence in Europe was given new impetus by the full consolidation of David Clulow,the highly successful UK chain operating in both the sun and optical businesses. In North America, wherethe BJ’s Optical store contract expired in March 2008 and was not renewed, the retail division initiatedrationalization and refocusing programs.
(1) Pro forma data reflects the inclusion of results by Oakley, Inc., a subsidiary that was acquired in November 2007, as if it had been acquired onJanuary 1, 2007.

| 41 <
EVENTS IN 2009
In January 2009, Luxottica Group entered into two agreements that further strengthen its licensed brandportfolio.On January 28, 2009, the Company entered into a new licensing agreement to design, manufacture andglobally distribute sun and prescription eyewear collections by Tory Burch and TT, two emerging Americanfashion and lifestyle brands. The agreement with Tory Burch LLC will run for six years - renewable for afurther four - and envisages the launch of the first collection in 2009.The new collections will be distributed not only by Tory Burch boutiques and premium Americandepartment stores but also in select independent optical stores and in Luxottica’s retail chains. After NorthAmerica, distribution will be extended to Europe and the rest of the world. Tory Burch, a highlyappreciated brand in the affordable luxury category, completes Luxottica’s brand portfolio by furtherstrengthening its positioning in the key North American market and in the continually expandingdepartment store channel.On January 30, 2009, Luxottica Group and Salvatore Ferragamo Italia S.p.A., which controls GruppoFerragamo, agreed to a three-year extension of their licensing agreement covering design, manufacturingand global distribution of prescription and sun eyewear under the Salvatore Ferragamo label. This renewalof an agreement originally signed in 1998 is an ultimate endorsement of a propitious collaboration with amajor player in the global luxury category, thanks to which Luxottica will continue to develop prestigiouscollections that leverage the universally recognized quality of “Made in Italy.”The new agreement runs until December 2011, with an option on a two-year renewal under the sameterms.In April, the strategy of lengthening the average duration of licenses and consolidating relationships withlicensors led to the renewal of the licensing agreement with Donna Karan International Inc., which hasbeen part of the LVMH group, the world’s leader in luxury goods, since 2001. The term of the new contract,which covers prescription and sun collections under the Donna Karan and DKNY brands, is December2014, with an option on renewal for a further five years.
OUTLOOK FOR 2009
2009 promises to be a difficult year, especially the first two quarters, and comparison with 2008 will bedifficult because of the structural adjustments the market is undergoing. In these two quarters the Groupwill complete most of the measures that will enable it to optimally manage change in the market and bestronger and better positioned for the future.
BOOSTING SALES
Having closed the sixth consecutive year of double-digit growth, Ray-Ban is fully expected to continue asthe world’s top eyewear brand in 2009 thanks to the success of its icon models, an improved product mix,an acceleration in the optical business and the launch of collections that are particularly innovative in termsof both design and materials, such as Ray-Ban Tech.In 2009, Luxottica is expected to draw further benefit from the second year of integration with Oakley, fromfurther synergies between the two structures and from Oakley’s as yet unexpressed potential in Europeand emerging markets. The brand has significant growth prospects for 2009, including the launch of newmodels in the sport and performance categories, ongoing development of its optical and women’scollections and its exclusive sun lens technology, which is one of the best on the market and may yieldpowerful synergies across the Group. The innovative Jawbone model is expected to further the success ofthe brand.2009 will be an important year for REVO, whose production and distribution through the sports channelhas been assigned to Oakley.
OUTLOOK

> 42 | ANNUAL REPORT 2008
On the premium and luxury front, numerous projects, collections and special editions are being developedto attract customers in this category.In the prescription eyewear business, which is less cyclical, Luxottica will carry forward the drive to improvemarket penetration, customer service and breadth of offering. Of key importance here will be thelaunching of the Prada Linea Rossa, Arnette and Ralph optical collections.High level priority will be given to differentiation of the offering by geographical region and type ofcustomer, so that sales strategies can be tailored to local demand.In this context, a more incisive approach to the main customers will be developed in order to leverage theentire brand portfolio to maximum effect by longer term planning and investment in the potential of singlecustomers.After three years of success, the STARS program will be extended, with the aim of topping 1,000 customersand establishing even more solid relationships with this important segment of customers.Following expansion in Thailand and India, the retail distribution segment will be assessing newopportunities in emerging countries and also any premium locations that may become available, even inmore mature markets.In North America, the strategy of segmentation and differentiation of customers across the Group’s variouschains will be continued, the aim being to optimize the potential of each brand to attract new customers.In this context, LensCrafters’ drive to reinforce its position by leveraging its values of service excellenceand breadth of offering will be particularly important.
BALANCE SHEET OPTIMIZATION AND EFFICIENCY DRIVE
In 2009, the process of optimizing net working capital and the balance sheet will continue. There will be aplanned reduction in inventory levels of approximately 10-15% and a significant efficiency improvementthroughout the entire supply chain, as well as a review of commercial conditions for around 80% ofsuppliers.New investments, which will be just under Euro 200 million in 2009, will be carefully focused on high valuedadded projects in the field of information technology and the supply chain.Containment of all expenses, whether industrial or commercial, will continue to be a high priority. Thebrand portfolio and international commercial structure will be further optimized. Advertising spending willbe cut by 10% in both segments, while product promotion at points of sale will be stepped up.The retail distribution segment’s presence will also be optimized in North America by the planned sale of56 Pearle Vision corporate stores to potential franchisees, closing of 117 stores and placing of another 110under review.

| 43 <RISK MANAGEMENT
The purpose of the Financial Risk Management Policy is to define consistent principles for risk managementfor all companies belonging to Luxottica Group. The Board of Directors of Luxottica Group is responsibleto approve this Policy and defines the:• Delegation of responsibility and authority;• Risk management activities and organization;• Principles for managing the risk management activities and financial risks and• Principles of risk management reporting and control.The principles and rules set out by this Policy shall be followed throughout the Group. This Policy supportsthe objective of effective and uniform risk management in the interest of the entire company belonging toLuxottica Group.Luxottica Group’s financial risks are related either to financial assets and liabilities denominated in localand foreign currencies (Interest Rate Risk) or to incomes and expenses denominated in currencies otherthan the functional currency (Foreign Currency Risk).
Interest rate risk is defined as follow:1. the uncertainty of cash flows related to the Group’s assets and liabilities structure caused by changes in
interest rates;2. the variability of market value of the Group’s assets and liabilities caused by changes in market interest
rates. Floating rate assets or liabilities are related to the first definition above, while fixed rate assets or liabilitiesare under the second one.The value of assets and liabilities are directly dependent on the prevailing interest rate level. The interestrate risk of assets and liabilities can be categorised into flow risk and price risk defined as follows:flow risk refers to the sensitivity of the interest amounts to changes in interest rates. The flow risk is coveredby Cash Flow hedge instruments, as defined below. price risk refers to the sensitivity of the market value of assets and liabilities to changes in the level ofmarket interest rates. The price risk is covered by Fair Value hedge instruments, as defined below.
As a consequence the objective of interest rate risk management is to reduce the uncertainty of theGroup’s net interest result.This is achieved reducing the volatility of the interest impact in the Group’s income statement andcontrolling the fluctuation of the net debt market value.In order to pursue the above risk management objective, the whole Group’s interest rate risk exposure, interm of notional amount, has to be composed as a mix of fixed interest rate and floating interest ratewhere neither of the two components will be lower than 25% or higher than 75%.
Foreign currency risk is defined as follow:1. the uncertainty of the value of net income, cash flows related to the Group’s firm commitment,
forecasted transactions created by changes in currency rate;2. the variability of market value of foreign-currency-denominated assets and liabilities due to changes in
currency rates. The objective of foreign currency risk management is to support the Group in minimising the uncertaintyand reaching its business objectives set by Group Planning by limiting this uncertainty, e.g. throughminimizing the impact on income statement of a random effects of currency rate changes.Group’s foreign currency position is divided into transaction, translation and competitive position.Positions are managed separately because of their different natures and effects on the Group’s incomestatement and balance sheet. The total position at Group level consists of all recognised currencydependent items. Transaction risk is defined as the effect coming from difference in foreign currency rates at the time ofpricing or contracting and of realization of a transaction. Transaction risk is defined in relation to the basecurrency of a company.
> 44 | ANNUAL REPORT 2008
Translation risk is defined as the effects of changes in foreign currency rates on the consolidated incomestatement and balance sheet of the Group. As the foreign Group Companies’ income statement andbalance sheets are translated into the Group functional currency using market foreign currency rates, thevalues of the Group’s consolidated net income, assets, debt and equity change. In addition to the absoluteamounts, also the balance sheet ratios like gearing and equity ratio may change, if the proportion of netincome, assets, equity, debt and equity in the various currencies differ. Competitive risk refers to the Group’s foreign currency rate sensitivity in comparison to its competitors, i.e.to the long term effects of currency rate changes to the economic position of the Group in any affectedmarket.

| 45 <
GROUP WORKFORCE
Luxottica Group employees as of December 31, 2008 totaled 60,975, of whom 69% were engaged in theretail distribution segment, 22.5% in the wholesale distribution segment and 8.2% at Oakley. Corporatecentral services employs 0.3% of the Group’s total workforce.On a regional basis, 64% of employees are in North America, 15.5% in Europe, 18.8% in the Asia-Pacificregion and 1.5% in other geographical regions.
Business area Headcounts
Retail 42,043
Wholesale 13,766
Oakley 4,982
Milan headquarters 184
Total 60,975
Geographical region Headcounts
Europe 9,423
North America 39,003
Asia Pacific 11,454
ROW 911
Milan headquarters 184
Total 60,975
ROW includes Russia, Middle East, South Africa, Latin America
ORGANIZATIONAL DEVELOPMENT
Of the organizational development initiatives completed in 2008, special mention must be made of thesuccessful integration of the wholesale commercial organizations of Luxottica and Oakley and the set upof a pan-European organization based in Zurich to manage Oakley’s diversified businesses.The wholesale distribution segment completed a number of initiatives aimed at penetrating new, high-growth markets. In China, India and the Middle East, the marketing and sales organization was upgraded;in South Africa, the wholesale team is now ready to take up new business opportunities arising from the2010 World Cup (football); and in Europe, Luxottica UK successfully completed its integration of the salesorganizations of Sunglass Hut and David Clulow and the creation of shared service structures for thewholesale and retail businesses.
One of the most significant projects aiming to recover organizational competitiveness was the radicalreview of central service structures in North America and the creation of marketing and sales structuresserving the main retail chains (LensCrafters, Pearle Vision, Sunglass Hut and the licensed brands). No lesssignificant were the measures taken in production facilities to introduce management systems designedto achieve greater organizational flexibility and continual improvement of product quality.
HUMAN RESOURCES

> 46
HUMAN RESOURCES DEVELOPMENT
2008 was another year in which Luxottica was one of the organizations most highly rated in terms of humanresources management and development. In addition to the more traditional initiatives, the Companymade considerable efforts to strengthen employees’ sense of identity and belonging, without which it isimpossible to develop motivated, high-performing resources at all levels of the organization.
On the operations front, Luxottica’s values of imagination, passion, entrepreneurialism, speed andsimplicity were translated into 12 specific management “commitments” under which the organizationreshaped its main human resources development systems in 2008. The commitments were: 1. To enrich the content of organizational positions, starting at the basic operating level, and reduce the
number of managerial positions to those offering a clear contribution to the co-ordination andintegration of the organization.
2. To prioritize development of resources already in the organization and only bring in people fromoutside in cases of real necessity or opportunity.
3. To select candidates whose profiles not only satisfy the required technical skills but also closely reflectthe Company’s values and the style of professional conduct the organization expects.
4. To favor positive and effective induction of new entries by creating the conditions for long-term,mutually satisfying relationships right from the start.
5. To ensure systematic assessment of training requirements and design increasingly personalizedlearning and professional development programs.
6. To privilege learning through action and the assignment of challenging tasks in order to continuallyimprove people’s capacities.
7. To measure performance mainly in terms of a person’s combined capacity to pursue objectives (thewhat) by adopting the right organizational approaches (the how); such performance assessment to bebased on analysis of data and fact, thus achieving maximum clarity and objectivity of judgment.
8. To use results obtained and speed of learning as the basis for assessing the capacity to acceptincreasing levels of responsibility in the organization.
9. To render assessment of people’s performance and potential as democratic a process as possible,especially for the positions of higher responsibility within the organization.
10. To ensure that meritorious resources can also develop outside their areas of entry and rewardmanagers who foster the development of their resources by giving them opportunities to moveoutside the organizational units they manage.
11. To develop channels for clear and effective communication of organizational development policies,strategies and plans and train managers to communicate effectively and always be ready to listen totheir collaborators; and
12. To develop a “value proposition” that effectively satisfies the various expectations and aspiration ofindividuals, thus making Luxottica a really ideal to place in which to work and improve.
Lastly, initiatives in 2008 to boost and optimize return on professional capital included:• Relations with universities: collaboration agreements were officially entered into with ISB, Hyderabad
and CEIPS, Shanghai, thus enriching the portfolio of partnerships already in operation for years withother prestigious universities and business schools in various countries.
• Succession plans: the corporate process of talent identification and definition of managementsuccession plans for the key positions in the Group was extended across the entire organization.
• Annual Incentive System: the short-term incentive system (MBO) was extended to all management and

HUMAN RESOURCES | 47 <
professional positions by introducing a single corporate process for defining objectives and assessingresults.
• Long-term Incentive System: a 3-year senior management incentive system tied to generating value forshareholders (EPS) was introduced.
• Work safety: prevention and protection measures were adopted to achieve “zero risk” and promotecontinual improvement and safety culture at all levels of the organization rather than merelymaintaining legal conformity.
LUXOTTICA’S PEOPLE CHARACTERISTICS
IMAGINATIVEOur ability to look at things in new ways has been the foundation of our success. We are and havealways been creative, inspired and resourceful in the way we work and in the way we interact withour customers.
ENTREPRENEURIALWe see the opportunities that others don’t and understand the value of taking risks. We trust ourinstincts and listen to our intuition so that in the future as in the past we continue to be theinnovators in our industry.
PASSIONATEWe love what we do. Our passion for our business is rooted in our history. We are proud of ourachievements and have a genuine belief that what we do makes a difference to people’s lives.
SIMPLE AND FASTWe believe in simplicity and understand the value of being straightforward, uncomplicated, andaccessible. We get things done more quickly by working in an open and informal way and by cuttingthrough to the essentials. We have a clear focus on being fast both in terms of delivering results andresponding to change.


CONSOLIDATEDFINANCIAL STATEMENTSUNDER US GAAP


CONSOLIDATED STATEMENT OF INCOME | 51 <
CONSOLIDATED STATEMENTS OF INCOME FOR THE YEARS ENDEDDECEMBER 31, 2008, 2007 AND 2006 (*)
2008 2008 2007 2006
(US$ 000) (1) (Euro 000)
NET SALES $7,240,123 €5,201,611 €4,966,054 €4,676,156
COST OF SALES (2,428,735) (1,744,907) (1,575,618) (1,487,700)
GROSS PROFIT 4,811,387 3,456,705 3,390,436 3,188,456
OPERATING EXPENSES:
Selling and advertising (3,008,412) (2,161,371) (2,069,280) (1,948,466)
General and administrative (759,380) (545,571) (487,843) (484,002)
Total (3,767,793) (2,706,942) (2,557,123) (2,432,468)
INCOME FROM OPERATIONS 1,043,595 749,763 833,313 755,987
OTHER INCOME (EXPENSE):
Interest income 18,464 13,265 17,087 9,804
Interest expense (188,278) (135,267) (89,498) (70,622)
Other - net (52,739) (37,890) 19,780 (16,992)
Other expense - net (222,554) (159,892) (52,631) (77,810)
INCOME BEFORE PROVISION FOR INCOME TAXES 821,041 589,870 780,681 678,177
PROVISION FOR INCOME TAXES (270,943) (194,657) (273,501) (238,757)
INCOME BEFORE MINORITY INTERESTS
IN CONSOLIDATED SUBSIDIARIES 550,097 395,213 507,180 439,420
MINORITY INTERESTS IN INCOME
OF CONSOLIDATED SUBSIDIARIES (21,563) (15,492) (14,976) (8,715)
NET INCOME FROM CONTINUING OPERATIONS 528,535 379,722 492,204 430,705
DISCONTINUED OPERATIONS, NET OF TAXES (6,419)
NET INCOME $528,535 €379,722 €492,204 €424,286
EARNINGS PER SHARE: BASIC
Continuing operations 1.16 0.83 1.08 0.95
Discontinued operations (0.01)
Net income 1.16 0.83 1.08 0.94
EARNINGS PER SHARE: DILUTED
Continuing operations 1.15 0.83 1.07 0.94
Discontinued operations (0.01)
Net income 1.15 0.83 1.07 0.93
WEIGHTED AVERAGE NUMBER OF SHARES OUTSTANDING
Basic 456,563,502 456,563,502 455,184,797 452,897,854
Diluted 457,717,044 457,717,044 458,530,609 456,185,650
(1) Translated for convenience at the New York City Noon Buying Rate as determined in Note 1(*) In accordance with US GAAPSee notes to the consolidated financial statements

> 52 | ANNUAL REPORT 2008
CONSOLIDATED BALANCE SHEETS AT DECEMBER 31, 2008 AND 2007 (*)
2008 2008 2007
(US$ 000) (1) (Euro 000)
ASSETS
CURRENT ASSETS
Cash and cash equivalents $401,494 €288,450 €302,894
Marketable securities 32,779 23,550 21,345
Accounts receivable - net
(Less allowance for doubtful accounts, Euro 29.1 million
in 2008 (US$ 40.5 million) and Euro 25.5 million in 2007 876,922 630,018 665,184
Sales and income taxes receivable 211,024 151,609 89,000
Inventories - net 794,757 570,987 575,016
Prepaid expenses and other 200,509 144,054 139,305
Deferred tax assets - net 183,601 131,907 117,853
Total current assets 2,701,086 1,940,575 1,910,597
PROPERTY, PLANT AND EQUIPMENT - net 1,629,494 1,170,698 1,057,782
OTHER ASSETS
Goodwill 3,750,855 2,694,774 2,601,840
Intangible assets - net 1,717,647 1,234,030 1,306,117
Investments 7,659 5,503 17,668
Other assets 245,252 176,199 195,370
Deferred tax assets - net 116,150 83,447 67,891
Total other assets 5,837,562 4,193,952 4,188,887
TOTAL ASSETS $10,168,142 €7,305,225 €7,157,266
(Continued)

CONSOLIDATED BALANCE SHEET | 53 <
2008 2008 2007
(US$ 000) (1) (Euro 000)
(1) Translated for convenience at the New York City Noon Buying Rate as determined in Note 1(*) In accordance with US GAAPSee notes to the consolidated financial statements
LIABILITIES AND SHAREHOLDERS’ EQUITY
CURRENT LIABILITIES
Bank overdrafts $601,948 €432,465 €455,588
Current portion of long-term debt 398,379 286,213 792,617
Accounts payable 554,088 398,080 423,432
Payroll and related 183,215 131,630 132,983
Customers’ right of return 43,654 31,363 26,557
Other 360,715 259,153 308,738
Income taxes payable 25,545 18,353 19,314
Total current liabilities 2,167,544 1,557,255 2,159,229
LONG-TERM DEBT 3,506,599 2,519,289 1,926,523
LIABILITY FOR TERMINATION INDEMNITIES 77,281 55,522 56,911
DEFERRED TAX LIABILITIES - NET 325,079 233,551 248,377
OTHER LONG-TERM LIABILITIES 536,838 385,687 229,972
MINORITY INTERESTS IN CONSOLIDATED SUBSIDIARIES 65,876 47,328 41,097
SHAREHOLDERS’ EQUITY
Capital stock par value Euro 0.06 - 463,368,233 and 462,623,620
ordinary shares authorized and issued at December 31, 2008
and 2007, respectively; 456,933,447 and 456,188,834 shares
outstanding at December 31, 2008 and 2007, respectively 38,698 27,802 27,757
Additional paid-in capital 419,699 301,529 277,947
Retained earnings 3,883,253 2,789,894 2,636,868
Accumulated other comprehensive loss, net of tax (755,308) (542,646) (377,428)
Total 3,586,342 2,576,580 2,565,145
Less treasury shares at cost; 6,434,786 and 6,434,786
shares at December 31, 2008 and 2007, respectively 97,415 69,987 69,987
Total shareholders’ equity 3,488,927 2,506,593 2,495,158
TOTAL LIABILITIES AND SHAREHOLDERS’ EQUITY $10,168,142 €7,305,225 €7,157,266

> 54 | ANNUAL REPORT 2008
CONSOLIDATED STATEMENTS OF SHAREHOLDERS’ EQUITY FOR THE YEARS ENDEDDECEMBER 31, 2006, 2007 AND 2008 (*)
AccumulatedOther other
Additional Unearned comprehensive comprehensive Treasury TotalCommon stock paid-in Retained stock-based income (loss) income (loss) shares amount, shareholders’
Shares Amount capital earnings compensation net of tax net of tax at cost equity
BALANCES AT JANUARY 1, 2006 457,975,723 27,479 150,179 2,050,883 (48,567) (155,954) (69,987) 1,954,033
Exercise of stock options 2,240,525 134 24,308 24,443
Translation adjustment (126,853) (126,853) (126,853)
Effect of adoption of SFAS 123 R (48,567) 48,567
Realized stock based compensation 47,969 47,969
Minimum pension, liability, net
of taxes of Euro 0.4 million (624) (624) (624)
Effect of adoption SFAS 158,
net of taxes of Euro 5.5 million (8,409) (8,409) (8,409)
Unrealized gain on available-for-sale securities,
net of taxes of Euro 0.5 million 1,244 1,244 1,244
Diluted gain on business combinations, SAB 5-H gain 21,847 21,847
Excess tax benefit on stock options 7,279 7,279
Change in fair value of derivative instruments,
net of taxes of Euro 1.8 million 2,003 2,003 2,003
Dividends declared (Euro 0.29 per share) (131,369) (131,369)
Income from continuing operations 430,705 430,705 430,705
(Loss) on discontinued operations (6,419) (6,419) (6,419)
Comprehensive income 291,647
BALANCES, DECEMBER 31, 2006 460,216,248 27,613 203,016 2,343,800 (288,593) (69,987) 2,215,849
Exercise of stock options 2,407,372 144 26,498 26,642
Translation adjustment (90,881) (90,881) (90,881)
Effect of adoption of FIN 48 (8,060) (8,060)
Realized stock based compensation 42,121 42,121
Minimum pension, liability, net of taxes
of Euro 3.9 million 9,688 9,688 9,688
Unrealized gain on available-for-sale securities,
net of taxes of Euro 0.9 million (1,579) (1,579) (1,579)
Excess tax benefit on stock options 6,313 6,313
Change in fair value of derivative instruments,
net of taxes of Euro 4.6 million (6,062) (6,062) (6,062)
Dividends declared (Euro 0.42 per share) (191,077) (191,077)
Net income 492,204 492,204 492,204
Comprehensive income 403,369
BALANCES, DECEMBER 31, 2007 462,623,620 27,757 277,947 2,636,868 (377,428) (69,987) 2,495,158
(Continued)

CONSOLIDATEDSTATEMENTS OF
SHAREHOLDERS’ EQUITY | 55 <
(1) Translated for convenience at the New York City Noon Buying Rate as determined in Note 1(*) In accordance with US GAAPSee notes to the consolidated financial statements
BALANCES, DECEMBER 31, 2007 462,623,620 27,757 277,947 2,636,868 (377,428) (69,987) 2,495,158
Exercise of stock options 744,613 45 7,081 7,126
Translation adjustment (73,682) (73,682) (73,682)
Realized stock based compensation 10,424 10,424
Adjustment to pension liability,
net of taxes of Euro 29.2 million (50,658) (50,658) (50,658)
Adoption of SFAS No. 158 measurement date
provisions, net of taxes of Euro 1.9 million (3,079) (3,079)
Unrealized gain on available-for-sale securities,
net of taxes of Euro 0.2 million 409 409 409
Excess tax benefit on stock options 631 631
Change in fair value of derivative instruments,
net of taxes of Euro 20.7 million (41,287) (41,287) (41,287)
Diluted gain on business combinations 5,446 5,446
Dividends declared (Euro 0.49 per share) (223,617) (223,617)
Net income 379,722 379,722
Comprehensive income (165,218)
BALANCES, DECEMBER 31, 2008 463,368,233 27,802 301,529 2,789,894 (542,646) (69,987) 2,506,593
Comprehensive income (1) (US$ 000) (229,967)
BALANCES, DECEMBER 31, 2008 (1) 463,368,233 38,698 419,699 3,883,253 (755,308) (97,415) 3,488,927
(US$ 000) (1)
AccumulatedOther other
Additional Unearned comprehensive comprehensive Treasury TotalCommon stock paid-in Retained stock-based income (loss) income (loss) shares amount, shareholders’
Shares Amount capital earnings compensation net of tax net of tax at cost equity
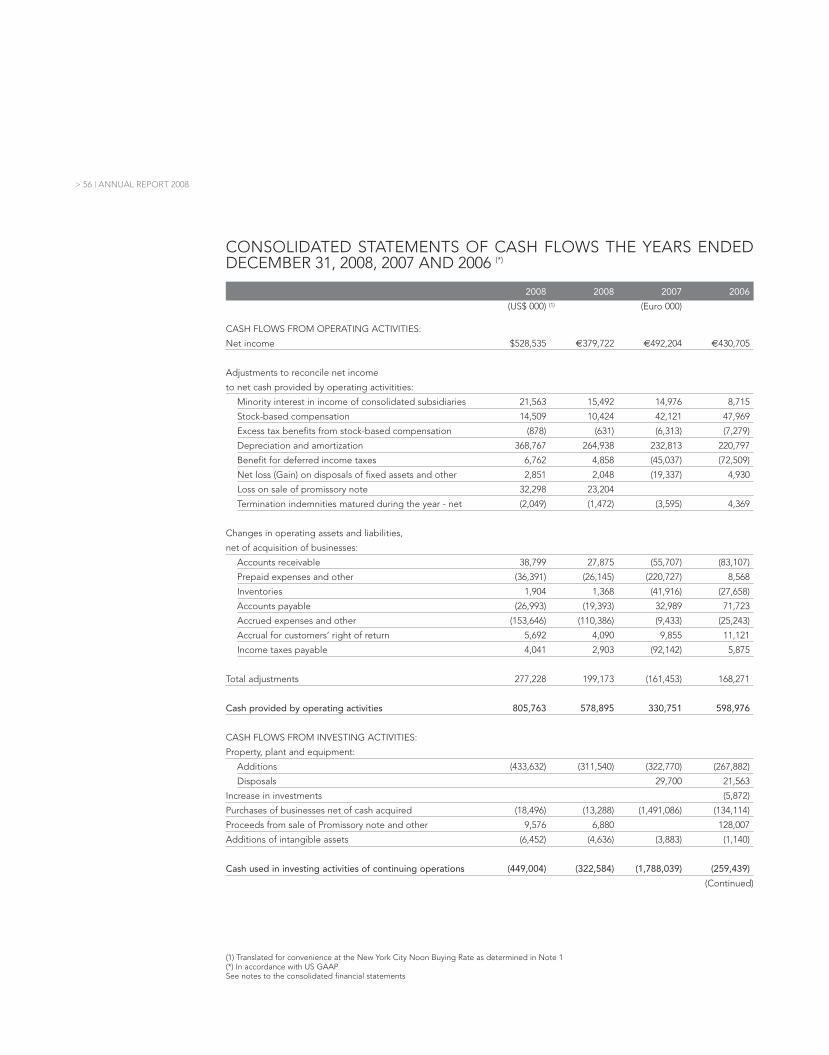
> 56 | ANNUAL REPORT 2008
CONSOLIDATED STATEMENTS OF CASH FLOWS THE YEARS ENDEDDECEMBER 31, 2008, 2007 AND 2006 (*)
2008 2008 2007 2006
(US$ 000) (1) (Euro 000)
CASH FLOWS FROM OPERATING ACTIVITIES:
Net income $528,535 €379,722 €492,204 €430,705
Adjustments to reconcile net income
to net cash provided by operating activitities:
Minority interest in income of consolidated subsidiaries 21,563 15,492 14,976 8,715
Stock-based compensation 14,509 10,424 42,121 47,969
Excess tax benefits from stock-based compensation (878) (631) (6,313) (7,279)
Depreciation and amortization 368,767 264,938 232,813 220,797
Benefit for deferred income taxes 6,762 4,858 (45,037) (72,509)
Net loss (Gain) on disposals of fixed assets and other 2,851 2,048 (19,337) 4,930
Loss on sale of promissory note 32,298 23,204
Termination indemnities matured during the year - net (2,049) (1,472) (3,595) 4,369
Changes in operating assets and liabilities,
net of acquisition of businesses:
Accounts receivable 38,799 27,875 (55,707) (83,107)
Prepaid expenses and other (36,391) (26,145) (220,727) 8,568
Inventories 1,904 1,368 (41,916) (27,658)
Accounts payable (26,993) (19,393) 32,989 71,723
Accrued expenses and other (153,646) (110,386) (9,433) (25,243)
Accrual for customers’ right of return 5,692 4,090 9,855 11,121
Income taxes payable 4,041 2,903 (92,142) 5,875
Total adjustments 277,228 199,173 (161,453) 168,271
Cash provided by operating activities 805,763 578,895 330,751 598,976
CASH FLOWS FROM INVESTING ACTIVITIES:
Property, plant and equipment:
Additions (433,632) (311,540) (322,770) (267,882)
Disposals 29,700 21,563
Increase in investments (5,872)
Purchases of businesses net of cash acquired (18,496) (13,288) (1,491,086) (134,114)
Proceeds from sale of Promissory note and other 9,576 6,880 128,007
Additions of intangible assets (6,452) (4,636) (3,883) (1,140)
Cash used in investing activities of continuing operations (449,004) (322,584) (1,788,039) (259,439)
(Continued)
(1) Translated for convenience at the New York City Noon Buying Rate as determined in Note 1(*) In accordance with US GAAPSee notes to the consolidated financial statements

CONSOLIDATED STATEMENTS OF CASH FLOWS | 57 <
CASH FLOWS FROM FINANCING ACTIVITIES:
Long-term debt:
Proceeds 1,385,927 995,709 2,145,428 84,100
Repayments (1,399,490) (1,005,453) (675,834) (233,378)
Repayment of acquired lines of credit (166,577)
(Decrease) increase in overdraft balances (42,551) (30,570) 282,280 (101,008)
Exercise of stock options 9,919 7,126 26,642 24,443
Excess tax benefit from stock-based compensation 878 631 6,313 7,279
Dividends (311,253) (223,617) (191,077) (131,369)
Cash used in financing activities of continuing operations (356,569) (256,174) 1,427,174 (349,933)
(DECREASE) INCREASE IN CASH AND CASH EQUIVALENTS 190 137 (30,114) (10,395)
CASH AND EQUIVALENTS, BEGINNING OF YEAR 421,599 302,894 339,122 367,461
Effect of exchange rate changes on cash and cash equivalents (20,296) (14,582) (6,114) (17,944)
CASH AND EQUIVALENTS, END OF YEAR 401,493 288,450 302,894 339,122
Cash provided by (used in) operating activities of discontinued operations (5,688)
Cash provided by (used in) investing activities of discontinued operations (9,186)
Cash provided by (used in) financing activities of discontinued operations 16,209
(DECREASE) INCREASE IN CASH AND CASH EQUIVALENTS
OF DISCONTINUED OPERATIONS 1,334
CASH RECLASSIFIED AS ASSETS OF DISCONTINUED
OPERATION AT BEGINNING OF YEAR 4,795
EFFECT OF TRANSLATION ADJUSTMENTS ON CASH
AND CASH EQUIVALENTS OF DISCONTINUED OPERATIONS (557)
CASH RETAINED BY DISCONTINUED OPERATIONS UPON SALE (5,572)
CASH INCLUDED IN ASSETS OF DISCONTINUED OPERATION
AT END OF PERIOD
SUPPLEMENTAL DISCLOSURE OF CASH FLOWS INFORMATION:
Cash paid during the year for interest 168,672 121,181 73,202 67,496
Cash paid during the year for income taxes 370,390 266,104 454,062 242,628
Property and equipment purchases in accounts payable 16,307 11,716 26,820 14,822
Acquisition of businesses:
Fair value of assets acquired 12,956 9,308 545,129 10,863
2008 2008 2007 2006
(US$ 000) (1) (Euro 000)


59 <
1. ORGANIZATION AND SIGNIFICANT ACCOUNTING POLICIES
Organization. Luxottica Group S.p.A. and its subsidiaries (collectively “Luxottica Group” or the“Company”) operate in two industry segments: (1) manufacturing and wholesale distribution and (2) retaildistribution. Through its manufacturing and wholesale distribution operations, Luxottica Group is engaged in thedesign, manufacturing, wholesale distribution and marketing of house brand and designer lines of mid topremium-priced prescription frames and sunglasses, and, with the acquisition of Oakley Inc. (“Oakley”) inNovember 2007, the Company, through various Oakley subsidiaries, is a designer, manufacturer, andworldwide distributor of performance optics products.Through its retail operations, as of December 31, 2008, the Company owned and operated 5,696 retaillocations worldwide (5,885 locations at December 31, 2007) and franchised an additional 559 locations (522locations at December 31, 2007) principally through LensCrafters, Inc., Sunglass Hut International Inc.,OPSM Group Limited, Cole National Corporation (“Cole”) and Oakley. The retail division of Oakley (“O”retail) consists of owned retail locations operating under various names including “O” stores which sellapparel and other Oakley branded merchandise in addition to performance sunglasses. Luxottica Group’s net sales consist of direct sales of finished products manufactured under its own brandnames or licensed brands to opticians and other independent retailers through its wholesale distributionchannels and direct sales to consumers through its retail segment.Demand for the Company’s products, particularly the higher-end designer lines, is largely dependent onthe discretionary spending power of the consumers in the markets in which the Company operates.The North America retail division’s fiscal year is a 52- or 53-week period ending on the Saturday nearestDecember 31. The accompanying consolidated financial statements include the operations of the NorthAmerica retail division for the 53-week period ended January 3, 2009 and for the 52-week periods endedDecember 29, 2007 and December 30, 2006.
Principles of consolidation and basis of presentation. The consolidated financial statements ofLuxottica Group include the financial statements of the parent company and all wholly or majority-ownedsubsidiaries. The principles of the Financial Accounting Standards Board (“FASB”) Interpretation (“FIN”)No. 46 (revised December 2003), Consolidation of Variable Interest Entities and Accounting ResearchBulletin (“ARB”) No. 51, Consolidated Financial Statements are considered when determining whether anentity is subject to consolidation. During 2007 a subsidiary of the Company located in the United Statesacquired an additional 26 percent interest in an affiliated manufacturing and wholesale distributor, locatedand publicly traded in India, in which it previously held an approximate 44 percent interest. Until the timethat the Company became the majority shareholder, this investment was accounted for under the equitymethod. During 2008, the Company acquired through one of its subsidiaries an additional 16 percentinterest in an affiliated company in which it previously held a 50 percent interest. Until the time that theCompany became the majority shareholder, this investment was accounted for under the equity method.Investments in other companies in which the Company has less than a 20 percent interest with no abilityto exercise significant influence are carried at cost. All intercompany accounts and transactions areeliminated in consolidation. Luxottica Group prepares its consolidated financial statements in accordancewith accounting principles generally accepted in the United States of America (“US GAAP”).In accordance with FASB Statement of Financial Accounting Standard (“SFAS”) No. 141, BusinessCombinations, the Company accounts for all business combinations under the purchase method (see“Recent Accounting Pronouncements” for a discussion on the revised standard). Furthermore, theCompany recognizes intangible assets apart from goodwill if they arise from contractual or legal rights orif they are separable from goodwill.
Use of estimates. The preparation of financial statements in conformity with US GAAP requiresmanagement to make estimates and assumptions that affect the reported amounts of assets and liabilitiesand disclosure of contingent assets and liabilities at the date of the financial statements and the reported
NOTES TOCONSOLIDATEDFINANCIALSTATEMENTS

> 60 | ANNUAL REPORT 2008
amounts of revenues and expenses during the reporting period. Significant judgment and estimates arerequired in the determination of the valuation allowances against receivables, inventory and deferred taxassets, calculation of pension and other long-term employee benefit accruals, legal and other accruals forcontingent liabilities and the determination of impairment considerations for long-lived assets, amongother items. Actual results could differ from those estimates.
Foreign currency translation and transactions. Luxottica Group accounts for its foreign currencydenominated transactions and foreign operations in accordance with SFAS No. 52, Foreign CurrencyTranslation. The financial statements of foreign subsidiaries are translated into Euro, which is the functionalcurrency of the parent company and the reporting currency of the Company. Assets and liabilities offoreign subsidiaries, which use the local currency as their functional currency, are translated at year-endexchange rates. Results of operations are translated using the average exchange rates prevailingthroughout the year. The resulting cumulative translation adjustments are recorded as a separatecomponent of “Accumulated other comprehensive income (loss).”Transactions in foreign currencies are recorded at the exchange rate in effect at the transaction date. Gainsor losses from foreign currency transactions, such as those resulting from the settlement of foreignreceivables or payables during the year, are recognized in the consolidated statement of income in suchyear. Aggregate foreign exchange transaction gain/(loss), included in Other Expense - net, for the fiscalyears 2008, 2007 and 2006 were Euro (0.3) million, Euro 15.2 million and Euro (19.9) million, respectively.
Cash and cash equivalents. Cash and cash equivalents includes cash on hand, demand deposits, highly liquidinvestments with an original maturity of three months or less, and amounts in-transit from banks for customercredit card and debit card transactions. Substantially all amounts in transit from the banks are convertedto cash within four business days from the time of sale. Credit card and debit card transactions in transitwere approximately Euro 16.7 million and Euro 25.5 million at December 31, 2008 and 2007, respectively.
Bank overdrafts. Bank overdrafts represent negative cash balances held in banks and amounts borrowedunder various unsecured short-term lines of credit (see “Short Term Credit Facilities” included in Note 15for further discussion of the short-term lines of credit) that the Company has obtained through localfinancial institutions. These facilities are usually short-term in nature or may contain provisions that allowthem to renew automatically with a cancellation notice period. Certain subsidiaries’ agreements require aguarantee from Luxottica Group. Interest rates on these lines of credit vary and can be used to obtainvarious letters of credit when needed.
Inventories. Luxottica Group’s manufactured inventories, approximately 83.7 percent and 66.2 percent oftotal frame inventory for 2008 and 2007, respectively, are stated at the lower of cost, as determined underthe weighted-average method, or market value. Retail inventories not manufactured by the Company orits subsidiaries are stated at the lower of cost as determined by the weighted-average cost method, ormarket value. Inventories are recorded net of allowances for estimated losses. This reserve is calculatedusing various factors including sales volume, historical shrink results and current trends.
Property, plant and equipment. Property, plant and equipment are stated at historical cost. Depreciationis computed on the straight-line method over the estimated useful lives of the related assets as follows:
Estimated useful life
Buildings and building improvements 19 to 40 years
Machinery and equipment 3 to 12 years
Aircraft 25 years
Other equipment 5 to 8 years
Leasehold improvements Lesser of 15 years or the remaining life of the lease

Maintenance and repair expenses are expensed as incurred. Upon the sale or disposition of property andequipment, the cost of the asset and the related accumulated depreciation and leasehold amortization areremoved from the accounts and any resulting gain or loss is included in the consolidated statement ofincome.
Capitalized leased property. Capitalized leased assets are amortized using the straight-line method overthe term of the lease, or in accordance with practices established for similar owned assets if ownershiptransfers to the Company at the end of the lease term.
Goodwill. Goodwill represents the excess of the purchase price (including acquisition-related expenses)over the value assigned to the net tangible and identifiable intangible assets acquired. The Company’sgoodwill is tested annually for impairment as of December 31 of each year in accordance with SFAS No.142, Goodwill and Other Intangible Assets (“SFAS 142”). Additional impairment tests are performed if, forany reason, the Company believes that an event has occurred that may impair goodwill. Such tests areperformed at the reporting unit level which consists of four units, Wholesale, Retail North America, RetailAsia Pacific and Retail Other, as required by the provisions of SFAS 142. For the fiscal years 2008, 2007, and2006 the Company did not recognize any goodwill impairment charge.
Trade names and other intangibles. In connection with various acquisitions, Luxottica Group hasrecorded as intangible assets certain trade names and other intangibles which the Company believes havea finite life. Trade names are amortized on a straight-line basis over periods ranging from 20 to 25 years(see Note 7). Other intangibles include, among other items, distributor networks, customer lists andcontracts, franchise agreements and license agreements, and are amortized over the respective usefullives. All intangibles are subject to impairment testing in accordance with SFAS No. 144, Accounting forthe Impairment or Disposal of Long-Lived Assets (“SFAS 144”). Aggregate amortization expense of tradenames and other intangibles for the fiscal years 2008, 2007 and 2006 was Euro 73.9 million, Euro 69.5million and Euro 68.8 million, respectively.
Impairment of long-lived assets. Luxottica Group’s long-lived assets, other than goodwill, are tested forimpairment whenever events or changes in circumstances indicate that the net carrying amount may notbe recoverable. When such events occur, the Company measures impairment by comparing the carryingvalue of the long-lived asset to the estimated undiscounted future cash flows expected to result from theuse of the long-lived assets and their eventual disposition. If the sum of the expected undiscounted futurecash flows is less than the carrying amount of the long-lived assets, the Company records an impairmentloss, if determined to be necessary. Such impairment loss is measured as the amount by which the carryingamount of the long-lived asset exceeds the fair value in accordance with SFAS 144. The aggregateimpairment loss on certain non-performing long-lived assets charged to the consolidated statements ofincome during fiscal years 2008, 2007 and 2006 was not material.
Store opening and closing costs. Store opening costs are charged to operations as incurred inaccordance with Statement of Position No. 98-5, Accounting for the Cost of Start-up Activities. The costsassociated with closing stores or facilities are recorded at fair value as such costs are incurred. Store closingcosts charged to the consolidated statements of income during fiscal years 2008, 2007 and 2006 were notmaterial.
Self insurance. The Company is self insured for certain losses relating to workers’ compensation, generalliability, auto liability, and employee medical benefits for claims filed and for claims incurred but notreported. The Company’s liability is estimated on an undiscounted basis using historical claims experienceand industry averages; however, the final cost of the claims may not be known for over five years. As ofDecember 31, 2008 and 2007, self insurance accruals were Euro 43.2 million and Euro 40.9 million,respectively.
NOTES TO CONSOLIDATED FINANCIAL STATEMENTS | 61 <

> 62 | ANNUAL REPORT 2008
Income taxes. Income taxes are recorded in accordance with SFAS No. 109, Accounting for Income Taxes,which requires recognition of deferred tax assets and liabilities for the expected future tax consequencesof events that have been included in the Company’s consolidated financial statements or tax returns.Under this method, deferred tax liabilities and assets are determined based on the difference between theconsolidated financial statement and tax basis of assets and liabilities using enacted tax rates in effect forthe year in which the differences are expected to reverse. A valuation allowance is recorded for deferredtax assets if it is determined that it is more likely than not that the asset will not be realized. Changes invaluation allowances from period to period are included in the tax provisions in the relevant period ofchange.As of January 1, 2007, the Company adopted FIN No. 48, Accounting for Uncertainty in Income Taxes - aninterpretation of FASB Statement No. 109 (“FIN 48”). FIN 48 provides that a tax benefit from an uncertaintax position may be recognized when it is more likely than not that the position will be sustained uponexamination, including resolutions of any related appeals or litigation processes, based on the technicalmerits. In addition, it provides additional requirements regarding measurement, de-recognition,disclosure, interest and penalties and classification. FIN 48 must be applied to all existing tax positions forall open tax periods as of the date of adoption (see Note 8 for a tabular reconciliation of uncertain taxpositions). The cumulative effect of adoption of FIN 48 of Euro 8.1 million was recorded as a reduction toretained earnings on the date of adoption. The Company recognizes interest and penalties related to unrecognized tax benefits within the income taxexpense line in the accompanying consolidated statements of income. Accrued interest and penalties areincluded within the related tax liability in the consolidated balance sheet.
Liability for termination indemnities. The reserve for employee termination indemnities of Italiancompanies was considered a defined benefit plan through December 31, 2006 and was accounted foraccordingly. Effective January 1, 2007, the Italian employee termination indemnity system was reformed,and such indemnities are subsequently accounted for as a defined contribution plan. Terminationindemnities in other countries are provided through payroll tax and other social contributions inaccordance with local statutory requirements.
Revenue recognition. Revenues include sales of merchandise (both wholesale and retail), insurance andadministrative fees associated with the Company’s managed vision care business, eye exams and relatedprofessional services, and sales of merchandise to franchisees along with other revenues from franchiseessuch as royalties based on sales and initial franchise fee revenues. Excluded from revenues and recordednet in expenses when applicable are amounts collected from customers and remitted to governmentalauthorities for taxes directly related to the revenue-producing transaction.Revenue is recognized when it is realized or realizable and earned. Revenue is considered to be realizedor realizable and earned when there is persuasive evidence of an arrangement, delivery has occurred, thesales price is fixed or determinable and collectibility is reasonably assured. Wholesale Division revenues are recognized from sales of products at the time of shipment, as title and the risksand rewards of ownership of the goods are assumed by the customer at such time. The products are not subjectto formal customer acceptance provisions. In some countries, the customer has the right to return products fora limited period of time after the sale. However, such right of return does not impact the timing of revenuerecognition as all conditions of SFAS No. 48, Revenue Recognition When Right of Return Exists (“SFAS 48”), aresatisfied at the date of sale. Accordingly, the Company has recorded an accrual for the estimated amounts to bereturned. This estimate is based on the Company’s right of return policies and practices along with historical dataand sales trends. There are no other post-shipment obligations. Revenues received for the shipping and handlingof goods are included in sales and the costs associated with shipments to customers are included in operatingexpenses. Total shipping costs in fiscal years 2008, 2007 and 2006 associated with the sale of goods were Euro14.2 million, Euro 8.3 million and Euro 7.3 million, respectively.Retail Division revenues, are recognized upon receipt by the customer at the retail location, or, for internetand catalogue sales, when goods are shipped directly to the customer. In some countries, the Company

NOTES TO CONSOLIDATED FINANCIAL STATEMENTS | 63 <
2008 2007 2006
Initiation fees 754 456 170
Royalties 14,712 16,949 17,005
Sales of frames and other materials 27,102 32,999 35,940
Other revenue 455 750 781
Total 43,023 51,154 53,896
The Wholesale and Retail Divisions may offer certain promotions during the year. Free frames given tocustomers as part of a promotional offer are recorded in cost of sales at the time they are delivered to thecustomer. Discounts and coupons tendered by customers are recorded as a reduction of revenue at thedate of sale.
Managed vision care underwriting and expenses. The Company sells vision insurance plans whichgenerally have a duration of up to five years. Based on its experience, the Company believes it can predictutilization and claims experience under these plans, including claims incurred but not yet reported, with ahigh degree of confidence. Claims are recorded as they are incurred and certain other membership costsare amortized over the covered period.
Advertising and direct response marketing. Costs to develop and create newspaper, radio and othermedia advertising are expensed as incurred. Costs to develop and create television advertising areexpensed the first time the airtime is used. The costs to communicate the advertising are expensed thefirst time the airtime or advertising space is used with the exception of certain direct response advertisingprograms. Costs for certain direct response advertising programs are capitalized if such direct response
allows retail customers to return goods for a period of time and, as such, the Company has recorded anaccrual for the estimated amounts to be returned. This accrual is based on the historical return rate as apercentage of net sales and the timing of the returns from the original transaction date. There are no otherpost-shipment obligations. As such, the right of return does not impact the timing of revenue recognitionas all conditions of SFAS 48 are satisfied at the date of sale. Additionally, the Retail Division enters intodiscount programs and similar relationships with third parties that have terms of twelve or more months.Revenues under these arrangements are likewise recognized as transactions occur in the Company’s retaillocations and customers take receipt of products and services. Advance payments and deposits fromcustomers are not recorded as revenues until the product is delivered. At December 31, 2008 and 2007customer advances included in the consolidated balance sheet in “Accrued Expenses and Other” wereEuro 23.0 million and Euro 22.9 million, respectively. Retail Division revenues also include managed visioncare revenues consisting of (i) insurance revenues, which are recognized when earned over the terms ofthe respective contractual relationships, and (ii) administrative services revenues, which are recognizedwhen services are provided during the contract period. Accruals are established for amounts due underthese relationships determined to be uncollectible.The Company licenses to third parties the rights to certain intellectual property and other proprietaryinformation and recognizes royalty revenues when earned.Franchise revenues based on sales by franchisees (such as royalties) are accrued and recognized as earned.Initial franchise fees are recorded as revenue when all material services or conditions relating to the saleof the franchise have been substantially performed or satisfied by the Company and when the related storebegins operations. Allowances are established for amounts due under these relationships when they aredetermined to be uncollectible. Sales of ophthalmic products and other materials are recorded when thegoods are shipped direct to franchisees net of appropriate allowances.Revenues associated with our third-party franchisees and licensors at December 31, 2008, 2007, and 2006,consist of the following:

> 64 | ANNUAL REPORT 2008
advertising costs are expected to result in future economic benefit and the primary purpose of theadvertising is to elicit sales to customers who could be shown to have responded specifically to theadvertising. Such costs related to the direct response advertising are amortized over the period duringwhich the revenues are recognized, not to exceed 90 days. Generally, other direct response program coststhat do not meet the capitalization criteria are expensed the first time the advertising occurs. Advertisingexpenses incurred during fiscal years 2008, 2007 and 2006 were Euro 339.3 million, Euro 348.2 million andEuro 318.1 million, respectively, and no significant amounts have been reported as assets.The Company receives a reimbursement from its acquired franchisees for certain marketing costs.Operating expenses in the consolidated statements of income are net of amounts reimbursed by thefranchisees calculated based on a percentage of their sales. The amounts received in fiscal years 2008,2007 and 2006 for such reimbursement were Euro 15.1 million, Euro 16.8 million and Euro 19.2 million,respectively.
Earnings per share. Luxottica Group calculates basic and diluted earnings per share in accordance withSFAS No. 128, Earnings per Share. Net income available to shareholders is the same for the basic anddiluted earnings per share calculations for the years ended December 31, 2008, 2007 and 2006. Basicearnings per share are based on the weighted average number of shares of common stock outstandingduring the period. Diluted earnings per share are based on the weighted average number of shares ofcommon stock and common stock equivalents (options) outstanding during the period, except when thecommon stock equivalents are anti-dilutive. The following is a reconciliation from basic to diluted sharesoutstanding used in the calculation of earnings per share:
2008 2007 2006
Weighted average shares outstanding - basic 456,563,502 455,184,797 452,897,854
Effect of dilutive stock options 1,153,542 3,345,812 3,287,796
Weighted average shares outstanding - dilutive 457,717,044 458,530,609 456,185,650
Options not included in calculation of dilutive
shares as the exercise price was greater than the
average price during the respective period 18,529,635 4,947,775 6,885,893
Stock-based compensation. Stock-based compensation represents the cost related to stock-basedawards granted to employees. Stock-based compensation cost is measured at grant date based on theestimated fair value of the award and recognizes the cost on a straight-line basis (net of estimatedforfeitures) over the employee requisite service period. The fair value of stock options is estimated usinga binomial lattice valuation technique. Deferred tax assets are recorded for awards that result indeductions on income tax returns, based on the amount of compensation cost recognized and thestatutory tax rate in the jurisdiction in which the deduction will be received. Differences between thedeferred tax assets recognized for financial reporting purposes and the actual tax deduction reported onthe income tax return are recorded in Additional Paid-In Capital (if the tax deduction exceeds the deferredtax asset) or in the consolidated statements of income (if the deferred tax asset exceeds the tax deductionand no additional paid-in capital exists from previous awards).
Derivative financial instruments. Derivative financial instruments are accounted for in accordance withSFAS No. 133, Accounting for Derivative Instruments and Hedging Activities (“SFAS 133”), as amendedand interpreted. SFAS 133 requires that all derivatives, whether or not designed in hedging relationships, be recorded onthe balance sheet at fair value regardless of the purpose or intent for holding them. If a derivative isdesignated as a fair-value hedge, changes in the fair value of the derivative and the related change in thehedge item are recognized in operations. If a derivative is designated as a cash-flow hedge, changes in

the fair value of the derivative are recorded in other comprehensive income/(loss) (“OCI”) in theconsolidated statements of shareholders’ equity and are recognized in the consolidated statements ofincome when the hedged item affects operations. The effect of these derivatives in the consolidatedstatements of income depends on the item hedged (for example, interest rate hedges are recorded ininterest expense). For a derivative that does not qualify as a hedge, changes in fair value are recognizedin the consolidated statements of income, under the caption “Other - net”.Designated hedging instruments and hedged items qualify for hedge accounting only if there is a formaldocumentation of the hedging relationship at the inception of the hedge, the hedging relationship is expectedto be highly effective and effectiveness is tested at the inception date and at least every three months.Certain transactions and other future events, such as (i) the derivative no longer effectively offsettingchanges to the cash flow of the hedged instrument, (ii) the expiration, termination or sale of the derivative,or (iii) any other reason of which the Company becomes aware that the derivative no longer qualifies as acash flow hedge, would cause the balance remaining in other comprehensive income to be realized intoearnings prospectively. Based on current interest rates and market conditions, the estimated aggregateamount to be recognized into earnings as additional expense from other comprehensive income relatingto these cash flow hedges in fiscal 2009 is approximately Euro 14.7 million, net of taxes. Luxottica Group uses derivative financial instruments, principally interest rate and currency swapagreements, as part of its risk management policy to reduce its exposure to market risks from changes ininterest and foreign exchange rates. Although it has not done so in the past, the Company may enter intoother derivative financial instruments when it assesses that the risk can be hedged effectively.
Defined benefit pensions. The funded status of the Company’s defined benefit pension plans isrecognized in the consolidated statements of income. The funded status is measured as the differencebetween the fair value of plan assets and the benefit obligation at December 31, the measurement date.For defined benefit pension plans, the benefit obligation is the projected benefit obligation (“PBO”),which represents the actuarial present value of benefits expected to be paid upon retirement based onestimated future compensation levels. The fair value of plan assets represents the current market value ofcumulative company and participant contributions made to an irrevocable trust fund, held for the solebenefit of participants, which are invested by the trust fund. Overfunded plans, with the fair value of planassets exceeding the benefit obligation, are aggregated and recorded as a prepaid pension asset equalto this excess. Underfunded plans, with the benefit obligation exceeding the fair value of plan assets, areaggregated and recorded as a retirement benefit obligation equal to this excess. The current portion ofthe retirement benefit obligations represents the actuarial present value of benefits payable in the next 12months exceeding the fair value of plan assets, measured on a plan-by-plan basis.Net periodic pension benefit cost/(income) is recorded in the consolidated statements of income andincludes service cost, interest cost, expected return on plan assets, amortization of prior servicecosts/(credits) and (gains)/losses previously recognized as a component of gains and (losses) not affectingretained earnings and amortization of the net transition asset remaining in accumulated gains and (losses)not affecting retained earnings. Service cost represents the actuarial present value of participant benefitsearned in the current year. Interest cost represents the time value of money cost associated with thepassage of time. Certain events, such as changes in employee base, plan amendments and changes inactuarial assumptions, result in a change in the benefit obligation and the corresponding change in thegains and (losses) not affecting retained earnings. The result of these events is amortized as a componentof net periodic cost/(income) over the service lives of the participants.
Fair value. Effective January 1, 2008, the Company adopted FASB Statement No. 157, Fair ValueMeasurements, (“SFAS 157”) and FASB Statement No. 159, The Fair Value Option for Financial Assets andFinancial Liabilities - Including an amendment of FASB Statement No. 115 (“SFAS 159”). SFAS 157establishes a definition of fair value (based on an exit price model), establishes a framework for measuringfair value and expands disclosures about fair value measurements. SFAS 157 does not require new fair valuemeasurements but clarifies the definition, method, and disclosure requirements of previously issued
NOTES TO CONSOLIDATED FINANCIAL STATEMENTS | 65 <
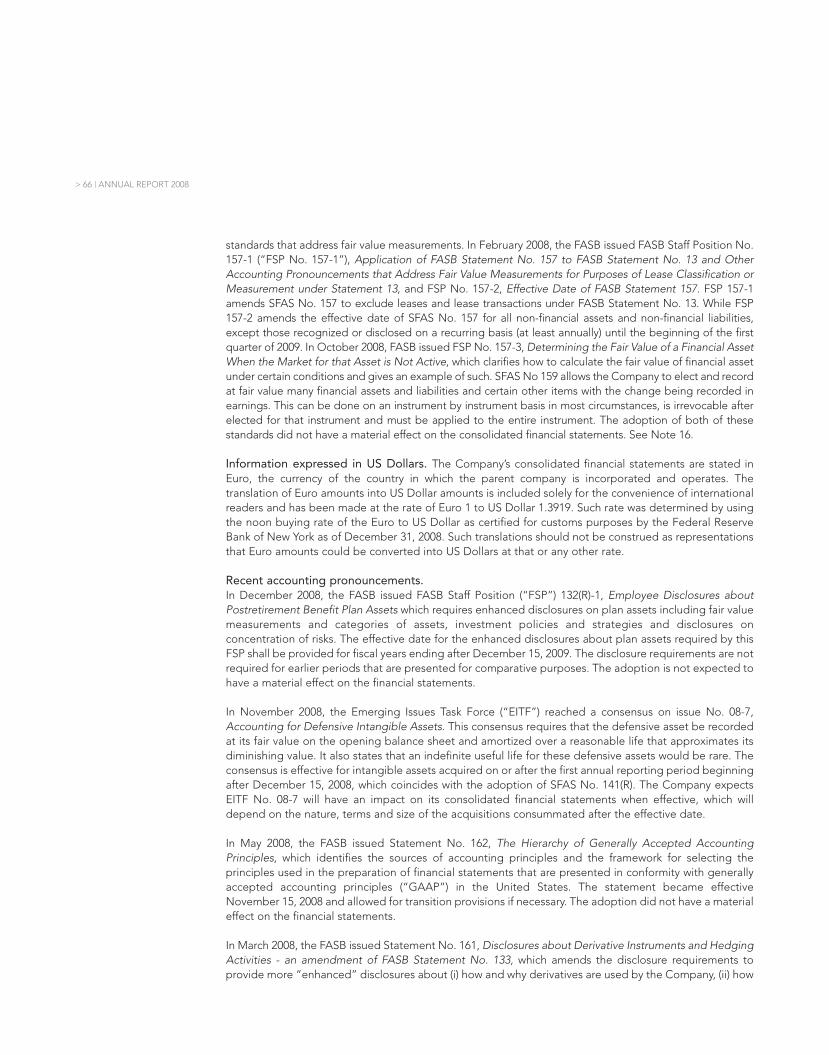
> 66 | ANNUAL REPORT 2008
standards that address fair value measurements. In February 2008, the FASB issued FASB Staff Position No.157-1 (“FSP No. 157-1”), Application of FASB Statement No. 157 to FASB Statement No. 13 and OtherAccounting Pronouncements that Address Fair Value Measurements for Purposes of Lease Classification orMeasurement under Statement 13, and FSP No. 157-2, Effective Date of FASB Statement 157. FSP 157-1amends SFAS No. 157 to exclude leases and lease transactions under FASB Statement No. 13. While FSP157-2 amends the effective date of SFAS No. 157 for all non-financial assets and non-financial liabilities,except those recognized or disclosed on a recurring basis (at least annually) until the beginning of the firstquarter of 2009. In October 2008, FASB issued FSP No. 157-3, Determining the Fair Value of a Financial AssetWhen the Market for that Asset is Not Active, which clarifies how to calculate the fair value of financial assetunder certain conditions and gives an example of such. SFAS No 159 allows the Company to elect and recordat fair value many financial assets and liabilities and certain other items with the change being recorded inearnings. This can be done on an instrument by instrument basis in most circumstances, is irrevocable afterelected for that instrument and must be applied to the entire instrument. The adoption of both of thesestandards did not have a material effect on the consolidated financial statements. See Note 16.
Information expressed in US Dollars. The Company’s consolidated financial statements are stated inEuro, the currency of the country in which the parent company is incorporated and operates. Thetranslation of Euro amounts into US Dollar amounts is included solely for the convenience of internationalreaders and has been made at the rate of Euro 1 to US Dollar 1.3919. Such rate was determined by usingthe noon buying rate of the Euro to US Dollar as certified for customs purposes by the Federal ReserveBank of New York as of December 31, 2008. Such translations should not be construed as representationsthat Euro amounts could be converted into US Dollars at that or any other rate.
Recent accounting pronouncements. In December 2008, the FASB issued FASB Staff Position (“FSP”) 132(R)-1, Employee Disclosures aboutPostretirement Benefit Plan Assets which requires enhanced disclosures on plan assets including fair valuemeasurements and categories of assets, investment policies and strategies and disclosures onconcentration of risks. The effective date for the enhanced disclosures about plan assets required by thisFSP shall be provided for fiscal years ending after December 15, 2009. The disclosure requirements are notrequired for earlier periods that are presented for comparative purposes. The adoption is not expected tohave a material effect on the financial statements.
In November 2008, the Emerging Issues Task Force (“EITF”) reached a consensus on issue No. 08-7,Accounting for Defensive Intangible Assets. This consensus requires that the defensive asset be recordedat its fair value on the opening balance sheet and amortized over a reasonable life that approximates itsdiminishing value. It also states that an indefinite useful life for these defensive assets would be rare. Theconsensus is effective for intangible assets acquired on or after the first annual reporting period beginningafter December 15, 2008, which coincides with the adoption of SFAS No. 141(R). The Company expectsEITF No. 08-7 will have an impact on its consolidated financial statements when effective, which willdepend on the nature, terms and size of the acquisitions consummated after the effective date.
In May 2008, the FASB issued Statement No. 162, The Hierarchy of Generally Accepted AccountingPrinciples, which identifies the sources of accounting principles and the framework for selecting theprinciples used in the preparation of financial statements that are presented in conformity with generallyaccepted accounting principles (“GAAP”) in the United States. The statement became effectiveNovember 15, 2008 and allowed for transition provisions if necessary. The adoption did not have a materialeffect on the financial statements.
In March 2008, the FASB issued Statement No. 161, Disclosures about Derivative Instruments and HedgingActivities - an amendment of FASB Statement No. 133, which amends the disclosure requirements toprovide more “enhanced” disclosures about (i) how and why derivatives are used by the Company, (ii) how

these derivatives are accounted for under SFAS No. 133 and its interpretations, and (iii) how much andwhere are the effects of these instruments located on the balance sheet, profit and loss and cash flowstatements. This will be done mostly through tabular formats and better cross referencing of informationincluded in different sections of the financial report. The statement is effective for the fiscal years andinterim periods beginning on or after November 15, 2008. Earlier adoption is encouraged. Additionally,the Statement “encourages” but does not require, comparative disclosures for earlier periods at initialadoption. The Company is still assessing the disclosure impact of this standard on its future consolidatedfinancial position and results of operations.
In December 2007, the FASB issued SFAS No. 160, Noncontrolling Interests in Consolidated FinancialStatements - an amendment to ARB No. 51, establishing new accounting and reporting standards fornoncontrolling interests (formerly known as “minority interests”) in a subsidiary and, when applicable, howto account for the deconsolidation of such subsidiary. The key differences include that non-controllinginterests will be recorded as a component of equity, the consolidated income statements and statementsof comprehensive income will be adjusted to include the non controlling interest and certain disclosureshave been updated. The statement is effective for the fiscal years and interim periods within those yearsbeginning on or after December 15, 2008. Earlier adoption is prohibited. The Company has minorityinterests in certain subsidiaries and as such is currently evaluating the effect of adoption.
In December 2007, the FASB issued SFAS No. 141(R), Business Combinations Revised (“SFAS 141(R)”),which revises the current SFAS 141. The significant changes include a change from the “cost allocationprocess” to determine the value of assets and liabilities to a full fair value measurement approach. Inaddition, acquisition related expenses will be expensed as incurred and not included in the purchase priceallocation and contingent liabilities will be separated into two categories, contractual and non-contractual,and accounted for based on which category the contingency falls into. This statement appliesprospectively and is effective for business combinations for which the acquisition date is on or after thebeginning of the first annual reporting period beginning after December 15, 2008. Since it will be appliedprospectively it will not have an effect on the current financial statements, however, since the Companyparticipates in business combinations, in the future the Company believes this statement after theadoption date could have a significant effect on future operations.
In September 2006, the FASB issued SFAS No. 158, Employer’s Accounting for Defined Benefit PensionOther Post Retirement Plans (“SFAS 158”), which requires the Company to recognize an asset or liabilityfor the funded status (difference between fair value of plan assets and benefit obligation, which for definedbenefit pension plans is deemed to be the Projected Benefit Obligation) of its retirement plans andrecognize changes in the funded status annually through other comprehensive income (“O.C.I.”).Additionally, SFAS 158 changes the date as of which the funded status can be measured (eliminates the 90day window) with limited exceptions. The effective date of the recognition of the funded status is for yearsending after December 15, 2006, and as such, refer to Note 10 for the effect on adoption. The effectivedate for the change in acceptable measurement date is for fiscal years ending after December 15, 2008.The Company has changed its measurement date on the consolidated financial statements as required(see Note 10).
2. RELATED PARTY TRANSACTIONS
Stock incentive plan. On September 14, 2004, the Company announced that its majority shareholder, Mr.Leonardo Del Vecchio, had allocated shares held through La Leonardo Finanziaria S.r.l. (subsequentlymerged into Delfin S.àr.l.), a holding company of the Del Vecchio family, representing at that time 2.11percent (or 9.6 million shares) of the Company’s authorized and issued share capital, to a stock option planfor top management of the Company. The stock options to be issued under the stock option plan vested
NOTES TO CONSOLIDATED FINANCIAL STATEMENTS | 67 <
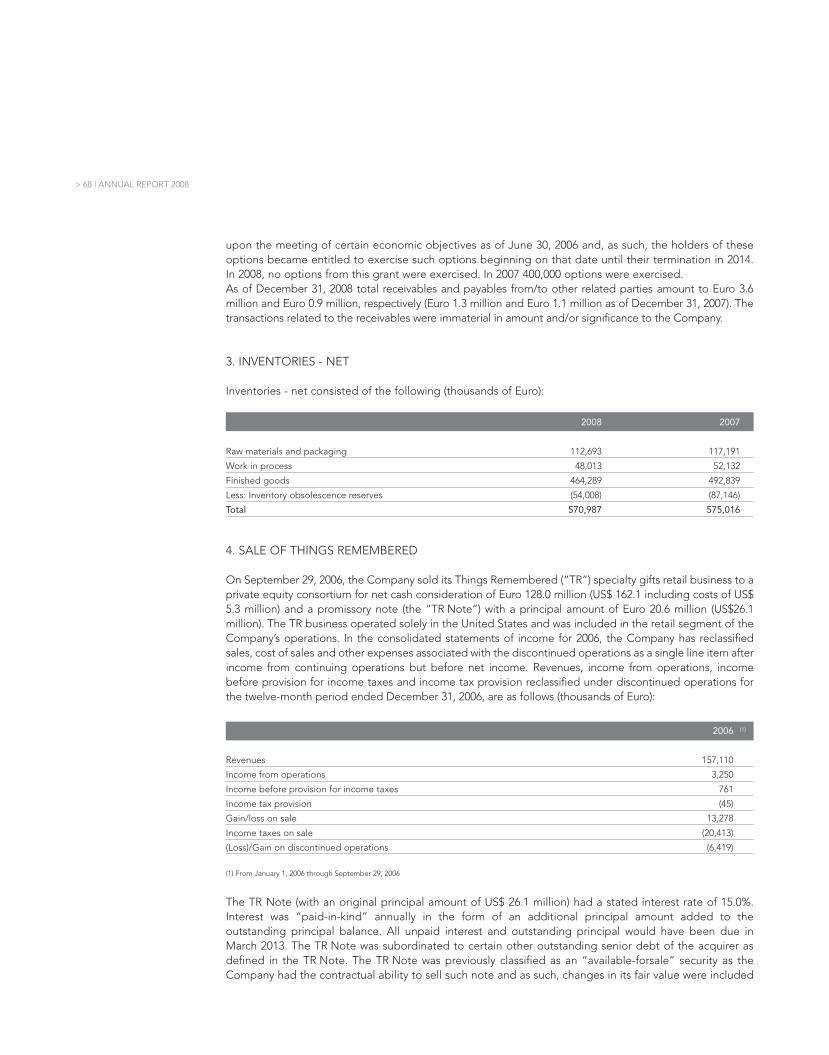
> 68 | ANNUAL REPORT 2008
2008 2007
Raw materials and packaging 112,693 117,191
Work in process 48,013 52,132
Finished goods 464,289 492,839
Less: Inventory obsolescence reserves (54,008) (87,146)
Total 570,987 575,016
4. SALE OF THINGS REMEMBERED
On September 29, 2006, the Company sold its Things Remembered (“TR”) specialty gifts retail business to aprivate equity consortium for net cash consideration of Euro 128.0 million (US$ 162.1 including costs of US$5.3 million) and a promissory note (the “TR Note”) with a principal amount of Euro 20.6 million (US$26.1million). The TR business operated solely in the United States and was included in the retail segment of theCompany’s operations. In the consolidated statements of income for 2006, the Company has reclassifiedsales, cost of sales and other expenses associated with the discontinued operations as a single line item afterincome from continuing operations but before net income. Revenues, income from operations, incomebefore provision for income taxes and income tax provision reclassified under discontinued operations forthe twelve-month period ended December 31, 2006, are as follows (thousands of Euro):
2006 (1)
Revenues 157,110
Income from operations 3,250
Income before provision for income taxes 761
Income tax provision (45)
Gain/loss on sale 13,278
Income taxes on sale (20,413)
(Loss)/Gain on discontinued operations (6,419)
(1) From January 1, 2006 through September 29, 2006
The TR Note (with an original principal amount of US$ 26.1 million) had a stated interest rate of 15.0%.Interest was “paid-in-kind” annually in the form of an additional principal amount added to theoutstanding principal balance. All unpaid interest and outstanding principal would have been due inMarch 2013. The TR Note was subordinated to certain other outstanding senior debt of the acquirer asdefined in the TR Note. The TR Note was previously classified as an “available-forsale” security as theCompany had the contractual ability to sell such note and as such, changes in its fair value were included
upon the meeting of certain economic objectives as of June 30, 2006 and, as such, the holders of theseoptions became entitled to exercise such options beginning on that date until their termination in 2014.In 2008, no options from this grant were exercised. In 2007 400,000 options were exercised.As of December 31, 2008 total receivables and payables from/to other related parties amount to Euro 3.6million and Euro 0.9 million, respectively (Euro 1.3 million and Euro 1.1 million as of December 31, 2007). Thetransactions related to the receivables were immaterial in amount and/or significance to the Company.
3. INVENTORIES - NET
Inventories - net consisted of the following (thousands of Euro):

in OCI and reclassified to earnings when realized. For fiscal 2007 there were no amounts reclassified fromOCI into earnings. During 2008, the Company sold the TR Note without recourse to an independent thirdparty for approximately Euro 1.0 million. The loss on the sale of the note of Euro 22.8 million including Euro0.4 million previously recorded in accumulated other comprehensive income (loss) is included in otherExpense net in the consolidated statements of income.
5. ACQUISITIONS AND INVESTMENTS
a) Oakley On June 20, 2007, the Company and Oakley entered into a definitive merger agreement with the unanimousapproval of the Boards of Directors of both companies. On November 14, 2007, the merger was consummated,the Company acquired all the outstanding common stock of Oakley which became a wholly owned subsidiary ofthe Company and Oakley’s results of operations began to be included in the consolidated statements of incomeof the Company. The aggregate consideration paid by the Company to the former shareholders, option holders,and holders of other equity rights of Oakley was approximately Euro 1,425.6 million (US$ 2,091 million) in cash. Inconnection with the merger, the Company assumed approximately Euro 166.6 million (US$ 244.4 million) ofoutstanding indebtedness. The purchase price of Euro 1,441.5 million (US$ 2,111.2 million) includingapproximately Euro 15.9 million (US$ 20.1 million) of direct acquisition related expenses was allocated to the assetsacquired and liabilities assumed based on their fair value at the date of the acquisition. The Company used variousmethods to calculate the fair value of the assets acquired and the liabilities assumed. The excess of purchase priceover net assets acquired (“goodwill”) has been recorded in the accompanying consolidated balance sheet. Noportion of this goodwill is deductible for tax purposes. The acquisition of Oakley was made as a result of theCompany’s strategy to strengthen its performance sunglass wholesale and retail businesses worldwide.The purchase price allocation was finalized in 2008 resulting in no material changes to the final fair valuesallocated to inventories, intangible assets and accrued expenses from the purchase price allocation donein 2007. The main changes from last year allocation relate to the restructuring of a part of the Retail NorthAmerica operations. The purchase price (including acquisition-related expenses) has been allocated basedupon the fair value of the assets acquired and liabilities assumed as follows (thousands of Euro):
NOTES TO CONSOLIDATED FINANCIAL STATEMENTS | 69 <
Assets acquired
Cash and cash equivalents 62,310
Inventories 122,668
Property, plant and equipment 131,466
Deferred tax assets 43,425
Prepaid expenses and other current assets 10,850
Accounts receivable 104,740
Trade names and other intangible assets 538,469
Other assets 3,985
Liabilities assumed
Accounts payable 36,560
Accrued expenses and other current liabilities 93,586
Deferred tax liabilities 181,789
Outstanding borrowings on credit facilities 166,850
Other long term liabilities 25,904
Bank overdrafts 5,584
Fair value of net assets 507,640
Goodwill 933,813
Total purchase price 1,441,453

> 70 | ANNUAL REPORT 2008
The following table sets forth the Company’s unaudited pro forma consolidated results of operationsassuming that the acquisition of Oakley was completed as of January 1 of each of the fiscal years shownbelow (in thousands of Euro except for earnings per share data):
2007 2006
Net sales 5,539,000 5,243,055
Net income 470,363 385,896
Earnings per share
Basic 1.04 0.85
Diluted 1.04 0.85
Pro forma data may not be indicative of the results that would have been obtained had these events actuallyoccurred at the beginning of the periods presented, nor does it intend to be a projection of future results.
b) Other acquisitions and investments.The following is a description of other acquisitions and investments. No pro forma financial information ispresented, as these acquisitions were not material, individually or in aggregate, to the Company’sconsolidated financial statements.
On July 31, 2008, Sunglass Hut UK Ltd. (“SGH”)., an indirect wholly owned subsidiary of the Company,issued new shares of common stock and paid an aggregate of Gbp 600,000 to the shareholders of OptikaHoldings Limited (“OHL”) for all the outstanding shares of OHL. OHL through its subsidiaries operated achain of ophthalmic retail locations throughout the UK and Ireland under the brand name “David Clulow”.The total consideration paid for the OHL acquisition was Euro 22.1 (approximately Gbp 17.5). OHL was ajoint venture owned 50% by the Company and 50% by a third party. Upon the completion of this transactionthe Company owns, directly and indirectly, approximately 66% of the SGH and OHL (the “combinedentity”). As a result of the acquisition the former shareholders of OHL received a minority stake of thecombined entity of 34% and a put option to sell the shares to the Company, while the Company wasgranted a call option on the minority stake.The acquisition of the Company’s additional interest in OHL wasaccounted for as a business combination. The Company used various methods to calculate the fair value ofthe assets acquired and the liabilities assumed and all valuations are not yet completed. The goodwillrecorded in the consolidated financial statements as of December 31, 2008 totals Euro 18.1 million. Therewere no significant intangibles realized or other fair value adjustments associated with the businesscombination. This acquisition was made as a result of the Company’s strategy to continue expansion of itsretail business in Europe.
In February 2007, the Company completed the acquisition of certain assets and assumed certain liabilitiesof D.O.C Optics Corporation and its affiliates, an optical retail business with approximately 100 storeslocated primarily in the Midwest United States of America for approximately Euro 83.7 million (US$ 110.2million) in cash. The purchase price, including direct acquisition-related expenses, was allocated to theassets acquired and liabilities assumed based on their fair value at the date of the acquisition. The goodwillrecorded in the consolidated financial statements as of December 31, 2007 totals Euro 70.4 million, of whichEuro 64.9 million is deductible for tax purposes. The Company used various methods to calculate the fairvalue of the assets acquired and liabilities assumed. The final allocation of the purchase price among theassets and liabilities acquired and the amount of the goodwill has been completed in 2008 resulting in nomaterial differences from the purchase price allocation done in 2007. The acquisition was made as a resultof the Company’s strategy to continue expansion of its retail business in the United States of America.
During 2007, in compliance with the 2006 decision of the Supreme Court of India, the Company launcheda public offering to acquire an additional 31 percent of the outstanding equity share capital of RayBan Sun

Optics India LTD (“RBSO”). Effective upon the entry of the shares tendered in the offer into the shareregister on June 26, 2007 the Company increased its ownership interest in RBSO to 70.5 percent. As of suchdate, RBSO was consolidated into the financial statements. The total cost of the shares acquired wasapproximately Euro 13 million (US$ 17.2 million). The Company recorded the acquisition as a “step-acquisition” and allocated the purchase price paid over the newly acquired proportional share of the fairvalue of RBSO assets and liabilities acquired. There were no substantial unrecognized intangibles, and assuch, goodwill was recorded for the excess price paid over the net fair values of assets and liabilities ofapproximately Euro 9.1 million (US$ 12.3 million). During 2008, the Company made a delisting offer to theremaining public shareholders of RBSO pursuant to India’s delisting guidelines. Through this process thepublic shareholders tendered 4,335,713 shares for approximately Euro 9.1 million (US$ 13.4 million,including approximately US$ 0.5 million in transaction costs). As of December 31, 2008 the Company owned88.2% of RBSO and the transaction increased goodwill by approximately Euro 5.0 million (US$ 7.8 million).
In March 2007 the Company announced that it had acquired two prominent specialty sun chains in SouthAfrica, with a total of 65 stores. The two acquisitions represent an important step in the expansion of theCompany’s sun retail presence worldwide. Luxottica Group’s total investment in the two transactions wasapproximately Euro 10 million. The Company used various methods to calculate the fair value of the assetsacquired and liabilities assumed. The excess of the purchase price over net assets acquired (“goodwill”)has been recorded in the accompanying consolidated balance sheet. All valuations have been completedduring 2008 with no material differences from the purchase price allocation done in 2007 which resulted inthe recognition of goodwill of Euro 8.3 million as of the date of acquisition.
On July 1, 2006, the Company acquired certain assets and assumed certain liabilities from King OpticalGroup Inc. consisting of its 74 Canadian optical store chain known as Shoppers Optical (“SO”). Theaggregate consideration paid by the Company to the former owners of SO was approximately Canadiandollar (“CDN$”) 68.8 million (Euro 48.3 million) in cash. In connection with the acquisition, the Companyassumed no indebtedness. The purchase price of CDN$ 69.3 million (Euro 48.7 million), includingapproximately CDN$ 0.1 million (Euro 0.4 million) of direct acquisition-related expenses, was allocated tothe assets acquired and liabilities assumed based on their fair value at the date of the acquisition. Allvaluations of net assets including but not limited to fixed assets and inventory have been completed during2007 resulting in no material differences from the purchase price allocation done in 2006. The acquisitionwas made as a result of the Company’s strategy to continue expansion of its retail business in Canada.
In May 2006, the Company completed the purchase of the remaining 49% stake of the Turkish-baseddistributor Luxottica Industri VE Ticaret Anonim (“Luxottica Turchia”) for an amount of Euro 15 million.Goodwill of Euro 7.0 million representing the excess of the net assets acquired has been recorded in theaccompanying Consolidated Balance Sheets. In November 2006 Standard Gozluk Industri Ve Ticaret A.S.(“Standard”), a Turkish wholesaler fully owned by the former minority shareholders of Luxottica Turchia,merged with Luxottica Turchia. As a result of the merger the former shareholders of Standard received aminority stake of Luxottica Turchia of 35.16% and a put option to sell the shares to the Company, while theCompany was granted a call option on the minority stake. The acquisition was accounted for in accordancewith SFAS 141 and, accordingly, the total consideration of Euro 46.7 million has been allocated to the fairmarket value of the assets and liabilities of the company at the acquisition date. All valuations of net assetsincluding but not limited to fixed assets and inventory have been completed during 2007 resulting in therecognition of intangible assets of approximately Euro 19.6 million and related deferred tax liabilities forapproximately Euro 3.9 million and in the reduction of the goodwill recognized in 2006 by approximatelyEuro 15.7 million. The acquisition was made as a result of the Company’s strategy to continue expansionof its wholesale business in Turkey, in particular in the prescription frames market.
In November 2006, the Company completed the acquisition, which was announced in June 2006, ofModern Sight Optics, a leading premium optical chain that operates a total of 28 stores in Shanghai,
NOTES TO CONSOLIDATED FINANCIAL STATEMENTS | 71 <

> 72 | ANNUAL REPORT 2008
China. These stores are located in premium and high-end commercial centers and shopping malls situatedprimarily in Shanghai’s downtown area and affluent residential areas. The Company acquired 100 percentof the equity interest in Modern Sight Optics for total consideration of RMB 140 million (approximatelyEuro 14 million). The acquisition was accounted for in accordance with SFAS 141 and, accordingly, the totalconsideration of Euro 16.3 million, including direct acquisition-related expenses, has been allocated to thefair market value of the assets and liabilities of the company as of the acquisition date. All valuations of netassets including but not limited to fixed assets and inventory have been completed during 2007 with nomaterial differences from the purchase price allocation done in 2006 which resulted in the recognition ofgoodwill of Euro 15.9 million as of the date of acquisition. The acquisition was made as a result of theCompany’s strategy to continue expansion of its retail business in The People’s Republic of China.
6. PROPERTY, PLANT AND EQUIPMENT - NET
Property, plant and equipment-net consisted of the following (thousands of Euro):
2008 2007
Land and buildings, including
leasehold improvements 755,254 687,428
Machinery and equipment 795,126 697,776
Aircraft 40,018 40,222
Other equipment 513,631 439,696
2,104,029 1,865,122
Less: accumulated depreciation
and amortization 933,331 807,340
Total 1,170,698 1,057,782
Depreciation and amortization expense relating to property, plant and equipment for the years endedDecember 31, 2008, 2007 and 2006 was Euro 191.0 million, Euro 163.3 million and Euro 151.9 million,respectively. Included in other equipment is approximately Euro 79.7 million and Euro 71.6 million ofconstruction in progress as of December 31, 2008 and 2007, respectively. Construction in progress consistsmainly of the opening, remodeling and relocation of stores and the expansion of manufacturing facilitiesin Italy. Certain tangible assets are maintained in currencies other than Euro (the reporting currency) and, as such,balances may fluctuate due to changes in exchange rates.
7. GOODWILL AND INTANGIBLE ASSETS - NET
The changes in the carrying amount of goodwill for the years ended December 31, 2007 and 2008, are asfollows (thousands of Euro):

(a) Goodwill acquired in 2007 mainly consists of the acquisition of Oakley, the acquisition of the additional 26% of the net equity of the Indian subsidiary and minoracquisitions in the Retail segment. Goodwill acquired in 2008 in the Retail segment mainly consists of the acquisition of OHL. Goodwill acquired in 2008 in theWholesale segment mainly consists of the acquisition of the additional 17.7% of the net equity of the Indian subsidiary. The adjustments on previous acquisitionsmainly refer to the finalization of the Oakley fair value analysis. Oakley goodwill has been allocated to the wholesale and retail segments in 2008.(b) Certain goodwill balances are denominated in currencies other than Euro (the reporting currency) and, as such, balances may fluctuate due to changes inexchange rates.
Intangible assets-net consist of the following (thousands of Euro):
NOTES TO CONSOLIDATED FINANCIAL STATEMENTS | 73 <
Retail Segment Wholesale Segment Oakley Total
Balance as of January 1, 2007 1,353,999 340,615 - 1,694,614
Acquisitions(a) 86,021 9,611 904,148 999,780
Adjustments on previous acquisitions(a) (15,678) (15,678)
Change in exchange rates(b) (84,323) 4,393 3,054 (76,876)
Balance as of December 31, 2007 1,355,697 338,941 907,202 2,601,840
Acquisitions(a) 24,192 6,914 31,106
Adjustments on previous acquisitions(a) 241,238 695,787 (907,202) 29,823
Change in exchange rates(b) 6,629 25,376 32,005
Balance as of December 31, 2008 1,627,756 1,067,018 - 2,694,774
2008 2007
Gross Accumulated Total Gross Accumulated Totalcarrying amount depreciation carrying amount depreciation
Trade names and trademarks(a) 1,318,737 (394,612) 924,125 1,288,620 (325,912) 962,708
Customer relation, contracts and list(b) 215,868 (20,206) 195,662 210,258 (9,153) 201,105
Distributor network(b) 81,086 (15,179) 65,907 79,359 (12,410) 66,949
Franchise agreements(b) 20,619 (3,870) 16,749 20,749 (2,757) 17,992
Other(c) 51,490 (19,903) 31,587 77,847 (20,484) 57,363
Total 1,687,800 (453,770) 1,234,030 1,676,833 (370,716) 1,306,117
(a) Trade names includes various trade names and trademarks acquired with the acquisitions of LensCrafters, Sunglass Hut International, OPSM, Cole and Oakley.Trade names are amortized on a straight-line basis over a period of 25 years (except for the Ray-Ban trade names, which are amortized over a period of 20 years),as the Company believes these trade names to be finite-lived assets. The weighted average amortization period is 24 years.
(b) Distributor network, customer contracts and lists, and franchise agreements were identifiable intangibles recorded in connection with the acquisition of Cole in2004 and of Oakley in 2007. These assets have finite lives and are amortized on a straight-line basis or on an accelerated basis (projected diminishing cash flows)over periods ranging between 3 and 25 years. The weighted average amortization period is 20.6 years.
(c) Other identifiable intangibles have finite lives ranging between 3 and 17 years and are amortized on a straight line basis. The weighted average amortizationperiod is 11.3 years. Most of these useful lives were determined based on the terms of the license agreements and non-compete agreements. During 2007,approximately Euro 5.8 million of intangibles became fully amortized and were written off. The reduction in the gross carrying amount in 2008 of the OtherIntangible assets was primarily due to (i) the finalization of the Oakley fair value analysis, and (ii) the reclassification of some intangible assets as a result of thechange in the contractual agreement based on which the above mentioned assets were originally recorded.
Certain intangible assets are maintained in currencies other than Euro (the reporting currency) and, assuch, balances may fluctuate due to changes in exchange rates.Amortization expense for 2008, 2007 and 2006 was Euro 73.9 million, Euro 69.6 million and Euro 68.8 million,respectively. Estimated annual amortization expense relating to identifiable assets is shown below (Euro 000):
Years ending December 31,
2009 77,376
2010 75,877
2011 74,350
2012 73,388
2013 72,610

> 74 | ANNUAL REPORT 2008
8. INCOME TAXES
Income before provision for income taxes and the provision for income taxes consisted of the following(thousands of Euro):
Income before provision for income taxes 2008 2007 2006
Italian companies 199,793 317,637 251,343
USA companies 172,609 319,154 331,035
Other foreign companies 217,468 143,890 95,799
Total income before provision
for income taxes 589,870 780,681 678,177
Provision for income taxes
Current
Italian companies 87,333 156,198 157,342
USA companies 29,975 116,785 120,681
Other foreign companies 55,985 61,742 33,206
Total provision for current income taxes 173,293 334,725 311,229
Deferred
Italian companies (7,757) (47,736) (23,016)
USA companies 39,517 (10,592) (3,392)
Other foreign companies (10,396) (2,896) (46,064)
Total provision for deferred income taxes 21,364 (61,224) (72,472)
Total taxes 194,657 273,501 238,757
The Italian statutory tax rate is the result of two components: national (“IRES”) and regional (“IRAP”) tax.IRAP could have a substantially different base for its computation than IRES.Reconciliation between the Italian statutory tax rate and the effective tax rate is as follows:
Year ended December 31,
2008 2007 2006
Italian statutory tax rate 31.4% 37.3% 37.3%
Aggregate effect of different rates in foreign jurisdictions (1.7)% (1.7)% (1.5)%
Aggregate effect of asset revaluation in Australia (6.8)%
Aggregate effect of Italian restructuring (5.3)%
Aggregate effect of change in tax law in Italy 2.1%
Effect of non-deductible stock-based compensation 1.1% 1.1% 5.5%
Aggregate other effects 2.2% 1.5% 0.7%
Effective rate 33.0% 35.0% 35.2%
In 2006, the Australian subsidiaries of the Company elected to apply a new tax consolidation regime, whichwas introduced by the Australian government. By electing such new consolidation regime for tax purposes,certain intangible and fixed assets were revaluated for tax purposes increasing their tax basis. The increasein the tax basis became effective in 2006 upon filing the final 2005 tax return in December 2006.

The 2007 tax benefit of 5.3%, relates to the business reorganization of certain Italian companies which resultsin the release of deferred tax liabilities and is partially offset by the increase by 2.1% in the 2007 tax chargedue to the change in the Italian statutory tax rates which results in the reduction of deferred tax assets. The deferred tax assets and liabilities as of December 31, 2008 and 2007, respectively, were comprised of(Euro 000):
NOTES TO CONSOLIDATED FINANCIAL STATEMENTS | 75 <
Amounts in thousands of Euro 2008 2007
Deferred income tax assets
Inventory 71,660 73,062
Insurance and other reserves 8,580 10,238
Right of return reserve 14,471 13,464
Net operating loss carryforwards 50,565 45,224
Occupancy reserves 19,630 14,681
Employee-related reserves (including pension liability) 72,974 48,977
Trade name 76,525 72,686
Deferred tax on derivatives 21,685 549
Other 54,819 28,349
Fixed assets 29,684 24,472
Total deferred income tax assets 420,593 331,702
Valuation allowance (24,048) (27,088)
Net deferred tax assets 396,545 304,614
Deferred income tax liabilities
Trade name (241,409) (216,997)
Fixed assets (32,919)
Other intangibles (115,031) (117,975)
Dividends (13,316) (11,933)
Other (12,067) (20,342)
Total deferred income tax liabilites (414,742) (367,247)
Net deferred income tax liabilities (18,197) (62,633)
Deferred income tax assets and liabilities have been classified in the consolidated financial statements asfollows:
Deferred income tax assets - current 131,907 117,853
Deferred income tax assets - non current 83,447 67,891
Deferred income tax liabilities - non current (233,551) (248,377)
Net deferred income tax liabilities (18,197) (62,633)
On December 24, 2007, the Italian Government issued the Italian Finance Bill of 2008 (the “2008 Bill”). The2008 Bill decreases the national tax rate (referred to as “IRES”) from 33% to 27.5%, and the regional taxrate (referred to as “IRAP”) from 4.25% to 3.9%. The effect of this change created an additional Euro 8million of deferred tax expense in 2007.
The Company does not provide for an accrual for income taxes on undistributed earnings of its non Italianoperations to the related Italian parent company that are intended to be permanently invested. It is not

> 76 | ANNUAL REPORT 2008
practicable to determine the amount of income tax liability that would result had such earnings actuallybeen distributed. In connection with the 2008 earnings of certain subsidiaries, the Company has providedfor an accrual for income taxes related to declared dividends of earnings.
At December 31, 2008, a US subsidiary of the Company had Federal net operating loss carry-forwards(NOLs) of approximately Euro 97.6 million which may be used against income generated by certainsubsidiary groups. Substantially all of the NOLs begin expiring in 2019. Approximately Euro 231.1thousand and Euro 513.0 thousand of these NOLs were used in 2008 and 2007, respectively. The use of theNOL is limited due to restrictions imposed by U.S. tax rules governing utilization of loss carry-forwardsfollowing changes in ownership. None of the net operating losses expired in 2008, 2007 or 2006. As ofDecember 31, 2008, such US subsidiary of the Company had various state net operating loss carry-forwards(SNOLs), associated with individual states within the United States of America totaling approximately Euro8.0 million. These SNOLs begin expiring in 2009. Due to the foreign operations of the US subsidiary, as ofDecember 31, 2008, such US subsidiary of the Company has approximately Euro 4.1 million and Euro 1.9million of non US net operating losses and foreign tax credit carry-forwards, respectively. These foreignNOLs and foreign tax credits will begin to expire in 2012 and 2016, respectively.
As of December 31, 2008 and 2007, the Company has recorded an aggregate valuation allowance of Euro24.1 million and Euro 27.1 million, respectively, against deferred tax assets as it is more likely than not thatthe above deferred income tax assets will not be fully utilized in future periods. The amount of valuationallowance that would be allocated directly to capital in future periods, if reversed, is not material.
A reconciliation of the amount of unrecognized tax benefits is as follows (amounts in thousands of Euro):
Balance - January 1, 2007 54,089
Gross increase - acquisition of Oakley 14,176
Gross increase - tax positions in prior period 5,018
Gross decrease - tax positions in prior period (7,473)
Gross increase - tax positions in current period 5,796
Settlements (2,799)
Lapse of statute of limitations (8,851)
Change in exchange rates (3,365)
Balance - December 31, 2007 56,591
Gross increase - tax positions in prior period 4,910
Gross decrease - tax positions in prior period (9,356)
Gross increase - tax positions in current period 13,139
Settlements (6,756)
Lapse of statute of limitations (2,296)
Change in exchange rates 1,901
Balance - December 31, 2008 58,133
Included in the balance of unrecognized tax benefits at December 31, 2008 and December 31, 2007, areEuro 39.1 million and Euro 39.9 million of tax benefits that, if recognized, would affect the effective tax rate.
The Group does not anticipate the unrecognized tax benefits to change significantly during 2009.
The Group recognizes interest accrued related to unrecognized tax benefits and penalties as income tax

expense. Related to the uncertain tax benefits noted above, the Company’s accrual for penalties andinterest during 2008 and 2007 was immaterial and, in total, as of December 31, 2008, the Company hasrecognized a liability for penalties of approximately Euro 3.6 million and interest expense of approximatelyEuro 7.5 million.The Group is subject to taxation in Italy and foreign jurisdictions of which only the U.S. federal is significant. Italian companies’ taxes are subject to review pursuant to Italian law. As of December 31, 2008, tax yearsfrom 2003 through the most recent year were open for such review. At the date of December, 31 2008 noItalian companies are subjected to a tax inspection. The previous tax inspections open in 2007 were closedwith no material liability for the Group.The Group’s U.S. federal tax years for 2005, 2006 and 2007 are subject to examination by the tax authorities.
9. LONG-TERM DEBT
Long-term debt consists of the following (thousands of Euro):
NOTES TO CONSOLIDATED FINANCIAL STATEMENTS | 77 <
December 31,
2008 2007
Credit agreement with various Italian financial institutions (a) 400,000 185,000
Senior unsecured guaranteed notes (b) 213,196 97,880
Credit agreement with various financial institutions (c) 1,001,403 1,059,918
Other loans with banks and other third parties, interest
at various rates, payable in installments through 2014 (d) 4,314 4,894
Credit Agreement with various financial Institution
for Oakley acquisition (e) 1,185,482 1,369,582
Capital lease obligations, payable in installments through 2009 1,107 1,866
Total 2,805,502 2,719,140
Current maturities 286,213 792,617
Long-term debt 2,519,289 1,926,523
(a) In September 2003, the Company acquired its ownership interest of OPSM and more than 90 percentof the performance rights and options of OPSM for an aggregate of AUD 442.7 million (Euro 253.7million), including acquisition expenses. The purchase price was paid for with the proceeds of a creditfacility with Banca Intesa S.p.A. of Euro 200 million, in addition to other short-term lines available. Thecredit facility included a Euro 150 million term loan, which required repayment of equal semi-annualinstallments of principal of Euro 30 million starting on September 30, 2006 until the final maturity date.Interest accrued on the term loan at Euribor (as defined in the agreement) plus 0.55 percent. Therevolving loan provided borrowing availability of up to Euro 50 million; amounts borrowed under therevolving portion could be borrowed and repaid until final maturity. Interest accrued on the revolvingloan at Euribor (as defined in the agreement) plus 0.55 percent. The Company could select interestperiods of one, two or three months. The final maturity of the credit facility was September 30, 2008,the credit facility was repaid in full. The credit facility contains certain financial and operating covenants.The Company was in compliance with those covenants during 2008, prior to the final maturity date.
In June 2005, the Company entered into four interest rate swap transactions with various banks with anaggregate initial notional amount of Euro 120 million which decreased by Euro 30 million every six monthsstarting on March 30, 2007. These swaps expired on September 30, 2008. The ineffectiveness of cash flow
> 78 | ANNUAL REPORT 2008
hedges was tested at the inception date and throughout the year. The results of the tests indicated thatthe cash flow hedges were highly effective prior to the swap expiration date of September 2008.
In December 2005, the Company entered into an unsecured credit facility with Banca Popolare diVerona e Novara Soc. Coop. a R.L (LLC). The 18-month credit facility consisted of a revolving loan thatprovided borrowing availability of up to Euro 100.0 million. Amounts borrowed under the revolvingportion could be borrowed and repaid until final maturity. The final maturity of the credit facility wasJune 1, 2007. The Company repaid the outstanding amount on the maturity date with the proceeds ofa new unsecured credit facility with Banca Popolare di Verona e Novara Soc. Coop. a R.L. The new 18-month credit facility consisted of a revolving loan that provided borrowing availability of up to Euro100.0 million. Amounts borrowed under the revolving portion could be borrowed and repaid until finalmaturity. Interest accrued on the revolving loan at Euribor (as defined in the agreement) plus 0.25percent. The Company could select interest periods of one, three or six months. The credit facilityexpired on December 3, 2008 and the credit facility was repaid in full.
In April 2008, the Company entered into a new Euro 150.0 million unsecured credit facility with BancaNazionale del Lavoro. This facility is an 18-month revolving credit facility that provides borrowingavailability of up to Euro 150.0 million. The amounts borrowed under the revolving facility can beborrowed and repaid until final maturity. Interest accrues at EURIBOR plus 0.375 percent (3.604 percentas of December 31, 2008). The Company can select interest periods of one, three or six months. Thefinal maturity of the credit facility is October 8, 2009. As of December 31, 2008 Euro 150.0 million wasborrowed under this facility.
On May 29, 2008, the Company entered into a Euro 250.0 million revolving credit facility, guaranteedby its subsidiary, Luxottica US Holdings Corp. (“US Holdings”), with Intesa Sanpaolo S.p.A., as agent,and Intesa Sanpaolo S.p.A., Banca Popolare di Vicenza S.c.p.A. and Banca Antonveneta S.p.A., aslenders. The final maturity of the credit facility is May 29, 2013. The credit facility will require repaymentof equal quarterly installments of Euro 30.0 million of principal starting on August 29, 2011, and arepayment of Euro 40.0 million on the final maturity date. Interest accrues at EURIBOR (as defined inthe agreement) plus a margin between 0.40 percent and 0.60 percent based on the “NetDebt/EBITDA” ratio, as defined in the agreement (3.741 percent as of December 31, 2008). As ofDecember 31, 2008 Euro 250.0 million was borrowed under this credit facility.
(b) On September 3, 2003, US Holdings closed a private placement of US$ 300 million (Euro 215.5 millionat the exchange rate as of December 31, 2008) of senior unsecured guaranteed notes (the “Notes”),issued in three series (Series A, Series B and Series C). Interest on the Series A Notes accrued at 3.94percent per annum and interest on Series B and Series C Notes accrues at 4.45 percent per annum. TheSeries A and Series B Notes matured on September 3, 2008 and the Series C Notes mature onSeptember 3, 2010. The Series A and Series C Notes require annual repayments beginning onSeptember 3, 2006 through the applicable dates of maturity. The Notes are guaranteed on a seniorunsecured basis by the Company and Luxottica S.r.l., a wholly owned subsidiary. The Notes containcertain financial and operating covenants. US Holdings was in compliance with those covenants as ofDecember 31, 2008. In December 2005, US Holdings terminated three interest rate swaps thatcoincided with the Notes and, as such, the final adjustment to the carrying amount of the hedgedinterest-bearing financial instruments is being amortized as an adjustment to the fixed-rate debt yieldover the remaining life of the debt. The effective interest rate on the Series C Notes outstanding asDecember 31, 2008, is 5.44 percent for its remaining life. Amounts outstanding under these Notes wereEuro 15.6 million and Euro 97.9 million as of December 31, 2008 and 2007, respectively.
On July 1, 2008, US Holdings closed a private placement of US$ 275 million senior unsecuredguaranteed notes (the “2008 Notes”), issued in three series (Series A, Series B and Series C). The principal

amounts of Series A, Series B and Series C Notes are US$ 20 million, US$ 127 million and US$ 128million, respectively. Series A Notes mature on July 1, 2013, Series B Notes mature on July 1, 2015 andSeries C Notes mature on July 1, 2018. Interest on the Series A Notes accrues at 5.96 percent perannum, interest on the Series B Notes accrues at 6.42 percent per annum and interest on the Series CNotes accrues at 6.77 percent per annum. The proceeds from the 2008 Notes received on July 1, 2008,were used to repay a portion of the Bridge Loan Facility which was amended on July 1, 2008. Inaddition, US Holdings extended the amended Bridge Loan (see (e) below) of US$ 150 million for afurther 18 months starting from July 1, 2008.
(c) On June 3, 2004, as amended on March 10, 2006, the Company and US Holdings entered into a creditfacility with a group of banks providing for loans in the aggregate principal amount of Euro 1,130 millionand US$ 325 million. The five-year facility consists of three Tranches (Tranche A, Tranche B, Tranche C).The March 2006 amendment increased the available borrowings, decreased the interest margin anddefined a new maturity date of five years from the date of the amendment for Tranche B and TrancheC. On February 2007, the Company exercised an option included in the amendment to the term andrevolving facility to extend the maturity date of Tranches B and C to March 2012. On February 2008, theCompany exercised an option included in the amendment to the term and revolving facility to extendthe maturity date of Tranches B and C to March 2013. Tranche A is a Euro 405 million amortizing termloan requiring repayment of nine equal quarterly installments of principal of Euro 45 million beginningin June 2007, which is to be used for general corporate purposes, including the refinancing of existingLuxottica Group S.p.A. debt as it matures. Tranche B is a term loan of US$ 325 million which was drawnupon on October 1, 2004 by US Holdings to finance the purchase price of the acquisition of Cole.Amounts borrowed under Tranche B will mature in March 2013. Tranche C is a Revolving Credit Facilityof Euro 725 million-equivalent multi-currency (Euro/US Dollar). Amounts borrowed under Tranche Cmay be repaid and reborrowed with all outstanding balances maturing in March 2013. The Companycan select interest periods of one, two, three or six months with interest accruing on Euro-denominatedloans based on the corresponding Euribor rate and US Dollar denominated loans based on thecorresponding LIBOR rate, both plus a margin between 0.20 percent and 0.40 percent based on the“Net Debt/EBITDA” ratio, as defined in the agreement. The interest rate on December 31, 2008 was4.166 percent for Tranche A, 4.874 percent for Tranche B, 1.189 percent on Tranche C amountsborrowed in US Dollars and 3.397 percent on Tranche C borrowed in Euro. The credit facility containscertain financial and operating covenants. The Company was in compliance with those covenants as ofDecember 31, 2008. Under this credit facility, Euro 1,001.4 million and Euro 1,059.9 million wasborrowed as of December 31, 2008 and 2007, respectively.
In June 2005, the Company entered into nine interest rate swap transactions with an aggregate initialnotional amount of Euro 405 million with various banks which will decrease by Euro 45 million everythree months starting on June 3, 2007 (the “Club Deal Swaps”). These swaps will expire on June 3, 2009.The Club Deal Swaps were entered into as a cash flow hedge on Tranche A of the credit facilitydiscussed above. The Club Deal Swaps exchange the floating rate of Euribor for an average fixed rateof 2.565. percent per annum. The ineffectiveness of cash flow hedges was tested at the inception dateand at least every three months. The results of the tests indicated that the cash flow hedges are highlyeffective. As a consequence approximately Euro 0.17 million, net of taxes, is included in othercomprehensive income as of December 31, 2008. Based on current interest rates and marketconditions, the estimated aggregate amount to be recognized as earnings from other comprehensiveincome for these cash flow hedges in fiscal 2009 is approximately Euro 0.07 million, net of taxes.During the third quarter of 2007 the Group entered into 13 interest rate swap transactions with anaggregate initial notional amount of US$ 325.0 million with various banks (“Tranche B Swaps”). Theseswaps will expire on March 10, 2012. The Tranche B Swaps were entered into as a cash flow hedge onTranche B of the credit facility discussed above. The Tranche B Swaps exchange the floating rate of Liborfor an average fixed rate of 4.616 percent per annum. The ineffectiveness of cash flow hedges was tested
NOTES TO CONSOLIDATED FINANCIAL STATEMENTS | 79 <

> 80 | ANNUAL REPORT 2008
at the inception date and every three month. The results of the tests indicated that the cash flow hedgesare highly effective. As a consequence approximately US$ (17.3) million, net of taxes, is included in othercomprehensive income as of December 31, 2008. Based on current interest rates and market conditions,the estimated aggregate amount to be recognized as earnings from other comprehensive income forthese cash flow hedges in fiscal 2009 is approximately US$ (6.3) million, net of taxes.
(d) Other loans consist of several small credit agreements. Certain subsidiaries’ fixed assets are pledgedas collateral for such loans.
(e) On November 14, 2007, the Group completed the merger with Oakley for a total purchase price ofapproximately US$ 2.1 billion. In order to finance the acquisition of Oakley, on October 12, 2007 theCompany and its subsidiary US Holdings entered into two credit facilities with a group of banksproviding for certain term loans and a bridge loan for an aggregate principal amount of US$ 2.0 billion.The term loan facility is a term loan of US$ 1.5 billion, with a five-year term, with options to extend thematurity on two occasions for one year each time. The term loan facility is divided into two facilities,Facility D and Facility E. Facility D consists of an amortizing term loan in an aggregate amount of US$1.0 billion, made available to US Holdings, and Facility E consists of a bullet term loan in an aggregateamount of US$ 500 million, made available to the Company. Each facility has a five-year term, withoptions to extend the maturity date on two occasions for one year each time. Interest accrues on theterm loan at LIBOR plus 20 to 40 basis points based on “Net Debt to EBITDA” ratio, as defined in theagreement (1.545 percent for Facility D and 2.346 percent for Facility E on December 31, 2008). OnSeptember 2008, the Company exercised an option included in the agreement to extend the maturitydate of Tranches D and E to October 12, 2013. These credit facilities contain certain financial andoperating covenants. The Company was in compliance with those covenants as of December 31, 2008.US$ 1,500.0 million was borrowed under this credit facility as of December 31, 2008.During the third quarter of 2007 the Group entered into ten interest rate swap transactions with anaggregate initial notional amount of US$ 500.0 million with various banks (“Tranche E Swaps”). Theseswaps will expire on October 12, 2012. The Tranche E Swaps were entered into as a cash flow hedge onFacility E of the credit facility discussed above. The Tranche E Swaps exchange the floating rate of Liborfor an average fixed rate of 4.26 percent per annum. The ineffectiveness of cash flow hedges was testedat the inception date and at least every three months. The results of the tests indicated that the cash flowhedges are highly effective. As a consequence approximately US$ (30.1) million, net of taxes, is includedin other comprehensive income as of December 31, 2008. Based on current interest rates and marketconditions, the estimated aggregate amount to be recognized in earnings from other comprehensiveincome for these cash flow hedges in fiscal 2009 is approximately US$ (9.5) million, net of taxes.
During the fourth quarter of 2008 US Holdings entered into ten interest rate swap transactions with anaggregate initial notional amount of US$ 500.0 million with various banks (“Tranche D Swaps”).The lastmaturity of these swaps will be October 12, 2012. The Tranche D Swaps were entered into as a cash flowhedge on Facility D of the credit facility discussed above. The Tranche D Swaps exchange the floating rateof Libor for an average fixed rate of 2.77 percent per annum. The ineffectiveness of cash flow hedges wastested at the inception date and at least every three months. The results of the tests indicated that the cashflow hedges are highly effective. As a consequence approximately US$ (10.7) million, net of taxes, isincluded in other comprehensive income as of December 31, 2008. Based on current interest rates andmarket conditions, the estimated aggregate amount to be recognized in earnings from othercomprehensive income for these hedges in fiscal 2009 is approximately US$ (4.7) million, net of taxes.The short term bridge loan facility was for an aggregate principal amount of US$ 500 million. Interestaccrued on the short term bridge loan at LIBOR (as defined in the agreement) plus 0.15 percent. Thefinal maturity of the credit facility was eight months from the first utilization date. On April 29, 2008, theCompany and its subsidiary US Holdings entered into an amendment and transfer agreement to theUS$ 500.0 million short-term bridge loan facility entered into to finance the Oakley acquisition. The
terms of this amendment and transfer agreement, among other things, reduced the total facilityamount from US$ 500.0 million to US$ 150.0 million, effective on July 1, 2008, and provided for a finalmaturity date that is 18 months from the effective date of the agreement. From July 1, 2008, interestaccrues at LIBOR (as defined in the agreement) plus 0.60 percent (4.6525 percent as of December31,2008). As of December 31, 2008 US$ 150.0 million was borrowed under this facility.Long-term debt, including capital lease obligations, matures in the years subsequent to December 31,2008 as follows (thousands of Euro):
10. EMPLOYEE BENEFITS
Liability for Termination Indemnities. With regards to staff leaving indemnities (“TFR”), Italian lawprovides for severance payments to employees upon dismissal, resignation, retirement of othertermination of employment. TFR, through December 31, 2006, was considered an unfunded definedbenefit plan. Therefore, through December 31, 2006, the Company accounted for the defined benefit planin accordance with EITF 88-1, “Determination of Vested Benefit Obligation for a Defined Benefit PensionPlan,” using the option to record the vested benefit obligation, which is the actuarial present value of thevested benefits to which the employee would be entitled if the employee retired, resigned or wereterminated as of the date of the financial statements..
Effective January 1, 2007, the TFR system was reformed, and under the new law, employees are given theability to choose where the TFR compensation is invested, whereas such compensation otherwise wouldbe directed to the National Social Security Institute or Pension Funds. As a result, contributions under thereformed TFR system are accounted for as a defined contribution plan. The liability accrued untilDecember 31, 2006 continues to be considered a defined benefit plan, therefore each year, the Companyadjusts its accrual based upon headcount and inflation and excluding the changes in compensation level.There are also some termination indemnities in other countries which are provided through payroll tax andother social contributions in accordance with local statutory requirements. The related charges to earningsfor the years ended December 31, 2008, 2007 and 2006 were Euro 17.9 million, Euro 15.4 million and Euro12.9 million respectively.
Qualified Pension Plans. During fiscal years 2008, 2007, and 2006, the Company continued to sponsor aqualified noncontributory defined benefit pension plan, the Luxottica Group Pension Plan (“Lux Plan”),which provides for the payment of benefits to eligible past and present employees of the Company uponretirement. Pension benefits are accrued based on length of service and annual compensation under acash balance formula.The Lux Plan was amended effective January 1, 2006, granting eligibility to associates who work in the ColeVision stores, field management, and the related labs and distribution centers. Additionally, the Companyamended the pension accrual formula for the Cole associates, as well as all new hires for the Company.The new formula has a more gradual benefit accrual pattern and incorporates changes to the vestingschedule as required by the Pension Plan Protection Act of 2006.
NOTES TO CONSOLIDATED FINANCIAL STATEMENTS | 81 <
Years ended December 31
2009 286,213
2010 260,601
2011 257,978
2012 511,564
2013 1,305,686
Thereafter 183,460
Total 2,805,502

> 82 | ANNUAL REPORT 2008
As of the effective date of the Cole acquisition, the Company assumed sponsorship of the Cole NationalGroup, Inc. Retirement Plan (“Cole Plan”). This was a qualified noncontributory defined benefit pensionplan that covered Cole employees who met eligibility service requirements and were not members ofcertain collective bargaining units. In January 2002, the Cole Plan was frozen for all participants. Theaverage pay for all participants was frozen as of March 31, 2002, and covered compensation was frozen asof December 31, 2001. Benefit service was also frozen as of March 31, 2002, except for those who were age50 with 10 years of benefit service as of that same date, whose service will continue to increase as long asthey remain employed by the Company. As of December 31, 2007, the Cole Plan was merged into the LuxPlan. The projected benefit obligation and fair value of net assets transferred on such date were Euro 34.2million (US$ 49.9 million) and Euro 37.6 million (US$ 54.9 million), respectively. Upon the merger, there wereno changes to the provisions or benefit formulas of the Lux Plan.
Nonqualified Pension Plans and Agreements. The Company also maintains a nonqualified, unfundedsupplemental executive retirement plan (“SERP”) for participants of its qualified pension plan to providebenefits in excess of amounts permitted under the provisions of prevailing tax law. The pension liabilityand expense associated with this plan are accrued using the same actuarial methods and assumptions asthose used for the qualified pension plan.Starting January 1, 2006, this plan’s benefit provisions were amended to mirror the changes made to theCompany’s qualified pension plan.A subsidiary of the Company sponsors the Cole National Group, Inc. Supplemental Pension Plan. This planis a nonqualified unfunded SERP for certain participants of the Cole pension plan who were designated bythe Board of Directors of Cole on the recommendation of Cole’s chief executive officer at such time. Thisplan provides benefits in excess of amounts permitted under the provisions of the prevailing tax law. Thepension liability and expense associated with this plan are accrued using the same actuarial methods andassumptions as those used for the qualified pension plan. The following tables provide key information pertaining to the Company’s pension plans and SERPs. Duringthe fiscal year 2008, the Company adopted a December 31 measurement date for these plans as required bySFAS 158. The Company used a September 30 measurement date for fiscal 2007 (thousands of Euro).
Obligation and funded status Pension Plans SERP
2008 2007 2008 2007
Change in benefit obligations:
Benefit obligation - beginning of period 266,786 272,248 10,095 8,320
Service cost 21,666 16,449 679 504
Interest cost 21,210 15,606 870 589
Actuarial (gain)/loss 55 (1,690) 92 1,871
Benefits paid (11,111) (8,573) (294) (219)
Translation difference 14,914 (27,254) 573 (970)
Benefit obligation - end of period 313,520 266,786 12,015 10,095
Pension Plans SERP
2008 2007 2008 2007
Change in plan assets:
Fair value of plan assets - beginning of period 226,575 216,792
Actual return on plan assets (55,679) 24,203
Employer contribution 16,318 16,717 294 219
Benefits paid (11,111) (8,573) (294) (219)
Translation difference 8,276 (22,564)
Fair value of plan assets - end of period 184,379 226,575
Funded status (129,141) (40,211) (12,015) (10,095)

The accumulated benefit obligations for the pension plans and SERPs as of December 31, 2008 andSeptember 30, 2007 and 2006 were as follows (thousands of Euro):
NOTES TO CONSOLIDATED FINANCIAL STATEMENTS | 83 <
Amounts recognized in the consolidated balance sheets as of December 31, 2008 and 2007, consist of thefollowing (thousands of Euro):
Obligation and funded status Pension Plans SERP
2008 2007 2008 2007
Liabilities:
Current liabilities - - 443 770
Noncurrent liabilities 129,141 40,211 11,572 9,325
Total accrued pension liabilities 129,141 40,211 12,015 10,095
Other comprehensive income:
Net loss 104,015 28,380 3,535 3,898
Prior service cost 217 283 5 17
Contributions after measurement date - - 5
Accumulated other comprehensive income 104,232 28,663 3,540 3,920
Pension plans SERP
2008 2007 2006 2008 2007 2006
Accumulated benefit obligations 288,828 245,829 255,239 10,124 7,989 6,542
Components of net periodic benefit cost
and other amounts recognized
in other comprehensive income
Net periodic benefit cost:
Service cost 17,333 16,449 13,326 543 504 335
Interest cost 16,968 15,606 15,090 696 589 442
Expected return on plan assets (17,256) (16,703) (15,837)
Amortization of actuarial loss 1,174 2,640 3,277 342 413 299
Amortization of prior service cost 52 547 561 (9) 9 10
Net periodic benefit cost 18,271 18,539 16,417 1,572 1,515 1,086
Adjustment due to change in measurement date 4,568 397
Other changes in plan assets and benefit obligations
recognized in other comprehensive income:
Net loss (gain) 77,303 (9,191) 4,518 92 1,871 1,831
Prior service cost 297
Amortization of actuarial loss (1,467) (2,640) (3,277) (427) (413) (299)
Amortization of prior service cost (64) (547) (561) (11) (9) (10)
Total recognized in other comprehensive income 75,772 (12,378) 977 (346) 1,449 1,522
Total 98,611 6,161 17,394 1,623 2,964 2,608

> 84 | ANNUAL REPORT 2008
The estimated net loss and prior service cost for the defined benefit pension plans that will be amortizedfrom accumulated OCI into net periodic benefit cost over the next fiscal year are Euro 2.0 million and Euro0.1 million, respectively. The estimated net loss and prior service cost for the SERPs that will be amortizedfrom accumulated OCI into net periodic benefit cost over the next fiscal year are Euro 0.2 million and Euro0.0 million, respectively.
Assumptions Pension plans SERP
2008 2007 2008 2007
Weighted-average assumption used to determine
benefit obligations:
Discount rate 6.30% 6.50% 6.30% 6.50%
Rate of compensation increase 6%/5%/4% 6%/5%/4% 6%/5%/4% 6%/5%/4%
Weighted-average assumption used to determine
net periodic benefit cost for years
ended December 31, 2008 and 2007:
Discount rate 6.50% 6.00% 6.50% 6.00%
Expected long-term return on plan assets 8.00% 8.25% N/A N/A
Rate of compensation increase 6%/5%/4% 6%/5%/4% 6%/5%/4% 6%/5%/4%
Mortality table RP-2000 RP-2000 RP-2000 RP-2000
The Company uses an assumption for salary increases based on a graduated approach of historicalexperience. The Company’s experience shows salary increases that typically vary by age. Our actuaries use the RP-2000 Mortality Table, which includes death rates for each age, in estimating theamount of pension benefits that will become payable.For 2008, the Company’s long-term rate of return assumption on the pension plans’ assets was 8.00%. Indeveloping this assumption, the Company considered input from its third-party pension asset managers,investment consultants, and plan actuaries, including their review of asset class return expectations andlong-term inflation assumptions. The Company also considered the pension plans’ historical averagereturn over various periods of time (through September 30, 2008). The resulting assumption was alsobenchmarked against the assumptions used by other U.S. corporations as reflected in several surveys todetermine consensus thinking at that time on this assumption. Plan Assets - The pension plan’s target and actual asset allocations at December 31, 2008 and September30, 2007, by asset category are as follows:
Asset allocation Plan assets at Plan assets at
target December 31, 2008 September 30, 2007
Lux plan Lux plan Cole plan
Asset categoryEquity securities 65% 57% 63% 72%
Debt securities 35% 42% 35% 27%
Other -% 1% 2% 1%
Total 100% 100% 100% 100%

The Lux Plan’s investment policy defines the target allocation as mentioned in the above table as well asa range of possible allocations. The range of allocation to equity securities is 58% to 72% and the rangeof allocation to debt securities is 32% to 38%. The actual allocation percentages at any given time may varyfrom the targeted amounts due to changes in stock and bond valuations as well as timing of contributionsto, and benefit payments from, the pension plan trusts. Beginning in September 2008, the global capitalmarkets took a downward turn and have since become extremely volatile. This volatility is evident in theyear-end market values of plan assets. Upon direction from the plan’s administrator, the Luxottica Group’sEmployee Retirement Income Security Act of 1974 (“ERISA”) Plans Compliance and InvestmentCommittee, it was decided to refrain from an actual rebalancing of the plan’s assets until the marketsbecome more stable. Plan assets are invested in diversified portfolios consisting of an array of asset classes within the abovetarget allocations and using a combination of active strategies. Active strategies employ multipleinvestment management firms. Risk is controlled through diversification among asset classes, managers,styles, market capitalization (equity investments), and individual securities. Certain transactions andsecurities are not authorized to be conducted or held in the pension trusts, such as ownership of realestate other than real estate investment trusts, commodity contracts, and American Depositary Receipts(“ADRs”) or common stock of the Company. Risk is further controlled both at the asset class and managerlevel by assigning benchmarks and excess return targets. The investment managers are monitored on anongoing basis to evaluate performance against the established market benchmarks and return targets.The defined benefit pension plans have an investment policy that was developed to serve as amanagement tool to provide the framework within which the fiduciary’s investment decisions are made,establish standards to measure investment manager’s performance, outline the roles and responsibilitiesof the various parties involved, and describe the ongoing review process.
Benefit Payments. The following estimated future benefit payments, which reflect expected futureservice, are expected to be paid in the years indicated (thousands of Euro):
NOTES TO CONSOLIDATED FINANCIAL STATEMENTS | 85 <
Pension Supplementalplan plans
2009 10,677 442
2010 11,314 560
2011 12,395 558
2012 13,670 948
2013 15,276 1,179
2014-2018 92,668 4,746
Contributions. The Company expects to contribute Euro 26.9 million to its pension plan and Euro 0.4million to the SERP in 2009.
Other benefits. The Company provides certain postemployment medical, disability, and life insurancebenefits. The Company’s accrued liability related to this obligation as of December 31, 2008 and 2007, wasEuro 1.6 million and Euro 1.4 million, respectively, and is included in other long term liabilities on theconsolidated balance sheets.
The Company sponsors a tax incentive savings plan covering all full-time employees. The Company makesquarterly contributions in cash to the plan based on a percentage of employees’ contributions.Additionally, the Company may make an annual discretionary contribution to the plan, which may be madein the Parent Company’s ADRs or cash. Aggregate contributions made to the tax incentive savings plan bythe Company were Euro 8.8 million and Euro 8.1 million for fiscal 2008 and 2007, respectively. For fiscal2008 and 2007, these contributions did not include a discretionary match.

> 86 | ANNUAL REPORT 2008
Upon the acquisition of Oakley, effective November 14, 2007, the Company also sponsors a tax incentivesavings plan for all United States Oakley associates with at least six months of service. This plan is fundedby employee contributions with the Company matching a portion of the employee contribution. Companycontributions to the plan for fiscal 2008 and for the period November 14, 2007 through December 31, 2007,were Euro 1.2 million and Euro 0.1 million, respectively.
The Company sponsors the following additional other benefit plans, which cover certain present and pastemployees of the Cole companies acquired:• Cole provides, under individual agreements, postemployment benefits for continuation of health care
benefits and life insurance coverage to former employees after employment. As of December 31, 2008and 2007, the accrued liability, related to these benefits, was Euro 0.7 million and Euro 1.0 million,respectively, and is included in “other long term liabilities” on the consolidated balance sheet.
• The Company sponsors a tax incentive savings plan covering all full-time employees in Puerto Rico. TheCompany makes quarterly contributions in cash to the plan based on a percentage of employee’scontributions. The Company may make an annual discretionary contribution to the plan, which may bemade in the Parent Company’s ADRs or cash. In 2008 and 2007, contributions to the plan wereimmaterial. For fiscal 2008 and 2007, these contributions did not include a discretionary match.
• Cole established and maintains the Cole National Group, Inc. Supplemental Retirement Benefit Plan,which provides supplemental retirement benefits for certain highly compensated and managementemployees who were previously designated by the former Board of Directors of Cole as participants.This is an unfunded noncontributory defined contribution plan. Each participant’s account is creditedwith interest earned on the average balance during the year. This plan was frozen as to future salarycredits on the effective date of the Cole acquisition in 2004. The plan liability of Euro 1.0 million and Euro1.0 million at December 31, 2008 and 2007, respectively, is included in “other long term liabilities” on theconsolidated balance sheets.
Other defined contribution plan. The Company continues to participate in superannuation plans inAustralia and Hong Kong. The plans provide benefits on a defined contribution basis for employees onretirement, resignation, disablement or death. Contributions to defined contribution superannuationplans are recognized as an expense as the contributions are paid or become payable to the fund.Contributions are accrued based on legislated rates and annual compensation.
Certain employees of the Company located outside the United States are covered by state sponsoredpostemployment benefit plans. These plans are generally funded in conformity with the applicable localgovernment regulations and amounts are expensed as contributions accrue. The aggregate liability to theCompany for these foreign postemployment benefit plans as of December 31, 2008 and 2007, was immaterial.
Health benefit plans. The Company partially subsidizes health care benefits for U.S. eligible retirees.Employees generally become eligible for retiree health care benefits when they retire from active servicebetween the ages of 55 and 65. Benefits are discontinued at age 65.As of the Cole acquisition date, the Company assumed a liability for a postretirement benefit planmaintained by Cole in connection with its acquisition of Pearle in 1996. This plan was closed to newparticipants at the time of Cole’s acquisition of Pearle. Under this plan, the eligible former employees areprovided life insurance and certain health care benefits, which are partially subsidized by Cole. Medicalbenefits under this plan can be maintained past age 65. Effective January 1, 2008, the Cole postretirementbenefit plan was merged into the Luxottica Group Postretirement Medical Benefits Program (“LuxPostretirement Plan”). The projected benefit obligation transferred on such date was Euro 2.2 million.Upon the merger, there were no changes to provisions of the Lux Postretirement Plan. Amounts recognized in the consolidated balance sheets as of December 31, 2008 and 2007, consist of thefollowing (thousands of Euro):

Amounts recognized in accumulated OCI are immaterial.
Benefit payments. The following estimated future benefit payments for the health benefit plans, whichreflect expected future service, are estimated to be paid in the years indicated (thousands of Euro):
NOTES TO CONSOLIDATED FINANCIAL STATEMENTS | 87 <
2008 2007
Liabilities:
Current liabilities 157 173
Noncurrent liabilities 2,773 3,260
Total accrued postretirement liabilities 2,930 3,433
Years ending December 31,
2009 157
2010 171
2011 192
2012 206
2013 215
2014-2018 1,275
Contributions. The expected contributions for 2009 are expected to be immaterial for both theCompany and aggregate employee participants.For 2008, an 11.0% (11.5% for 2007) increase in the cost of covered health care benefits was assumed. Thisrate was assumed to decrease gradually to 5% for 2020 and remain at that level thereafter. The health carecost trend rate assumption could have a significant effect on the amounts reported. A 1% increase ordecrease in the health care trend rate would not have a material impact on the consolidated financialstatements. The weighted-average discount rate used in determining the accumulated postretirementbenefit obligation was 6.3% at December 31, 2008 and 6.5% at September 30, 2007.The weighted-average discount rate used in determining the net periodic benefit cost for 2008 and 2007,was 6.5%, and 6.00%, respectively.
Implementation of SFAS No. 158As required by SFAS 158, during fiscal 2008 the Company adopted a December 31 measurement date forthe Lux Plan, SERP and the Lux Postretirement Plan. As a result of this change in measurement date, theadjustment to retained earnings net of tax related to the Lux Plan, the SERP and Lux Postretirement Planwas a decrease of Euro 2.8 million, Euro 0.2 million and Euro 0.1 million, respectively. The impact toaccumulated other comprehensive Income net of tax related to the Lux Plan and the SERP plans was anincrease of Euro 0.2million, Euro 0.0 million and Euro 0.0 million, respectively
11. STOCK OPTION AND INCENTIVE PLANS
Stock option plan. Beginning in April 1998, certain officers and other key employees of the Companyand its subsidiaries were granted stock options of Luxottica Group S.p.A. under the Company’s stockoption plans (the “plans”). The aggregate number of shares permitted to be granted under these plansto the employees is 24,714,600. The Company believes that the granting of options to these keyemployees strengthens their loyalty and recognizes their contribution to the Group’s success. Prior to2006, under the older plans the stock options were granted at a price that was equal to or greater thanmarket value of the shares at the date of grant. Under the 2005 and 2006 plans, options were granted at

> 88 | ANNUAL REPORT 2008
Weighted average Weighted averageNumber exercise price remaining Aggregate
of options (denominated contractual intrinsic valueoutstanding in Euro) terms (Euro 000)
Outstanding as of December 31, 2007 9,113,913 16.61
Granted 2,020,500 18.08
Forfeitures (248,800) 10.89
Exercised (724,613) 8.65
Outstanding as of December 31, 2008 10,161,000 13.89 5.51 3,611
Exercisable at December 31, 2008 5,708,000 14.57 3.75 3,611
The weighted-average fair value of grant-date fair value options granted during the years 2008, 2007 and2006 was Euro 5.02, Euro 6.03 and Euro 5.72, respectively.The fair value of the stock options granted was estimated at the date of grant using a binomial latticemodel. The following table presents the weighted - average assumptions used in the valuation and theresulting weighted average fair value per option granted:
2008 2007 2006
Dividend yield 1.65% 1.43% 1.33%
Risk-free interest rate 3.63% 3.91% 3.11%
Expected option life (years) 6.27 5.7 5.8
Expected volatility 26.93% 23.70% 25.91%
Weighted average fair value (Euro) 5.02 6.03 5.72
Expected volatilities are based on implied volatilities from traded share options on the Company’s stock,historical volatility of the Company’s share price, and other factors. The expected option life is based onthe historical exercise experience for the Company based upon the date of grant and represents theperiod of time that options granted are expected to be outstanding. The risk-free rate for periods withinthe contractual life of the option is based on the U.S. Federal Treasury or European government bond yieldcurve, as appropriate, in effect at the time of grant.As of December 31, 2008 there was Euro 10.2 million of total unrecognized compensation cost related tonon-vested share-based compensation arrangements; that cost is expected to be recognized over aperiod of 1.8 years.
the greater of either (i) the previous 30 day average stock price immediately before the date of grant or(ii) the price on the grant date depending on certain regulatory requirements of the country where theemployee receiving the option is located. These options become exercisable in either three equal annualinstallments, two equal annual installments in the second and third years of the three-year vesting periodor 100 percent vesting on the third anniversary of the date of grant. Certain options may containaccelerated vesting terms if there is a change in ownership (as defined in the plans).
The Company adopted SFAS No. 123(R), Share-Based Payment, as of January 1, 2006, and at such pointbegan expensing stock options over their requisite service period based on their fair value as of the dateof grant. For the years ended December 31, 2008, 2007 and 2006, Euro 7.5 million, Euro 7.8 million andEuro 7.0 million, respectively, of compensation expense has been recorded for these plans.A summary of option activity under the Plans as of December 31, 2008, and changes during the year thenended is as follows:

Stock Performance Plans. In October 2004, under a Company performance plan, the Company grantedoptions to acquire an aggregate of 1,000,000 shares of the Company to certain employees of the NorthAmerican Luxottica Retail Division which vested and became exercisable on January 31, 2007 as certainfinancial performance measures were met over the period ending December 2006. For the years endedDecember 31, 2008, 2007 and 2006 Euro 0.0 million, Euro 0.2 million and Euro 1.9 million, respectively, ofcompensation expense has been recorded for this plan.
In September 2004, the Company’s Chairman and majority shareholder, Mr. Leonardo Del Vecchio,allocated shares held through La Leonardo Finanziaria S.r.l., an Italian holding company of the Del Vecchiofamily, representing, at that time, 2.11 percent (or 9.6 million shares) of the Company’s currently authorizedand issued share capital, to a stock option plan for top management of the Company at an exercise priceof Euro 13.67 per share. The stock options to be issued under the stock option plan vested upon meetingcertain economic objectives in June 2006. For the year ended December 31, 2006 Euro 21.4 million ofcompensation expense has been recorded for this plan.
In July 2006, under a Company performance plan, the Company granted options to acquire an aggregateof 13,000,000 shares of the Company to certain top management positions throughout the Companywhich vest and become exercisable as certain financial performance measures are met. Upon vesting theemployee will be able to exercise such options until they expire in 2016. Currently it is expected that theseperformance conditions will be met. If these performance measures are not expected to be met noadditional compensation costs will be recognized and previous compensation costs recognized will bereversed. In 2008 management revisited their estimate of the period when the targeted performancemeasures are likely to be met. Based on the new estimate the vesting period has been postponed toDecember 31, 2013. For the years ended December 31, 2008, 2007 and 2006, Euro 3.0 million, Euro 34.1million and Euro 17.6 million, respectively, of compensation expense has been recorded for these plans.A summary of option activity under the performance plans as of December 31, 2008, and changes duringthe year then ended are as follows:
NOTES TO CONSOLIDATED FINANCIAL STATEMENTS | 89 <
Weighted average Weighted averageNumber exercise price remaining Aggregate
Performance Plans of options (denominated contractual intrinsic valueoutstanding in Euro) Terms (Euro 000s)
Outstanding as of December 31, 2007 22,670,000 18.01
Granted 1,203,600
Forfeitures (100,000) 22.09
Exercised (20,000) 12,64
Outstanding as of December 31, 2008 23,753,600 17.1 6.37 15,362
Exercisable at December 31, 2008 9,650,000 13.66 5.55 15,362
The weighted-average fair value of grant-date fair value options granted during the year 2006 was Euro5.13. There were no performance grants issued in 2007. In May 2008, a Performance Shares Plan for topmanagers within the Group as identified by the Board of Directors of the Group (the “Board”) (the “2008PSP”) was adopted. The 2008 PSP is intended to strengthen the loyalty of the Group’s key employees andto recognize their contribution to the Group’s success on a medium-to long-term basis. The beneficiariesof the 2008 PSP are granted the right to receive ordinary shares, without consideration, at the end of thethree-year vesting period, and subject to achievement of certain financial target as defined by the Board.The 2008 PSP has a term of five years, during which time the Board may resolve to issue different grantsto the 2008 PSP’s beneficiaries. The 2008 PSP covers a maximum of 6,500,000 ordinary shares. Each annualgrant will not exceed 2,000,000 ordinary shares. On May 13, 2008, the Board granted 1,203,600 rights toreceive ordinary shares. Management believes that based, on the current estimates, the Group

> 90 | ANNUAL REPORT 2008
performance targets as defined by the plan will not be achieved. Accordingly no compensation expenseplan has been recorded in 2008 for this plan.The fair value of the stock options granted was estimated at the date of grant using a binomial latticemodel. The following table presents the weighted - average assumptions used in the valuation and theresulting weighted average fair value per option granted:
2008 2007 2006
PSP Plan I Plan II (a) (b)
Dividend yield 1.65% - 1.33% 1.33%
Risk-free interest rate 3.96% - 3.88% 3.89%
Expected option life (years) 2.10 - 5.36 5.53
Expected volatility 30.41% - 26.63% 26.63%
Weighted average fair value (Euro) 17.67 - 6.15 5.8
(a) Stock Performance Plan issued in July 2006 for a total of 9,500,000 options granted(b) Stock Performance Plan issued in July 2006 for a total of 3,500,000 options granted
As of December 31, 2008 there was Euro 14.8 million of total unrecognized compensation cost related tonon-vested share-based compensation arrangements; that cost is expected to be recognized over aperiod of 5 years.Cash received from option exercises under all share-based arrangements and actual tax benefits realizedfor the tax deductions from option exercises are disclosed in the consolidated statements of shareholders’equity.
12. SHAREHOLDERS’ EQUITY
In May 2008 and June 2007, the Company’s Annual Shareholders Meetings approved cash dividends ofEuro 223.6 million and Euro 191.1 million, respectively. These amounts became payable in May 2008 andJune 2007, respectively. Italian law requires that five percent of net income be retained as a legal reserveuntil this reserve is equal to one-fifth of the issued share capital. As such, this legal reserve is not availablefor dividends to the shareholders. Legal reserves of the Italian entities included in retained earnings wereEuro 5.6 million and Euro 5.5 million at December 31, 2008 and 2007, respectively.Luxottica Group’s legal reserve roll-forward for fiscal period 2006-2008 is detailed as follows (thousands ofEuro):
January 1, 2006 5,477
Increase in fiscal year 2006 36
December 31, 2006 5,513
Increase in fiscal year 2007 23
December 31, 2007 5,536
Increase in fiscal year 2008 18
December 31, 2008 5,554

Previously the Board of Directors authorized US Holdings to repurchase through the open market up to21,500,000 ADRs of Luxottica Group S.p.A., representing at that time approximately 4.7 percent of theauthorized and issued share capital. As of December 31, 2004, both repurchase programs expired and USHoldings purchased 6,434,786 ADRs (1,911,700 in 2002 and 4,523,786 in 2003) at an aggregate purchaseprice of Euro 70.0 million (US$ 73.8 million translated at the exchange rate at the time of the transactions).In connection with the repurchase, an amount of Euro 70.0 million is classified as treasury shares in theCompany’s consolidated financial statements. The market value of these shares based on the share price aslisted on the Milan Stock Exchange at December 31, 2008, is approximately Euro 81.5 million (US$ 113.8million).
13. SEGMENTS AND RELATED INFORMATION
In accordance with SFAS No. 131, Disclosures About Segments of an Enterprise and Related Information,the Company operates in two industry segments: (1) manufacturing and wholesale distribution and (2)retail distribution. Through its manufacturing and wholesale distribution operations, the Company isengaged in the design, manufacture, wholesale distribution and marketing of house brand and designerlines of mid- to premium-priced prescription frames and sunglasses. The Company operates in the retailsegment through its Retail Division, consisting of LensCrafters, Sunglass Hut International, OPSM GroupLimited and Cole National Corporation. For 2007, Oakley was viewed as a stand alone segment since itwas not yet integrated into the wholesale and retail segmentsThe following tables summarize the segment and geographic information deemed essential by theCompany’s management for the purpose of evaluating the Company’s performance and for makingdecisions about future allocations of resources.The “Inter-segment transactions and corporate adjustments” column includes the elimination of inter-segment activities which consist primarily of sales of product from the manufacturing and wholesalesegment to the retail segment and corporate related expenses not allocated to reportable segments.Identifiable assets are those tangible and intangible assets used in operations in each segment. Corporateidentifiable assets are principally cash, goodwill and trade names.
NOTES TO CONSOLIDATED FINANCIAL STATEMENTS | 91 <

> 92 | ANNUAL REPORT 2008
(1) Inter-segment elimination of net sales relates to intercompany sales from the manufacturing and wholesale segment to the retail segment.(2) Inter-segment elimination of Income from operations mainly relates to depreciation and amortization of corporate identifiable assets and profit-in-stockelimination for frames manufactured by the wholesale Segment and included in the retail segment inventory. (3) Corporate adjustments to depreciation and amortization relate to depreciation and amortization of corporate assets.(4) Corporate adjustments to identifiable assets include mainly the net value of goodwill and trade names of acquired retail businesses.
The geographic segments include Italy, the main manufacturing and distribution base, United States andCanada (which includes the United States of America, Canada and Caribbean islands), Asia Pacific (whichincludes Australia, New Zealand, China, Hong Kong and Japan) and Other (which includes all othergeographic locations including Europe (excluding Italy), South and Central America and the Middle East).Sales are attributed to geographic segments based on the legal entity domicile where the sale isoriginated.
(thousands of Euro) Manufacturing Retail Oakley Inter-segments Consolidatedand Wholesale transactions
and corporateadjustments
Year ended
December 31, 2006
Net sales 1,715,369 3,294,161 (333,374) (1) 4,676,156
Income from operations 445,843 431,547 (121,403) (2) 755,987
Capital expenditure 108,117 164,063 272,180
Depreciation &
amortization 57,331 122,403 41,063 (3) 220,797
Identifiable assets 1,853,144 1,343,482 1,772,252 (4) 4,968,878
Year ended
December 31, 2007
Net sales 1,992,740 3,233,802 86,964 (347,452) (1) 4,966,054
Income from operations 527,991 361,809 3,717 (60,204) (2) 833,313
Capital expenditure 112,973 213,293 8,503 334,769
Depreciation &
amortization 68,981 118,100 7,682 38,050 (3) 232,813
Identifiable assets 2,321,204 1,405,299 1,937,292 1,493,471 (4) 7,157,266
Year ended
December 31, 2008
Net sales 2,472,330 3,109,146 (379,865) (1) 5,201,611
Income from operations 545,507 291,469 (87,213) (2) 749,763
Capital expenditure 125,489 170,947 296,436
Depreciation &
amortization 85,987 123,129 55,822 (3) 264,938
Identifiable assets 2,750,081 1,528,410 3,026,734 (4) 7,305,225

(5) No single customer represents five percent or more of sales in any year presented.(6) Sales, income from operations and identifiable assets are the result of combination of legal entities located in the same geographic area.
14. FINANCIAL INSTRUMENTS
Concentration of Credit Risk. Financial instruments which potentially expose the Company toconcentration of credit risk consist primarily of cash investments and accounts receivable. The Companyattempts to limit its credit risk associated with cash equivalents by placing the Company’s cash balancesand investments with highly rated banks and financial institutions. With respect to accounts receivable,the Company limits its credit risk by performing ongoing credit evaluations and certain customers may berequired to post security in the form of letters of credit. As of December 31, 2008 and 2007, no singlecustomer balances comprised 10 percent or more of the overall accounts receivable balance. However,included in accounts receivable as of December 31, 2008 and 2007, was approximately Euro 12.3 millionfor both fiscal years, due from the host stores of our license brands retail division. These receivablesrepresent cash proceeds from sales deposited into the host stores bank accounts, which are subsequentlyforwarded to the Company on a weekly or monthly basis depending on the Company’s contract with theparticular host store and are based on contract arrangements that are short-term in length.
Concentration of Supplier Risk. As a result of the OPSM and Cole acquisitions, Essilor S.A. has becomeone of the largest suppliers to the Company’s Retail Division. For the 2008, 2007 and 2006 fiscal years,Essilor S.A. accounted for approximately 12.0 percent, 15.0 percent and 15.0 percent of the Company’stotal merchandise purchases, respectively. The Company has not signed any specific purchase contractwith Essilor. Management believes that the loss of this vendor would not have a significant impact on thefuture operations of the Company as it could replace this vendor quickly with other third-party suppliers.
NOTES TO CONSOLIDATED FINANCIAL STATEMENTS | 93 <
(Thousands of Euro) Italy (6) United States (6) Asia Pacific (6) Other (6) Adjustments ConsolidatedYear ended December 31, and Canada and eliminations
2006
Net sales (5) 1,321,887 3,076,503 603,640 761,955 (1,087,829) 4,676,156
Income from operations 389,275 331,002 33,841 79,397 (77,528) 755,987
Long lived assets, net 280,692 387,861 110,099 8,549 - 787,201
Identifiable assets 1,331,719 2,675,833 748,305 388,825 (175,804) 4,968,878
2007
Net sales (5) 1,506,077 3,073,086 685,561 1,114,429 (1,413,098) 4,966,054
Income from operations 377,799 324,167 57,191 127,761 (53,605) 833,313
Long lived assets, net 326,978 575,566 134,435 20,803 1,057,782
Identifiable assets 1,894,546 4,839,680 804,786 752,818 (1,134,565) 7,157,266
2008
Net sales (5) 1,379,599 3,376,294 729,050 1,307,631 (1,590,963) 5,201,611
Income from operations 290,697 332,564 53,262 133,018 (59,778) 749,763
Long lived assets, net 348,016 655,393 141,339 25,950 1,170,698
Identifiable assets 1,731,022 4,914,282 790,691 858,380 (989,150) 7,305,225

> 94 | ANNUAL REPORT 2008
15. COMMITMENTS AND CONTINGENCIES
Royalty Agreements. Luxottica Group has entered into license agreements to manufacture, design anddistribute prescription frames and sunglasses with selected fashion brands.Under these license agreements, Luxottica Group is required to pay a royalty which generally ranges fromfive percent to 14 percent of the net sales (as identified in the relevant agreements). Some of theseagreements provide also for annual guaranteed minimum payments. Such license agreements alsoprovide for a mandatory marketing contribution that generally amounts to between five and ten percentof net sales (as identified in the relevant agreements). These license agreements typically have termsranging from three to ten years, but may be terminated early by either party for a variety of reasons, interalia, non-payment of royalties, failure to meet minimum sales thresholds, product alteration and, undercertain agreements, a change in control of Luxottica Group S.p.A.On April 17, 2008 Luxottica Group announced the signing of a 6-year license agreement for the design,manufacture and distribution of sun eyewear under the Stella McCartney brand; it is renewable for further5 years. The agreement began on January 1, 2009.On January 31, 2008 Luxottica Group announced the extension of the license agreement for the design,manufacture and distribution of sun and prescription eyewear under the Chanel brand for another 3 yearsand it is renewable for an additional period of 3 years.Minimum payments required in each of the years subsequent to December 31, 2008 are detailed as follows(thousands of Euro):
Year ending December 31,
2009 56,862
2010 34,148
2011 26,291
2012 23,697
2013 24,141
Thereafter 96,872
Total 262,011
Total royalties and related advertising expenses for the fiscal years 2008, 2007 and 2006 aggregated 139.5million, Euro 181.6 million and Euro 184.1 million, respectively.Total payments for royalties and related advertising expenses for the fiscal years 2008, 2007 and 2006aggregated Euro 142.4 million, Euro 278.2 million and Euro 225.1 million, respectively.
Leases. The Company leases through its worldwide subsidiaries various retail store, plant, warehouse andoffice facilities, as well as certain of its data processing and automotive equipment under operating leasearrangements expiring between 2008 and 2025, with options to renew at varying terms. The leasearrangements for the Company’s U.S. retail locations often include escalation clauses and provisionsrequiring the payment of incremental rentals, in addition to any established minimums contingent uponthe achievement of specified levels of sales volume. In addition, with the acquisition of Cole, theCompany operates departments in various host stores paying occupancy costs solely as a percentage ofsales. Certain agreements which provide for operations of departments in a major retail chain in theUnited States contain short-term cancellation clauses.Total rental expense for each year ended December 31 is as follows (thousands of Euro):

Future minimum annual rental commitments are as follows (thousands of Euro):
NOTES TO CONSOLIDATED FINANCIAL STATEMENTS | 95 <
2008 2007 2006
Minimum rent 288,743 264,496 236,546
Contingent rent 55,464 60,177 64,091
Sublease income (26,017) (38,806) (35,955)
Totale 318,190 285,867 264,682
Year ending December 31,
2009 262,662
2010 221,936
2011 186,977
2012 156,085
2013 127,971
Thereafter 348,249
Total 1,303,880
Other commitments. The Company is committed to pay amounts in future periods for endorsementcontracts, supplier purchase and other long term commitments. Endorsement contracts are entered intowith selected athletes and others who endorse Oakley products. Oakley is often required to pay specifiedminimal annual commitments and, in certain cases, additional amounts based on performance goals.Certain contracts provide additional incentives based on the achievement of specified goals. Suppliercommitments have been entered into with various suppliers in the normal course of business. Future minimum amounts to be paid for endorsement contracts and supplier purchase commitments atDecember 31, 2008, are as follows (thousands of Euro):
Year ending December 31, Endorsement contracts Supplier commitments
2009 6,121 11,914
2010 2,811 11,898
2011 1,153 2,652
Thereafter 305 486
Total 10,390 26,950
Guarantees. The United States Shoe Corporation, a wholly owned subsidiary of the Company, remainscontingently liable on seven store leases in the United Kingdom. These leases were previously transferredto third parties. The third parties have assumed all future obligations of the leases from the date eachagreement was signed. However, under the common law of the United Kingdom, the lessor still has theright to seek payment of certain amounts from the Company if unpaid by the new obligor. If theCompany is required to pay under these guarantees, it has the right to recover amounts from the newobligor. These leases will expire during various years until December 31, 2015. At December 31, 2008, themaximum amount for which the Company’s subsidiary is contingently liable is Euro 5.2 million.
Cole has guaranteed future minimum lease payments for certain store locations leased directly byfranchisees. These guarantees aggregated approximately Euro 3.0 million at December 31, 2008.Performance under a guarantee by the Company is triggered by default of a franchisee on its leasecommitment. Generally, these guarantees also extend to payments of taxes and other expenses payableunder the leases, the amounts of which are not readily quantifiable. The terms of these guarantees range
> 96 | ANNUAL REPORT 2008
from one to ten years. Many are limited to periods less than the full term of the lease involved. Under theterms of the guarantees, Cole has the right to assume the primary obligation and begin operating thestore. In addition, as part of the franchise agreements, Cole may recover any amounts paid under theguarantee from the defaulting franchisee. The Company has accrued a liability at December 31, 2005 forthe estimates of the fair value of the Company’s obligations from guarantees entered into or modified afterDecember 31, 2002, using an expected present value calculation. Such amount is immaterial to theconsolidated financial statements as of December 31, 2008 and 2007.
Short-Term credit facilities. As of December 31, 2008 and 2007, Luxottica Group had unused short-termlines of credit of approximately Euro 230.5 million and Euro 291.4 million, respectively.The Company and its wholly-owned Italian subsidiary Luxottica S.r.l. maintain unsecured lines of credit withprimary banks for an aggregate maximum credit of Euro 374.8 million (Euro 467.4 million at December 31,2007). These lines of credit are renewable annually, can be cancelled at short notice and have nocommitment fees. At December 31, 2008 and 2007, these credit lines were utilized for Euro 252.4 millionand Euro 312.0 million, respectively.US Holdings maintains four unsecured lines of credit with four separate banks for an aggregate maximumcredit of Euro 111.3 million (US$ 155.0 million). These lines of credit are renewable annually, can becancelled at short notice and have no commitment fees. At December 31, 2008, there were Euro 46.7million (US$ 65.0 million) of borrowings outstanding and there were Euro 24.6 million in aggregate faceamount of standby letters of credit outstanding under these lines of credit (see below). The blended average interest rate on these lines of credit is approximately LIBOR plus 0.25 percent.
Outstanding standby letters of credit. A U.S. subsidiary has obtained various standby and trade lettersof credit from banks that aggregated Euro 34.2 million and Euro 31.0 million as of December 31, 2008 and2007, respectively. Most of these letters of credit are used for security in risk management contracts,purchases from foreign vendors or as security on store leases. Most standby letters of credit containevergreen clauses under which the letter is automatically renewed unless the bank is notified not torenew. Trade letters of credit are for purchases from foreign vendors and are generally outstanding for aperiod that is less than six months. Substantially all the fees associated with maintaining the letters ofcredit fall within the range of 50 to 100 basis points annually.
Litigation. The Company and its subsidiaries are involved in the following legal and regulatoryproceedings of which the timing and outcomes are inherently uncertain, and such outcomes could have amaterial adverse effect on the Company’s business, financial position or operating results.
California Vision Health Care Service Plan lawsuit. In March 2002, an individual commenced an actionin the California Superior Court for the County of San Francisco against the Company and certain of itssubsidiaries, including LensCrafters, Inc. and EYEXAM of California, Inc. The plaintiffs sought to certifythis case as a class action. The claims against LensCrafters and EYEXAM alleged various statutoryviolations relating to the confidentiality of medical information and the operation of LensCrafters’ storesin California, including violations of California laws governing relationships among opticians, opticalretailers, manufacturers of frames and lenses and optometrists, and other unlawful or unfair businesspractices. The action sought unspecified damages, statutory damages of US$ 1,000 per class member,return of profits, restitution of allegedly unjustly obtained sums, punitive damages and injunctive relief,including an injunction that would prohibit defendants from providing eye examinations or otheroptometric services at LensCrafters stores in California. The parties reached a settlement that offers a range of benefits, including store vouchers and a cashoption, along with certain enhancements to LensCrafters’ business practices. The Court granted finalapproval of the settlement, and final judgment was entered on August 7, 2008. The settlement becamefinal on October 6, 2008.

Amounts paid to settle this litigation and related costs incurred for the years ended December 31, 2008,2007 and 2006 were not material.
Cole consumer class action lawsuit. In June 2006, Cole and its subsidiaries were sued by a consumer ina class action that alleged various statutory violations related to the operations of Pearle Vision, Inc. andPearle Vision Care, Inc. in California. The claims and remedies sought are similar to those asserted in theLensCrafters and EYEXAM case. The parties entered into a settlement agreement, which provides for astore voucher at Pearle Vision or LensCrafters for each class member and the payment of attorneys’ feesand costs. On December 19, 2008, the court granted final approval of the settlement and entered finaljudgment. The settlement became final on March 17, 2009. Amounts paid to settle this litigation and related costs incurred for the years ended December 31, 2008,2007 and 2006 were not material.
Oakley shareholder lawsuit. On June 26, 2007, the Pipefitters Local No. 636 Defined Benefit Plan filed aclass action complaint, on behalf of itself and all other shareholders of Oakley, Inc. (“Oakley”), againstOakley and its Board of Directors in California Superior Court, County of Orange. The complaint alleged,among other things, that the defendants violated their fiduciary duties to shareholders by approvingOakley’s merger with Luxottica and claimed that the price per share fixed by the merger agreement wasinadequate and unfair. The defendants filed demurrers to the complaint, which the Court granted withoutprejudice. On September 14, 2007, the plaintiff filed an amended complaint containing the sameallegations as the initial complaint and adding purported claims for breach of the duty of candor.Because the Company believed the allegations were without merit, on October 9, 2007, the defendantsfiled a demurrer to the amended complaint. Rather than respond to that demurrer, the plaintiff admittedthat its claims were moot and on January 4, 2008 filed a motion for attorneys’ fees and expenses. Thehearing for this motion took place on April 17, 2008. On May 29, 2008, the Court issued a ruling denyingthe plaintiff’s motion for attorneys’ fees and expenses in its entirety. The court did not rule on thedefendants’ demurrer to the amended complaint. On July 11, 2008, the Court entered an orderdismissing the action with prejudice and denying the plaintiff’s motion for attorneys’ fees and expenses.The plaintiff has appealed the Court’s May 29, 2008 ruling and the July 11, 2008 order. Costs associated with this litigation incurred for the years ended December 31, 2008 and 2007, were notmaterial. Management believes, based in part on advice from counsel, that no estimate of the range ofpossible losses, if any, can be made at this time.
Fair credit reporting act litigation. In January 2007, a complaint was filed against Oakley and certain ofits subsidiaries in the United States District Court for the Central District of California, alleging willfulviolations of the Fair and Accurate Credit Transactions Act related to the inclusion of credit cardexpiration dates on sales receipts. Plaintiff brought suit on behalf of a class of Oakley’s customers. Oakleydenied any liability, and later entered into a settlement arrangement with Plaintiff that resulted in acomplete release in favor of the Oakley defendants, with no cash payment to the class members butrather an agreement by Oakley to issue vouchers for the purchase of products at Oakley retail storesduring a limited period of time. The settlement also provided for the payment of attorneys’ fees andclaim administration costs by the Oakley defendants. An order approving this settlement was entered onNovember 24, 2008.Amounts paid to settle this litigation and related costs incurred for the years ended December 31, 2008and 2007, were not material.
Texas LensCrafters class action lawsuit. In May 2008, two individual optometrists commenced an actionagainst LensCrafters, Inc. and Luxottica Group S.p.A. in the United States District Court for the EasternDistrict of Texas, alleging violations of the Texas Optometry Act (“TOA”) and the Texas Deceptive TradePractices Act, and tortious interference with customer relations. The suit alleges that LensCrafters hasattempted to control the optometrists’ professional judgment and that certain terms of the optometrists’
NOTES TO CONSOLIDATED FINANCIAL STATEMENTS | 97 <

> 98 | ANNUAL REPORT 2008
sub-lease agreements with LensCrafters violate the TOA. The suit seeks recovery of a civil penalty of upto US$ 1,000 for each day of a violation of the TOA, injunctive relief, punitive damages, and attorneys’fees and costs. In August 2008, plaintiffs filed a first amended complaint, adding claims for fraudulentinducement and breach of contract. In October 2008, plaintiffs filed a second amended complaintseeking to certify the case as a class action on behalf of all current and former LensCrafters’ sub-leaseoptometrists. Luxottica Group S.p.A. filed a motion to dismiss for lack of personal jurisdiction in October2008. That motion is currently pending. The case was transferred to the Western District of Texas, AustinDivision, in January, 2009, pursuant to the defendants’ motion to transfer venue. Although the Companybelieves that its operational practices in Texas comply with Texas law, if this action results in an adversedecision, LensCrafters may have to modify its activities in Texas. Further, LensCrafters and LuxotticaGroup might be required to pay statutory damages, the amount of which might have a material adverseeffect on the Company’s operating results, financial condition and cash flow.Costs associated with this litigation for the year ended December 31, 2008 were not material.Management believes, based in part on advice from counsel, that no estimate of the range of possiblelosses, if any, can be made at this time.
The Company is a defendant in various other lawsuits arising in the ordinary course of business. It is theopinion of the management of the Company that it has meritorious defenses against all such outstandingclaims, which the Company will vigorously pursue, and that the outcome of such claims, individually or inthe aggregate, will not have a material adverse effect on the Company’s consolidated financial position orresults of operations.
16. FAIR VALUES
Certain assets and liabilities of the Company are recorded at fair value on a recurring basis while othersare recorded at fair value based on specific events. SFAS No. 157 specifies a hierarchy of valuationtechniques consisting of three levels:• Level 1 - Inputs are quoted prices in an active markets for identical assets or liabilities• Level 2 - Inputs are quoted for similar assets or liabilities in an active market, quoted prices for identical
or similar assets and liabilities in markets that are not active, inputs other than quoted prices that areobservable (for example interest rates and yield curves observable at common quoted intervals) ormarket-corroborated inputs
• Level 3 - Unobservable inputs used observable inputs are not available in situations when there is little,if any market activity for the asset or liability
At December 31, 2008 the fair value of the Company’s financial assets and liabilities measured on arecurring basis are as follows (thousands of Euro):
Fair value measurements at reporting date using
Description Balance sheet classification December 31, 2008 Level 1 - Level 2 - Level 3 -
Marketable securities Prepaid expenses and other 23,550 23,550
Foreign Exchange Contracts Prepaid expenses and other 7,712 7,712
Interest Rate Derivatives Other assets 138 138
Interest Rate Derivatives Other long term liabilities 64,213 64,213
Foreign Exchange Contracts Other accrued expenses 5,022 5,022
As of December 31, 2008 the Company did not have any Level 3 fair value measurements.The Company maintains policies and procedures with the aim of valuing the fair value of assets andliabilities using the best and most relevant data available.

The fair value of the marketable securities are based on quoted prices that are observable in activemarkets such as bond prices, including both corporate and government bonds.The Company portfolio of foreign exchange derivatives includes only foreign exchange forward contractson the most traded currency pairs with maturity less than one year. The fair value of the portfolio is valuedusing internal models that use market observable inputs including Yield Curves, Spot and Forward prices.The fair value of the interest rate derivatives portfolio is calculated using internal models that maximize theuse of market observable inputs including Interest Rates, Yield Curves and Foreign Exchange Spot prices. The fair value of the TR Note as of December 31, 2007 was based on discounted projected cash flowsutilizing an expected yield and disclosed as “Other Assets” on the consolidated balance sheet. During2008 the Company sold such note to a third party (see Note 4 “Sale of Things Remembered”).SFAS 159 allows the Company to elect on a financials instrument basis to fair value such instrument withchanges in its fair value recorded into operations during the period of change. As of December 31, 2008and for the year then ended the Company has not elected any of its financial instruments to be accountedfor under SFAS 159.
17. SUBSEQUENT EVENTS
On January 28, 2009, the Company entered a new licensing agreement to design, manufacture andglobally distribute sun and prescription eyewear collection by Tory Burch and TT, two emerging Americanfashion and lifestyle brands. The agreement with Tory Burch LLC will run for six years - renewable for afurther four - with an expected launch of the first collection in 2009.The new collections will be distributed not only by Tory Burch boutiques and premium Americandepartment stores but also in select independent optical stores and in Luxottica’s retail chains. After NorthAmerica, distribution will be extended to Europe and the rest of the world.Tory Burch, a highly appreciated brand in the affordable luxury segment, completes Luxottica’s brandportfolio by further strengthening its positioning in the key North American market and in the continuallyexpanding department store channel.
On January 30, 2009, Luxottica Group and Salvatore Ferragamo Italia S.p.A., which controls GruppoFerragamo, agreed to a three-year extension of their licensing agreement covering design, manufacturingand global distribution of prescription and sun eyewear under the Salvatore Ferragamo label. The newagreement runs through December 2011, with an option on a two-year renewal under the same terms.
On Aprile 10, 2009, Luxottica Group and Donna Karan International Inc. agreed a five-year extension of thelicense agreement for the design, production and worldwide distribution of prescription frames andsunglasses under the Donna Karan and DKNY brands. The new agreement runs through December 2014,with an option for a further five-year extension.
STATEMENT OF THE OFFICER RESPONSIBLE FOR PREPARING THE COMPANY’S FINANCIAL REPORTS
The officer responsible for preparing the company’s financial reports, Enrico Cavatorta, declares, pursuantto paragraph 2 of Article 154-bis of the Consolidated Law on Finance, that the accounting informationcontained in this press release corresponds to the document results, books and accounting records.
NOTES TO CONSOLIDATED FINANCIAL STATEMENTS | 99 <

> 100 | ANNUAL REPORT 2008
INDEPENDENT AUDITOR’SREPORT

INDEPENDENT AUDITORS REPORT | 101 <


ANNEXES

In accordance to US GAAP(1) 1 ADS = 1 ordinary share. (2) Figures include results of Cole National operations from the acquisition date (October 4. 2004). (3) Results of Things Remembered, Inc., a former subsidiary that was sold in September 2006, arereclassified as discontinued operations and are not included in results from continuing operations for 2006, 2005 and 2004. (4) Figures include results of Oakley operations from the acquisition date (November 14, 2007).
In accordance to US GAAP(1) Except for per share (ADS) data, which is in Euro and US$. (2) All amounts in US$ were translated at the average Euro/US$ exchange rate for the period in reference. See page 110.
2004-2008 FINANCIAL HIGHLIGHTS
2008(Euro 000) (1) (3) 1st quarter 2nd quarter 3rd quarter 4th quarter
Net sales 1,398,703 100.0% 1,354,442 100.0% 1,211,991 100.0% 1,236,476 100.0%
Gross profit 927,793 66.3% 917,034 67.7% 811,860 67.0% 800,018 64.7%
Operating income 207,057 14.8% 230,177 17.0% 195,081 16.1% 117,448 9.5%
Income before taxes 170,468 12.2% 206,581 15.3% 161,021 13.3% 51,800 4.2%
Net income 103,705 7.4% 132,580 9.8% 104,612 8.6% 38,825 3.1%
Earnings per share:
In Euro 0.23 0.29 0.23 0.09
In US$ (2) 0.34 0.46 0.35 0.11
2007-2008 QUARTERLY RESULTS(subject to limited auditing review)
2007
(Euro 000) 2008 2007 2006 2005 2004(4) (3) (3) (2)(3)
Net sales 5,201,611 100.0% 4,966,054 100.0% 4,676,156 100.0% 4,134,263 100.0% 3,179,613 100.0%
Gross profit 3,456,705 66.5% 3,390,436 68.3% 3,188,456 68.2% 2,761,190 66.8% 2,126,527 66.9%
Operating income 749,763 14.4% 833,313 16.8% 755,987 16.2% 581,401 14.1% 479,499 15.1%
Income before taxes 589,870 11.3% 780,681 15.7% 678,177 14.5% 539,309 13.0% 444,575 14.0%
Net income from continuing operations 379,722 7.3% 492,204 9.9% 430,705 9.2% 330,790 8.0% 279,109 8.8%
Discontinued operations - 0,0% - 0.0% (6,419) -0.1% 11,504 0.3% 7,765 0.2%
Net income 379,722 7.6% 492,204 9.9% 424,286 9.1% 342,294 8.3% 286,874 9.0%
Per ordinary share/(ADS)(1)
Earnings from continuing operations:
Euro 0.83 1.08 0.95 0.73 0.62
US$ 1.22 1.48 1.19 0.91 0.77
Total earnings
Euro 0.83 1.08 0.94 0.76 0.64
US$ 1.22 1.48 1.18 0.95 0.80
Dividend (2)
Euro - 0.490 0.420 0.290 0.230
Average no. of outstanding shares 456,563,502 455,184,797 452,897,854 450,179,073 448,275,028
(Euro 000) (1) (3) 1st quarter 2nd quarter 3rd quarter 4th quarter
Net sales 1,299,825 100.0% 1,326,777 100.0% 1,150,952 100.0% 1,188,500 100.0%
Gross profit 874,026 67.2% 918,620 69.2% 806,101 70.0% 791,689 66.6%
Operating income 224,125 17.2% 262,486 19.8% 195,021 16.9% 151,681 12.8%
Income before taxes 208,918 16.1% 247,953 18.7% 180,315 15.7% 143,496 12.1%
Net income 128,257 9.9% 154,581 11.7% 112,441 9.8% 96,926 8.2%
Earnings per share:
In Euro 0.28 0.34 0.25 0.21
In US$ (2) 0.35 0.45 0.34 0.31

(Euro 000) 2008 2007 2006(1)
Cash 302,894 339,122 367,461
Bank overdraft (455,588) (168,358) (275,956)
Current portion of long-term debt (792,617) (359,527) (110,978)
Long-term debt (1,926,523) (959,735) (1,417,931)
Net financial position, beginning of the year (2,871,834) (1,148,498) (1,437,404)
Net income from continuing operations 379,722 492,204 430,705
Depreciation and amortization 264,938 232,813 220,797
Change in net working capital (119,688) (377,082) (38,720)
Provision and other 53,923 (17,184) (13,805)
Operating cash flow 578,895 330,751 598,977
Capital expenditure (311,540) (322,770) (267,882)
(Investments)/Disposal in intangible assets (4,636) (3,883) (1,140)
Purchase of business net of cash acquired (13,288) (1,491,086) (134,114)
Sale of Things Remembered 128,007
Other 6,880 29,700 15,691
Free cash flow 256,311 (1,457,288) 339,539
Dividends (223,617) (191,077) (131,369)
Exercise of stock options 7,126 26,642 24,445
Effect of exchange adjustments to net financial position (117,503) (101,613) 56,292
Decrease/(Increase) in net financial position (77,683) (1,723,336) 288,906
Cash 288,450 302,894 339,122
Bank overdraft and notes payable (432,465) (455,588) (168,358)
Current portion of long-term debt (286,213) (792,617) (359,527)
Long-term debt (2,519,289) (1,926,523) (959,735)
Net financial position, end of the year (2,949,517) (2,871,834) (1,148,498)
STATEMENTS OF CHANGES IN NET FINANCIAL POSITIONANNEXES | 105 <
In accordance to US GAAP(1) Figures include results of Oakley operations from the acquisition date (November 14, 2007).

> 106 | ANNUAL REPORT 2008
SHARE CAPITAL AND DIVIDEND PER ORDINARY SHARE (ADS)
Euro (3)
1990 0.025
1991 0.028
1992 0.031
1993 0.037
1994 0.041
1995 0.045
1996 0.052
1997 0.063
1998 0.074
1999 0.085
2000 0.140
2001 0.170
2002 0.210
2003 0.210
2004 0.230
2005 0.290
2006 0.420
2007 0.490
2008 -
Number of shares authorized Adjusted number of shares
and issued as of December 31 authorized as of December 31 (2)
1990 45,050,000 450,500,000
1991 45,050,000 450,500,000
1992 45,050,000 450,500,000
1993 45,050,000 450,500,000
1994 45,050,000 450,500,000
1995 45,050,000 450,500,000
1996 45,050,000 450,500,000
1997 45,050,000 450,500,000
1998 (1) 225,250,000 450,500,000
1999 225,269,800 450,539,600
2000 (1) 451,582,300 451,582,300
2001 452,865,817 452,865,817
2002 454,263,600 454,263,600
2003 454,477,033 454,477,033
2004 455,205,473 455,205,473
2005 457,975,723 457,975,723
2006 460,216,248 460,216,248
2007 462,623,620 462,623,620
2008 463,368,233 463,368,233
ORDINARY SHARES AND ADS EVOLUTION (1)
GROSS DIVIDEND PER ORDINARY SHARE (OR ADS) (1)(2)
(1) 1 ADS = 1 ordinary share(2) Figures until 1999 have been retroactively adjusted to reflect the 5-for-1 stock split effective April 16, 1998, and the 2-for-1 stock split effective June 26, 2000.(3) Figures through 1999 have been calculated converting the dividend in Italian Lira by the fixed rate of Lire 1,936.27 = Euro 1.00. Beginning with the 2000 finan-
cial statements the dividend is declared in Euro.

31 Dec. 31 Dec. 31 Dec. 31 Dec. 31 Dec. 31 Dec. 31 Dec. 31 Dec. 30 Mar. 31 Jun. 30 Sept. 31 Dec.2000 2001 2002 2003 2004 2005 2006 2007 2008 2008 2008 2008
LensCrafters 864 868 882 877 888 894 902 951 951 954 956 966
Pearle Vision 843 837 840 880 875 856 839 809
Licensed Brands 1,327 1,349 1,358 1,338 1,185 1,185 1,200 1,204
- Sears Optical 934 960 941 886 881 881 883 879
- Target Optical 255 246 264 296 304 304 317 325
- BJ’s Optical 138 143 153 156
The Optical Shop of Aspen 21 20 21 22 24
Oliver Peoples 5 5 5 5 6
Sun North America 1,694 1,663 1,633 1,584 1,556 1,502 1,749 1,717 1,725 1,714 1,719
- Sunglass Hut, Sunglass Icon 1,694 1,663 1,633 1,584 1,556 1,502 1,743 1,710 1,714 1,701 1,703
- ILORI 6 7 11 13 16
Oakley Stores e Vaults 81 83 87 89 98
NORTH AMERICA 864 2,562 2,545 2,510 4,642 4,636 4,602 5,025 4,836 4,833 4,825 4,826
Optical Australia - New Zealand 524 519 511 527 552 547 543 539 540
- OPSM 328 324 314 314 322 319 320 319 319
- Laubman&Pank 126 124 123 127 135 134 133 131 131
- Budget Eyewear 70 71 74 86 94 93 89 88 89
- Oliver Peoples 1 1 1 1 1
Sunglass Hut Asia-Pacific 161 160 173 164 182 224 219 214 211 207 210
Bright Eyes 140 141 142 140 141
Oakley Stores & Vaults 15 15 15 14 16
ASIA-PACIFIC 161 160 697 683 693 751 926 917 911 900 907
David Clulow 65 64
Sunglass Hut Europe 89 91 99 110 109 92 87 88 85 85 82
Oakley Stores & Vaults 12 14 12 12 15
EUROPE 89 91 99 110 109 92 99 102 97 162 161
Optical China 76 74 65 274 249 241 238 240 238
Sunglass Hut Hong Kong 6 6 6 6 6
CHINA 76 74 65 274 255 247 244 246 244
Sunglass Hut 68 68 71 70 68
Oakley Stores & Vaults 2 2 2 2 2
SOUTH AFRICA 70 70 73 72 70
Sunglass Hut 23 27 31 33 38
Oakley Stores & Vaults 1 1 1 1 1
AFRICA & MIDDLE EAST 24 28 32 34 39
CENTRAL AND SOUTH AMERICA (Oakley) 8 7 8 8 8
TOTAL GROUP 864 2,812 2,796 3,382 5,509 5,503 5,719 6,407 6,207 6,198 6,247 6,255
2000-2008 EVOLUTION OF NUMBER OF STORES
ANNEXES | 107 <

> 108 | ANNUAL REPORT 2008
1990-2008 LUXOTTICA ADS AT NYSE (US$)
2000-2008 LUXOTTICA ORDINARY SHARE AT MTA (EURO)
(1) These figures have been retroactively adjusted to reflect the five-for-one stock split which was effective April 16, 1998, and the two-for-one stock split which was effective June 26, 2000.(2) From IPO (January 24, 1990).(3) From IPO (December 4, 2000).
Year Low High Average Close Year change Average volumes
1990 (1) 0.794 1.456 1.089 1.019 7.24% (2) 989,578
1991 0.988 2.750 1.822 2.750 169.93% 390,719
1992 2.250 3.281 2.852 2.513 -8.64% 313,051
1993 2.025 2.950 2.373 2.925 16.42% 231,107
1994 2.787 3.625 3.279 3.413 16.67% 189,325
1995 3.175 5.950 4.180 5.850 71.43% 417,048
1996 5.212 8.100 7.033 5.213 -10.90% 348,201
1997 5.125 6.988 6.092 6.250 19.90% 427,059
1998 3.875 9.494 6.964 6.000 -4.00% 342,659
1999 5.000 10.313 7.613 8.781 46.35% 354,464
2000 7.969 17.000 12.945 13.750 56.58% 222,136
2001 12.150 17.990 15.283 16.480 19.85% 248,020
2002 11.820 20.850 16.184 13.650 -17.17% 273,378
2003 10.230 18.150 13.877 17.400 27.47% 156,275
2004 15.180 20.390 17.344 18.640 7.13% 80,921
2005 19.690 25.830 22.408 25.310 35.78% 70,244
2006 24.360 31.390 28.303 30.670 21.18% 76,514
2007 29.700 38.640 33.925 31.490 2.67% 125,672
2008 15.980 30.920 24.228 18.120 -42.46% 251,319
Year Low High Average Close Year change Average volumes
2000 15.239 17.618 16.530 15.356 -16.99% (3) 211,328
2001 13.409 20.620 17.096 18.430 20.02% 117,744
2002 11.750 22.950 17.380 12.576 -31.76% 204,110
2003 9.248 14.820 12.231 13.700 8.94% 458,682
2004 12.427 15.512 13.911 14.995 9.45% 671,783
2005 15.110 21.940 18.109 21.430 42.91% 789,552
2006 19.300 24.460 22.512 23.280 8.63% 869,788
2007 22.720 28.790 24.979 21.750 -6.57% 1,306,403
2008 12.670 21.150 16.493 12.670 -41.75% 2,058,049
1990-2008 LUXOTTICA ADS AND ORDINARY SHARE PERFORMANCES

ANNEXES | 109 <
0
5
10
15
20
25
30
35
40
45
1990
1991
1992
1993
1994
1995
1996
1997
1998
1999
2000
2001
2002
2003
2004
2005
2006
2007
2008
ADS NYSE (US$) Dow Jones (rebased) S&P 500 (rebased)
Nineteen-years highUS$ 39.38 on July 12, 2007
Nineteen-years lowUS$ 0.7938 on November 7, 1990
0
5
10
15
20
25
30
2000
2001
2002
2003
2004
2005
2006
2007
2008
Ordinary share MTA (Euro) S&P MIB (rebased) Eur/US$ (rebased)
Nine-years low Euro 9.248 on March 12, 2003
Nine-years high Euro 28.79 on July 9, 2007

> 110 | ANNUAL REPORT 2008
Year 1st quarter 2nd quarter 3rd quarter 4th quarter Full-year Year change
1995 1.1793 1.1613 1.2081 1.2160 1.1887 -1.05%
1996 1.2307 1.2443 1.2727 1.2721 1.2549 5.57%
1997 1.1823 1.1457 1.0991 1.1255 1.1367 -9.42%
1998 1.0802 1.0944 1.1130 1.1765 1.1152 -1.89%
1999 1.1207 1.0567 1.0483 1.0370 1.0642 -4.57%
2000 0.9859 0.9326 0.9041 0.8676 0.9209 -13.47%
2001 0.9230 0.8721 0.8895 0.8959 0.8957 -2.74%
2002 0.8766 0.9198 0.9838 0.9982 0.9450 5.50%
2003 1.0731 1.1372 1.1248 1.1882 1.1307 19.65%
2004 1.2497 1.2046 1.2220 1.2968 1.2435 9.98%
2005 1.3113 1.2594 1.2197 1.1886 1.2444 0.07%
2006 1.2023 1.2579 1.2743 1.2889 1.2553 0.88%
2007 1.3016 1.3479 1.3738 1.4486 1.3705 9.18%
2008 1.4976 1.5622 1.5055 1.3180 1.4707 7.31%
1995-2008 AVERAGE EURO/US$ EXCHANGE RATE

ANNEXES | 111 <
NON US GAAP MEASURES: FREE CASH FLOWFree cash flow represents income from operations before depreciation and amortization, plus or minusthe decrease/(increase) in working capital over the prior period, less capital expenditures, plus or minusinterest income/(expense) and net charges for extraordinary items, minus taxes paid. The Companybelieves that free cash flow is useful to both management and investors in evaluating the Company’soperating performance compared to other companies in its industry. In particular, our calculation of freecash flow provides a clearer picture of the Company’s ability to generate net cash from operations, whichmay be used, among other things, to fund discretionary investments, pay dividends or pursue otherstrategic opportunities.Free cash flow is not a measure of performance under accounting principles generally accepted in theUnited States (US GAAP). We include it in this presentation in order to:• Improve transparency for investors;• Assist investors in their assessment of the Company’s operating performance and its ability to generate
cash from operations in excess of its cash expenses;• Ensure that this measure is fully understood in light of how the Company evaluates its operating results;• Properly define the metrics used and confirm their calculation; and• Share this measure with all investors at the same time.
Free cash flow is not meant to be considered in isolation or as a substitute for items appearing on ourfinancial statements prepared in accordance with US GAAP. Rather, this non-GAAP measure should beused as a supplement to US GAAP results to assist the reader in better understanding the operationalperformance of the Company. The Company cautions that this measure is not a defined term under USGAAP and its definition should be carefully reviewed and understood by investors. Investors should beaware that Luxottica Group’s method of calculation of free cash flow may differ from methods used byother companies. The Company recognizes that the usefulness of free cash flow as an evaluative tool mayhave certain limitations, including:• The manner in which the Company calculates free cash flow may differ from that of other companies,
which limits its usefulness as a comparative measure;• Free cash flow does not represent the total increase or decrease in the net debt balance for the period
since it excludes, among other things, cash used for funding discretionary investments and to pursuestrategic opportunities during the period and any impact of the exchange rate changes; and
• Free cash flow can be subject to adjustment at the Company’s discretion if the Company takes steps oradopts policies that increase or diminish its current liabilities and/or changes to working capital.
We compensate for the foregoing limitations by using free cash flow as one of several comparative tools,together with US GAAP measurements, to assist in the evaluation of our operating performance.See tables on the following pages for a reconciliation of free cash flow to EBITDA and EBITDA to incomefrom operations, respectively, which is the most directly comparable US GAAP financial measure.
(Euro 000) At December 31, 2008
EBITDA (1) 1,015
Change in working capital (77)
Capex (296)
Operating cash flow 641
Financial charges (2) (122)
Taxes (202)
Extraordinary charges (3) (15)
Free cash flow 302
(1) EBITDA is not a measure in accordance with US GAAP. For a reconciliation of EBITDA to income from operations, the nearest US GAAP measure, see the tableon the following page(2) Equals interest income minus interest expenses(3) Equals extraordinary income minus extraordinary expenses

> 112 | ANNUAL REPORT 2008
NON US GAAP MEASURES: EARNINGS PER SHARE BEFORETRADEMARK AMORTIZATION
Earnings per share before trademark amortization: Earnings per share (EPS) before trademark amortizationmeans earnings per share before trademark and other similar intangible asset amortization expense, net of taxes,per share. The Company believes that EPS before trademark amortization is useful to both management andinvestors in evaluating the Company’s operating performance and prospects compared to that of othercompanies in its industry. Our calculation of EPS before trademark amortization allows us to compare ourearnings per share with those of other companies without giving effect to the accounting effects of theamortization of the Company’s trademarks and other similar intangible assets, which may vary for differentcompanies for reasons unrelated to the overall operating performance of a company’s business.
EPS before trademark amortization is not a measure of performance under accounting principles generallyaccepted in the United States (US GAAP). We include it in this presentation in order to:• improve transparency for investors;• assist investors in their assessment of the Company’s operating performance;• ensure that this measure is fully understood in light of how the Company evaluates its operating results;• properly define the metrics used and confirm their calculation; and• share this measure with all investors at the same time.
EPS before trademark amortization is not meant to be considered in isolation or as a substitute for itemsappearing on our financial statements prepared in accordance with US GAAP. Rather, this non-GAAP measureshould be used as a supplement to US GAAP results to assist the reader in better understanding the operationalperformance of the Company. The Company cautions that this measure is not a defined term under US GAAPand its definition should be carefully reviewed and understood by investors. Investors should be aware thatLuxottica Group’s method of calculating EPS before trademark amortization may differ from methods used byother companies. The Company recognizes that the usefulness of EPS before trademark amortization as anevaluative tool may have certain limitations, including:• EPS before trademark amortization does not include the effects of amortization of the Company’s trademarks
and other intangible assets.
Because trademarks and other intangible assets are important to our business and to our ability to generatesales, we consider trademark amortization expense as a necessary element of our costs. Therefore, any measurethat excludes trademark amortization expense may have material limitations.
We compensate for these limitations by using EPS before trademark amortization as one of several comparativetools, together with US GAAP measurements, to assist in the evaluation of our operating performance.
See the table on the following pages for a reconciliation of EPS before trademark amortization to EPS, which isthe most directly comparable US GAAP financial measure.
(Euro millions) FY 2008
Operating income (+) 749.8
Depreciation & amortization (+) 264.9
EBITDA (=) 1,014.7

ANNEXES | 113 <
(Euro millions) FY 2008(1) FY 2007(2) Change
Trademark amortization and other similar intangible assets (+) 72 64
Taxes on trademark amortization and other similar
intangible assets (-) (26) (24)
Trademark amortization and other similar intangible assets,
net of taxes (=) 45 40
Average number of shares outstanding as of December 31
(in thousands) (/) 456,564 455,185
Trademark amortization and other similar intangible assets,
net of taxes, per share (=) 0.10 0.09
EPS (+) 0.87 1.05 -17.8%
EPS before trademark amortization and other similar
intangible assets, net of taxes (=) 0.96 1.14 -15.4%
€/US$ average exchange rate 1.4707 1.3705
EPS before trademark amortization and other
similar intangible assets, 1.42 1.56 -9.2%
net of taxes (in US$)
(1) Excluding the write-off of credit related to the sale of the Things Remembered business. The impact of such write-off is a loss of approximately €15 millionafter tax or €0.03 per share.(2) Excluding non-recurring gain related to the sale of a real estate property in 2Q 2007. The impact of the sale was a gain of approximately €20 million beforetaxes and approximately €13 million after taxes, equivalent to €0.03 at EPS level.
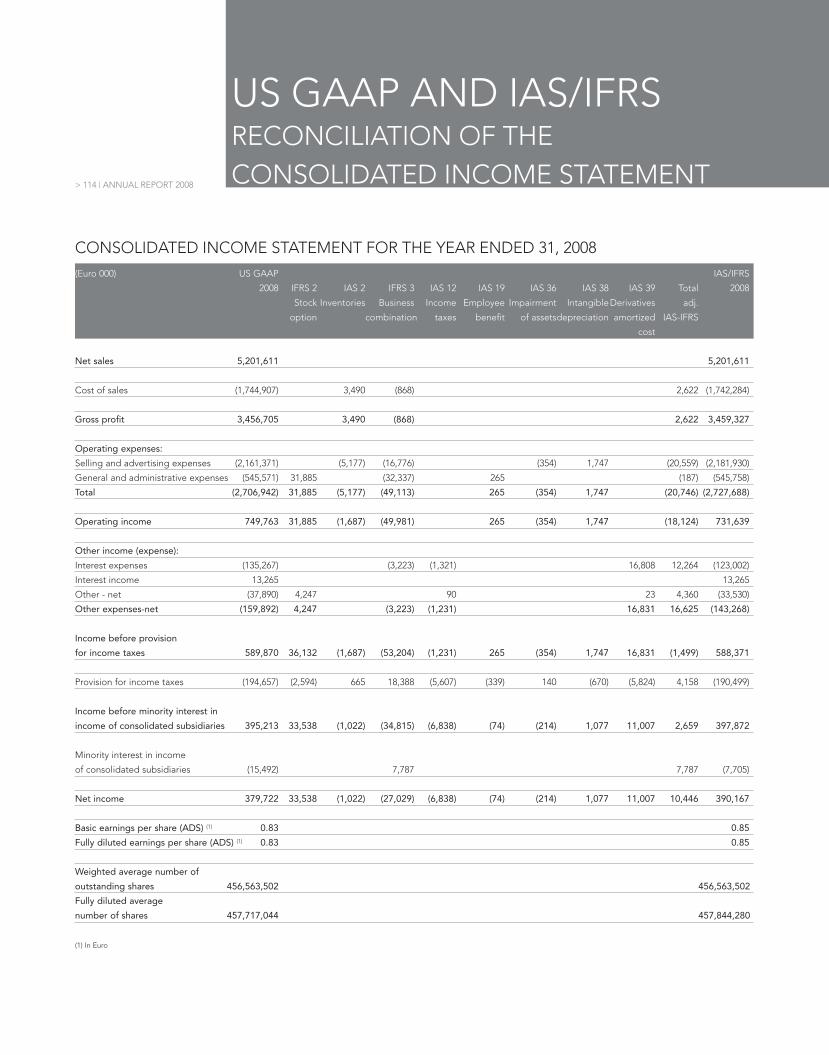
> 114 | ANNUAL REPORT 2008
US GAAP AND IAS/IFRSRECONCILIATION OF THECONSOLIDATED INCOME STATEMENT
(Euro 000) US GAAP IAS/IFRS
2008 IFRS 2 IAS 2 IFRS 3 IAS 12 IAS 19 IAS 36 IAS 38 IAS 39 Total 2008
Stock Inventories Business Income Employee Impairment IntangibleDerivatives adj.
option combination taxes benefit of assetsdepreciation amortized IAS-IFRS
cost
Net sales 5,201,611 5,201,611
Cost of sales (1,744,907) 3,490 (868) 2,622 (1,742,284)
Gross profit 3,456,705 3,490 (868) 2,622 3,459,327
Operating expenses:
Selling and advertising expenses (2,161,371) (5,177) (16,776) (354) 1,747 (20,559) (2,181,930)
General and administrative expenses (545,571) 31,885 (32,337) 265 (187) (545,758)
Total (2,706,942) 31,885 (5,177) (49,113) 265 (354) 1,747 (20,746) (2,727,688)
Operating income 749,763 31,885 (1,687) (49,981) 265 (354) 1,747 (18,124) 731,639
Other income (expense):
Interest expenses (135,267) (3,223) (1,321) 16,808 12,264 (123,002)
Interest income 13,265 13,265
Other - net (37,890) 4,247 90 23 4,360 (33,530)
Other expenses-net (159,892) 4,247 (3,223) (1,231) 16,831 16,625 (143,268)
Income before provision
for income taxes 589,870 36,132 (1,687) (53,204) (1,231) 265 (354) 1,747 16,831 (1,499) 588,371
Provision for income taxes (194,657) (2,594) 665 18,388 (5,607) (339) 140 (670) (5,824) 4,158 (190,499)
Income before minority interest in
income of consolidated subsidiaries 395,213 33,538 (1,022) (34,815) (6,838) (74) (214) 1,077 11,007 2,659 397,872
Minority interest in income
of consolidated subsidiaries (15,492) 7,787 7,787 (7,705)
Net income 379,722 33,538 (1,022) (27,029) (6,838) (74) (214) 1,077 11,007 10,446 390,167
Basic earnings per share (ADS) (1) 0.83 0.85
Fully diluted earnings per share (ADS) (1) 0.83 0.85
Weighted average number of
outstanding shares 456,563,502 456,563,502
Fully diluted average
number of shares 457,717,044 457,844,280
(1) In Euro
CONSOLIDATED INCOME STATEMENT FOR THE YEAR ENDED 31, 2008


> 116 | ANNUAL REPORT 2008
LUXOTTICA GROUP S.P.A.
REGISTERED OFFICE AND HEADQUARTERSVia C. Cantù, 2 - 20123 Milan - ItalyTel. +39 02 86334.1 - Fax +39 02 8633 4636E-mail: [email protected] code 00891030272 VAT no. IT 10182640150
MEDIA RELATIONSVia C. Cantù, 2 - 20123 Milan - ItalyTel. +39 02 86334062 - Fax +39 02 86334092E-mail: [email protected]
INVESTOR RELATIONSVia C. Cantù, 2 - 20123 Milan - ItalyTel. +39 02 86334718 - Fax +39 02 86334092E-mail: [email protected]
CORPORATE WEBSITEwww.luxottica.com
DEPOSITARY BANKITALYDeutsche Bank S.p.A. Piazza del Calendario, 3 - 20126 Milan - ItalyBruno Montemartini - Tel. +39 02 40242560 - Fax +39 02 40242790 E-mail: [email protected]
USADeutsche Bank Shareholder Servicesc/o American Stock Transfer & Trust Company (ADR Depositary Bank)Peck Slip Station - P.O. Box 2050 - New York, NY 10272-2050 - USATelephoneToll free number: 800 7491873 (from USA only)International callers: +1 718 9218137
INDEPENDENT AUDITORDeloitte & Touche S.p.A. Via Fratelli Bandiera, 3 - 31100 Treviso - ItalyTel. +39 0422 5875 Partner: Dario RighettiE-mail: [email protected]
KEY CONTACTS AND ADDRESSES


> 118 | ANNUAL REPORT 2008