Embed Size (px)
Citation preview
Camilo Lamus
October 1, 2010
1 / 22
9.07 MATLAB Tutorial
1 / 22

Aim
Transform students into MATLAB ninjas!
2 / 22
®
© Source Unknown. All rights reserved. This content is excluded from our Creative Commons license. For more information, see http://ocw.mit.edu/help/faq-fair-use/
Contents
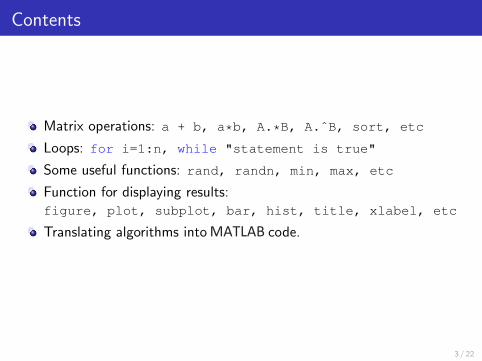
Matrix operations: a + b, a*b, A.*B, A.ˆB, sort, etc
Loops: for i=1:n, while "statement is true"
Some useful functions: rand, randn, min, max, etc
Function for displaying results:figure, plot, subplot, bar, hist, title, xlabel, etc
Translating algorithms intoMATLAB code.
3 / 22
Getting started
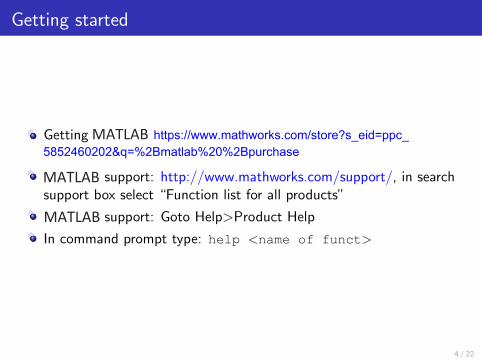
Getting
support: http://www.mathworks.com/support/, in searchsupport box select “Function list for all products”
support: Goto Help>Product Help
In command prompt type: help <name of funct>
4 / 22
MATLAB https://www.mathworks.com/store?s_eid=ppc_5852460202&q=%2Bmatlab%20%2Bpurchase
MATLAB
MATLAB
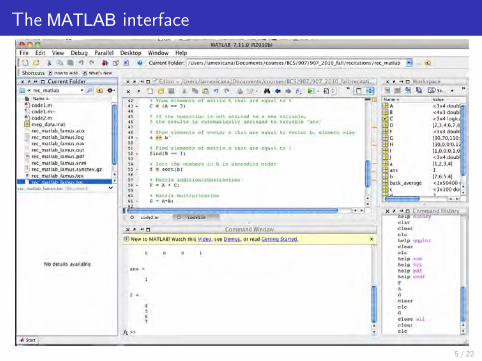
The MATLAB interface
5 / 22
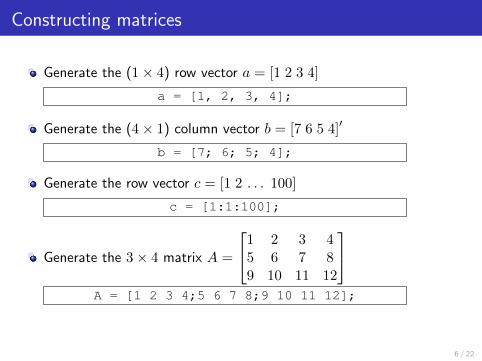
Constructing matrices
Generate the (1× 4) row vector a = [1 2 3 4]
a = [1, 2, 3, 4];
Generate the (4× 1) column vector b = [7 6 5 4]′
b = [7; 6; 5; 4];
Generate the row vector c = [1 2 . . . 100]
c = [1:1:100];
1Generate the 3× 4 matrix A =
2 3 45 6 7 8
9 10 11 12
A = [1 2 3 4;5 6 7 8;9 10 11 12];
6 / 22
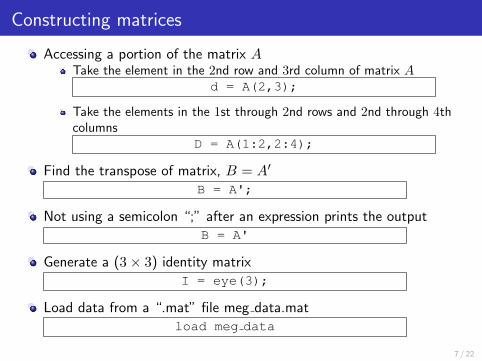
Constructing matrices
Accessing a portion of the matrix ATake the element in the 2nd row and 3rd column of matrix A
d = A(2,3);
Take the elements in the 1st through 2nd rows and 2nd through 4thcolumns
D = A(1:2,2:4);
Find the transpose of matrix, B = A′
B = A';
Not using a semicolon “;” after an expression prints the outputB = A'
Generate a (3× 3) identity matrixI = eye(3);
Load data from a “.mat” file meg data.matload meg data
7 / 22
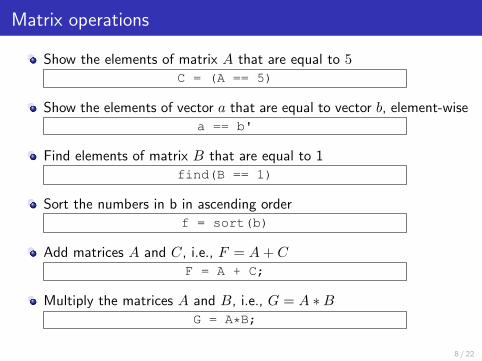
Matrix operations
Show the elements of matrix A that are equal to 5C = (A == 5)
Show the elements of vector a that are equal to vector b, element-wisea == b'
Find elements of matrix B that are equal to 1find(B == 1)
Sort the numbers in b in ascending orderf = sort(b)
Add matrices A and C, i.e., F = A+ CF = A + C;
Multiply the matrices A and B, i.e., G = A ∗BG = A*B;
8 / 22
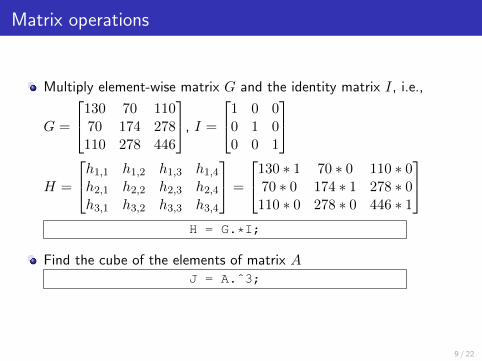
Matrix operations
Multiply
G =
element-wise matrix G and the identity matrix I, i.e.,
130 70 110 1 0 0 70 174 278
, I =
0 1 0110 278 446 0 0 1
h 1 h 1, 1,2 h1,3 h1,4 130
∗ 1 70 ∗ 0 110 ∗ 0
H = h2,1 h2,2 h2,3 h2,4 = 70 ∗ 0 174 ∗ 1 278 ∗ 0h3,1 h3,2 h3,3 h3,4
110 ∗ 0 278 ∗ 0 446 ∗ 1
H = G.*I;
Find the cube of the elements of matrix AJ = A.ˆ3;
9 / 22
Loops
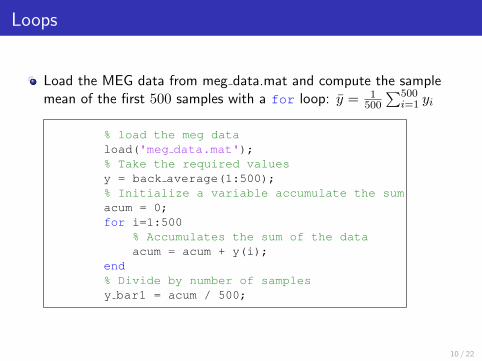
Load the MEG data from meg data.mat and compute the samplemean of the first 500 samples with a for loop: y = 1 500
500
∑i=1 yi
% load the meg dataload('meg data.mat');% Take the required valuesy = back average(1:500);% Initialize a variable accumulate the sumacum = 0;for i=1:500
% Accumulates the sum of the dataacum = acum + y(i);
end% Divide by number of samplesy bar1 = acum / 500;
10 / 22
Loops
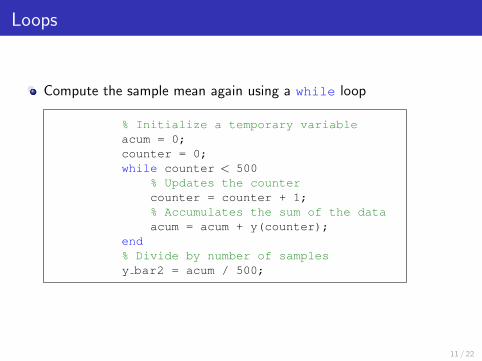
Compute the sample mean again using a while loop
% Initialize a temporary variableacum = 0;counter = 0;while counter < 500
% Updates the countercounter = counter + 1;% Accumulates the sum of the dataacum = acum + y(counter);
end% Divide by number of samplesy bar2 = acum / 500;
11 / 22
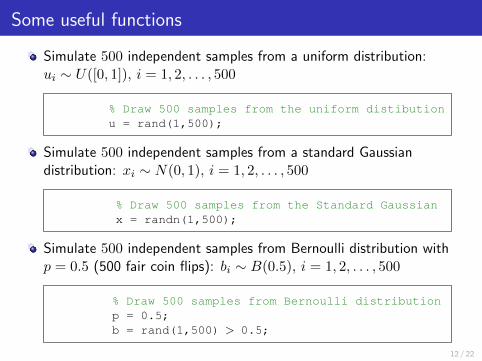
Some useful functions
Simulate 500 independent samples from a uniform distribution:ui ∼ U([0, 1]), i = 1, 2, . . . , 500
% Draw 500 samples from the uniform distibutionu = rand(1,500);
Simulate 500 independent samples from a standard Gaussiandistribution: xi ∼ N(0, 1), i = 1, 2, . . . , 500
% Draw 500 samples from the Standard Gaussianx = randn(1,500);
Simulate 500 independent samples from Bernoulli distribution withp = 0.5 (500 fair coin flips): bi ∼ B(0.5), i = 1, 2, . . . , 500
% Draw 500 samples from Bernoulli distributionp = 0.5;b = rand(1,500) > 0.5;
12 / 22
Some useful functions
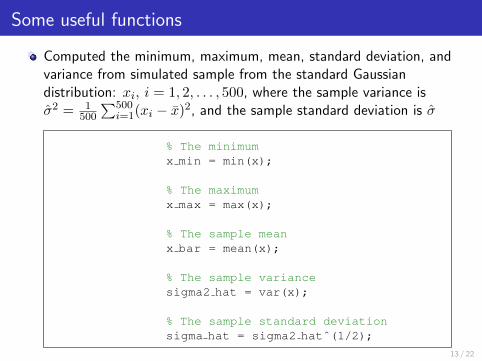
Computed the minimum, maximum, mean, standard deviation, andvariance from simulated sample from the standard Gaussiandistribution: xi, i = 1, 2, . . . , 500, where the sample variance isσ2 = 1 500
500
∑i=1(xi − x)2, and the sample standard deviation is σ
% The minimumx min = min(x);
% The maximumx max = max(x);
% The sample meanx bar = mean(x);
% The sample variancesigma2 hat = var(x);
% The sample standard deviationsigma hat = sigma2 hatˆ(1/2);
13 / 22
Functions for displaying results
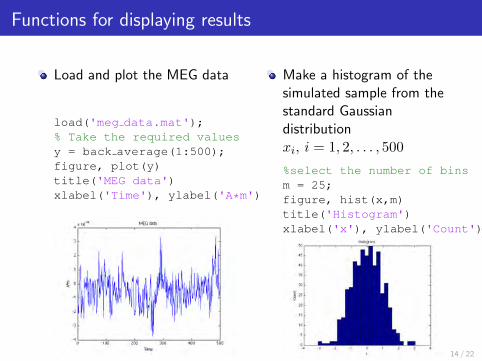
Load and plot the MEG data
load('meg data.mat');% Take the required valuesy = back average(1:500);figure, plot(y)title('MEG data')xlabel('Time'), ylabel('A*m')
Make a histogram of thesimulated sample from thestandard Gaussiandistributionxi, i = 1, 2, . . . , 500
%select the number of binsm = 25;figure, hist(x,m)title('Histogram')xlabel('x'), ylabel('Count')
14 / 22
Translating a problem to an algorithm to a code
Simulate 500 independent samples from the exponential distributionwith a “fair” coin
With the “fair” coin we can obtain a samples from the Bernoullidistribution with parameter p = 0.5. Recall that the pdf of theBernoulli is given by:fber(b) = pb(1− p)(1−b), where b ∈ {0, 1}Recall that if ti ∼ Exp(λ), i = 1, 2, . . . , 500, then its pdf is given by:fexp(t) = λe−λt, where t > 0
Wow! This sound impossible!
It is possible if we could generate a sample from the uniformdistribution using a coin
And from the uniform sample simulate a new sample of theexponential distribution using the Inverse Transform method!
Find an algorithmWrite the code
15 / 22
From the problem to an algorithm
To find the algorithm we should note that a number u between 0 and1 can be represented with the binary expansion 0.b1b2b3 . . ., i.e:
∞
u =∑
bi/2i,where bi
i=1
∈ {0, 1}
For example:
If u = 0.75 then b1 = 1, b2 = 1, bj = 0, j = 3, 4, . . ., sinceu = 1/2 + 1/22 + 0/23 + · · ·If u = 0.958 then 0.b1b2b3 . . . = 0.11110101010If u = 0.3288 then 0.b1b2b3 . . . = 0.010101000010100100100
16 / 22
From the problem to an algorithm
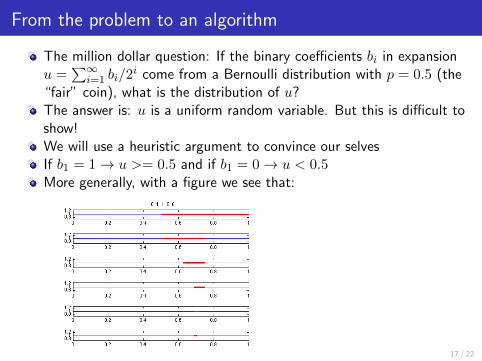
The million dollar question: If the binary coefficients bi in expansionu =
∑∞i=1 bi/2
i come from a Bernoulli distribution with p = 0.5 (the“fair” coin), what is the distribution of u?The answer is: u is a uniform random variable. But this is difficult toshow!We will use a heuristic argument to convince our selvesIf b1 = 1→ u >= 0.5 and if b1 = 0→ u < 0.5More generally, with a figure we see that:
17 / 22
From the algorithm to the code
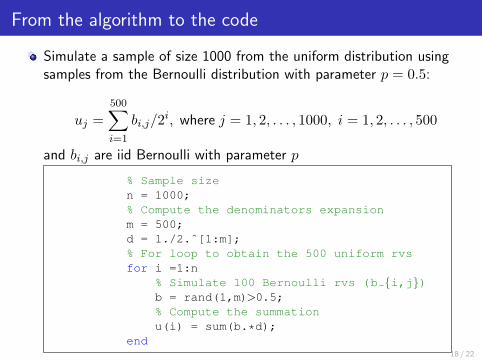
Simulate a sample of size 1000 from the uniform distribution usingsamples from the Bernoulli distribution with parameter p = 0.5:
500
u ij =
∑bi,j/2 , where j = 1, 2, . . . , 1000, i = 1, 2, . . . , 500
i=1
and bi,j are iid Bernoulli with parameter p
% Sample sizen = 1000;% Compute the denominators expansionm = 500;d = 1./2.ˆ[1:m];% For loop to obtain the 500 uniform rvsfor i =1:n
% Simulate 100 Bernoulli rvs (b {i,j})b = rand(1,m)>0.5;% Compute the summationu(i) = sum(b.*d);
end18 / 22
From the algorithm to the code
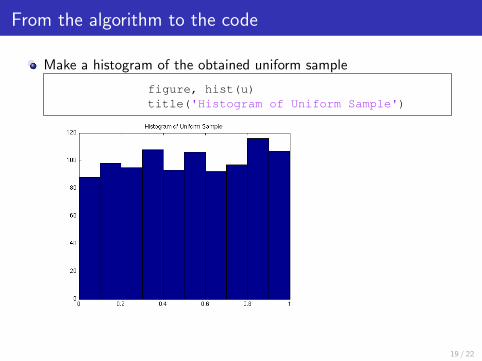
Make a histogram of the obtained uniform sample
figure, hist(u)title('Histogram of Uniform Sample')
19 / 22
From the problem to an algorithm
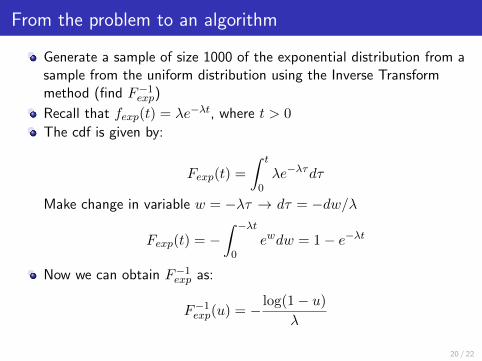
Generate a sample of size 1000 of the exponential distribution from asample from the uniform distribution using the Inverse Transformmethod (find F−1exp)
Recall that fexp(t) = λe−λt, where t > 0
The cdf is given by:
Fexp(t) =
∫ t
λe−λτdτ0
Make change in variable w = −λτ → dτ = −dw/λ
Fexp(t) = −∫ −λt
ewdw = 10
− e−λt
Now we can obtain F−1exp as:
F−1log(1
exp(u) =− u)−λ
20 / 22
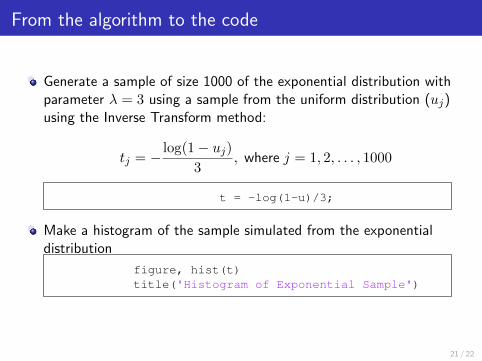
From the algorithm to the code
Generate a sample of size 1000 of the exponential distribution withparameter λ = 3 using a sample from the uniform distribution (uj)using the Inverse Transform method:
log(1 )tj =
− u− j, where j = 1, 2, . . . , 1000
3
t = -log(1-u)/3;
Make a histogram of the sample simulated from the exponentialdistribution
figure, hist(t)title('Histogram of Exponential Sample')
21 / 22
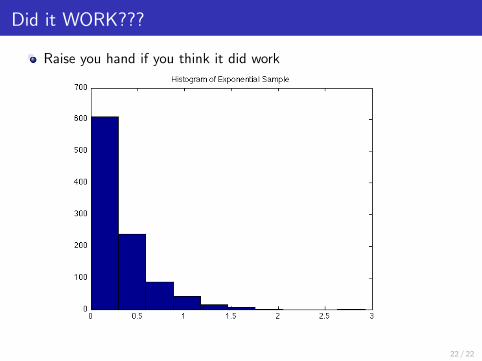
Did it WORK???
Raise you hand if you think it did work
22 / 22
MIT OpenCourseWarehttps://ocw.mit.edu
9.07 Statistics for Brain and Cognitive ScienceFall 2016
For information about citing these materials or our Terms of Use, visit: https://ocw.mit.edu/terms.