Embed Size (px)
Citation preview

Feb 2005 Iowa Pork Regional Conferences 1
1Your Investment. Your Future.
Optimal Selling Strategies &Comparing Packer Matrices
Steve R. Meyer, Ph.D.PresidentParagon Economics, Inc.
2005 IPPA-IPIC Regional Meetings
2Your Investment. Your Future.
University of Missouri, Iowa State University, Pork magazine, Pig Improvement Company, National Pork Board, Monsanto Choice Genetics, and Land O’ Lakes.
Percent of Hogs Sold on Carcass Merit Basis
6070 71
77
88
76
63
80 80 77
97 99
81
9385 89
95 98
0102030405060708090
100
1-3 3-5 5-10 10-50 50-500 500+Firm Size by Head Marketed
Percent
199720002003
3Your Investment. Your Future.
University of Missouri, Iowa State University, Pork magazine, Pig Improvement Company, National Pork Board, Monsanto Choice Genetics, and Land O’ Lakes.
2932123Own packing plant
05713161213Group contract
76825564Negotiated contract
6
70%
3-5
4
77%
1-3
Firm Size (thousand head mktd.)
5
66%
5-10
5
55%
10-50
04Other
33%13%Load by load
500+50-500
How Firms Marketed Slaughter Hogs, 2003(percent of firms in size category)
4Your Investment. Your Future.
University of Missouri, Iowa State University, Pork magazine, Pig Improvement Company, National Pork Board, Monsanto Choice Genetics, and Land O’ Lakes.
41653Window - no ledger
4857Formula - meat prices
1956Formula - feed/ledger
6554Formula - feed/no ledger21Window - ledger
68393732Formula - hog prices
29118Contract - futures market
3-51-3
Firm Size (thousand head mktd.)
7
29%
5-10
5
26%
10-50
2Other
15%11%Spot market - negotiated
500+50-500
Percent of Hogs Sold under Marketing Contracts(average of percentages reported by size category)
5Your Investment. Your Future.
Marketing – More than pricing!Business schools talk about the 4 (or 5) P’s of Marketing– Product– Place– Price– Promotion– Positioning – the 5th P; added in the ’70s
Surprisingly, all have a place in live hog marketing!
6Your Investment. Your Future.
Product – What kind of hogs do you have?
Carcass yield – a factor only if you sell on a live weight basisLean muscle yield – BIG factor in the ’80s and ’90s; still a big determinant of net priceLean muscle quality –growing importance but difficult to measure and quantifyBreed – two aspects– Manifestation of muscle quality– Consumer perception – Black hog meat
Rearing method

Feb 2005 Iowa Pork Regional Conferences 2
7Your Investment. Your Future.
Product – What are you selling?Hogs are a PRODUCTION INPUT to the meat production process– Intermediate good– Today’s differentiated product is tomorrow’s
commodity– Very competitive
Value is strictly a function of the value of the outputs – meat, by-products– Anything that causes less efficient processing
detracts from value!8
Your Investment. Your Future.
PlaceGeographical location impacts transportation costs, trim loss, death loss, etc .A partial determinant of your market options for type and quality– Few options: Can affect local price– Not a factor in Iowa
9Your Investment. Your Future.
University of Missouri, Iowa State University, Pork magazine, Pig Improvement Company, National Pork Board, Monsanto Choice Genetics, and Land O’ Lakes.
2461714169150-199 mi.
46109105200-299 mi.
877643300 mi. or more
441126201917100-149 mi.
20662131222450-99 mi.
29%
3-5
42%
1-3
Firm Size (thousand head mktd.)
21%
5-10
18%
10-50
04%Less than 50 mi.
500+50-500
Distance Hogs Are Hauled for Slaughter(percent of firms responding in size category)
10Your Investment. Your Future.
Place – Extend the concept to Time . . Geographical location impacts transportation costs, trim loss, death loss, etc .A partial determinant of you market options for type and qualityTIME can differentiate your product as well– Possibly limited by production system/facilities– Time interacts with several factors to determine
optimal marketing weight:» Feed costs» Facilities costs» Other constraints
11Your Investment. Your Future.
University of Missouri, Iowa State University, Pork magazine, Pig Improvement Company, National Pork Board, Monsanto Choice Genetics, and Land O’ Lakes.
194133415463Market at desired weight
171432323127Somewhat flexible
15%
3-5
10%
1-3
Firm Size (thousand head mktd.)
26%
5-10
35%
10-50
61%45%Tight schedule
500+50-500
Flexibility in Marketing Dates(percent of firms responding in size category)
12Your Investment. Your Future.
One choice variable is the day of the week . .
Avg. Price*
$/cwt. Percent $/cwt $/hd.**
Monday $56.72 0.026% $0.015 $0.03
Tuesday $56.73 0.052% $0.030 $0.06
Wednesday $56.62 -0.152% ($0.086) -$0.17
Thursday $56.87 0.294% $0.167 $0.33
Friday $56.58 -0.221% ($0.125) -$0.25
Average $56.70*Iowa-Minnesota Prior Day Purchase, Wtd. Average Negotiated Price.**Assumes carcass weight of 196 pounds.
Difference from Average
Day of Week Differences, May 2001-January 2005
Feb 2005 Iowa Pork Regional Conferences 3
13Your Investment. Your Future.
Price – Consider a retailer’s pricing decision:
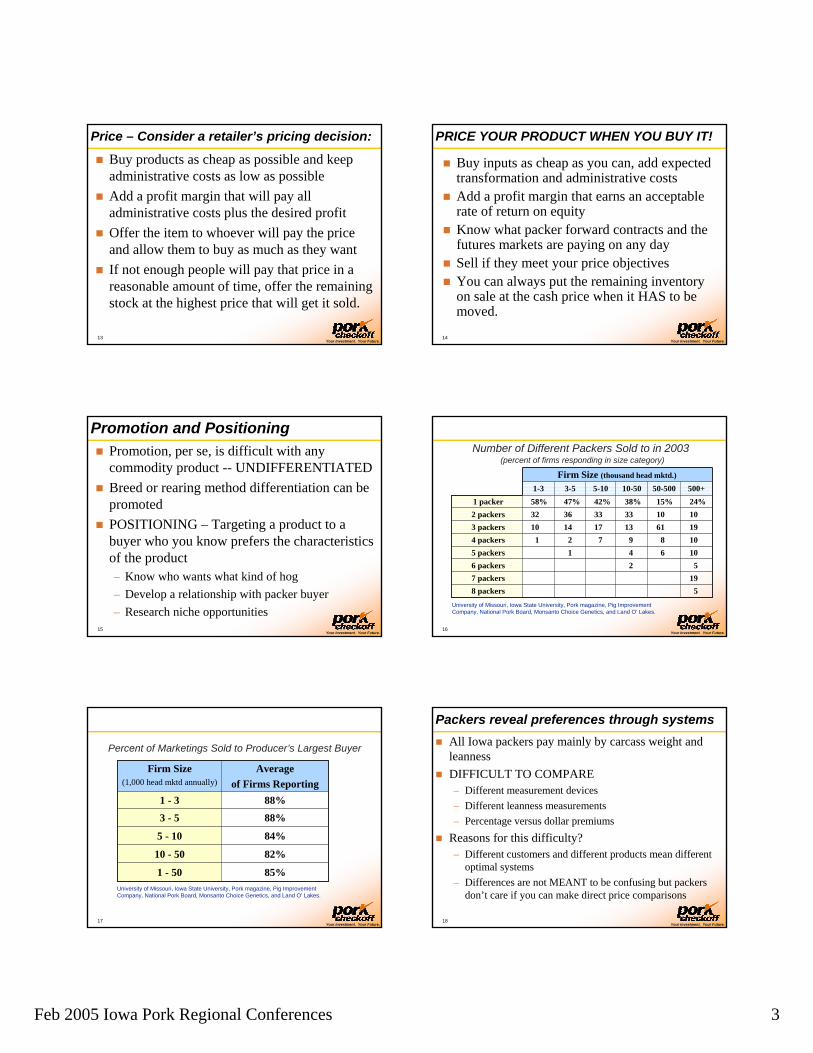
Buy products as cheap as possible and keep administrative costs as low as possibleAdd a profit margin that will pay all administrative costs plus the desired profitOffer the item to whoever will pay the price and allow them to buy as much as they wantIf not enough people will pay that price in a reasonable amount of time, offer the remaining stock at the highest price that will get it sold.
14Your Investment. Your Future.
PRICE YOUR PRODUCT WHEN YOU BUY IT!
Buy inputs as cheap as you can, add expected transformation and administrative costsAdd a profit margin that earns an acceptable rate of return on equityKnow what packer forward contracts and the futures markets are paying on any daySell if they meet your price objectivesYou can always put the remaining inventory on sale at the cash price when it HAS to be moved.
15Your Investment. Your Future.
Promotion and PositioningPromotion, per se, is difficult with any commodity product -- UNDIFFERENTIATEDBreed or rearing method differentiation can be promotedPOSITIONING – Targeting a product to a buyer who you know prefers the characteristics of the product – Know who wants what kind of hog– Develop a relationship with packer buyer– Research niche opportunities
16Your Investment. Your Future.
University of Missouri, Iowa State University, Pork magazine, Pig Improvement Company, National Pork Board, Monsanto Choice Genetics, and Land O’ Lakes.
10897214 packers106415 packers
526 packers197 packers
1961131714103 packers1010333336322 packers
47%3-5
58%1-3
Firm Size (thousand head mktd.)
42%5-10
38%10-50
58 packers
24%15%1 packer 500+50-500
Number of Different Packers Sold to in 2003(percent of firms responding in size category)
17Your Investment. Your Future.
University of Missouri, Iowa State University, Pork magazine, Pig Improvement Company, National Pork Board, Monsanto Choice Genetics, and Land O’ Lakes.
Percent of Marketings Sold to Producer’s Largest Buyer
85%1 - 50
82%10 - 50
84%5 - 10
88%3 - 5
88%1 - 3
Averageof Firms Reporting
Firm Size(1,000 head mktd annually)
18Your Investment. Your Future.
Packers reveal preferences through systemsAll Iowa packers pay mainly by carcass weight and leannessDIFFICULT TO COMPARE– Different measurement devices– Different leanness measurements– Percentage versus dollar premiums
Reasons for this difficulty?– Different customers and different products mean different
optimal systems– Differences are not MEANT to be confusing but packers
don’t care if you can make direct price comparisons

Feb 2005 Iowa Pork Regional Conferences 1
1Your Investment. Your Future.
Tyson Grid – 2 parts to itLeanness Premiums/Discounts– 15 weight and 14 leanness categories – heaviest 3
leanness categories are the same– Largest discount is $8/cwt carc. for <44.9% and >219#– Largest premium is $10/cwt carcass for >55% and
>256# Carcass Weight Discounts– 19 weight categories (note the difference)– The “round” numbers on the page are LIVE weight –
smaller than the carcass discounts which are the ones actually used.
2Your Investment. Your Future.
Tyson – Combine the two and get 19 x 12
WeightEst Live Hot Casc <45 45-45.9 46-46.9 47-47.9 48-48.9 49-49.9 50-50.9 51-51.9 52-52.9 53-53.9 54-54.9 55 & up181-190 133-139 (19.75)$ (19.75)$ (18.25)$ (16.25)$ (15.25)$ (14.25)$ (13.25)$ (12.25)$ (11.25)$ (9.75)$ (9.25)$ (9.25)$ 191-200 140-146 (15.56)$ (15.56)$ (14.06)$ (12.06)$ (11.06)$ (10.06)$ (9.06)$ (8.06)$ (7.06)$ (5.56)$ (5.06)$ (5.06)$ 201-210 147-155 (12.91)$ (12.91)$ (11.41)$ (9.41)$ (8.41)$ (7.41)$ (6.41)$ (5.41)$ (4.41)$ (2.91)$ (2.41)$ (2.41)$ 211-220 156-163 (10.87)$ (10.87)$ (9.37)$ (7.37)$ (6.37)$ (5.37)$ (4.37)$ (3.37)$ (2.37)$ (0.87)$ 0.63$ 1.63$ 220-230 164-171 (8.17)$ (8.17)$ (6.67)$ (4.67)$ (3.67)$ (2.67)$ (0.67)$ (0.67)$ 1.83$ 3.33$ 4.33$ 4.83$ 231-240 172-178 (7.50)$ (7.50)$ (6.00)$ (4.00)$ (3.00)$ (2.00)$ -$ -$ 2.50$ 4.00$ 5.00$ 5.50$ 241-250 179-186 (7.50)$ (7.50)$ (6.00)$ (4.00)$ (3.00)$ (2.00)$ -$ -$ 2.50$ 4.00$ 5.50$ 6.50$ 251-260 187-194 (7.50)$ (7.50)$ (6.00)$ (4.00)$ (3.00)$ (1.00)$ -$ -$ 2.50$ 4.00$ 5.50$ 7.50$ 261-270 195-202 (7.50)$ (7.50)$ (6.00)$ (4.00)$ (3.00)$ (1.00)$ -$ -$ 2.50$ 5.00$ 6.50$ 7.50$ 271-280 203-209 (7.50)$ (7.50)$ (6.00)$ (4.00)$ (3.00)$ (1.00)$ -$ -$ 3.50$ 5.50$ 7.50$ 7.50$ 281-290 210-218 (8.17)$ (8.17)$ (6.67)$ (4.67)$ (3.67)$ (1.67)$ (0.67)$ (0.67)$ 2.83$ 4.83$ 6.83$ 6.83$ 291-300 219-225 (9.33)$ (8.83)$ (7.33)$ (5.33)$ (4.33)$ (2.33)$ (0.33)$ 0.67$ 2.17$ 4.17$ 6.67$ 7.17$ 301-310 226-233 (10.67)$ (10.17)$ (8.67)$ (6.67)$ (5.67)$ (3.67)$ (1.67)$ (0.67)$ 0.83$ 2.83$ 5.33$ 5.83$ 311-320 234-240 (12.67)$ (12.17)$ (10.67)$ (8.67)$ (7.67)$ (5.67)$ (3.67)$ (2.67)$ (1.17)$ 0.83$ 3.33$ 3.83$ 321-330 241-248 (14.67)$ (14.17)$ (12.67)$ (10.67)$ (9.67)$ (7.67)$ (5.67)$ (4.17)$ (2.67)$ (0.67)$ 1.33$ 1.83$ 331-340 249-255 (16.00)$ (15.50)$ (14.00)$ (12.00)$ (11.00)$ (9.00)$ (7.00)$ (5.50)$ (4.00)$ (2.00)$ -$ 0.50$ 341-350 256-263 (17.33)$ (16.83)$ (15.33)$ (13.33)$ (12.33)$ (10.33)$ (8.33)$ (6.83)$ (5.33)$ (3.33)$ (1.33)$ 0.67$ 351-360 264-271 (18.63)$ (18.13)$ (16.63)$ (14.63)$ (13.63)$ (11.63)$ (9.63)$ (8.13)$ (6.63)$ (4.63)$ (2.63)$ (0.63)$ 361-up 272-up (19.96)$ (19.46)$ (17.96)$ (15.96)$ (14.96)$ (12.96)$ (10.96)$ (9.46)$ (7.96)$ (5.96)$ (3.96)$ (1.96)$
Animal Ultsasound Sesvices (AUS) % Lean

Feb 2005 Iowa Pork Regional Conferences 2
3Your Investment. Your Future.
Hormel Grid – 14 x 6Grade/Last Rib BF, in
1- 1 2 3 4 5 6Est'd LW CW <.51 .51-.70 .71-.90 .91-1.10 1.11-1.30 1.31-1.50 1.51 & Up<213 <160 61% 64% 64% 61% 60% 48% 35%213-223 160-166 83% 89% 89% 83% 75% 63% 50%224-232 167-173 91% 98% 96% 91% 83% 71% 58%233-241 174-180 101% 104% 104% 101% 95% 83% 70%242-251 181-187 103% 108% 108% 103% 97% 83% 70%252-260 188-194 103% 108% 108% 103% 97% 83% 70%261-269 195-201 103% 108% 108% 103% 97% 83% 70%271-278 202-208 103% 108% 108% 103% 97% 83% 70%279-288 209-215 103% 108% 108% 103% 97% 83% 70%289-297 216-222 102% 105% 105% 101% 97% 83% 70%298-307 223-229 100% 100% 100% 100% 95% 81% 68%308-316 230-236 86% 89% 89% 86% 80% 66% 53%317-325 237-243 80% 83% 83% 80% 74% 60% 47%326 & over244 & over 74% 77% 77% 74% 68% 54% 41%
Apr-03Red Box Quarterly Premiums:>80.0% & < 85.0 $1.00/pig>85.0% & <90.0% $1.50/pig>90.0% $2.00/pig
4Your Investment. Your Future.
Excel Grid – 17 x 24
Excel Lean Value Matrix<40 41 42 43 44 45 46 47 48 49 50 51 52 53 54 55 56 57 58 59 60 61 62 63>
Under 155 67 68 69 70 71 72 73 74 75 76 76 77 78 79 80 81 82 83 82 81 80 79 78 77155-162 82 83 84 85 86 87 88 89 90 91 91 92 93 94 95 96 97 98 97 96 95 94 93 92163-169 84 85 86 87 88 89 90 91 92 93 93 94 95 96 97 98 99 100 99 98 97 96 95 94170-176 86 87 88 89 90 91 92 93 94 95 96 97 98 99 100 101 102 103 102 101 100 99 98 97177-184 88 89 90 91 92 93 94 95 96 97 98 99 100 101 102 103 104 105 104 103 102 101 100 99185-191 90 91 92 93 94 95 96 97 98 99 99 100 101 102 103 104 105 106 105 104 103 102 101 100192-198 90 91 92 93 94 95 96 97 98 99 100 101 102 103 104 105 106 107 106 105 104 103 102 101199-206 90 91 92 93 94 95 96 97 98 99 101 102 103 104 105 106 107 108 107 106 105 104 103 102207-213 90 91 92 93 94 95 96 98 99 101 103 104 105 106 107 108 109 109 108 107 106 105 104 103214-221 90 91 92 93 94 95 96 98 99 101 103 104 105 106 107 108 109 109 108 107 106 105 104 103222-228 89 90 91 92 93 94 95 97 98 99 101 102 103 104 105 106 107 107 106 105 104 103 102 101229-235 88 89 90 91 92 93 94 96 97 99 99 100 101 102 103 104 105 106 105 104 103 102 101 100236-242 88 89 90 91 92 93 94 95 96 97 97 98 99 100 101 102 103 104 103 102 101 100 99 98243-249 86 87 88 89 90 91 92 93 91 95 95 96 97 98 99 100 101 102 101 100 99 98 97 96250-256 85 86 87 88 89 90 91 92 93 94 94 95 96 97 98 99 99 99 99 98 97 96 95 94257-263 82 83 84 85 86 87 88 89 96 91 91 92 93 94 95 96 97 98 97 96 95 94 93 92264 & Over 67 68 69 70 71 72 73 74 75 76 76 77 78 79 80 81 82 83 82 81 80 79 78 77
Effective March 1, 2004

Feb 2005 Iowa Pork Regional Conferences 3
5Your Investment. Your Future.
Farmland Grid – 15 x 10
Fat-O-Meater % Lean58.9 56.9 54.9 52.9 50.9 48.9 46.9 44.9
> 58.9 - 57.0 - 55.0 - 53.0 - 51.0 - 49.0 - 47.0 - 45.0 - 43.0 <42.9 P / DUnder 141 ($13.50) ($13.50) ($13.50) ($13.50) ($13.50) ($13.50) ($16.00) ($18.50) ($22.50) ($23.50) ($13.50)
141 - 148 ($13.50) ($13.50) ($13.50) ($13.50) ($13.50) ($13.50) ($16.00) ($18.50) ($22.50) ($23.50) ($13.50)149 - 155 ($9.76) ($9.76) ($9.76) ($9.76) ($9.76) ($9.76) ($12.26) ($14.76) ($18.76) ($19.76) ($9.76)156 - 163 ($6.00) ($6.00) ($6.00) ($6.00) ($6.00) ($6.00) ($8.50) ($11.00) ($15.00) ($16.00) ($6.00)164 - 169 $3.74 $3.74 $2.74 $1.49 $0.24 ($1.26) ($3.76) ($6.26) ($10.26) ($11.26) ($1.26)170 - 177 $5.00 $5.00 $4.00 $2.75 $1.50 $0.00 ($2.50) ($5.00) ($9.00) ($10.00) $0.00178 - 185 $5.00 $5.00 $4.00 $2.75 $1.50 $0.00 ($2.50) ($5.00) ($9.00) ($10.00) $0.00186 - 192 $5.00 $5.00 $4.00 $2.75 $1.50 $0.00 ($2.50) ($5.00) ($9.00) ($10.00) $0.00193 - 200 $5.00 $5.00 $4.00 $2.75 $1.50 $0.00 ($2.50) ($5.00) ($9.00) ($10.00) $0.00201 - 207 $5.00 $5.00 $4.00 $2.75 $1.50 $0.00 ($2.50) ($5.00) ($9.00) ($10.00) $0.00208 - 214 $5.00 $5.00 $4.00 $2.75 $1.50 $0.00 ($2.50) ($5.00) ($9.00) ($10.00) $0.00215 - 222 $2.00 $2.00 $1.00 ($0.25) ($1.50) ($3.00) ($5.50) ($8.00) ($12.00) ($13.00) ($3.00)223 - 229 ($0.26) ($0.26) ($1.26) ($2.51) ($3.76) ($5.26) ($7.76) ($10.26) ($14.26) ($15.26) ($5.26)230 - 237 ($10.00) ($10.00) ($10.00) ($10.00) ($10.00) ($10.00) ($12.50) ($15.00) ($19.00) ($20.00) ($10.00)
Over 237 ($14.76) ($14.76) ($14.76) ($14.76) ($14.76) ($14.76) ($17.26) ($19.76) ($23.76) ($24.76) ($14.76)P / D $5.00 $5.00 $4.00 $2.75 $1.50 $0.00 ($2.50) ($5.00) ($9.00) ($10.00)
Hot Carcass Weight (lb)
6Your Investment. Your Future.
Morrell Grid – 10 x 13
Est'd Live Carc. 57+ 55-56 54 53 52 51 50 49 48 47 46 44-45 <43
181-200 134-148 ($9.99) ($9.99) ($9.99) ($9.99) ($9.99) ($9.99) ($9.99) ($10.99) ($11.99) ($12.99) ($13.99) ($15.99) ($19.99)
201-210 149-155 ($7.22) ($7.22) ($7.22) ($7.22) ($7.22) ($7.22) ($7.22) ($8.22) ($9.22) ($10.22) ($11.22) ($13.22) ($17.22)
211-220 156-163 ($1.94) ($2.44) ($2.81) ($3.07) ($3.44) ($3.69) ($4.44) ($5.44) ($6.44) ($7.44) ($8.44) ($10.44) ($14.44)
221-230 164-170 $4.07 $3.07 $2.32 $1.82 $1.07 $0.57 ($0.93) ($1.93) ($2.93) ($3.93) ($4.93) ($6.93) ($10.93)
231-240 171-178 $5.00 $4.00 $3.25 $2.75 $2.00 $1.50 $- ($1.00) ($2.00) ($3.00) ($4.00) ($6.00) ($10.00)
241-250 179-185 $5.00 $4.00 $3.25 $2.75 $2.00 $1.50 $- ($1.00) ($2.00) ($3.00) ($4.00) ($6.00) ($10.00)
251-260 186-193 $5.00 $4.00 $3.25 $2.75 $2.00 $1.50 $- ($1.00) ($2.00) ($3.00) ($4.00) ($6.00) ($10.00)
261-270 194-200 $5.00 $4.00 $3.25 $2.75 $2.00 $1.50 $- ($1.00) ($2.00) ($3.00) ($4.00) ($6.00) ($10.00)
271-280 201-207 $5.00 $4.00 $3.25 $2.75 $2.00 $1.50 $- ($1.00) ($2.00) ($3.00) ($4.00) ($6.00) ($10.00)
281-290 208-215 $2.50 $2.00 $1.63 $1.37 $1.00 $0.75 $- ($1.00) ($2.00) ($3.00) ($4.00) ($6.00) ($10.00)
291-300 216-222 $0.28 ($0.22) ($0.55) ($0.85) ($1.22) ($1.47) ($2.22) ($3.22) ($4.22) ($5.22) ($6.22) ($8.22) ($12.22)
301-310 223-229 ($1.39) ($1.89) ($2.22) ($2.52) ($2.89) ($3.14) ($3.89) ($4.89) ($5.89) ($6.89) ($7.89) ($9.89) ($13.89)
311-320 230-237 ($4.90) ($5.40) ($5.73) ($5.73) ($6.40) ($6.65) ($7.40) ($8.40) ($9.40) ($10.40) ($11.40) ($13.40) ($17.40)
321-350 238-259 ($8.42) ($8.92) ($9.25) ($9.55) ($9.92) ($10.17) ($10.92) ($11.92) ($12.92) ($13.92) ($14.92) ($16.92) ($20.92)
Fat-O-Meter % LeanWeight
Shaded rows are the same

Feb 2005 Iowa Pork Regional Conferences 4
7Your Investment. Your Future.
Sioux-Preme Grid – As provided
Est'd Live Wt. 180-196 197-216 217-231 232-263 264-292 293-311Carc Wt. 133-145 146-160 161-171 172-195 196-216 217-230Wt Range in Column 12.9 13.9 10 22.9 19.9 12.9% LEAN60-60.9 88% 93% 101% 105% 105% 100%59-59.9 88% 93% 101% 105% 105% 100%58-58.9 88% 94% 101% 106% 106% 97%57-57.9 88% 94% 101% 106% 106% 97%56-56.9 88% 93% 101% 105% 105% 97%55-55.9 88% 93% 101% 105% 105% 96%54-54.9 88% 92% 101% 103% 103% 96%53-53.9 88% 92% 101% 103% 103% 96%52-52.9 88% 91% 101% 102% 102% 94%51-51.9 88% 91% 100% 102% 102% 94%50-50.9 88% 90% 99% 100% 100% 94%49-49.9 88% 90% 99% 100% 100% 94%48-48.9 88% 90% 98% 98% 98% 92%47-47.9 88% 90% 97% 97% 97% 92%46-46.9 88% 90% 96% 96% 96% 92%45-45.9 88% 90% 95% 95% 95% 90%44-44.9 88% 90% 94% 94% 94% 90%43-43.9 88% 90% 93% 93% 93% 90%42-42.9 88% 90% 92% 92% 92% 90%41-41.9 88% 90% 91% 91% 91% 90%40-40.9 88% 90% 90% 90% 90% 90%
8Your Investment. Your Future.
Sioux-Preme Grid – Reformatted (6 x 15)
Est'd Live Wt.
Carc. Wt.
59 & Over
58-58.9
57-57.9
56-56.9
55-55.9
53-54.9
52-52.9
51-51.9
49-50.9
48-48.9
47-47.9
46-46.9
45-45.9
44-44.9
43-43.9
42-42.9
41-41.9
40-40.9
180-196 133-145 88% 88% 88% 88% 88% 88% 88% 88% 88% 88% 88% 88% 88% 88% 88% 88% 88% 88%197-216 146-160 93% 94% 94% 93% 93% 92% 91% 91% 90% 90% 90% 90% 90% 90% 90% 90% 90% 90%217-231 161-171 101% 101% 101% 101% 101% 101% 101% 100% 99% 98% 97% 96% 95% 94% 93% 92% 91% 90%232-246 172-182 105% 106% 106% 105% 105% 103% 102% 102% 100% 98% 97% 96% 95% 94% 93% 92% 91% 90%247-261 183-193 105% 106% 106% 105% 105% 103% 102% 102% 100% 98% 97% 96% 95% 94% 93% 92% 91% 90%262-277 194-204 105% 106% 106% 105% 105% 103% 102% 102% 100% 98% 97% 96% 95% 94% 93% 92% 91% 90%278-292 205-216 105% 106% 106% 105% 105% 103% 102% 102% 100% 98% 97% 96% 95% 94% 93% 92% 91% 90%293-311 217-230 100% 97% 97% 97% 96% 96% 94% 94% 94% 92% 92% 92% 90% 90% 90% 90% 90% 90%312-472 231-350 85% 85% 85% 85% 85% 85% 85% 85% 85% 85% 85% 85% 85% 85% 85% 85% 85% 85%
Percent Lean
Shaded rows are the same
Shaded columns represent the combination of two rows that are the same in the original
Feb 2005 Iowa Pork Regional Conferences 5
9Your Investment. Your Future.
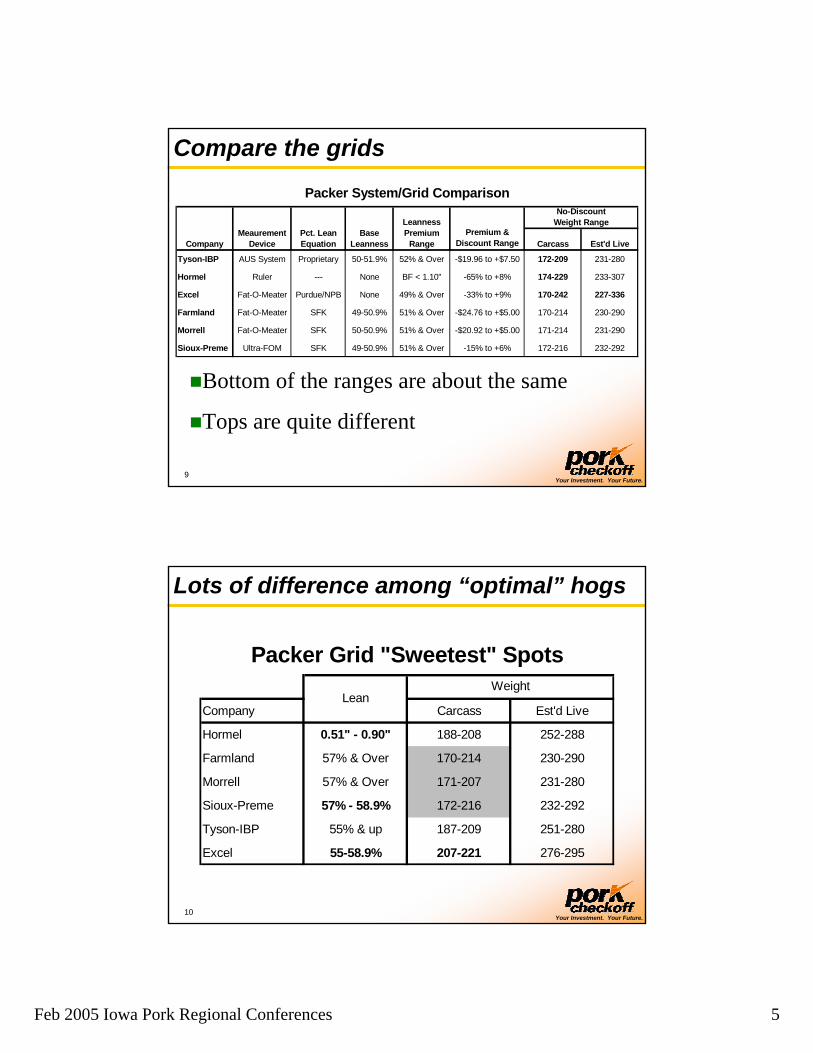
Compare the grids
Premium & Discount Range Carcass Est'd Live
Tyson-IBP AUS System Proprietary 50-51.9% 52% & Over -$19.96 to +$7.50 172-209 231-280
Hormel Ruler --- None BF < 1.10" -65% to +8% 174-229 233-307
Excel Fat-O-Meater Purdue/NPB None 49% & Over -33% to +9% 170-242 227-336
Farmland Fat-O-Meater SFK 49-50.9% 51% & Over -$24.76 to +$5.00 170-214 230-290
Morrell Fat-O-Meater SFK 50-50.9% 51% & Over -$20.92 to +$5.00 171-214 231-290
Sioux-Preme Ultra-FOM SFK 49-50.9% 51% & Over -15% to +6% 172-216 232-292
Packer System/Grid ComparisonNo-Discount
Weight Range
CompanyMeaurement
DevicePct. Lean Equation
Base Leanness
Leanness Premium
Range
Bottom of the ranges are about the same
Tops are quite different
10Your Investment. Your Future.
Lots of difference among “optimal” hogs
Company Carcass Est'd Live
Hormel 0.51" - 0.90" 188-208 252-288
Farmland 57% & Over 170-214 230-290
Morrell 57% & Over 171-207 231-280
Sioux-Preme 57% - 58.9% 172-216 232-292
Tyson-IBP 55% & up 187-209 251-280
Excel 55-58.9% 207-221 276-295
Packer Grid "Sweetest" SpotsWeight
Lean
Feb 2005 Iowa Pork Regional Conferences 1
1Your Investment. Your Future.
44 46 48 50 52 54 56 58 60 62139
186
233278
-50-45-40-35-30-25-20-15-10-505
10
$/cwt.
Pct. Lean
Carcass weight
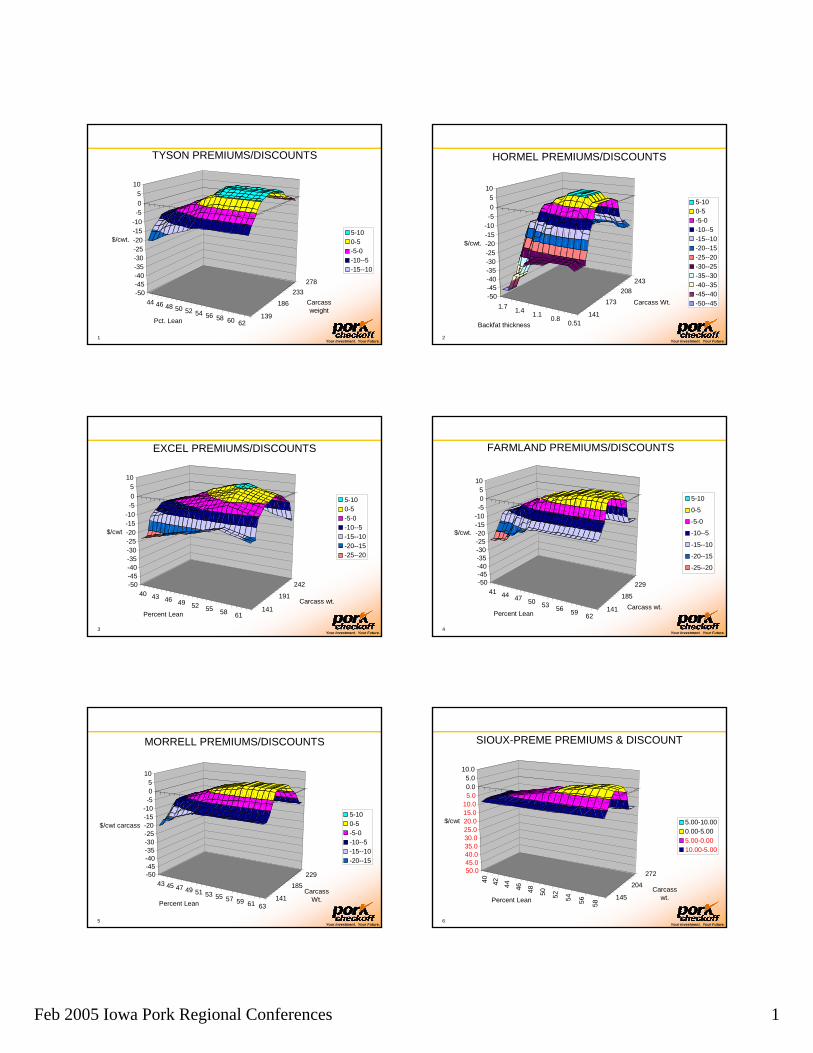
TYSON PREMIUMS/DISCOUNTS
5-100-5-5-0-10--5-15--10
2Your Investment. Your Future.
1.7 1.4 1.1 0.80.51
141
173208
243
-50-45-40-35-30-25-20-15-10-505
10
$/cwt.
Backfat thickness
Carcass Wt.
HORMEL PREMIUMS/DISCOUNTS
5-100-5-5-0-10--5-15--10-20--15-25--20-30--25-35--30-40--35-45--40-50--45
3Your Investment. Your Future.
40 43 46 49 52 55 58 61141
191
242-50-45-40-35-30-25-20-15-10-505
10
$/cwt
Percent Lean
Carcass wt.
EXCEL PREMIUMS/DISCOUNTS
5-100-5-5-0-10--5-15--10-20--15-25--20
4Your Investment. Your Future.
41 44 47 50 53 56 59 62141
185
229-50-45-40-35-30-25-20-15-10-505
10
$/cwt.
Percent LeanCarcass wt.
FARMLAND PREMIUMS/DISCOUNTS
5-10
0-5
-5-0
-10--5
-15--10
-20--15
-25--20
5Your Investment. Your Future.
43 45 47 49 51 53 55 57 59 61 63141
185229-50
-45-40-35-30-25-20-15-10-505
10
$/cwt carcass
Percent Lean
Carcass Wt.
MORRELL PREMIUMS/DISCOUNTS
5-100-5-5-0-10--5-15--10-20--15
6Your Investment. Your Future.
40 42 44 46 48 50 52 54 56 58
145
204
27250.045.040.035.030.025.020.015.010.05.00.05.0
10.0
$/cwt
Percent LeanCarcass
wt.
SIOUX-PREME PREMIUMS & DISCOUNT
5.00-10.000.00-5.005.00-0.0010.00-5.00

Feb 2005 Iowa Pork Regional Conferences 1
1Your Investment. Your Future.
Other IssuesHow can I tell how my hogs will do on a packer’s measurement system?– SELL SOME HOGS TO THEM– Percent lean at Farmland and Morrell should be
very comparable – same machine, same spot, same equation
– Others are NOT linearly correlated – you can’t predict one’s grade from another’s measurments
Know how your hogs perform on one packer’s systemSplit a load to another packer TWICE
2Your Investment. Your Future.
Other key questionsWhat is the plant’s:– Condemnation rate? – Trim loss rate?– Percent of lost carcasses (usually added in at the
average weight and leanness)Does the plant offer premiums for specific delivery times?
3Your Investment. Your Future.
Remember – NET prices pay bills!Do not get bogged down in:– Highest base price – easy to see– Highest premiums – Lake Woebegon syndrome
Highest NET return at weights that are achievable with my system. Function of:– Base price– Premiums/discounts at various weights– Transportation costs– Marginal cost of extra pounds & days (feed,
direct labor & utilities, foregone profits?)4
Your Investment. Your Future.
Wtd. Average base price relationships
NATIONAL PRIOR DAY PURCHASE BASE PRICES
20
30
40
50
60
70
80
A-01 N-01 F-02 M-02 A-02 N-02 F-03 M-03 A-03 N-03 F-04 M-04 A-04 N-04 F-05 M-05
$/cwt. carc.
TotalNegotiatedSwine or Pork Market FormulaOther Market FormulaOther Purchase Agreement

Feb 2005 Iowa Pork Regional Conferences 2
5Your Investment. Your Future.
Wtd. Average NET price relationshipsNATIONAL PRIOR DAY SLAUGHTER
NET PRICES
20
30
40
50
60
70
80
90
A-01 N-01 F-02 M-02 A-02 N-02 F-03 M-03 A-03 N-03 F-04 M-04 A-04 N-04 F-05
$/cwt. carc.
NegotiatedOther Market FormulaSwine or Pork Market FormulaOther Purchase ArrangementTotal
6Your Investment. Your Future.
Future of carcass merit systemsLarger discounts are coming for heavy hogs– Pressure from retailers and restaurants on cut
sizes» Retailers: Box weights and OSHA regulations, high
package values or low cut counts per dollar of value» Restaurants: Can sell meals with small cuts for same
amount as meals with larger, more costlier cuts
– Problem is not the top of the optimal ranges – Problem is the pigs beyond the top of the ranges
Further commoditization – raising the base lean percents
7Your Investment. Your Future.
This presentation and materials sponsored by:
Iowa Pork Producers AssociationNational Pork BoardYour Pork Checkoff