Embed Size (px)
Citation preview
9 Problem-solving and designIn this chapter you will learn about:• computer systems and sub-systems • top-down design • structure diagrams • flowcharts • pseudocode • library routines • sub-routines• algorithms• standard methods of solution• test data• validation and verification• using trace tables• identifying and correcting errors• producing algorithms• the effectiveness of a solution.
9.1 IntroductionIn order to build a computer system that performs a specific task or solves a givenproblem, the task or problem has to be clearly defined, showing what is going to becomputed and how it is going to be computed. This chapter introduces the tools andtechniques that are used to design a software solution that together with theassociated computer hardware will form a computer system.
9.1.1 What is a computer system?A COMPUTER SYSTEM is made up of software, data, hardware, communications andpeople; each computer system can be divided up into a set of sub-systems. Each sub-system can be further divided into sub-systems and so on until each sub-system justperforms a single action.
Computer systems can be very large or very small or any size in between; mostpeople interact with many different computer systems during their daily life withoutrealising it. For example, when I wake up in the morning I use an app on my smartphone for my alarm, I then check the weather forecast on my computer before I driveto work. The alarm program is a very small computer system; when I check theweather forecast I obtain information from one of the largest computer systems in theworld.
173

Activity 9.1Identify at least five computer systems you frequently use in your daily life.See if you can decide the size of each system.
9.1.2 Tools and techniquesIn order to understand how a computer system is built up and how it works, it is oftendivided up into sub-systems. This division can be shown using top-down design toproduce structure diagrams that demonstrate the modular construction of the system.Each sub-system can be developed by a programmer as sub-routine or an existinglibrary routine may be already available for use. How each sub-routine works can beshown by using flowcharts or pseudocode.
Top-down designTOP-DOWN DESIGN is the breaking down of a computer system into a set of sub-systems, then breaking each sub-system down into a set of smaller sub-systems, untileach sub-system just performs a single action. This is an effective way of designing acomputer system to provide a solution to a problem, since each part of the problem isbroken down into smaller more manageable problems. The process of breaking downinto smaller sub-systems is called ‘stepwise refinement’.
This structured approach works for the development of both large and smallcomputer systems. When large computer systems are being developed this means thatseveral programmers can work independently to develop and test different sub-systems for the same system at the same time. This reduces the development andtesting time.
Structure diagramsIn order to show top-down design in a diagrammatic form, structure diagrams can beused. The STRUCTURE DIAGRAM shows the design of a computer system in ahierarchical way, with each level giving a more detailed breakdown of the systeminto sub-systems.
Alarm app for a smart phoneConsider the alarm app computer system for a smart phone. This could be dividedinto three sub-systems, setting the alarm, checking for the alarm time, sounding thealarm. These sub-systems could then be further sub-divided; the structure diagrammakes the process clearer.
174
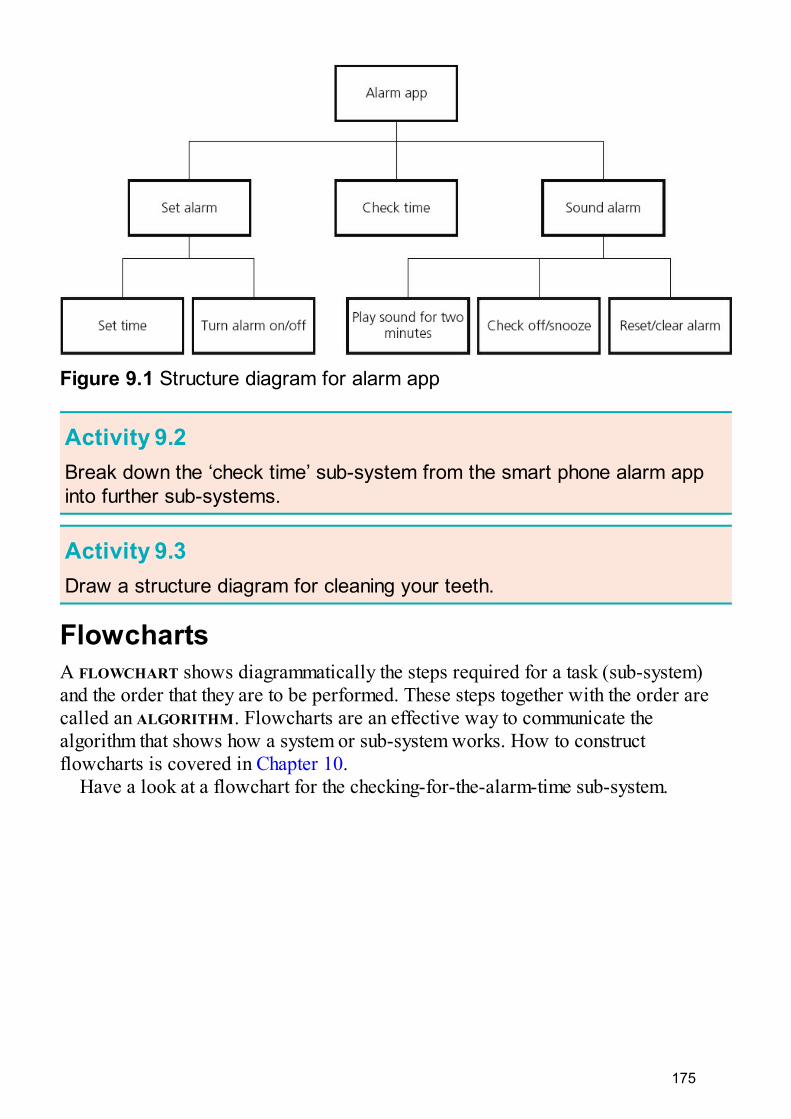
Figure 9.1 Structure diagram for alarm app
Activity 9.2Break down the ‘check time’ sub-system from the smart phone alarm appinto further sub-systems.
Activity 9.3Draw a structure diagram for cleaning your teeth.
FlowchartsA FLOWCHART shows diagrammatically the steps required for a task (sub-system)and the order that they are to be performed. These steps together with the order arecalled an ALGORITHM. Flowcharts are an effective way to communicate thealgorithm that shows how a system or sub-system works. How to constructflowcharts is covered in Chapter 10.
Have a look at a flowchart for the checking-for-the-alarm-time sub-system.
175

Figure 9.2 Flowchart for checking-for-the-alarm-time sub-system
PseudocodePSEUDOCODE is a simple method of showing an algorithm, using English-like wordsand mathematical operators that are set out to look like a program. How to writealgorithms in pseudocode is covered in Chapter 10.
Have a look at the pseudocode for the checking-for-the-alarm-time algorithm.
176

Figure 9.3 Pseudocode for the checking-for-the-alarm-time algorithm
Library routinesA LIBRARY ROUTINE is a set of programming instructions for a given task that isalready available for use. It is pre-tested and usually performs a task that isfrequently required. For example, the task ‘get time’ in the checking-for-the-alarm-time algorithm would probably be readily available as a library routine.
Sub-routinesA SUB-ROUTINE is a set of programming instructions for a given task that forms a sub-system, not the whole system. Sub-routines written in high-level programminglanguages are called ‘procedures’ or ‘functions’ depending on how they are used.See Chapter 11 for further details.
9.2 AlgorithmsAn ALGORITHM sets out the steps to complete a given task. This is usually shown asa flowchart or pseudocode. Anyone who studies the flowchart or algorithm should beable to work out the purpose of the task.
Activity 9.4Have a look at the flowchart and pseudocode below. What is the purposeof the algorithm that they both represent?What would be output if the numbers 7 and 18 were input?
177

Figure 9.4 Flowchart
Figure 9.5 Pseudocode
For more complicated tasks just inspecting the flowchart or pseudocode may not be
178

an accurate way of determining its purpose; a more structured thorough approach isrequired. This will require the use of test data and trace tables.
Some tasks are required frequently and there are standard methods of completingthem, for example, taking the square root of a number or sorting a list of names intoalphabetical order. These standard solutions can be provided by a high-levelprogramming language as a standard function or procedure, for example,mathematical functions such as max or min. Library routines are also available forstandard methods such as sorting or searching.
9.3 Test dataIn order to determine whether a solution is working as it should, it needs to be tested.Usually before a whole system is tested each sub-system is tested separately.
Algorithms can be tested by a person working through them using any data that isrequired and seeing what the result is; computer programs can be tested by runningthem on a computer using any data that is required and seeing what result is output. Inorder to test a solution thoroughly it may need to be worked through several timeswith different sets of test data.
A SET OF TEST DATA is all the items of data required to work through a solution.The set of test data used in the activity above was 7 and 18.
Testing needs to be done to prove that the solution works correctly. In order to dothis a set of test data should be used together with the result(s) that are expected fromthat data. The type of test data used to do this is called NORMAL DATA, this should beused to work through the solution to find the actual result(s) and see if these are thesame as the expected result(s).
For example, here is a set of normal test data for an algorithm to record thepercentage marks from 10 end-of-term examinations for a student and find theiraverage mark:
Normal test data: 50, 50, 50, 50, 50, 50 50, 50, 50, 50Expected result: 50
Activity 9.5Provide another set of test data and its expected result.
Testing also needs to be done to prove that the solution does not give incorrectresults. In order to do this, test data should be used that will be rejected as the valuesare not suitable. This type of test data is called ERRONEOUS or ABNORMAL TESTDATA; it should be rejected by the solution.
For example erroneous/abnormal data for an algorithm to record the percentagemarks from 10 end-of-term examinations for a student and find their average markcould be:
Erroneous/abnormal data: –12, eleven179

Expected results: these values should be rejected
Activity 9.6Provide some more erroneous/abnormal data for this algorithm and itsexpected results.
When testing algorithms with numerical values, sometimes only a given range ofvalues should be allowed. For example, percentage marks should only be in the range0 to 100. The algorithm should be tested with EXTREME DATA, which, in this case,are the largest and smallest marks that should be accepted. Extreme data are thelargest and smallest values that normal data can take.
Extreme data: 0, 100Expected results: these values should be accepted
There is another type of test data called BOUNDARY DATA; this is used to establishwhere the largest and smallest values occur. For example, for percentage marks inthe range 0 to 100, the algorithm should be tested with the following boundary data;at each boundary two values are required, one value is accepted and the other valueis rejected.
Boundary data for 0 is –1, 0Expected results: –1 is rejected, 0 is accepted
Activity 9.7Provide boundary data for the upper end of the range; assume that thepercentage marks are always whole numbers.
Activity 9.8The end-of-term examinations are now marked out of 20. Provide thefollowing:a two sets of normal data and their expected resultsb some erroneous/abnormal data and their expected resultsc two sets of boundary data and their expected results.
9.4 Validation and verificationIn order for computer systems to only accept data inputs that are reasonable andaccurate, every item of data needs to be examined before it is accepted by the system.Two different methods, with very similar sounding names, are used. For data entry,VALIDATION is performed automatically by the computer system to ensure that only
180

data is that is reasonable is accepted and VERIFICATION is used to check that the datadoes not change as it is being entered.
9.4.1 ValidationValidation is the automated checking by a program that data is reasonable before it isaccepted into a computer system. Different types of check may be used on the samepiece of data; for example an examination mark could be checked for reasonablenessby using a range check, a type check and a presence check. When data is validated bya computer system, if the data is rejected a message should be output explaining whythe data was rejected and another opportunity given to enter the data.
Figure 9.6 Data entry error message
There are many different types of validation checks including:• range checks• length checks• type checks• character checks• format checks• presence checks• check digits.A RANGE CHECK checks that only numbers within a specified range are accepted. Forexample percentage marks between 0 and 100 inclusive.
A LENGTH CHECK checks either:
181

• that data contains an exact number of characters, for example that a password mustbe exactly eight characters in length so that passwords with seven or fewercharacters or nine or more characters would be rejected
or• that the data entered is a reasonable number of characters, for example a family
name could be between two and 30 characters inclusive so that names with onecharacter or 31 or more characters would be rejected.
A TYPE CHECK checks that the data entered is of a given data type, for examplenumber of brothers or sisters would be an integer (whole number).
A CHARACTER CHECK checks that when a string of characters is entered it does notcontain any invalid characters or symbols, for example a name would not containcharacters such as %, and a telephone number would only contain digits or (, ), and+.
A FORMAT CHECK checks that the characters entered conform to a pre-definedpattern, for example in Figure 9.6 the cub number must be in the form CUB9999.
A PRESENCE CHECK checks to ensure that some data has been entered and thevalue has not been left blank, for example an email address must be given for anonline transaction.
182

Figure 9.7 Presence check error message
A CHECK DIGIT is the final digit included in a code; it is calculated from all the otherdigits in the code. Check digits are used for barcodes, product codes, InternationalStandard Book Numbers (ISBN) and Vehicle Identification Numbers (VIN).
Check digits are used to identify errors in data entry caused by mis-typing or mis-scanning a barcode. They can usually detect the following types of error:• an incorrect digit entered, for example 5327 entered instead of 5307• transposition errors where two numbers have changed order, for example 5037
instead of 5307• omitted or extra digits, for example 537 instead of 5307 or 53107 instead of 5307• phonetic errors, for example 13, thirteen, instead of 30, thirty.
183

Figure 9.8 ISBN 13 code with check digit
An example of a check digit calculation is ISBN 13, where the 13th digit of the ISBNcode is calculated using the following algorithm.1 Add all the odd numbered digits together, excluding the check digit.2 Add all the even numbered digits together and multiply the result by 3.3 Add the results from 1 and 2 together and divide by 10.4 Take the remainder, if it is zero use this value, otherwise subtract the remainder
from 10 to find the check digit.
Figure 9.9 ISBN
Using the ISBN above 9 7 8 0 3 4 0 9 8 3 8 2 without its check digit:1 9 + 8 + 3 + 0 + 8 + 8 = 362 3(7 + 0 + 4 + 9 + 3 + 2) = 753 (36 + 75)/10 = 11 remainder 14 10 – 1 = 9 the check digit.To check that an ISBN 13 digit code is correct a similar process is followed.1 Add all the odd numbered digits together, including the check digit.2 Add all the even number of digits together and multiply the result by 3.3 Add the results from 1 and 2 together and divide by 10.4 The number is correct if the remainder is zero.Using the ISBN above 9 7 8 0 3 4 0 9 8 3 8 2 9 with its check digit:
184

1 9 + 8 + 3 + 0 + 8 + 8 + 9 = 452 3(7 + 0 + 4 + 9 + 3 + 2) = 753 (45 + 75)/10 = 12 remainder 04 Remainder is 0 therefore number is correct.
Activity 9.9a Find the check digit for the ISBN 978190612400.b Are these ISBNs correct? i 9718780171500 ii 9781234567897
Activity 9.10• Find an ISBN, then show that its check digit is correct.• Working in pairs find two ISBNs each, copy one down with a transposition
error and the other one correctly. Swap your ISBNs and see if you canfind the one with the error.
• Look at a correct ISBN, can you think of an error that this system will notidentify and explain with an example why this is the case?
Activity 9.11Find out about the modulo 11 check digit calculation and how it is used forVINs.
Activity 9.12Find out how limit checks and consistency checks are used.
Activity 9.13Which validation checks could you use for the following? You may decidethat more than one validation check is required.a Entering a telephone number.b Entering a student’s name.c Entering a part number in the form XXX999, where X must be a letter and
9 must be a digit.
9.4.2 VerificationVerification is checking that data has been accurately copied onto the computer ortransferred from one part of a computer system to another.
185

Verification methods include:• double entry• screen/visual check• parity check• checksum.For DOUBLE ENTRY the data is entered twice, sometimes by different operators; thecomputer system compares both entries and outputs an error message requesting thatthe data is entered again if they are different.
Figure 9.10 Double entry
A SCREEN/VISUAL CHECK is a manual check completed by the user who is enteringthe data. When the data entry is complete the data is displayed on the screen and theuser is asked to confirm that it is correct before continuing. The user either checks thedata on the screen against a paper document that is being used as an input form orconfirms from their own knowledge if the data is about them.
Parity checks and checksums are discussed in Sections 2.3.1 and 2.3.3.
9.5 Using trace tablesA thorough, structured approach is required to find out the purpose of an algorithm,which involves recording and studying the results from each step in the algorithm.This will require the use of test data and trace tables.
Consider the algorithm represented by the following flowchart:
186

Figure 9.11 Flowchart to trace
A TRACE TABLE can be used to record the results from each step in an algorithm; it isused to record the value of an item (variable) each time that it changes. This manualexercise is called a DRY RUN. A trace table is set up with a column for each variableand a column for any output. For example:
187

Table 9.1 Trace table
Test data is then used to dry run the flowchart and record the results on the tracetable.
Test data: 9, 7, 3, 12, 6, 4, 15, 2, 8, 5
Table 9.2 Completed trace table for flowchart
It can be seen from the output that the algorithm selects the largest and the smallestnumbers from a list of 10 positive numbers. The same trace table could have beenused if the algorithm had been shown using pseudocode.
188

Figure 9.12 Pseudocode for the same algorithm to trace
Activity 9.14Use the trace table below and the test data 4, 8, 19, 17, 3, 11, 6, 1, 13, 9to record a dry run of the pseudocode.
Table 9.3 Trace table to complete for the pseudocode
189
9.6 Identifying and correcting errors
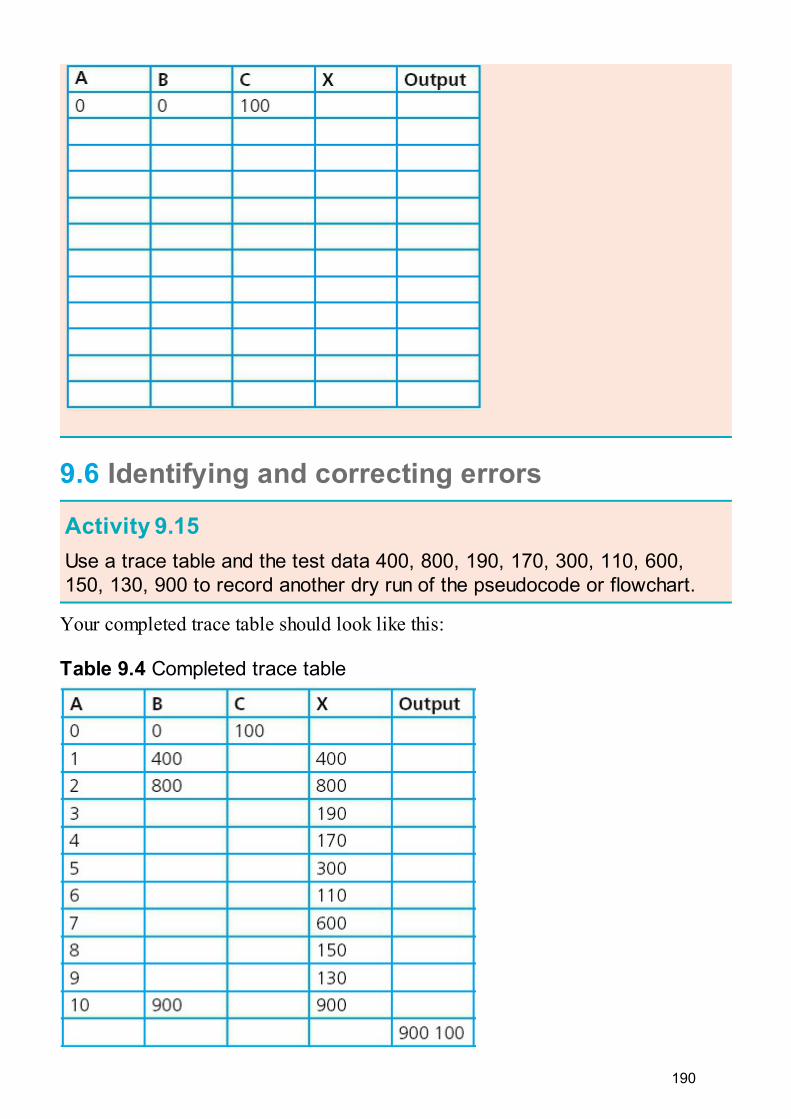
Activity 9.15Use a trace table and the test data 400, 800, 190, 170, 300, 110, 600,150, 130, 900 to record another dry run of the pseudocode or flowchart.
Your completed trace table should look like this:
Table 9.4 Completed trace table
190
There is an error as the smallest number has not been identified.
Activity 9.16Use a trace table and some negative test data to record another dry run ofthe pseudocode or flowchart. What error have you found?
The algorithm only works for numbers between 0 and 100; a better algorithm couldlook like this:
191

Figure 9.13 A better algorithm
This algorithm is very similar and works for a much larger range of numbers but itstill does not work for every set of numbers. In order to do this the algorithm needs tobe rewritten to allow the largest and smallest numbers to be tested against numbersthat appear in the list. Figure 9.14 shows this.
192

193

Figure 9.14 A much better algorithm
Activity 9.17Change the pseudocode so it works for every set of numbers like theflowchart above.
9.7 Producing algorithms
9.7.1 Stages in producing an algorithm1 Make sure that the problem is clearly specified.2 Break the problem down into sub-problems; if it is complex, you may want to
consider writing an algorithm for each sub-problem. Most problems, even thesimplest ones can be divided into:
• set up • input • processing • output of results.3 Decide on how any data is to be obtained and stored, what is going to happen to the
data and how any results are going to be displayed.4 Decide on how you are going to construct your algorithm, using a flowchart or
pseudocode.5 Construct your algorithm, making sure that it can be easily read and understood by
someone else. This involves setting it out clearly and using meaningful names forany data stores. The algorithms that you have looked at so far in this chapter werenot designed with readability in mind because you needed to work out what theproblem being solved was.
6 Use several sets of test data (normal, abnormal and boundary) and trace tables tofind any errors.
7 If any errors are found, repeat the process until you think that your algorithm worksperfectly.
Have a look at a more readable flowchart showing the algorithm to select the largestand smallest numbers from a list of 10 numbers.
194

195

Figure 9.15 A readable algorithm
More practice on producing algorithms is given in Chapter 10.
9.7.2 The effectiveness of a solutionThere are many different solutions to the same problem. In order to consider theeffectiveness of a given solution ask the following questions.1 Does the solution work for all sets of data?2 Does the solution have any unnecessary processes that are never used?3 Are any actions repeated more often than necessary?4 Can the solution be simplified and still work as well?
Activity 9.18Consider the following algorithm written in pseudocode to check if a child isold enough or tall enough to go on a theme park ride. Comment on itseffectiveness.
Figure 9.16 Pseudocode to check the height and age of a child
196

End-of-chapter questions1 Name and describe the components of a computer system.2 A computer system is to be developed to provide a modulo 11 check digit for
numbers from four to 20 digits in length. Provide a structure diagram for thiscomputer system.
3 A phone app is being developed to split the cost of a restaurant bill between agiven number of people. It is being designed to work for up to 12 diners and forbills from $10 to $500.
a What validation checks should be used for the number of diners and the size ofthe bill?
b Provide two sets of normal data and their expected results. c Provide some abnormal/erroneous data. d Identify the boundary data required and the expected results.4 Explain what is meant by validation and verification.5 The following data is to be entered onto an online form: • name • date of birth • password • phone number. For each item state, with reasons, the validation and verification checks that
should be used.6 Using ISBN 13: a Find the check digit for ISBN 978034098382 b Are these ISBNs correct? 9780521170653 97805961580867 The following algorithm shown as a flowchart checks the sizes of a consignment of
10 parcels. The dimensions of each parcel are input in centimetres.
197
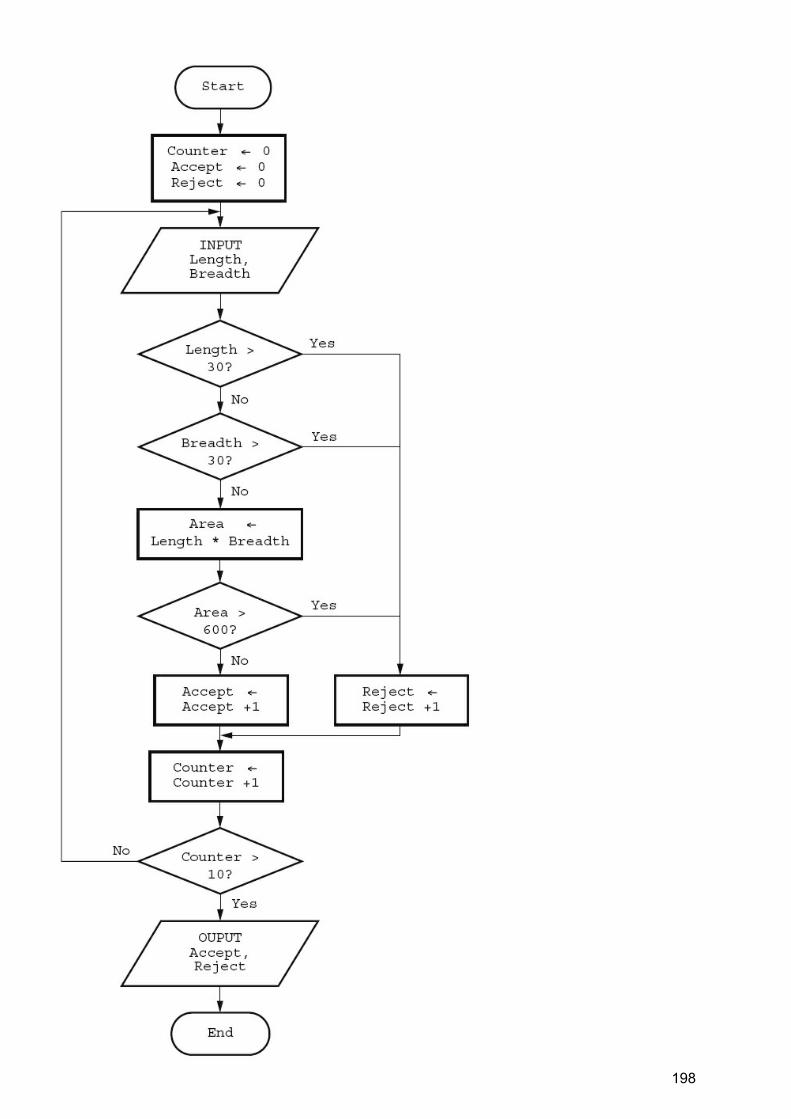
198

Figure 9.17 Flowchart
a Use this data and the trace table to dry run the algorithm. 15, 10, 20, 17, 32, 10, 30, 35, 30, 15, 30, 28, 25, 25, 20, 15, 40, 20, 12, 10
Table 9.5 Trace table to complete
b What are the rules required to accept a parcel? c Comment on the effectiveness of the algorithm.8 This algorithm written in pseudocode adds up 10 positive numbers. It contains
several errors.
199

Figure 9.18 Pseudocode for algorithm
a Identify all the errors in the algorithm. b Comment on the effectiveness of the algorithm. c Rewrite the algorithm so that it is effective and error free. d Set up a trace table and some test data to dry run your rewritten algorithm. e Identify which items of your test data are normal, erroneous and extreme.9 State two different validation checks and give an example of their use. Each
example should be different.[4]
Cambridge IGCSE Computer Studies 7010/0420 Paper 12 Q9(b) June 201210 New software is often developed using top-down (modular) design. Give three benefits of using this method of development.
[3]Cambridge IGCSE Computer Studies 7010/0420 Paper 13 Q2 November 2012
11 A program requires the user to type in a user ID which must be in the form: XX999999 where X stands for any letter, and 9 stands for any digit. a Name two possible validation checks that could be applied to this user ID.
[2] b Name a validation check that could not be used on this occasion. Give a reason
for your choice.[2]
200

Cambridge IGCSE Computer Studies 7010/0420 Paper 13 Q5 November 2012
201


![Design Methodology , Problem Solving and Creative Thinking [Autosaved]](https://img.pdfslide.us/doc/110x75/55cf977c550346d03391de9f/design-methodology-problem-solving-and-creative-thinking-autosaved.jpg)

