Embed Size (px)
Citation preview

9Oil Spill EffectsR. J. Barsdate, M. C. Miller, V. Alexander,J. R. Vestal, and J. E. Hobbie
INTRODUCTION
Oil production at Prudhoe Bay stimulated interest in research oneffects of a possible oil spill on ponds . In fact, there are natural oil seeps atCape Simpson, not very far from Barrow, and a producing gas well is insight of the ponds . For this reason, NSF funded pond research in 1970 andan experimental oil spill was carried out on Pond E. This pond wassampled during the years of intensive research and then the Department ofEnergy provided funds for an additional oil spill (Pond Omega in 1975)and follow-up studies from 1975 through 1979. This research allowedadditional studies on chironomids, zooplankton, and algae ; much of thisbasic research is included in this book . In addition to the basic research,the oil spills were experimental treatments that produced information onsuch things as the control of phytoplankton algae by zooplankton andrecolonization of ponds by insects .
Most of the research on effects of oil has been carried out on marinespecies ; there are, however, several studies of effects on arctic freshwaters .In Canada, both lake and stream spills have been studied in the MackenzieDelta (Brunskill et al. 1973, Snow and Rosenberg 1975a, 1975b) . InAlaska, a spill was studied in an arctic lake (Jordan et al . 1978, Miller etal. 1978a) and the natural seeps at Cape Simpson have been investigated(Barsdate et al . 1973) .
Spill on Pond E, 1970
On 16 July, 1970, 760 liters (4 barrels) of crude oil from Prudhoe Bay(ARCO) were applied to the surface of Pond E (Figure 9-1) . Pond E has asurface area of 300 m 2 , or 490 m2 if the surrounding marsh is included,and an approximate volume of 800 m' . This amount of oil is about 16,000liters ha - ` or 25 times the dose used for the Mackenzie Delta study .
Several hours after the spill on Pond E the oil covered the entire pond ;24 hours later the wind had moved the oil to the west side of the pondwhere it accumulated in a band 3 to 5 m wide . Throughout August andearly September, about half of the applied oil moved back and forth in the
388

II
J "' Light Oil 1<0.2g CC')
Heavy Oil (0.2-I .Og cc l )
00 S 20m,0 20 40 60 ft
Oil Spill Effects
389
FIGURE 9-1 . Ponds Cand E showing locationof sampling points fortemperature and oxygenin 1970 (solid points), thedistribution of oil in July1971, and the location ofthe 1971 and 1972 vegeta-tion transect (triangles) .
pond as the wind changed while the rest remained in the emergent-vegetation zone . Some of the lighter fractions of oil evaporated and as theremainder became more viscous, it began to adhere to the stems of theemergent plants (first noticed in mid-August) . Only a small amount of oilpenetrated into the sediment or into the wet litter . A lighter (rainbow-colored) scum surrounded the margin of the ponds and extended overmuch of the surface whenever the wind fell . Later, the lighter scum foldedinto brown floating fans whenever it struck a blade of grass . These fanswere easily broken up by wave action and sunk . In September, the floatingoil retarded freezing so that the water beneath the oil accumulations didnot freeze until the ice was 2 cm thick on the rest of the pond .
The following spring (1971), these same areas of accumulationthawed more rapidly than the rest of the pond . Pond E did overflow duringthe runoff but little oil moved out of the polygon due to filtering by thesnowpack and by the emergent plants . A few small clumps of plant litter

390
R. J. Barsdate et al.
soaked with oil were found some 20 m from the polygon . Through lateJune and early July, 1971, some floating oil was still visible (Figure 9-1)and the oil odor was evident . By mid-July, the thin film of oil surroundingthe heavy accumulation along the west side had changed from a typical oilslick to a thin brown scum . At the same time, the thick accumulationsbegan to sink, and became attached to the plant litter in the Carex bed .
A rough determination of the quantity of oil remaining in July 1971revealed that at least half of the oil was still present . This was measuredfrom aerial and ground observations of the area covered by the heavyaccumulation of oil, the oil slick, and the light scum . Samples were thentaken 0 .5 m to either side of the division between the light and the heavyaccumulation to obtain an average weight of oil for each area .Approximately 150 m 2 of the total area was covered with oil weighinggreater than 2 kg m -2 and about 190 m', with oil weighing less than this .These values included the oil attached to the vascular plants and litter .This attached oil made collection and extraction of the oil very difficult sothere may well be a large error associated with this estimate . Certainly alot of the oil was still present nearly 1 year after the spill, for a minimum
E 8
t 10nm0
d03
2
6
8
I0
Distance From Shore, m
FIGURE 9-2 . Temperature (°C) and oxygen concentrations (mg 0 2liter') in Ponds E and C, 23 July 1970 .
East
Pond C
05:66 .90/0 .5
0.90/2.6 0.70/0.0Pond E
Oxygen,-,Temp .
`~ Q
10.805.6
6.507.6
11 .40
3 .905 .9
05.6
V
IIIIIIIIIII
10.70
8 .20
J I111II1I1i1
10
9
8
7
6
5
4
3
2
0
Floating Oil
5.00/0./
3.50//.2
West
3.5 0 / 0.9

estimate of the quantity is 395 kg remaining of the 680 kg added (this is150 x 2 + 190 x 0.5) .
During the remainder of 1971 and in later years, the location andgeneral appearance of the oil did not change and there was no furthereffect on the timing of the freeze and melt . Occasional oil slicks and smallpatches of floating oil were seen in 1972 and 1973 ; and in June, 1975, oilwas visible in the Carex beds on the west side of the pond as a low ridgeseveral centimeters high in the sediments . Although the surface of theridge was covered with a brown scum and organic detritus, any mechanicaldisturbance caused a renewed oil slick to well up from the ridge .
Spill on Pond Omega, 1975
The experimental spill in 1975 was made on Pond Omega, a 260 m 2 -pond located several hundred meters from Pond B (see Miller et al . 1978afor exact location) . The 0.24 liter m -2 dose on 10 July was about one-tenth the amount added to Pond E. The initial movement of the oil slickwas controlled by the direction of the wind and within 24 hours after thespill, the oil had collected in the Carex beds around the pond . This wassimilar to the 1970 oil spill .
PHYSICAL AND CHEMICAL MEASUREMENTS
Temperature
There was practically no change in the physical regime of the ponds asa result of the oil spill . The water temperature of Pond E did increase byabout 4°C for 3 days after the spill but returned to normal after the oilmoved into the pond margin and after this was exactly the same as thetemperature in Pond C . As long as the floating oil covered a large area, itis likely that there was a microstratification of temperature bothhorizontally and vertically. For example, 7 days after the spill the range oftemperature beneath the oil was slightly higher than in a similar locationin Pond C (Figure 9-2) . Evaporation in Pond E was about the same as inthe control Pond C as shown by their similar water levels (Figure~9-3) .Finally, it was possible that the oil could change the heat budget of thesediment through a decrease in albedo or an increase in heat conduction .Again the similarity of the depth of thaw (Figure 9-3) to that in the controlpond indicates that any changes were too slight to measure .
Oil Spill Effects
391

392
R. J. Barsdate et al .
0
L
CL 20 -
25-
30-
20Jun
Jul
Aug
FIGURE 9-3 . Depth of thaw and of the water levelin Ponds C and E, 1970.
Oxygen
The only measured chemical change was in the .oxygen concentration .There is normally a decrease in oxygen gear the pond margins caused bythe high rate of sediment respiration (Chapter 8), by the shallow watercontaining a small absolute amount of oxygen, and by the restrictedcirculation and mixing in the shelter of the emergent plants (Pond C inFigure 9-2) . This decrease is intensified by the floating oil which not onlydrastically restricts water movement but also reduces the diffusion ofoxygen through the water surface . These data are for a single date andthere is every possibility that oxygen could be lowered even further onwarm days or at night . If so, then the benthic animals may be affected .
Nutrients and Water Chemistry
There was no detectable change in the inorganic chemistry of thewater after the oil spills in 1970 and 1975 . We measured pH, alkalinity,Ca, Ha, K, Mg, Fe, and conductivity as well as nutrients (Table 9-1) . Infact, the oil itself contains by weight 0.23% N and 0 .82% S (Thompson etal. 1971) so the amounts added are large (20 mg N and 70 mg S liter' ofPond E) Also, the organic matter added can change the systems asBrunskill et al . (1973) found anaerobic conditions and H 2 S beneath the iceof Lake 4 (Mackenzie Delta). However, in Ponds E and Omega the strongreducing conditions did not develop and evidently the N remains tied up inthe heavier fractions (Ball 1962) .
35° Pond E•
Pond C -30---- Depth of Thaw
-
of
-Depth
Water 25 E
c-20
~Q,N I Oil applied to
-15 °
i Pond E n- 10 0
~%, 01-1
010
20 10
20

Oil Spill Effects
393
TABLE 9-1 Nutrient Concentrations in Control Pond C and Before andAfter Whole Pond Spills on Pond E and Pond Omega
1 Data expressed as yearly average (± standard deviation) .2 1970-72 DRP was extracted into isobutanol and read in 10 cm cells .3 Autoanalyzer, unextracted 1975 .Source : Miller et al (1978a) .
The only chemical change noted was a detectable amount of nitrogenfixation in Pond E 3 years after the spill (Miller et al . 1978a) . This fixationoccurred in only one of three samples ; the only other N fixation ever foundin the ponds was in an experimental subpond of Pond B which was heavilyfertilized with phosphorus . This may be bacterial fixation similar to thatfound in oiled experimental ponds along the Ottawa River (Shindler et al .,1975) .
Some of the oil is lost by volatization and some lost by degradation ;the exact amount lost is difficult to measure in the field but at least half ofthe oil disappeared in the first several months after a spill (details given inMiller et al . 1978b) . For example, the initial loss rate of the volatilecomponents of Prudhoe Bay crude oil was 10 .3% day -1 at 5°C and 12 .5%
Parameter- 1970 1970 1971 1972 1975 1975Pond/Year prespill postspill prespill postspill
Dissolved Pond C 0.066 2 0 .082 2 0.071 2 0 .064 2 0 .24 3 0.38 3reactive ( .042) ( .029) ( .04) ( .01) ( .13) ( .58)phosphate
0.052 0.076 0.059 0.082 0 .28(µg at. P04 Pond EP liter -1 ) (0 .03) ( .048) ( .05) ( .04) ( .21)
Pond 0.43 0.43Omega ( .30) ( .62)
Ammonium Pond C 2 .9 1 .4 2.6 2.4 2 .7(hg at . N113- (1 .6) (0.4) (0 .8) (2.3) (2.0)N liter-1)
Pond E 2 .8 1 .2 2 .1 1 .6(1 .2) (0.3) (1 .9) (0 .8)
Pond 2 .8 2 .2Omega (1 .2) (1 .5)
Nitrate Pond C 0.64 0.03 1 .30 1 .0 0.88(fig at. N03 (.47) ( .05) (1 .1) (1 .1) ( .74)N liter
_1 )Pond E 0 .57 0.27 2 .9 .2 .8
( .58) (0 .8) (2 .6) (3 .8)Pond 2.6 1 .0Omega (1 .5) (0 .7)
Silicate Pond C 4.2 9 .4 2 .3 3 .4 1 .5pg at. Si03 (5 .7) (7 .6) (0 .9) (2 .6) (1 .5)Si liter _t
)
Pond E 3 .5 8 .6 2 .9 8 .9(2 .4) (4 .3) (1 .8) (10.3)
Pond 1 .8 1 .6Omega (1 .0) (0 .7)

394
R. J. Barsdate et al .
r-0
0 400.E0
cm
CL
so
20
Saturate
'Aromatic
BSANSO_-
i
0 1
4
7
13 days
5 yrsTime
FIGURE 9-4 . Composition of Prudhoe Bay crude oil as apercentage of the total. The classes are benzene-soluble as-phaltenes (BSA), benzene-insoluble asphaltenes (BIA), thesaturate fraction, the aromatic fraction, and the nitrogen-,sulfur- or oxygen-containing fraction (NSO) . (After Milleret al. 1978b .)
day' at 25°C in a laboratory hood with moving air . The loss of allfractions of the oil was 18 to 19% in 36 days when the oil was placed indarkened Petri dishes in the field . When clear dishes were placed in thesun, 24% of the oil was lost, so this photo-decomposition could beimportant in the arctic . The loss was even higher when the oil was placed inplastic tubes containing natural water and sediment and incubated in thepond. After 45 days, 75% of the oil disappeared, which indicates that bioticprocessing was not too important . Somewhat slower rates were reportedby Federle et al . (1979) ; after 1 year 58% of the oil remained in core tubes .
Despite the rapid loss of oil, the overall composition of the remainingoil does not change appreciably over time (Figure 9-4) . The differentclasses were separated on solid-liquid chromatographic columns asdescribed by Jobson et al. (1972) after separation from the water andsediment by Freon extraction . Even after 5 years in the pond, thecomposition of the oil is about the same . However, the saturate fraction(pentane soluble) did show some biological degradation, as Miller et al .(1978b) found that in the saturate fraction all of the hydrocarbons withfewer than 13 carbon atoms were lost within 13 days (measured by gas-liquid chromatography) .
Oil Spill Effects
395
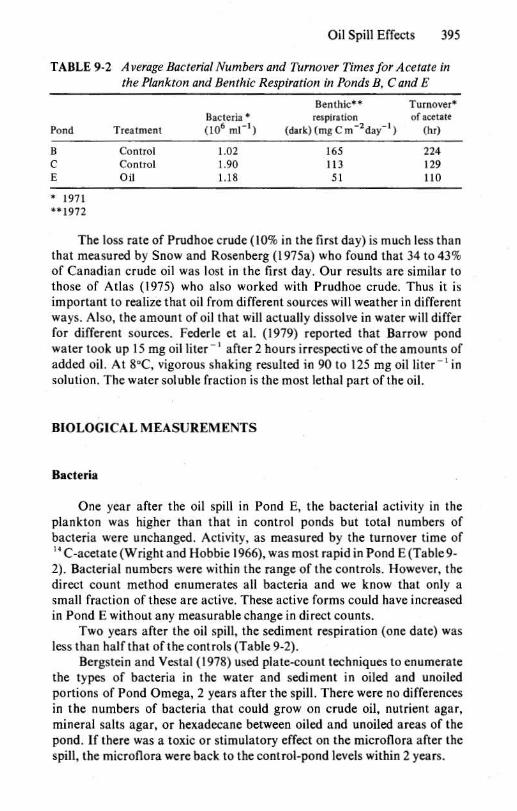
TABLE 9-2 Average Bacterial Numbers and Turnover Times for Acetate inthe Plankton and Benthic Respiration in Ponds B, C and E
* 1971**1972
The loss rate of Prudhoe crude (10% in the first day) is much less thanthat measured by Snow and Rosenberg (I 975a) who found that 34 to 43%of Canadian crude oil was lost in the first day . Our results are similar tothose of Atlas (1975) who also worked with Prudhoe crude . Thus it isimportant to realize that oil from different sources will weather in differentways. Also, the amount of oil that will actually dissolve in water will differfor different sources . Federle et al . (1979) reported that Barrow pondwater took up 15 mg oil liter' after 2 hours irrespective of the amounts ofadded oil. At 8°C, vigorous shaking resulted in 90 to 125 mg oil liter - ' insolution . The water soluble fraction is the most lethal part of the oil .
BIOLOGICAL MEASUREMENTS
Bacteria
One year after the oil spill in Pond E, the bacterial activity in theplankton was higher than that in control ponds but total numbers ofbacteria were unchanged. Activity, as measured by the turnover time of14 C-acetate (Wright and Hobbie 1966), was most rapid in Pond E (Table 9-2). Bacterial numbers were within the range of the controls . However, thedirect count method enumerates all bacteria and we know that only asmall fraction of these are active . These active forms could have increasedin Pond E without any measurable change in direct counts .
Two years after the oil spill, the sediment respiration (one date) wasless than half that of the controls (Table 9-2) .
Bergstein and Vestal (1978) used plate-count techniques to enumeratethe types of bacteria in the water and sediment in oiled and unoiledportions of Pond Omega, 2 years after the spill . There were no differencesin the numbers of bacteria that could grow on crude oil, nutrient agar,mineral salts agar, or hexadecane between oiled and unoiled areas of thepond. If there was a toxic or stimulatory effect on the microflora after thespill, the microflora were back to the control-pond levels within 2 years .
Pond TreatmentBacteria *(106 MI-1 )
Benthic**respiration
(dark) (mg C m -2 day t)
Turnover*of acetate
(hr)
B Control 1.02 165 224C Control 1.90 113 129E Oil 1.18 51 110

396
R. J . Barsdate et al .
TABLE 9-3 Rates of Photosynthesis of the Benthic Algae on 16 August 1971in Ponds E, C and J
Source : D. Stanley (personal communication) .
The general results from spills in lakes in arctic Alaska are similar tothe pond results . For example, Jordan et al . (1978) found no significantincreases in numbers (direct counts) in the water or sediment of a lake oneyear after the addition of oil (0 .25 liters m -2 or 0 .18 ml liter -1 ) . They alsofound that glucose uptake rates were unaffected by the oil but that theuptake of hexadecane and napthalene increased drastically over controls(but only after 110 hours of incubation) . Another study by Horowitz et al .(1978) measured high numbers of hydrocarbon-utilizing organisms in thesediments of a lake near Barrow 7 years after a large gasoline spill . Fromthese and other studies it appears that large numbers of hydrocarbon-utilizing microbes are present only when there are continual additions ofoil or gasoline .
FIGURE 9-5 . Biomass ofphytoplankton algae (mg
$ep wet weight m - ') in Ponds Eand C.
Pond Treatment mg C m-2 hr-1 mg C m -2 day-1
E Oil 5 60
C Control 13 160
J Control 11 130

Algae
One year after the spill on Pond E, the photosynthesis of benthicalgae was reduced by more than 50% over the controls (Table 9-3) . Only asingle measurement was made, however .
The phytoplankton algae were studied in great detail in the oilexperiment ponds. The results are clear ; there was some increase in pri-mary production and a change in species . However the causes are difficultto separate into direct toxicity effects and indirect effects due to the killingof zooplankton . This death of zooplankton will be documented later ; theyare extremely sensitive to oil and were eliminated from Pond E .
20
SpillPond E
~R
R
10
1 1970
C
-
SpillPond a.
50
a
,aE
C
0 May
Jun
Jul
Aug
Sep
FIGURE 9-6 . Primary productivity in Ponds E, 4and C. (After Miller et al. 1978a.)
Oil Spill Effects
397
0 -200
1971
150-000 C
;, 100- P
IE1
L) 11
i 50-
i
II
I ,0
°0 200CL 1972r /I `
`E 100- /\\a` / aE
398
R. J. Barsdate et al .
5 .0
4.0
C
Uv
Treatment0 2.0
Grapha
Zoop Oil`I
yes
no0
2
no
noE
3
no yesd
4
yes yes
∎
.4
.3
8
12 16 20Days
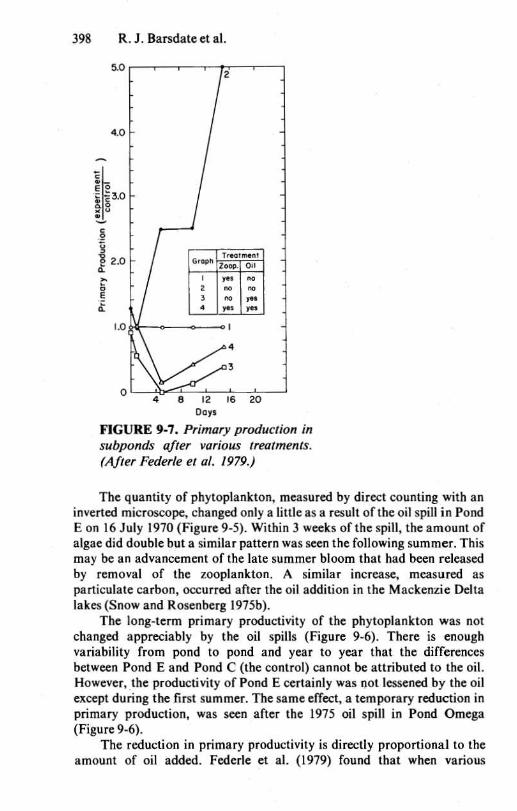
FIGURE 9-7. Primary production insubponds after various treatments .(After Federle et al. 1979.)
The quantity of phytoplankton, measured by direct counting with aninverted microscope, changed only a little as a result of the oil spill in PondE on 16 July 1970 (Figure 9-5) . Within 3 weeks of the spill, the amount ofalgae did double but a similar pattern was seen the following summer. Thismay be an advancement of the late summer bloom that had been releasedby removal of the zooplankton . A similar increase, measured asparticulate carbon, occurred after the oil addition in the Mackenzie Deltalakes (Snow and Rosenberg 1975b) .
The long-term primary productivity of the phytoplankton was notchanged appreciably by the oil spills (Figure 9-6) . There is enoughvariability from pond to pond and year to year that the differencesbetween Pond E and Pond C (the control) cannot be attributed to the oil .However, the productivity of Pond E certainly was not lessened by the oilexcept during the first summer . The same effect, a temporary reduction inprimary production, was seen after the 1975 oil spill in Pond Omega(Figure 9-6) .
The reduction in primary productivity is directly proportional to theamount of oil added. Federle et al. (1979) found that when various

quantities of oil were shaken with Pond C water, the short-termproductivity was reduced by 50% (by 15 µl oil liter') and stoppedcompletely by 30 µl . Oil layered on top of experimental vessels and notshaken was only half as toxic . Thus, the water-soluble fraction of the oil isinhibitory to the algae .
The inhibition lasts at least several weeks (Figure 9-7) but the algaebegin to recover after one week . This inhibition and recovery has also been
100
10
20Jun
10
20Jun
CyonoI
I10
20Jul
Crypto
Cyano
_Hetero
Pyrro
Euglenoano
Chloro
Pyrro
DiatomsChryso
1970
I10
20Aug
Crypto
CyanoDiatoms
Crypto
10
20
10
20Jul
Aug
Oil Spill Effects
399
Sep
Sep
-w,,-' ,Chloro -Hetero
1971
FIGURE 9-8 . Groups of phytoplankton as a percentageof the total wet weight in Ponds C and E .
Pond C
80
60
40 Cyano
0 Pyrro0E 200M0 Diatoms
m
0
80ua°
60
- Pond E
Chryso
40
20
Cyano
Chloro
Cr YPto"AI
0
100
a0 80E0 Crypto'm 60
0Diatoms
40cmu
a 20
0Pond E .--1
400
R. J. Barsdate et al .
500-
EM
400-PEN 300 -
E0m
200-M
Pond E
Jun
Jul
Aug
Sep
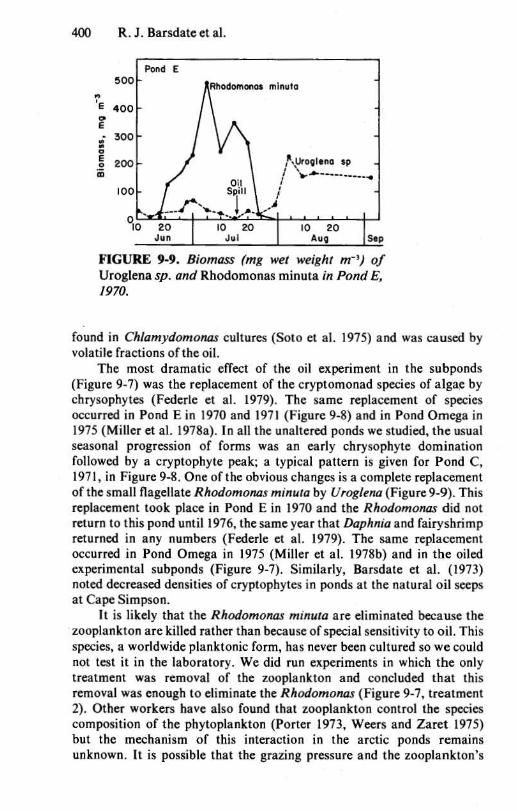
FIGURE 9-9 . Biomass (mg wet weight m -1) ofUroglena sp. and Rhodomonas minuta in Pond E,1970 .
found in Chlamydomonas cultures (Soto et al . 1975) and was caused byvolatile fractions of the oil .
The most dramatic effect of the oil experiment in the subponds(Figure 9-7) was the replacement of the cryptomonad species of algae bychrysophytes (Federle et al . 1979) . The same replacement of speciesoccurred in Pond E in 1970 and 1971 (Figure 9-8) and in Pond Omega in1975 (Miller et al . 1978a) . In all the unaltered ponds we studied, the usualseasonal progression of forms was an early chrysophyte dominationfollowed by a cryptophyte peak; a typical pattern is given for Pond C,1971, in Figure 9-8 . One of the obvious changes is a complete replacementof the small flagellate Rhodomonas minuta by Uroglena (Figure 9-9) . Thisreplacement took place in Pond E in 1970 and the Rhodomonas did notreturn to this pond until 1976, the same year that Daphnia and fairyshrimpreturned in any numbers (Federle et al . 1979). The same replacementoccurred in Pond Omega in 1975 (Miller et al . 1978b) and in the oiledexperimental subponds (Figure 9-7). Similarly, Barsdate et al . (1973)noted decreased densities of cryptophytes in ponds at the natural oil seepsat Cape Simpson .
It is likely that the Rhodomonas minuta are eliminated because thezooplankton are killed rather than because of special sensitivity to oil . Thisspecies, a worldwide planktonic form, has never been cultured so we couldnot test it in the laboratory . We did run experiments in which the onlytreatment was removal of the zooplankton and concluded that thisremoval was enough to eliminate the Rhodomonas (Figure 9-7, treatment2). Other workers have also found that zooplankton control the speciescomposition of the phytoplankton (Porter 1973, Weers and Zaret 1975)but the mechanism of this interaction in the arctic ponds remainsunknown. It is possible that the grazing pressure and the zooplankton's
I

* Data are expressed in g dry wt m -2 ; (n) = number of samples .**Location of transects given in Figure 9-1 .
Oil Spill Effects
401
enhancement of the nutrient cycling rate control the competition amongthe various algal species .
In other experiments with oil in the Arctic, green and blue-green algaebecome abundant. For example, Hanna et al. (1975) and Snow and Scott(1975) report that Oscillatoria increased after oil spills and some of ourexperimental subponds followed the same pattern (Federle et al . 1979) .This change did not occur in the whole-pond experiments we performedbut did occur when experiments were run in subponds without sediment . Itis likely that the phosphorus in the natural ponds is kept low and relativelyunavailable because of adsorption by the sediment; in lakes and inexperimental vessels without sediment the phosphorus becomes moreavailable because of the elimination of zooplankton .
Rooted Plants
No damage to the vascular plants, especially the dominant Carexaquatilis, was observed in the ponds during 1970, but growth was affectedduring following years . Immediately after the spill much of the oil becameattached to the stems of this sedge along the shore of the pond . As long asthe oil touched only the stem there was no damage ; some damage didoccur when the oil contacted leaves . In the same manner the new leaves ofCarex that appeared the next spring (1971) were killed in the area of thepond where they had to actually push through the floating layer of oil . Thismechanical effect, therefore, could have been the cause of the low biomassof Carex in the areas of heavy oil accumulation (Table 9-4) . The areacovered with a light accumulation of oil had a lowered Carex biomass in1971 but was back to normal in 1972 . There was no evident effect on therooted plantsiof the 10-fold smaller spill in 1975 in Pond Omega .
TABLE 9-4 The Above-water Live Biomass ofCarex aquatilis in Ponds Eand C in 1971 and 1972*
Treatment 8 July 1971 17 July 1972
Heavy oilA (north transect, Pond E)** 3 (15) 6 (8)
Light oilB (south transect, Pond E)** 18 (9) 34 (8)
Control(Pond C transect)** 30 (8) 27 (5)

402
R. J. Barsdate et al .
TABLE 9-5 Sequence of Disappearance of Zooplankton Species from PondOmega Following the Experimental Oil Spill on 9 July 1975*
*An "X" indicates that a representative of that species or group of species was foundalive on that day . An "0" indicates that no individual of that species or group wasfound alive on that day .Source : O'Brien 1978 .
TABLE 9-6 Numbers per Liter of Four Groups of Crustaceans in PondsCand E June through August 1971
Source : R. Stross (personal communication) .
TABLE 9-7 Zooplankton Production in Ponds B, C and E in1971, 1972 and 1973
Source : R. Stross (personal communication) .
Observed presence after spillSpecies Observed 7/10 7/11 7/12 7/14 7/16 7/18 7/21 7/23 7/29
Fairyshrimp(both species)
X 0 0 0 0 0 0 0 0
Daphnia middendorffiana X X X 0 0 0 0 0 0
Heterocope septentrionalis X X X X X 0 0 0 0
Cyclops spp . X X X X X X X X X
Jun Jun Jun Jul Jul Jul Jul Aug AugPond 14 21 28 5 12 19 26 2 16
Cyclops vernalisE 2 .3 1 .5 1 .3 1 .6 0 .0 0 .5 0 .2 0 .1 0 .2C 0 .8 6 .7 4 .6 4 .0 2 .3 2 .9 1 .6 0 .6 1 .0
Daphnia middendorffiana0 .1 0 .0 0 .0 0 .0 0 .0 0 .0 0 .0 0 .0E 0 .0
C 0 .0 0.1 3 .0 1 .8 3 .6 1 .2 3 .9 1 .4 1 .7
FairyshrimpsE 0 .4 0 .7 0 .0 0 .0 0 .0 0.0 0 .0 0.0 0 .0C 0 .1 4 .9 3 .0 0 .4 0 .2 0 .2 0 .1 0 .1 0 .1
Calanoid CopepodsE 0.6 3 .4 0 .2 0 .2 0 .1 0 .0 0 .0 0 .0 0 .1C 0 .0 93 .5 32 .4 10 .0 10 .1 5 .4 4 .4 2 .7 2 .7
Pond 1971
Year1972 1973 X
E (Oil) 0 .05 0.08 0.04 0.06
B (Control) 0.53 1 .07 0.44 0.68
C (Control) 1 .40 1 .19 0.82 1 .14

Zooplankton
The major effect of the oil spills on the ponds was the rapid kill of thezooplankton . O'Brien (1978) studied the animals during the Pond Omegaexperiment and showed the great sensitivity of the fairyshrimp andDaphnia and the lesser sensitivity of the copepods (Table 9-5) . In pond E,which received 10 times more oil than Pond Omega, the copepods wereeliminated in 1970 but a few were found in 1971 (Table 9-6) . Some animalsof each species were present at the beginning of every year, presumablydue to transfer of animals during the spring flooding of the tundra . Thesewere killed each year by the small amounts of the water-soluble fraction(WSF) released each year from the oil in and near the pond (Figure 9-1) .Daphnia did not return to Pond E until 1977 (Butler and Keljo personalcommunication) ; therefore, production of the zooplankton communitywas extremely low even though some copepods were present (Table 9-7) .
The differential sensitivity of the zooplankton to oil was confirmed inaquarium studies of O'Brien (1978) . Daphnia were killed at all levels ofadded oil including 0 .2 ml oil liter' or about 15% of the Pond Omegatreatment level . Fairyshrimp were most sensitive, Daphnia next,Heterocope next, and Cyclops least, exactly duplicating the field results ofTable 9-5 . The toxicity could be eliminated by vigorous aeration .
The results of the pond studies are similar to those from other marineand freshwater studies . For example, Busdosh and Atlas (1977) found that3 .0 ml liter' of Prudhoe crude oil killed marine amphipods and that itwas the WSF that was toxic . A tidepool copepod was killed by 1 ml dieseloil liter' within 3 days (Barnett and Kontogiannis 1975) . Aeration of oiland water dispersions resulted in a loss of 80 to 90% of the WSF within 24hours (Anderson et al . 1974) . Because the aeration did eliminate the toxiceffects of small amounts of oil, O'Brien (1978) suggests that aerationmight be used in an actual spill .
Aquatic Insects
Insects from the ponds are not killed by oil in aquarium studies .Mozley (1978) added up to 8.4 ml liter' in 13-liter aquaria and found nochange in survival of several kinds of chironomid larvae and eggs, oftrichopteran larvae, and of plecopteran nymphs . Unfortunately, up to 50%of the animals in the controls of these experiments died during the 12-daytest so that a low level of toxicity would have been missed .
Despite the lack of toxicity of oil in the laboratory, some insects andother invertebrates were eliminated or drastically reduced in numbers inthe oiled ponds . a t Barrow (Mozley and Butler 1978) . The Agabus(beetles), Asynarchus and Micrasema (caddisflies), Nemoura (stoneflies)and Physa (snails) were especially affected while Libertia (mites) remainedpresent in all ponds . Most of these animals live only in the plant beds and
Oil Spill Effects
403

404
R. J. Barsdate et al.
5
4
3
aE
MO
-2
TABLE 9-8 Two-year Mean Densities and TaxonomicComposition of Benthic Macroinverte-brates from Hand-core Samples in BarrowThaw Ponds*
E
14,7003,800
28 .49.9
15 .020 .625 .9
i
0
I
Pond
*Standard errors are based on variation between mean densities foreach sampling date .
Source : Mozley, 1978 .
MTrichotanypus
Orthoclodi inae
IIIIIITanypodinae
Chironomini
Tony tarsini
F111,
I_
FIGURE 9-10 . Number ofemerging chironomidadults per square meter by
~~ subfamily in the twoponds treated with oil .Trapping was continuous
No
__ through the emergenceunn. .,76 77 76 77
7576 77 757677center Corer
center Carex
season. (After Mozley andPOND E
POND a
Butler 1978.)
a,
Measure J G E2
Mean density m- 2 26,800 5,380 7,810Standard Error 4,800 570 800
%Chironomini 35 .9 63 .9 18 .3%Tanytarsini 51 .1 30 .0 64 .0%Tanypodinae 5 .8 4 .4 6 .7%Orthocladiinae 0 .5 1 .8 2 .4%Oligochaeta 6.8 0 7 .9

may have become trapped in the oil on the plant stems and in the floatingoil. Snow and Rosenberg (1975a) reported similar entrapment of insects inthe surface film of a Mackenzie Delta lake. At Barrow, recovery must takemore than 6 years as many of the insects were still absent in Pond E in1977 .
The chironomid larvae were virtually unaffected by the oil spills . Thenumbers present in the sediments did vary a great deal from pond to pondbut the highest and lowest numbers occurred in the control ponds J and G(Table 9-8) . Emergence was affected by the oil, however, and themetamorphosis of Tanytarsus was strongly reduced after the spill in PondOmega (Figure 9-10) . This genus of filter feeders did not recover in Pond Eeither and was also strongly affected in Mackenzie Delta Lake 4 (Snowand Rosenberg 1975a) .
These observations on the aquatic insects indicate that the-oil-inducedchanges are on the species level and that such measures as secondaryproduction and carbon flux are virtually unchanged . For example, theemerging cohort of Chironomus in 1977 presumably hatched in the year ofthe spill in Pond E and yet its numbers in Pond E were the same as in thecontrol Pond J (Mozley and Butler 1978) . These authors conclude that alight spill such as these reported here might best be treated by merelyattempting to absorb floating oil onto inert materials and possibly byflooding the ponds to float oil away from the littoral plants .
SUMMARY
Crude oil from Prudhoe Bay was added to Pond E in 1970 (1 .6 literm -2) and to Pond Omega in 1975 (0 .24 liter m -2 ) . The wind moved thefloating oil to the edge of the ponds and some oil floated for about amonth. By the end of the summer all the oil was trapped along the pondedge and much had sunk . No oil left the pond during runoff the next springbut oil was still visible at the edge . After several years, at least half the oilwas still present and was covered by debris and organic matter ; it stillwelled up and created a scum when disturbed .
The only physical-chemical change caused by the oil was a slightdecrease in the oxygen concentration of the shallow pond margins . Thiswas likely the result of reduced diffusion and water movement . There wasno change in the pH, alkalinity, or nutrient concentrations .
At least half of the oil was lost during the first year after the spill,mostly by volatilization and chemical degradation ; there was also a smalleffect of biological degradation . In Pond E, for example, the oil remainingafter five years had virtually the same chemical composition, but there wassome loss of those hydrocarbon compounds with fewer than 13 carbonatoms (presumably from biological degradation) .
Oil Spill Effects
405

406
R. J. Barsdate et al .
The number of bacteria in the plankton was unaffected by theaddition of oil but their activity increased during the first year . Two yearsafter the spill in Pond Omega, there were no differences in the types andnumbers of bacteria in the oiled and unoiled parts of the pond (plate counttechnique, nutrient and oil agar) . Thus it appears that a single addition ofcrude oil briefly stimulated microbial activity but the microflora wereback to control-pond levels within 2 years .
The effect of oil on benthic algae was only briefly studied ; 1 year afterthe spill the photosynthesis in Pond E was 50% that of a control pond . Incontrast, the phytoplankton algae were intensively studied and we foundthat the water-soluble fractionof the oil strone0y reduced photosyntbcs _for several days . The amount of algae, however, did not change as a resultof the spill and productivity reached normal levels within several months .
The added oil drastically changed the species composition of theplanktonic algae in both the ponds and in experimental chambers . Thischange, a rapid replacement of the cryptophyte Rhodomonas by thechrytophyte Uroglena, continued for 6 years . It is likely that theRhodomonas are eliminated because the zooplankton are killed ;experimental removal of the zooplankton caused the same elimination . Itis not known whether the algae responded to a release of grazing pressureor to a cessation of the zooplankton's recycling of nutrients .
No damage to the vascular plants was observed in the ponds duringthe first year, but growth of Carex aquatilis was reduced in later years .Much of this reduction was caused when new leaves encountered a barrierof floating oil .
In experiments in the laboratory, the fairyshrimps were most sensitiveto oil, Daphnia were next, Heterocope next, and the Cyclops were leastsensitive. This sequence duplicates the field results ; all the Daphnia andfairyshrimps were killed immediately by the whole-pond treatments anddid not return for 7 years . The less-sensitive copepods returned within ayear .
In laboratory tests, aquatic insects and other invertebrates were notsensitive to oil . In the field, the spill had no major effect on the numbersand production of chironomids, but there were some minor effects on theiremergence. One genus, Tanytarsus, was nearly eliminated from the ponds .Beetles, caddisflies, stoneflies, and snails were also drastically affected;most of these animals live only in the plant beds and may have becometrapped in the oil on plant stems and in the floating oil . These insects werestill absent in Pond E 6 years after the spill .
When the oil spills are relatively light, as in these experiments, thenthe best treatment would be to absorb the floating oil and perhaps to floodthe marsh to float oil away from the littoral plants . The biota of ponds willrecover within a few years with this simple treatment . More drastic clean-up measures will induce greater changes into the ecology of ponds .