Embed Size (px)
Citation preview

9
LLNL Environmental Report for 1999 9-1
Ground Water Monitoring
Eric ChristoffersonRichard A. Brown Sandra Mathews
Introduction
Lawrence Livermore National Laboratory regularly samples and analyzes groundwaters in the Livermore Valley and in the Altamont Hills. LLNL maintains multipleground water monitoring programs to comply fully with environmental regulations,U.S. Department of Energy (DOE) orders, and the requirements of the Ground WaterProtection Management Program (GWPMP). The objectives of the ground watermonitoring programs described in this chapter are to measure compliance with wastedischarge requirements and post-closure plans and to assess the impact, if any, ofcurrent LLNL operations on ground water resources.
DOE Order 5400.1 and the to-be-promulgated 10 CFR 834 require all DOE facilities toprepare a GWPMP that describes the site’s ground water regime, areas of knowncontamination, remediation activities, programs to monitor the ground water, andthe means to monitor and control potential sources of ground water contamination.Considerable ground water monitoring and remediation, discussed in Chapter 8, arecarried out under Comprehensive Environmental Response, Compensation andLiability Act (CERCLA) restoration efforts. Soil and sediment surveillance monitoringunder the GWPMP is described in Chapter 10. Additional programs address thesanitary sewer system, building drains, and underground storage tanks.
Surveillance Monitoring
Ground water monitoring at LLNL complies with DOE Order 5400.1, which affirmsDOE’s commitment to protect the environment. LLNL conducts surveillance moni-toring of ground water in the Livermore Valley and in the Altamont Hills throughnetworks of wells and springs that include private wells off site and DOE CERCLAwells on site. The two monitored areas are not connected hydrologically; they areseparated by a major drainage divide and numerous faults. The Livermore site in theLivermore Valley drains to San Francisco Bay via Alameda Creek. Most of Site 300drains to the San Joaquin River Basin via Corral Hollow Creek, with a small unde-veloped portion in the north draining to the north and east toward Tracy. In order tomaintain a comprehensive, cost-effective monitoring program, LLNL determines the

9 Ground Water Monitoring
9-2 LLNL Environmental Report for 1999
number and locations of surveillance wells, the analytes to be monitored, the frequencyof sampling, and the analytical methods to be used.
A wide range of analytes is monitored to assess the impact, if any, of current LLNLoperations on local water resources. Because surveillance monitoring is geared todetecting substances at very low concentrations in ground water, it can detectcontamination before it significantly impacts ground water resources. Wells at theLivermore site, in the Livermore Valley, and at Site 300 in the Altamont Hills areincluded in LLNL’s surveillance monitoring plan. Historically, the surveillance andcompliance monitoring programs have detected relatively elevated concentrations ofvarious metals, nitrate, perchlorate, and depleted uranium (uranium-238) in groundwater at Site 300. Subsequent CERCLA studies have linked several of these contam-inants to past operations, while others are the objects of continuing study. Present-dayadministrative, engineering, and maintenance controls in place at both LLNL sites arespecifically tailored to prevent damage to the environment.
Compliance Monitoring
The Compliance Ground Water Monitoring Program complies with numerous federaland state controls (see Chapter 2, Table 2-4, for a summary of LLNL permits).Compliance monitoring of ground water is conducted at Site 300 to satisfy state-issuedpermits associated with closed landfills containing solid wastes and with continuingdischarges of liquid waste to surface impoundments, sewage ponds, and percolationpits. Ground water compliance monitoring at Site 300 is specified in Waste DischargeRequirement (WDR) orders issued by the Central Valley Regional Water QualityControl Board (CVRWQCB) and in landfill closure and postclosure monitoring plans.The WDRs and postclosure plans specify wells and effluents to be monitored, constitu-ents of concern (COCs) to be measured, measurement frequency, inspections to beconducted, and the frequency and form of required reports. These monitoring pro-grams include quarterly and semiannual monitoring of ground water, monitoring ofvarious influent waste streams, and visual inspections. LLNL conducts additionaloperational monitoring of wastewater effluents discharged to surface impoundmentsand sewage evaporation and percolation ponds to comply with WDRs issued underCalifornia’s Porter-Cologne Water Quality Control Act. Quarterly and annual writtenreports of analytical results, inspection findings, and maintenance activities are requiredfor each monitoring network.
Table 9-1 in the Data Supplement shows the analytical methods and reporting limits forinorganic constituents (including specific radioisotopes analyzed by alpha spectroscopyand other sensitive methods), organic constituents, and radioisotopes in ground water.

Ground Water Monitoring 9
LLNL Environmental Report for 1999 9-3
Livermore Site and Environs
Livermore Valley
LLNL has monitored tritium in water hydrologically downgradient of the Livermoresite since 1988. Tritium is potentially the most mobile ground water contaminantemanating from LLNL. Rain and storm water runoff in the Livermore Valley, whichrecharges local aquifers, contains small amounts of tritium from natural sources, pastworldwide atmospheric nuclear weapons tests, and atmospheric emissions from LLNL.(See Chapters 4, 5, and 7 for further discussion of air emissions, rain, and storm waterrunoff.) Ground water samples were obtained during 1999 from 18 of 21 wells in theLivermore Valley (see Figure 9-1) and measured for tritium activity.
Ground water is recharged at the Livermore site from arroyos by rainfall. Rechargeenters primarily through the arroyos (see also Chapter 7). Ground water flow at theLivermore site, which is generally westward, is discussed generally in Chapter 1 and
Shadow Cliffs
Zone 7Ground waterbasin boundary
Alluvialplain
Livermore
LivermoreAvenue
Santa RitaRoad
Pleasanton
Stanley Boulevard16L7
2R111B1
1H3
1R212A2
1P3
16L5
HopyardRoad
N
84
Monitoring well
Ground watersamples not provided
Scale: Kilometers
0 2 4
9M29M3
8P1
16B1
12G118A1
9Q17P3
8F17C2
004
1P2
12D2
17D2
East Avenue
84
LLNLLLNLLLNL
580580
680
680
Figure 9-1. Locations of off-site tritium monitoring wells in the Livermore Valley.

9 Ground Water Monitoring
9-4 LLNL Environmental Report for 1999
in detail in the CERCLA Remedial Investigation Report for the LLNL Livermore Site(Thorpe et al. 1990) and the annual LLNL Ground Water Project reports (Aaronset al. 2000).
Livermore Site Perimeter
LLNL designed a surveillance monitoring program to complement the LivermoreGround Water Project (discussed in Chapter 8). The intent of this network is tomonitor for possible contaminants other than volatile organic compounds (VOCs),which are handled under the Livermore Site Ground Water Project. The perimeterportion of this surveillance ground water monitoring network makes use of threebackground monitoring wells near the eastern boundary of the site and seven westernperimeter monitoring wells, located near the western boundary (see Figure 9-2). Theseseven wells located in the regions of Treatment Facilities A, B, and C (see Figure 8-1)meet the requirements of DOE Order 5400.1. These western perimeter wells monitorthe uppermost aquifers for COCs that are outside, but very near to, the areas whereground water is being treated.
The screened interval for each surveillance monitoring well is in the uppermost satu-rated aquifer (or aquifers) at that well location. As discussed in Chapter 8, the alluvialsediments have been divided into seven hydrostratigraphic units (HSUs). HSUs aredescribed in Chapter 8 and shown in Figure 8-1.
Two of the background wells, W-008 (screened in HSUs 3A/3B) and W-221 (screenedin HSU 3A), were sampled and analyzed once for semivolatile organic compounds(SVOCs), semiannually for minerals, and quarterly for trace metals and most radioactiveconstituents in order to obtain sufficient data for statistical analyses. Background wellW-017 (screened in the deeper HSU 5) was sampled and analyzed once during the thirdquarter for trace metals and radioactive constituents. The seven western perimeterwells screened in shallower HSUs 1B and 2 were sampled and analyzed annually fornonradioactive constituents and quarterly for many radioactive constituents. Each wellwas sampled and the water analyzed for metals and minerals, herbicides, gross alphaand beta, tritium, and other radioisotopes. Routine surveillance monitoring data for1999 are presented in the Data Supplement (Tables 9-2 through 9-11). These monitoringresults help establish baseline conditions for future monitoring and detect the presenceof any COCs that may adversely affect public health or the environment.

Ground Water Monitoring 9
LLNL Environmental Report for 1999 9-5
W-306
East Avenue
Arroyo Seco
Scale: Meters
0 150 300
Monitoring well sampled in 1999Old waste disposal areafrom remedial investigation(Thorpe et al. 1990)Current hazardous/mixed-waste storage
LLNL perimeter
Radioactive material
N
Taxi stripTaxi strip
East YrafficCircle Landfill
DWTFDWTF
East TrafficCircle Landfill
Building 322
Patterson Pass Road
Gre
envi
lle R
oad
W-008
W-221W-221
Vas
co R
oad
W-373
W-556W-556
W-1012W-1012
W-121
14B1
DowngradientWells
Upgradientwells
Upgradientwells
W-008W-593W-593
W-221
W-359
W-270W-270
W-359
W-148W-148SIP-331-001SIP-331-001
W-305W-305
W-204W-204
W-363W-363
W-017
W-1308W-1308
W-119W-119
W-1306W-1306
W-906W-906
W-1303W-1303
W-270GSW-011GSW-011
W-373
W-1012
Downgradientwells
W-151 W-571
RhonewoodSubdivision
W-017
Building 322Buildings 331, 332
Buildings331, 332
W-307
W-226
Building 253
W-307
W-226
Building 253
Building 514
Building612
Building612
Figure 9-2. Locations of routine surveillance ground water monitoring wells at the Livermore site.
Livermore Site
Livermore site (interior) ground water sampling locations include areas where releasesto ground may have occurred in the recent past or where previously detected COCshave low concentrations that do not require CERCLA remedial action. Monitoring wellsscreened in the uppermost aquifers are situated downgradient from, and as near aspossible to, the potential release locations.
The Taxi Strip Area and the East Traffic Circle Landfill are two potential sources ofground water contamination for which surveillance monitoring wells were added to thesurveillance monitoring network in 1997 (see Figure 9-2). Ground water samples frommonitoring wells screened in HSUs 2 and 3A downgradient from the Taxi Strip Areaand East Traffic Circle Landfill were analyzed for americium, plutonium, thorium,

9 Ground Water Monitoring
9-6 LLNL Environmental Report for 1999
uranium, gross alpha and beta radiation, radium-226, radium-228, tritium, metals,polychlorinated biphenyls (PCBs), and general minerals. The locations of these wells—W-204, W-363, W-119, W-906, W-1303, W-1306, and W-1308—are shown in Figure 9-2.All surveillance monitoring analytical data for the Taxi Strip Area and the East TrafficCircle Landfill are presented in Data Supplement Tables 9-12 through 9-18.
Another potential source of ground water contamination is the Decontamination andWaste Treatment Facility (DWTF) in the northeastern portion of LLNL. Ground watersamples were obtained downgradient from this facility from well W-593 during 1999and were analyzed for the same suite of analytes as the East Traffic Circle Landfill andTaxi Strip Area (see Data Supplement Table 9-19).
The hazardous waste/mixed waste storage facilities around Buildings 514 and 612 aremonitored by wells W-270, W-359, and GSW-011. These wells were sampled andanalyzed for trace metals and radioactive constituents in 1999. In addition, groundwater samples from well W-359 were also analyzed for minerals and for SVOCs. Allsurveillance monitoring analytical data from the Hazardous Waste Management Areaare presented in Data Supplement Tables 9-20 through 9-22.
Ground water samples were also obtained downgradient from areas where minorreleases of metals to ground have occurred. Samples were obtained from monitoringwell W-307 (screened in HSU 1B), downgradient from a fume hood vent on the roofof Building 322. Soil samples obtained from the area show elevated concentrations(in comparison with LLNL’s site background levels) of chromium, copper, lead,nickel, zinc, and occasionally other metals. LLNL removed contaminated soils nearBuilding 322 in 1999 and replaced them with clean fill. The area was then paved over,making it less likely that metals will migrate from the site. Analytical results fordissolved metals in 1999 ground water samples are presented in Data SupplementTable 9-23.
Ground water samples were also obtained downgradient from a location wheresediments containing metals (including cadmium, copper, lead, mercury, and zinc) hadaccumulated in a storm water catch basin near Building 253 (Jackson 1997). Theseground water samples were obtained from monitoring wells W-226 and W-306 screenedin HSUs 1B and 2, respectively. Analytical results for dissolved metals in these samplesare presented in Data Supplement Tables 9-24 and 9-25.
The additional surveillance ground water sampling locations for 1999 surround the areawhere the Plutonium Facility (Building 332) and the Tritium Facility (Building 331) arelocated (see Figure 9-2). Possible contaminants include plutonium-239 and americium-241from the Plutonium Facility and tritium from the Tritium Facility. Both plutonium and

Ground Water Monitoring 9
LLNL Environmental Report for 1999 9-7
americium are more likely to bind to the soils rather than to migrate into the ground water.Tritium, on the other hand, is likely to migrate into ground water if spilled in sufficientquantities. Upgradient of these facilities, well W-305 is screened in HSU 2; downgradientwell W-148 is screened in HSU 1B; and SIP-331-001 is screened in HSU 2. Analyticalresults are presented in Data Supplement Tables 9-26 through 9-28.
Site 300
For surveillance and compliance ground water monitoring at Site 300, LLNL uses DOECERCLA wells on site and private wells and springs off site. Representative groundwater samples are obtained at least once per year; they are routinely measured forvarious elements (primarily metals), a wide range of organic compounds, nitrate,general radioactivity (gross alpha and gross beta), uranium activity, and tritium activity.Typically, Environmental Protection Agency- (EPA-) approved analytical methods areused because they are both accurate and sensitive. (See Data Supplement Table 9-1 for acomplete list of COCs and for the EPA or other standard analytical methods used tomeasure them.)
Figure 9-3 shows the ground water sampling locations with wells and springs atSite 300. Although ground water from the uppermost water-bearing zone is the targetof most of the sampling, at several locations up to three vertically separated water-bearing zones are sampled by means of multiple-completion installations fitted withBarcad devices. Barcads are identified in Figure 9-3 by the capital letters A, B, and C atthe end of a monitoring installation’s identifier code. (“A” is assigned to the Barcad thatsamples the deepest of three, or deeper of two, water-bearing zones.)
Twelve ground water monitoring locations are off site. Two are springs, identified asMUL2 and VIE1, which are located near the northern boundary of Site 300. Off-sitesurveillance well VIE2 (not shown in Figure 9-3) is located 6 km west of Site 300 in theupper reaches of the Livermore Valley watershed. Nine off-site surveillance locationsare wells located near the southern boundary of Site 300 in, or adjacent to, the CorralHollow Creek floodplain.
On-site wells that were installed for CERCLA characterization studies during the 1980scontinue to be used to monitor several former landfills, a former open-air burn pit, twoconnected surface water impoundments, and two connected sewer ponds. The formerlandfills—which are identified as Pit 1, Pit 2, Pit 7 Complex, Pit 8, and Pit 9—are locatedin the Elk Ravine drainage area, while Pit 6, the former burn pit, the two surface

9 Ground Water Monitoring
9-8 LLNL Environmental Report for 1999
Ala
med
a C
ount
y
San
Joa
quin
Cou
nty
VIE26 km
MUL12.4 km
MUL2 (spring 13)
STONEHAM1
Corral Hollow Road
Spring sampling location
Well or Barcad samplinglocation
Closed landfill (Pit)
Site 300 perimeter
CARNRW2
CON1GALLO1
0 1
Scale: Kilometers
0.5
CARNRW1
CON2
Tesla Road
W35A-04Well 20
Well 18
NC7-69
NC2-11D
NC2-12D
K1-02A,B
K2-04S
K2-04D
K2-01A,B,C
Process waterimpoundments
HE burn pit SewagepondsPit 6
Pit 7 Complex
Pit 9
K2-02A,B
Pit 1
N
VIE1 (spring)
Pit 2
CDF1
Elk Ravinedrainage area
Corral Hollow Creekdrainage area
K7-07
K1-01C
channel
dividedivide
812CRK (spring 6)
NC2-07
NC7-61Pit 8
Figure 9-3. Locations of surveillance ground water wells, Barcads, and springs atSite 300.
impoundments, and the sewer ponds are located in the Corral Hollow Creek drainagearea. Two on-site water supply wells, well 18 and well 20, are also used for surveillancemonitoring purposes. Well 20 provides potable water to the site. Well 18 is maintainedas a standby supply well.
Brief descriptions of the Site 300 ground water monitoring networks are given below.Networks within the Elk ravine drainage area are described first, followed by thenetworks in the Corral Hollow creek drainage area. CERCLA wells within Site 300 have

Ground Water Monitoring 9
LLNL Environmental Report for 1999 9-9
been selected for compliance and surveillance monitoring use based on their locationsand our general understanding of local geologic and hydrogeologic conditions atSite 300 as described in Webster-Scholten 1994 (see also Chapter 8 for a summary ofSite 300 stratigraphy and hydrogeology.) Ground water measurements made during1999 that have not been published elsewhere are listed in tables in the Data Supplementthat accompanies this volume. References to the publications that contain the remainingground water data collected during 1999 are cited herein.
Elk Ravine Drainage Area
The Elk Ravine drainage area, a branch of the Corral Hollow Creek drainage system,includes most of northern Site 300 (see Figure 9-3). Storm water runoff from closedlandfills within the Elk Ravine drainage area (Pits 1–5 and 7–9) collects in arroyosand quickly infiltrates into the ground. Ground water from wells that lie within theElk Ravine drainage area are monitored for COCs because of the system of surfaceand underground flows that connect the entire Elk Ravine drainage area. The areacontains eight of the nine closed landfills (Pits 1–5 and 7–9) and a number of firing tableswhere explosives tests have been conducted. The following descriptions of monitoringnetworks within Elk Ravine begin with the headwaters area and proceed downstream.(See Chapter 8 for a review of ground water contamination in this drainage area asdetermined from numerous CERCLA investigations.)
Pit 7 Complex
Monitoring requirements for the closed Pit 7 landfill in the Elk Ravine drainage area arespecified in Waste Discharge Requirements Order 93-100 (WDR 93-100) administered bythe CVRWQCB (1993 and 1998) and in LLNL Site 300 RCRA Closure and Post-ClosurePlans— Landfill Pits 1 and 7 (Rogers/Pacific Corporation 1990).
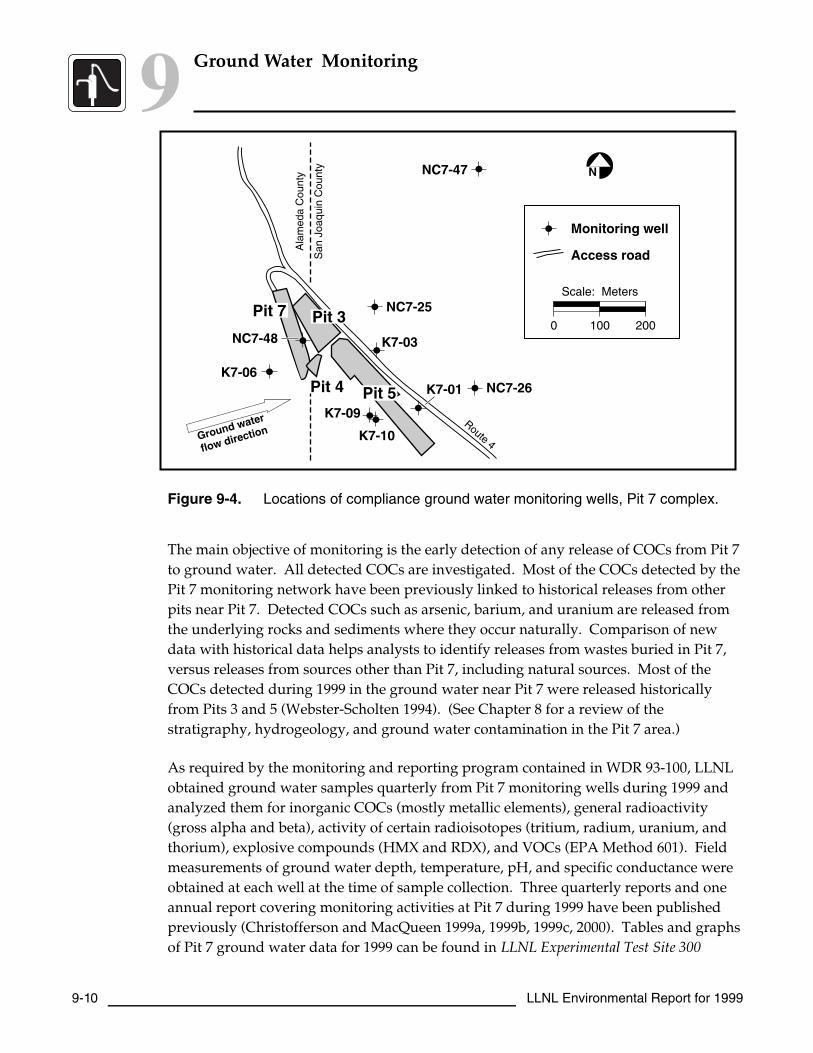
The Pit 7 complex area is located at an elevation of about 400 m in the most elevatedportion of the Elk Ravine drainage area. The complex comprises four adjacent landfillsidentified as Pits 3, 4, 5, and 7 (see Figure 9-4). From 1963 to 1988, the landfills receivedwaste gravels and debris from hydrodynamic tests of explosive devices conducted onfiring tables at Site 300. The gravels contained concrete, cable, plastic, wood, tritium,depleted uranium (uranium-238), beryllium, lead, and other metals in trace amounts. In1988, 9440 m3 of gravel were removed from six firing tables at Site 300 and placed inPit 7 (Lamarre and Taffet 1989). These were the last solid wastes to be placed in alandfill at Site 300.
9 Ground Water Monitoring
9-10 LLNL Environmental Report for 1999
Pit 3Pit 7 NC7-25
Pit 4
K7-10
K7-03
NC7-47
K7-06NC7-26
Monitoring well
Access road
Pit 5
Route 4
NC7-48
K7-01
K7-09
Ala
med
a C
ount
y
San
Joa
quin
Cou
nty
N
0 200100
Scale: Meters
Ground water
flow direction
Figure 9-4. Locations of compliance ground water monitoring wells, Pit 7 complex.
The main objective of monitoring is the early detection of any release of COCs from Pit 7to ground water. All detected COCs are investigated. Most of the COCs detected by thePit 7 monitoring network have been previously linked to historical releases from otherpits near Pit 7. Detected COCs such as arsenic, barium, and uranium are released fromthe underlying rocks and sediments where they occur naturally. Comparison of newdata with historical data helps analysts to identify releases from wastes buried in Pit 7,versus releases from sources other than Pit 7, including natural sources. Most of theCOCs detected during 1999 in the ground water near Pit 7 were released historicallyfrom Pits 3 and 5 (Webster-Scholten 1994). (See Chapter 8 for a review of thestratigraphy, hydrogeology, and ground water contamination in the Pit 7 area.)
As required by the monitoring and reporting program contained in WDR 93-100, LLNLobtained ground water samples quarterly from Pit 7 monitoring wells during 1999 andanalyzed them for inorganic COCs (mostly metallic elements), general radioactivity(gross alpha and beta), activity of certain radioisotopes (tritium, radium, uranium, andthorium), explosive compounds (HMX and RDX), and VOCs (EPA Method 601). Fieldmeasurements of ground water depth, temperature, pH, and specific conductance wereobtained at each well at the time of sample collection. Three quarterly reports and oneannual report covering monitoring activities at Pit 7 during 1999 have been publishedpreviously (Christofferson and MacQueen 1999a, 1999b, 1999c, 2000). Tables and graphsof Pit 7 ground water data for 1999 can be found in LLNL Experimental Test Site 300

Ground Water Monitoring 9
LLNL Environmental Report for 1999 9-11
Compliance Monitoring Program for RCRA-Closed Landfill Pits 1 and 7, Annual Report for1999 (Christofferson and MacQueen 2000).
Elk Ravine
As planned, ground water samples were obtained twice (semiannually) during 1999from the widespread Elk Ravine surveillance monitoring network. Samples wereanalyzed for inorganic COCs (mostly metallic elements), general radioactivity (grossalpha and beta), tritium and uranium activity, explosive compounds (HMX and RDX),and VOCs (EPA Method 601).
Pit 2
The closed Pit 2 landfill lies in the upper portion of Elk Ravine, about 320 m above sealevel (Figures 9-3 and 9-5). The landfill primarily contains gravels and debris fromhydrodynamic tests of explosive devices conducted at the Building 801 and 802 firingtables. The buried waste material contains depleted uranium (uranium-238), and traceamounts of beryllium, thorium, and (possibly) tritium.
As planned for surveillance purposes, LLNL obtained ground water samples twice(semiannually) during 1999 from the Pit 2 monitoring network (comprising mostlyBarcad installations) and analyzed them for inorganic COCs (mostly metallic elements),general radioactivity (gross alpha and beta), activity of certain radioisotopes (tritiumand uranium), and explosive compounds (HMX and RDX).
Pit 1
Monitoring requirements for the closed Pit 1 landfill are specified in Waste DischargeRequirements Order 93-100 (WDR 93-100) administered by the CVRWQCB (1993 and1998) and in LLNL Site 300 RCRA Closure and Post-Closure Plans— Landfill Pits 1 and 7(Rogers/Pacific Corporation 1990).
Pit 1 lies in the Elk Ravine drainage area about 330 m above sea level. The ResourceConservation and Recovery Act (RCRA)-closed Pit 1 landfill and the positions of theeight ground water wells used to monitor it are shown in Figure 9-5.
As required by the monitoring and reporting program contained in WDR 93-100, LLNLobtained ground water samples from Pit 1 monitoring wells every quarter during 1999.Samples were analyzed for inorganic COCs (mostly metallic elements), generalradioactivity (gross alpha and beta), activity of certain radioisotopes (tritium, radium,uranium, and thorium), explosive compounds (HMX and RDX), and VOCs (EPAMethod 601). Every other quarter, analyses were conducted for an additional seven

9 Ground Water Monitoring
9-12 LLNL Environmental Report for 1999
Route 3
Doall Road
Advanced TestAccelerator
K2-01A, B
Pit 2
Pit 1
K1-01C
K1-07
K1-08
K1-09 K1-05
K1-04
K1-03
K1-02A, B
K2-02A, B
N
Monitoring wellor Barcad
Building
Access road
Scale: Meters
2001000
Ground water
flow direction
Figure 9-5. Locations of Pit 2 surveillance Barcads (K1-02A, K2-01A, K2-01B, andK2-02A) and surveillance well K2-02B, and Pit 1 compliance groundwater monitoring wells (K1-01C, -07, -02B, -03, -04, -05, -08, and -09).
elements. Additional annual analyses were conducted on fourth-quarter samples forextractable organics (EPA Method 625), pesticides and PCBs (EPA Method 608), andherbicides (EPA Method 615). Field measurements of ground water depth, temperature,pH, and specific conductance were obtained at each well at the time of quarterly samplecollection. Three quarterly reports and one annual report covering monitoring activitiesat Pit 1 during 1999 have been published previously (Christofferson and MacQueen1999a, 1999b, 1999c, 2000). Tables and graphs containing Pit 1 ground water data for 1999can be found in LLNL Experimental Test Site 300 Compliance Monitoring Program for RCRA-Closed Landfill Pits 1 and 7, Annual Report for 1999 (Christofferson and MacQueen 2000).
Pit 8
The closed Pit 8 landfill is located in the Elk Ravine drainage area adjacent to theBuilding 801 firing table, where explosives experiments were conducted from 1958 to1974. Approximately 40 m3 of untreated debris from the firing table were placed inthe pit during that time. Buried debris may contain trace amounts of tritium, depleteduranium (uranium-238), lead, and beryllium.
Figure 9-6 shows the Building 801 and Pit 8 areas and the locations of the monitoringwells. The pit is located in a narrow ravine within the Elk Ravine drainage areaabout 350 m above sea level. Chemical analysis of soil and rock samples obtainedfrom this area during CERCLA remedial investigations detected no COCs abovebackground concentrations (Webster-Scholten 1994). However, low concentrations

Ground Water Monitoring 9
LLNL Environmental Report for 1999 9-13
of trichloroethylene (TCE) have been detected in ground water samples from Pit 8surveillance monitoring wells, including upgradient well K8-01, since 1987. Previousremedial investigation links the TCE to a dry well near Building 801 that was once usedto dispose liquid wastes (Webster-Scholten 1994).
K8-01
K8-03B
NC2-11D
Firing table gravel
K8-02B
Storagearea
Route 3
Pit 8
N
K8-05
K8-04
Closed Pit 8 landfill
Active monitoring well
Inactive monitoring well
Scale: Meters
0 10050
Building 801 complex
Figure 9-6. Locations of surveillance ground water monitoring wells, Pit 8, 1999.
Because of construction activities in the vicinity of Pit 8, ground water samples could beobtained from only two surveillance monitoring wells during 1999. Ground watersamples from wells K8-01 and K8-02B were analyzed for inorganic COCs (mostlymetallic elements), general radioactivity (gross alpha and beta), activity of certainradioisotopes (tritium and uranium), explosive compounds (HMX and RDX), and VOCs(EPA Method 601).
Pit 9
The Pit 9 landfill is centrally located within Site 300 about 340 m above sea level. Similarto the other closed landfills in Elk Ravine, the closed Pit 9 landfill contains firing tablegravels and debris from explosives experiments conducted on the Building 845 firingtable nearby.

9 Ground Water Monitoring
9-14 LLNL Environmental Report for 1999
Figure 9-7 shows the locations of the four surveillance wells used to monitor the groundwater in the vicinity of Pit 9. Ground water flows east-northeasterly beneath Pit 9 in theNeroly lower blue sandstone unit (Tnbs1). The water table lies about 40 m below theground surface at Pit 9. Monitoring well K9-02 is hydrologically upgradient from Pit 9,and wells K9-01, K9-03, and K9-04 are downgradient.
K9-04
K9-01
K9-02
K9-03
Route 3Building 845
Pit 9
N
Monitoring well
Building
Access road
500 25
Scale: Meters
Figure 9-7. Locations of surveillance ground water monitoring wells, Pit 9, 1999.
As planned for surveillance purposes, the four Pit 9 monitoring wells were sampledonce (annually) during 1999. Ground water samples from the four wells were analyzedfor inorganic COCs (mostly metallic elements), general radioactivity (gross alpha andbeta), activity of certain radioisotopes (tritium and uranium), explosive compounds(HMX and RDX), VOCs (EPA Method 601), and extractable organics (EPA Method 625).
Corral Hollow Creek Drainage Area
This section describes the ground water monitoring networks that are located in thesouthern half of Site 300 where runoff and ground water flow south to Corral Hollowcreek. (See Chapter 8 for a review of ground water contamination in this drainage areaas determined from numerous CERCLA investigations.)
Pit 6
Compliance monitoring requirements for the closed Pit 6 landfill in the Corral HollowCreek drainage area are specified in the Post-Closure Plan for the Pit 6 Landfill Operable UnitLawrence Livermore National Laboratory Site 300 (Ferry et al. 1998). The closed Pit 6 landfillcovers an area of about 1 hectare (2.5 acres). Its elevation is approximately 215 m above

Ground Water Monitoring 9
LLNL Environmental Report for 1999 9-15
sea level. From 1964 to 1973, approximately 1500 m3 of solid wastes were buried there innine separate trenches. The trenches were not lined, consistent with historical disposalpractices. Three larger trenches contain 1300 m3 of solid waste that includes emptydrums, glove boxes, lumber, ducting, and capacitors. Six smaller trenches contain 230 m3
of biomedical waste, including animal carcasses and animal waste. Minor releases ofVOCs—primarily the solvent TCE, and tritium—occurred prior to closure. During 1997,a multilayered cap was constructed over all the trenches, and a drainage control systemwas installed around the cap. The cap and the drainage control system are engineered tokeep rainwater from contacting the buried waste (Ferry et al. 1998).
The Pit 6 disposal trenches were constructed in Quaternary terrace deposits (Qt) aboveand north of the Corral Hollow Creek flood plain. Surface runoff from the pit areaflows southward to Corral Hollow Creek. The Carnegie-Corral Hollow Fault zoneextends beneath the southern third of Pit 6. The northern limit of the fault zone isshown in Figure 9-8. Beneath the northern two-thirds of Pit 6, ground water flowssouth-southeast, following the inclination (dip) of the underlying sedimentary rocks.Ground water seepage velocities are less than 10 m/y. Depths to the water table rangefrom 10−20 m. Beneath the southern third of Pit 6, a trough containing terrace gravelwithin the fault zone provides a channel for ground water to flow southeast, parallel tothe Site 300 boundary fence (Webster-Scholten 1994). (See Chapter 8 for a review of thestratigraphy, hydrogeology, and ground water contamination in the Pit 6 area.)
Two ground water monitoring programs were implemented at the Pit 6 landfill during1998 to ensure compliance with all regulations: (1) The Detection Monitoring Program(DMP), designed to detect any new release of COCs to ground water from wastes buriedin the Pit 6 landfill, and (2) the Corrective Action Monitoring Program (CAMP), whichoperates under CERCLA, and monitors the movement of existing releases (see Chapter 8for a summary of CAMP monitoring results for Pit 6). Twenty-four COCs, includingVOCs and radioisotopes, are monitored in ground water near Pit 6 (Ferry et al. 1998).Figure 9-8 shows the locations of Pit 6 and the wells used to monitor ground water there.
As required by the monitoring program contained in the postclosure plan, ground waterat the Pit 6 monitoring wells was sampled quarterly during 1999. Samples were analyzedfor inorganic COCs (mostly metals), general radioactivity (gross alpha and beta), tritiumactivity, uranium activity, VOCs (EPA Method 624), extractable organics (EPA Method625), pesticides and PCBs (EPA Method 608), and herbicides (EPA Method 615). Fieldmeasurements of ground water depth, temperature, pH, and specific conductance wereobtained at each well at the time of sample collection. Three quarterly reports and oneannual report covering monitoring activities at Pit 6 during 1999 have been publishedpreviously (Christofferson and Taffet 1999a, 1999b, 1999c, 2000). Tables listing the 1999ground water data for Pit 6 can be found in Christofferson and Taffet 2000.

9 Ground Water Monitoring
9-16 LLNL Environmental Report for 1999
K6-04
K6-15
K6-03
EP6-07
BC6-10
K6-26
K6-24K6-27
K6-18
K6-25K6-14
BC6-13K6-17 K6-23
W-33C-01
BC6-11
K6-16K6-22
K6-21
Corral Hollow Road
Site 300 boundary fence
K6-32
K6-33
K6-01
EP6-09
EP6-06
BC6-12
EP6-08
K6-01SK6-19
Scale: Meters
0 25 50
Pit 6 cover
Monitoring wells
Upgradient
Detection
Corrective action
Building, trailer, or canopy
Disposal trenches and pits
Approximate northern limit of fault zone
N
ORAD-98-0003
Figure 9-8. Locations of Pit 6 ground water monitoring wells.
HE Process Area Closed Burn Pits
The former High-Explosives (HE) Open Burn Treatment Facility, part of the Building 829Complex, is located on a ridge within the southeast portion of Site 300 at an elevation ofabout 320 m (1050 ft) (see Figure 9-9). The facility included three shallow unlined pitsconstructed in unconsolidated sediments that cap the ridge (Tps formation). The formerburn facility was covered with an impervious cap during 1998 following RCRA guidance.The facility was used to thermally treat explosives waste generated by researchoperations at Site 300. Surface water drains southward from the facility toward CorralHollow Creek. The nearest site boundary lies about 1.6 km (4500 ft) to the south

Ground Water Monitoring 9
LLNL Environmental Report for 1999 9-17
800
900
828
829
827
900Ground elevation contour(ft above mean sea level)
Monitoring wells
Scale: Meters
0 200100
W-827-05
W-829-06
W-829-22W-829-08
Closed BurnTreatmentFacility Area
Complex
W-829-15 W-827-04
N
Figure 9-9. Locations of monitoring wells in Building 829 closed burn facility area.
at Corral Hollow Road. Stratified rocks of the Neroly (Tn) formation underlie thefacility and dip southeasterly. Two water-bearing zones exist at different depthsbeneath the facility. The shallower zone, at a depth of about 30 m (100 ft), is perchedwithin the Neroly upper siltstone/claystone aquitard (Tnsc2). The deeper zone, at adepth of about 120 m (400 ft), represents a regional aquifer within the Neroly uppersandstone member (Tnbs2). (See Chapter 8 for a review of the stratigraphy,hydrogeology, and ground water contamination in this area.)
Based on ground water samples recovered from boreholes, previous CERCLA remedialinvestigations determined that the perched ground water beneath the burn facility wascontaminated with VOCs, primarily TCE, but that the deeper regional aquifer was freeof any contamination stemming from operation of the facility (Webster-Scholten 1994).

9 Ground Water Monitoring
9-18 LLNL Environmental Report for 1999
Subsequent assays of soil samples obtained from shallow boreholes prior to closurerevealed that low concentrations of HE compounds, VOCs, and metals exist beneath theburn pits (Mathews and Taffet 1997). Conservative transport modeling indicates thatthe shallow contamination will not adversely impact the regional aquifer, primarilybecause its downward movement is blocked by a 100-m-thick intervening aquitard.However, beginning in 1999, LLNL implemented the intensive ground water moni-toring program for this area described in the post-closure plan (Mathews and Taffet1997) to track the fate of contaminants in the perched water-bearing zone and to watchthe deep regional aquifer for the appearance of any potential contaminants from theclosed burn facility.
Figure 9-9 shows the locations of the closed burn treatment facility area and the six wellsused to monitor the ground water. Two wells, W-829-06 and W–829-08, are screened inthe perched water-bearing zone beneath the former burn facility. The remaining fourwells are screened in the deep regional aquifer downgradient of the closed facility.During 1999, quarterly samples were obtained from five of the six monitoring wells.One of the deep wells, W-829-04, was dry during 1999. Ground water samples from thewells screened in the deep regional aquifer were analyzed quarterly for inorganic COCs(mostly metals), general minerals, explosive compounds (HMX, RDX, and TNT), VOCs(EPA Method 624), extractable organics (EPA Method 625), pesticides and PCBs (EPAMethod 608), general radioactivity (gross alpha and beta), activity of certain radioiso-topes (tritium, radium, and uranium), total organic carbon (TOC), total organic halides(TOX), and coliform bacteria. Ground water samples from the two wells screened in theshallow perched water-bearing zone were analyzed for explosive compounds and VOCsfor the first three quarters of 1999. Fourth-quarter samples of the perched ground waterwere subjected to the same analyses as described above for the deep ground water in theregional aquifer.
Water Supply Wells
Water suppy wells 18 and 20 are located in the southeastern part of Site 300 (Figure 9-3).Both are deep, high-production wells. Well 20 supplied potable water at the site during1999, while well 18 was maintained as a standby water supply well. Both wells arescreened in the Tnbs1. The well 18 screen extends upwards into the aquitard unit (Tnsc1)that separates the upper (Tnbs2) and lower blue sandstone units of the Neroly Formation.Each well can produce up to 1500 L/min of potable water. For many years, well 18ground water samples have shown trace amounts of TCE. CERCLA studies have not yetdetermined the source of the TCE in well 18 (see Chapter 8 for locations of TCE plumes atSite 300).
Ground Water Monitoring 9
LLNL Environmental Report for 1999 9-19
As planned for surveillance purposes, ground water samples were obtained quarterlyfrom these two on-site supply wells. Quarterly water samples from well 20 wereanalyzed for inorganic COCs (mostly metals), VOCs (EPA Method 502.2) explosivecompounds (HMX, RDX), general radioactivity, and tritium activity. Quarterly watersamples from standby well 18 were analyzed for arsenic, zinc, and VOCs; generalradioactivity (gross alpha and gross beta); and tritium.
Explosives Process Area
WDR Order No. 96-248 establishes the basis for compliance monitoring of the twoadjacent surface impoundments (see Figure 9-10). This includes quarterly monitoringof the ground water, monitoring of various influent waste streams to the surfaceimpoundments, and visual observations of leachate collection and removal systems.Influent wastewater monitoring complements administrative controls that regulate thedischarge of chemicals that could degrade the polyethylene liners of the impoundments.A three-tiered monitoring program comprising weekly visual inspections of the leachatecollection and removal systems, quarterly inspections of lysimeters, and quarterlysampling of monitoring wells is in place to detect any release of chemicals from thesurface impoundments in the Explosives Process Area.
As part of the Monitoring and Reporting Program (MRP) for the surface impoundments,contained in WDR 96-248, LLNL is required to obtain ground water samples quarterlyfrom four monitoring wells (see Figure 9-10) and to establish statistical concentrationlimits for COCs in ground water beneath the surface impoundments.
WDR 96-248 establishes limits for discharges of COCs into the surface impoundmentsand requires monitoring of the photographic process and chemistry area wastewaterretention tanks that discharge to the surface impoundments as well as direct dischargesto the surface impoundments from explosives processing. Influent streams aremonitored at a prescribed frequency for area-specific COCs.
Retention tanks containing photographic process rinsewater from Buildings 801, 823,850, and 851 are sampled to confirm that discharges are consistent with effluent dis-charge limits specified in WDR 96-248. Discharges to the surface impoundments occurafter samples are obtained, except for rinsewater from the Building 823 retention tanks,which is discharged automatically to the surface impoundments and sampled quarterly.
Samples of process wastewater from the Chemistry Area (Buildings 825, 826, and 827complex) are collected when the retention tanks are ready for discharge to the surfaceimpoundments. The wastewater is held in retention tanks until analytical resultsindicate compliance with WDR 96-248.

9 Ground Water Monitoring
9-20 LLNL Environmental Report for 1999
Building 823Ground water flow direction
Building 818
Building 815
W-817-01
Building 817
W-817-02
Process waterimpoundments
W-817-03
W-817-04
Route 5
Monitoring well
Building
Access road
150
Scale: Meters
0 75
N
Figure 9-10. Locations of compliance ground water monitoring wells in the ExplosivesProcess Area.
Process water discharges to the surface impoundments are analyzed for COCs that havebeen found (or are likely to be found) in the process water from each specified buildingwithin the Explosives Process Area. This monitoring program includes process areawastewater from Buildings 806/807, 809, and 817. WDR 96-248 requires annual analysisof this waste stream from Buildings 806/807, 809, and 817.
Percolation Pits
Percolation pits that are designed to accept discharges from mechanical equipment arelocated at Site 300 Buildings 806A, 827A, 827C, 827D, and 827E. In other remote Site 300facilities, these types of waste streams are discharged to septic systems. This dischargeis permitted by WDR 96-248. WDR 96-248 specifies monthly observations and moni-toring requirements for overflows. Overflows of the percolation pits, should they occur,are sampled and analyzed to determine if any metals are present.
Sewage Evaporation and Percolation Ponds
Site 300 is not serviced by a publicly owned treatment works (POTW) as is theLivermore site; therefore, alternate methods of treating and disposing of sanitary wasteare necessary. Sewage generated at buildings in the General Services Area is dischargedinto a lined evaporation pond. The wastewater is disposed of through evaporation fromthe pond. However, during rare periods of high rainfall, treated wastewater mayoverflow into an unlined percolation pond, where it enters the ground and the shallowground water.

Ground Water Monitoring 9
LLNL Environmental Report for 1999 9-21
The environmental monitoring requirements for the sewage evaporation and percola-tion ponds (hereafter sewage ponds) are specified in MRP 96-248. The monitoringrequirements include both wastewater monitoring and monitoring of the ground waterto detect potential impacts of the sewage on ground water quality.
Wastewater is sampled quarterly at an influent location (ISWP) and within the pond(ESWP). Overflows are sampled as needed at location DSWP. The sampling locationsare shown in Figure 9-11.
Sewage evaporation
pond
Sewage evaporation
pond
W-7DS
W-26R-11
W-35A-04W-7E
W-7ES
W-7PS
W-26R-01
W-25N-20
W-26R-05
ISWP
ESWP
Ground water flow direction
in upper aquifer
DSWP
Building
Scale: Meters
0 6030
Road
In pondMonitoring well
Discharge from pondInfluent to pond
Corral Hollow Road
N
Sewage percolation pond
Figure 9-11. Sewage evaporation and percolation ponds, compliance ground watermonitoring wells, and wastewater monitoring locations.
Nine ground water monitoring wells are sampled semiannually to provide informationon the ground water quality in the vicinity of the sewage ponds (Figure 9-11). The wellsare screened in three different geological formations (Qal, Tnbs1, and Tnsc1—seeChapter 8). Tnbs1 (Neroly Formation lower blue sandstone unit) is the regional aquifer.
Off-site Surveillance Wells and Springs
As planned for surveillance purposes, ground water samples were obtained fromtwo off-site springs and ten off-site wells during 1999. With the exception of one well,all off-site monitoring locations are near Site 300. The exception, well VIE2, is located at

9 Ground Water Monitoring
9-22 LLNL Environmental Report for 1999
a private residence 6 km west of the site. It represents a typical Altamont Hills potablewater supply well. One stock watering well, MUL1, and two stock watering springs,MUL2 and VIE1, are adjacent to Site 300 on the north. Eight wells, CARNRW1,CARNRW2, CDF1, CON1, CON2, GALLO1, STONEHAM1, and W-35A-04, are adjacentto the site on the south (Figure 9-3). Seven of the wells to the south are privately ownedand were constructed to supply water for human consumption, stock watering, or firesuppression. The exception is well W-35A-04, which is a DOE CERCLA well that wasinstalled for monitoring purposes only.
Ground water samples were obtained quarterly during 1999 at six off-site surveillancewell locations south of Site 300. Of these, CARNRW1 and CON2 samples were analyzedfor VOCs only (EPA Method 601). Samples from CARNRW2, CDF1, CON1, andGALLO1 were analyzed quarterly for inorganic COCs (mostly metals), generalradioactivity (gross alpha and beta), tritium activity, explosive compounds (HMX andRDX), and VOCs (EPA Method 502.2). Additional analyses were conducted on third-quarter samples for uranium activity, extractable organics (EPA Method 625), pesticidesand PCBs (EPA Method 608), and herbicides (EPA Method 615).
Ground water samples were obtained once (annually) during 1999 from four off-sitesurveillance monitoring locations—MUL1, MUL2, VIE1, and VIE2 (north of Site 300)and STONEHAM1 and W-35A-04 (south of Site 300). Samples were analyzed forinorganic COCs (mostly metals), general radioactivity (gross alpha and beta),tritium and uranium activity, explosive compounds (HMX and RDX), VOCs (EPAMethod 502.2), extractable organics (EPA Method 625), pesticides and PCBs (EPAMethod 608), and herbicides (EPA Method 615).
Sampling and Analytical Methods
Representative samples of ground water were obtained from monitoring wells inaccordance with the LLNL Livermore Site and Site 300 Environmental Restoration ProjectStandard Operating Procedures (SOPs) (Dibley and Depue 1999). These protocols coversampling techniques and specific information concerning the chemicals in ground waterthat are routinely searched for. Different sampling techniques were applied to differentwells depending on whether they were fitted with submersible pumps, had to be bailed,or contained Barcad devices. See the Data Supplement for sampling details.
At Site 300, wastewater samples from the photographic and explosives process areas,sewage evaporation pond influent, water in the pond, and overflow water from thepercolation pits pond were obtained in accordance with the standardized procedures

Ground Water Monitoring 9
LLNL Environmental Report for 1999 9-23
of the Operations and Regulatory Affairs Division (Tate et al. 1999). Standard samplehandling and hygiene procedures were employed to prevent cross-contamination (e.g.,wearing disposable gloves, decontaminating equipment between uses, and maintainingsamples at 4 ± 2°C). Replicates, field blanks, and trip blanks were obtained for qualityassurance/quality control purposes. Analyses were performed by state-certifiedcontract analytical laboratories.
Technologists collected wastewater samples from retention tanks in the Chemistry Areaassociated with Buildings 825, 826, and 827 using Hazardous Waste ManagementProcedure 411. Wastewater was held in retention tanks until analytical results werereviewed for compliance with WDR 96-248. Some of the analyses were performed byLLNL, which is state-certified for some analyses. The remainder of the analyses weredone by off-site contract laboratories late in the year.
Results
This section presents the monitoring results for the Livermore site and environs as wellas Site 300.
Livermore Site and Environs
Livermore Valley
Measurements of water samples obtained during the summer of 1999 from 18 wells(some of the wells were dry in 1999) in the Livermore Valley continue to show very lowtritium levels compared with the 740 Bq/L (20,000 pCi/L) maximum contaminant level(MCL) established by the State of California. The highest tritium activity measured offsite was 8.5 ± 2.4 Bq/L in a ground water sample from well 11B1 (see Figure 9-1),located about 11 km west of LLNL (results are reported in Data Supplement Table 9-29).
Tritium activity has been decreasing in Livermore Valley ground waters downgradientof LLNL. The median activities of tritium in ground water samples from these down-gradient wells decreased from 4.59 Bq/L in 1989 to –0.01 Bq/L in 1999 based on the fivepositive detections of tritium and 13 calculated values.

9 Ground Water Monitoring
9-24 LLNL Environmental Report for 1999
Livermore Site Perimeter
Tritium activity ranged from –2.8 (calculated) Bq/L to 4.4 Bq/L in ground watersamples from on-site background monitoring wells and from –4.4 (calculated) to10.5 Bq/L in western perimeter monitoring wells.
The semivolatile organic compound di(2-ethylhexyl)adipate was detected in groundwater samples collected from wells W-556 and W-373 (see Figure 9-2). This compoundis a plasticizer. Concentrations analyzed were 3.9 µg/L in the W-556 sample and5.2 µg/L in the W-373 sample (see Data Supplement Tables 9-10 and 9-11, respectively).The California drinking water MCL for di(2-ethylhexyl)adipate is 400 µg/L. No otherorganic compounds, excluding VOCs that were not COCs for this surveillancemonitoring effort, were detected in the ground water during 1999.
The inorganic compounds detected, including dissolved trace metals and minerals,occur naturally in the ground water at variable concentrations. Table 9-1 shows thethree anions with the highest concentrations in two of the background wells (W-008and W-221) and the seven western perimeter wells at LLNL. Concentrations of thesemajor anions are higher in the background wells than in the western perimeter wells(see Tables 9-2 through 9-11 in the Data Supplement). Concentrations of chloride inbackground wells W-008 and W-221 are higher than California’s recommendedsecondary MCL of 250 mg/L, while chloride concentrations in none of the westernperimeter wells exceed 250 mg/L. Likewise, sulfate concentrations in background wellW-008 exceed California’s recommended secondary MCL of 250 mg/L, while sulfateconcentrations in none of the western perimeter wells exceed 250 mg/L. Additionally,the boron concentration of 9.4 mg/L in background monitoring well W-008 in February1999 is an order of magnitude higher than it is in the western perimeter wells. Poorground water quality in the background portions of the site has been describedpreviously in the remedial investigations (Thorpe et al. 1990).
Table 9-1. Concentration ranges for three major anions in background and westernperimeter monitoring wells.
Hydrologic Concentration range (mg/L)
Flow Bicarbonate (HCO3–) Chloride (Cl–) Sulfate (SO4
2–)
Range Median Range Median Range Median
Background 220–330 270 280–560 400 77–340 209
Western perimeter 190–270 240 76–130 87 12–65 38
Ground Water Monitoring 9
LLNL Environmental Report for 1999 9-25
In March 1996, nitrate was first detected at concentrations greater than the MCL of45 mg/L (68 to 80 mg/L) in ground water samples obtained from western perimetermonitoring well W-1012 (screened in HSU 2) (see Figure 9-2). From a ground watersample collected in February 1999, the concentration of nitrate for this well was 79 mg/L(see Data Supplement Table 9-9). This is the highest nitrate concentration measuredin any on-site monitoring well during 1999. Because of the hydrologic influence ofTreatment Facility B that pumps and treats ground water from HSUs 1B and 2 (seeChapter 8), ground water with high nitrate concentrations is not moving off site to thewest. The highest concentration measured in an off-site well was below the MCL at31 mg/L, in downgradient monitoring wells W-151 and W-571 (see Data SupplementTables 9-7 and 9-8). Monitoring well W-571 is off site and downgradient from wellW-1012, but is screened in HSU 1B. During 1999, concentrations of nitrate in on-sitebackground wells W-008 and W-221 ranged from <0.5 mg/L (not detected) to 31 mg/L.Detected concentrations of nitrate in site western perimeter wells ranged from 12 to31 mg/L. Fluctuations in nitrate concentrations have occurred since regular surveillancemonitoring began in 1996, but nitrate concentrations have not increased overall inground water from the western perimeter monitoring wells since 1996. The nitrate mayoriginate as an agricultural residue (Thorpe et al. 1990).
Of the 22 metal COCs, nine were detected in western perimeter surveillance wellsduring 1999. Only chromium and hexavalent chromium exceeded California’s MCL of50 µg/L in western perimeter well W-373 (see Data Supplement Table 9-11). Groundwater samples collected from this well are from HSU 1B, and the nearby TreatmentFacility C (see Figure 8-1) treats ground water from HSU 1B for chromium. Conse-quently, concentrations of chromium (including hexavalent chromium) have beencontinually decreasing. Concentrations of iron reach 23% of California’s secondaryMCL in off-site monitoring well 14B1 (see Data Supplement Table 9-5). No other metalCOC concentration exceeded 23% of its MCL or secondary MCL in ground watersamples collected from western perimeter monitoring wells during 1999 (see DataSupplement Tables 9-2 through 9-11).
None of the ground water samples obtained from surveillance monitoring wellsduring 1999 had of any radioactivity that exceeded a drinking water MCL. A groundwater sample collected from well W-593 reached 75% of the MCL (0.41 ± 0.12 Bq/L, seeData Supplement Table 9-19) for gross alpha radioactivity, but that radioactivity wasnot significantly higher than for background well W-008 (0.38 ± 0.10 Bq/L, see DataSupplement Table 9-2). Gross beta radioactivity was highest in background well W-008(0.20 ± 0.10 Bq/L, see Data Supplement Table 9-2), but was only 11% of California’sMCL for gross beta radioactivity. The highest tritium activity measured in a Livermoresite perimeter ground water sample was 10.5 Bq/L, equal to 1.4% of the tritium MCL.The sample was from monitoring well W-373 (see Data Supplement Table 9-11).
9 Ground Water Monitoring
9-26 LLNL Environmental Report for 1999
Activities of total uranium (U-234 + U-235 + U-238) continued to be highest in thebackground wells W-008, W-017, and W-221 during 1999. Activities of total uranium inthose wells range from 0.19 ± 0.02 Bq/L to 0.30 ± 0.03 Bq/L (41% of California’s MCL).(See Data Supplement Tables 9-2, 9-3, and 9-4). Activities of total uranium are signif-icantly lower, from 0.024 ± 0.005 Bq/L (in well W-121) to 0.14 ± 0.02 Bq/L (19% ofCalifornia’s MCL in well W-1012), in ground water from each of the western monitoringwells. Uranium and its radioactive daughters, thorium-230, radium-226, and radon-222,occur naturally in the sediments and rock layers beneath and surrounding LLNL.Uranium activities did not exceed drinking water limits.
Livermore Site
Ground water downgradient of potential sources showed possible impact from tworeleases of metals to ground. Ground water at well W-307 near Building 322 showeda maximum concentration of chromium(VI) at 13 µg/L, just slightly greater than11 µg/L, measured in background well W-017 (see Data Supplement Tables 9-23 and9-4, respectively). Chromium (total) and chromium(VI) were detected at elevatedconcentrations in ground water samples from wells W-226 and W-306, downgradientfrom the Building 253 catch basin. Chromium (total) concentrations were measured as71 µg/L and 19 µg/L (at well W-226) and 37 µg/L (at well W-306); chromium(VI)concentrations were 27 and 24 µg/L (at well W-226) and 25, 33, and 13 µg/L (at wellW-306) (see Data Supplement Tables 9-24 and 9-25). The accumulated sediment in thecatch basin is a potential source of several metals (Jackson 1997). Only the concentrationof chromium (total) measured in a ground water sample collected from well W-226 onFebruary 11, 1999, exceeded the MCL of 50 µg/L for chromium drinking water.Chromium concentration was measured again during the fourth quarter and was belowthe MCL (see Data Supplement Table 9-24).
The initial analytical results from well W-148, downgradient from both the Plutoniumand Tritium Facilities, show plutonium-238 detected at 0.006 ± 0.002 Bq/L(0.17 ± 0.06 pCi/L). Meanwhile, the activity for plutonium-239+240 was analyzed atonly 0.0002 ± 0.0004 Bq/L (0.006 ± 0.012 pCi/L). This was considered unusual becauseplutonium-239 might be expected, but not plutonium-238. Plutonium-239 is the isotopethat was used in weapons development at LLNL, and all historical waste records atLLNL indicate the presence of plutonium-239 rather than plutonium-238. A secondaliquot of this sample was analyzed with a result of 0.01 ± 0.01 Bq/L for plutonium-238.Another ground water sample was collected from this well on March 15, 2000, andwas analyzed for americium-241 and expected plutonium radioisotopes; no radioiso-topes were detected. A ground water sample was collected downgradient fromthe Plutonium Facility from SIP-331-001 on October 21, 1999, and analyzed forplutonium-239+240 along with other analytes. The initial analytical result forplutonium-239+240 was 0.004 ± 0.002 Bq/L (0.10 ± 0.06 pCi/L). However, this sample

Ground Water Monitoring 9
LLNL Environmental Report for 1999 9-27
from SIP-331-001 appeared to contain too much particulate matter. The remainingsample was then filtered and reanalyzed by both the off-site analytical laboratory andthe on-site laboratory, and neither result indicated the presence of plutonium. Theconclusion is that no dissolved plutonium is present in the ground water downgradientfrom the Plutonium Facility. Ground water samples will continue to be collectedbiannually from these wells and analyzed for americium and plutonium radioisotopes.(Analytical results from first quarter 2000 samples from both wells are below detectablelimits for americium-241 and plutonium radioisotopes.)
Tritium activity in ground water samples collected from well W-148, downgradientfrom the Tritium Facility, reached 59 ± 7 Bq/L (1600 ± 180 pCi/L). This activity is lessthan 10% of the MCL of 740 Bq/L for tritium. The maximum tritium activity in groundwater samples from SIP-331-001, downgradient from the Plutonium Facility butupgradient from the Tritium Facility, was 18 ± 3 Bq/L (480 ± 80 pCi/L), and themaximum tritium activity in well W-305, upgradient of both Superblock buildings,was 4.8 ± 2.5 Bq/L (128 ± 69 pCi/L) (see Data Supplement Tables 9-26 through 9-28).
Site 300
The following are summaries of Site 300 ground water surveillance and compliancemonitoring results for 1999. Site 300 compliance monitoring results for 1999 have beenpublished previously (Brown et al. 1999a, b, c, and 2000; Christofferson and MacQueen1999a, b, c, and 2000; Christofferson and Taffet 1999a, b, c, and 2000). Compliancemonitoring results for Site 300 that exceeded permitted concentration limits, i.e.,statistical limits (SLs), or otherwise suggested a release of a COC to ground water, arediscussed again in the following summaries. Surveillance monitoring results for 1999have not been published elsewhere.
Elk Ravine Drainage Area
Pit 7
Compliance monitoring results for 1999 suggest that zinc was released to ground waterfrom the RCRA-closed Pit 7 landfill. However, it is more likely that it came from wasteburied in one of the other closed landfills nearby. Zinc has been detected historically atlow, but increasing, concentration in ground water at monitoring well K7-03 sincecompliance monitoring began there in 1993 (see Figure 9-4). During 1999, zinc exceededthe SL of 72 µg/L set in 1998 for well K7-03. It peaked at 160 µg/L during the thirdquarter. Its fourth-quarter concentration was 70 µg/L, slightly below the SL. Theabrupt rise and fall of zinc concentration observed during 1999 was likely caused by a

9 Ground Water Monitoring
9-28 LLNL Environmental Report for 1999
slug release from a nearby source. Well K7-03 is located hydraulically downgradient ofall four closed landfills constituting the Pit 7 Complex. Although LLNL is directed byWDR 93-100 to report any concentration of zinc in excess of its SL as an indication of arelease from Pit 7, if such a release occurred, it must have predated pit closure in 1993.Since postclosure monitoring began in 1993, zinc has been detected only sporadically atmonitoring well locations other than K7-03. It is improbable that there has been apostclosure release of zinc from Pit 7 because zinc was not detected at well NC7–48,which is located immediately downgradient of Pit 7 (Figure 9-4). Although a pre-1993release of zinc from Pit 7 is not excluded by the historical data, it was likely releasedmore recently from waste buried in the closed Pit 5 landfill, which is close to well K7–03.Pit 5 was inundated from below by rising ground water levels during several pastwinter rainy seasons (Taffet et al. 1996; Ziagos and Reber-Cox 1998b), which could havereleased metals to ground water.
A second-quarter total uranium activity of 0.7 Bq/L in ground water at monitoring wellK7-01 slightly exceeded the statistical limit of 0.6 Bq/L set for that well. LLNL reportedsimilar statistical evidence of a uranium release during 1998 (Galles 1998). Pits 3 and 5are located near well K7-01 (Figure 9-4). Both Pits 3 and 5 are known to have beenpartially inundated by rising ground water during the El Niño winter of 1997–1998,when the site received more than double the average seasonal rainfall (Ziagos andReber-Cox 1998b). Earlier CERCLA uranium investigations have characterized twosmall ground water plumes containing depleted uranium (uranium-238) that wasreleased in the past from Pit 5, Pit 7, and possibly Pit 3 (Taffet et al. 1996; see Chapter 8for a map of depleted uranium plumes existing at Site 300).
Tritium activity in the ground water at the Pit 7 monitoring well continued to increaseabove the MCL of 740 Bq/L (20,000 pCi/L) during 1999, reaching 28,500 Bq/L(770,000 pCi/L) during the fourth quarter. Previous CERCLA tritium investigationshave characterized three coalescing plumes of tritium-bearing ground water thatoriginate at Pits 3 and 5 and the Building 850 firing table on the west. The Building 850plume extends eastward to Pit 1 (Webster-Scholten 1994, Taffet et al. 1996, Ziagos andReber-Cox 1998b; see Chapter 8 for a map of tritium plumes existing at Site 300).Tritium activity above background occurs in ground water at several Pit 7 monitoringwells, but not at well NC7-48, which excludes Pit 7 as a significant tritium source.Modeling indicates that, given tritium’s short half-life of 12.3 years and the relativelyslow rate of ground water movement across the site, the activity of the released tritiumin ground water will decrease to below the MCL before it reaches a site boundary(Taffet et al. 1996).

Ground Water Monitoring 9
LLNL Environmental Report for 1999 9-29
As in the past, traces of VOCs including TCE, 1,1-DCE, and trichlorofluoromethane(Freon 11) were detected by the monitoring network during 1999 at concentrationsbelow their respective MCLs. Pit 7 is the likely source of the Freon 11. PreviousCERCLA remedial investigations have characterized a small plume containing VOCsthat were released in the past from waste buried in Pit 5 (Webster-Scholten 1994; seeChapter 8 for a map of VOC plumes existing at Site 300).
Elk Ravine
Analytical results for the Elk Ravine drainage area surveillance monitoring network for1999 are listed in Data Supplement Table 9-30 (see Figure 9-3). As in past years, arsenic,barium, chromium, selenium, vanadium, and zinc were detected at low concentrationstypical of ground water elsewhere in the Altamont Hills. Nitrate appears primarily inthe uppermost water-bearing zone. Maximum concentrations were measured in groundwater at monitoring wells NC7-61 (62 mg/L and 72 mg/L) and K2-04S (49 mg/L and61 mg/L). Well NC7-69, which monitors a deeper water-bearing zone, shows very lownitrate concentration (2.7 mg/L). A CERCLA investigation of nitrate in Site 300 groundwater is in progress (see Chapter 8 for a map of nitrate plumes existing at Site 300).
The explosive compounds HMX and RDX were detected at low concentrations up to7 µg/L in shallow ground water at one location, well NC7-61. Although these were theonly explosives detected in ground water by surveillance monitoring outside the HEProcess Area, it is not surprising at this location. This surveillance well is proximal tothe Building 850 firing table, where explosives have been detonated for decades. Thefiring table is a known source of depleted uranium (uranium-238) and tritium in theground water (see Chapter 8 for the CERCLA map of contaminant plumes).
Tritium activity was above background in many of the shallow ground water surveil-lance samples obtained during 1999 from Elk Ravine. Tritium, as tritiated water (HTO),has been released in the past from beneath the firing table at Building 850 (Taffet et al.1996). HTO was transported to ground water beneath the Building 850 firing tablegravels by percolating rainwater. HTO has also been released from closed landfill Pits 3and 5 over the past decade during wetter-than-normal winters when ground water roseand contacted buried firing table wastes (Ziagos and Reber-Cox 1998b). The most recentrelease occurred during the wet El Niño winter of 1997−1998. The plumes are mostlyshallow in the Neroly lower blue sandstone unit and overlying alluvium (see Chapter 8for the CERCLA map of tritium plumes). Tritium activity was not discernible in groundwater samples from the deeper water-bearing zone monitored at surveillance wellNC7-69.

9 Ground Water Monitoring
9-30 LLNL Environmental Report for 1999
The majority of the Elk Ravine surveillance network tritium measurements made during1999 support earlier CERCLA studies, which show that, despite additional releases, thetritium contents and extents of the plumes are generally diminishing over time becauseof natural decay and dispersion (Ziagos and Reber-Cox 1998b). LLNL observe smallincreases in tritium activity at the distal end of the plume (wells K2-01C, NC2-11D, andNC2-12D), while those wells monitoring the bulk of the plume (NC7-61, K2-04D, andK2-04S) show relatively large decreases in tritium activity over the past several years.For example, tritium activity in ground water at well NC7-61 decreased from 6500 Bq/Lin 1996 to 3500 Bq/L in 1999.
Surveillance measurements in Elk Ravine of gross alpha, gross beta, and uraniumradioactivity were all low and indistinguishable from background. (Note that grossbeta measurements do not detect the low-energy beta emission from tritium decay.)
Pit 2
No release of a COC from Pit 2 to ground water is indicated by the surveillance moni-toring data obtained during 1999 (see Figure 9-5). Analytical results for the Pit 2surveillance monitoring network are presented in Data Supplement Table 9-31. Severalmetals were detected at low concentrations. Most were below analytical reportinglimits, which are in the parts per billion (ppb) range. None exceeded an MCL. Arsenicand barium concentrations were within the range of natural (background) concentra-tions in ground waters at Site 300 (Webster-Scholten 1994). The radioactivity measure-ments show only low background activities for gross alpha, gross beta, and tritium.
Pit 1
Compliance monitoring results for 1999 suggest that lead was released to ground waterfrom the RCRA-closed Pit 1 landfill (see Figure 9-5). However, it more likely came fromanother source. Over the years, lead has been detected sporadically at low concentra-tions in ground water samples from monitoring wells located both upgradient anddowngradient from Pit 1. Lead was detected more frequently in ground water samplesobtained prior to the capping and RCRA-closure of Pit 1 in 1993, implying that the capis effectively limiting the release of lead. The monitoring data do not point to Pit 1 asbeing a source of any other COC to ground water. More likely, the lead detected inground water sampled at downgradient well K1–04 during 1999 is the same leaddetected years before at upgradient well K1-01C.
Throughout 1999, tritium activity measured above background in the ground water atPit 1 monitoring wells K1-01C, K1-02B, and K1-03, where it exceeded the SL. However,no release of tritium from Pit 1 is indicated by these measurements. Rather, the tritium

Ground Water Monitoring 9
LLNL Environmental Report for 1999 9-31
activity represents a distal lobe of the Building 850 tritium plume, which extendseastward to Pit 1 (see Chapter 8 for a CERCLA map of the Building 850 tritium plumeextending to Pit 1).
Measurements of radium, thorium, and uranium made during 1999 in ground watersamples from Pit 1 compliance monitoring wells all showed low activities indistinguish-able from background.
The VOC 1,1,2-trichloro-1,2,2-trifluoroethane (Freon 113) was detected during 1999 at amaximum concentration of 140 µg/L in ground water at Pit 1 monitoring wells K1-05,K1-08, and K1-09 (Figure 9-5). The drinking water MCL for this VOC is 1200 µg/L.Previous CERCLA investigations have linked the appearance of Freon 113 in Pit 1monitoring wells to past spills in the Advanced Test Accelerator area, about 200 m westand cross-gradient from the affected wells (Webster-Scholten 1994; Taffet et al. 1996).
Pit 8
No release of a COC to ground water from Pit 8 is indicated by the surveillance moni-toring data obtained during 1999. Analytical results for the Pit 8 surveillance monitoringnetwork are presented in Data Supplement Table 9-32. Two VOCs, TCE and 1,2-DCA,were detected below their 5 µg/L MCLs. A relatively small VOC plume exists beneaththis area (see Chapter 8 ), which originated prior to 1981 from waste discharged to a drywell upgradient of Pit 8, near Building 801 (Webster-Scholten 1994).
Arsenic, chromium, selenium, and vanadium were detected in concentrations similar totheir natural levels in ground water elsewhere in the Altamont Hills.
Pit 9
No evidence for a release from Pit 9 is indicated by the surveillance monitoring dataobtained during 1999. Analytical results for the Pit 9 surveillance monitoring networkare presented in Data Supplement Table 9-33. COCs either were not detected or wereindistinguishable from natural background concentrations. Since annual surveillancemonitoring of ground water began there more than a decade ago, no evidence of arelease of any COCs from Pit 9 has been recorded.
Corral Hollow Creek Drainage Area
Pit 6
No new release of designated COCs from Pit 6 is indicated by the compliance monitor-ing results for 1999. However, a release of benzoic acid, which is not a designated COC,

9 Ground Water Monitoring
9-32 LLNL Environmental Report for 1999
is suggested by the data. Designated COCs known to have been released to groundwater prior to pit closure continued to be detected, but their concentrations eitherremained steady during 1999, or followed historically decreasing trends.
Quarterly COC measurements were mostly below SLs. The few COC measurementsthat exceeded SLs were not confirmed by retests. At the time of the fourth-quartersampling in October 1999, designated COCs were all below their respective MCLs.
During 1998, the VOC, 1,2-dichloroethane (1,2-DCA), exceeded its SL in ground water atwell EP6-09 (see Figure 9-8). Subsequently, during the fall of 1998, a volume of about270,000 L of VOC-contaminated water was pumped from well EP6-09. VOCs, including1,2-DCA and TCE, were removed from the pumped water by air-sparging. Evidence ofthe success of this action was the subsequent decrease in TCE concentration to below theMCL, and the disappearance of detectable concentrations of 1,2-DCA in the groundwater sampled at well EP6-09 during 1999.
The extractable organic compound bis(2-ethylhexyl)phthalate, which is not a designatedCOC, was detected during 1999 in one upgradient ground water sample at a concentra-tion of 4 µg/L and in two downgradient samples at concentrations of 15 and 24 µg/L.This compound, with an MCL of 4 µg/L, was previously detected in 1998 in fourground water samples at concentrations up to 41 µg/L. The source of this compound isunknown. There is no record of it being placed in Pit 6, but the chemical has been usedat Site 300.
The extractable organic compound benzoic acid, which has no MCL, was detectedquarterly during 1999 at concentrations up to 75 µg/L in ground water samples fromdowngradient well K6-19. Of 104 total analyses made since November 1997 in groundwater samples obtained throughout Site 300, benzoic acid has been detected in only fiveground water samples, all obtained from well K6-19 during 1999. Although the first-quarter detection was not confirmed by two additional retest analyses, the chemicalreappeared in increasing concentration during the second, third, and fourth quartersof 1999.
During 1999, tritium activity remained above background and relatively constant inground water samples from two downgradient wells. The maximum activity recordedwas 93.2 Bq/L, which is less than 13% of the 740 Bq/L MCL for tritium in drinkingwater. Relatively elevated tritium activity is contained within a small volume of groundwater adjacent to Pit 6. Continued monitoring of tritium there is being conducted underCERCLA auspices (see Chapter 8 for a CERCLA map of the small tritium plume).

Ground Water Monitoring 9
LLNL Environmental Report for 1999 9-33
Building 929 Closed HE Burn Facility
Analyses of ground water samples obtained quarterly from the regional aquiferdowngradient of the closed HE burn facility show no evidence of contamination frompast operation of the facility. Except for the presence of coliform bacteria detected inground water samples from a new well, W-829-22, the analytical results representbackground concentrations of substances dissolved from natural sources in theunderlying rocks (see Figure 9-9). Monitoring well W-829-22 was newly constructed in1998. Bacteria may have been introduced during construction. Continued monitoring isnecessary to determine their source. Analytical results for 1999 for three of the fourwells that are used to monitor the deep regional aquifer are listed in Data SupplementTable 9-34. (A fourth deep well, W-827-04, was dry during 1999.)
As in the past, analyses of ground water samples obtained from the shallower perchedground water beneath the closed facility do show evidence of contamination. Analyticalresults for 1999 for the two wells that are used to monitor the perched ground water arelisted in Data Supplement Tables 9-35. The primary contaminant in the perched groundwater is TCE. TCE concentrations up to 310 µg/L were measured during 1999. Theperched water has a high total concentration of dissolved substances. Many of theinorganic analytes measured have natural sources in the surrounding rocks. Theperched ground water does not contain clearly anthropomorphic chemicals such aspesticides, PCBs, herbicides, or the explosives compounds that were burned at thefacility and that are known to exist at shallow depth in the soil above the perchedground water. However, perchlorate was detected in the perched ground water atconcentrations up to 21 µg/L, and it may be linked to past operations at the closed burnfacility. Similarly, nitrate was measured in the perched ground water at concentrationsup to 230 mg/L, and it may be a contaminant from the closed facility above it. CERCLAinvestigations of perchlorate and nitrate in ground water at Site 300 are in progress.
Water Supply Wells
Analytical results for Site 300 water supply wells 18 and 20 are presented in DataSupplement Tables 9-36 and 9-37. As in past years, TCE was detected below the MCL of5 µg/L in surveillance ground water samples from well 18 (0.63, and 0.54 µg/L) (seeFigure 9-3). The source of the TCE has not yet been identified. Methylene chloride wasdetected at low concentration in two quarterly water samples from well 20. However,both detections were accompanied by similar detections in field blanks or methodblanks, which invalidate the results. Gross alpha, gross beta, and tritium activities inwater samples from both production wells are very low and are indistinguishable fromnatural background activities. Barium (62 µg/L) and copper (11 µg/L) were detectedonce in well 20 water samples during 1999 at concentrations far below their MCLs of1000 µg/L.

9 Ground Water Monitoring
9-34 LLNL Environmental Report for 1999
Surface Impoundments
The two leachate collection and removal systems were monitored weekly for thepresence of liquids. In 1999, no water was recovered from the leachate collection andremoval system. The visual inspections indicate that the impoundment liners did notleak wastewater during 1999. No water has been observed in the leachate collection andremoval system since liner repairs were made in 1997. No water was found in fivelysimeters, which also indicates that the impoundment liners did not leak wastewaterduring 1999. Analytical results for all monitored constituents in Site 300 ground waterbeneath the surface impoundments are contained in the LLNL Experimental Test Site 300Compliance Monitoring Report for Waste Discharge Requirements 96-248, Annual/FourthQuarter Report 1999 (Brown et al. 2000).
The explosive compounds (HMX, RDX, and TNT) and perchlorate are the compoundsmost indicative of discharges to ground water from the Explosives Process Area surfaceimpoundments. However, prior to 1985, explosives wastewater was discharged intounlined ponds in the vicinity of the surface impoundments, where it infiltrated thesoil and some reached ground water. Because of this past practice, it is necessary todiscriminate between new releases from the surface impoundments and past releasesfrom the unlined ponds. Analyses of ground water from upgradient monitoring wellW-817-01 during 1999 showed HMX concentrations between 8.5 and 17.6 µg/L (seeFigure 9-10). HMX was not detected above the analytical reporting limit of 1.0 µg/L inany of the ground water samples from the downgradient monitoring wells. Groundwater samples from three wells contained detectable concentrations of the explosivecompound RDX above the analytical reporting limit of 0.85 µg/L. The ground watersamples containing RDX were from upgradient well W-817-01 (from 24 to 54 µg/L) andlower concentrations in downgradient wells W-817-03 and W-817-04. The RDX andHMX originated at closed disposal sites upgradient of the present surface impound-ments (Raber and Carpenter 1983, Webster-Scholten 1994). Other explosive compoundsor components of explosive compounds, 4-amino-2,6-dinitrotoluene and perchlorate,were detected in upgradient well W-817-01 and in several downgradient wells in thismonitoring network. The concentrations observed in the downgradient wells do notexceed their permitted limits, but concentrations of perchlorate exceed the CaliforniaDepartment of Health Services’ recommended limit of 18 µg/L in drinking water. Theremediation of these compounds is discussed in Chapter 8 of this document.
As in the past, ground water concentrations of arsenic and nitrate continued to exceeddrinking water MCLs in ground water samples from all the surface impoundmentmonitoring wells during 1999. Concentrations of both arsenic and nitrate in groundwater have historically exceeded their respective MCLs (0.050 mg/L for arsenic and45 mg/L for nitrate) in this area. Background concentrations of arsenic in ground watermonitoring wells upgradient from the surface impoundments have been measured at
Ground Water Monitoring 9
LLNL Environmental Report for 1999 9-35
concentrations above the drinking water MCL (Webster-Scholten 1994). Although thedistribution of arsenic over time and throughout the area suggests a natural source,the occurrence and concentration of arsenic at Site 300 is the subject of a continuingCERCLA study. The remediation of all of these compounds (except for the elementarsenic) is discussed in Chapter 8 of this document.
During 1999, all discharges into the surface impoundments were in compliance withdischarge concentration limits. See the LLNL Experimental Test Site 300 ComplianceMonitoring Report for Waste Discharge Requirements 96-248, Annual/Fourth Quarter Report1999 (Brown et al. 2000).
Percolation Pits
During 1999, the percolation pits at Buildings 806A, 827D, and 827E operated normallywith no overflows. Standing water was regularly noted in the Building 827C percola-tion pit inspections, and the pit overflowed during the third quarter. A sample formetals analysis was collected from the overflow water. Ten metals were detected abovethe analytical reporting limit: aluminum, boron, total chromium, copper, iron, lead,manganese, molybdenum, nickel, and zinc. Water from the overflow infiltrated andsaturated the soil surrounding the percolation pit but did not reach a surface waterdrainage course. Metals data for this overflow event are contained in the LLNLExperimental Test Site 300 Compliance Monitoring Report for Waste Discharge Requirements96-248, Annual/Fourth Quarter Report 1999 (Brown et al. 2000).
Sewage Evaporation and Percolation Ponds
All wastewater parameters for the sewage evaporation and percolation ponds compliedwith permits provisions and specifications throughout 1999, and there were nooverflows to the percolation pond.
In June 1999 LLNL performed corrective actions to mitigate odors from the evaporationpond and modified operations to prevent a recurrence (see Figure 9-11). The modifiedoperations included raising and maintaining a higher water level in the evaporationpond. LLNL requested permission from the CVRWQCB to operate the pond withreduced freeboard because of the change in operations. All other observations—leveecondition, color, and odor—indicated normal operations.
All of the ground water monitored constituents were also in compliance with permittedlimits. Nitrate concentrations in downgradient monitoring wells W-26R-01 andW-26R-05 decreased to 33 and 38 mg/L, respectively, during the third quarter. LLNLhas not been able to determine the origin of this nitrate, but a sitewide study of nitrate at

9 Ground Water Monitoring
9-36 LLNL Environmental Report for 1999
Site 300 is continuing, and LLNL continues to monitor these wells and nearby off-sitewells for nitrate concentrations (see also Chapter 8).
Off-Site Water Supply Wells
Analytical results for the off-site water supply wells for 1999 are presented in DataSupplement Tables 9-40 to 9-44. Generally, no COC attributable to LLNL activities wasdetected in the off-site ground water samples. Arsenic and barium were widelydetected at these locations, but their concentrations were below MCLs and consistentwith natural sources in the rocks. Scattered detections of metals were all below MCLsand were probably related to metals used in pumps and supply piping.
As in past years, TCE was detected at concentrations up to 0.74 µg/L in the groundwater samples obtained from well GALLO1 (see Figure 9-3). Previous CERCLAremedial investigations concluded that the TCE in the GALLO1 well water was likelycaused by a localized surface spill on the property, possibly solvents used to service theprivate well (Webster-Scholten 1994). (Surveillance monitoring of a similarly sited well,GALLO2, was terminated in 1991 because of contamination from chemicals leaking fromthe pumping apparatus.) Radioactivity measurements of off-site ground water are allindistinguishable from natural background activities.
Environmental Impacts
The overall impact of LLNL Livermore site and Site 300 operations on off-site groundwaters is minimal. With the exception of VOCs being remediated under CERCLA atboth sites, current LLNL operations have no measurable impact on ground watersbeyond the site boundaries.
Livermore Site and Environs
Ground water monitoring at the LLNL Livermore site and in the Livermore Valleyindicates that LLNL operations have minimal impact on ground water beyond the siteboundary. (See Chapter 8 for CERCLA remediation activities with VOCs.) During 1999,neither radioactivity nor concentrations of elements or compounds detected in groundwater from any off-site monitoring well exceeded primary drinking water MCLs. Themaximum tritium activity of 10.5 Bq/L (283 pCi/L), only 1.4% of the MCL, was detectedin the ground water sample collected from on-site well W-373 in June (see Figure 9-2).

Ground Water Monitoring 9
LLNL Environmental Report for 1999 9-37
The maximum tritium activity measured off site in the Livermore Valley was evenlower, 8.5 Bq/L, in well 11B1 (see Figure 9-1).
Of the Livermore on-site monitoring wells, no inorganic data exceeded primary MCLs,with the exceptions of chromium in monitoring well W-373 and nitrate in monitoringwell W-1012 (see Figure 9-2). Chromium(VI) in ground water in the vicinity of moni-toring well W-373 is being removed at Treatment Facilities B and C. The LLNL GroundWater Project reports on the treatment of ground water in the vicinity of the treatmentfacilities (see Chapter 8). Concentrations of nitrate in ground water samples collectedfrom well W-1012 in June 1999 exceeded California’s MCL of 45 mg/L. Nitrate abovethe MCL has not migrated off site. LLNL continues to monitor this well and monitoringwell W-571, which is off site and about 350 meters downgradient from well W-1012, todetermine if nitrate at concentrations above the MCL migrates off site.
The arroyo sediment data included in Chapter 10 indicate no potential adverse impacton ground water through the arroyos that cross the Livermore site.
Site 300
Ground water monitoring at Site 300 and adjacent properties in the Altamont Hillsshows minimal impact of LLNL operations on ground water beyond the siteboundaries.
Within Site 300, the chemicals detected in ground water beneath the High ExplosivesProcess Area will not migrate off site. Plans to remediate TCE, explosive compoundssuch as RDX, perchlorates, and nitrate are currently being implemented under CERCLAauspices (see Chapter 8). Additionally, LLNL is investigating the distribution andorigins of arsenic and zinc in this area.
VOCs, primarily the solvent TCE, have been released historically to shallow groundwater at numerous locations at Site 300 (see Chapter 8 and references cited therein).With the exceptions of a small plume in the General Services Area area that extendsminimally off site along Corral Hollow Road, all of the TCE-bearing ground water is onsite. The plume extending off site from the Eastern GSA area is being drawn back to thesite by pumping, and the TCE is being removed from the ground water.
Tritiated water and depleted uranium have been released to ground water from landfillsand several firing tables in the northern part of Site 300. The boundaries of the slowlymoving ground water plumes lie entirely within the site boundaries. Fate and transportmodels predict that the tritium will decay naturally to an activity below the drinking

9 Ground Water Monitoring
9-38 LLNL Environmental Report for 1999
water MCL before the tritium-bearing ground water reaches a site boundary (Webster-Scholten 1994, Taffet et al. 1996).
Maximum uranium activities that could reach potential exposure points (hypotheticalground water supply wells) at the northern boundary of Site 300 are estimated to be0.08 Bq/L from plumes originating at Pits 5 and 7, and 0.05 Bq/L at the easternboundary of Site 300 from the plume originating at Building 850. These conservativelyestimated maximum activities are small when compared with the 0.74 Bq/L CaliforniaMCL for uranium in drinking water. The predicted incremental lifetime cancer risksfrom the released uranium are less than one-in-a-million at the hypothetical exposurepoints on the Site 300 boundary (Taffet et al. 1996). The VOCs, tritium, nitrate, Freon,perchlorate, and depleted uranium in the shallow ground water beneath Site 300 presentno current health risks because the contaminated water is not used for potable domestic,livestock, or industrial water supplies.