Embed Size (px)
Citation preview
Best Practices in Product Stewardship, Extended Producer
Responsibility & LCAGodrej Appliances - Mohali

2
�India’s largest privately business house.
�Started operations in 1897
�Annual turnover more than Rs.18000 Crores.
�Family of about 19000 employees.
� Product Spectrum Ranges from - Locks to Launchers
Godrej in Every Home and Work Place
Enriching Quality of Life Everyday Everywhere
ABOUT THE COMPANYABOUT THE COMPANY
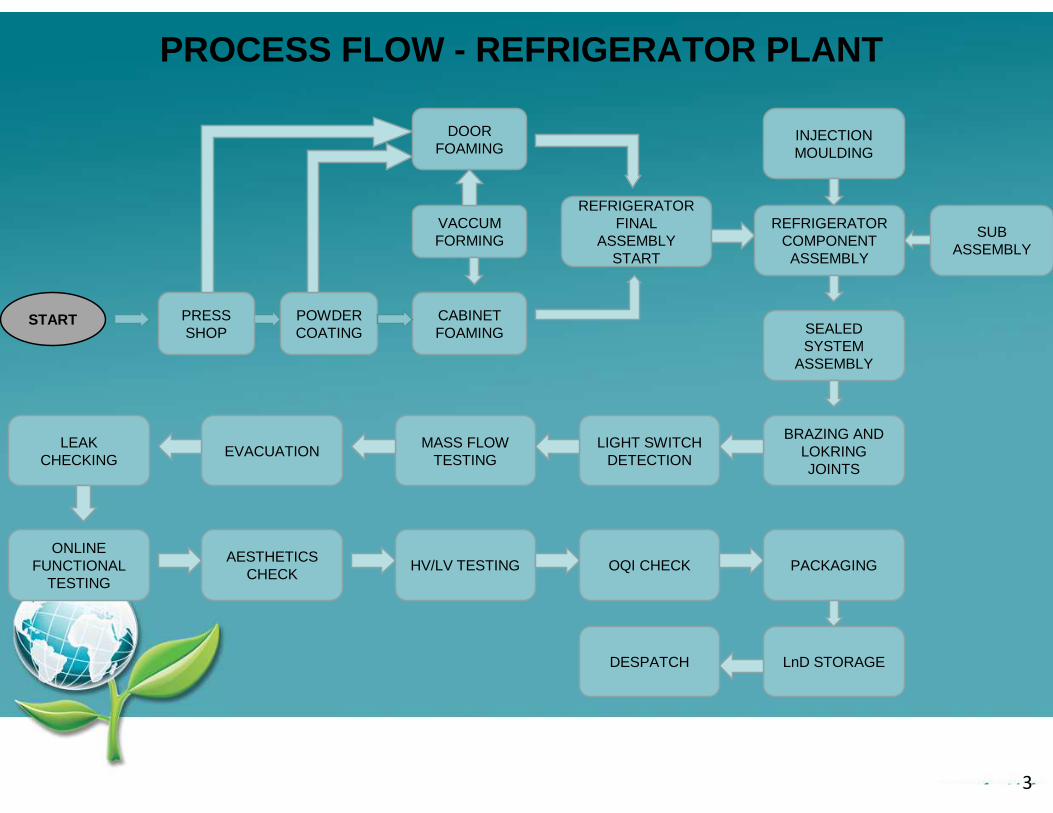
START PRESS SHOP
POWDER COATING
CABINET FOAMING
DOOR FOAMING
VACCUM FORMING
REFRIGERATOR FINAL
ASSEMBLY START
REFRIGERATOR COMPONENT
ASSEMBLY
SEALED SYSTEM
ASSEMBLY
INJECTION MOULDING
BRAZING AND LOKRING JOINTS
LIGHT SWITCH DETECTION
MASS FLOW TESTING
EVACUATIONLEAK
CHECKING
ONLINE FUNCTIONAL
TESTING
AESTHETICS CHECK
HV/LV TESTING OQI CHECK PACKAGING
LnD STORAGEDESPATCH
SUB ASSEMBLY
3
PROCESS FLOW - REFRIGERATOR PLANT
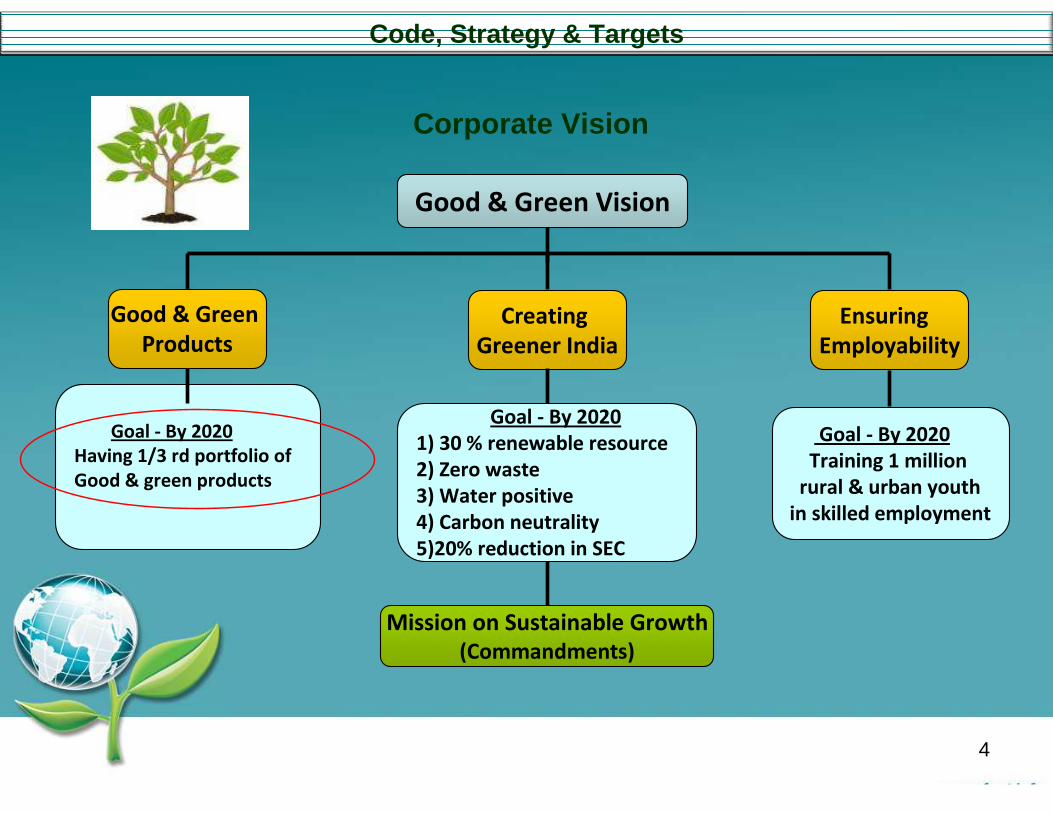
Good & Green Vision
Creating
Greener India
Good & Green
Products
Ensuring
Employability
Goal - By 2020
Having 1/3 rd portfolio of
Good & green products
Goal - By 2020
1) 30 % renewable resource
2) Zero waste
3) Water positive
4) Carbon neutrality
5)20% reduction in SEC
Goal - By 2020
Training 1 million
rural & urban youth
in skilled employment
Corporate Vision
Mission on Sustainable Growth
(Commandments)
Code, Strategy & Targets
4
5
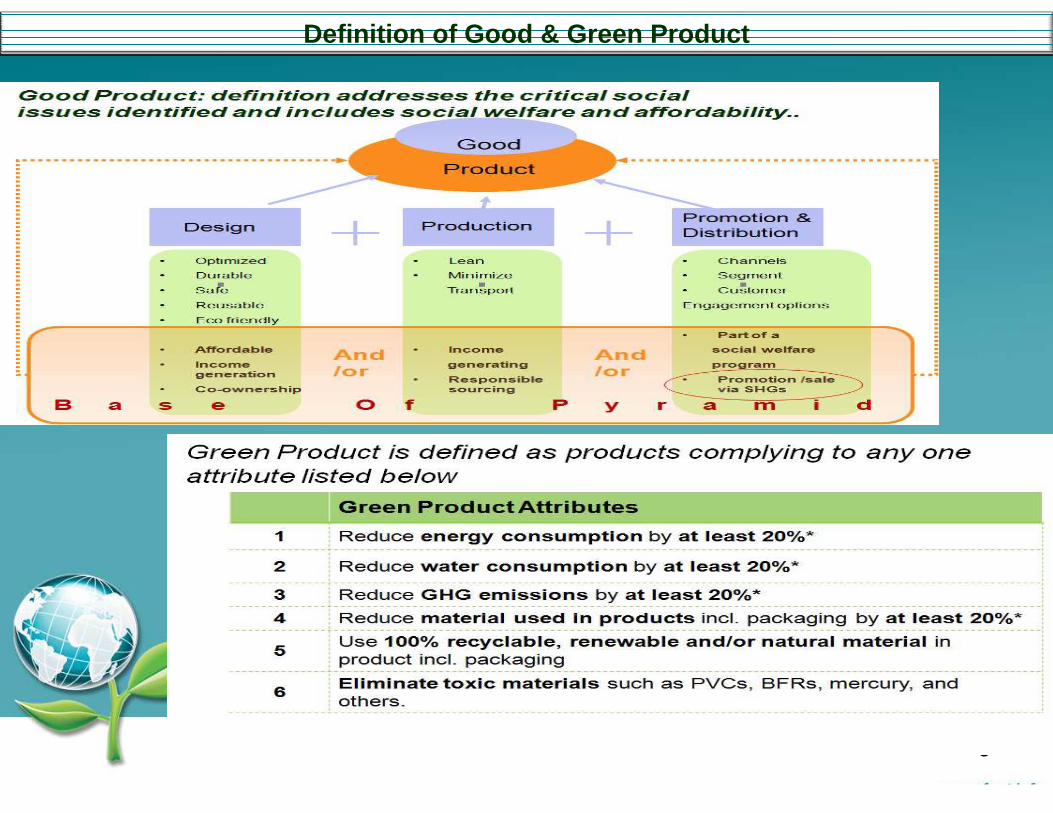
Definition of Good & Green Product
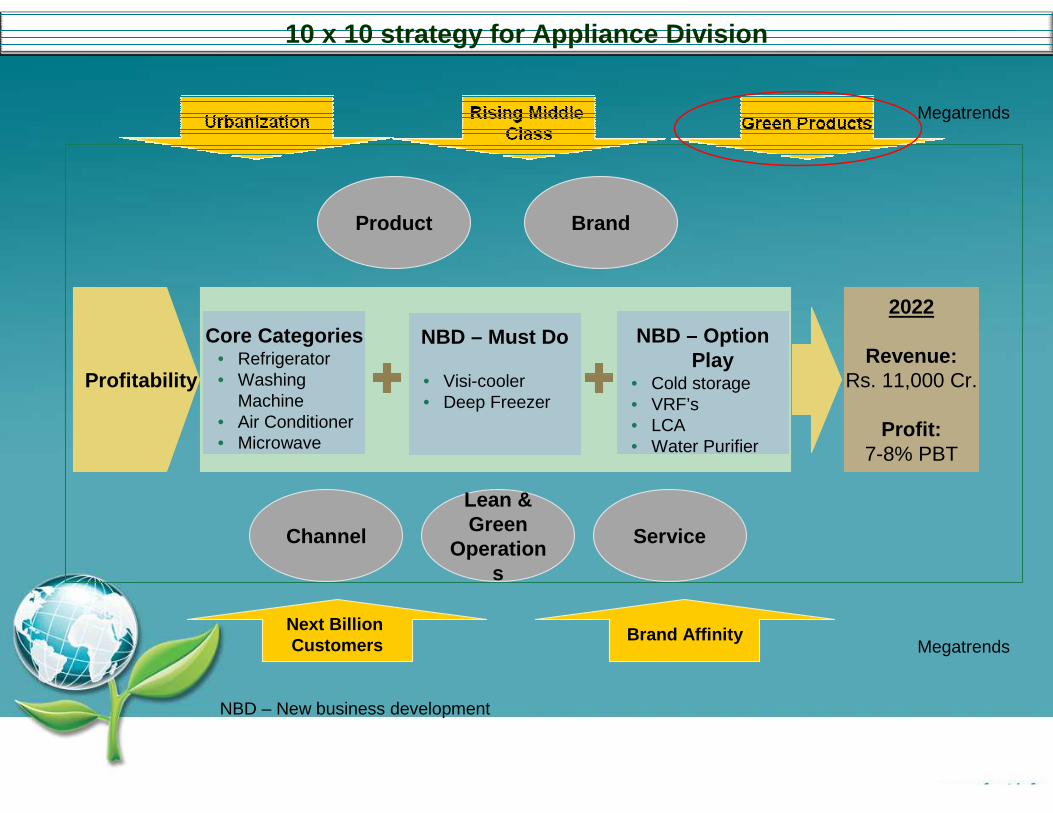
Profitability
2022
Revenue: Rs. 11,000 Cr.
Profit:7-8% PBT
Core Categories• Refrigerator• Washing
Machine• Air Conditioner• Microwave
NBD – Option Play
• Cold storage• VRF’s• LCA• Water Purifier
Product Brand
Channel
Lean & Green
Operations
Service
Next Billion Customers
Brand Affinity
NBD – Must Do
• Visi-cooler• Deep Freezer
Megatrends
Megatrends
NBD – New business development
10 x 10 strategy for Appliance Division
Header
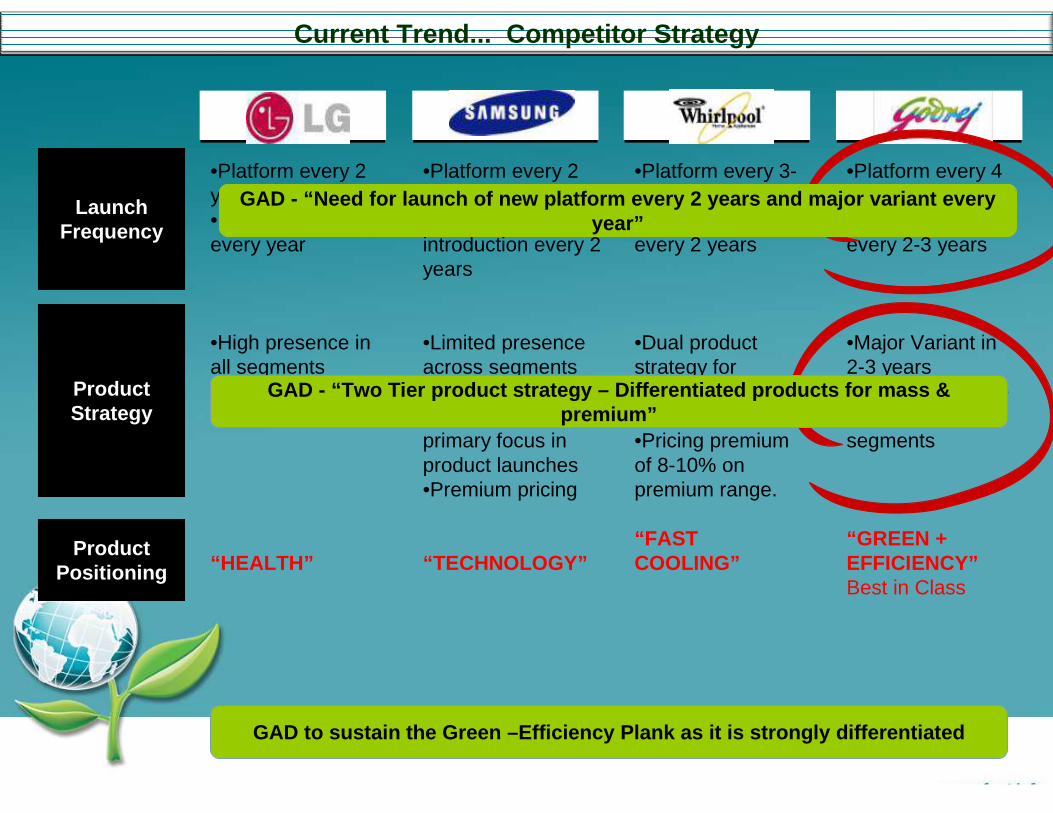
•Platform every 2 years•Major Variant every year
•High presence in all segments•Mass pricing strategy
“HEALTH”
Header
•Platform every 2 years•Major Variant introduction every 2 years
•Limited presence across segments•Aesthetics & Technology are primary focus in product launches•Premium pricing
“TECHNOLOGY”
Header
•Platform every 3-4 years•Major Variant every 2 years
•Dual product strategy for mass/premium segments•Pricing premium of 8-10% on premium range.
“FAST COOLING”
Header
•Platform every 4 years•Major Variant every 2-3 years
•Major Variant in 2-3 years•Limited presence in High end segments
“GREEN + EFFICIENCY”Best in Class
Launch Frequency
Product Strategy
Product Positioning
GAD - “Need for launch of new platform every 2 years and major variant every year”
GAD - “Two Tier product strategy – Differentiated pro ducts for mass & premium”
GAD to sustain the Green –Efficiency Plank as it is strongly differentiated
Current Trend... Competitor Strategy
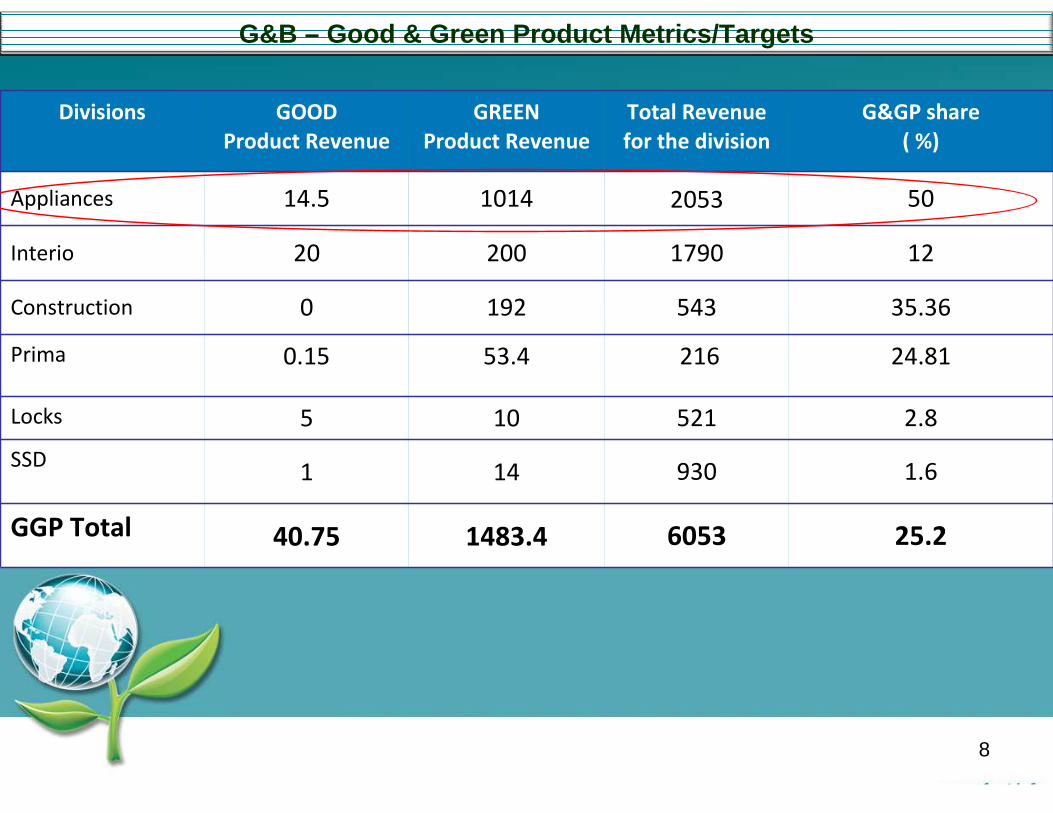
Divisions GOOD
Product Revenue
GREEN
Product Revenue
Total Revenue
for the division
G&GP share
( %)
Appliances 14.5 1014 2053 50
Interio 20 200 1790 12
Construction 0 192 543 35.36
Prima 0.15 53.4 216 24.81
Locks 5 10 521 2.8
SSD1 14 930 1.6
GGP Total 40.75 1483.4 6053 25.2
8
G&B – Good & Green Product Metrics/Targets
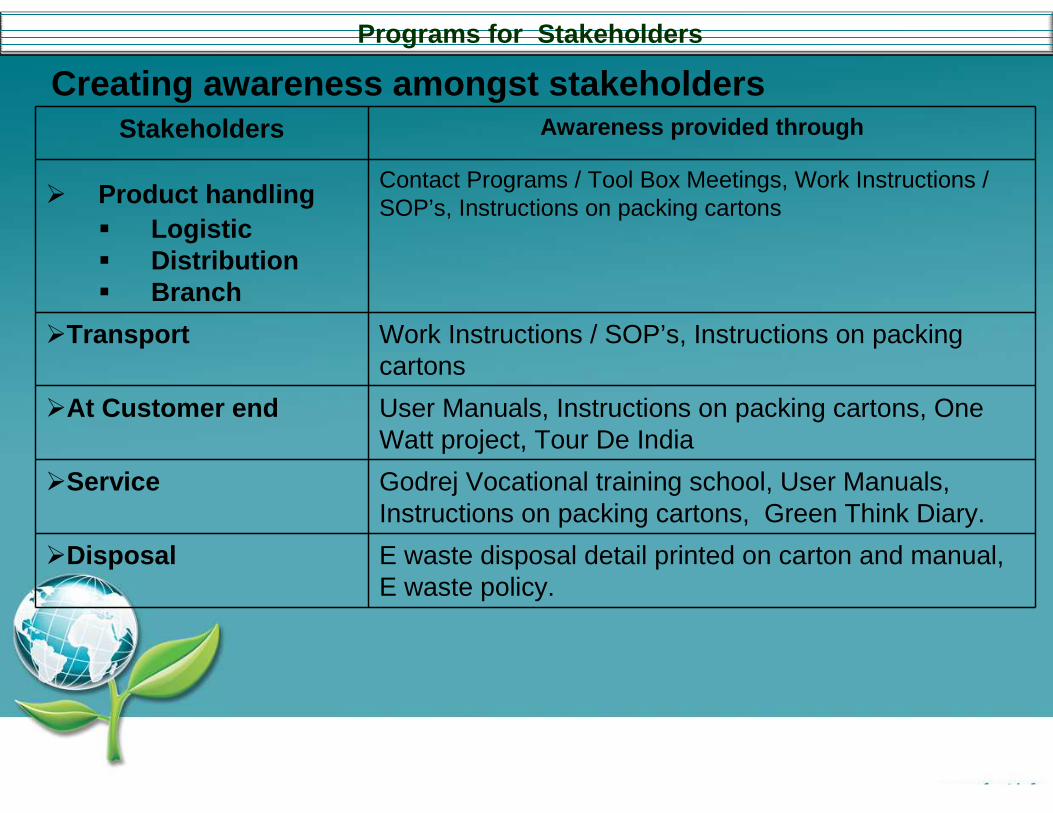
Creating awareness amongst stakeholders
Programs for Stakeholders
Stakeholders Awareness provided through
� Product handling � Logistic� Distribution� Branch
Contact Programs / Tool Box Meetings, Work Instructions / SOP’s, Instructions on packing cartons
�Transport Work Instructions / SOP’s, Instructions on packing cartons
�At Customer end User Manuals, Instructions on packing cartons, One Watt project, Tour De India
�Service Godrej Vocational training school, User Manuals, Instructions on packing cartons, Green Think Diary.
�Disposal E waste disposal detail printed on carton and manual, E waste policy.
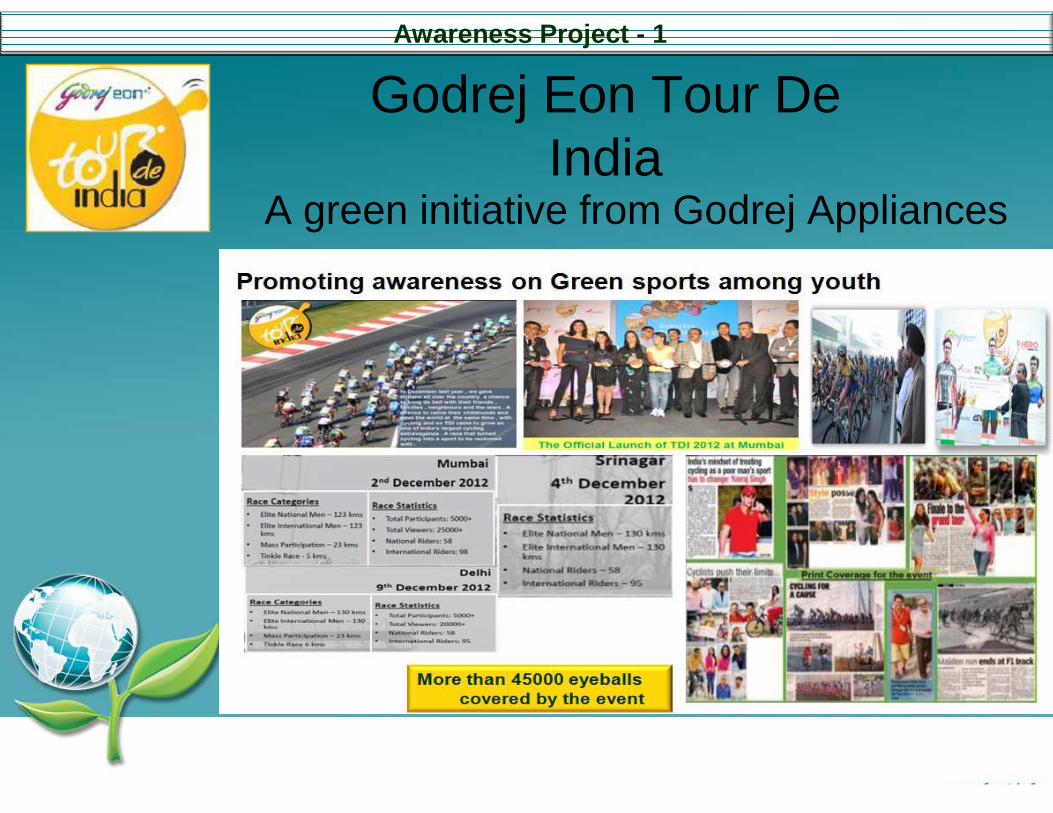
Awareness Project - 1
Godrej Eon Tour DeIndia
A green initiative from Godrej Appliances

Awareness Project - 2
One Watt Project
� National Initiative to sensitize people about the grave situation of Power Deficiency.
� Spread awareness about the importance of conserving energy.
� Approach:
� Covering all the major cities of India, in a duration of a Month- starting 18th
April’2012
� Seeking people’s contribution by taking a Pledge to save electricity
� Cover Corporate Parks in select cities to target participation of Key Corporate
� Objective:
� SAVE A BILLION WATTS.

Awareness Project - 2
Taking it to the people
Green Van 35 CitiesGreen Van 35 Cities
Tie up with Kings XI - IPL 2012Visibility of 5 Crore+
Tie up with Kings XI - IPL 2012Visibility of 5 Crore+
In store promotions In store promotions 300 + Schools Reached300 + Schools Reached
10 lakhs + spectators engaged through CCL10 lakhs + spectators engaged through CCL

Awareness Project - 3
Context
• Inspiration from CII’s hybrid cluster for OEMS
• Godrej Appliances’factories successfully deployed cluster learnings
• Extending to suppliers –the next logical step considering the challenges faced due to external factors.
• Choosing suppliers– Small scale suppliers– Dependent on Godrej– Current quality
performance (PPM level)
Cross-functional working
A systematic effort to develop supplier capabilities
• Sourcing head leads the project.
• Manufacturing head acts as mentor.
• Cross functional Supplier Improvement Team drives execution.
• Top management reviews the progress on monthly basis.
SUPPLIER CLUSTER
Individual participation, but a collective experien ce
13
Roadmap
• The roadmap for excellence
1m 8m 15m
Quality
ProductivityImprovement
My Machine
Green
5 S
TEI to be at the core of the initiative.
TEI
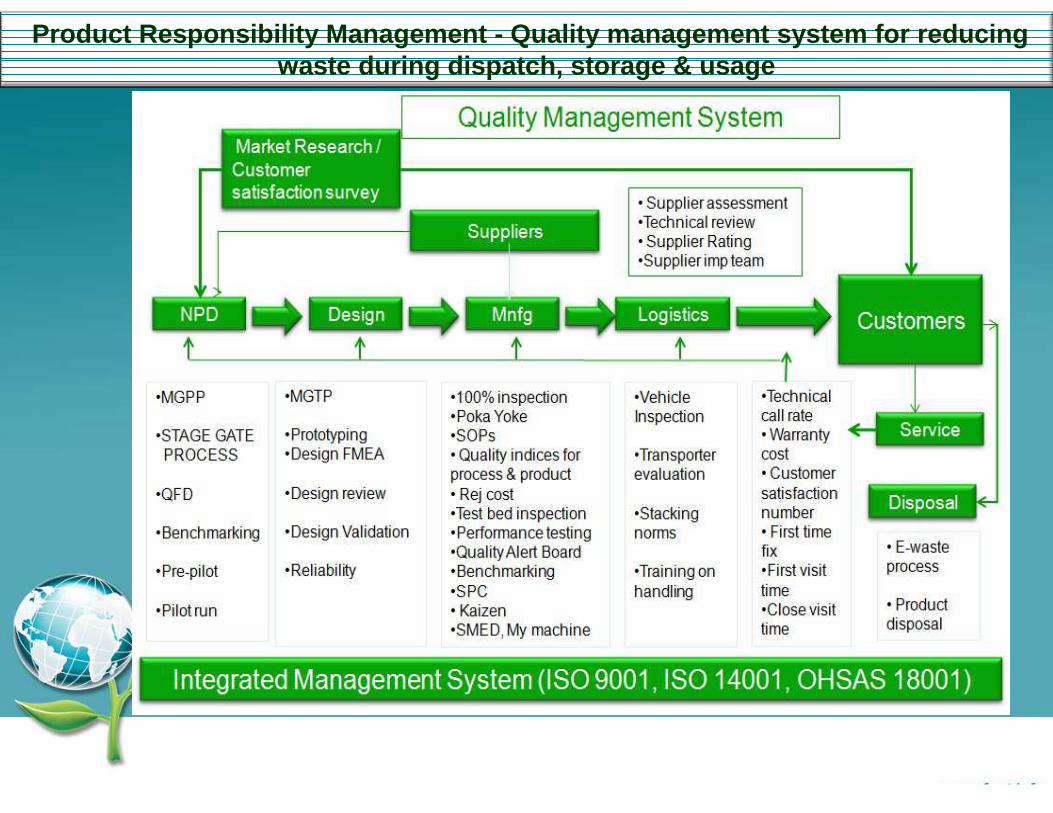
Product Responsibility Management - Quality manageme nt system for reducing waste during dispatch, storage & usage
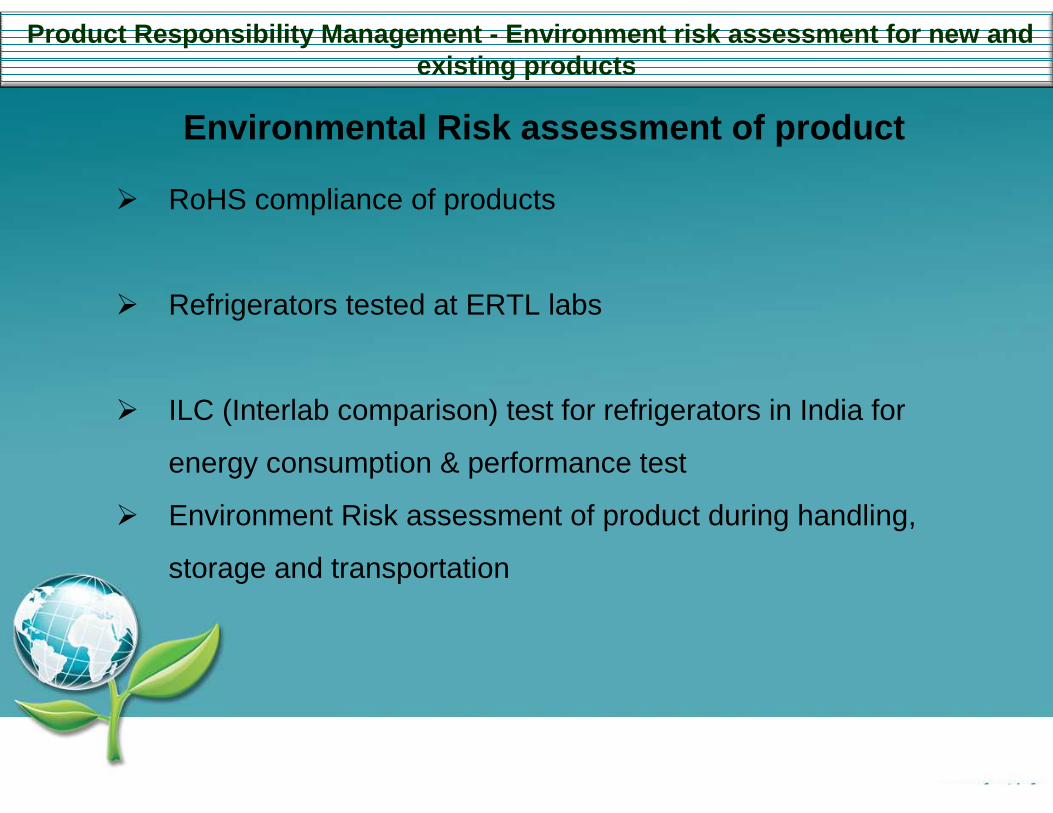
Product Responsibility Management - Environment risk assessment for new and existing products
Environmental Risk assessment of product
� RoHS compliance of products
� Refrigerators tested at ERTL labs
� ILC (Interlab comparison) test for refrigerators in India for
energy consumption & performance test
� Environment Risk assessment of product during handling,
storage and transportation

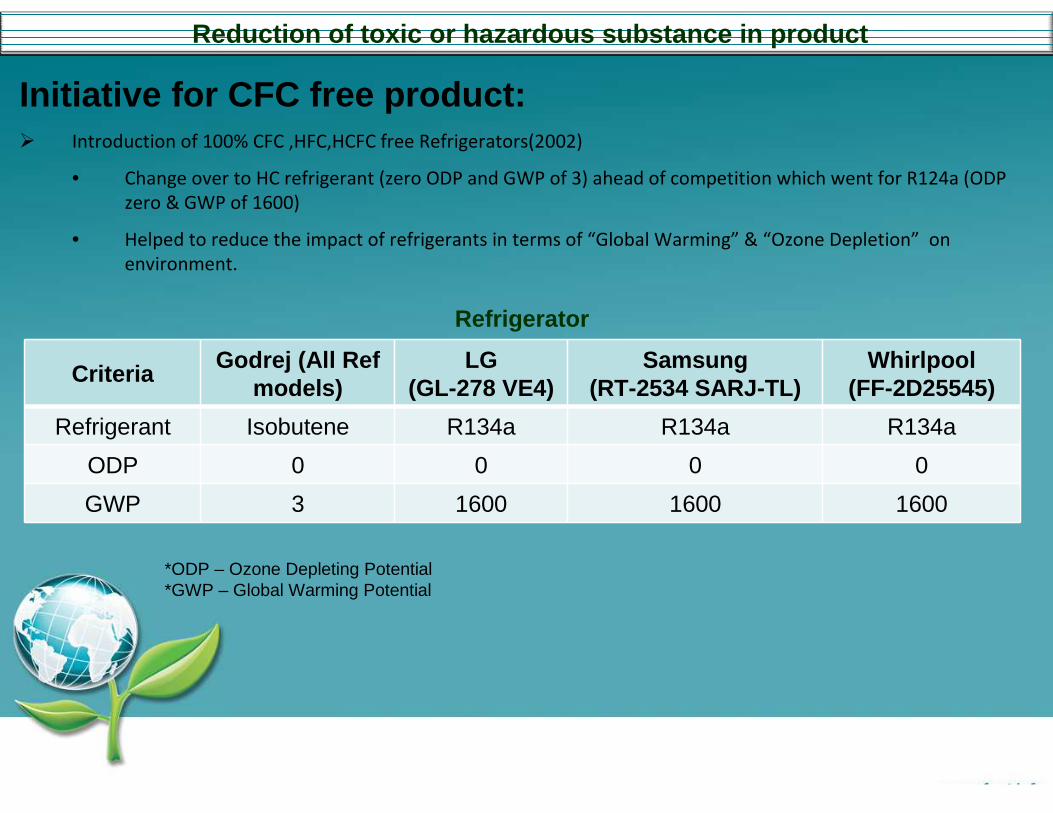
Reduction of toxic or hazardous substance in produc t
Initiative: To make all items used for manufacturing of appliances at MohaliFactory -100% RoHS compliant
Status : Till year 2012, we had hardly 20~25% items with RoHS compliance
Current Status: We took 100% RoHS compliance target with deadline of March 2014 and achieved the same by making suppliers aware of RoHS requirements , tied up with testing lab (M/s SGS , Chakan, Pune) to facilitate suppliers with special discounted rates for RoHS testing, had detailed discussions with each supplier for making step-by-step plan for implementation.
With this efforts, we are now 100% RoHS compliant
ParameterParameterParameterParameter (2012~13)(2012~13)(2012~13)(2012~13) (2013~14)(2013~14)(2013~14)(2013~14) (2014~15)(2014~15)(2014~15)(2014~15)
RoHS compliant items
25% 84% 100%
RoHS compliance for products
Reduction of toxic or hazardous substance in produc t
Initiative for CFC free product: � Introduction of 100% CFC ,HFC,HCFC free Refrigerators(2002)
• Change over to HC refrigerant (zero ODP and GWP of 3) ahead of competition which went for R124a (ODP
zero & GWP of 1600)
• Helped to reduce the impact of refrigerants in terms of “Global Warming” & “Ozone Depletion” on
environment.
Criteria Godrej (All Ref models)
LG (GL-278 VE4)
Samsung(RT-2534 SARJ-TL)
Whirlpool(FF-2D25545)
Refrigerant Isobutene R134a R134a R134a
ODP 0 0 0 0
GWP 3 1600 1600 1600
Refrigerator
*ODP – Ozone Depleting Potential*GWP – Global Warming Potential
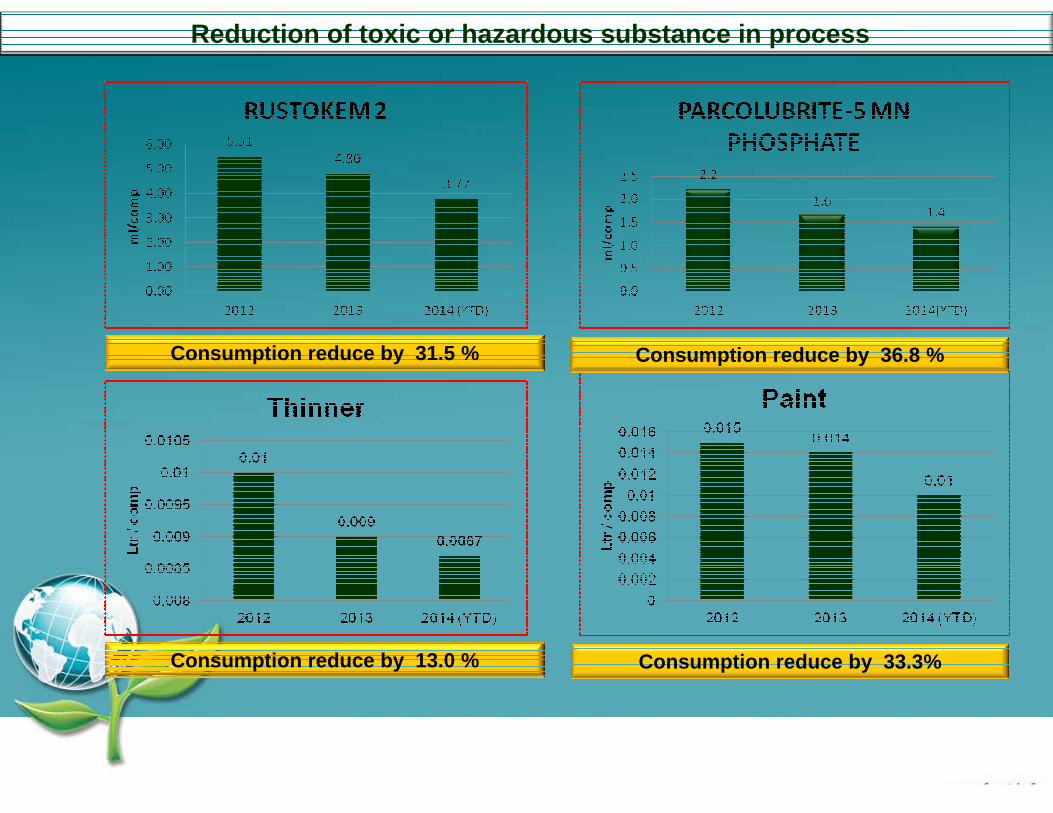
Reduction of toxic or hazardous substance in proces s
Consumption reduce by 13.0 % Consumption reduce by 33.3%
Consumption reduce by 31.5 % Consumption reduce by 36.8 %
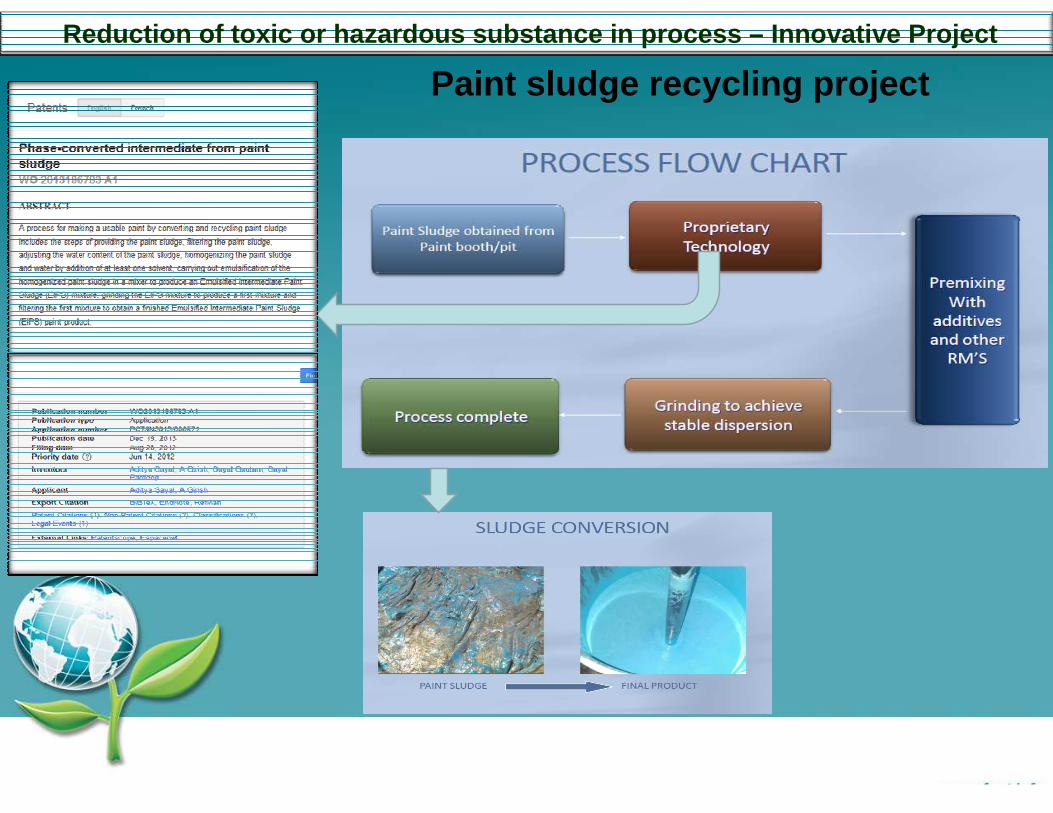
Reduction of toxic or hazardous substance in proces s – Innovative Project
Paint sludge recycling project
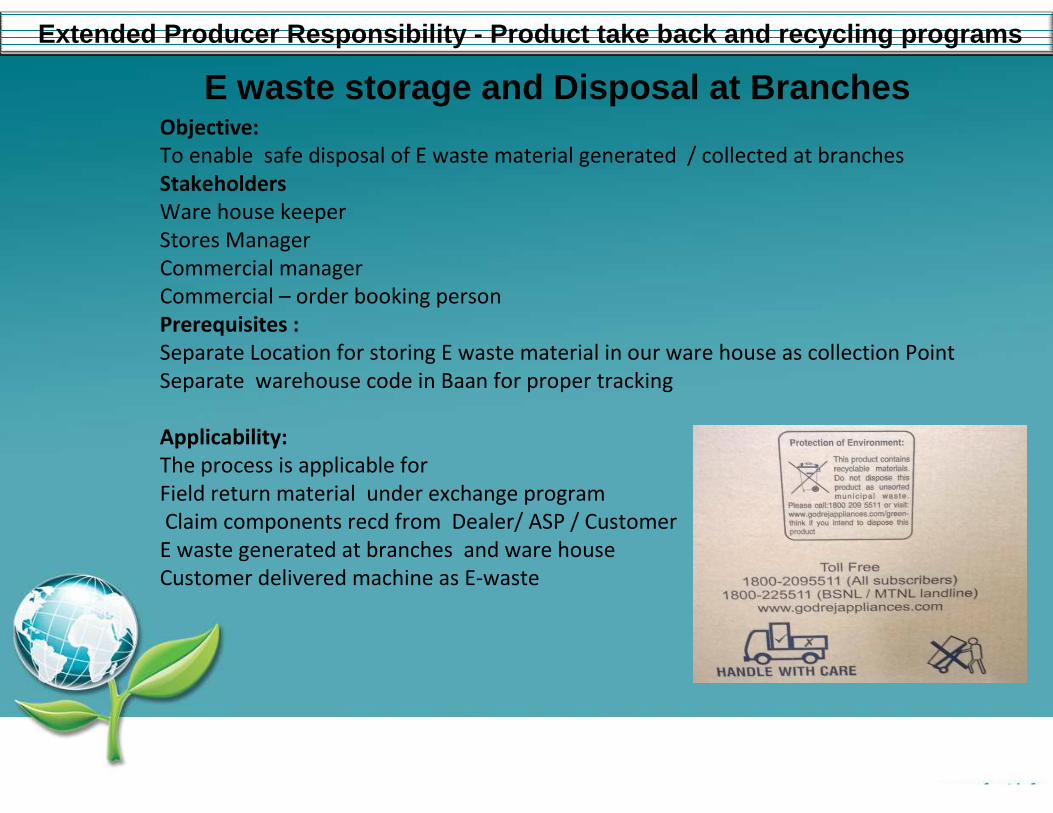
Extended Producer Responsibility - Product take back and recycling programs
Objective:
To enable safe disposal of E waste material generated / collected at branches
Stakeholders
Ware house keeper
Stores Manager
Commercial manager
Commercial – order booking person
Prerequisites :
Separate Location for storing E waste material in our ware house as collection Point
Separate warehouse code in Baan for proper tracking
Applicability:
The process is applicable for
Field return material under exchange program
Claim components recd from Dealer/ ASP / Customer
E waste generated at branches and ware house
Customer delivered machine as E-waste
E waste storage and Disposal at Branches

Extended Producer Responsibility - Product take back and recycling programs
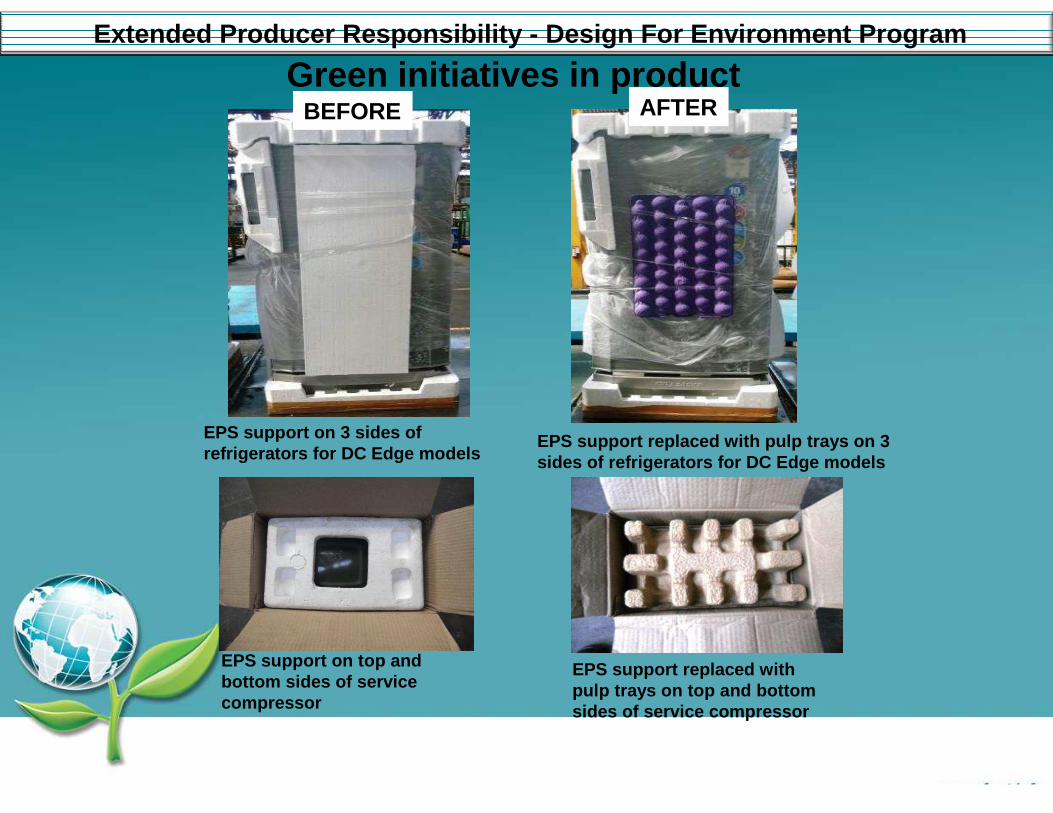
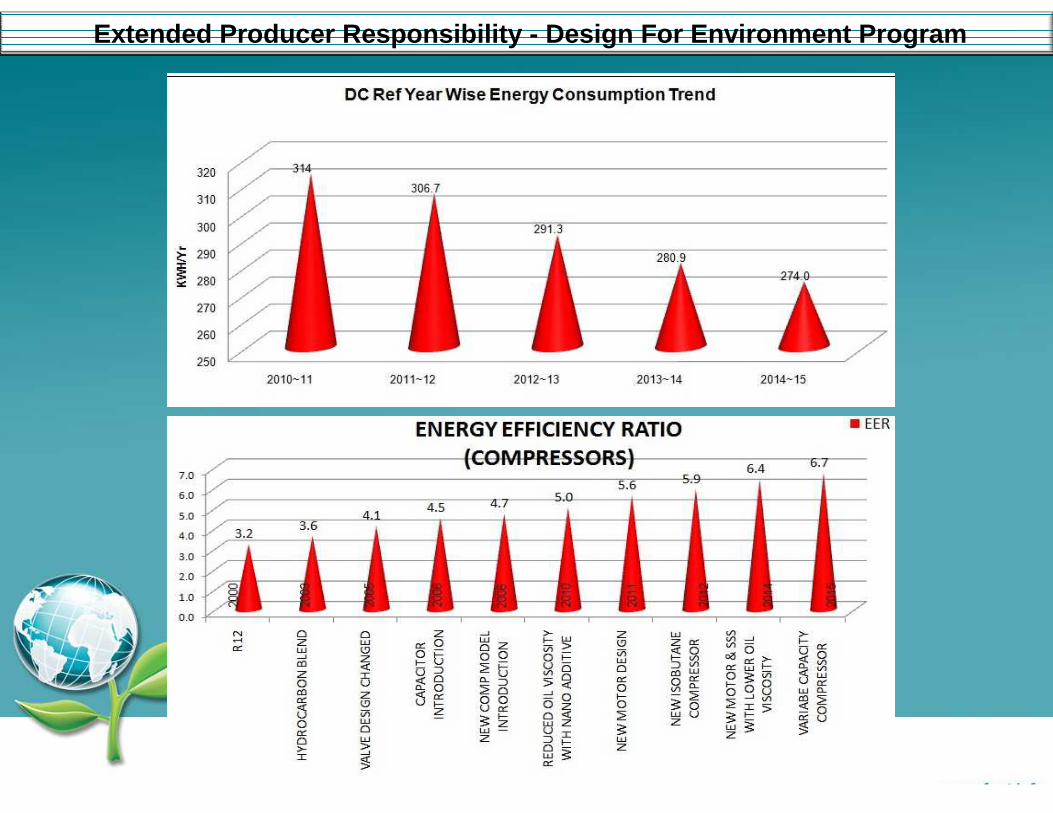
Extended Producer Responsibility - Design For Enviro nment Program
Green initiatives in product
EPS support on 3 sides of refrigerators for DC Edge models
EPS support replaced with pulp trays on 3 sides of refrigerators for DC Edge models
BEFORE AFTER
EPS support on top and bottom sides of service compressor
EPS support replaced with pulp trays on top and bottom sides of service compressor
Extended Producer Responsibility - Design For Enviro nment Program

24
Engagement to voluntary codes and standards and als o directives for reducing environmental impact
� Compliance to CII commandments on MSG initiatives
Sustainability Reporting System (SoFi)
Engagement to voluntary codes and standards and als o directives for reducing environmental impact
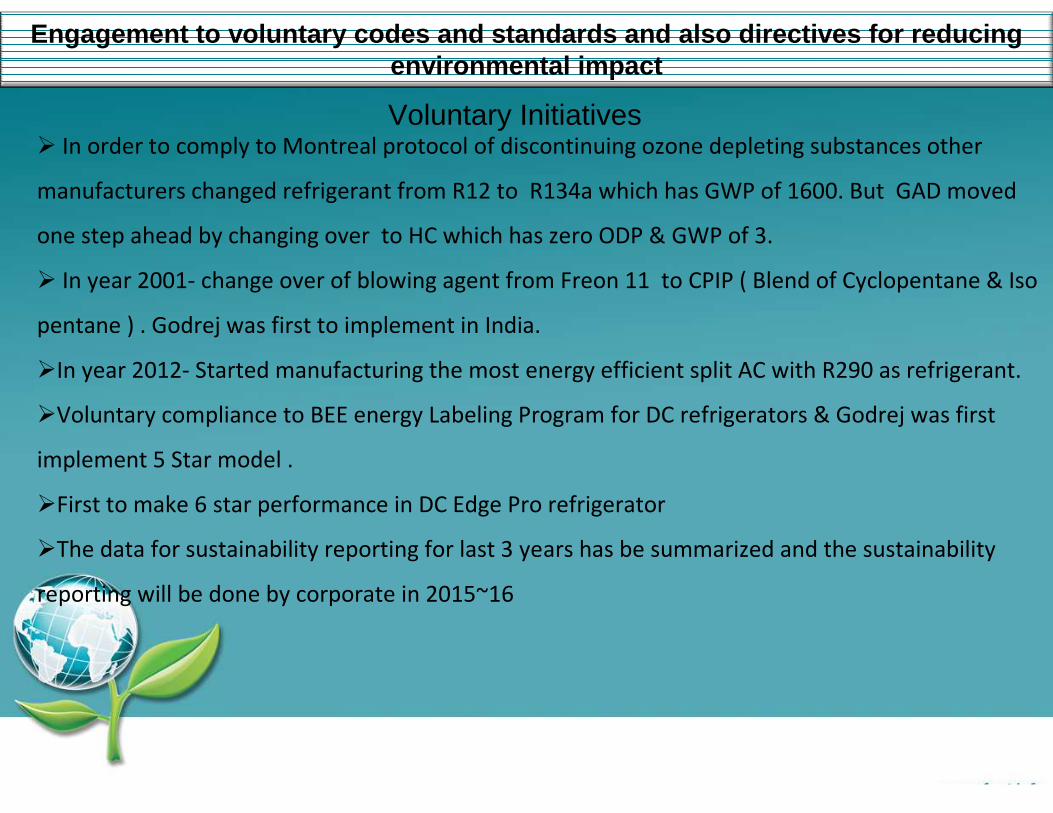
Voluntary Initiatives � In order to comply to Montreal protocol of discontinuing ozone depleting substances other
manufacturers changed refrigerant from R12 to R134a which has GWP of 1600. But GAD moved
one step ahead by changing over to HC which has zero ODP & GWP of 3.
� In year 2001- change over of blowing agent from Freon 11 to CPIP ( Blend of Cyclopentane & Iso
pentane ) . Godrej was first to implement in India.
�In year 2012- Started manufacturing the most energy efficient split AC with R290 as refrigerant.
�Voluntary compliance to BEE energy Labeling Program for DC refrigerators & Godrej was first
implement 5 Star model .
�First to make 6 star performance in DC Edge Pro refrigerator
�The data for sustainability reporting for last 3 years has be summarized and the sustainability
reporting will be done by corporate in 2015~16

LIFE CYCLE ASSESSMENT
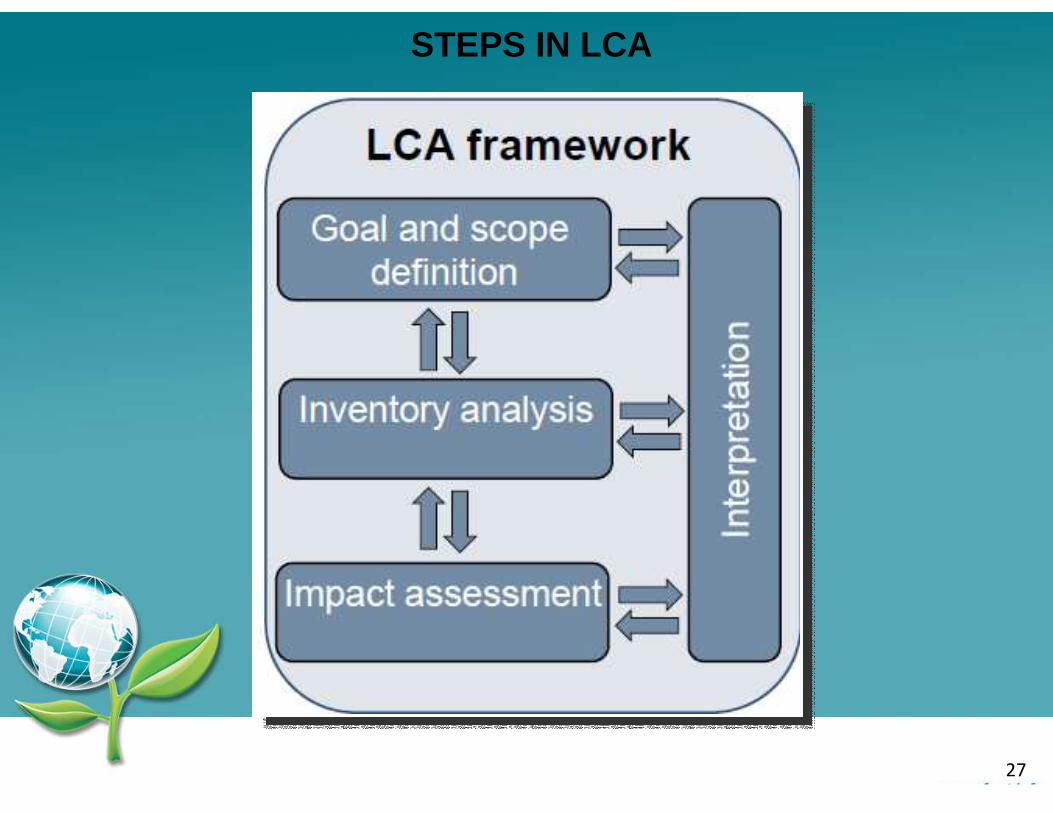
LCA : A method/tool for the estimation of the environmental and human
health impacts that are connected with a product/service /process /technology
over the whole life cycle from cradle to grave.
26
27
STEPS IN LCA
� To study the environmental impact of the various processes involved during complete life cycle of DC refrigerators and hermetic compressors.
�To provide users with the best in class refrigerators and compressors with most eco-friendly technology and approach.
� Identify areas and opportunities for improvements.
� Identify information and data gaps within the system boundary.
OBJECTIVE BEHIND CONDUCTING LCA
2
8
Short Term Mid Term Long Term
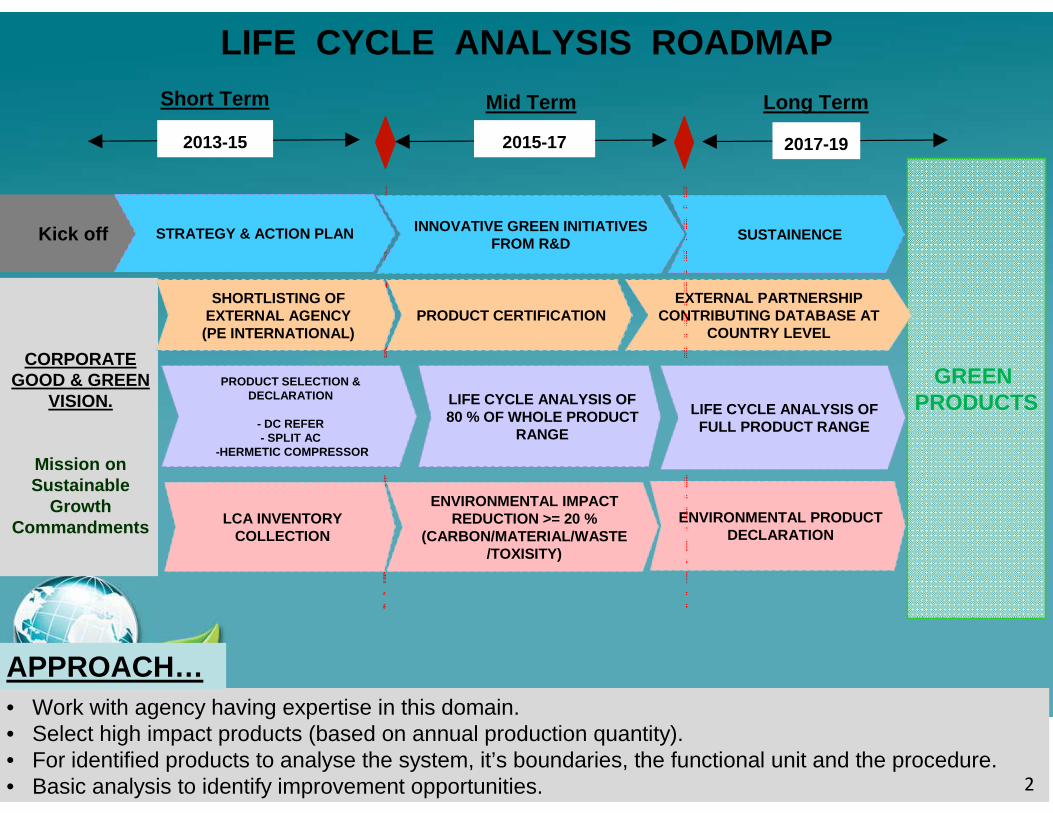
• Work with agency having expertise in this domain.• Select high impact products (based on annual production quantity).• For identified products to analyse the system, it’s boundaries, the functional unit and the procedure.• Basic analysis to identify improvement opportunities.
LIFE CYCLE ANALYSIS ROADMAP
APPROACH…
GREEN PRODUCTS
2015-172013-15 2017-19
SUSTAINENCE
ENVIRONMENTAL PRODUCT DECLARATION
EXTERNAL PARTNERSHIP CONTRIBUTING DATABASE AT
COUNTRY LEVEL
INNOVATIVE GREEN INITIATIVES FROM R&DKick off STRATEGY & ACTION PLAN
CORPORATE GOOD & GREEN
VISION.
Mission on Sustainable
Growth Commandments LCA INVENTORY
COLLECTION
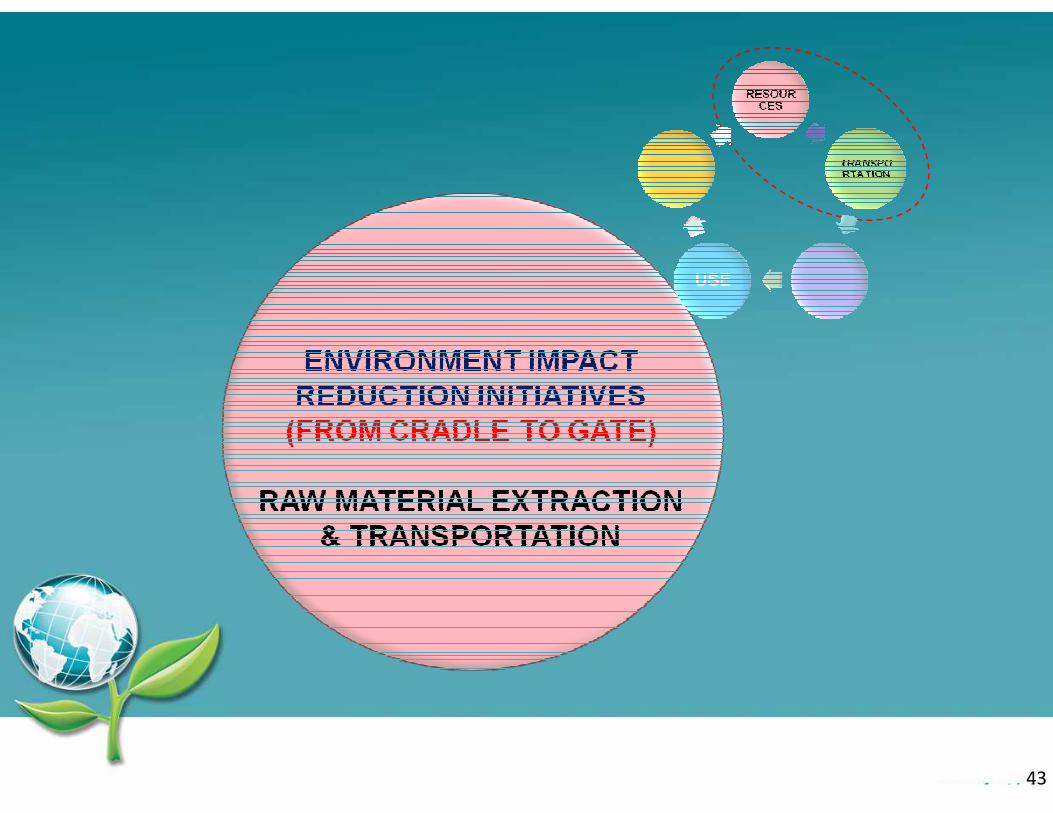
ENVIRONMENTAL IMPACT REDUCTION >= 20 %
(CARBON/MATERIAL/WASTE /TOXISITY)
SHORTLISTING OF EXTERNAL AGENCY(PE INTERNATIONAL)
PRODUCT CERTIFICATION
PRODUCT SELECTION & DECLARATION
- DC REFER- SPLIT AC
-HERMETIC COMPRESSOR
LIFE CYCLE ANALYSIS OF 80 % OF WHOLE PRODUCT
RANGE
LIFE CYCLE ANALYSIS OF FULL PRODUCT RANGE
2
9

BOM Inbound Logistics ManufacturingShip to
Consumer Usage LifeProduct
Take backData in Key area for LCA
Data required
Details of material consumed
- Transportation of material.- Mode & Distance of travel
- Conversion processes.- Consumables for the processes.
- Transportation of finished good.- Mode & distance of travel.
- Energy consumption over entire life-cycle during the usage phase
E-waste policy adherence
PrimaryResponsibility
R&D Sourcing Manufacturing LogisticsQE &
ServiceR&D
Anil Sahu Rajiv SharmaPlant(s)-Neeraj MehraRajkumar
Plant(s)-Pravin Sharma
Anil SahuRajkumar Rohit K
LIFE CYCLE ASSESSMENT ARCHITECTURE
SUPPORT OF ALL CRITICAL FUNCTIONS IS ESSENTIAL FOR CONDUCTING LCA STUDY
30
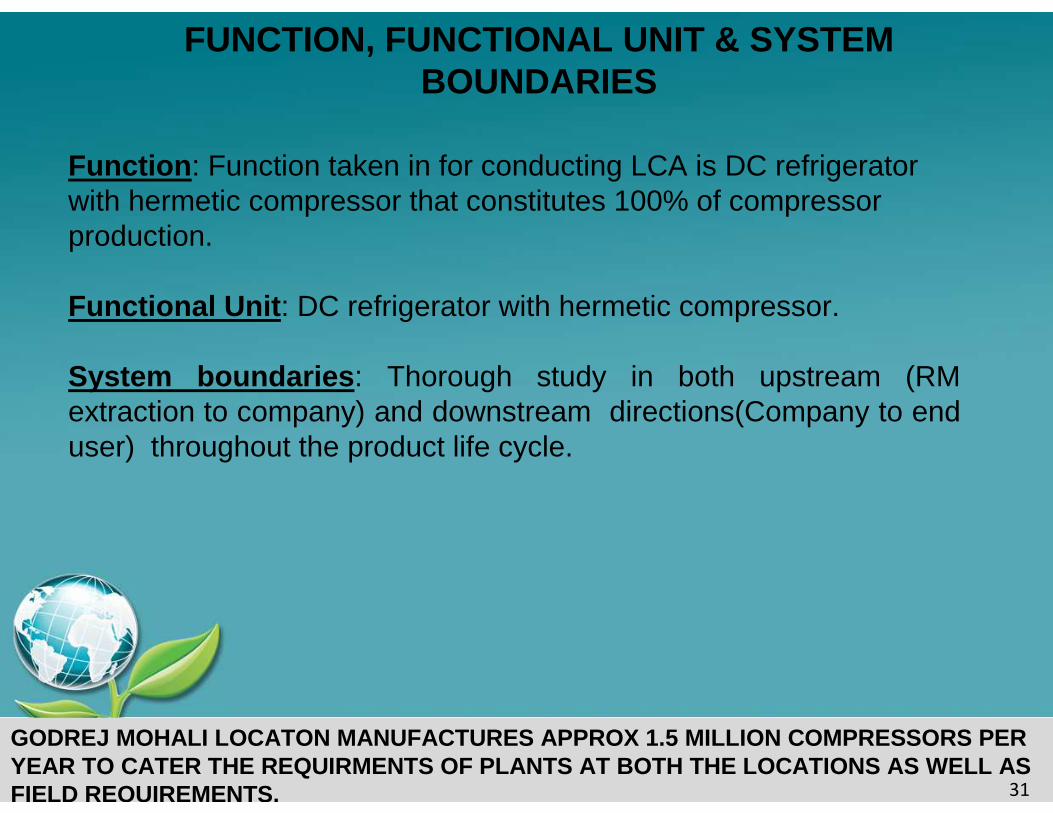
FUNCTION, FUNCTIONAL UNIT & SYSTEM BOUNDARIES
GODREJ MOHALI LOCATON MANUFACTURES APPROX 1.5 MILLI ON COMPRESSORS PER YEAR TO CATER THE REQUIRMENTS OF PLANTS AT BOTH THE LOCATIONS AS WELL AS FIELD REQUIREMENTS. 31
Function : Function taken in for conducting LCA is DC refrigerator with hermetic compressor that constitutes 100% of compressor production.
Functional Unit : DC refrigerator with hermetic compressor.
System boundaries : Thorough study in both upstream (RM extraction to company) and downstream directions(Company to enduser) throughout the product life cycle.
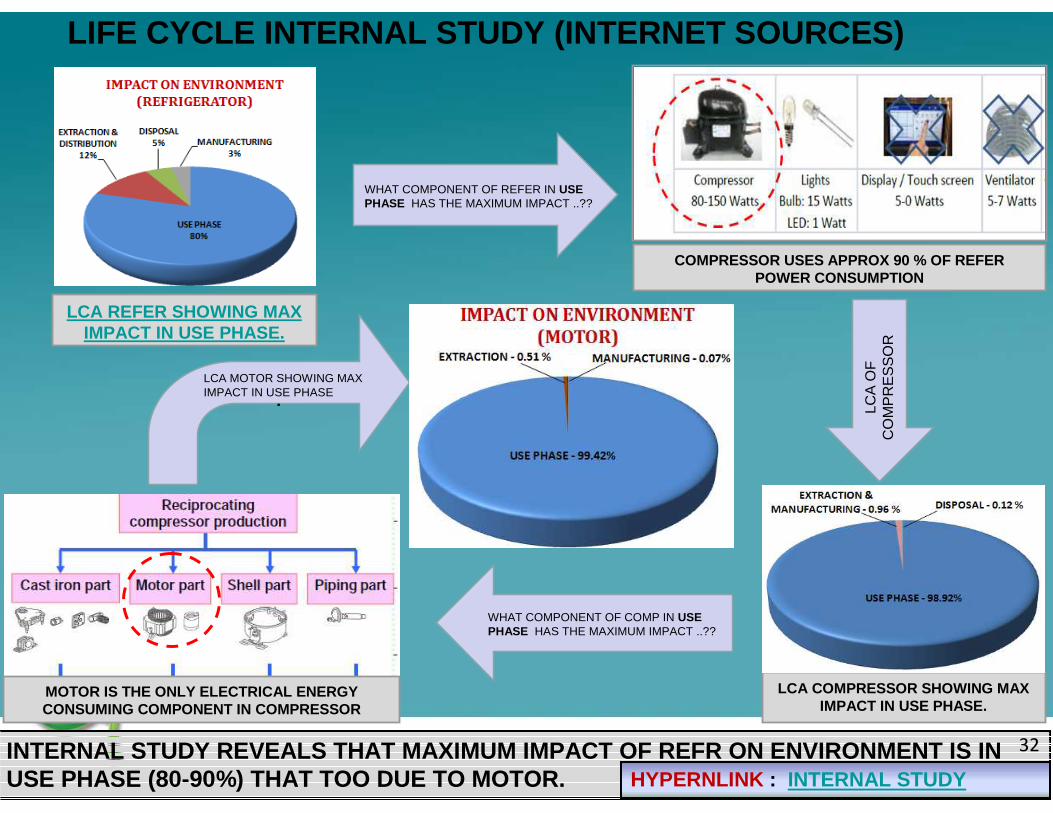
WHAT COMPONENT OF REFER IN USE PHASE HAS THE MAXIMUM IMPACT ..??
COMPRESSOR USES APPROX 90 % OF REFER POWER CONSUMPTION
LCA
OF
C
OM
PR
ES
SO
R
MOTOR IS THE ONLY ELECTRICAL ENERGY CONSUMING COMPONENT IN COMPRESSOR
.LCA MOTOR SHOWING MAX IMPACT IN USE PHASE
LCA REFER SHOWING MAX IMPACT IN USE PHASE.
LCA COMPRESSOR SHOWING MAX IMPACT IN USE PHASE.
LIFE CYCLE INTERNAL STUDY (INTERNET SOURCES)
INTERNAL STUDY REVEALS THAT MAXIMUM IMPACT OF REFR ON ENVIRONMENT IS IN USE PHASE (80-90%) THAT TOO DUE TO MOTOR.
32
WHAT COMPONENT OF COMP IN USE PHASE HAS THE MAXIMUM IMPACT ..??
HYPERNLINK : INTERNAL STUDY

FOR THIS REASON WE ADOPTED BOTTOM - UP APPROACH AND INITIATED LCA STUDY OF MOTOR FIRST AND COMPLETED IT WITH GODREJ LAWKM . THE SAME IS ATTACHED HEREWITH..
LCA REFRIGERATOR
LCA COMPRESSOR
LCAMOTOR
OUR ACTON PLAN FOR CONDUCTING LCA
13
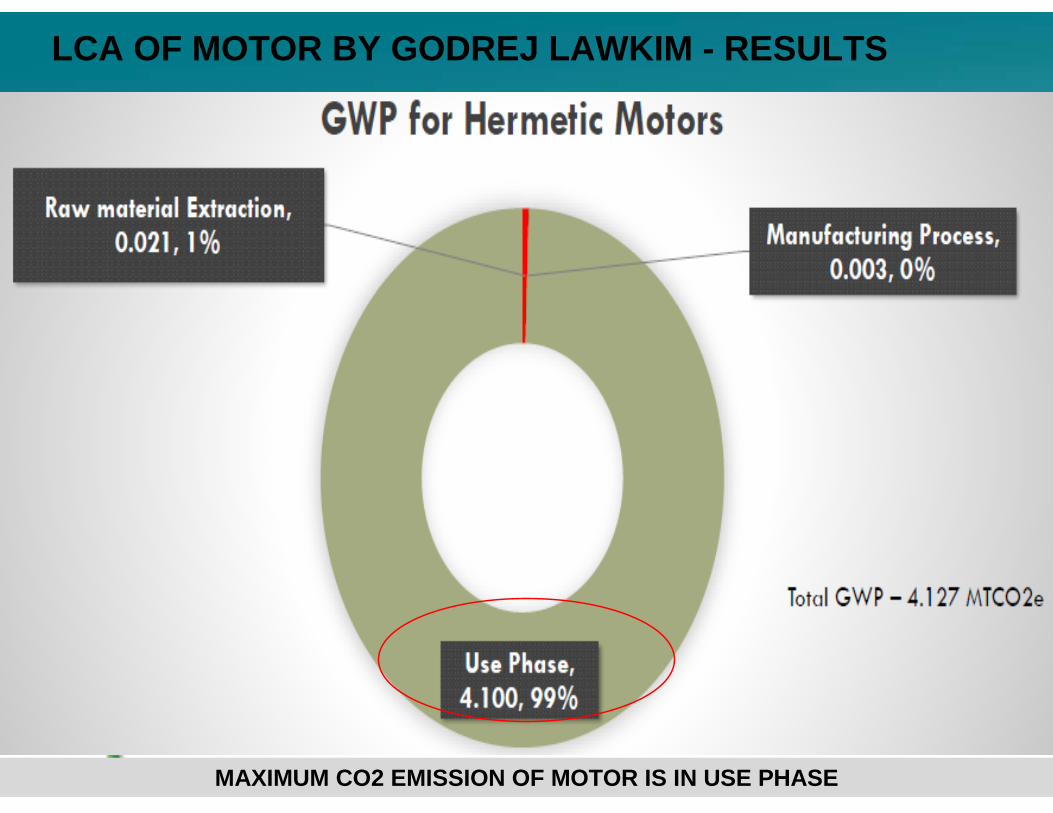
LCA OF MOTOR BY GODREJ LAWKIM - RESULTS
16MAXIMUM CO2 EMISSION OF MOTOR IS IN USE PHASE
35
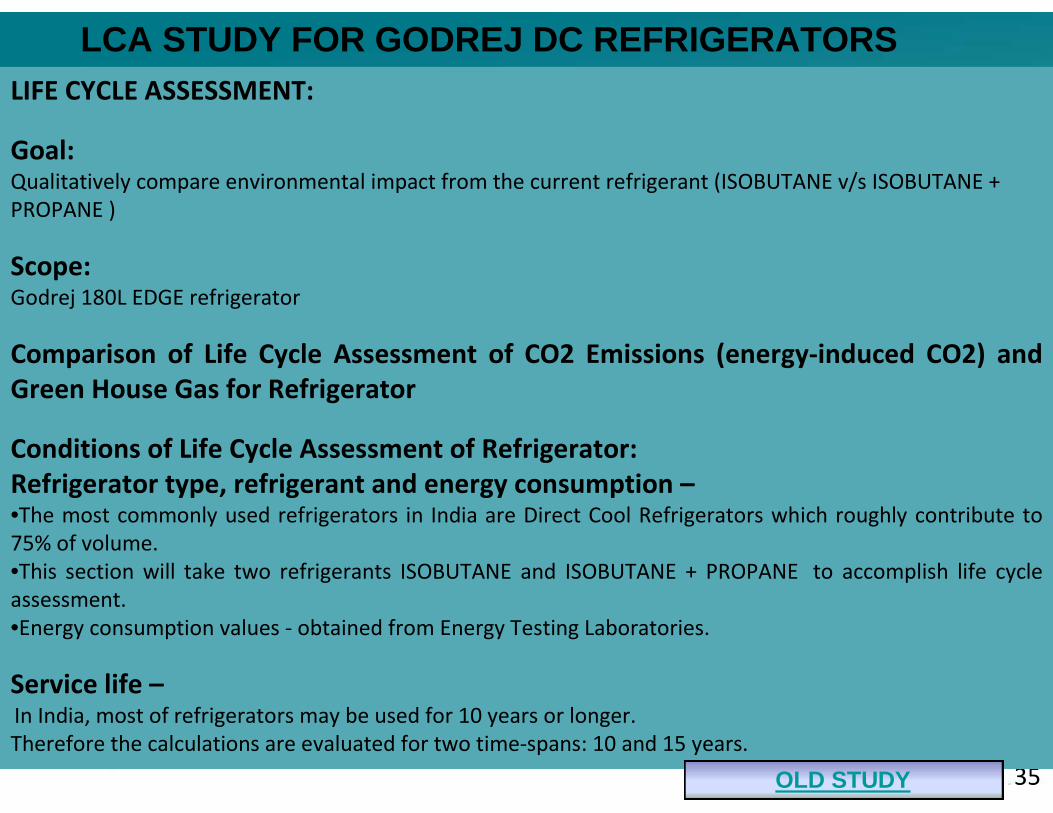
LIFE CYCLE ASSESSMENT:
Goal:Qualitatively compare environmental impact from the current refrigerant (ISOBUTANE v/s ISOBUTANE +
PROPANE )
Scope:Godrej 180L EDGE refrigerator
Comparison of Life Cycle Assessment of CO2 Emissions (energy-induced CO2) and
Green House Gas for Refrigerator
Conditions of Life Cycle Assessment of Refrigerator:
Refrigerator type, refrigerant and energy consumption –•The most commonly used refrigerators in India are Direct Cool Refrigerators which roughly contribute to
75% of volume.
•This section will take two refrigerants ISOBUTANE and ISOBUTANE + PROPANE to accomplish life cycle
assessment.
•Energy consumption values - obtained from Energy Testing Laboratories.
Service life –In India, most of refrigerators may be used for 10 years or longer.
Therefore the calculations are evaluated for two time-spans: 10 and 15 years.
LCA STUDY FOR GODREJ DC REFRIGERATORS
OLD STUDY
36
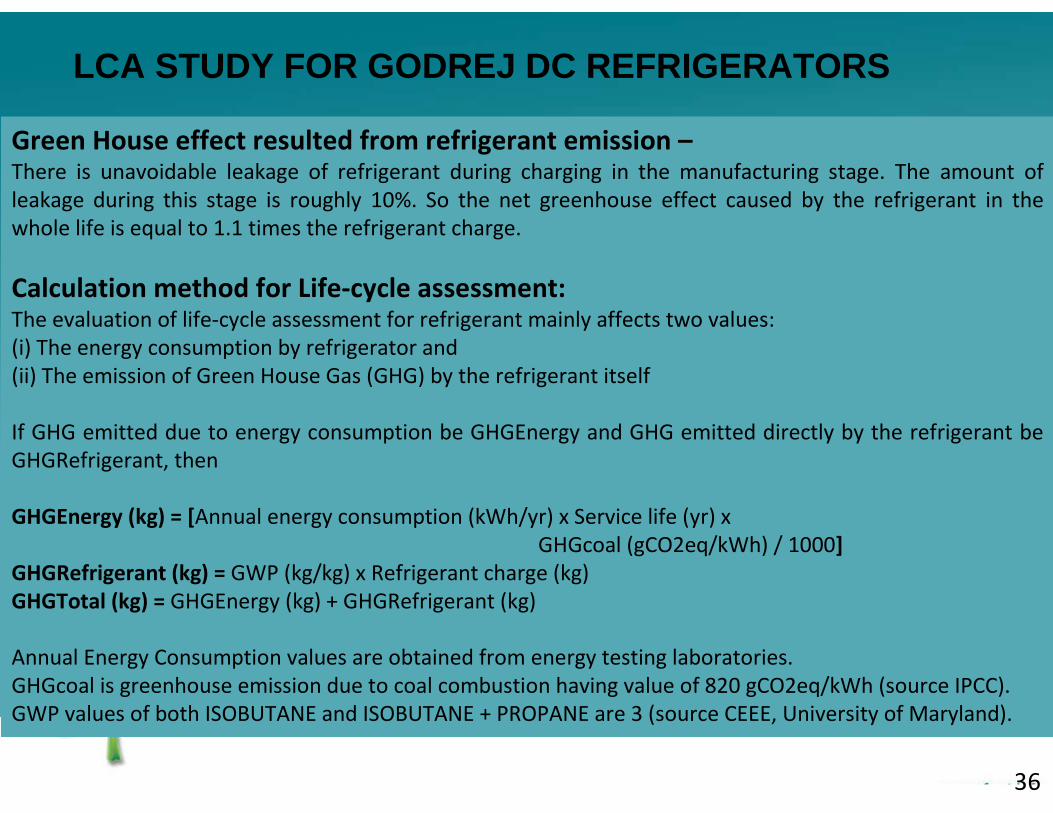
Green House effect resulted from refrigerant emission –There is unavoidable leakage of refrigerant during charging in the manufacturing stage. The amount of
leakage during this stage is roughly 10%. So the net greenhouse effect caused by the refrigerant in the
whole life is equal to 1.1 times the refrigerant charge.
Calculation method for Life-cycle assessment:The evaluation of life-cycle assessment for refrigerant mainly affects two values:
(i) The energy consumption by refrigerator and
(ii) The emission of Green House Gas (GHG) by the refrigerant itself
If GHG emitted due to energy consumption be GHGEnergy and GHG emitted directly by the refrigerant be
GHGRefrigerant, then
GHGEnergy (kg) = [Annual energy consumption (kWh/yr) x Service life (yr) x
GHGcoal (gCO2eq/kWh) / 1000]
GHGRefrigerant (kg) = GWP (kg/kg) x Refrigerant charge (kg)
GHGTotal (kg) = GHGEnergy (kg) + GHGRefrigerant (kg)
Annual Energy Consumption values are obtained from energy testing laboratories.
GHGcoal is greenhouse emission due to coal combustion having value of 820 gCO2eq/kWh (source IPCC).
GWP values of both ISOBUTANE and ISOBUTANE + PROPANE are 3 (source CEEE, University of Maryland).
LCA STUDY FOR GODREJ DC REFRIGERATORS
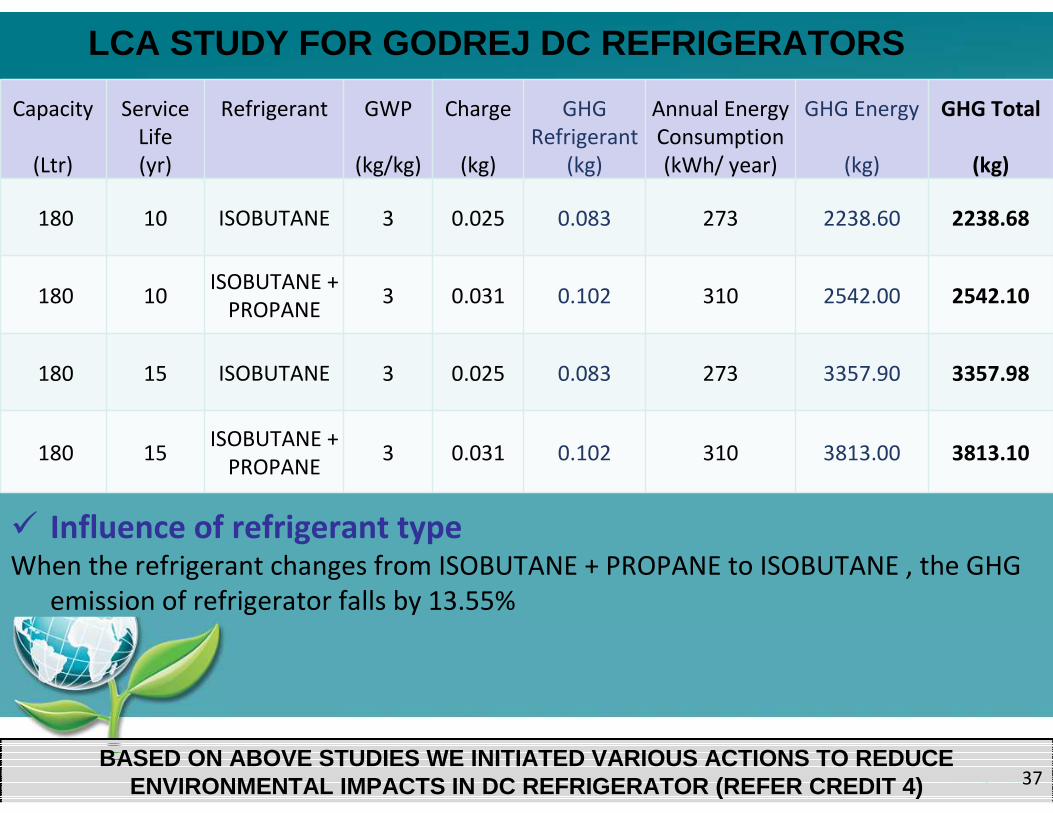
� Influence of refrigerant typeWhen the refrigerant changes from ISOBUTANE + PROPANE to ISOBUTANE , the GHG
emission of refrigerator falls by 13.55%
LCA STUDY FOR GODREJ DC REFRIGERATORS
BASED ON ABOVE STUDIES WE INITIATED VARIOUS ACTIONS TO REDUCE ENVIRONMENTAL IMPACTS IN DC REFRIGERATOR (REFER CRE DIT 4)
Capacity
(Ltr)
Service
Life
(yr)
Refrigerant GWP
(kg/kg)
Charge
(kg)
GHG
Refrigerant
(kg)
Annual Energy
Consumption
(kWh/ year)
GHG Energy
(kg)
GHG Total
(kg)
180 10 ISOBUTANE 3 0.025 0.083 273 2238.60 2238.68
180 10ISOBUTANE +
PROPANE 3 0.031 0.102 310 2542.00 2542.10
180 15 ISOBUTANE 3 0.025 0.083 273 3357.90 3357.98
180 15ISOBUTANE +
PROPANE 3 0.031 0.102 310 3813.00 3813.10
37
LCA CREDIT 4Environment impact reduction at each stage
LIFE CYCE
ASSESSMENT
38
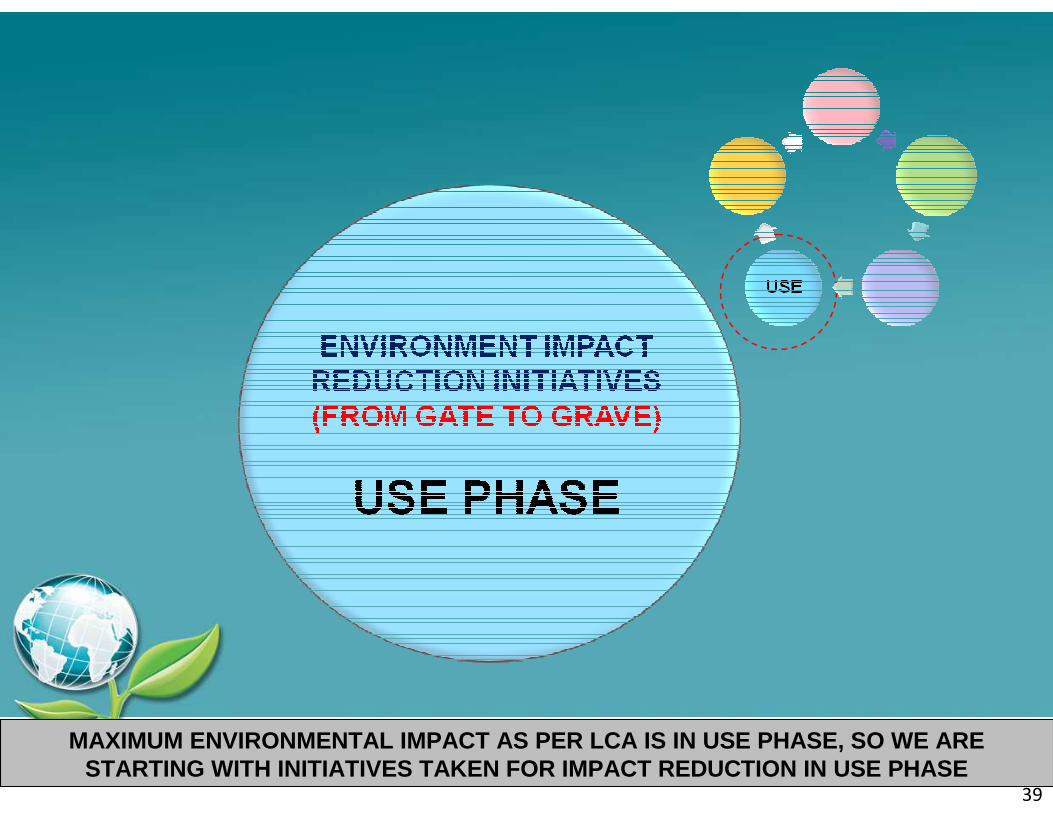
MAXIMUM ENVIRONMENTAL IMPACT AS PER LCA IS IN USE P HASE, SO WE ARE STARTING WITH INITIATIVES TAKEN FOR IMPACT REDUCTIO N IN USE PHASE
39
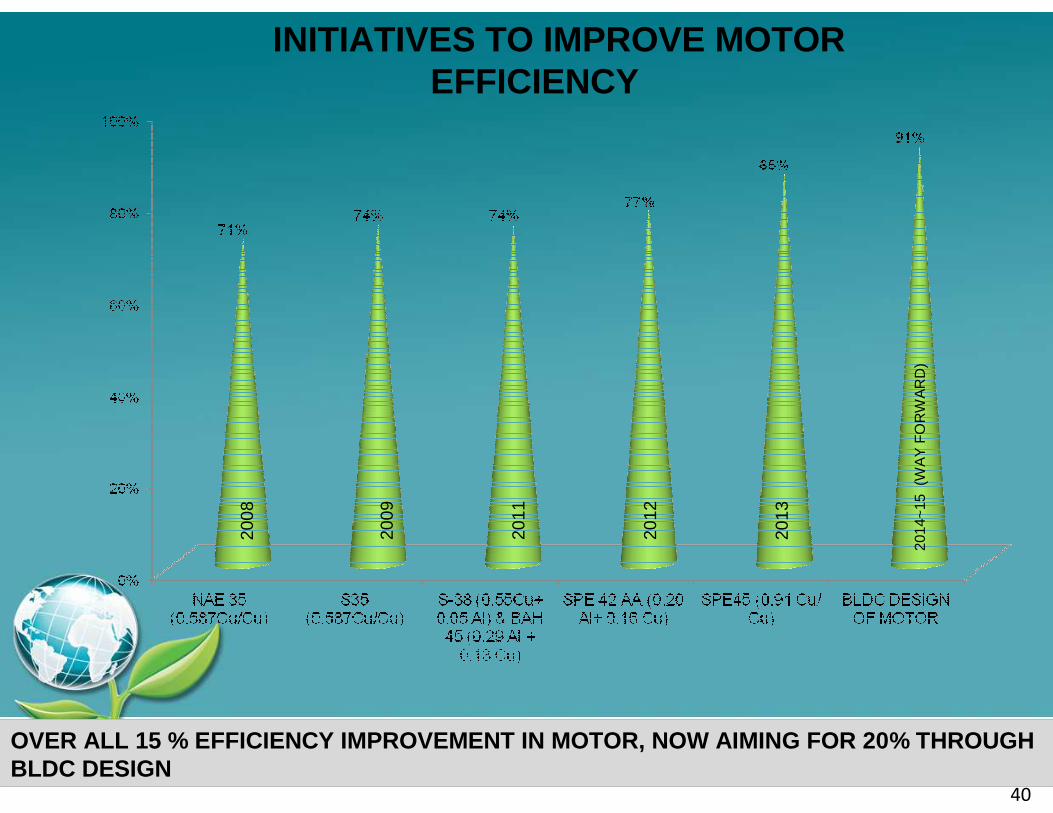
INITIATIVES TO IMPROVE MOTOR EFFICIENCY
2008
2014
~15
(W
AY
FO
RW
AR
D)
2012
2013
2011
2009
OVER ALL 15 % EFFICIENCY IMPROVEMENT IN MOTOR, NOW AIMING FOR 20% THROUGH BLDC DESIGN
40
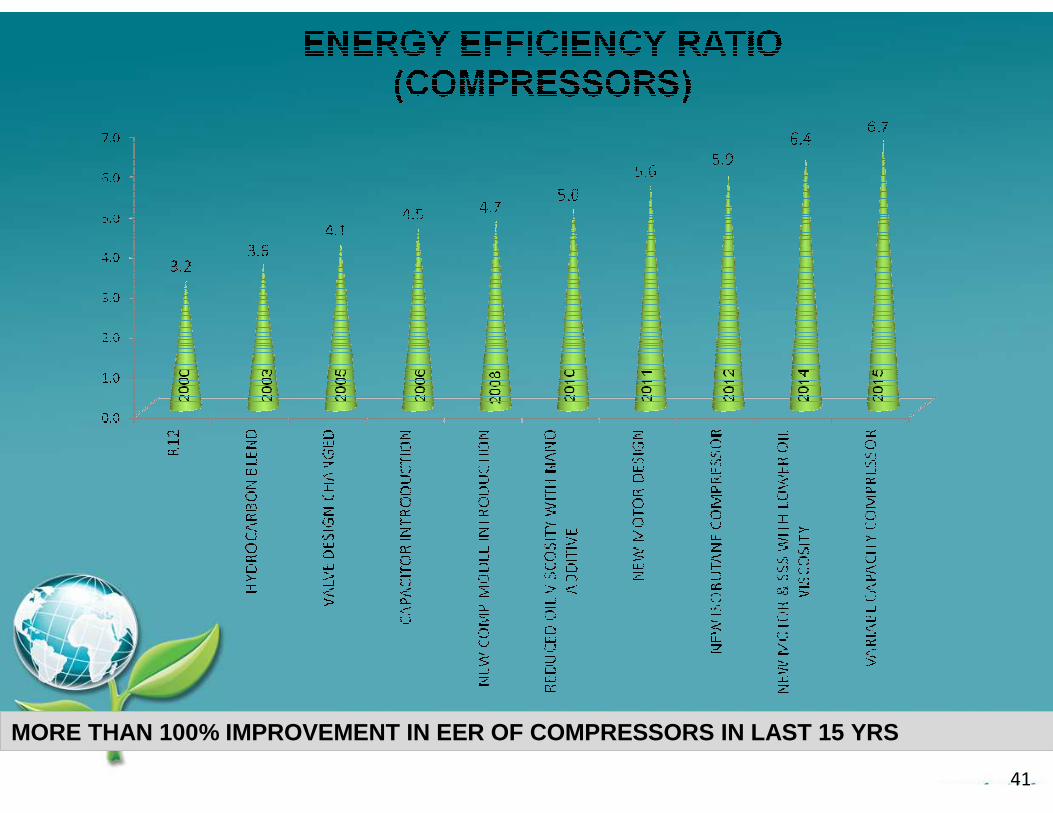
MORE THAN 100% IMPROVEMENT IN EER OF COMPRESSORS IN LAST 15 YRS
41
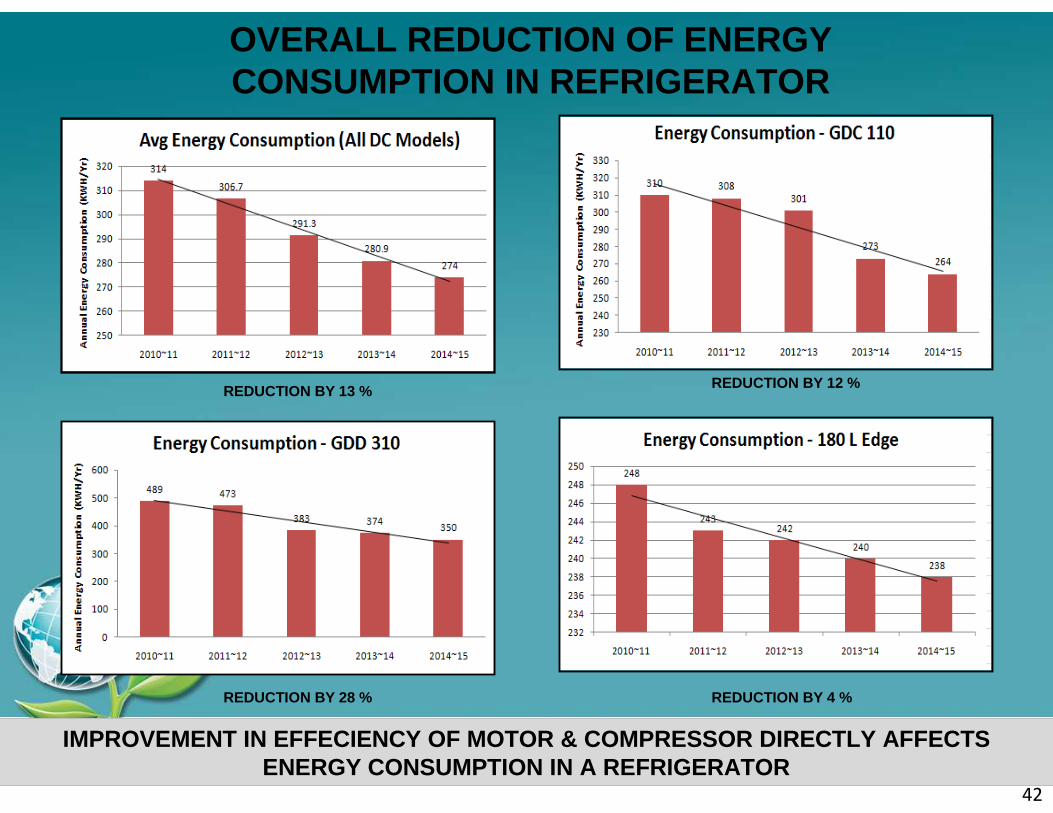
REDUCTION BY 13 %
REDUCTION BY 4 %
REDUCTION BY 12 %
REDUCTION BY 28 %
42
OVERALL REDUCTION OF ENERGY CONSUMPTION IN REFRIGERATOR
IMPROVEMENT IN EFFECIENCY OF MOTOR & COMPRESSOR DIRECTLY AFFECTSENERGY CONSUMPTION IN A REFRIGERATOR
42
43
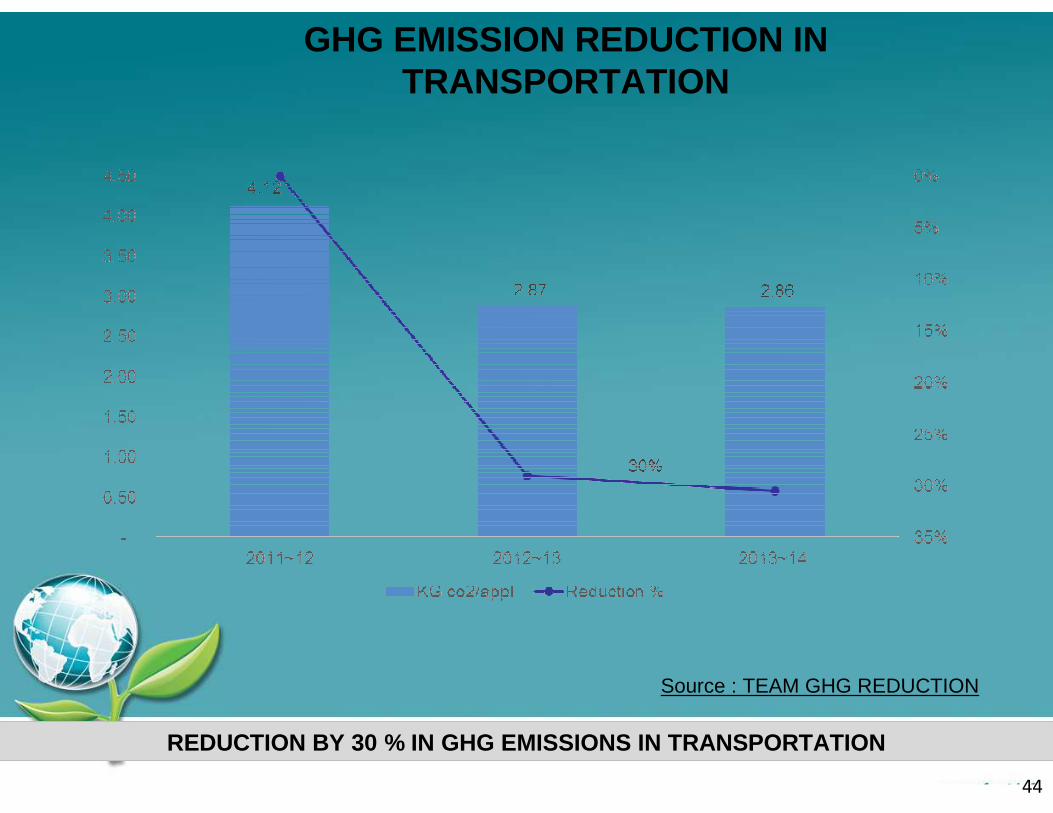
GHG EMISSION REDUCTION IN TRANSPORTATION
REDUCTION BY 30 % IN GHG EMISSIONS IN TRANSPORTATIO N
44
Source : TEAM GHG REDUCTION
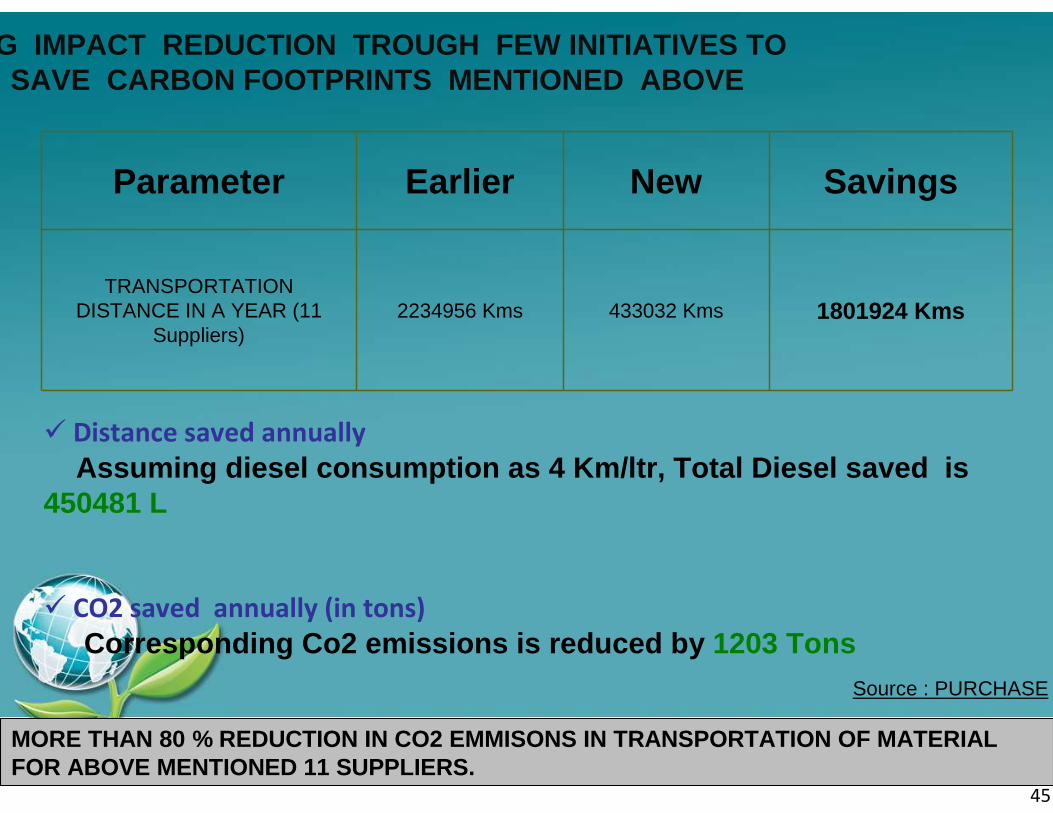
Parameter Earlier New Savings
TRANSPORTATION DISTANCE IN A YEAR (11
Suppliers)2234956 Kms 433032 Kms 1801924 Kms
� Distance saved annually
Assuming diesel consumption as 4 Km/ltr, Total Dies el saved is 450481 L
� CO2 saved annually (in tons)
Corresponding Co2 emissions is reduced by 1203 Tons
MORE THAN 80 % REDUCTION IN CO2 EMMISONS IN TRANSPORTATION OF MATERIAL FOR ABOVE MENTIONED 11 SUPPLIERS.
45
Source : PURCHASE
GHG IMPACT REDUCTION TROUGH FEW INITIATIVES TO SAVE CARBON FOOTPRINTS MENTIONED ABOVE
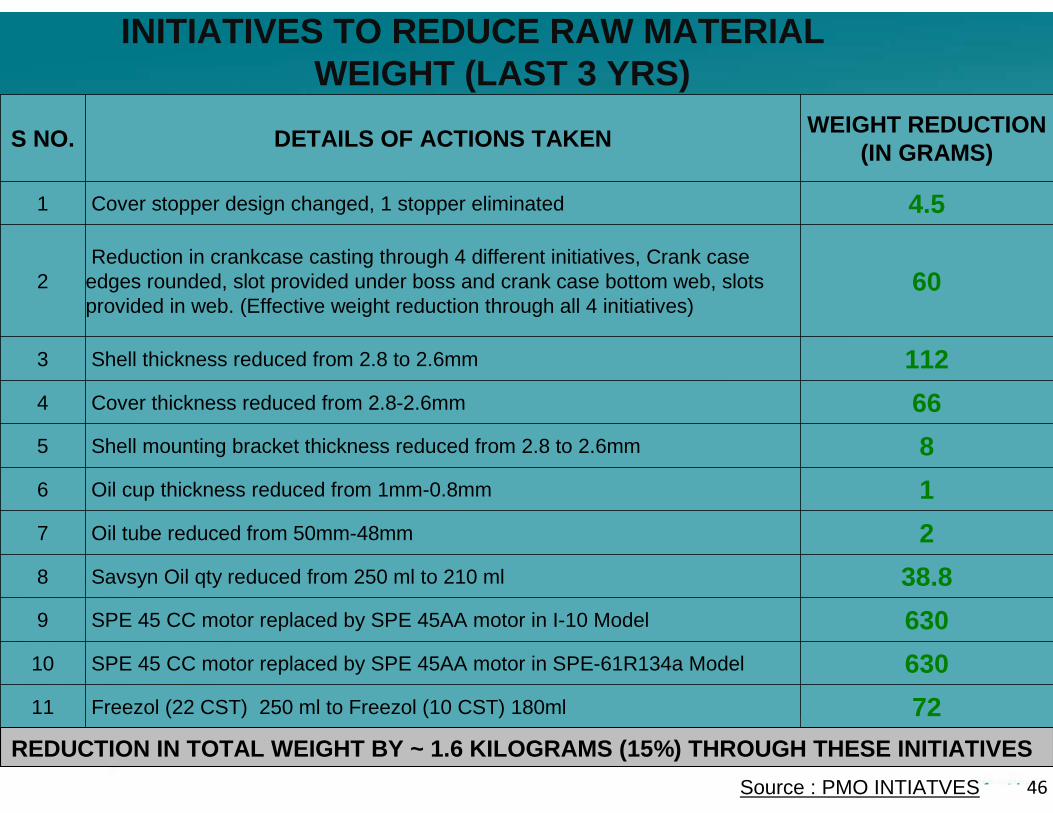
S NO. DETAILS OF ACTIONS TAKENWEIGHT REDUCTION
(IN GRAMS)
1 Cover stopper design changed, 1 stopper eliminated 4.5
2Reduction in crankcase casting through 4 different initiatives, Crank case
edges rounded, slot provided under boss and crank case bottom web, slots provided in web. (Effective weight reduction through all 4 initiatives)
60
3 Shell thickness reduced from 2.8 to 2.6mm 112
4 Cover thickness reduced from 2.8-2.6mm 66
5 Shell mounting bracket thickness reduced from 2.8 to 2.6mm 8
6 Oil cup thickness reduced from 1mm-0.8mm 1
7 Oil tube reduced from 50mm-48mm 2
8 Savsyn Oil qty reduced from 250 ml to 210 ml 38.8
9 SPE 45 CC motor replaced by SPE 45AA motor in I-10 Model 630
10 SPE 45 CC motor replaced by SPE 45AA motor in SPE-61R134a Model 630
11 Freezol (22 CST) 250 ml to Freezol (10 CST) 180ml 72
REDUCTION IN TOTAL WEIGHT BY ~ 1.6 KILOGRAMS (15%) THROUGH THESE INITIATIVES
46Source : PMO INTIATVES
INITIATIVES TO REDUCE RAW MATERIAL WEIGHT (LAST 3 YRS)
47

Reduction is 20.5% in
last 3 years
(excluding Additional 0.41 SPC)
0.41
Reduction is
23.6% in last
4 years.
SPECIFIC ENERGY CONSUMPTION (ELECTRICAL) KWH/PRODUCT
21 % REDUCTION IN SPECIFIC POWER CONSUMPTION IN LAST 3 YEARS TILL 201448
Source : TEAM ENERGY EFFICIENCY

EQ
U. H
SD
Lit/
Pro
duct
Reduction is 22.9%
in last 3 years
Reduction is
43.75% in last 4
years
SPECIFIC ENERGY CONSUMPTION (THERMAL) KWH/PRODUCT
EQU. HSD (LTRS)/PRODUCT REDUCED BY 23 % IN LAST 3 YEARS TILL 2014
49
Source : TEAM ENERGY EFFICIENCY

Calculation of % reduction in SWC = [[SWC (2010-11) - SWC (Year 2013-14)]/SWC (Year 2010-11)]*100
% reduction in SWC = 18.61 %
REDUCTION IN WATER CONSUMPTION
Source : TEAM WATER CONSERVATION
Calculation of % reduction in SWC = [[SWC (2006-07) - SWC (Year 2013-14)]/SWC (Year 2006-07)]*100
% reduction in SWC = 51.06 %
WATER CONSUMPTION REDUCED BY 18.61 % IN LAST 3 YEA RS .
50

� Idle Sludge filter press of P/C dept to be installed at ETP for early completely drying the ETP sludge.
� Optimized the chemical dosing by installing the new dosing pumps and ON Line pH indicators at different stages. Which leads to reduction in sludge generation.
� New Sludge drying beds installed for drying the sludge completely and improving the treated water quality.
� Reduction in generation of ETP sludge by reusing of process water from leak testing tank to cooling towers.
Calculation of % reduction in SHW = [[SHW(2011-12) - SHW(Year 2013-14)]/SHW (Year 2011-12)] * 100 % reduction in SHW = 25.02 %
Projects implemented in reduction of Hazardous wast e in last three years.
HAZARDOUS WASTE MANAGEMENT
HAZARDOUS WASTE REDUCED BY 25.02 % IN LAST 3 YEARS .
Source : TEAM WASTE MANAGEMENT
51

� Change of paper carton packing into recyclable plastic cartons.
� Reduction of polythene packing due to introduction of recyclable plastic cartons.
� Change of Plastic Bags packing into recyclable plastic cartons.
� Introduction of recyclable (assembled) wooden box.
Calculation of % reduction in SNHW = [[SNHW(2011-12) - SNHW(Year 2013-14)]/SNHW (Year 2011-12)] * 100 % reduction in SNHW = 51.10 %
Projects implemented in reduction of Non Hazardous waste in last three years.
NON HAZARDOUS WASTE REDUCED BY 51.10 % IN LAST 3 Y EARS .
NON- HAZARDOUS WASTE MANAGEMENT
Source : TEAM WASTE MANAGEMENT
52

OVERALL GHG EMISSION REDUCTION
OVERALL 22 % REDUCTION IN GHG EMISSIONS
53
Source : TEAM GHG REDUCTION

54

Category Total Units Produced( Annualised)
BOM Content Per Unit (Kg)
Recycled Content per Unit (Kg)
Recycled Content %
Refrigerator 6 Lacs 39.3 9 22.96
Compressors13.5 Lacs 8.5 2.5 28.93
Total 19.5 Lacs 47.8 11.5 25.5
TOTAL % RECYCLED RM CONTENT CONSIDERING ALL CATEGORIES
Source :Material Conservation & Recycling
RECYCLED CONTENT IN RAW MATERIALS – 25.5%
55

Initiative: To make all items used for manufacturing of appliances at Mohali Factory -100% RoHS compliant
Status : Till year 2012, we had 20~25% items with RoHS compliance
Current Status: We took 100% RoHS compliance target with deadline of March 2014 and achieved the same by making suppliers aware of RoHS requirements , tied up with testing lab (M/s SGS , Chakan, Pune) to facilitate suppliers with special discounted rates for RoHS testing, had detailed discussions with each supplier for making step-by-step plan for implementation.
With this efforts, we are now 100% RoHS compliant
Parameter (2012~13) (2013~14) (2014~15)
RoHS compliant items
25% 84% 100%
WE ARE 100% RoHS COMPLIANT
ROHS COMPLIANCE
56

YEAR Generated Recycled Discharged Specific
KL / M³ M³ % M³ % Effluent disposal
2011-12 13779 13779 100 0 0 Gardening
2012-13 18452 18452 100 0 0 Gardening
2013-14 14130 14130 100 0 0 Gardening
2014-15 8694 8694 100 0 0 Gardening
WE ARE AT ZERO DISCHARGE, STP ALSO INSTALLED.
PROCESS EFFLUENT ( ETP ) KL / M ³
57

SUMMARY OF ENVIRONMENT IMPACT REDUCTION
Stages ACTION BENEFIT Reference Parameters
Raw Material
•Reduction in total weight of compressor through recent initiatives
•Reduction in GHG emissions during transportation
15 %
30 %
• PMO Initiatives
• GHG Reduction
Manufacturing
• Reduction in water consumption • Reduction in hazardous substances• Reduction in non hazardous substance• Reduction in specific power consumption.• Reduction in GHG emissons
18.61 % .25.02 %51 %21%22%
• Material Conservation & Recycling• Water Conservation • Product stewardship• Electrical Energy•GHG
Product Usage
•Improvement in over all energy reduction in refrigerators.•Improvement in EER of compressors in last 15 yrs• Overall Improvement in motor efficiency
15~20 %
100 %
15 %
• Product Stewardship• Lawkim
End of life
•RoHS compliance for products
•Recycled content in refrigerator and compressor
100 %
25.5 %
• Material Conservation & Recycling• GSC
58

NATIONAL ENERGY CONSERVATION AWARD - 2009
‘The Emvies’ -2012(One watt project)
CII National Award for Excellence in Energy management-2013
URJAVARAN- 2008
FIRST PRIZE AT NATIONAL ENERGY CONSERVATION AWARDS- 2014
RECOGNITION TO OUR GREEN INITIATIVES
NATIONAL ENERGY CONSERVATION AWARD FOR MOST ENERGY
EFFICIENT REFER 2014
59
AWARDS

-Godrej Appliances Division, Mohali has attained the distinction of being the 2 nd company to be certified Platinum in GreenCo assessment and the 1 st unit on all India basis to go through “platinum category” in the first attempt.
GREEN CO PLATINUM RATING GREEN CO PLATINUM RATING

The data provided is reliable, all the figures mentioned are of high certainty to the best of our knowledge.
LET’S GO GREEN
Thanks…….
61
TOWARDS GREENER FUTURE..