Embed Size (px)
Citation preview
CHAPTER
9 Management Control Systemsand Responsibility Accounting
LEARNING OBJECTIVESWhen you have finished studying this chapter,you should be able to:
I. Describe Ihc relationshipof management control systems to organisational goals.
2. Explain the importance of evaluating performance and describe how it impacts motivation,
goal congruence, and employee effort.
3. Developperformance measures and use them to monitor the achievements of anorganization.
4. Use responsibility accounting to define an organizational suhunit as a cost center, a profitcenter, or an investment center.
5. Prepare segment income statements for evaluating prolit and investment centers using thecontribution margin andcontrollable-cost concepts.
6. Measure performance against nonfinancial performance measures such as quality, cycletime, and productivity.
7. Use a balanced .xcorccard to integrate financial and nonfinancial measures of performance.
8. Describe the difficulties of management control in service and nonprofit organizations.
ÿ HEALTH NET
It's 2:30 am.You don't feel well. Should you call your doctor? Go to the emergency room? Is whatyou're feeling really something to worry about? What you need is good quality health care and youneed it now.not tomorrow morning,and you do not want to worry about its cost Sound familiar? Thisis a dilemma that we have all faced at some time. One health-care organization that has a solution is
Health Net.one of the largest managed health-care organizations in the United States.With approxi¬mately 7.500 employees and 201 1 revenues of about $12 billion, it provides coverage to 5.6 millionhealth plan members.
Health-care organizations must compete Just as any other business, offering high-quality healthcare at an affordable cost. To maintain its competitive advantage. Health Net undertook a major infor¬mation systems development program called "fourth generation medical management" Accordingto Dr. Malik Hasan, former chairman and CEO. Health Net created this new management controlsystem "because the greatest opportunity for increasing overall quality and decreasing the cost ofhealth care lies in managing patient care by seamlessly linking the entire health care delivery systemelectronically." The system "gives physicians and health care providers instant, user-friendly electronicaccess to comprehensive information about a patient's medical history and the best dinical treatments
recommended."The result? A fast and preapproved referral to the best dinical resource, whether it be a spe¬
cialist the emergency room or urgent care center, your regular physician, or safe self-care. In otherwords, a satisfied customer! And as a bonus, costs arc reduced. As Medical Director John Danaher.MD. explains. "Paper charting and duplicative lab and radiology tests are eliminated "
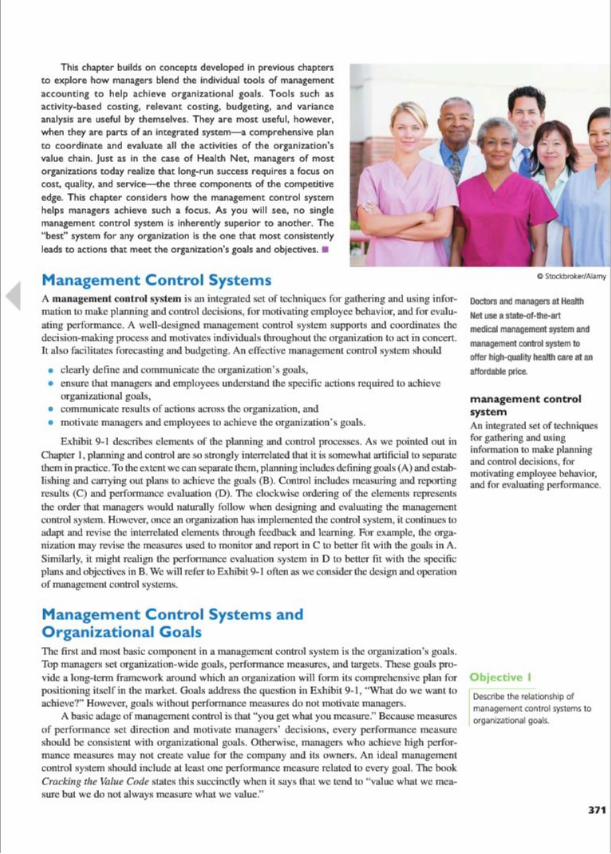
This chapter builds on concepts developed in previous chaptersto explore how managers blend the Individual tools of management
accounting to help achieve organizational goals. Tools such as
activity-based costing, relevant costing, budgeting, and variance
analysis are useful by themselves. They are most useful, however,when they are parts of an integrated system—a comprehensive planto coordinate and evaluate all the activities of the organization'svalue chain. Just as in the case of Health Net. managers of most
organizations today realize that long-run success requires a focus oncost, quality, and service—the three components of the competitiveedge. This chapter considers how the management control systemhelps managers achieve such a focus. As you will see. no singlemanagement control system is inherently superior to another. The"best" system for any organization is the one that most consistentlyleads to actions that meet the organization's goals and objectives. ÿ
Management Control SystemsA management control system is an integrated set of techniques for gathering and using infor¬mation to make planning and control decisions, for motivatingemployee behavior, and for evalu¬ating performance. A well-designed management control system supports and coordinates thedecision-making process and motivates individuals throughout Use organization to act in concert.It also facilitates forecasting and budgeting. An effective management control system should
• clearly define and communicate the organization's goals.
• ensure that managers andemployees understand the specific actions requiredto achieveorganizational goals.
• communicate results of actions across the organization, and
• motivate managers and employees to achieve the organization's goals.
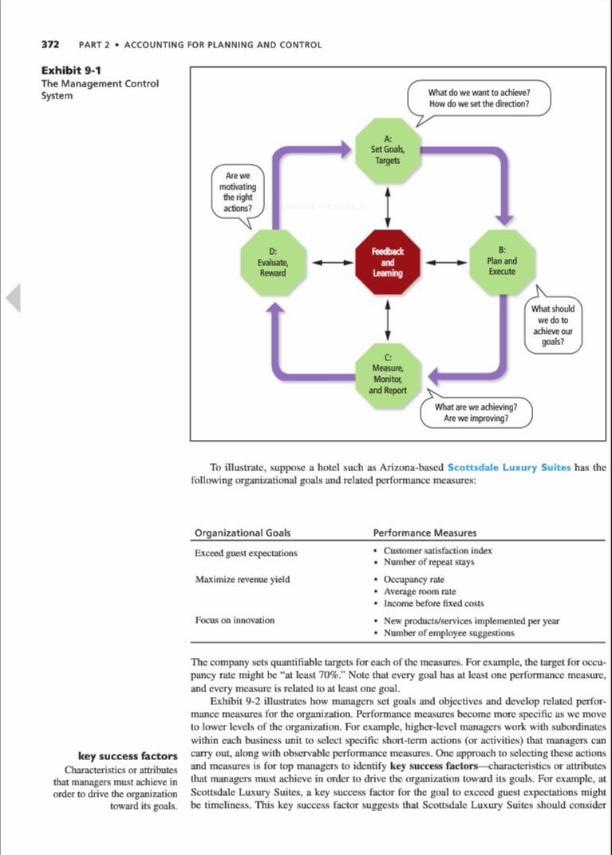
Exhibit 9-1 describes elements of the planning and control processes. As we pointed out inChapter 1. planning and control are so strongly interrelated that it is somewhat artificial to separatethem inpractice.To the extent we can separate them,planningincludesdefininggoals (A)and estab¬lishing and carrying out plans to achieve the goals (B). Control includes measuring and reportingresults (C) and performance evaluation (D). The clockwise ordering of the dements representsthe order that managers would naturally follow when designing and evaluating the managementcontrol system. However, once an organization lias implementedlire control system, it continues to
adapt and revise the interrelated elements through feedback and learning. For example, the orga¬nization may revise the measures used to monitor and report in C to better fit with the goals in A.Similarly, it might realign the performance evaluation system in D to better fit with the specific-plans and objectives in B. We will refer to Exhibit 9-1 often as we consider the design and operationof management control systems.
O StocUxoktr/AUmy
Doctors and managers at Health
Net use a state-of-the-artmedical management system and
management control system to
offer high-quality health care at anaffordable price.
management controlsystemAn integrated set of techniquesfor gathering and usinginformation to make planningand control decisions, formotivating employee behavior,and for evaluating performance
Management Control Systems andOrganizational GoalsThe first and most basic component in a management control system is the organization's goals.Top managers set organization-wide goals, performance measures, and targets. These goals pro¬vide a long-term framework around which an organization will form its comprehensive plan forpositioning itself in the market. Goals address the question inExhibit 9-1. "What do wc want toachieve?" However, goals without performance measures do not motivate managers.
A basic adage of management control is that "you gelwhat you measure." Because measuresof performance set direction and motivate managers' decisions, every performance measureshould be consistent with organizational goals. Otherwise, managers who achieve high perfor¬mance measures may not create value for the company and its owners. An ideal managementcontrol system should include at least one performance measure related to every goal. The b<x>kCracking the Value Cade stales this succinctly when it says that wc lend to "value what wc mea¬sure but wc do not always measure what wc value."
Objective I
Describe the relationship ofmanagement control systems to
organizational goals
371
372 PART 2 • ACCOUNTING FOR PLANNING AND CONTROL
Exhibit 9-1The Management ControlSystem | What do we want to achieve?
I How do we set the direction?
/"Are we
motivating Athe right t
ÿ actionÿ y 1 IPlan andBNMExecute
Measure,
Monitor.and Report
What are we achieving?Are we improving?
What shouldwe do to
achieve ourgoab?
To illustrate, suppose a hotel such as Ari/ona-hased ScottsdaJe Luxury Suites has thefollowing organizational goals and related performance measures:
Organizational Goals_Performance Measures
Exceed guest expectations • Customer satisfaction index• Number of repeat stays
Maximize revenue yield • Occupancy rale
• Average room rate
• Incomebefore fixed costs
Focus on innovation • New products/sen'ices implementedper year• Number of employee suggestions
key success factorsCharacteristics or attributes
that managers must achieve inorder to drive the organization
toward its goals.
The company sets quantifiable targeLs for each of the measures. For example, the target for occu¬pancy rate might be "at least 70%." Note that every goal has at least one performance measure.and every measure isrelated to at least one goal.
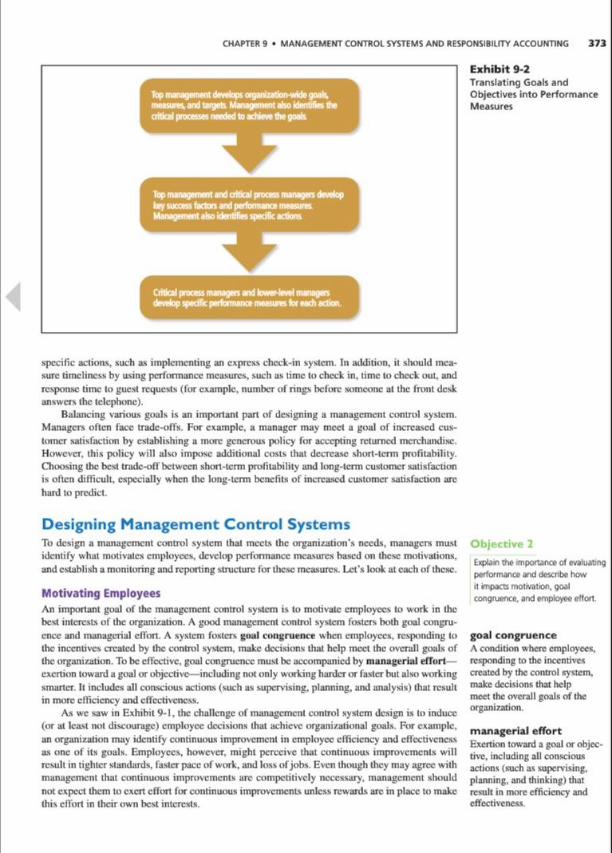
Exhibit 9-2 illustrates how managers set goals and objectives and develop related perfor¬mance measures for the organization. Performance measures become more specific us we moveto lower levels of the organization. For example, higher-level managers work with subordinateswithin each business unit to select specific short-term actions (or activities) that managers cancarry out. along with observable performance measures. One approach to selecting these actionsand measures is for top managers to identify key success factors— characteristics or attributesthat managers must achieve in order to drive the organization tow ard its goals. For example, at
Scottsdalc Luxury Suites, a key success factor for the goal to exceed guest expectations mightbe timeliness. This key success factor suggests thai Scottsdalc Luxury Suites should consider
CHAPTER 9 • MANAGEMENT CONTROL SYSTEMS AND RESPONSIBILITY ACCOUNTING 373
Exhibit 9-2Translating Goals andObjectives into PerformanceMeasures
specific actions, such as implementing an express check-in system. In addition, it should mea¬sure timeliness by using performance measures, such as time to check in. time to check out, andresponse time to guest requests (for example, number of rings before someone at the front deskanswers the telephone).
Bahmcing various goals is an important part of designing a management control system.Managers often face trade-offs. For example, a manager may meet a goal of increased cus¬
tomer satisfaction by establishing a more generous policy for accepting returned merchandise.However, this policy will also impose additional costs that decrease short-term profitability.Choosing the best trade-off between short-term profitability and long-term customer satisfactionis often diflicull, especially when the long-term benefits of increased customer satisfaction arehard to predict.
Designing Management Control SystemsTo design a management control system that meets the organization's needs, managers must
identify what motivates employees, develop performance measures based on these motivations.andestablish a monitoring and reportingstructure for these measures. Let's look at eachof these.
Motivating EmployeesAn important goal of the management control system is to motivate employees to work in thebest interestsof the organization. A good management control system fosters both goal congru¬ence and managerial effort. A system fosters goal congruence when employees, responding tothe incentives created by the control system, make decisions that help meet the overall goals ofthe organization.To beeffective, goal congruence must be accompaniedby managerial efTortexertion toward a goal or objective—including not only working harder or faster but also workingsmarter. It includes all conscious actions (such as supervising, planning, and analysis) that resultin more efficiency and effectiveness.
As we saw in Exhibit 9-1.the challenge of management control system design is to induce(or at least not discourage) employee decisions that achieve organizational goals. For example.an organization may identify continuous improvement in employee efficiency and effectivenessas one of its goals. Employees, however, might perceive that continuous improvements willresult in tighter standards, faster pace of work, and lossofjobs. Even though they may agree withmanagement that continuous improvements arc competitively necessary, management shouldnot expect them to exert effort for continuous improvements unless rewards arc inplace to makethis effort in their own best interests.
Objective 2
Explain tho important* of evaluatingperformance and describe howit impacts motivation, goalcongruence, and employee effort
goal congruenceA condition where employees.responding to the incentivescreated by the control system.make decisions that helpmeet the overall goals of theorganization.
managerial effortExertion toward a goal or objec¬tive. including all consciousactions (such as supervising.planning, and thinking) thatresult in more efficiency andeffectiveness.
374 PART 2 • ACCOUNTING FOR PLANNING AND CONTROL
As amrthcr example, students may enroll in a college course because their goal is to learnabout management accounting. The faculty and the students share the same goal, but goalcongruence is not enough. Faculty also introduce a grading system to reward student effort.Grading is a formof performance evaluation, similar to organizations using management controlreports for raises, promotions, and other forms of rewards. Performance evaluation improveseffort because most individuals lend to perform better when performance reports lead directly to
personal rewards. Thus, manufacturers that set quality improvements as critical organizationalgoals, such as Allen-Bradley and Corning, put quality targets into the bonus plansof top man¬agers and factory workers.
Motivation the drive that creates effort and action toward a goal—is key to managementcontrol. Yet employees differ widely in their motivations. This makes the system designer's taskcomplex and ill-structured. Each system must fit the specific organizational environment andbehavioral characteristics of the employees. The system designer must align individuals' self-interests with the goals of the organization. Thus, the designer must predict the motivationalimpact of a particular system—how it will cause people to respond—and compare it to the moti¬vational impact of other potential systems. Designing performance measures is not a back-officeaccounting task. It requires direction from top management and the direct involvement of thoseaffected. Stephen Kaufman, former chairmanof the board of Arrow Electronics put it this way:"It's very difficult to define the right metric and anticipate exactly how your people will react to
it.Your best chance of knowing whether it will have the intended effect is to talk to the peopledirectly involved."
All management control tools, such as budgets and variances, should constructively influ¬ence behavior. These tools arc most effective when managers use them positively to encourageemployees to improve performance, rather than negatively to punish, place blame, or find fault.Used negatively, these tools pose a threat to employees, who will resist the use of such tech¬niques. Critics have pointed to Enron's management control system as a major cause of thecompany's problems. Employees were heavily rewarded for good performance. More impor¬tantly. the employees who were ranked lowest at each evaluation were fired. This created intensecompetition, which at first seemed to create exceptional performance levels for the company.Later, it became clear that the pressure for good performance caused some employees to useunethical methods to increase their performance measures, which eventually led to the demiseof the company.
Developing Performance MeasuresFor m«»st organizations, an effective management control system requires multiple performance
„ , , measures, includingboth financial and nonlinancial measures, where the measures have the fol-Doveloo performance measures ...and use them 10monitor l«.nfchMlM.c:
achievements of an organization |. Reflect key actions and activities that relate to the goals of the organization2. Affected by actions of managers undemployees3. Readily understood by employees4. Reasonably objective and easily measured5. Used consistently and regularly in evaluating and rewarding managers and employees6. Balance long-term and short-term concerns
Sometimes accountants and managers focus too muchon financial measures—such as oper¬ating budgets, profit targets, or required return on investment—because the accounting systemreadily produce* such measures. Further, it is often difficult to construct performance measuresfor nonlinancial goals such as customer satisfaction, improvements in quality, environmentalstewardship, social responsibility, and organizational learning, which many companies listas key goals. However, well-designed management control systems develop and report bothfinancial and nonlinancial measures of performance because "Youcan't manage something youcan't measure."
Nonlinancial measures often motivate employees toward achieving important performancegoals. F<>r example. AT&T Universal Card Services, which received the prestigious BaldrigcNational Quality Award (presented by the U.S. Department of Commerce), used 18 perfor¬mance measures for its customer inquiries process. These measures include average speed of
motivationThe drive thai creates effort and
action toward a goal
Business FirstPerformance Measures in PracticeAn organization's performance measures depend on Its goalsand objectives For example, a software company and an auto
manufacturer have different goals and objectives and there¬fore have different performance measures. The measures alsomust span a variety of key success factors for the organizationPerformance measures too focused on one aspect of perfor¬mance may foster neglect of other Important factors.
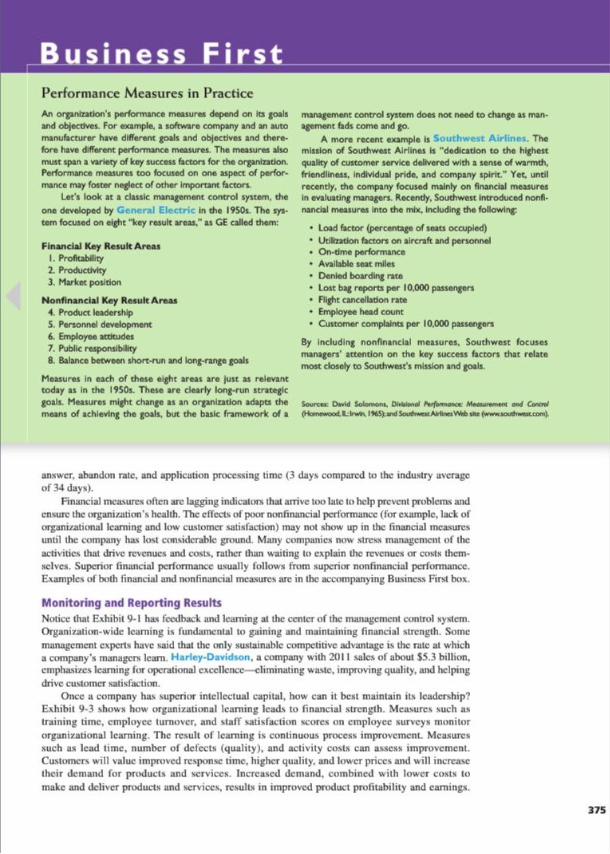
Let's look at a classic management control system, theone developed by General Electric In the 1950s. The sys¬tem focused on eight "key result areas." as GE called them:
Financial Key Result AreasI.Profitability2. Productivity3. Market position
Nonfinancial Key Result Areas4. Product leadership5. Personnel development6. Employee attitudes7. Public responsibility8. Balance between short-run and long-range goals
Measures In oach of these eight areas are Just as relevanttoday as In the 1950s. These are clearly long-run strategicgoals. Measures might change as an organization adapts themeans of achieving the goals, but the basic framework of a
management control system does not need to change as man¬agement fads come and go.
A more recent example Is Southwrst Airlint Themission of Southwest Airlines Is "dedication to the highestquality of customer service delivered with a sense of warmth.friendliness, individual pride, and company spirit." Yet. untilrecently, the company focused mainly on financial measuresIn evaluating managers. Recently. Southwest Introduced nonfi¬nancial measures Into the mix. Including the following:
• Load factor (percentage of seats occupied)• Utilizationfactors on aircraft and personnel• On-dme performance• Available seat miles• Denied boarding rate
• Lost bag reports per 10.000 passengers• Flight cancellation rate
• Employee head count
• Customer complaints per 10.000 passengers
By Including nonfinancial measures. Southwest focusesmanagers' attention on the key success factors that relatemost closely to Southwest's mission and goals.
Sourcac Orrid Solomoov DMwonal forfo"nonet Moonjromnn and Control(Homcwood.LInW.,I*S)mdSou*iw«m Wb6 uu {wawtoutfiwatcom)
answer, abandon rale, and application processing lime (3 days compared to the industry averageof 34 days).
Financial measures often arc lagging indicators that arrive too late to help prevent problems andensure the organization's health. The effects of p<x»r nonfinancial performance (for example, lack oforganizational learning and low customer satisfaction) may not show up in the financial measuresuntil the company has lost considerable ground. Many companies now stress management of theactivities that drive revenues and costs, rather than waiting to explain the revenues or costs them¬selves. Superior financial performance usually follows from superior nonfinancial performance.Examples of both financial and nonfinancial measures arc in the accompanying Business First box.
Monitoring and Reporting ResultsNotice that Exhibit 9-1 has feedback and learning at the center of the management control system.Organization-wide teaming is fundamental to gaining and maintaining financial strength. Some
management experts have said that the only sustainable competitive advantage is the rate at whicha company's managers learn. Harfey-Davidson. a company with 2011 sales of about $5.3 billion.emphasizes learning for operational excellence—eliminating waste, improvingquality, and helpingdrive customer satisfaction.
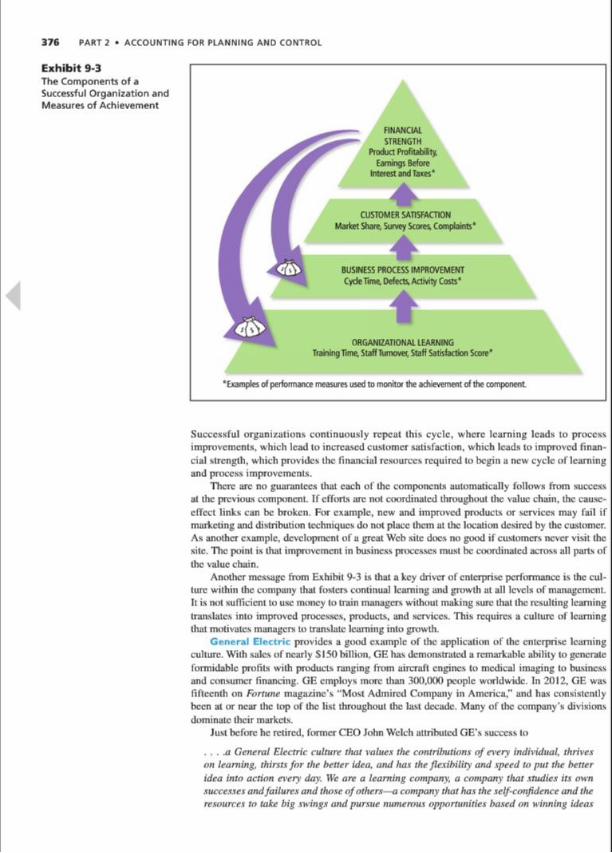
Once a company has superior intellectual capital, how can it best maintain its leadership?Exhibit 9-3 shows how organizational learning leads to financial strength. Measures such as
training time, employee turnover, and staff satisfaction scores on employee surveys monitororganizational learning. The result of learning is continuous process improvement. Measuressuch as lead time, number of defects (quality), and activity costs can assess improvement.Customers will value improved response time, higher quality, and lower prices and will increasetheir demand for products and services. Increased demand, combined with lower costs to
make and deliver products and services, results in improved product profitability and earnings.
376 PART 2 • ACCOUNTING FOR PLANNING AND CONTROL
Exhibit 9-3The Components of aSuccessful Organization andMeasures of Achievement
ORGANIZATIONAL
FINANCIALSTRENGTH
Product Profitability,Earnings Before
Interest and Taxes*
CUSTOMER SATISFACTIONMarket Share, Survey Scores Complaints*
BUSINESS PROCESS IMPROVEMENTCycleTime Defects,Activity Costs*
ORGANIZATIONAL LEARNINGTrainingTime, Staff Turnover, Staff Satisfaction Score*
•Examples of performance measures used to monitor the achievement of the component
Successful organizations continuously repeat this cycle, where learning leads to processimprovements, which lead to increased customer satisfaction, which leads to improved finan¬cial strength, which provides the financial resources required to begin a new cycle of learningand process improvements.
There are no guarantees that each of the components automatically follows from successat the previous component. If efforts arc not coordinated throughout the value chain, the causc-cffcct links can be broken. For example, new and improved products or services may fail ifmarketing and distribution techniques do not place them at the location desired by the customer.As another example, development of a great Wch site docs no good if customers never visit thesite. The point is that improvement in business processes must be coordinated across all parts ofthe value chain.
Another message from Exhibit 9-3 is that a key driver of enterprise performance is the cul¬ture within the company that fosters continual learning and growth at all levels of management.It is not sufficient to use money to train managers without making sure that the resulting learningtranslates into improved processes, products, and services. This requires a culture of learningthat motivates managers to translate learning into growth.
General Electric provides a good example of the application of the enterprise learningculture. With sales of nearly SI50billion. GE has demonstrated a remarkable ability to generateformidable profits with products ranging from aircraft engines to medical imaging to businessand consumer financing. GE employs more titan 300,000 people worldwide. In 2012, GE wasfifteenth on Fortune magazine's "Most Admired Company in America." and has consistentlybeen at or near the top of the list throughout the last decade. Many of the company's divisionsdominate their markets.
Just beforehe retired, former CEO John Welch attributed GE's success to
....a General Electric culture that values the contributions of every individual, thriveson learning, thirsts for the better idea, and has the flexibility and speed to put the betteridea into action every day. We are a learning company, a company that studies its ownsuccesses andfailures andthose of others—a company that has the self-confidence andtheresources to take big swings andpursue numerous opportunities based on winning ideas
CHAPTER 9 • MANAGEMENT CONTROL SYSTEMS AND RESPONSIBILITY ACCOUNTING 377
and insights. regardless of their source. That appetitefor learning, and the ability to act
quickly on that learning, will prm'ide GE with what we believe is an insurmountable andsustainable competitive ad\antage.
Exactly what did John Welch mean by Ihc "ability to act quickly on thai learning"? Accordingto Welch. GE "opened |itsl culture up to ideas from everyone, everywhere, killed NIH (Not
Invented Here) thinking,decimated the bureaucracy, and made boundaryless behavior a reflexiveand natural part of our culture, thereby creating the learning culture." His successor. Jeff Immclt.points out another important part of the GElearning culture—openness to dropping oldmanage¬ment approaches in favor of new and better techniques: "Most people inside GE learn from thepast but have a healthy disrespect f(»r history. They have an ability to live in the moment and not
beburdened by the past, which is extremely important."
Weighing Costs and BenefitsThe designer of a management control system must always weigh the costs and benefits ofvarious alternatives. Benefits and costs of management control systems arc often difficult to
measure, and both may become apparent only after implementation. For example, the directorof accounting policy of Citicorp stated that, after using a very detailed management con¬trol system for several years, the system proved to be too costly to administer relative to
the perceived benefits. Accordingly. Citicorp returned to a simpler, less costly—though lessdetailed—management control system. Incontrast. Home Depot added detail in the form ofadditional metrics to its management control system. When employees asked then-CEO BobNardclli why they should use the new metrics, he compared the metrics to gauges in a car:"Why do you need a gas gauge? Why do you need a speedometer?" He believed the metricswere worth the cost because they help lop management know what is occurring throughoutthe company.
Summary Problem forYour ReviewPROBLEMThe Blue Harbor Inn is developing performance measures for each of itsmajor goals. Topmanagement established an organization-wide goal to "exceed guest expectations." Among the
key success factors arc timeliness of customer service and quality of personalized service. PattyBowen. vice president of sales, is the manager responsible for the actions required to meet Ihcgoal of exceeding guest expcctatioas. She has already identified one action (objective) for thecoming year—upgrade customer service department capabilities.
1. Identify several possible performancemeasures for the quality-of-pcrxonalizcd-scrvicckey success factor.
2. Recommend several specific actions or activities associated with upgrading customer
service department capabilities that would drive Luxury Suites toward its goal ofexceeding customer expectations.
SOLUTION1. Performance measures for the quality of personalized service might include the number
of changes to registration, rating on the "friendly, knowledgeable staff question onthe guest survey, number of complaints, percentage of return guests, and percentageof customers with completed customer profile (which profiles the special needs ofcustomers).
2. Specific actions or activities might include training employees, implementing a callchecklist (list of services and options available to the guest) and monitoring compliancewith Ihc list, developing a customer satisfaction survey, and rccnginccring the guestregistration and reservation processes.

378 PART 2 • ACCOUNTING FOR PLANNING AND CONTROL
controllable cost
Any com that a manager'*decisions and action* can
influence
uncontrollable cost
Any cost that the managementof a responsibility center cannot
affect within a given time span
Objective 4
Use responsibility accounting to
define an organizational subunrt asa cost center, a profit center, or aninvestment center
responsibility centerA set of activities and resources
assigned to a manager, agroup of managers, or other
employee*
responsibility accountingIdentifying what parts of the
organization have primaryresponsibility for each action.developing performance mea¬
sures and targets, and designingreports of these measure* by
responsibility center
cost centerA responsibility center in which
managers arc responsible forcosts only.
profit centerA responsibility center in which
managers are responsible forrevenues as well as costs—that
is. profitability.
Controllability and Measurement of FinancialPerformanceManagement control systems often distinguish between controllable and uncontrollable events
and between controllable and uncontrollable costs. These terms refer to relative rather thanabsolute controllability—no cost is completely under the control of u manager. A controllablecost is one that a manager's decisions and actions can influence to a reasonable extent. Anuncontrollable cost is any cost that management cannot reasonably afTcct within a given timespan. For example. Dow Chemical is likely to consider the cost of the crude oil used to makev arious chemicals as uncontrollable by the manager of a chemical factory because the managercannot control the market price of crude oil. On the other hand. Dow Chemical is likely to con¬sider labor costs as controllable by the factory manager even though there arc some aspects oflabor costs that arc not controlled by the manager, such as the cffccLx of union contracts on payrates and labor usage.
The distinction between controllable and uncontrollable costs is used in evaluating theperformance of a manager. Costs that arc completely uncontrollable provide no insight into a
manager's decisions and actions because, by definition, manager actions will not affect uncon¬trollable costs. In contrast, controllable costx provide evidence about costs that arc aficctcd bythe manager's decisions.
Identifying Responsibility CentersDesigners of management control systems identify the responsibilities of each manager byestablishing responsibility centers based on what a manager can control. A responsibilitycenter is a set of activities and resources avsigncd to a manager, a group of managers.or other employees. A set of machines and machining activities, for example, may be a
responsibility center for a production supervisor. The full production department may bea responsibility center for the department head. Finally, the entire organization may be a
responsibility center for the president. In some organizations, groups of employees sharemanagement responsibility to create wide "ownership" of management decisions, to allowcreative decision making, and to prevent one person's concern (or lack of concern) over riskfrom dominating decisions.
An effective management control system gives each manager responsibility for a group ofactivities and actions and then, as Exhibit 9-1 shows, monitors and reports on (1) the rcsulLsof the activities and (2) the manager's influence on those results. Such a system has intrinsicappeal for most top managers (because it helps them delegate decision making and frees themto focus on more strategic issues) and lower-level managers (who value the decision-makingautonomy they inherit).Thus, system designers apply respoasibility accounting to identify whatparts of the organization have primary responsibility for each action, develop performance mea¬sures and targets, and design reports of these measures by responsibility center. Responsibilitycenters usually have multiple goals and actions that the management control system monitors.We classify responsibility centers as cost centers, profit centers, or investment centers based ontheir managers' primary financial responsibilities.
COST. PROFIT. AND INVESTMENT CENTERS Ina cost center, managers arc responsible for costsonly. A cost center may encompass an entire department, or a department may contain severalcost centers. For example, although one manager may supervise an assembly department, thedepartment may contain several assembly lines and each assembly line may be considered a sep¬arate cost center. Likewise, within each line, each separate machine may be its own cost center.
The determination of the number of cost centers depends on cost-benefit considerations—do thebenefits (for planning, control, and evaluation) of smaller, more numerous cost centers exceedthe higher costx of reporting?
In a profit center managers arc responsible for controlling revenues as well as costs—thaiis, profitability. Despite the name, a profit center can exist in nonprofit organizations (thoughit might not be referred to as such) when a responsibility center receives revenues for its ser¬vices. For example, the Western Area Power Authority (WAPA) is charged with recoveringiL* costs of operations through sales of power to electric utilities in the western United States.Thcrcfim:. WAPA is a profit center responsible for both revenues and costs, though its objectiveis not to maximize profits but rather to break even.
CHAPTER 9 • MANAGEMENT CONTROL SYSTEMS AND RESPONSIBILITY ACCOUNTING 379
An investment center adds responsibility for investment to profit-center responsibilities.Investment-center success depends on both income and invested capital, measured by relatingincome generated to the value of the capital employed.
Systems designers must understand operating processes and cost behavior to help identifyresponsibility for controllable cosLs. For example, by isolating activities and related cost drivers,activity-basedcosting (see Chapter 4) can help to point outcontrollable costs. Procter & Gamblecredited its activity-based management control system with identifying controllable costs in oneof its detergent divisions, which ledto major strategic changes.
Responsibility center managers arc often able to explain their center's uncontrollablecosts, even in situations where they arc not held responsible fi»r these uncontrollable costs. Forexample, an importer of grapes from Chile to the United States suffered a sudden loss of salesseveral years ago after a few grapes were found to contain poisonous cyanide. Because thetampering was beyond the import manager'scontrol, the manager was rcspoasiblc for efficiency(the flexible-budget variance Isee Chapter 8|) but not for the effects of activity volume (the sales-activity variance). Even though he was not held responsible for the sales-activity variance, themanager was in the best position to provide an explanation for the variance because he had thebest information about the reasons for the decline in sales.
investment centerA responsibility center wheremanagers arc responsible forinvestment as well as profits.
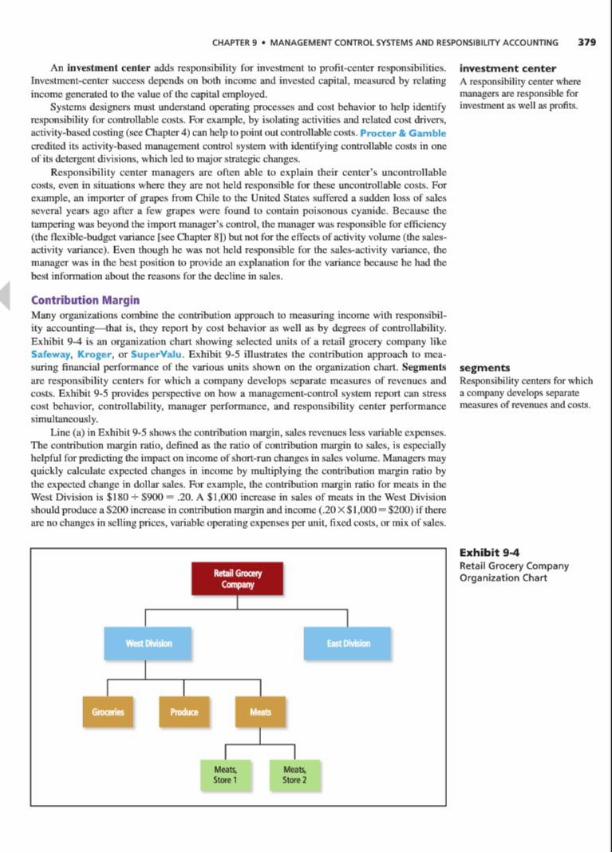
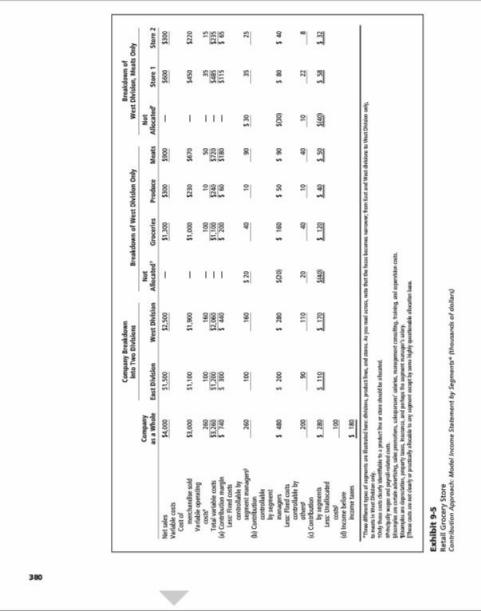
Contribution MarginMany organizations combine the contribution approach to measuring income with responsibil¬ity accounting—that is. they report by cost behavior as well as by degrees of controllability.Exhibit 9-4 is an organization chart showing selected units of a retail grocery company likeSafeway, Kroger, or SuperVafu. Exhibit 9-5 illustrates the contribution approach to mea¬suring financial performance of the various units shown on the organization chart. Segmentsarc responsibility centers for which a company develops separate measures of revenues andcosts. Exhibit 9-5 provides perspective on how a management-control system report can stresscost behavior, controllability, manager performance, and responsibility center performancesimultaneously.
Line (a) inExhibit 9-5 shows the contribution margin, sales revenues less variable expenses.The contribution margin ratio, defined as the ratio of contribution margin to sales, is cxpcciallyhclpful for predicting the impact on incomeof short-run changes in sales volume. Managers mayquickly calculate expected changes in income by multiplying the contribution margin ratio bythe expected change indollar sales. For example, the contribution margin ratio for meats in theWest Division is SIHO +S900 - .20. A $ 1.(MX) increase in sales of meats in the West Divisionshould producea S200 increase incontribution margin and income (.20X $ 1.000= $200) if therearc nochanges inselling prices, variable operating expenses per unit, fixed costs, or mix of sales.
segmentsResponsibility centers for whicha company develops separatemeasures of revenues and costs.
Retail GroceryCompany
Store 1 Store ?
Exhibit 9-4Retail Grocery CompanyOrganization Chart
CHAPTER 9 • MANAGEMENT CONTROL SYSTEMS AND RESPONSIBILITY ACCOUNTING
Contribution Controllable by Segment ManagersDesigner* of management control systems distinguish between the segment as an cconomicinvestment and the manager as a decision maker. For instance, an extended period of droughtcoupled with an aging population may adversely afTcct the desirability of continued economicinvestment in a ski resort, but the resort manager may nonetheless be doing an excellent jobunder these adverse circumstances.
Exhibit 9-5 separates costs by controllability. The manager of meats at Store I may haveinfluence over some local advertising but not other advertising, some fixed salaries but notother salaries, and so forth. Moreover, the meat manager at both the division and store levelsmay have zero influence over store depreciation or the president's salary. Managers on alllevelshelpexplain the total segment contribution, but they arc responsible rnily for the control¬lable contribution. Note that we deduct the fixed costs controllable by the segment managersfrom the contribution margin to obtain the contribution controllable by segment managers.These controllable costs arc usually discretionary fixed costs such as local advertising andsome salaries.
As we move to the right in Exhibit 9-5, we sec allocations of only pan of the fixed costs tolower levels in the organization. For example, consider the line with fixed costs controllable bysegment managers. Of the SI60.000 fixed costs that the West Division manager controls,groceries.produce, and meat departments control only $I40.0(X). We do nirt allocate lire remaining S20.0(X)
of West Division fixed costs because they arc not controllable farther down in the organizationchart. That is. the West Division manager controls all SI60.(XX) of fixed costs, but subordinates(gn>ccry. produce, and meat managers) control only S!40.(XX). Similarly, the meals managercontrols S9().(XX) of fixed costs, but subordinates at stores Iand 2 control only $35,000 andS25.(XX). respectively.
Contribution by SegmentsThe contribution by segments, line (c) inExhibit 9-5. is an attempt to approximate the financialperformance of the segment, as distinguished from the financial performance of its manager.which we measure in line (b).The "fixedcosts controllable by others" typically include commit¬ted cost* (such as depreciation and property taxes) and discretionary cost* (such as the segmentmanager's salary). Although the segment manager does not control these costs, they arc neces¬sary lor the operation of the segment.
Unallocated CostsExhibit 9-5 shows "unallocated co*t*" immediately before line (d). These costs might includecentral corporate costs, such as the costs of top management and some corporate-level serv ices(for example, legal and taxation). When an organization cannot find a persuasive cause-and-cfTcci or activity-based justification for allocating such costs, it generally should not allocatethem to segments.
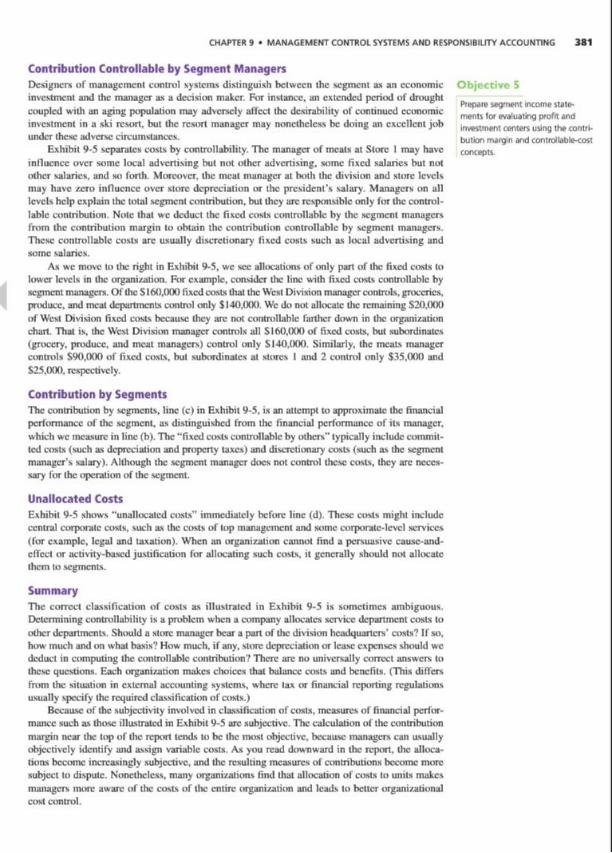
SummaryThe correct classification of costs as illustrated in Exhibit 9-5 ix sometimes ambiguous.Determining controllability is a problem when a company allocates service department costx to
other departments. Should a store manager bear a part of the division headquarters' costs? If so.how much and on what basis? How much, if any. store depreciation or lease expenses should wededuct incomputing the controllable contribution? There arc no universally correct answers tothese questions. Each organization makes choices that balance costs and benefits. (This differsfrom the situation in external accounting systems, where tax or financial reporting regulationsusually specify the requiredclassification of costs.)
Because of the subjectivity involved in classification of costs, measures of financial perfor¬mance such as those illustrated in Exhibit 9-5 arc subjective. The calculation of the contributionmargin near the top of the report tends to be the most objective, because managers can usuallyobjectively identify and assign variable costs. As you read downward in the report, the alloca¬tions become increasingly subjective, and the resulting measures of contribution* become moresubject to dispute. Nonetheless, many organizations find that allocation of eosLs to units makesmanagers mine aware of the costs of the entire organization and leads to better organizationalcost control.
Objective 5
Prepare segment income state¬
ments tor evaluating profit andinvestment centers using the contri¬bution margin and controllable-costconcepts.

382 PART 2 • ACCOUNTING FOR PLANNING AND CONTROL
Making Managerial Decisions
Managers should try lodistinguish between controllable anduncontrollable costs when designing segment financial reportsFor each of the following costs of a suburban Wal-Martstore, indicate whether it is a variable cost, fixed cost control¬lable by segment managers, fixed cost controllable by someoneother than the segment manager,or a cost the company nor¬mally does not allocate:
Property taxes
Supervision of local sales staffDepreciationof store
Cost of goods soldLocal store advertisingCorporate-level advertisingCorporate-level public relationsTemporary sales labor
AnswerVariable costs are generally controllable by the store manager.Cost of goods sold and temporary sales labor are examples
Fixedcosts controllable by the segment (store) managerinclude local store advertising and supervision of the localsales staff.The store manager usually decides the appropriatelevel for these costs.
Fixedcosts controllable by those other than the store
manager include property taxes and depreciation of the store
These costs relate directly to the store, but the store managercannot change them
Unallocatedcosts include corporate-level advertising andpublic relations These costs have a tenuous link to the store
Summary Problem forYour ReviewPROBLEMThe Book & Game Company has two bookstores: Auntie's and Merlin's. Each store has man¬agers who have a great deal of decision authority over their store. Advertising, market research,
acquisition of books, legal services, and other staff functions, however, arc handledby a cen¬tral office. The Book & Game Company's current accounting system allocates all costs to thestores. Results for 20X Iwere as follows:
Item Total Company Auntie's Merlin's
Sales revenue
Cost of merchandise sold
Gross margin
Operating expenses
Salaries and wages
Supplies
Rent and utilities
DepreciationAllocated staff costs
Total operating expenses
Operating income (loss)
$700,000
450,000
250.000
63.00045.00060,000
15.00060.000
243,000
S 7.000
$350,000
225.000125.000
30,000
22.500
40.0007.000
30.000129,500
$ (4,500)
$350,000
225.000115.000
33.00022,500
20.000K.000
30.00011.3,500
$ 1 1,500
Each bookstore manager makes decisions that affect salaries and wages, supplies, and deprecia¬tion. Incontrast, rent and utilities arc beyond the managers' control because the managers didnot choose the location or the si/£ of the store.
Supplies arc variable costs. Variable salaries and wages are equal to 8% of the cost ofmerchandise sold; the remainder of salaries and wages is a fixed cost. Rent, utilities, and depre¬ciation also arc fixed costs. StalT costs represent the cost of activities performedby the centraloffice. Events at the individual bookstores do not affect staff costs; nevertheless. Book & GameCompany allocates staff costs as a proportionof sales revenue.
1. Using the contribution approach, prepare a performance report that distinguishes theperformance of each bookstore from that of the bookstore manager.
2. Evaluate the financial performance of each bookstore.3. Evaluate the financial performance of each manager.
CHAPTER 9 • MANAGEMENT CONTROL SYSTEMS AND RESPONSIBILITY ACCOUNTING 383
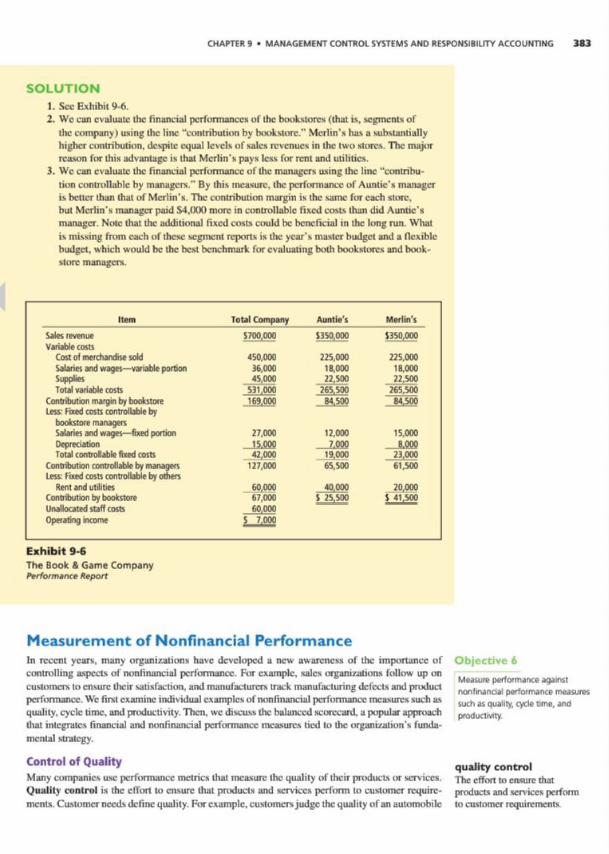
SOLUTIONI.See Exhibit 9-6.2. We can evaluate the financial performances of the bookstores (that is, segments of
the company) usingthe line "contributionby bookstore." Merlin's has a substantiallyhigher contribution,despite equal levels of sales revenues in the two stores. The majorreason for this advantage is that Merlin's pays less for rent and utilities.
3. We can evaluate the financial performance of the managers using the line "contribu¬tion controllable by managers." By this measure, the performanceof Auntie's manageris better than that of Merlin's.The contribution margin is the same for each store.but Merlin's manager paid S4.(XX) more in controllable fixed costs than did Auntie'smanager. Note that the additional fixed costs could be beneficial in the longrun. Whatis missing from each of these segment reports is the year's master budget and a flexiblebudget, which would be the best benchmark for evaluating bothbooksUwes and book¬store managers.
Item Total Company Auntie's Merlin's
Sales revenue S700.000 S350,000 5350,000Variable costs
Cost of merchandise sold 450,000 225,000 225,000Salaries and wages—variable portion 36,000 18,000 18,000Supplies 4S.000 22,500 22,500Total variable costs 531,000 265,500 265.500
Contribution margin by bookstore 169.000 84.500 84,500less: Fixed costs controllable by
bookstore managersSalaries and wages—fixed portion 27,000 12,000 15,000Depreciation 15.000 7.000 8.000Total controflable fixed costs 42,000 19.000 23,000
Contribution controllable bymanagers 127.000 65,500 61,500Less: Fixed costs controllable by others
Rent and utilities 60,000 40,000 20,000Contribution by bookstore 67,000 S 25,500 S 41.500Unallocated staff costs 60,000Operating income S 7.000
Exhibit 9-6The Book & Game CompanyPerformance Report
Measurement of Nonfinancial PerformanceIn recent years, many organizations have developed a new awareness of the importance ofcontrolling aspects of nonfinancial performance. For example, sales organizations follow up oncustomers to ensure their satisfaction, and manuf acturers track manufacturing defects andproductperformance.We first examine individual examples of nonfinancial performance measures suchas
quality, cycle time, and productivity. Then, we discuss the balanced scorecanl. a popular approachthat integrates financial and nonfinancial performance measures tied to the organization's funda¬mental strategy.
Control of Quality quality controlMany companies use performance metrics that measure the quality of their produce* tw services. The effort to ensure thatQuality control is the effort to ensure that products and services perform to customer require- products and sen-ices performmcnls. Customer needs define quality. For example,customersjudge thequality of an automobile to customer requirements
Objective 6
Measure performance against
nonfmanoal performance measuressuch as quality, cycle time, andproductivity.
384 PART 2 • ACCOUNTING FOR PLANNING AND CONTROL
cost of quality reportA report thai displays the
financial impact of quality.
total qualitymanagement (TQM)An approach to quality that
focuses on prevention of defectsand on customer satisfaction
quaJity-control chartThe statistical plot of measures
of various product quality-dimensions or attributes.
relative to their needs f<w reliability, performance, styling, safety, image, and other attributes.Defining quality in terms of customer requirements is only half the battle. There remains theproblem of reaching and maintaining the desired level of quality.
The traditional approach to controlling quality in the United Stales was to inspect pn>ducL\after completing them and reject or rework those that failed the inspections. Because testing isexpensive, companies often inspected only a sample of produces. They judged the process tobe in control as long as the number of defective producLs did not exceed an acceptable quality-level. This meant that some defective products could still make their way to customers. When a
company docs not discover defects until the product reaches the customer, it is costly to repairproducts already in useby a customer or to win back a dissatisfied customer. IBM's former CEOJohn Akcrs was quoted in the Wall Street Journal as saying, "1am sick and tiredof visiting planLsto hear nothing but great things about quality and cycle time—and then to visit customer* whotell me of problems."
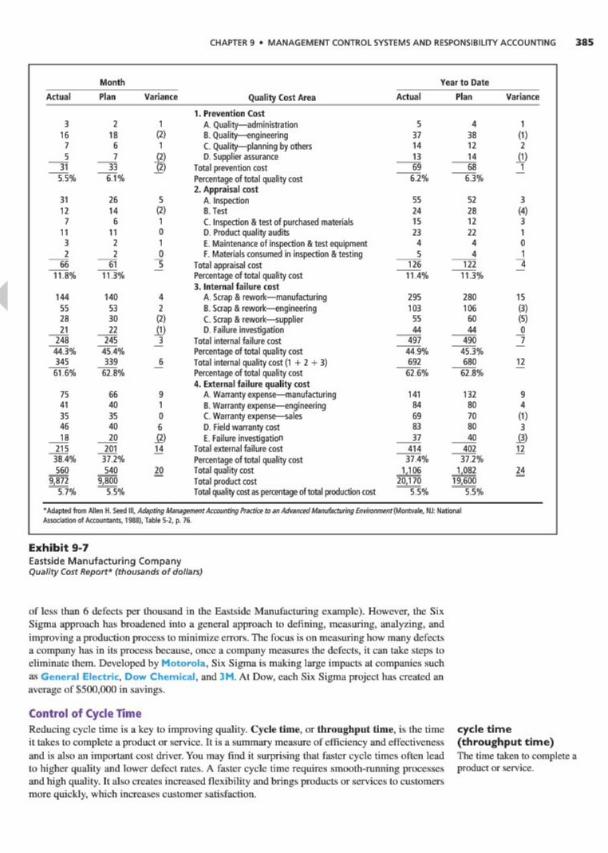
A cost of quality report displays the financial impact of quality. The quality cost report
shown inExhibit 9-7 measures four categories of quality costs:
I. Prevention—costs incurred to prevent the production of defective producLs or delivery ofsubstandard services including engineering analyses to improve product design for bettermanufacturing, improvements inproduction processes, increased quality of material inputs.and programs to train personnel
2. Appraisal—costs incurredto identify defective products or services including inspectionand testing
3. Internal failure—costs of defective components and final products or services that arcscrapped or reworked; also costs of delays caused by defective products or services
4. External failure—costs caused by delivery of defective products or services to customers.such as field repairs, returns, and warranty expenses
Exhibit 9-7 shows that internal or external failures caused most of the costs incurred byEastside Manufacturing Company. These costs almost certainly arc understated, however,because they omit opportunity costs of internal delays and lost sales. For example, quality prob¬lems inAmerican-built automobiles in the 1980s caused sales to dn»p for many years. The oppor¬tunity cost of these lost future sales were much more significant than the immediate tangiblecosts measured in any quality cost report.
In recent years, more U.S. companies have moved away from the traditional approach toachieve quality by "inspecting it in." Many companies have discovered that it is morecost effec¬tive to prevent defects rather than inspect and correct them. The resources consumed to delectdefective products do not add value. Further, if the company must scrap the defective product, itwastes the resources that were consumed to produce it. Even when the company can correct theproduct defects, it wastes the resources required for rework.
Many companies have adopted an approach first espoused by an American. W. Edw ardsDeming. and embraced by Japanese companies decades ago: total quality management(TQM). Following the old adage "an ounce of prevention is worth a pound of cure." it focuseson prevention of defects and on achievement of customer satisfaction. The TQM approachbuildson the assumption that an organization minimizes the cost of quality when it achieves high qual¬ity levels. TQM is the application of quality principles to all of the organization's endeavors tosatisfy customers. TQM has significant implications for organization goals, structure, and man¬agement control systems.
To implement TQM. an organization trains employees to prepare, interpret, and act onquality-control charts, such as that shown inExhibit 9-8. The quality-control chart is a statisti¬cal plot of measures of various product quality dimensions or attributes. This plot helps delectprocess deviations and identify excessive variation in product dimensions or attributes that pro¬cess or design engineers should address. The chart in Exhibit 9-8 shows that, except for a briefperiod near the end of April, the Easlsidc Manufacturing Company generally is not meeting itsdelects objective of .6% defects. Managers looking at this chart would know that they shouldtake corrective action.
The most recent trend in quality control is Six Sigma, defined in Chapter Ias a data-drivenapproach to eliminatingdefects and improvingquality.The name Six Sigma comes from the ideaof an extremely low defect rate of fewer than 3.4 defects per million (far lower than the objective
CHAPTER 9 • MANAGEMENT CONTROL SYSTEMS AND RESPONSIBILITY ACCOUNTING 385
Artnal
Monthp|>n IIm \ it( ÿ Afiitnl
Year to Datepl-m VarumreMllUJI nan vdnaiKP Quality Cost Area
1. Prevention Cost
rl«jn variance
3 2 1 A Quality—administration 5 4 i16 18 (2) 8 Quality—engineering 37 38 (t)
7 6 1 C Quality—planning by others 14 12 25 7 J?> D Supplier assurance 13 14 Jl>31 53 Total prevention cost 69 3 1
5.5% 61% Percentage of total quality cost2. Appraisal cost
62% 6.3%
31 26 5 A Inspection 55 52 312 14 (2) 8 Test 24 28 (4)
7 6 1 C Inspection& test of purchased materials 15 12 311 11 0 D Product quality audits 23 22 1
3 2 1 E Maintenance of inspection & test equipment 4 4 02 2 0 F Materials consumed in inspection & testing 5 4 1
6611.8%
6111 3%
3 Total appraisal costPercentage of total quality cost3. Internalfailure cost
126114%
12211.3%
3
144 140 4 A Soap & rework—manufacturing 295 280 1555 53 2 8 Soap & rework—engineering 103 106 (3)28 30 (2) C Soap & rework—supplier 55 60 (5)21 22 ID D Failure investigation 44 44 0
248 245 j Total internal failure cost 497 490 244 3% 454% Percentage of total quality cost 449% 45.3%345616%
33962 8%
j Total internal quality cost (1 + 2 + 3)Percentage of total quality cost4. External failure quality cost
69262 6%
68062.8%
12
75 66 9 A Warranty expense—manufacturing 141 132 941 40 1 8 Warranty expense—engineering 84 80 435 35 0 C Warranty expense—sales 69 70 (1)46 40 6 D Field warranty cost 83 80 318 20 £> E Failure investigation 37 40 il)
215 201 14 Total external failure cost 414 402 12384% 37 2% Percentage of total quality cost 37 4% 37.2%560 540 20 Total quality cost 1.106 1.082 24
9,87257% <8. Total product cost
Total quality cost as percentage of total production cost
20,1705*5%
19,600*53%
•AdjptM tier Allw H Seed 11Adapting ManagementAccounting Praamto anAdvanced ManufacturingInmnmentMonteaSe. NJ NawrulAiiocUOofl ot Atco«m*U I9W). T«6t» 5-Z. p. 76
Exhibit 9-7Eastside Manufacturing CompanyQuality Cost Report• (thousands of dollars)
of less than 6 delects per thousand in the Eastside Manufacturing example). However, the SixSigma approach has broadened into a general approach to defining, measuring, anulyzing, and
improving a productionprocess to minimize errors. The focus ison measuring how many defectsa company has in its process because, once a company measures the defects, it can take steps toeliminate them. Developed by Motorola. Six Sigma is making large impacts at companies suchas General Electric, Dow Chemical, and 3M. At Dow, each Six Sigma project has created an
average of S500.000 insavings.
Control of Cycle TimeReducing cycle time is a key to improving quality. Cycle time, or throughput time, is the timeit takes to complete a product or service. It is a summary measureof efficiency andeffectivenessand is also an important cost driver. You may find it surprising that faster cycle times often leadto higher quality and lower defect rates. A faster cycle time requires smooth-ninning processesand high quality. Italso creates increased flexibility andbrings productsor services to customers
more quickly, which increases customer satisfaction.
cycle time(throughput time)The time taken to completeproduct or service.

386 PART 2 • ACCOUNTING FOR PLANNING AND CONTROL
Exhibit 9-8Eastside ManufacturingCompanyQuality-ControlChan
Quality-Control Chart
One way lo measure cycle lime is to attach an identifier such as a bar code or RFID (radio-
frequency identification) lagto each component or product and use a scanner to read the code at
the endofeach stage of completion. Cycle time for each stage is the time betweenreadingsof theidentifier tag. Tagging also permits effective tracking of materials and producLs for inventories.scheduling, and delivery.
Exhibit 9-9 is a sample cycle-time report showing that Eastside Manufacturing Companyis meeting its cycle-time objectives at two of its five production process stages. This report issimilar to the flexible budget reports of Chapter 8, but note that the variances here arc mea¬sured in units of time, rather than indollars of revenue or cost. Explanations for the variancesin the right column indicate that poor-quality materials andpoor design led to extensive reworkand rclcsling.
Control of ProductivityMore than half the companies in the United States measure and manage productivity as part of
productivity the effort to improve their competitiveness. Productivity is a measure of outputs divided byA measure of outputs divided inputs. The fewer inputs needed to produce a given output, the more productive the organi/a-
by inputs tion. This simple definition, however, raises difficult measurement questions. How should thecompany measure outputs and inputs? Specific management control issues usually determinethe most appropriate measures. Labor-intcasivc organizations, especially service organizations.focus on increasing the productivity of labor, so labor-based measures arc appropriate. Highlyautomatedcompanies focus on machine use andproductivity of capital investments, so capacity-based measures, such as the percentage of time machines arc available, may be most importantto them. Manufacturing companies, in general, monitor the efficient use of materials. For them.measures of material yield (a ratioof material outputs over material inputs) may be useful indica¬tors of productivity.
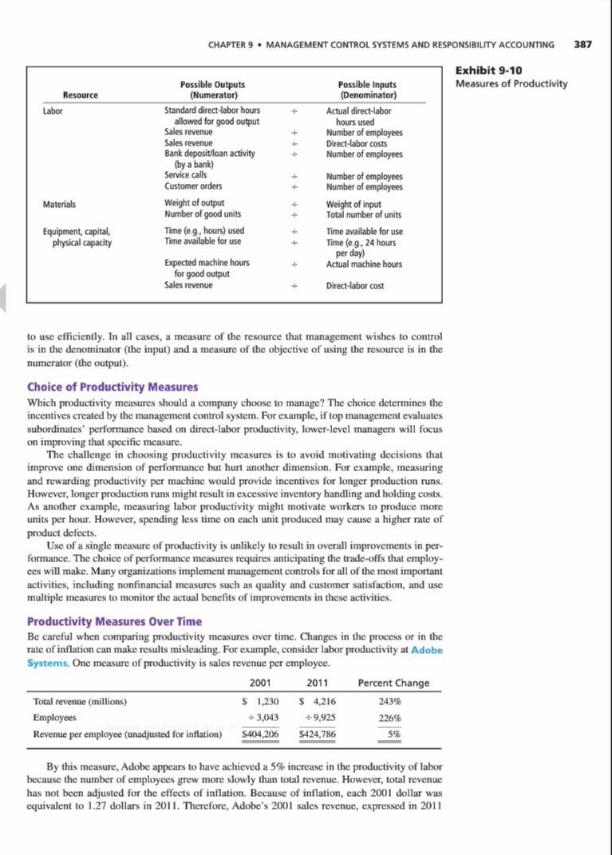
Exhibit 9-10 shows 12 examples of productivity measures. As you can sec from theseexamples, measures vary widely according lo the type of resource that management wishes
Exhibit 9-9Eastside ManufacturingCompanyCycle Time Reponfor the SecondWeek of May
Actual Standard
Process StageCydeTime*
CycleTime Variance Explanation
Materials processing 21 25 04 FCircuit board assembly 447 28 8 15 9 U Poor-quality materials caused reworkPower unit assembly 596 362 23 4 U Engineering change required
rebuilding all power unitsProduct assembly 146 147 01FFunctional and
environmental test 53 3 320 21 3 U Software failure in testprocedures required retesting
F -Favor** U - Untenant*'Avmgtww per tag* over weft
CHAPTER 9 • MANAGEMENT CONTROL SYSTEMS AND RESPONSIBILITY ACCOUNTING
Possible Outputs Possible InputsResource (Numerator) (Denominator)
Labor Standard directlabor hoursallowed for good output
+ Actual direct-laborhours used
Sales revenue * Number of employeesSales revenue + Direct-labor costsBank deposit/loan activity + Number of employees
(by a bank)Service calls + Number of employeesCustomer orders + Number of employees
Materials Weight of output + Weight of inputNumber of good units + Total number of units
Equipment, capital, Time (eg,hours) used + Time available for usephysical capacity Time available for use + Time (e g ,24 hours
per day)Actual machine hoursExpected machine hours +
for good outputSales revenue * Direct-labor cost
Exhibit 9-10Measures of Productivity
lo use efficiently. In all eases, a measure of the resource that management wishes to controlis in the denominator (the input) and a measure of the objective of using the resource is in thenumerator (the output).
Choice of Productivity MeasuresWhich productivity measures should a company choose to manage? The choice determines theincentives createdby the management control system. For example, if lopmanagement evaluatessubordinates' performance based on direct-labor productivity, lower-level managers will focuson improving that specific measure.
The challenge in choosing productivity measures is to avoid motivating decisions thatimprove erne dimension of performance but hurt another dimension. For example, measuringand rewarding productivity per machine would provide incentives for longer production runs.However, longer productionruns might result inexcessive inventory handlingand holding costs.As another example, measuring labor productivity might motivate workers to produce moreunits per hour. However, spending less time on each unit produced may cause a higher rate ofproduct defects.
Use of a single measure of productivity is unlikely to result inoverall improvements in per¬formance. The choice of performance measures requires anticipating the trade-offs that employ¬ees will make. Many organizations implement management controls for all of the most importantactivities, including nonfinancial measures such as quality and customer satisfaction, and use
multiple measures to monitor the actual benefits of improvements in these activities
Productivity Measures Over TimeBe careful when comparing productivity measures over time. Changes in the process or in therate of inflation can make results misleading. For example, consider labor productivity at AdobeSystems. One measure of productivity is sales revenue per employee.
2001 2011 Percent Change
Total revenue (millions) S 1,230 $ 4.216 243%
Employees +3.043 +9,925 226%
Revenue per employee (unadjusted for inflation) S44M.206 S424.7K6 5%
By this measure. Adobe appears lohave achieved a 5% increase in the productivity of laborbecause the number of employees grew more slowly than total revenue. However, total revenuehas not been adjusted for the effects of inflation. Because of inflation, each 2(X)I dollar was
equivalent to 1.27 dollars in 201 1. Therefore. Adobe's 2001 sales revenue, expressed in 2011

Business FirstBalanced Scorecard Hall of FameRobert Kaplan and David Norton created the balanced icore-card (BSC) In 1992- The Balanced Scorecard Hall ofFarm honors organizations that have achieved executionexcellence through the use of the BSC To be selected for theHall of Fame, a company must apply one or more of the fol¬lowing five principles to create a strategy-focused organization:"mobilize change through executive leadership; translate thestrategy Into operational terms; align the organization aroundIts strategy, make strategy everyone's Job; and make strategy acontinual process." By the end of 201 1.the Balanced ScorecardCollaborative had recognized a total of 167 Hall of Fame orga¬nizations. Past inductees Include Army and Air Force-Exchange Service (AAFES). the City of Corpus Chrltd.BMW Financial Services,and Wendy's International.
AAFES Is a $9.9 billionglobal retailer with 43.000 employ¬ees serving military customers In 3.100 stores In 30 countries.AAFES adopted the BSC to prepare the organization to meet
growing and diverse demands of Its Increasingly mobile cus¬tomers. The BSC helps create alignment, drive accountability.optimizo resource allocation, and link strategy to operations.In 4 years revenue Increased by IIX.dividends 19%. employeesatisfaction 16%. and customer satisfaction 17%. Inventory wasreduced by about $108 million. Michael Howard.AAFES chiefoperating officer, observed the following: "The BSC has givenus the ability to look beyond traditional financial measures to
drive long-term sustainability that focuses on employee opti¬mization.The BSC aligns corporate resources and energies todrive performance that ensure AAFES continues to provide avalued benefit to the military market"
The City of Corpus Christ! is the largest coastal city InTexas and the nation's sixth largest portThe city employs about3.000.serving a population of 30S.000.The city adopted the BSCto dartfy and communicate its strategy, align departments, divi¬sions. and employees;and make more timely and better informeddecisions that impart citizens' lives. Constituent satisfaction
Increased 16Xworkforce retentionwas up,and citizen/customerwait time down.The city's bond rating Improved,fueled in partby the BSC management system. Angel R. Escobar. Interim citymanager commented. "Now.with the BSC.we know what weare great at and what we need to improve upon...our monthlyBSC meetings unify departmental directors to collectively focuson and discuss solutions to real Issues."
BMW Financial Services was established In 1993 to sup¬port the sales and marketing efforts of BMW North America.The company has more than $24 billion In managed assets
and offers customers flexible lease and retail financing options.BMW Financial Services adopted the BSC in 1998 and has seenremarkable growth in annual sales and number of customer
accounts. The company uses the scorecard to link objectives.Initiatives, and metrics to Its strategy and communicate theselinks throughout the company.
Wendy's International Is one of the world's largest restaurant
operating and franchising companies,with about 6.600 restaurants
and 201 1 revenue of $24 billion.The company Implemented theBSC to get a better handle on intangible assets,such as Intellectualcapital and customer focusCEOjack Schucssler lauded the BSCssuccess In "establishing targets and measuring our progress In keydimensions ranging from employee retention at the restaurant
level, to restaurant evaluation scores, to business processes, tototal revenue growth They are all vitally Important, not just thefinancial measures" The BSC provides a framework for balancingfinancial and nonfinancial measures.
The BSC has helped these and other award-winningorganizations In many different ways. Ithas gained wide accep¬tance and successful Implementation In many companies sinceIts Introduction more than IS years ago.
Source* AAFES Web cite (wwwahopmyencHinjc com). C*y of Corpu*Chrttti Wot, ike (cccciuwww cctaw): BMW of Nonb America Web it*
(wwwbm-uncom); The WmO,, Compaq 2011Annual krfxxz Palladium GroupWeb Utc (wwmthepalladnenfroiip com)
dollar, (so wc can compare ilwith 201 1 sales revenue), is SI.230X 1.27— SI.562. The adjusted2001 sales revenue per employee is as follows;
2001 (adjusted) 2011 Percent Change
Total revenue (millions) S 1.562 S 4.216 170%
Employees + 3,043 +9,925 226%
Revenue per employee (adjusted for inflation) $313,309 $424,786 -17%
Adjusting lor the effects of inflation reveals that Adobe's labor productivity has actuallydecreased by 17% rather than increasedby 5%.
Objective 7
Use a balanced scorecard to
integrate financial and nonfmancialmeasures ot performance
388
The Balanced ScorecardA balanced scorecard (BSC) is a system that strikes a balance between financial and nonfinan-cial measures in the performance measurement proccvs. links performance to rewards, and givesexplicit recognition to the link between performance measurement and organizational goals andobjectives. The balanced scorecard fixruscs management attention on measures that drive an orga¬nization to achieve its goals. About 50% of the I.(MX) largest U.S. firms use some version of the
CHAPTER 9 • MANAGEMENT CONTROL SYSTEMS AND RESPONSIBILITY ACCOUNTING
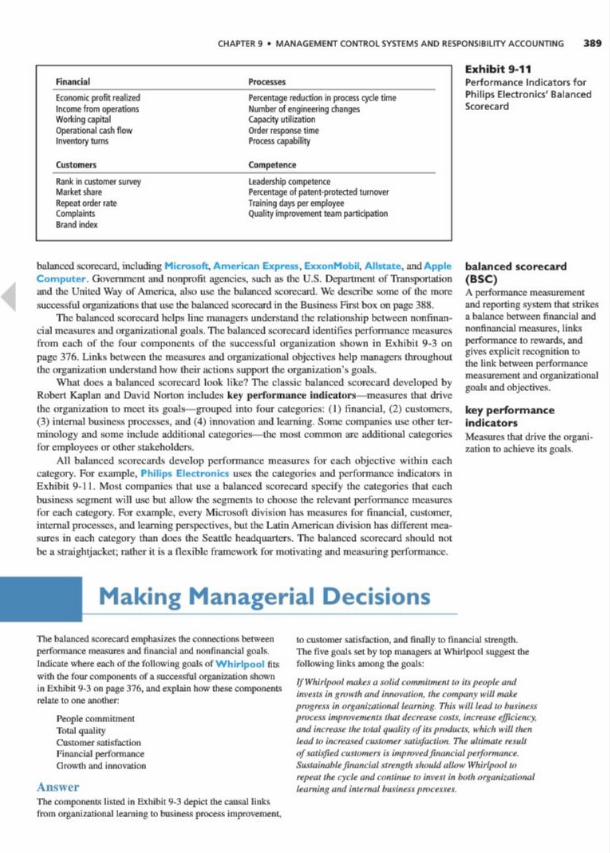
Financial Processes
Economic profit realized Percentage reduction in process cycle timeIncome from operations Number of engineering changesWorking capital Capacity utilizationOperational cash flow Order response timeInventory turns Process capability
Customers Competence
Rank in customer surveyMarket shareRepeat order rateComplaintsBrand index
Leadership competencePercentage of patent-protected turnover
Training days per employeeQuality improvement team participation
Exhibit 9-11Performance IndicatorsforPhilips Electronics' BalancedScorecard
balancedscorecard. including Microsoft.American Express, ExxonMobil. Allstate, andAppleComputer. Government and nonprofit agencies, such as the U.S. Deportment of TYansportationand the United Way of America, also use the balanced scorecard. We describe some of the moresuccessful organizations that use the balanced scorecard in the Business Fint box on page 388.
The balanced scorecard helps line managers understand the relationship between nonlinan-cial measures and organizational goals. The balanced scorecard identifies performance measuresfrom each of the four components of the successful organization shown in Exhibit 9-3 onpage 376. Links between the measures and organizational objectives help managers throughoutthe organization understand how their actions support the organization's goals.
What docs a balanced scorecard look like? The classic balanced scorccanl developed byRobert Kaplan and David Norton includes key performance Indicators measures that drivethe organization to meet its goals—grouped into four categories: (I) financial. (2) customers.(3) internal business processes, and (4) innovation and learning. Some companies use other ter¬minology and some include additional categories—the most common arc additional categoriesfor employees or other stakeholders.
All balanced scorccards develop performance measures for each objective within eachcategory. For example. Philips Electronics uses the categories and performance indicators inExhibit 9-11. Most companies that use a balanced scorecard specify the categories that eachbusiness segment will use but allow the segments to choose the relevant performance measureslor each category. For example, every Microsoft division has measures for financial, customer.internal processes, and learning perspectives, but the I-atinAmerican division has diiTcrent mea¬
sures in each category than docs the Seattle headquarters. The balanced scorecard should not
be a straightjacket; rather it is a flexible framework few motivating and measuringperformance.
balanced scorecard(BSC)A performance measurement
and reporting system that strikesa balance between financial andnonfinancial measures, linksperformance to rewards, andgives explicit recognition to
the link between performancemeasurement and organizationalgoals and objectives.
key performanceindicatorsMeasures that drive the organi¬zation to achieve itx goals
Making Managerial Decisions
Tlie balancedscorecard emphasizes the connections betweenperformance measures and financial and nonfinancial goalsIndicate where each of the following goals of Whirlpool fitswith the four components of a successful organization shownin Exhibit 9-3 on page 376, and explain how these componentsrelate to one another:
People commitmentTotal qualityCustomer satisfactionFinancial performanceGrowthand innovation
AnswerThe components listed in Exhibit 9-3 depict die causal linksfrom organizational learning to business process improvement.
to customer satisfaction, and finally to financial strength.The five goals set by top manager* at Whirlpool suggest thefollowing links among the goals:
IfWhirlpool makes a solid commitment to its people andim'esls ingrowth and innovation, the company will makeprogress in organizaliimal learning This will leadto businessprocess improvements that decrease casts, increase efficiency.and increase the total quality ofits products, which will thenleadto increasedcustomer satisfaction The ultimate result
of satisfied customers is impmvedfinancialperformance.Sustainablefinancial strength should allow Whirlpool to
repeat the cycle and continue to invest in both organizationallearningand internalbusinessprocesses.
390 PART 2 • ACCOUNTING FOR PLANNING AND CONTROL
Management Control Systems in Service,Government,and Nonprofit OrganizationsMany service organisations face substantial difficulty implementing management controlsystems. Why? Because the outputs of service organizations arc difficult to measure. Forexample, what is a good measure of output for a bank's call center (where service representa¬tives answer customers' questions)? Number of calls or total time spent on calls? The mea¬sure "number of calls" might motivate many short calls that do not provide thorough answersto customers. The measure "total time spent on calls" might motivate long, time-wastingcalls. It is often difficult to know the quality, or sometimes even the quantity, of the serviceprovided until long after the organization delivers the service. When quality and quantityof output arc hard to measure, developing timely measures of input/output relationships isnearly impossible.
The keys to successful management control in any organization arc proper training and
motivation of employees to achieve the organization's strategic objectives, accompanied byconsistent monitoring of measures chosen to fit with these objectives. These keys arc equallyimportant in scrvicc-oricnicd organizations. MBNA America, a large issuer of bank creditcards, works hard to measure the amount and quality of its service. It identifies customer
retention as iIs most important key success factor. MBNA trains its customer representativescarefully. Each day it measures and reports performance on 14 objectives consistent withcustomer retention, and it rewards every employee based on those 14 objectives. Measuresinclude answering every call by the second ring, keeping the computer up 100% of the time.and processing credit-line requests within I hour. Employees earn bonuses as high as 20% oftheir annual salaries by meeting those objectives.
Government and nonprofit organizations face additional difficulties. When for-profit orga¬nizations confront conflicting goals, the appropriate trade-off is determined by the net effecton the financial "bottom line." When government and nonprofit organizations face conflictinggoals us to when, where, and to whom they will provide services, the relevant trade-offs arcoften unclear. Because they have no precisely defined objective function that specifics how to
make these trade-offs, it is difficult to determine the "right" incentives to be incorporated in themanagement control system.
Further, the design of management control systems in nonprofit organizations is compli¬cated by the fact that many people in these organizations seek primarily nonmonetary rewards.For example, volunteers in the Peace Corps receive little pay but derive much satisfaction fromhelping to improve conditions inunderdeveloped countries. AmeriCorps volunteers have simi¬lar objectives domestically. Thus, monetary incentives arc generally less effective in nonprofitorganizations.
Insummary, management control systems in nonprofit organizations probably will never beas highly developed as arc those inprofit-seeking firms because of the following:
1. Organizational goals and objectives arc less clear. Moreover, there arc often multiple goalsandobjectives, requiring difficult trade-offs.
2. Professionals (for example, teachers, attorneys, physicians, scientists. cconomisLs) tend todominate nonprofit organizations. Because of their perceivedprofessional status, they arcoften less receptive to the installation of formal control systems.
3. Measurements arc more difiicullbecausea. there is no profit measure, andb. there arc heavy amounts of discretionary fixed costs, which make the relationships of
inputs to outpuLs difficult to specify and measure.4. There is less competitive pressure from other organizations or "owners" to improve man¬
agement control systems. As a result, many cities in the United Slates arc "privatizing"some essential services, such as sanitation, by contracting with private firms.
5. The role of budgeting, instead of being a rigorous planningprocess, is often more a
matter of playing bargaining games with sources of funding to gel the largest possibleauthorization.
6. Motivations and incentives of employees may differ from those in for-profit organizations.
Objective 8
Describe the difficulties ofmanagement control in service
and nonprofit organizations
CHAPTER 9 • MANAGEMENT CONTROL SYSTEMS AND RESPONSIBILITY ACCOUNTING 391
Making Managerial Decisions
Study Exhibit 9-3 again. Use the tame four general compo- an available poolof financial resources. Thus, the causal
nents. but rearrange thein to reflect a framework that might relationships might be as follows:help managers of a successful governmental or nonprofit ..... . Organizational learning process improvements in delivering
program* -* improvedfinalorfinancial strength -+ greater
Answer program benefitsfar citizens or clients
For governmental and nonprofit organizations, the ultimateobjective isnot to focus on financial results but to deliverthe maximum benefits to customers (or citizens) basedon
Future of Management Control SystemsAs organizations mature and as environments change, managers expand and refine their manage¬ment control tools. Tlic management control techniques that were satisfactory 10or 20 years agoarc not adequate for many organizations today.
A changing environment often means that organizations adjust their goals or key successfactors. New goals require different benchmarks for evaluating performance. The managementcontrol system must evolve, too. cw the organization may not manage its resources effectively orefficiently. A summary of management control principles that will always be important and canguide the redesign of systems follows:
1. Always expect that individuals will be pulled in the direction of their own self-interest.You may be pleasantly surprised that some individuals will act sclflessly, but manage¬ment control systems should be designed to take advantage of more typical humanbehavior. Also, be aware that managers indifferent cultures may perceive self-interestdifferently.
2. Design incentives so that individuals who pursue their own self-interest alsoachieve the organization's objectives. Because there arc usually multiple objectives.multiple incentives arc appropriate. Do not underestimate the difficulty of balancingmultiple incentives.
3. Evaluate actual performance relative to planned performance. Where appri»priatc. reviseplanned performance to reflect actual output achieved. You can apply the concept offlexible budgeting to many goals and actions, both financial and nonlinancial.
4. Consider nonlinancial performance to be an important determinant of long-term success.
In the short run. a manager may be able to generate good financial performance whileneglecting nonlinancial performance, but it is n<« likely over the long haul.
5. Array performance measures across the entire value chain of the company to ensure thatthe management control system incorporates all activities that arc critical to the long-runsuccess of the company.
6. Periodically review the success of the management control system. Is the organizationachieving its overall goals? Do the actions motivated by the management control systemlead to goal achievement? Do individuals understand the management control system andeffectively use the information it provides?
7. Lcam fnmi the management control successes (and failures) of competitors around theworld. Despite cultural differences, human behavior is remarkably similar. Managerscan learn from successful applications of new technology and management controls byreading books or attending courses that describe management control systems at othercompanies.
392 PART 2 • ACCOUNTING FOR PLANNING AND CONTROL
Highlights to RememberI. Describe the relationship of management control systems to organizational goals.
The Mailing point lor designing and evaluating a management control system is the identification oforganizational goals as specified by top management
2. Explain the importance of evaluating performance and describe how it impactsmotivation, goal congruence, and employee effort. The way an organization measures andevaluates pertonnance affects individuals' behavior.The morethat it ties rewards to performance mea¬sures. the more incentive there is to improve the measures. Poorly designed measures may actuallywork against the organization's goals
3. Develop performance measures and use them to monitor the achievements ofan organization. A well-designed management control system measures both financial andnonlinanciai pertonnance. Superior nonfinancial performance usually leads to superior financial per-fonnance in time The performance measures should tell managers how well they are meeting theorganization's goals.
4. Use responsibility accounting to define an organizational subunit as a cost center, aprofit center, or an investment center. Responsibility accounting assigns revenue and cost
objectives to the management of the subunit that has the greatest influence over them. Cost centers
focus on costs only, profit centers on both revenues and costs, and investment centers on profits rela¬tive to the amount invested.
S. Prepare segment income statements for evaluating profit and investment centers
using the contribution margin and controllable-cost concepts. The contribution approachto measuring a segment's income aids pertonnance evaluation by separating a segment's costs intothose controllable by the segment management and those beyond management's control. It allowsseparate evaluation of a segment as an economic investment and tlie pertonnance of the segment'smanager
6. Measure performance against nonfinancial performance measures such as quality,cycle time, and productivity. Measuring performance in areas such as quality, cycle time, andproductivity causes employees to direct attention to those areas Achieving goals in these nonfinancialmeasures can help meet long-run financial objectives
7. Use a balanced scorecard to integrate financial and nonfinancial measures ofperformance. The balanced scorecard helps managers monitor actions that are designed to meet thevarious goals of the organization It integrates key pertonnance indicators that measure how well theorganization is meeting its goals
8. Describe the difficulties of management control in service and nonprofit organizations.Managementcontrol in service and nonprofit organizations isdifficult because of a number of factors,including a relative lack of clearly observable outcomes and. for many nonprofit organizations, thelack of a clearly defined objective function
AccountingVocabulary
balanced scorecard (BSC).p 389
controllable cost.p. 378cost center,p. 378cost of quality report, p 384cycle time. p. 385goal congruence, p 373investment center, p. 379key performance indicators.
p 389
key succcvs factor, p. 372management control system.
p 371managerial effort, p. 373motivation, p. 374productivity, p 386profit center, p. 378quality control,p. 383quality-control chart,
p 384
responsibility accounting.p 378
responsibility center,
p 378segments, p 379throughput time, p 385total quality management
(TQM),p 384uncontrollable cost.p. 378
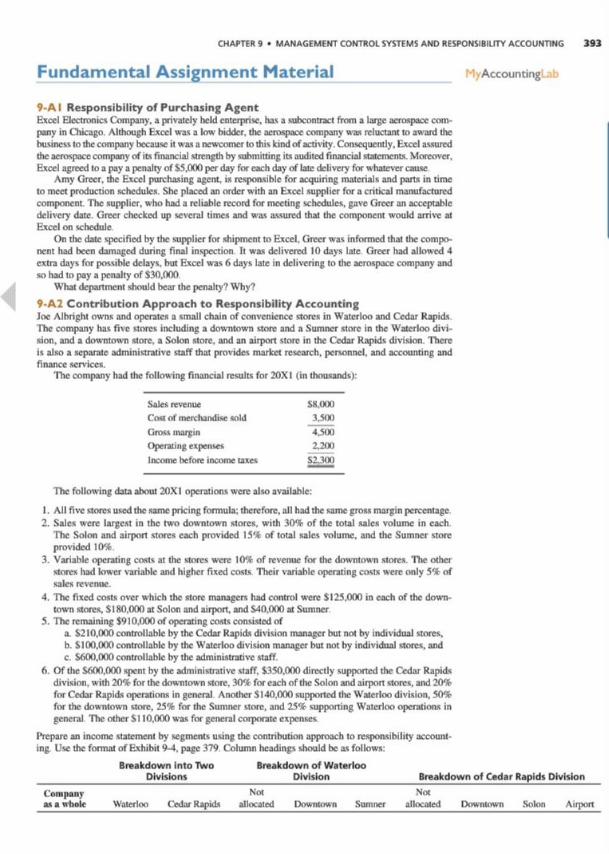
CHAPTER 9 • MANAGEMENT CONTROL SYSTEMS AND RESPONSIBILITY ACCOUNTING 393
Fundamental Assignment Material MyAccountingLib
9-AI Responsibility of Purchasing AgentExcel ElectronicsCompany, a privately held enterprise, has a subcontract from a large aerospace com¬pany in Chicago. Although Excel was a low bidder, the aerospace company was reluctant to award thebusiness to the company because it was a newcomer to this kindof activity.Consequently.Excel assuredthe aerospace company of its financial strength by submitting its audited financial statements. Moreover.Excel agreed to a pay a penalty of $5,000 per day for each day of late delivery for whatever cause
Amy Greer, the Excel purchasing agent, is responsible for acquiring materials and parts intimeto meet production schedules. She placed an order with an Excel supplier for a critical manufacturedcomponent. The supplier,who had a reliable record for meeting schedules, gave Greer an acceptabledelivery date. Greer checked up several times and was assured that the component would arrive atExcel on schedule
On the date specified by the supplier for shipment to Excel, Greer was informed that the compo¬nent had been damaged during final inspection It was delivered 10 days late Greer had allowed 4extra days for possible delays, but Excel was 6 days late in delivering to the aerospace company andso had to pay a penalty of $30,000
What department should bear the penalty?Why?
9-A2 Contribution Approach to Responsibility AccountingJoe Albright owns and operates a small chain of convenience stores in Waterloo and Cedar RapidsThe company has five stores including a downtown store and a Sumner store in the Waterloo divi¬sion. and a downtown store, a Solon store, and an airport store in the Cedar Rapids division. Thereis also a separate administrative staff that provides market research, personnel, and accounting andfinance services.
The company had the following financial results for 20X1 (in thousands):
Sales revenue SX.000Cost of merchandise sold 3.300Gross marginOperating expensesIncomebefore income taxes
The following data about 20X1 operations were also available:
I. All five stores used the same pricingformula: therefore, all hadthe same gross margin percentage2. Sales were largest in the two downtown stores, with 30% of the total sales volume in each
The Solon and airport stores each provided 15% of total sales volume, and the Sumner store
provided 10%3. Variable operating costs at the stores were 10% of revenue for the downtown stores. The other
stores had lower variable and higher fixed costs Their variable operating costs were only 5% ofsales revenue.
4. The fixed costs over which the store managers had control were $125,000 in each of the down¬town stores. $180,000 at Solon andairport, and $40,000 at Sumner
5. The remaining $910,000 of operating costs consisted ofa. S210.000controllable by the Cedar Rapids division manager but not by individual stores.b. $100,000 controllable by the Waterloo division manager but not by individual stores, andc. $600,000 controllable by the administrative staff.
6. Of the $600,000 spent by the administrative staff. $350,000 directly supported the Cedar Rapidsdivision,with 20% for the downtown store. 30% for each of the Solon and airport stores, and20%for Cedar Rapids operations in general Another SI40.000 supported the Waterloo division.50%for the downtown store. 25% for the Sumner store, and 25% supporting Waterloo operations ingeneral Hie other $110,000wis for general corporate expenses
Prepare an income statement by segments using the contribution approach to responsibility account¬ing Use the format of Exhibit 9-4. page 379 Column headings should he as follows:
Breakdown Into TWo Breakdown of WaterlooDivisions Division Breakdown of Cedar Rapids Division
Company Not Notas a whole Waterloo Cedar Rapids allocated Downtown Sumner allocated Downtown Solon Airport
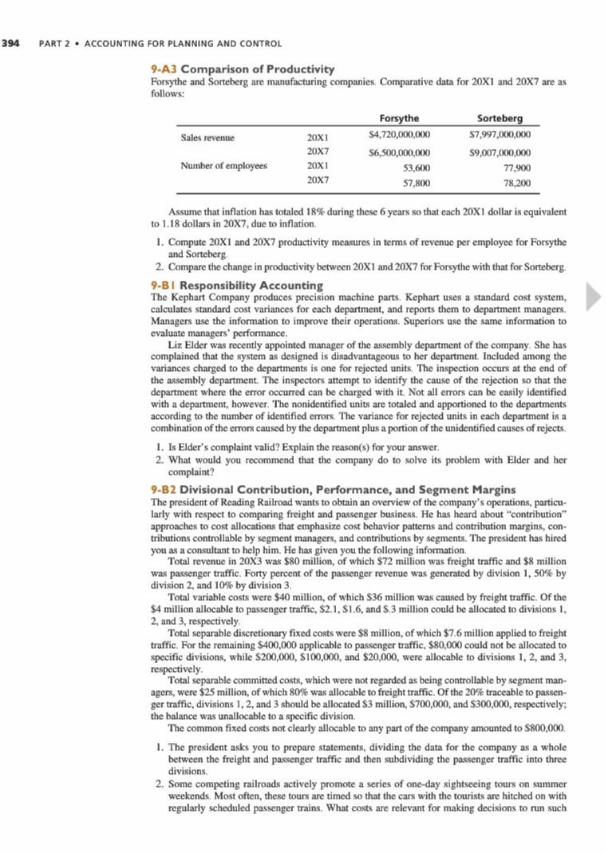
394 PART 2 • ACCOUNTING FOR PLANNING AND CONTROL
9-A3 Comparison of ProductivityForsythe and Sorteberg arc manufacturing companies Comparative data for 20X1 and 20X7 arc asfollows:
Forsythe_Sorteberg
Sales revenue 20X1 S4.720.000.000 S7,997,000,000
20X7 S6.500.000.000 S9,007,000.000Number of employees 20X1 53.600 77.900
20X7 57.KOO 78200
Assume that inflationhas totaled 18*during these 6 years so that each 20X 1 dollar is equivalentto 1.18 dollars in 20X7,due to inflation
I. Compute 20X1 and 20X7 productivity measures in terms of revenue per employee for Forsytheand Sorteberg
2. Compare the change in productivity between20X 1 and 20X7 for Forsythewith that for Sorteberg
9-B I Responsibility AccountingThe Kcphart Company produces precision machine pans Kephan uses a standard cost system.calculates standard cost variances for each department, and reports them to department managersManagers use the information to improve their operations. Superiors use the same information to
evaluate managers' performance.Liz Elder was recently appointed manager of the assembly department of the company She has
complained that the system as designed is disadvantageous to her department Included among thevariances charged to the departments is one for rejected units The inspection occurs at the end ofthe assembly department The inspectors attempt to identify the cause of the rejection so that thedepartment where the error occuncd can be charged with it. Not all errors can be easily identifiedwith a department, however The nonidcntified units are totaled and apportioned to the departmentsaccording to the number of identified errors The variance for rejected units in each department is acombination of the errors caused by the department plus a portion of the unidentified causes of rejects
I. Is Elder's complaint valid? Explain the rcason(s) for your answer2. What would you recommend that the company do to solve its problem with Elder and her
complaint?
9-B2 Divisional Contribution, Performance, and Segment MarginsThe president of Reading Railroadwants to obtain an overview of the company's operations, particu¬larly with respect to comparing freight and passenger business He has heard about "contribution"approaches to cost allocations that emphasize cost behavior patterns and contribution margins, con¬tributions controllable by segment managers, and contributions by segments. The president has hiredyou as a consultant to help him. He has given you the following information
Total revenue in 20X3 was $80 million, of which $72 million was freight traffic and $8 millionwas passenger traffic. Forty percent of the passenger revenue was generated by division 1. 50* bydivision 2. and 10*by division3.
Total variable costs were $40 million, of which $36 million was caused by freight traffic. Of the$4 million allocable to passenger traffic. S2.1. SI.6. and S 3 million could be allocated to divisions I.2. and 3. respectively
Total separable discretionary fixed costs were $8 million,of which $7 6 million applied to freighttraffic For the remaining S400.000 applicable to passenger traffic. $80,000 could not be allocated to
specific divisions, while S200.000, SI00.000, and $20,000, were allocable to divisions I.2. and 3,respectively.
Total separable committed costs, which were not regarded as being controllable by segment man¬agers. were $25 million, of which 80* was allocable to freight traffic. Of the 20* traceable to passen¬ger traffic, divisions 1,2,and 3 should be allocated S3 million. $700,000, and $300,000, respectively:the balance was unallocable to a specific division
The common fixed costs not clearly allocable to any part of the company amounted to $800,000
I. The president asks you to prepare statements, dividing the data for the company as a wholebetween the freight and passenger traffic and then subdividing the passenger traffic into threedivisions.
2. Some competing railroads actively promote a series of one-day sightseeing tours on summerweekends Most often, these tours are timed so that the cars with the tourists arc hitched on withregularly scheduled passenger trains What costs arc relevant for making decisions to nin such

CHAPTER 9 • MANAGEMENT CONTROL SYSTEMS AND RESPONSIBILITY ACCOUNTING
lours? Other railroads, facing the same general cost structure, refuse to conduct such sightseeingtours Why?
3. Suppose that the railroad has petitionedgovernment authorities for permission to drop division 1What would he the effect on overall company net income for 20X4. assuming that the figuresare accurate and that 20X4 operations arc expected to be in all respects a duplication of 20X3operations?
9-B3 Balanced Scorecard for a Law FirmYoung. Martinez, and Cheung (YMC) is a law firm in Chicago The firm has had a very loose andrelaxed management style that has served it well in the past. However, more aggressive law firmshave been winning new clients faster than YMC has Thus, the managing partner, Jerry Martinez.recently attended an ABA seminar on performance measurement in law firms, where he learnedaboutthe balancedscorecard He thought it might be a good tool for YMC, one that would allow the firm to
keep its culture yet still more aggressively seek new clients.Martinez identified the following strategic objectives that fit with the firm's core values and
provide a framework for assessing progress toward the firm's goals:
Financiala. Steadily increase the firm's revenues and profits.
Customera. Understandthe firm's customers and their needsb. Value castomer service over self-interest.
InternalBusiness Process
a Encourage knowledge sharing among the legal staffb. Communicate with each other openly, honestly, and often.c. Empower staff to make decisions that benefit clients.
OrganizationalI-earninga. Maintain an open and collaborative environment that attracts and retains the best legal staff.b. Seek staff diversity
I. Develop at least one measure for each of the strategic objectives listed.2. Explain how YMC can use this balanced scorecard to evaluate staff performance3. Should staff compensation be tied to the scorecard performance measures? Why or why not?
Additional Assignment Material
QUESTIONS9- 1 What is a management control system?9-2 What are the purposes of a managementcontrol system?9-3 What arc the major components of a man¬agement control system?9-4 What is a key success factor?9-5 "Goals arc useless without performancemeasures "Do you agree? Explain9-6 "There are corporate goals other than to
improve profit " Name three9-7 How docs management determine its keysuccess factors?9-8 Give three examples of how managers mayimprove short-run performance to the detrimentof long-run results
9-9 Name three kinds of responsibility centers
9- 10 How do profit centers and investment cen¬ters differ?9- 1 I List five characteristics of a good perfor¬mance measure9- 12 List four nonfinancial measures of perfor¬mance that managers find useful
9- 13 "Performance evaluation seeks to achievegoal congruence and managerial effort " Explainwhat is meant by this statement
9- 14 "Managers of profit centers should be heldresponsible for the center's entire profit They arcresponsible for profit even if they cannot controlall factors affecting it."Discuss9- 15 "Variable costs are controllable and fixedcosts are uncontrollable." Doyou agree? Explain9- 16 "The contribution margin is the best mea¬sure of short-run performance" Do you agree?Explain9- 17 Give four examples of segments9- 18 "Always try to distinguish between the per¬formance of a segment and its manager"Why?9- 19 'The contribution margin approach to per¬formance evaluation is flawed because focusingon only the contribution margin ignores importantaspects of performance." Doyou agree? Explain.9-20 What is a balanced scorecard and why arcmore companies using one?9-2 1 What are key performance indicators?
MyAccountingLib
396 PART 2 • ACCOUNTING FOR PLANNING AND CONTROL
9-22 There are four categories of cost in the using all financial measures, and (c) one thatquality cost report: explain them mixes physical and financial measures9-23Why are companies increasing their quality 9-26 Discuss the difficulties of comparing pro-control emphasis on the prevention of defects? ductivity measures over time
9-24 "Nonfinancial measures of performance 9-27 "Control systems in nonprofit organizationscan be controlled just like financial measures" will never be as highly developed as in profit-Do you agree? Explain seeking organizations"Doyou agree? Explain9-25 Identify' three measures of labor productiv¬ity. (a) one using all physical measures, (b) one
CRITICALTHINKING EXERCISES
9-28 Management Control Systems and InnovationThe president of a fast-growing, high-technology firm remarked. "Developing budgets and comparingperformance with the budgets may be fine for some firms But we want to encourage innovation andcntrcpreneurship Budgets go with bureaucracy, not innovation " Do you agree? How can a manage¬ment control system encourage innovation and cntrcpreneurship?
9-29 Municipal Responsibility AccountingAfter barely avoiding bankruptcy. New York City established one of the most sophisticated budgetingand reporting systems of any municipality The Integrated Financial Management System (fFMS)
"clearly identifies managers in line agencies and correlates allocations and expenditures with organi¬zational structure . In addition, managers have more time to take corrective measures when vari¬ances between budgeted and actual expenditures start to develop." (FE—The Magazinefor FinancialExecutives, 1.no. 8. p. 26.)
Discuss how a responsibility accounting system such as IFMS can help manage a municipalitysuch as New York City
9-30 Control Systems and Customer Service Function of the Value ChainCompanies increasingly use nonfinancial measures to supplement financial measures of performance.One of the most important areas of nonfinancialperformance iscustomer service.The last decade hasbrought an increasedfocus on the customer, and this focus is reflected in many companies' manage¬ment control systems, where companies use "customer-value metrics." That is. they develop mea¬sures that monitor how well the company is meeting its customers' interests. What customer-valuemetrics might a company such as Volvo, the Swedish automobile company, use in its managementcontrol system?
9-3 I Control Systems and the Production Function of the Value ChainIn recent years, many organizations have focused on the value of controlling nonfinancialperformanceas a key to improvedproductivity In particular, to gain and maintain a competitive edge, companiesfocus on quality and cycle time. Discuss how quality, cycle time, and productivity are related
9-32 Key Performance IndicatorsResearch on performance management suggests that organizations can compete most effectively byidentifying and monitoring those elements that are most closely linked to organizational success.A key performance indicator can be thought of as a measure that drives organizational success.For each of the following companies or organizations, identify two possible key performanceindicators
I. Delta Airlines2. Wal-Mart3. Hewlett Packard4. New York Department of Motor Vehicles
EXERCISES
9-33 Responsibility for Stable Employment PolicyThe Mid-Atlantic Metal Fabricating Company has been manufacturing machine tools for a numberof years and has had an industry-wide reputation for doing high-quality work The company has beenfaced with fluctuations in demand over the years. It has been company policy to lay off welders assoon as there was insufficient work to keep them busy and to rehire them when demand warrantedBecause of this lay-off policy, the company now has poor labor relations and finds it difficult to hiregood welders. Consequently, the quality of the products has been declining steadily

CHAPTER 9 • MANAGEMENT CONTROL SYSTEMS AND RESPONSIBILITY ACCOUNTING 397
The plant manager has proposed that welders, who cam S20 per hour, be retained during slowperiods to do menial plant maintenance work that is normally performed hy workers earning $14 perhour in the plant maintenance department
You, as controller, must decide the most appropriate accounting procedure to handle the wages ofthe welders doing plant maintenance work. What departmental should he chargedwith this work, andat what rate? Discuss the implicationsof your plan
9-34 Salesderk's Compensation PlanYou arc the manager of a department store in Tokyo. Sales arc subject to month-to-month variations.depending on the individual salcsclcrk "s efforts and other factors A new salary -plus-bonus plan hasbeen in effect for 4 months, and you arc reviewing a sales performance report The plan provides fora base salary of ¥50.000 per month, a¥68,000 bonus each month if the salcsclcrk meets the monthlysales quota, and an additional commissionof 5** of all sales over the monthly quota Eachmonth,tirequota is reset at approximately 3% above the previous month's sales to motivate clerks to continuallyincrease sales The monthly quotas and actual amounts for the first 4 monthsof the plan arc shown inthe following sales report (in thousands):
Salesclerk A Salesclerk B Salesclerk C
January Quota ¥4,500 ¥1.500 ¥7,500
Actual 1,500 1,500 9,000
February Quota ¥1.545 ¥1.545 ¥9,270
Actual 3,000 1.545 3,000
March Quota ¥3,090 ¥1.590 ¥3,090
Actual 5,250 750 9,000
April Quota ¥5,400 ¥ 775 ¥9.270Actual 1,500 780 4.050
I. Compute the compensation for each salcsclcrk for each month.2. Evaluate the compensation plan Be specific. What changes would you recommend?
9-35 Common Measures on a Balanced ScorecardListed next arc common performance measures appearing on balanced tcorccards Indicate whetherthe listed measure is primarily associated with the financial, customer, internal process, or learningand growth perspective (Note that some measures might reasonably he associated with more than oneperspective.)
• Return on sales• Retention of target customers
• Net cash flow
• Training hours
• Employee turnover rate
• Materials handling cost per unit
• Market share
• Product-development cycle time
• Revenue growth in segments
• Occupational injuriesand illness
• Day's sales in inventory
• Average cost per invoice
9-36 Goals and Objectives at Health NetHealth Net provides health care to more than 5.6 million members As a managed hcalth-carc orga¬nization. the company strives to provide high-quality health care at a reasonable cost. Many stake¬holders have an interest in Health Net's operations, including doctors and other medical personnel.patients, insurance companies, government regulators, and the general public
Prepare a goal and one measure for assessing achievement of that goal for each of the followingkey areas:
Customer satisfactionEfficient use of lab tests
Usage of physician timeMaintenanceof state-of-the-art facilitiesOverall financial performance

PART 2 • ACCOUNTING FOR PLANNING AND CONTROL
9-37 Performance EvaluationDaniel Merrill & Co in a slock brokerage firm thai evaluates its employees on sales activity gen¬erated. Recently, the firm also began evaluating its stockbrokers on the number of new accounts
generatedDiscuss how these two performance measures arc consistent and how they may conflict Do you
believe that these measures are appropriate for the long-term goal of profitability?
9-38 Simple Controllable CostsShortline Espresso is a gourmet dessert restaurant in Seattle Margie McMahon. the sole proprietor.expanded to a second location in Bellingham 3 years ago Recently. McMahon decided to enroll in aPtiDprogram and retire from active management of the individual restaurants but continues to overseethe entire company. She hired a manager for each restaurant In 20X3. each had sales of SI.200.000The Bellingham restaurant is still pricing lower than the Seattle restaurant to establish a customerbase Variable expenses run 70% of salesfor the Seattle restaurant and 75%of sales for the Bellinghamrestaurant
Eachmanager is responsible for therent and some other fixed costs for hisor her restaurant Thesecosts amounted to $110,000 for the Seattle restaurant and $75,000 for the one in Bellingham Thedifference isprimarily due to lower rent in Bellingham In addition, several costs, such as advertising.legal services, accounting, and personnel services, were centralized The managers had no control ofthese expenses, but some of them directly benefited the individual restaurants Of the $345,000 cost inthis category, $100,000 related to Seattle and SI85.000 to Bellingham. where most of the additionalcost in Bellingham is due to the cost of extra advertising to buildup its customer base. The remaining$60,000 was general corporate overhead.
I. Prepare income statements for each restaurant and for the company as a whole. Use a formatthat allows easy assessment of each manager's performance and each restaurant's economicperformance.
2. Using only the information given inthis exercise, do the following:a. Evaluate each restaurant as an economic investmentb. Evaluate each manager
9-39 Quality Theories ComparedExamine the following two graphs Compare the total quality management approach to the traditionaltheory of quality Which theory do you believe represents the current realities of today's global com¬petitive environment? Explain
Internal andExternalFailure
InternalandExternalFailure
Prevention andAppraisal . Prevention and
.Appraisal.
Quality Level Quality Level
9-40 Quality-Control ChartSan Angelo ManufacturingCompany was concerned about a growing number of defective units beingproduced At one time, the company had the percentage of defective units down to less than five perthousand, but recently rates of defects have been near, or even above. 1% The company decided to
graph its defects for the last 8 weeks (40 working days), beginning Monday. September 1 throughFriday. October 24 The graph is shown in Exhibit 9-12.
I. Identify two important trends evident in the quality-control chart2. What might management of San Angelo do to deal with each trend?
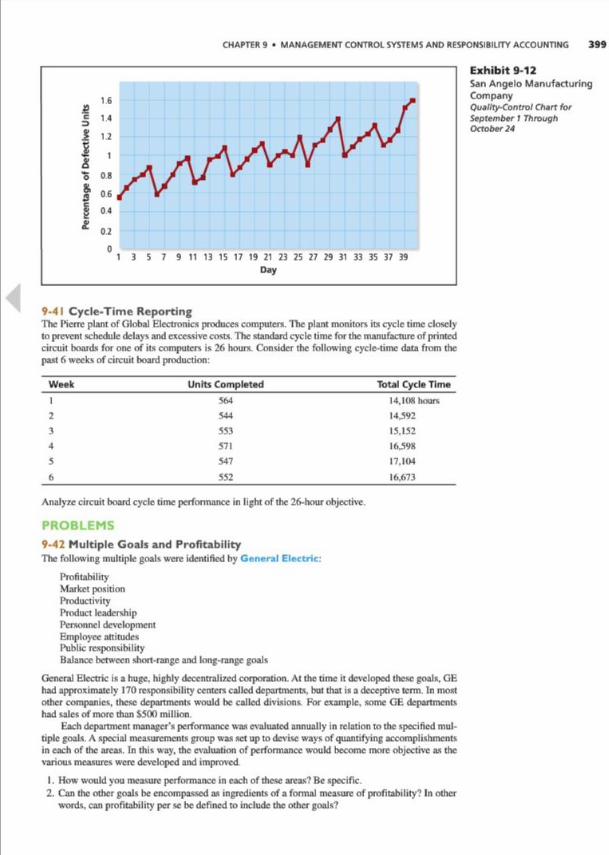
CHAPTER 9 • MANAGEMENT CONTROL SYSTEMS AND RESPONSIBILITY ACCOUNTING 399
1.6£5 1.43
1 1.2t*
&1
"5 08
£ 06
|04
* 02
03 5 7 9 11 13 15 17 19 21 23 25 27 29 31 33 35 37 39
Day
Exhibit 9-12San Angelo ManufacturingCompanyQuality-Control Chart forSeptember 1 ThroughOctober24
9-4 1 Cycle-Time ReportingThe Pierre plant of Global Electronics produces computers. The plant monitors its cycle time closelyto present schedule delays and excessive costs.The standard cycle time for the manufacture of printedcircuit boards for one of its computers is 26 hours. Consider the following cycle-time data from thepast 6 weeks of circuit boardproduction:
Week Units Completed Total Cycle Time
1 564 14,108 hours
2 544 14.3923 553 15.1524 571 164985 547 17.1046 552 16.673
Analyze circuit hoardcycle time performance in light of the 26-hour objective.
PROBLEMS
9-42 Multiple Goals and ProfitabilityThe following multiple goals were identified by General Electric:
ProfitabilityMarket positionProductivityProduct leadershipPersonnel developmentEmployee attitudesPublic responsibilityBalance between short-range and long-range goals
General Electric is a huge, highly decentralized corporation. At the time it developed these goals. GEhad approximately 170responsibility centers called departments, but that is a deceptive term. In most
other companies, these departments would be called divisions. For example, some GE departmentshad sales of more than $500 million
Each department manager's performance was evaluated annually in relationto the specified mul¬tiple goals. A special measurements group was set up to devise ways of quantifying accomplishmentsin each of the areas. In this way. the evaluation of performance would become more objective as thevarious measures were developed and improved
I. How would you measure performance ineach of these areas? Be specific.2. Can the other goals be encompassed as ingredients of a formal measure of profitability? Inother
words, can profitability per sc be defined to include the other goals?

400 PART 2 • ACCOUNTING FOR PLANNING AND CONTROL
9-43 Responsibility Accounting, Profit Centers, and Contribution ApproachRichflcld Honda hadthe following data for the year's operations:
The president of the dealership has long regarded the markup on material and labor for theparts and sen-ice activity as the amount that is supposed to cover all part* and service overheadplus some general overhead of the dealership In other words, the parts and sen-ice departmentis viewed as a cost-recovery operation, while the sales of vehicles is viewed as the income-producing activity
I. Prepare a departmentalized operating statement that harmonizes with the views of the president2. Prepare an alternative operating statement that would reflect a different view of the dealership
operations Assume that $30,000 and $89,000 of the S180.000 general overhead can he allocatedwith confidence to the parts and scnice department and to sales of vehicles, respectively Theremaining $61,000 cannot be allocated except in some highly arbitrary manner.
3. Comment on the relative merits of numbers 1 and2
9-44 Incentives in Planned EconomiesOften government-owned companies in planned economies reward managers based on nonfinancialmeasures. For example, the government might give managers a bonus for exceeding a 5-ycar-plannedtarget for production quantities A problem with this method is that managers tend to predict low vol¬umes so that officials will set the targets low This makes it easier for the managers to meet the targets.but it severely hinders planning because managers do notprovide accurate information about productionpossibilities.
The former .Soviet Uniondeveloped an alternative performance measurement and reward systemSuppose F is the forecast of production.A is actual production, and X. Y. and '/. are positive constants
set by top officials, with X. Y, Z >0. The following performance measure was designed to motivateboth high production and accurate forecasts.
Assume that Cuba adopted this measure at a time when Soviet influence was great Considerthe Havana Television Manufacturing Company (HTMC) During 19X3. the factory manager.Che Chavez, had to predict the number of TVs that HTMC could produce during the next yearHe was confident that at least 700.000 TVs could be produced in 19X4. and most likely they couldproduce 800.000 TVs With good luck, they might even produce 900.000 Government officials toldhim that the new performance evaluation measure would be used, and that X - .50, Y - .80. andZ = 1.00for 19X4 and 19X5.
I. Suppose Chavez predicted production of 800,000 TVs and HTMC actually produced 800.000Calculate the performance measure.
2. Suppose again that HTMC produced 800,000 TVs Calculate the performance measure if Chavezhad been coascrvativc and predicted only 700,000 TVs. Also calculate the performance measureif he had predicted 900,000 TVs.
3. Now suppose it is November 19X4,and it is clear that HTMC cannot achieve the 800,000 targetDoes the performance measure motivate continued efforts to increase production? Suppose it isclear that HTMC will easily meet the 800,000 targcL Will the system motivate continued effortsto increase production?
Sales of vehicles
Sales of parts and service
Cost of vehicle sales
Parts and service materials
Parts and service labor
Parts and service overhead
General dealership overhead
Advertising of vehicles
Sales commissions, vehicles
Sales salaries, vehicles
$3,100,000
500.0002,480.000
100.000
200.00040,000
180.000100.000155.00088.000
performance measure = ( Y X F) + [XX (A - F) ] IfF S A(KXF)-fZX (F - A)) if F > A
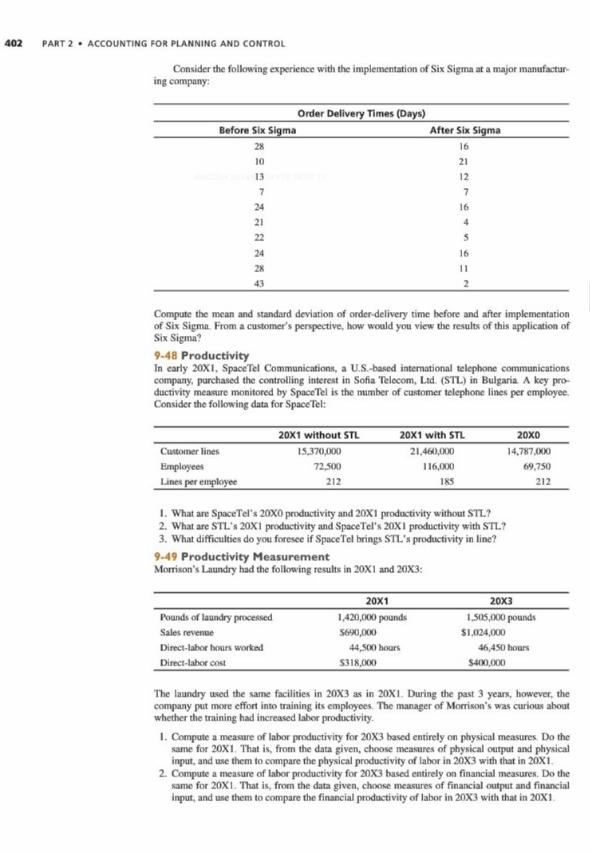
402 PART 2 • ACCOUNTING FOR PLANNING AND CONTROL
Consider the following experience with the implcmcniation of Six Sigma at a major manufactur¬ing company:
Order Delivery Times (Days)
Before Six Sigma After Six Sigma
28 16
10 21
13 12
7 7
24 16
21 422 5
24 16
28 11
43 2
Compute the mean and standard deviation of order-delivery time before and after implementationof Six Sigma From a customer's perspective, how would you view the results of this application ofSix Sigma?
9-48 ProductivityIn early 20X1. SpaccTcl Communications, a U S -based international telephone communicationscompany, purchased the controlling interest in Sofia Tfclccom. Ltd (STL) in Bulgaria A key pro¬ductivity measure monitored by SpaccTcl is the number of customer telephone lines per employeeConsider the following data for SpaccTfcl:
20X1 without STL 20X1 with STL 20X0
Customer lines 15.370.000 21.460.000 14.787.(8)0
Employee* 72ÿ00 116.000 69.750Lines per employee 212 185 212
I. What arc SpaceTcl's 20X0 productivity and 20X1 productivity without STL?2. What arc STL's 20X1 productivity and SpaceTcl's 20X1 productivity with STL?3. What difficulties do you foresee if SpaccTcl brings STL's productivity in line?
9-49 Productivity MeasurementMorrison's Laundry had the following results in 20X1 and 20X3:
20X1 20X3
Pounds of laundry processed 1.420.000pounds 1.505.000pounds
Sales revenue S690.000 SI.024.000Direct-labor hours worked 44.5(8) hours 46.450 hour*
Direct-labor cost S318.(88) S4(8).(8X)
The laundry used the same facilities in 20X3 as in 20X1 During the past 3 years, however, thecompany put more effort into training its employees The manager of Morrison's was curious aboutwhether the training had increased labor productivity
I. Compute a measure of labor productivity for 20X3 based entirely on physical measures Do thesame for 20XI That is. from the data given, choose measures of physical output and physicalinput, and use them to compare the physical productivity of labor in 20X3 with that in 20X1
2. Compute a measure of labor productivity for 20X3 based entirely on financial measures. Do thesame for 20X1 . That is. from the data given, choose measures of financial output and financialinput, and use them to compare the financial productivity of labor in 20X3 with that in 20XI
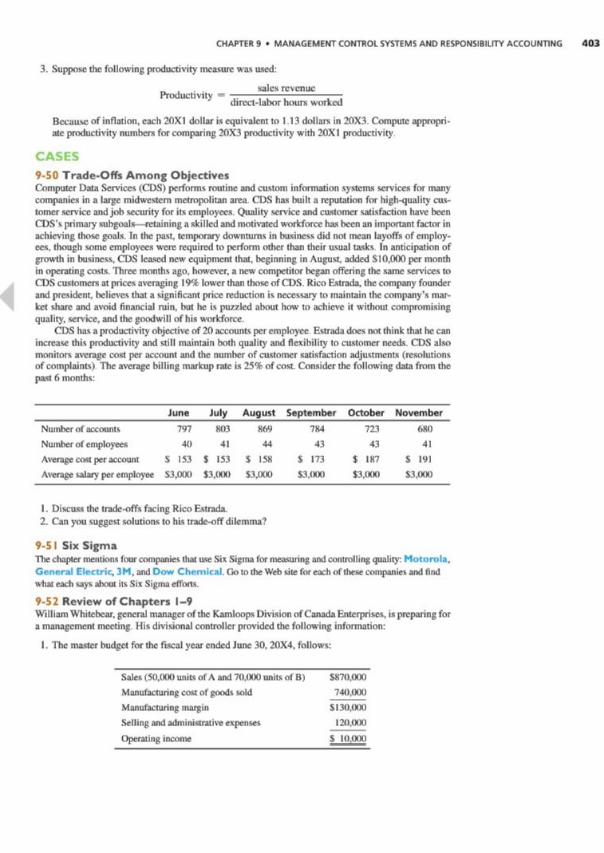
CHAPTER 9 • MANAGEMENT CONTROL SYSTEMS AND RESPONSIBILITY ACCOUNTING 403
3. Suppose the following productivity measure was used:
„ . sales revenueProductivity — —-——---—-
direct-labor hours worked
Because of inflation, each 20X1 dollar is equivalent to 1.13 dollars in 20X3. Compute appropri¬ate productivity numbers for comparing 20X3 productivity with 20X1 productivity
CASES
9-50 Trade-Offs Among ObjectivesComputer Data Sen-ices (CDS) performs routine and custom information systems services for manycompanies in a large midwestem metropolitan area CDS has built a reputation for high-quality cus¬tomer service andjob security for its employees. Quality service and customer satisfaction have beenCDS's primary subgoals—retaininga skilled and motivatedworkforce has been an important factor inachieving those goals. In the past, temporary downturns in business did not mean layoffs of employ¬ees. though some employees were required to perform other than their usual tasks Inanticipation ofgrowth in business. CDS leased new equipment that, beginning in August, added SI0,000 per monthin operating costs. Three months ago. however, a new competitor began offering the same services to
CDS customers at prices averaging 19** lower than those of CDS. RicoEstrada. the company founderand president, believes that a significant price reduction is necessary to maintain the company's mar¬ket share and avoid financial ruin, but he is puzzled about how to achieve it without compromisingquality, sen-ice. and the goodwill of his workforce.
CDS has a productivity objective of 20 accounts per employee Estrada docs not think that he canincrease this productivity and still maintain both quality and flexibility to customer needs. CDS alsomonitors average cost per account and the number of customer satisfaction adjustments (resolutionsof complaints) The average billing markup rate is 25% of cost. Consider the following data from thepast 6months:
June July August September October November
Number of accounts 797 803 869 784 723 680
Number of employees 40 41 44 43 43 41
Average cost per account S 153 $ 153 $ 158 S 173 $ 187 S 191
Average salary per employee S3.000 $3,000 $3,000 $3,000 $3,000 S3.000
I. Discuss the trade-offs facing RicoEstrada2. Can you suggest solutions to his trade-off dilemma?
9-5 I Six SigmaThe chapter mentions four companies thai use Six Sigma for measuring and controlling quality: Motorola.General Electric,3M. and Dow Chemical. Go to the Web site for each of these companies and findwhat each says about its Six Sigina efforts.
9-52 Review of Chapters 1-9WilliamWhitebear. general manager of the KamloopsDivision of Canada Enterprises,ispreparingfora management meeting His divisional controller providedthe following information:
I.The master budget for the fiscal year ended June 30. 20X4, follows:
Sales (30.000 uniis of A and 70.000 units of B)
Manufacturing cost of goods sold
Manufacturing marginSelling and administrative expenses
Operating income
$870,000
740.000SI30,000
120.000S 10.000

404 PART 2 • ACCOUNTING FOR PLANNING AND CONTROL
2. The standard variable manufacturing cost per unit follows:
Product A Product B
Direct materials 10pieces at $.25 $250 5 pounds at S.30 SI 50
Direct labor 1 hour at $3.00 3.00 .3 hour at $2 50 .75
Variable overhead 1 hour at $2.00 2.00 .3 hour at $2 50 .75
Total $7 50 S3.00
3. All budgeted selling and administrative expenses are common, fixed expenses: 60% arc discre¬tionary expenses.
4. The actual income statement for the fiscal year ended June 30. 20X4. follows:
Sales (53.000 units ofA and64,000 units of B) $861,000
Manufacturing cost of goods sold 749.200Manufacturing margin SIII.K00Selling and administrative expenses 116,000
Operating income $ (4.200)
5. The budgeted sales prices for products A and B were S9 and S6. respectively Actual sales pricesequaled budgeted sales prices
6. The schedule of the actual variable manufacturing cost of goods sold by product follows (actual
quantities in parentheses):
Product A: Materials $134,500 (538,000 pieces)
Labor 156.350 (53,000 hours)
Overhead 108.650 (53,000 hours)
Product B. Materials 102.400 (320,000 pounds)
Labor 50.000 (20,000 hours)
Overhead 50.000 (20.000 hours)
Total $601,900
7. Products A and B arc manufactured in separate facilities. Of the budgeted fixed manufacturingcost. SI30.000 is separable as follows: $45,000 to product A and S85.000 to product B. Ten per¬cent of these separate costs arc discretionary. All other budgeted fixed manufacturing expenses,separable and common, are committed.
8. There arc no beginning or ending inventories
During the upcoming management meeting, it is quite likely that some of the information fromthe controller will he discussed Inanticipation you set out to prepare answers to possible questions
I. Determine the firm's budgeted break-even point indollars,overall contribution-margin ratio, andcontribution margins per unit by product Assume no change in product mix.
2. Considering products A and B as segments of the firm, find the budgeted "contribution by seg¬ments" for each
3. It is decided to allocate the budgeted selling and administrative expenses to the segments (in
number 2) as follows: committed costs on the basis of budgeted unit sales mix and discretion¬ary costs on the basis of actual unit sales mix What are the final expense allocations? Brieflyappraise the allocation method
4. How would you respondto a proposal to base commissions to salespersons on the sales (revenue)
value of orders received? Assume all salespersons have the opportunity to sell both products.5. Determine the firm's actual "contribution margin" and "contribution controllable by segment
managers" for the fiscal year ended June 30. 20X4 Assume no variances in committedfixed costs
6. Determine the "sales-activity variance" for each product for the fiscal year ended June 30. 20X47. Determine and identify all variances in variable manufacturingcosts by product for the fiscal year
ended June 30. 20X4
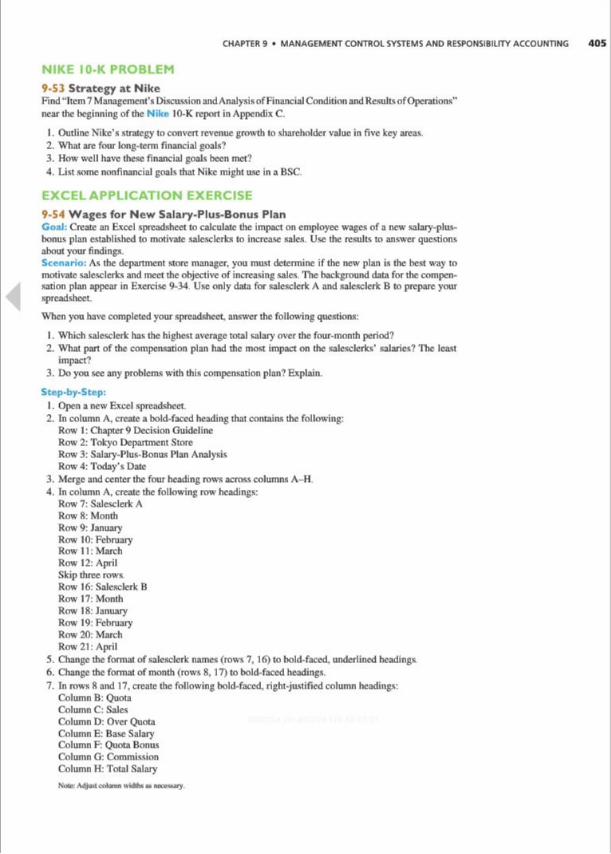
CHAPTER 9 • MANAGEMENT CONTROL SYSTEMS AND RESPONSIBILITY ACCOUNTING 405
NIKE 10-K PROBLEM
9-53 Strategy at NikeFind"Item7 Management's DiscussionandAnalysisof FinancialConditionand Resultsof Operations"near the beginningof the Nike 10-K report inAppendix C.
I. Outline Nike's strategy to convert revenue growth to shareholder value in five key areas2. What are four long-term financial goals?3. How well have these financial goals been met?4. List some nonfinancial goals that Nike might use in a BSC
EXCELAPPLICATION EXERCISE
9-54 Wages for New Salary-Plus-Bonus PlanGoal: Create an Excel spreadsheet to calculate the impact on employee wages of a new salary-plus-bonus plan established to motivate salesclcrks to increase sales. Use the results to answer questionsabout your findings.Scenario: As the department store manager, you must determine if the new plan is the best way to
motivate salesclcrks and meet the objective of increasing sales The backgrounddata for the compen¬sation plan appear in Exercise 9-34 Use only data for salesclerk A and salesclerk B to prepare yourspreadsheet
When you have completedyour spreadsheet, answer the following questions:
I. Which salesclerk has the highest average total salary over the four-month period?2. What part of the compcasation plan had the most impact on the salesclcrks' salaries? The least
impact?3. Do you sec any problems with this compensation plan? Explain.
Step-by-Step:I. Open a new Excel spreadsheet2. Incolumn A. create a bold-faced heading that contains the following:
Row I:Chapter 9 Decision GuidelineRow 2: Tokyo Department StoreRow 3: Salary-Plus-Bonus Plan AnalysisRow 4: Today's Date
3. Merge and center the four heading rows across columas A-H4. Incolumn A. create the following row headings:
Row 7: Salesclerk ARow 8: MonthRow 9: JanuaryRow 10: FebruaryRow 11 . MarchRow 12: AprilSkip three rowsRow 16: Salesclerk BRow 17: MonthRow 18: JanuaryRow 19: FebruaryRow 20: MarchRow 21: April
5. Change the format of salesclerk names (rows 7. 16) to bold-faced, underlined headings6. Change the format of month (rows 8. 17) to bold-faced headings7. In rows 8 and 17. create the following bold-faced, right-justifiedcolumn headings:
Column B: QuotaColumn C: SalesColumn D: Over QuotaColumn E:Base SalaryColumn F:Quota BonusColumn G: CommissionColumn H:Total Salary
Note. AdjuUcolumn .v«hh» «. ncortury
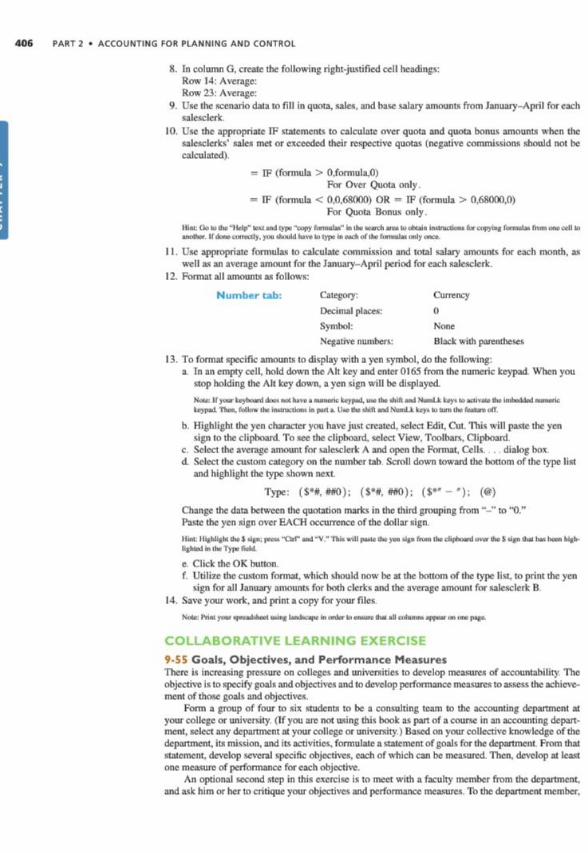
406 PART 2 • ACCOUNTING FOR PLANNING AND CONTROL
8. Incolumn G. create the following right-justifiedcell headings:Row 14: Average:Row 23: Average:
9. Use the scenario data to fill in quota, sales, and base salary amounts from January-April for eachsalcsclcrk
10. Use the appropriate IF statements to calculate over quota and quota bonus amounts when thesalcsclcrks' sales met or exceeded their respective quotas (negative commissions should not becalculated)
— IF (formula > O.formulaO)For Over Quota only.
= IF (formula < 0.0.68000) OR = IF (formula > 0.68000,0)
For Quota Bonus only.Hito: (toto iho-Help- leuMhli>pc -uip) (umoto- to the amU>utoaa muractoau tor copying (omul*hum one cell toamrthor. IIdoaoonealj, )««i duillluveto type to etdi oi the liamuUtonly unce.
1 1. Use appropriate formulas to calculate commission and total salary amounts for each month, aswell as an average amount for the January-April period for each salcsclcrk.
12. Format all amounts as follows:
Number lab: Category: Currency
Decimal places: 0
Symbol: None
Negative numbers: Black with parentheses
13. To format specific amounts to display with a yen symbol, do the following:a Inan empty cell, holddown the Alt key and enter 0165 from the numeric keypad When you
stop holding the Alt key down, a yen sign will be displayed.
Nuto IIyour UytaunJ itoet m* havea Moonc keypad. u* ihc dull ami NumlA Uy%to activate Vie imboddnl oumertckeypad Owe. follow the iiuciwtton.ia part a. Utothe dult and NwnLkkey.to turn (he foalum <JT
b. Highlight the yen character you have just created, select Edit. Cut. This will paste the yensign to the clipboard. To sec the clipboard, select View. Toolbars. Clipboard
c. Select the average amount for salcsclcrk A and open the Format. Cells dialog boxd. Select the custom category on the number tab. Scroll down toward the bottom of the type list
and highlight the type shown next
Type: ($•#. ##0); ($•#. ##0); ($•'-*); («)
Change the data between the quotation maris in the third grouping from to "0."Paste the yen sign over EACH occurrence of the dollar sign
KM: Highlight (heJ ujpi: prcw "Car end"V."TMt will pmu (he yen ugn hum(heckphoadowr (he$ «gn thto ha. hcon highlightedto (he Type IWU
e Click the OK buttonf. Utilize the custom format, which should now be at the bottom of the type list to print the yen
sign for all January amounts for both clerks and the average amount for salcsclcrk B14. Save your work, and print a copy for your files
NoteIVim ynu tprcadduvt nung Undwepe to unkr to eneuic Out ellcJomn. appnm ininpage.
COLLABORATIVE LEARNING EXERCISE
9-55 Goals, Objectives, and Performance MeasuresThere is increasing pressure on colleges and universities to develop measures of accountability Theobjective is to specify goals and objectives and to develop performance measures to assess the achieve¬ment of those goals and objectives.
Form a group of four to six students to be a consulting team to the accounting depanment at
your college or university (If you arc not using this book as pan of a course in an accounting depan¬ment. select any depanment at your college or university ) Based on your collective knowledge of thedepartment, its mission, and itsactivities, formulate a statement of goals for the department From thatstatement, develop several specific objectives, each of which can be measured Then, develop at leastone measure of performance for each objective.
An optional second step in this exercise is to meet with a faculty member from the department.and ask him or her to critique your objectives and performance measures, lbthe department member.
CHAPTER 9 • MANAGEMENT CONTROL SYSTEMS AND RESPONSIBILITY ACCOUNTING 407
do the objectives make sense? Arc the proposed measures feasible, and will they concctly measureattainment of the objectives? Will they provide proper incentives to the faculty? If the department hascreated objectives and performance measures, compare them to those your group developed
INTERNET EXERCISE
9-56 Management Control System at Procter & GambleSetting up management control systems and determining measurement methods and who should beresponsible for particular revenues, costs, and information can be a large task. The structure of theorganization plays a pan in how well a particular measure is likely to work Ensuring that the goals ofthe organization arc in concert with the management control system is also an important factor It isnot possible to evaluate a company's management control system from an Internet site What we cando. however, is to use a site as an example and apply some of the concepts of the chapter to measuresand tools that would be possibilities for a firm
I. A well-known and well-established company with worldwide acceptance is Procter & Gamble(P&G). Log on to the company's Web site at www.pg.com. Locate the most recent annual reportby following the links under the "Investor/Shareholder Relations" tab to "Financial Reporting."Examine the "Letter to Shareholders" section of the annual report What docs P&G consider to bethe most important factors that drive their growth strategy? How does P&G ensure that managersmeet the company's objectives?
2. The company has numerous products,and the Web site divides them intodifferent categories andbrands to help customers find relevant product information. Click on "Brands and Innovation."What arc the major categories of brands listed on the Web site? Dick on the "Household Care"category What are some of the brands in this category that you arc familiar with? How could asystem be set up to help measure the success of the firm's goal to build brands in the "HouseholdCare" category? What would be three possible financial measures? What about three nonfinancialmeasures?