Embed Size (px)
Citation preview
VCAT Ref No: P2429/2014 – Expert witness Dr Dean Judd
Page 25
9 ANALYSE RISKS
The risks at Seymour Quarry have been analysed by:
1. Assessing the likelihood of a pit capture event that impacts on the assets around
Seymour Quarry (Section 9.1);
2. Assessing the consequences for the assets (Section 9.2); and
3. Combining the likelihood and consequences of events to determine the level of risk
(Section 9.3).
9.1 Likelihood
The likelihood that Seymour Quarry will impact on floodplain and river stability is informed by:
1. The behaviour of natural river systems (Section 9.1.1);
2. The local and international case studies of quarries (Section 9.1.2);
3. Interventions to manage the impact of quarries on rivers and infrastructure
(Section 9.1.3);
4. The additional adverse factors influencing the likelihood of pit capture at Seymour
Quarry (Section 9.1.4);
5. The recent history of floodplain mining and floods on the Goulburn River (Section 9.1.5);
and
6. Assessment of the likelihood of pit capture due to floodplain flow through Seymour
Quarry (Section 9.1.6).
9.1.1 The behaviour of natural river systems
Rivers such as the Goulburn scour new channels and change course via avulsions (Erskine et al.,
1993a). Through hydraulic and sediment transport analysis, Judd et al. (2004) and Judd (2005)
found that floodwaters flowing through natural floodplain depressions such as palaeochannels
can initiate the scour of a new channel. Wende and Nanson (1998) and Tooth and Nanson
(1999) also established that natural depressions on the floodplain are associated with the
initiation of avulsions. This is also consistent with the conclusions of a number of authors that
avulsions involve the reoccupation of palaeochannels (Field, 2001; Goswami et al., 1999; Jain
and Sinha, 2004; McCarthy et al., 1992; Mohrig et al., 2000; Morozova and Smith, 2000; Smith et
al., 1998).
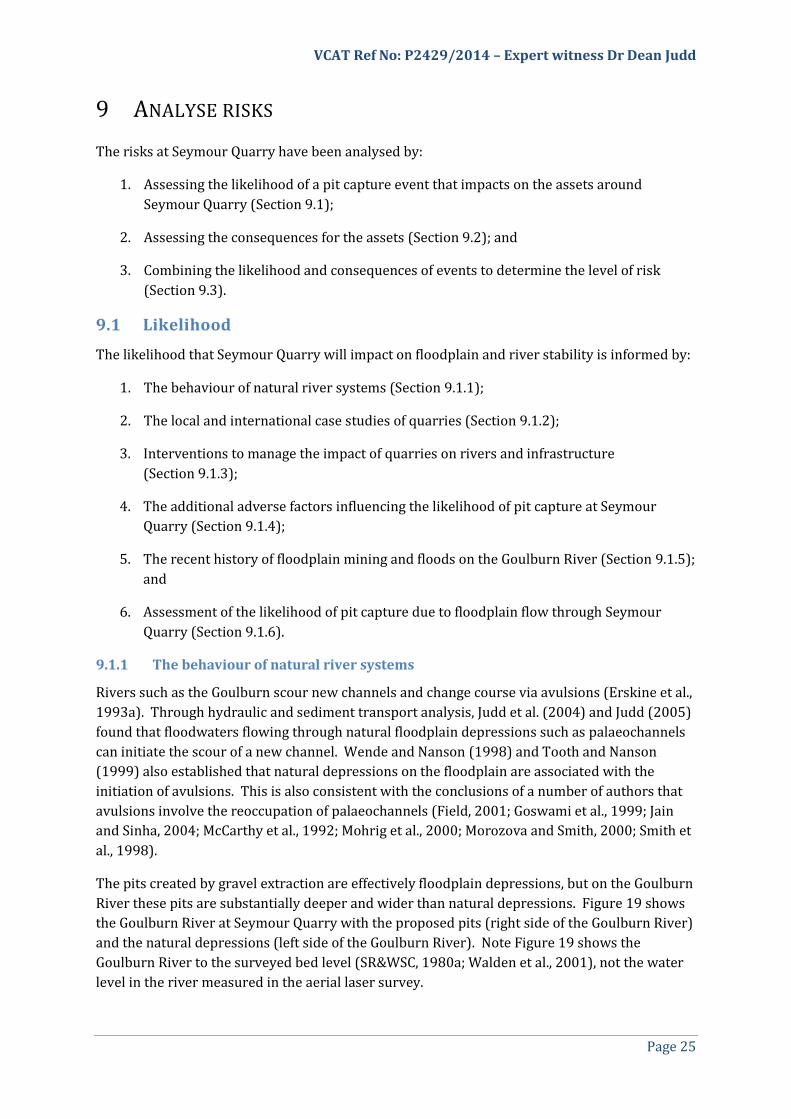
The pits created by gravel extraction are effectively floodplain depressions, but on the Goulburn
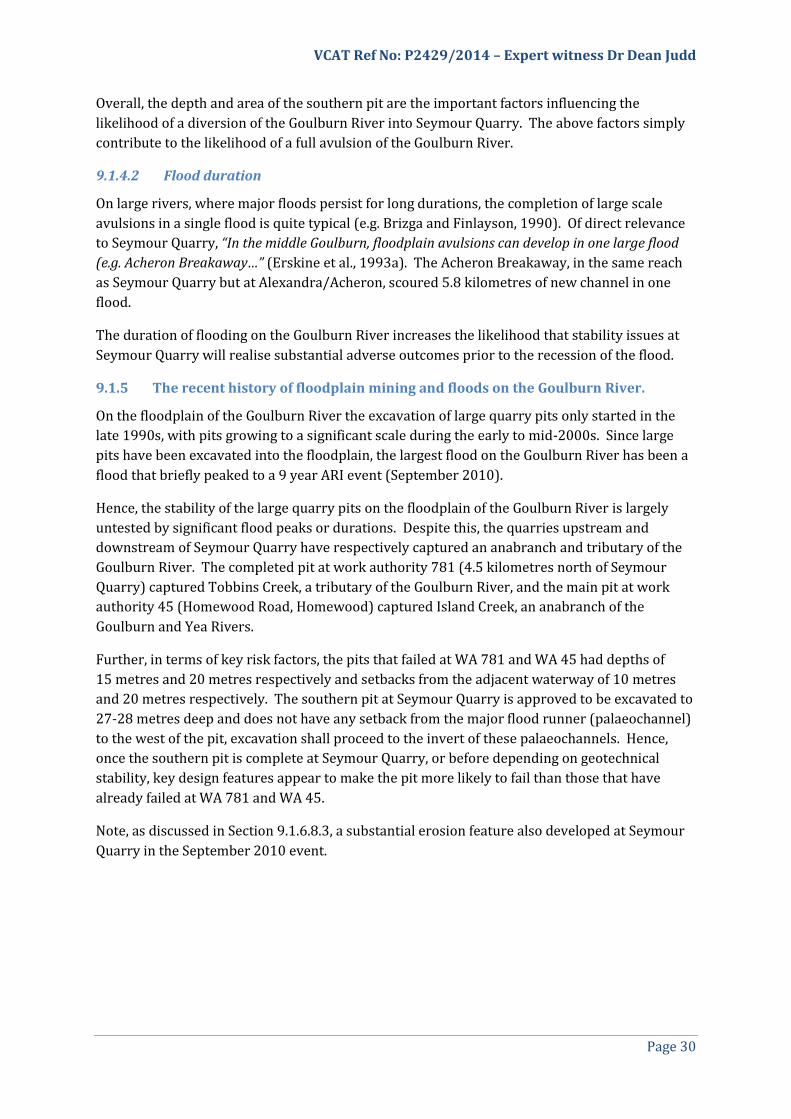
River these pits are substantially deeper and wider than natural depressions. Figure 19 shows
the Goulburn River at Seymour Quarry with the proposed pits (right side of the Goulburn River)
and the natural depressions (left side of the Goulburn River). Note Figure 19 shows the
Goulburn River to the surveyed bed level (SR&WSC, 1980a; Walden et al., 2001), not the water
level in the river measured in the aerial laser survey.
VCAT Ref No: P2429/2014 – Expert witness Dr Dean Judd
Page 26
Judd (2005) found that the peak shear stress, and hence erosion rate, increases at the upstream
end of natural depressions when these features are deeper, straighter and longer. Hence, the pit
excavated at Seymour Quarry, and those proposed, increase the risk of an avulsion, diversion or
cut-off of the Goulburn River. Further, as the proposed changes to the southern pit will
straighten the flow path for floodwater through the pit and increase the average width and
depth along this flow path, the proposed changes to the southern pit have the potential to
increase the likelihood of an avulsion, diversion or cut-off of the Goulburn River.
As the key attributes of the floodplain depressions investigated by Judd (2005) are substantially
different to those proposed at Seymour Quarry (Figure 19), the author has investigated
hydraulic conditions at Seymour Quarry (Section 9.1.6).
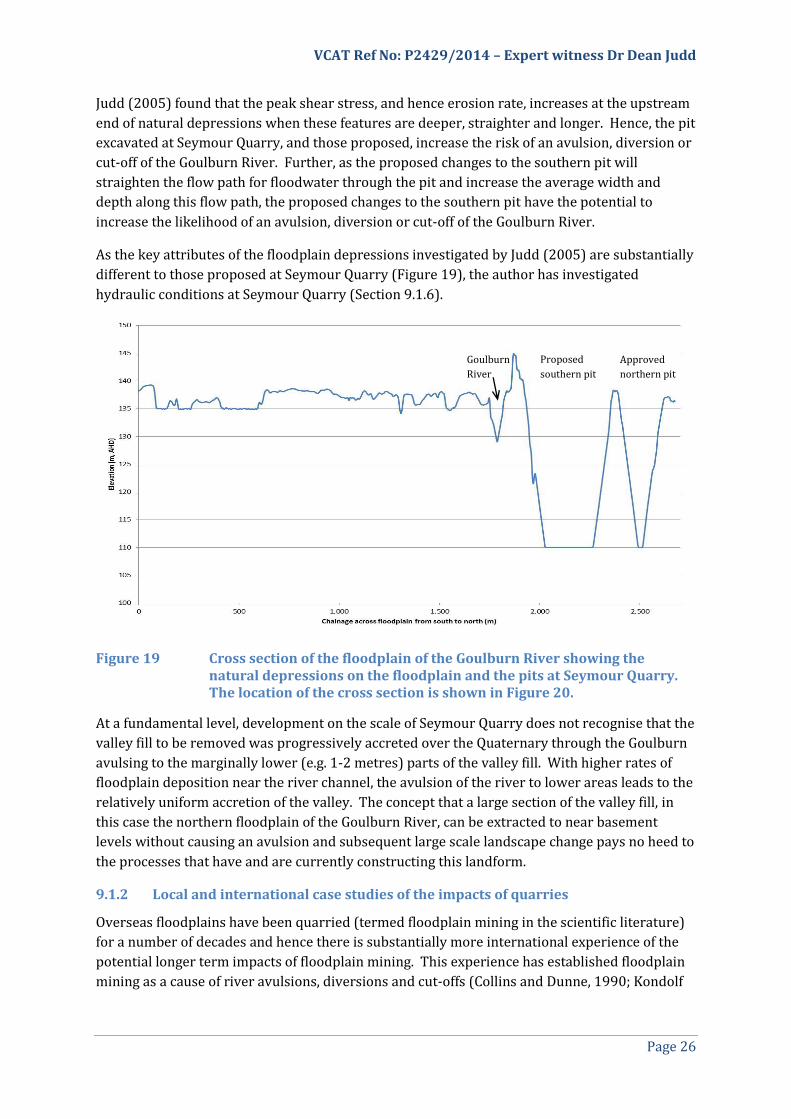
Figure 19 Cross section of the floodplain of the Goulburn River showing the natural depressions on the floodplain and the pits at Seymour Quarry. The location of the cross section is shown in Figure 20.
At a fundamental level, development on the scale of Seymour Quarry does not recognise that the
valley fill to be removed was progressively accreted over the Quaternary through the Goulburn
avulsing to the marginally lower (e.g. 1-2 metres) parts of the valley fill. With higher rates of
floodplain deposition near the river channel, the avulsion of the river to lower areas leads to the
relatively uniform accretion of the valley. The concept that a large section of the valley fill, in
this case the northern floodplain of the Goulburn River, can be extracted to near basement
levels without causing an avulsion and subsequent large scale landscape change pays no heed to
the processes that have and are currently constructing this landform.
9.1.2 Local and international case studies of the impacts of quarries
Overseas floodplains have been quarried (termed floodplain mining in the scientific literature)
for a number of decades and hence there is substantially more international experience of the
potential longer term impacts of floodplain mining. This experience has established floodplain
mining as a cause of river avulsions, diversions and cut-offs (Collins and Dunne, 1990; Kondolf
Goulburn
River
Proposed
southern pit
Approved
northern pit
VCAT Ref No: P2429/2014 – Expert witness Dr Dean Judd
Page 27
et al., 2002; Langer, 2002). As an example, a study of 25 recently completed floodplain mining
sites in northern Alaska found that 12 of them had captured the river (Woodward-Clyde, 1980).
Mapping 56 floodplain pits on the Tangipahoa River in 1980, Mossa and Marks (2011) found
that 6 of these pits had been captured by 2004 (11% in 24 years).
Figure 20 The location of the cross section shown in Figure 19.
Reflecting the risks associated with floodplain mining, Kondolf (1997, p. 545) states “In many
cases, floodplain pits have captured the channel during floods…” Similarly, Mossa and McLean
(1997, p. 43) found “…statistically robust, moderate correlations between the degree of floodplain
mining and change in channel position”. Overall, the following conclusions highlight that
floodplain mining is likely to capture the river:
“In general, pit capture is inevitable for floodplain pits…” (Kondolf et al., 2002, p. 62); and
“In the long term, stream capture by gravel pits is a near certainty” (Norman et al., 1998).
Kondolf (1994, p. 227) found that “Because floodplain pits can become part of the active channel,
they should be considered as being potentially instream when viewed on a timescale of decades”.
Further, Mossa and Marks (2011, p. 2) state “Floodplain mining is far less regulated that [sic] in-
stream mining, even though the geomorphic changes are generally more dramatic, as stream

VCAT Ref No: P2429/2014 – Expert witness Dr Dean Judd
Page 28
capture of floodplain pits generates channel-position shifts in addition to the perimeter and profile
changes associated with in-stream mining”. Thus although “the damage from incision has led to
the prohibition of instream mining in many countries, including Switzerland, Germany, France and
England” (Kondolf, 1998, p. 118) and limitations placed on instream mining on the Goulburn
River (Erskine et al., 1996, 1993a), in many jurisdictions the potentially larger impacts of
floodplain mining are overlooked.
In Australia, floodplain mining has caused pit capture and avulsions, including the Fish River in
Bathurst (Erskine, 1990), the Nepean River (Erskine, 1990), the Georges River in Sydney
(Warner et al., 1977) and on the floodplain of the Goulburn River (Ladson and Judd, 2014).
In their review of the impacts of floodplain mining Norman et al. (1998) describe pit depths as
averaging about 30 feet (9.1 metres) with several as deep as 90 feet (27.4 metres). Similarly
Mossa and Marks (2011) describe pits as 10-15 metres deep. That is, Seymour Quarry is at the
upper end of pit depths recorded in the literature. Further, the literature does not, to the
author’s knowledge, contain pits as close to public infrastructure as the pits at Seymour Quarry.
Hence, important aspects of Seymour Quarry that influence risk are outliers (represent a
greater risk) relative to the case studies. Therefore the empirical evidence in the case studies
may understate the risks at Seymour Quarry.
9.1.3 Interventions to manage the impact of quarries on rivers and infrastructure
The management interventions proposed in case-studies and standards for mining floodplains
are instructive for:
1. understanding the likelihood of an avulsion at Seymour Quarry; and
2. understanding the adequacy or otherwise of the Rehabilitation Plan for Seymour
Quarry.
The management interventions proposed in case-studies and standards for mining floodplains
include:
“Wherever possible, large gravel mines should be located in uplands away from the river
valley floors. A poor second choice is to locate mining on terraces and the inactive
floodplain, that is, above the 100-year flood plain” (Norman et al., 1998, pp. 17–18).
Other authors also advocate pits on terraces and higher floodplain surfaces above the
100-year ARI flood (Langer, 2002; Mossa and Marks, 2011; Packer et al., 2005;
Woodward-Clyde, 1980). Seymour Quarry is not above the 100-year floodplain, a 6 year
ARI flood begins to inundate the quarry (Walden et al., 2001).
The literature highlights that the risks of an avulsion are high when the basement of the
quarry pit is below the thalweg (invert) of surrounding waterways (Kondolf, 1997;
Langer, 2002; Norman et al., 1998; Packer et al., 2005). Hence, guidelines have been
developed to limit the depth of pits, for example, “The maximum depth of floodplain
extraction should remain above the channel thalweg” (Department of Irrigation and
Drainage, 2009, p. 6). The cross-sections of the Goulburn River (SR&WSC, 1980a)
indicate that Seymour Quarry would need to have a maximum depth of approximately
7 metres to ensure the basement of the pit is above the thalweg of the Goulburn River.
VCAT Ref No: P2429/2014 – Expert witness Dr Dean Judd
Page 29
The variation to the work plan (and the existing plan) shall create a pit with a maximum
depth of 28 metres, four times the depth recommended in the literature.
Guidelines from Arizona require that if mines within the floodplain are excavated below
the channel invert then engineered grade control structures should be provided where
the 100-year flood could enter the excavation, or engineered structures shall prevent
the 100-year flood from entering the excavation (JE Fuller/Hydrology and
Geomorphology Inc., 2004). The Rehabilitation Plan for Seymour Quarry contains no
such structures.
The NOAA Guidelines require pit excavations to be outside the channel migration zone
and to not extend below the water table (Packer et al., 2005). Seymour Quarry does not
meet either of these requirements.
The Malaysian Guidelines set a minimum distance between quarries and infrastructure
“Sand and gravel shall not be extracted within 1,000 metres from any crucial hydraulic
structure such as pumping stations, water intakes, bridges, buildings and such structures”
(Department of Irrigation and Drainage, 2009). The southern pit of the approved and
proposed Seymour Quarry shall be 80 metres from the north bound embankment and
90 metres from the nearest north bound bridge on the Melbourne-Sydney rail corridor
and still closer to major telecommunications infrastructure.
9.1.4 Factors increasing the likelihood of an avulsion at Seymour Quarry
In addition to issues such as the depth of the quarry pits, the likelihood of channel change at
Seymour Quarry is increased by the site specific factors:
the local morphology of the Goulburn Valley (Section 9.1.4.1); and
the duration of flooding on the Goulburn River (Section 9.1.4.2).
9.1.4.1 Local morphology of the Goulburn Valley
An avulsion is more likely to scour if it is on a shorter (less sinuous) course than the parent
channel (Erskine et al., 1993b; Jones and Schumm, 1999; Kondolf, 1998; Schumm, 1977;
Schumm et al., 1996). At Seymour Quarry an avulsion through the main pit offers alternate
courses for the Goulburn River that are as little as 50% of the length of the current river course.
Further, there is already a substantial channel (Deep Creek) that flows north from Seymour
Quarry into the township of Seymour (Figure 2) and is largely aligned with the shortest avulsion
course through Seymour Quarry.
Additionally, Erskine (2015, p. 6) notes “The author concluded in his Field Notes No. 27, p. 1 on 22
July 1994 that the Goulburn River at Seymour gauging station (G405202)(relevant to WA1189)
has a control of a compound bedrock bar that dips steeply downstream and strikes across the
channel at nearly 90°. From field indicators, the author suspected that the channel was perched or
hung up on a bedrock high on one side of the valley trough and the depth to bedrock may have
deepened across the floodplain. If correct this would increase the risk of an avulsion...”
VCAT Ref No: P2429/2014 – Expert witness Dr Dean Judd
Page 30
Overall, the depth and area of the southern pit are the important factors influencing the
likelihood of a diversion of the Goulburn River into Seymour Quarry. The above factors simply
contribute to the likelihood of a full avulsion of the Goulburn River.
9.1.4.2 Flood duration
On large rivers, where major floods persist for long durations, the completion of large scale
avulsions in a single flood is quite typical (e.g. Brizga and Finlayson, 1990). Of direct relevance
to Seymour Quarry, “In the middle Goulburn, floodplain avulsions can develop in one large flood
(e.g. Acheron Breakaway…” (Erskine et al., 1993a). The Acheron Breakaway, in the same reach
as Seymour Quarry but at Alexandra/Acheron, scoured 5.8 kilometres of new channel in one
flood.
The duration of flooding on the Goulburn River increases the likelihood that stability issues at
Seymour Quarry will realise substantial adverse outcomes prior to the recession of the flood.
9.1.5 The recent history of floodplain mining and floods on the Goulburn River.
On the floodplain of the Goulburn River the excavation of large quarry pits only started in the
late 1990s, with pits growing to a significant scale during the early to mid-2000s. Since large
pits have been excavated into the floodplain, the largest flood on the Goulburn River has been a
flood that briefly peaked to a 9 year ARI event (September 2010).
Hence, the stability of the large quarry pits on the floodplain of the Goulburn River is largely
untested by significant flood peaks or durations. Despite this, the quarries upstream and
downstream of Seymour Quarry have respectively captured an anabranch and tributary of the
Goulburn River. The completed pit at work authority 781 (4.5 kilometres north of Seymour
Quarry) captured Tobbins Creek, a tributary of the Goulburn River, and the main pit at work
authority 45 (Homewood Road, Homewood) captured Island Creek, an anabranch of the
Goulburn and Yea Rivers.
Further, in terms of key risk factors, the pits that failed at WA 781 and WA 45 had depths of
15 metres and 20 metres respectively and setbacks from the adjacent waterway of 10 metres
and 20 metres respectively. The southern pit at Seymour Quarry is approved to be excavated to
27-28 metres deep and does not have any setback from the major flood runner (palaeochannel)
to the west of the pit, excavation shall proceed to the invert of these palaeochannels. Hence,
once the southern pit is complete at Seymour Quarry, or before depending on geotechnical
stability, key design features appear to make the pit more likely to fail than those that have
already failed at WA 781 and WA 45.
Note, as discussed in Section 9.1.6.8.3, a substantial erosion feature also developed at Seymour
Quarry in the September 2010 event.
VCAT Ref No: P2429/2014 – Expert witness Dr Dean Judd
Page 31
9.1.6 Assessment of the likelihood of pit capture due to floodplain flow.
To inform the likelihood of failure at Seymour Quarry due to floodplain flow through the pit, the
hydraulics of flood flows was investigated.
9.1.6.1 Hydraulic model used
The hydraulic modelling was undertaken using the two dimensional hydrodynamic model
TUFLOW with dynamic linkages to the one dimensional model ESTRY. The CPU version of the
November 2014 release of TUFLOW was used (Build 2013-12-AD). As of June 2015 this was the
latest release of TUFLOW. The CPU version of TUFLOW was used (instead of the GPU version)
for its greater accuracy and the ability to model bridge and culvert structures. The CPU model
was run at a 5 metre grid size.
ESTRY was used to model relatively narrow hydraulic structures (culverts). Wider hydraulic
structures, such as the bridges on the Melbourne-Sydney rail corridor and along Emily Street,
were represented as 2D layered flow constrictions directly in TUFLOW. Refer Appendix A for
more details.
9.1.6.2 Hydraulic model boundaries
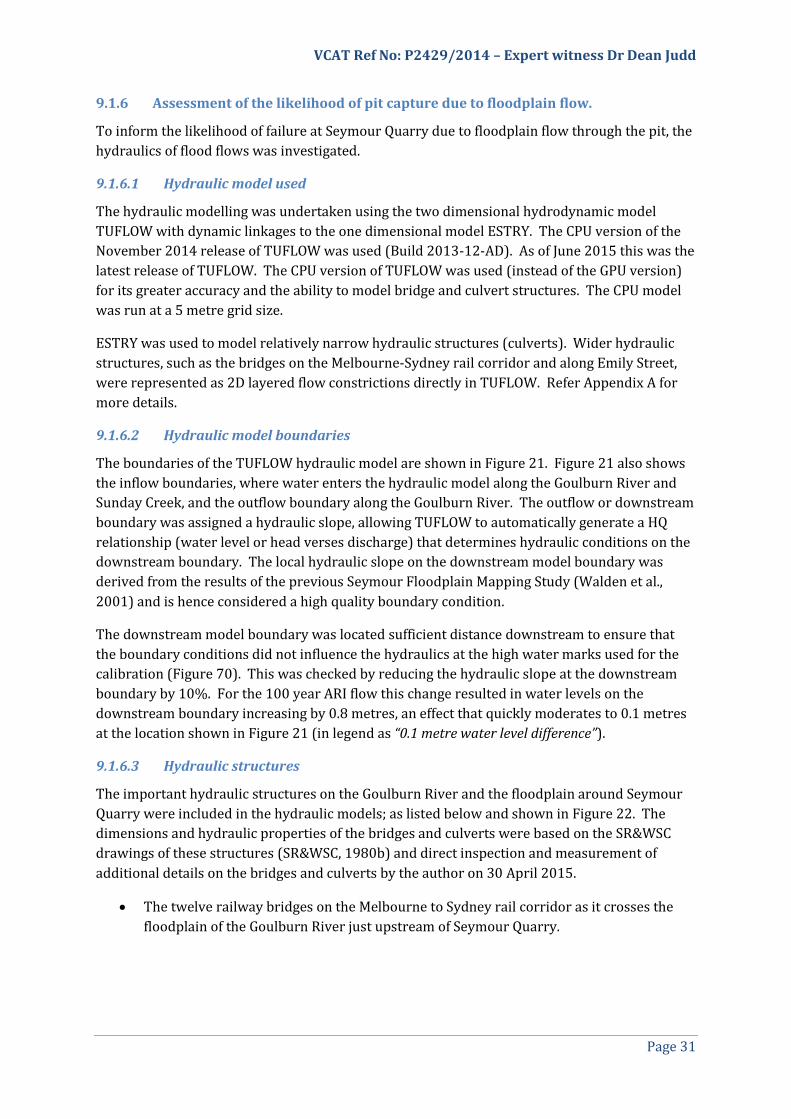
The boundaries of the TUFLOW hydraulic model are shown in Figure 21. Figure 21 also shows
the inflow boundaries, where water enters the hydraulic model along the Goulburn River and
Sunday Creek, and the outflow boundary along the Goulburn River. The outflow or downstream
boundary was assigned a hydraulic slope, allowing TUFLOW to automatically generate a HQ
relationship (water level or head verses discharge) that determines hydraulic conditions on the
downstream boundary. The local hydraulic slope on the downstream model boundary was
derived from the results of the previous Seymour Floodplain Mapping Study (Walden et al.,
2001) and is hence considered a high quality boundary condition.
The downstream model boundary was located sufficient distance downstream to ensure that
the boundary conditions did not influence the hydraulics at the high water marks used for the
calibration (Figure 70). This was checked by reducing the hydraulic slope at the downstream
boundary by 10%. For the 100 year ARI flow this change resulted in water levels on the
downstream boundary increasing by 0.8 metres, an effect that quickly moderates to 0.1 metres
at the location shown in Figure 21 (in legend as “0.1 metre water level difference”).
9.1.6.3 Hydraulic structures
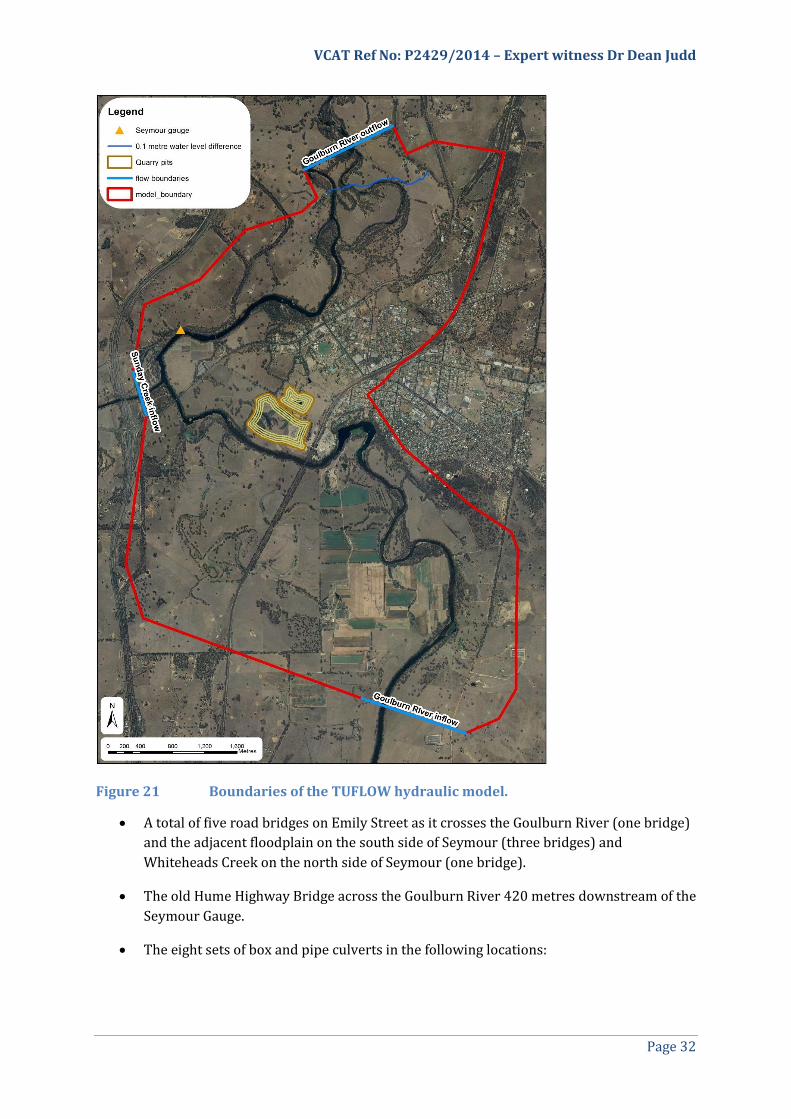
The important hydraulic structures on the Goulburn River and the floodplain around Seymour
Quarry were included in the hydraulic models; as listed below and shown in Figure 22. The
dimensions and hydraulic properties of the bridges and culverts were based on the SR&WSC
drawings of these structures (SR&WSC, 1980b) and direct inspection and measurement of
additional details on the bridges and culverts by the author on 30 April 2015.
The twelve railway bridges on the Melbourne to Sydney rail corridor as it crosses the
floodplain of the Goulburn River just upstream of Seymour Quarry.
VCAT Ref No: P2429/2014 – Expert witness Dr Dean Judd
Page 32
Figure 21 Boundaries of the TUFLOW hydraulic model.
A total of five road bridges on Emily Street as it crosses the Goulburn River (one bridge)
and the adjacent floodplain on the south side of Seymour (three bridges) and
Whiteheads Creek on the north side of Seymour (one bridge).
The old Hume Highway Bridge across the Goulburn River 420 metres downstream of the
Seymour Gauge.
The eight sets of box and pipe culverts in the following locations:
VCAT Ref No: P2429/2014 – Expert witness Dr Dean Judd
Page 33
o A total of three sets of culverts on Deep Creek at Seymour Quarry, Edward Street
and Emily Street;
o Two sets of culverts on Emily Street either side of Tierney Street;
o A pipe culvert at 5 Tierney Street;
o Culverts on the constructed floodway under the Goulburn Valley Highway, north
of Whiteheads Creek;
o Culverts under the Goulburn Valley Highway immediately north of the
constructed floodway.
Figure 22 Hydraulic structures in the TUFLOW and ESTRY models.
VCAT Ref No: P2429/2014 – Expert witness Dr Dean Judd
Page 34
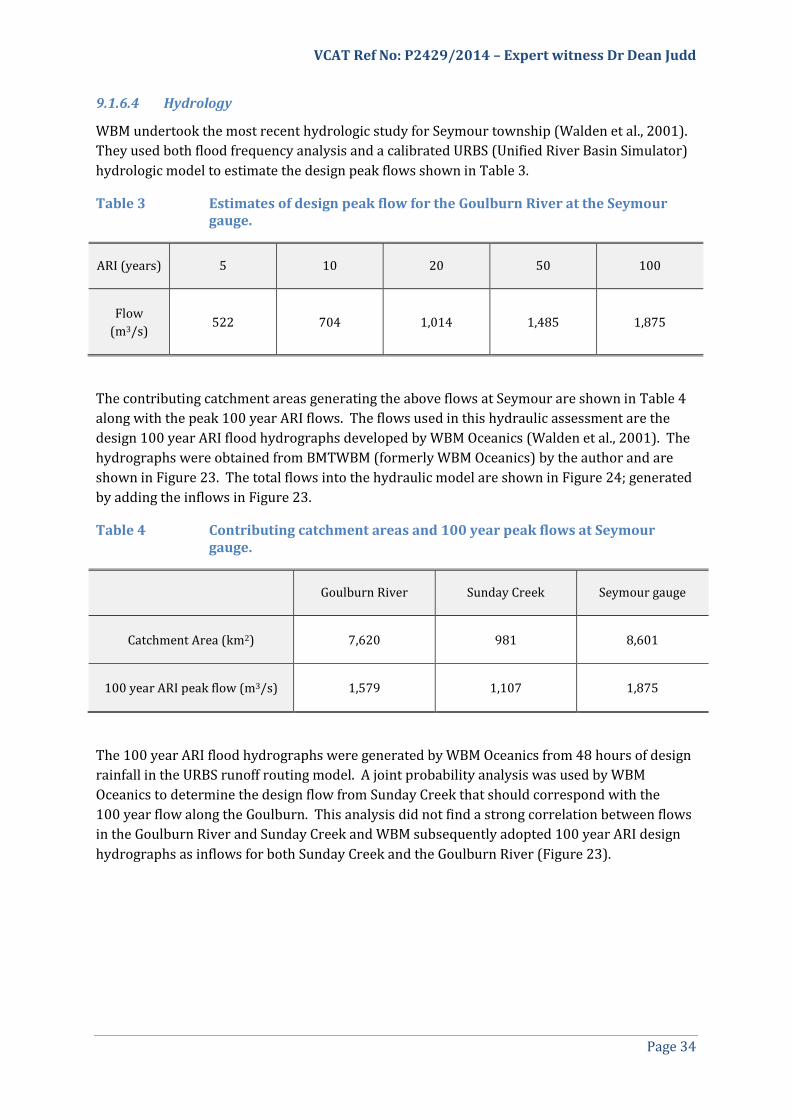
9.1.6.4 Hydrology
WBM undertook the most recent hydrologic study for Seymour township (Walden et al., 2001).
They used both flood frequency analysis and a calibrated URBS (Unified River Basin Simulator)
hydrologic model to estimate the design peak flows shown in Table 3.
Table 3 Estimates of design peak flow for the Goulburn River at the Seymour gauge.
ARI (years) 5 10 20 50 100
Flow
(m3/s) 522 704 1,014 1,485 1,875
The contributing catchment areas generating the above flows at Seymour are shown in Table 4
along with the peak 100 year ARI flows. The flows used in this hydraulic assessment are the
design 100 year ARI flood hydrographs developed by WBM Oceanics (Walden et al., 2001). The
hydrographs were obtained from BMTWBM (formerly WBM Oceanics) by the author and are
shown in Figure 23. The total flows into the hydraulic model are shown in Figure 24; generated
by adding the inflows in Figure 23.
Table 4 Contributing catchment areas and 100 year peak flows at Seymour gauge.
Goulburn River Sunday Creek Seymour gauge
Catchment Area (km2) 7,620 981 8,601
100 year ARI peak flow (m3/s) 1,579 1,107 1,875
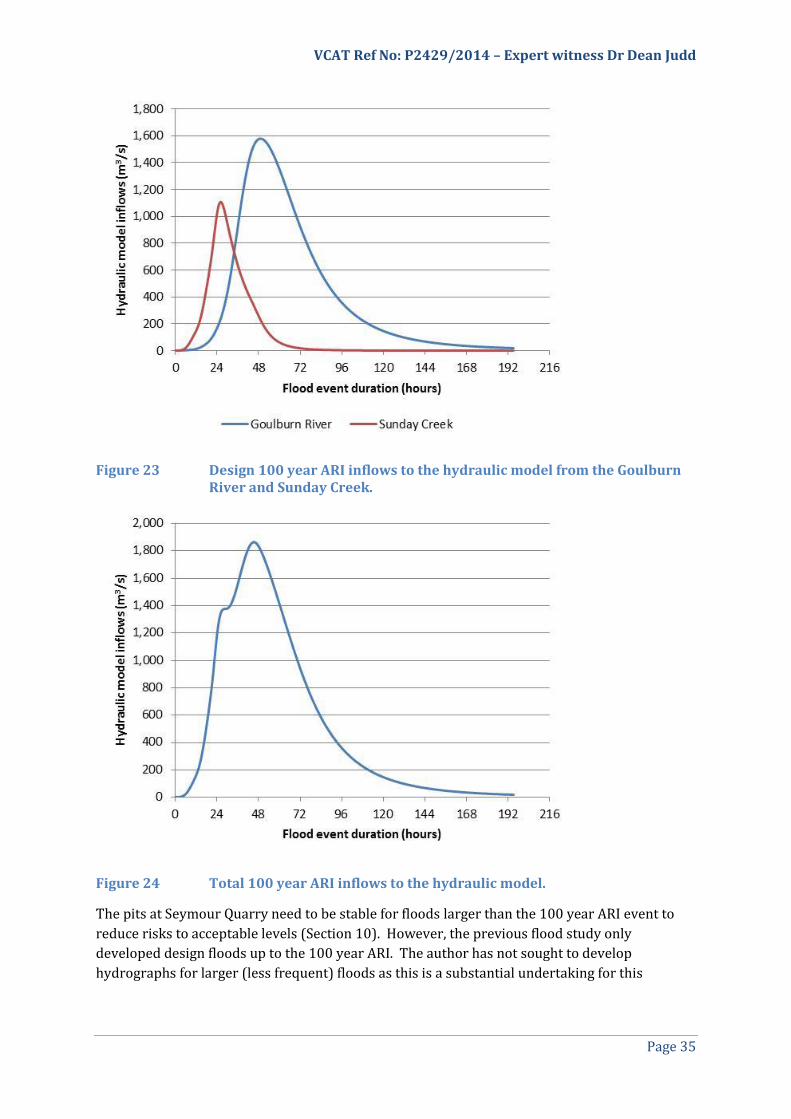
The 100 year ARI flood hydrographs were generated by WBM Oceanics from 48 hours of design
rainfall in the URBS runoff routing model. A joint probability analysis was used by WBM
Oceanics to determine the design flow from Sunday Creek that should correspond with the
100 year flow along the Goulburn. This analysis did not find a strong correlation between flows
in the Goulburn River and Sunday Creek and WBM subsequently adopted 100 year ARI design
hydrographs as inflows for both Sunday Creek and the Goulburn River (Figure 23).
VCAT Ref No: P2429/2014 – Expert witness Dr Dean Judd
Page 35
Figure 23 Design 100 year ARI inflows to the hydraulic model from the Goulburn River and Sunday Creek.
Figure 24 Total 100 year ARI inflows to the hydraulic model.
The pits at Seymour Quarry need to be stable for floods larger than the 100 year ARI event to
reduce risks to acceptable levels (Section 10). However, the previous flood study only
developed design floods up to the 100 year ARI. The author has not sought to develop
hydrographs for larger (less frequent) floods as this is a substantial undertaking for this
VCAT Ref No: P2429/2014 – Expert witness Dr Dean Judd
Page 36
catchment. Notwithstanding this limitation the author considers that the 100 year ARI flood
informs the consideration of the expansion of Seymour Quarry.
9.1.6.5 Hydraulic model runs
The TUFLOW hydraulic model was run with two floodplain topographies and two pit
geometries, the approved and proposed quarries. For clarity, throughout the report these
scenarios are referred to as:
Scenario 1: operating quarry
Scenario 2: rehabilitated quarry
The modifications to the hydraulic model that were included in these scenarios, in addition to
the approved and proposed pits, are:
Scenario 1: operating quarry
a. The floodplain topography in the November 2013 aerial laser survey.
b. Dewatering of the quarry pits.
Scenario 2: rehabilitated quarry
a. A floodplain topography that is in accordance with the Rehabilitation Plan.
b. Seymour levee constructed.
c. No dewatering of the quarry pits.
The topography of these pits was cut into the TUFLOW model by the Z Shape polygons, lines and
points in TUFLOW. The resulting pit topography is shown in Figure 8 and Figure 9.
Combinations of the floodplain and pit geometries resulted in four model runs, all using the
model setup explained in Section 9.1.6 and Appendix A.
9.1.6.6 Scenario 1: operating quarry (both approved and proposed)
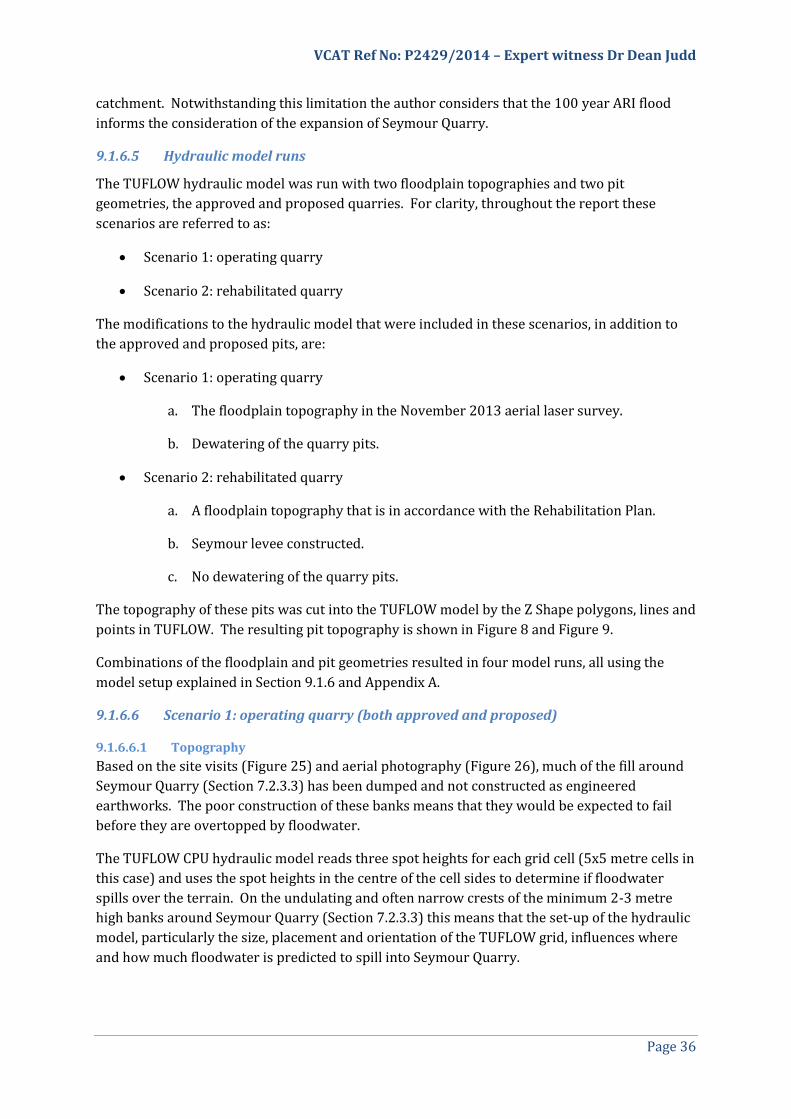
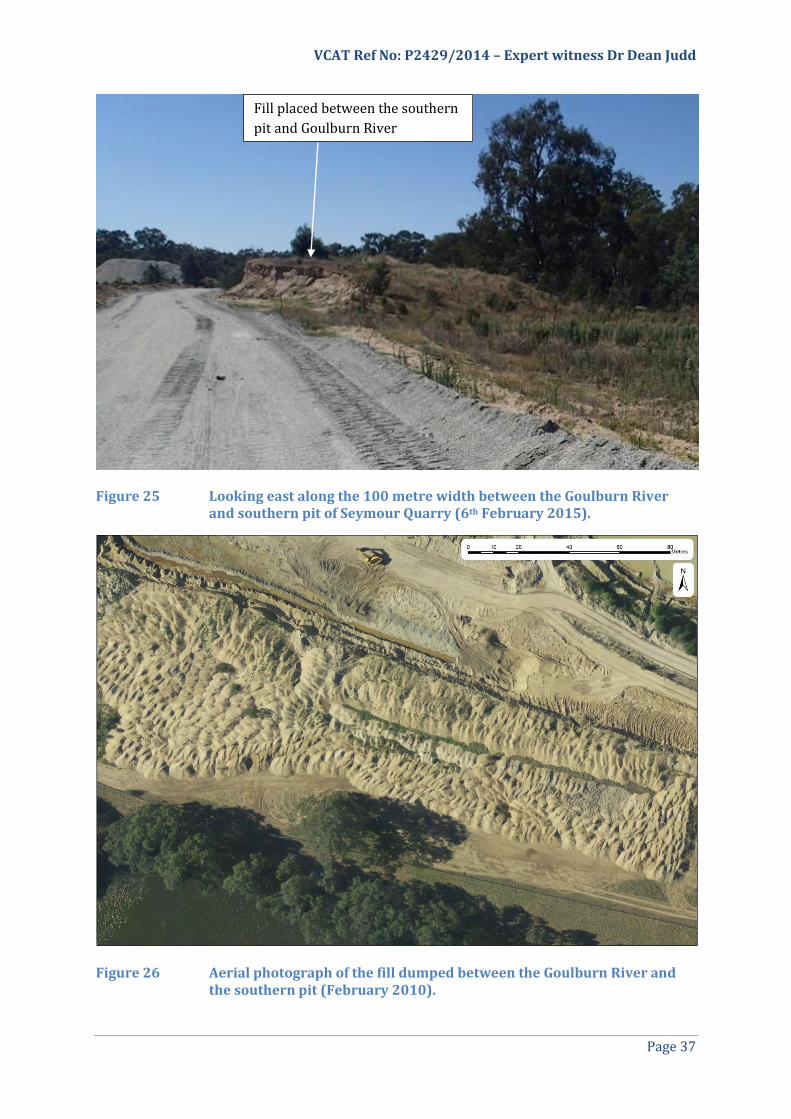
9.1.6.6.1 Topography
Based on the site visits (Figure 25) and aerial photography (Figure 26), much of the fill around
Seymour Quarry (Section 7.2.3.3) has been dumped and not constructed as engineered
earthworks. The poor construction of these banks means that they would be expected to fail
before they are overtopped by floodwater.
The TUFLOW CPU hydraulic model reads three spot heights for each grid cell (5x5 metre cells in
this case) and uses the spot heights in the centre of the cell sides to determine if floodwater
spills over the terrain. On the undulating and often narrow crests of the minimum 2-3 metre
high banks around Seymour Quarry (Section 7.2.3.3) this means that the set-up of the hydraulic
model, particularly the size, placement and orientation of the TUFLOW grid, influences where
and how much floodwater is predicted to spill into Seymour Quarry.
VCAT Ref No: P2429/2014 – Expert witness Dr Dean Judd
Page 37
Figure 25 Looking east along the 100 metre width between the Goulburn River and southern pit of Seymour Quarry (6th February 2015).
Figure 26 Aerial photograph of the fill dumped between the Goulburn River and the southern pit (February 2010).
Fill placed between the southern
pit and Goulburn River
VCAT Ref No: P2429/2014 – Expert witness Dr Dean Judd
Page 38
This issue can be addressed by defining break lines in the terrain. However, the author did not
improve the definition of the bank crests in TUFLOW with break lines as this would
misrepresent the high degree of uncertainty regarding the behaviour of these features under
flood conditions. For this scenario TUFLOW was simply allowed to read spot heights from the
November 2013 aerial laser survey.
In the event of overtopping, the irregular crest of the banks of fill would concentrate the spill of
floodwater and, along with its poor construction (Figure 25), will facilitate rapid failure.
TUFLOW does not evaluate whether the terrain will be stable under the prevailing hydraulic
conditions. The terrain is “hardwired” into TUFLOW for the duration of the model run unless
the operator uses variable Z shapes to prescribe which areas will erode when and by how much.
Whilst this option could be used to model what will happen when the banks around Seymour
Quarry fail, the scenarios are not predicted by the model but constructed by the hydraulic
engineer and in large part simply reflect the assumptions made.
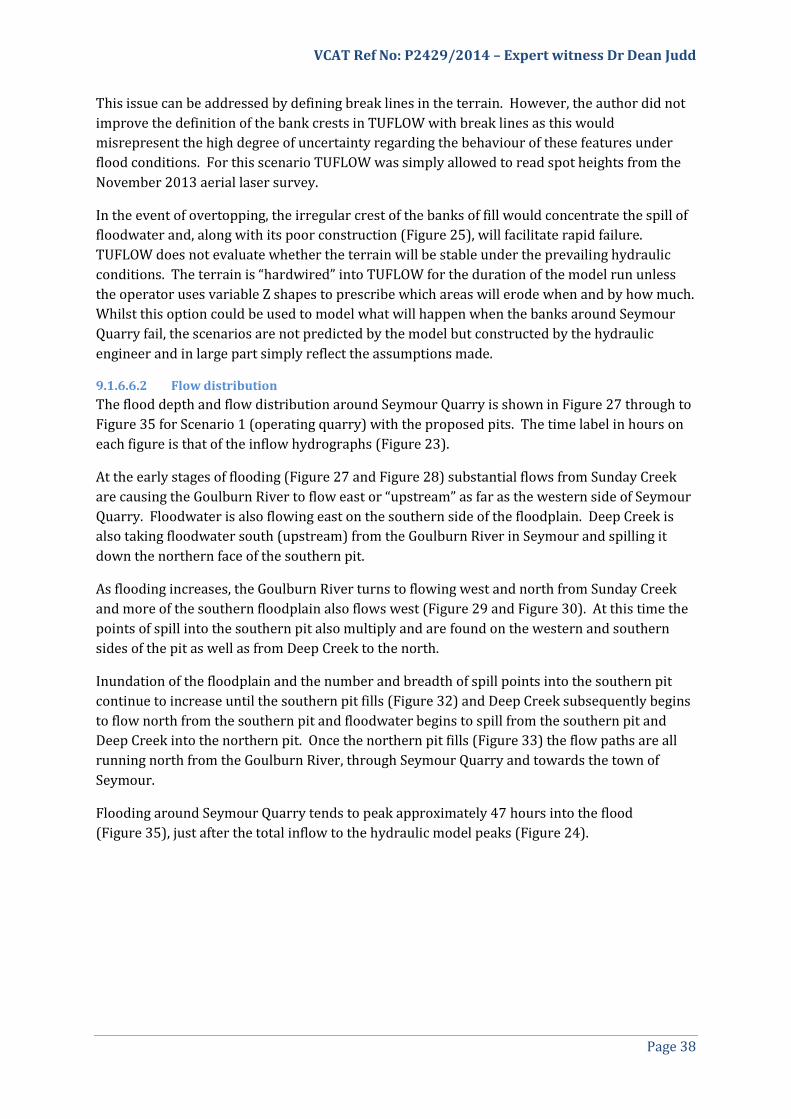
9.1.6.6.2 Flow distribution
The flood depth and flow distribution around Seymour Quarry is shown in Figure 27 through to
Figure 35 for Scenario 1 (operating quarry) with the proposed pits. The time label in hours on
each figure is that of the inflow hydrographs (Figure 23).
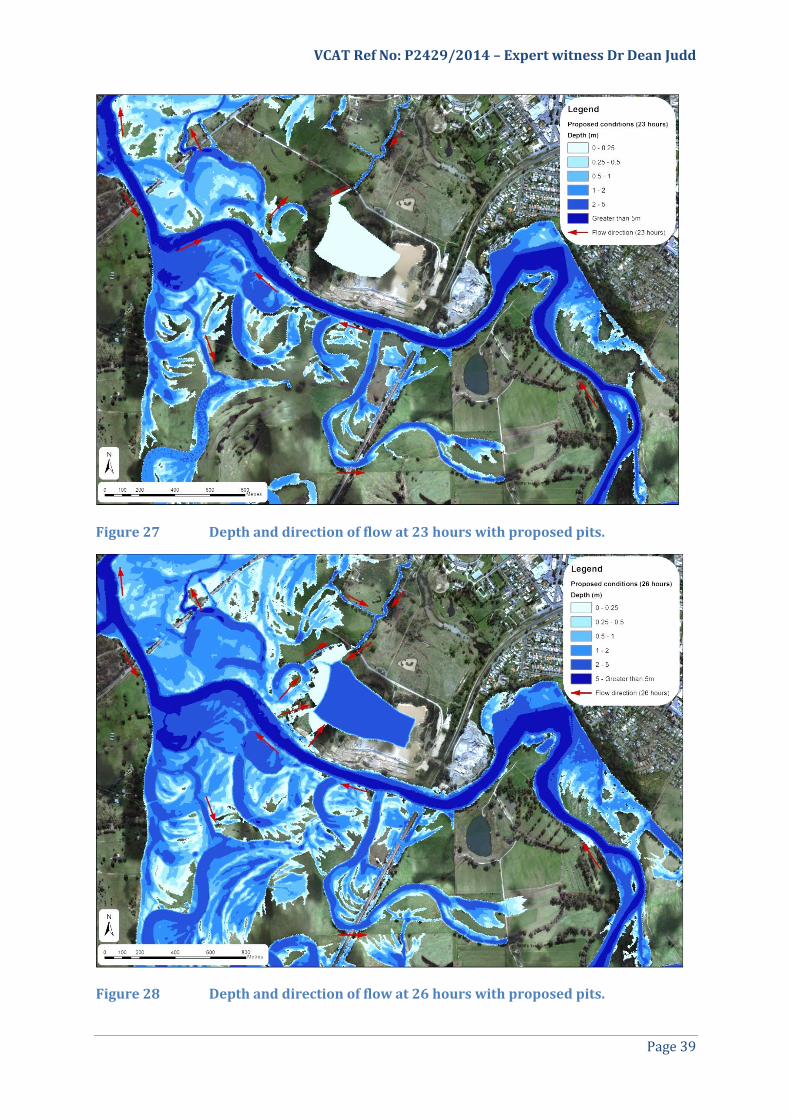
At the early stages of flooding (Figure 27 and Figure 28) substantial flows from Sunday Creek
are causing the Goulburn River to flow east or “upstream” as far as the western side of Seymour
Quarry. Floodwater is also flowing east on the southern side of the floodplain. Deep Creek is
also taking floodwater south (upstream) from the Goulburn River in Seymour and spilling it
down the northern face of the southern pit.
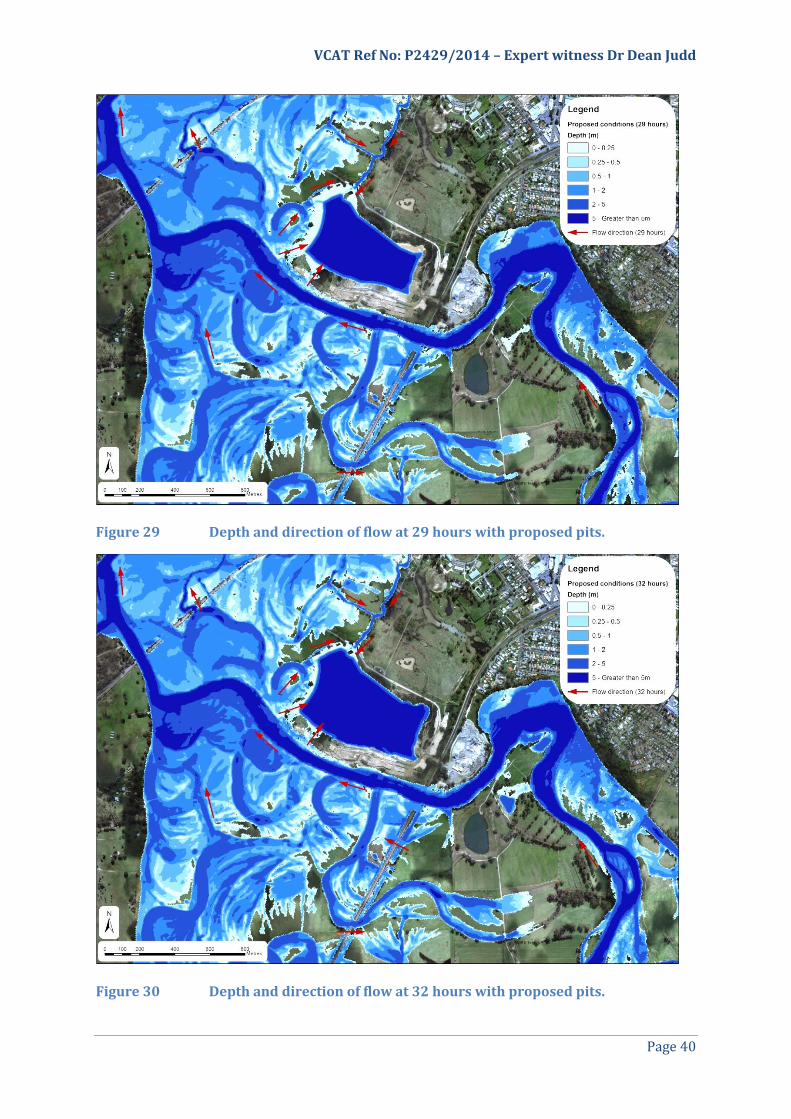
As flooding increases, the Goulburn River turns to flowing west and north from Sunday Creek
and more of the southern floodplain also flows west (Figure 29 and Figure 30). At this time the
points of spill into the southern pit also multiply and are found on the western and southern
sides of the pit as well as from Deep Creek to the north.
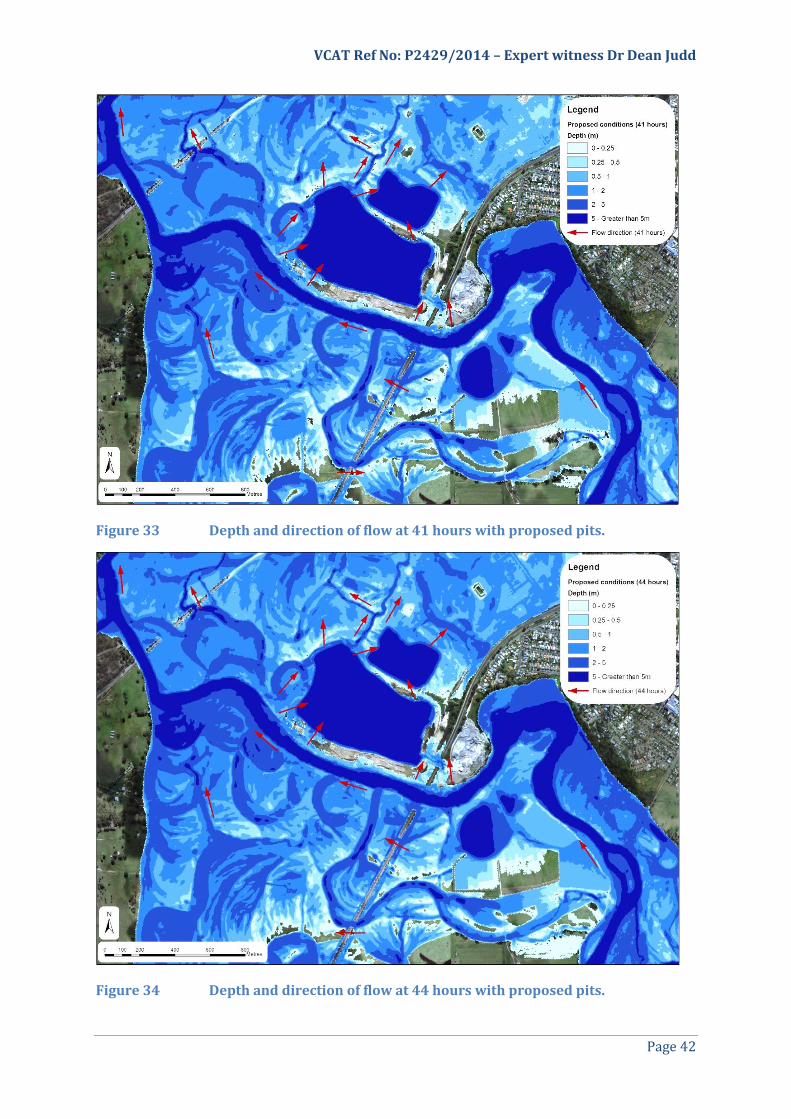
Inundation of the floodplain and the number and breadth of spill points into the southern pit
continue to increase until the southern pit fills (Figure 32) and Deep Creek subsequently begins
to flow north from the southern pit and floodwater begins to spill from the southern pit and
Deep Creek into the northern pit. Once the northern pit fills (Figure 33) the flow paths are all
running north from the Goulburn River, through Seymour Quarry and towards the town of
Seymour.
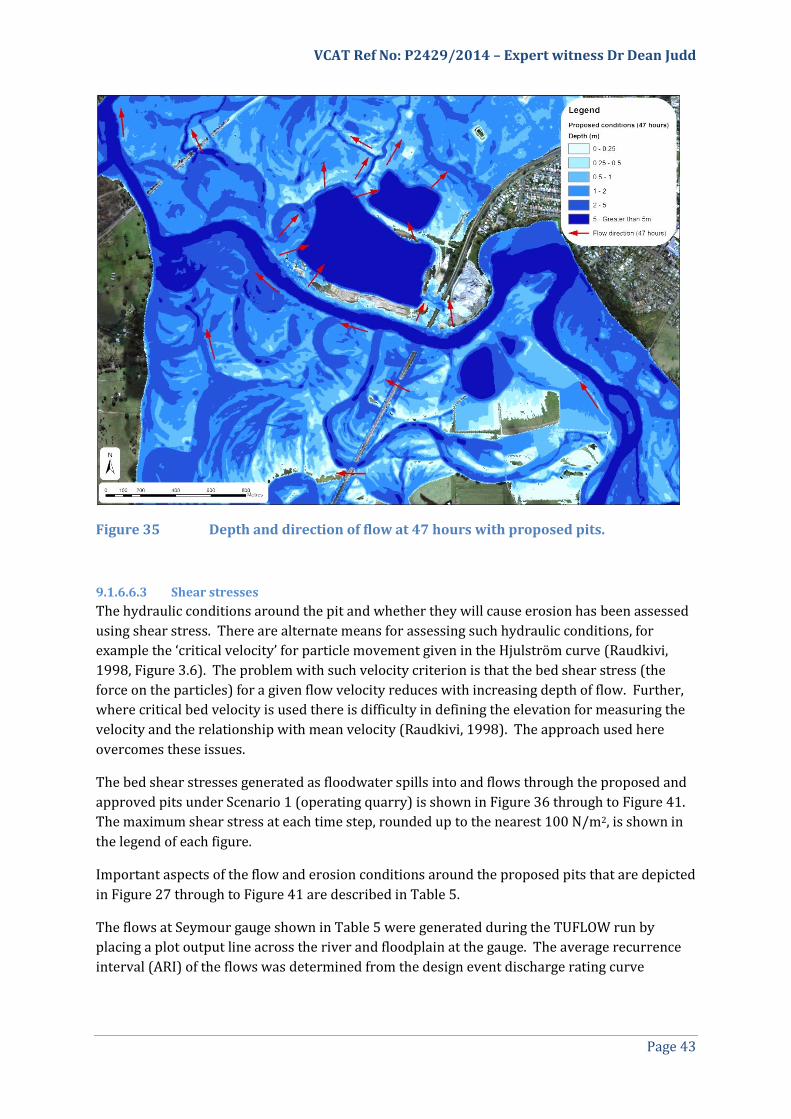
Flooding around Seymour Quarry tends to peak approximately 47 hours into the flood
(Figure 35), just after the total inflow to the hydraulic model peaks (Figure 24).
VCAT Ref No: P2429/2014 – Expert witness Dr Dean Judd
Page 39
Figure 27 Depth and direction of flow at 23 hours with proposed pits.
Figure 28 Depth and direction of flow at 26 hours with proposed pits.
VCAT Ref No: P2429/2014 – Expert witness Dr Dean Judd
Page 40
Figure 29 Depth and direction of flow at 29 hours with proposed pits.
Figure 30 Depth and direction of flow at 32 hours with proposed pits.

VCAT Ref No: P2429/2014 – Expert witness Dr Dean Judd
Page 41
Figure 31 Depth and direction of flow at 35 hours with proposed pits.
Figure 32 Depth and direction of flow at 38 hours with proposed pits.
VCAT Ref No: P2429/2014 – Expert witness Dr Dean Judd
Page 42
Figure 33 Depth and direction of flow at 41 hours with proposed pits.
Figure 34 Depth and direction of flow at 44 hours with proposed pits.
VCAT Ref No: P2429/2014 – Expert witness Dr Dean Judd
Page 43
Figure 35 Depth and direction of flow at 47 hours with proposed pits.
9.1.6.6.3 Shear stresses
The hydraulic conditions around the pit and whether they will cause erosion has been assessed
using shear stress. There are alternate means for assessing such hydraulic conditions, for
example the ‘critical velocity’ for particle movement given in the Hjulström curve (Raudkivi,
1998, Figure 3.6). The problem with such velocity criterion is that the bed shear stress (the
force on the particles) for a given flow velocity reduces with increasing depth of flow. Further,
where critical bed velocity is used there is difficulty in defining the elevation for measuring the
velocity and the relationship with mean velocity (Raudkivi, 1998). The approach used here
overcomes these issues.
The bed shear stresses generated as floodwater spills into and flows through the proposed and
approved pits under Scenario 1 (operating quarry) is shown in Figure 36 through to Figure 41.
The maximum shear stress at each time step, rounded up to the nearest 100 N/m2, is shown in
the legend of each figure.
Important aspects of the flow and erosion conditions around the proposed pits that are depicted
in Figure 27 through to Figure 41 are described in Table 5.
The flows at Seymour gauge shown in Table 5 were generated during the TUFLOW run by
placing a plot output line across the river and floodplain at the gauge. The average recurrence
interval (ARI) of the flows was determined from the design event discharge rating curve
VCAT Ref No: P2429/2014 – Expert witness Dr Dean Judd
Page 44
adopted in the Seymour Floodplain Mapping Study (Walden et al., 2001, Figure 5.35), a
graphical representation of the individual data points provided in Table 3.
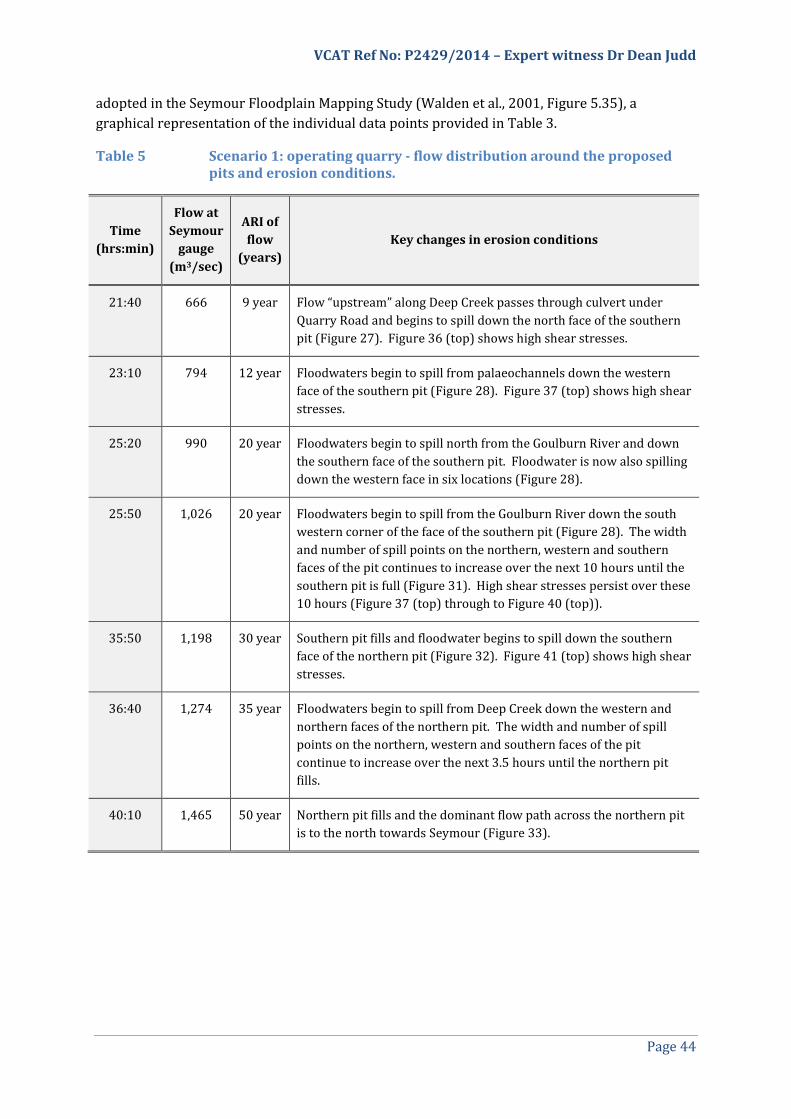
Table 5 Scenario 1: operating quarry - flow distribution around the proposed pits and erosion conditions.
Time
(hrs:min)
Flow at
Seymour
gauge
(m3/sec)
ARI of
flow
(years)
Key changes in erosion conditions
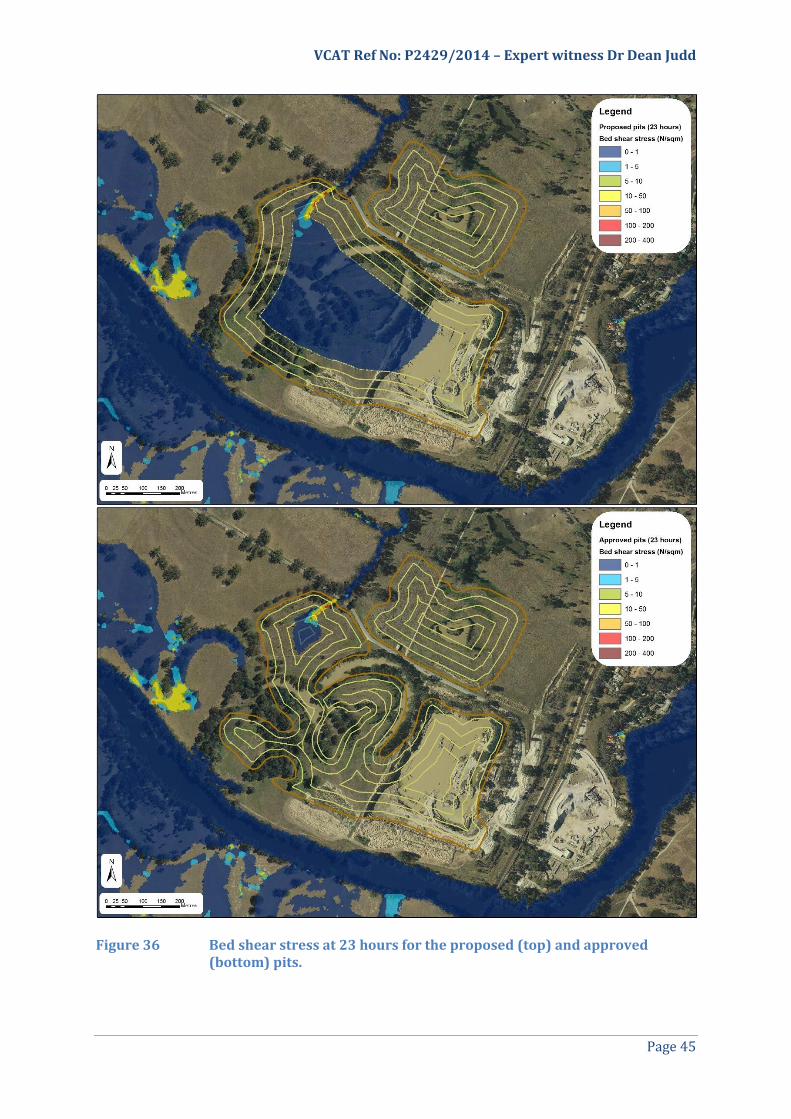
21:40 666 9 year Flow “upstream” along Deep Creek passes through culvert under
Quarry Road and begins to spill down the north face of the southern
pit (Figure 27). Figure 36 (top) shows high shear stresses.
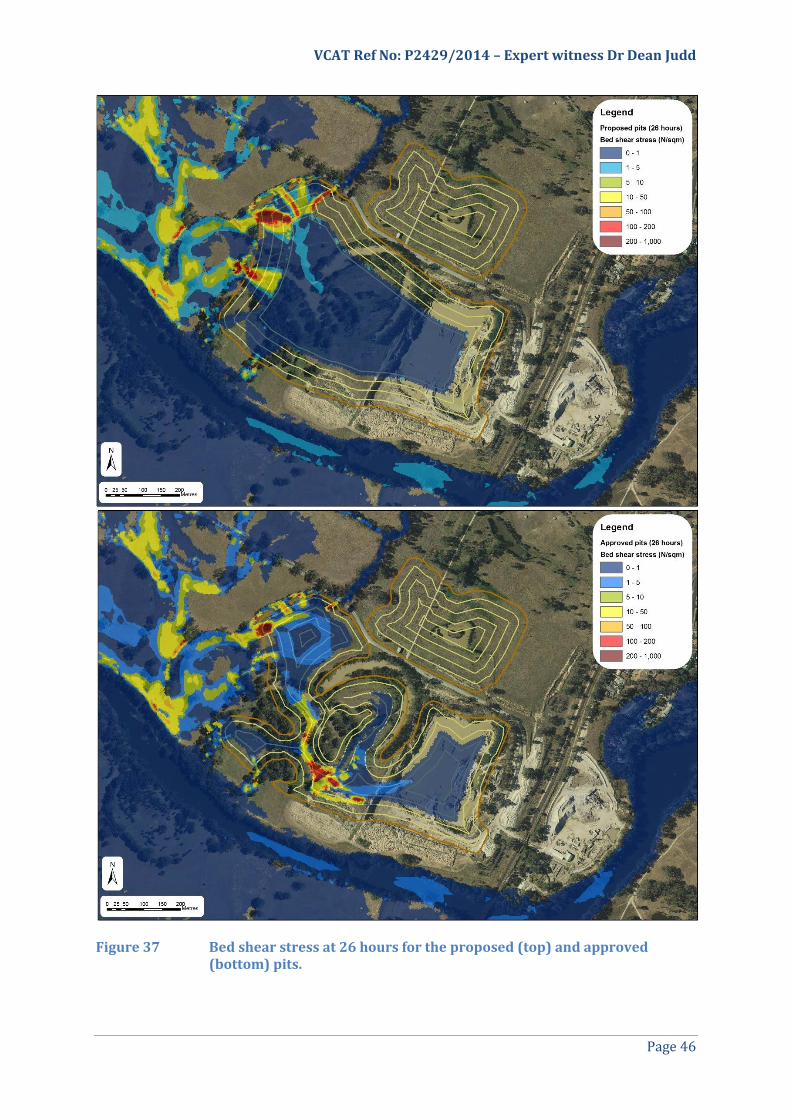
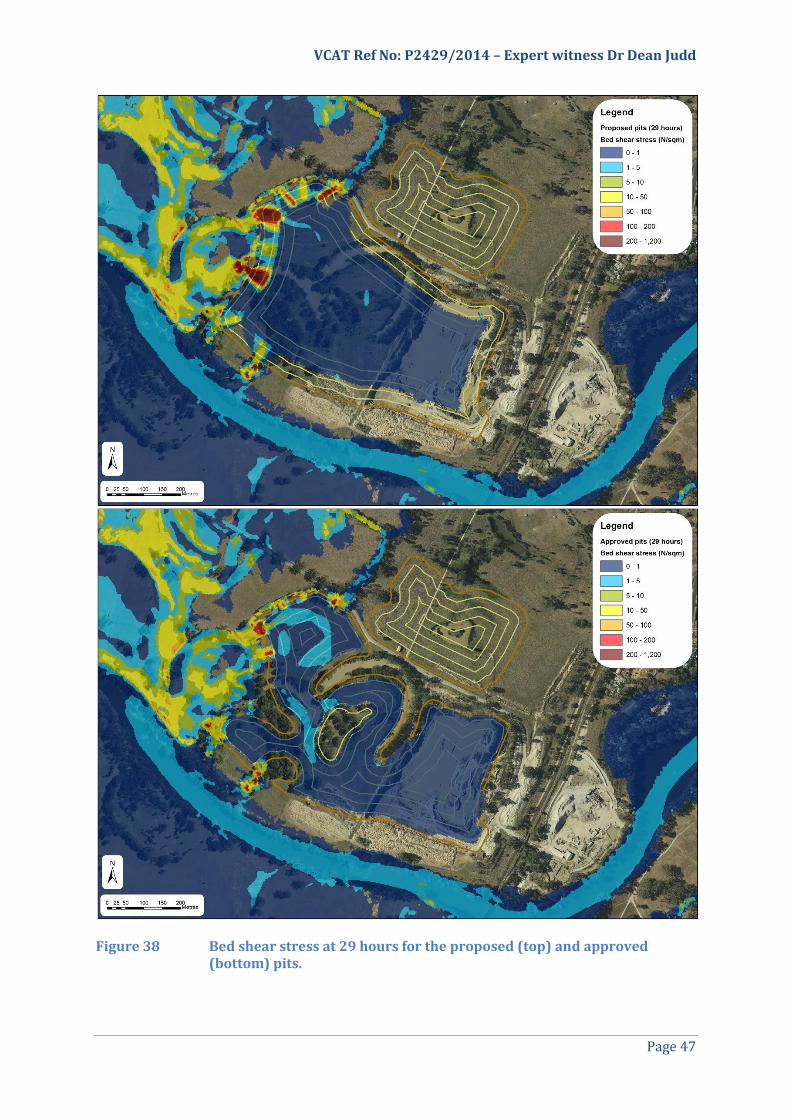
23:10 794 12 year Floodwaters begin to spill from palaeochannels down the western
face of the southern pit (Figure 28). Figure 37 (top) shows high shear
stresses.
25:20 990 20 year Floodwaters begin to spill north from the Goulburn River and down
the southern face of the southern pit. Floodwater is now also spilling
down the western face in six locations (Figure 28).
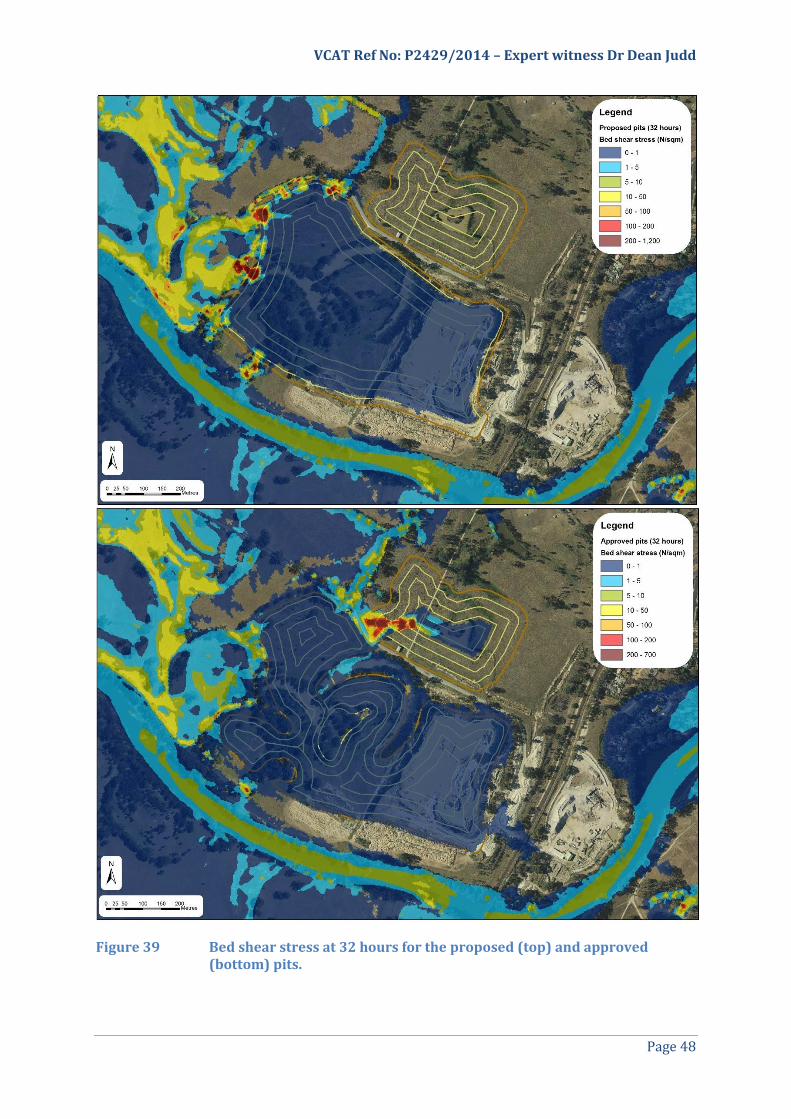
25:50 1,026 20 year Floodwaters begin to spill from the Goulburn River down the south
western corner of the face of the southern pit (Figure 28). The width
and number of spill points on the northern, western and southern
faces of the pit continues to increase over the next 10 hours until the
southern pit is full (Figure 31). High shear stresses persist over these
10 hours (Figure 37 (top) through to Figure 40 (top)).
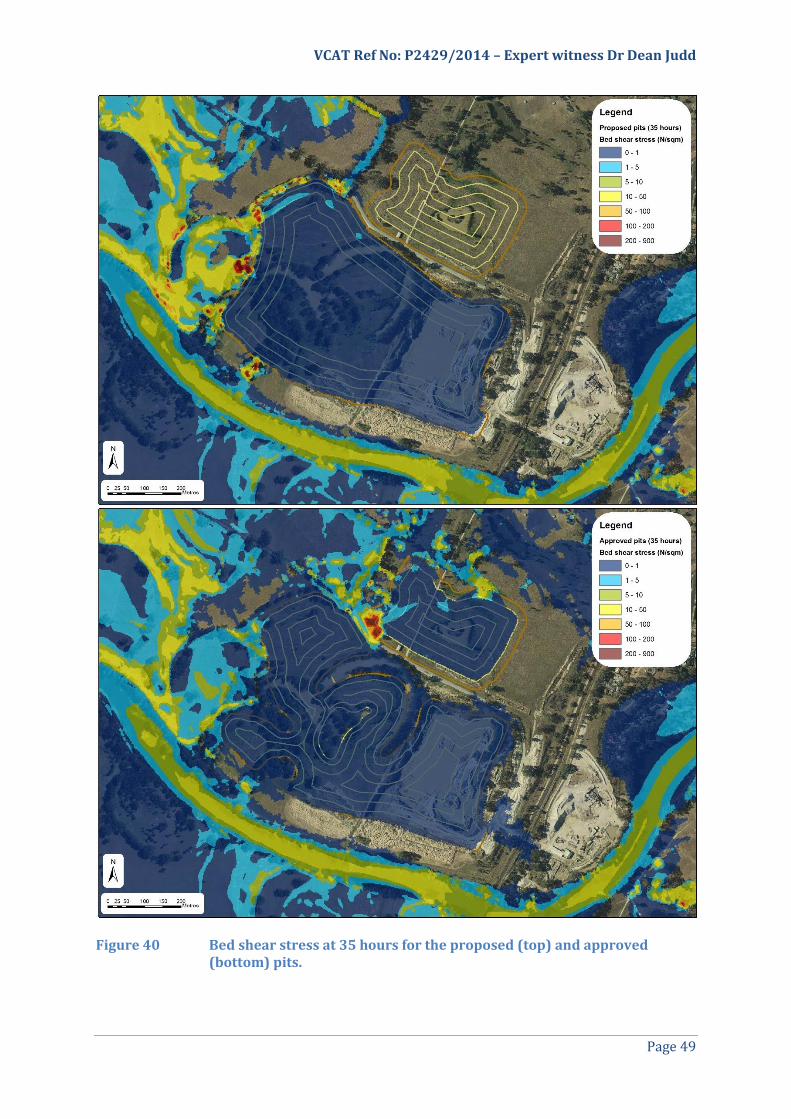
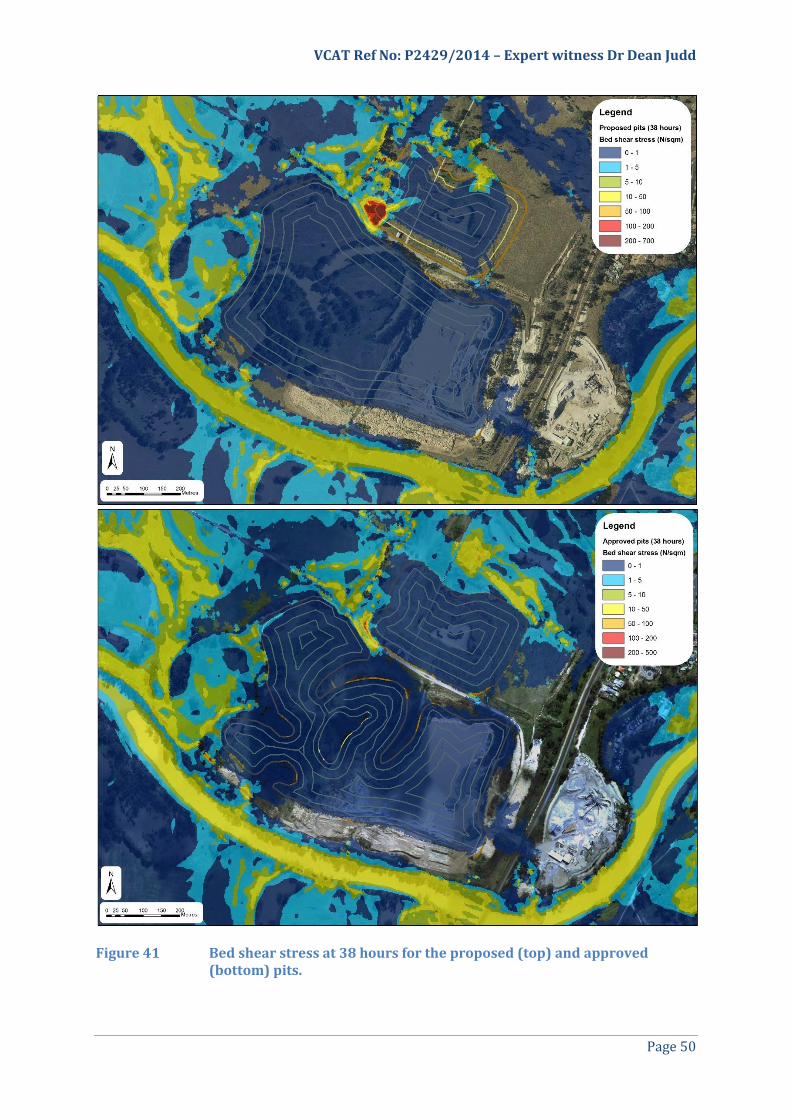
35:50 1,198 30 year Southern pit fills and floodwater begins to spill down the southern
face of the northern pit (Figure 32). Figure 41 (top) shows high shear
stresses.
36:40 1,274 35 year Floodwaters begin to spill from Deep Creek down the western and
northern faces of the northern pit. The width and number of spill
points on the northern, western and southern faces of the pit
continue to increase over the next 3.5 hours until the northern pit
fills.
40:10 1,465 50 year Northern pit fills and the dominant flow path across the northern pit
is to the north towards Seymour (Figure 33).
VCAT Ref No: P2429/2014 – Expert witness Dr Dean Judd
Page 45
Figure 36 Bed shear stress at 23 hours for the proposed (top) and approved (bottom) pits.
VCAT Ref No: P2429/2014 – Expert witness Dr Dean Judd
Page 46
Figure 37 Bed shear stress at 26 hours for the proposed (top) and approved (bottom) pits.
VCAT Ref No: P2429/2014 – Expert witness Dr Dean Judd
Page 47
Figure 38 Bed shear stress at 29 hours for the proposed (top) and approved (bottom) pits.
VCAT Ref No: P2429/2014 – Expert witness Dr Dean Judd
Page 48
Figure 39 Bed shear stress at 32 hours for the proposed (top) and approved (bottom) pits.
VCAT Ref No: P2429/2014 – Expert witness Dr Dean Judd
Page 49
Figure 40 Bed shear stress at 35 hours for the proposed (top) and approved (bottom) pits.
VCAT Ref No: P2429/2014 – Expert witness Dr Dean Judd
Page 50
Figure 41 Bed shear stress at 38 hours for the proposed (top) and approved (bottom) pits.
VCAT Ref No: P2429/2014 – Expert witness Dr Dean Judd
Page 51
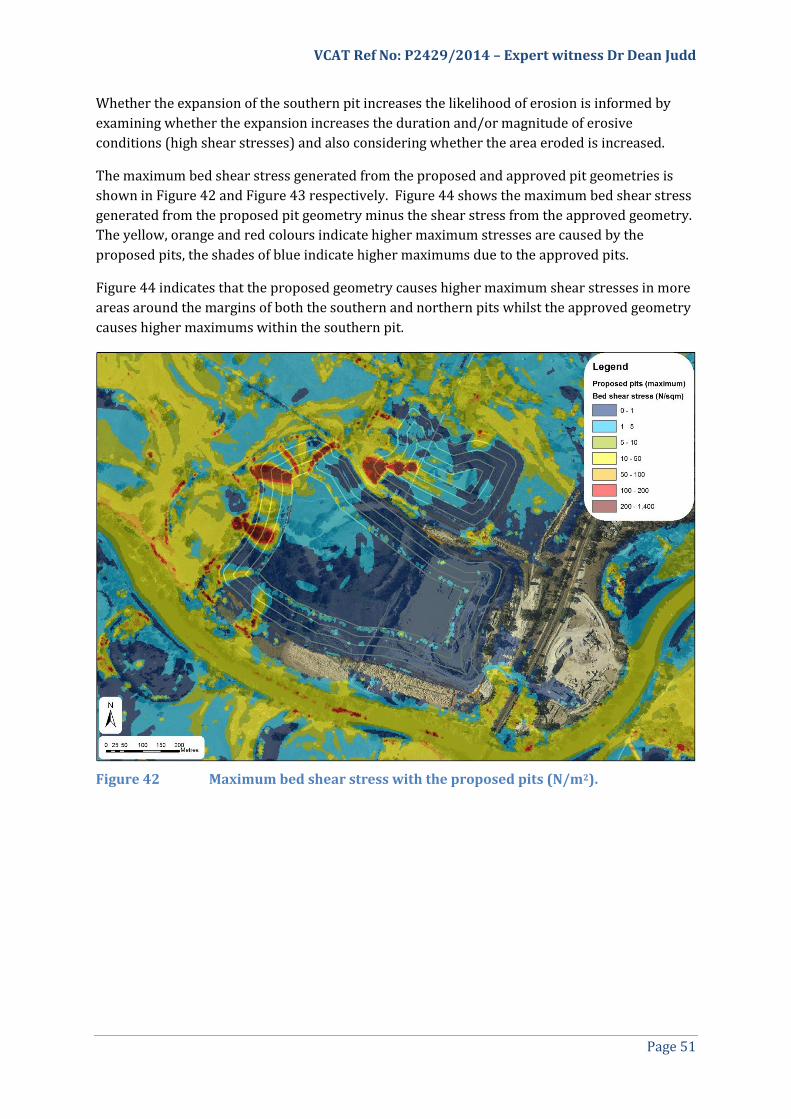
Whether the expansion of the southern pit increases the likelihood of erosion is informed by
examining whether the expansion increases the duration and/or magnitude of erosive
conditions (high shear stresses) and also considering whether the area eroded is increased.
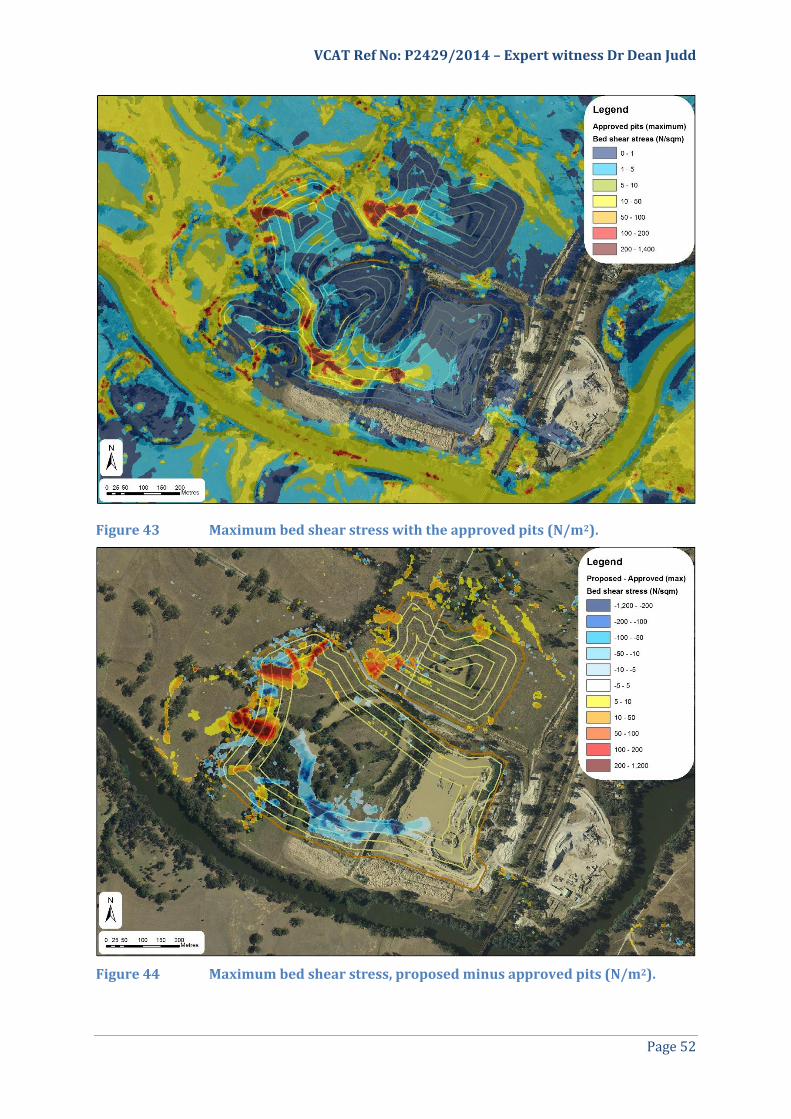
The maximum bed shear stress generated from the proposed and approved pit geometries is
shown in Figure 42 and Figure 43 respectively. Figure 44 shows the maximum bed shear stress
generated from the proposed pit geometry minus the shear stress from the approved geometry.
The yellow, orange and red colours indicate higher maximum stresses are caused by the
proposed pits, the shades of blue indicate higher maximums due to the approved pits.
Figure 44 indicates that the proposed geometry causes higher maximum shear stresses in more
areas around the margins of both the southern and northern pits whilst the approved geometry
causes higher maximums within the southern pit.
Figure 42 Maximum bed shear stress with the proposed pits (N/m2).
VCAT Ref No: P2429/2014 – Expert witness Dr Dean Judd
Page 52
Figure 43 Maximum bed shear stress with the approved pits (N/m2).
Figure 44 Maximum bed shear stress, proposed minus approved pits (N/m2).
VCAT Ref No: P2429/2014 – Expert witness Dr Dean Judd
Page 53
Note, unlike some other variables, TUFLOW does not generate maximum bed shear stress
results from every time step of the model (1 second intervals in this case). The maximum bed
shear stress must be generated from the map outputs that, in this model, are produced at
10 minute intervals for the duration of the hydrograph (Figure 23). Hence higher shear stresses
than those shown in Figure 42 and Figure 43 may have occurred for short intervals.
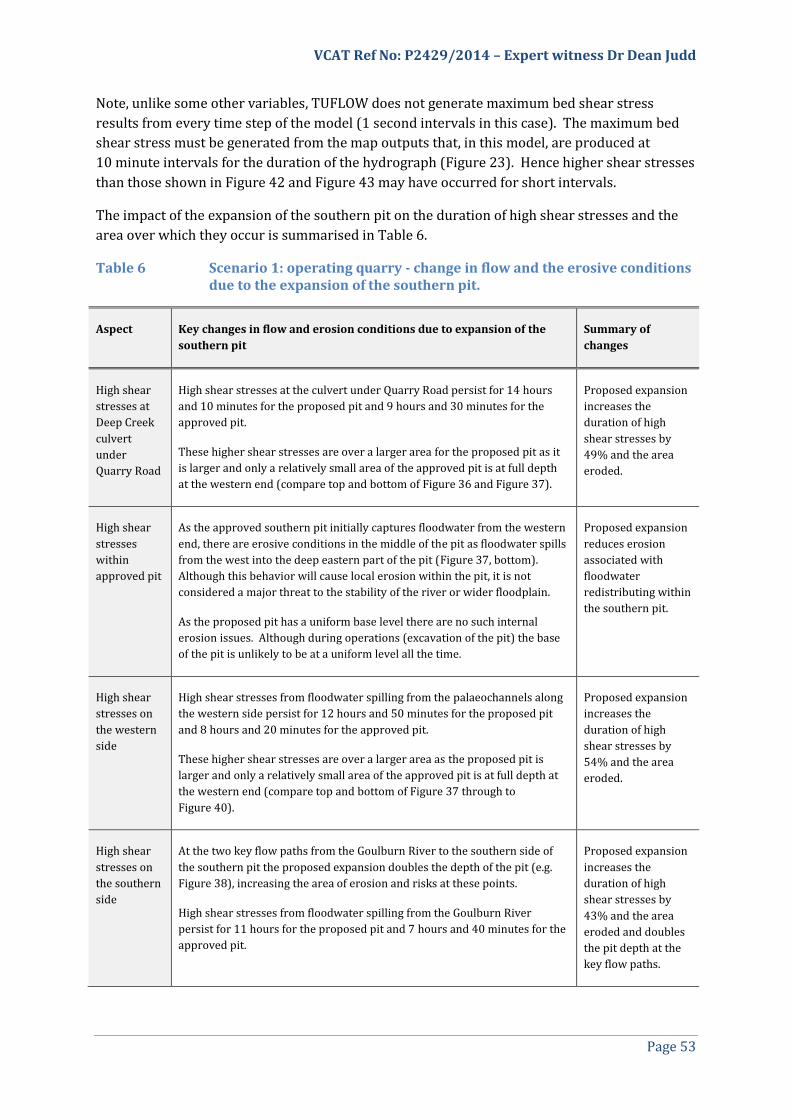
The impact of the expansion of the southern pit on the duration of high shear stresses and the
area over which they occur is summarised in Table 6.
Table 6 Scenario 1: operating quarry - change in flow and the erosive conditions due to the expansion of the southern pit.
Aspect Key changes in flow and erosion conditions due to expansion of the
southern pit
Summary of
changes
High shear
stresses at
Deep Creek
culvert
under
Quarry Road
High shear stresses at the culvert under Quarry Road persist for 14 hours
and 10 minutes for the proposed pit and 9 hours and 30 minutes for the
approved pit.
These higher shear stresses are over a larger area for the proposed pit as it
is larger and only a relatively small area of the approved pit is at full depth
at the western end (compare top and bottom of Figure 36 and Figure 37).
Proposed expansion
increases the
duration of high
shear stresses by
49% and the area
eroded.
High shear
stresses
within
approved pit
As the approved southern pit initially captures floodwater from the western
end, there are erosive conditions in the middle of the pit as floodwater spills
from the west into the deep eastern part of the pit (Figure 37, bottom).
Although this behavior will cause local erosion within the pit, it is not
considered a major threat to the stability of the river or wider floodplain.
As the proposed pit has a uniform base level there are no such internal
erosion issues. Although during operations (excavation of the pit) the base
of the pit is unlikely to be at a uniform level all the time.
Proposed expansion
reduces erosion
associated with
floodwater
redistributing within
the southern pit.
High shear
stresses on
the western
side
High shear stresses from floodwater spilling from the palaeochannels along
the western side persist for 12 hours and 50 minutes for the proposed pit
and 8 hours and 20 minutes for the approved pit.
These higher shear stresses are over a larger area as the proposed pit is
larger and only a relatively small area of the approved pit is at full depth at
the western end (compare top and bottom of Figure 37 through to
Figure 40).
Proposed expansion
increases the
duration of high
shear stresses by
54% and the area
eroded.
High shear
stresses on
the southern
side
At the two key flow paths from the Goulburn River to the southern side of
the southern pit the proposed expansion doubles the depth of the pit (e.g.
Figure 38), increasing the area of erosion and risks at these points.
High shear stresses from floodwater spilling from the Goulburn River
persist for 11 hours for the proposed pit and 7 hours and 40 minutes for the
approved pit.
Proposed expansion
increases the
duration of high
shear stresses by
43% and the area
eroded and doubles
the pit depth at the
key flow paths.
VCAT Ref No: P2429/2014 – Expert witness Dr Dean Judd
Page 54
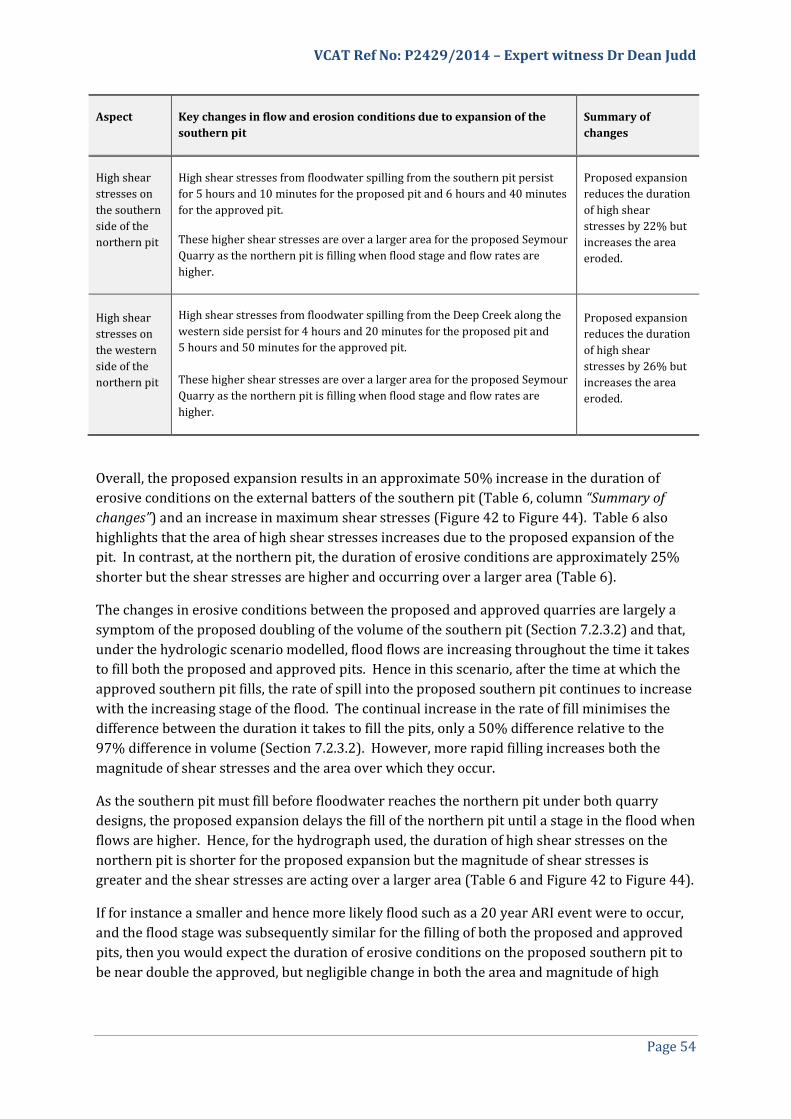
Aspect Key changes in flow and erosion conditions due to expansion of the
southern pit
Summary of
changes
High shear
stresses on
the southern
side of the
northern pit
High shear stresses from floodwater spilling from the southern pit persist
for 5 hours and 10 minutes for the proposed pit and 6 hours and 40 minutes
for the approved pit.
These higher shear stresses are over a larger area for the proposed Seymour
Quarry as the northern pit is filling when flood stage and flow rates are
higher.
Proposed expansion
reduces the duration
of high shear
stresses by 22% but
increases the area
eroded.
High shear
stresses on
the western
side of the
northern pit
High shear stresses from floodwater spilling from the Deep Creek along the
western side persist for 4 hours and 20 minutes for the proposed pit and
5 hours and 50 minutes for the approved pit.
These higher shear stresses are over a larger area for the proposed Seymour
Quarry as the northern pit is filling when flood stage and flow rates are
higher.
Proposed expansion
reduces the duration
of high shear
stresses by 26% but
increases the area
eroded.
Overall, the proposed expansion results in an approximate 50% increase in the duration of
erosive conditions on the external batters of the southern pit (Table 6, column “Summary of
changes”) and an increase in maximum shear stresses (Figure 42 to Figure 44). Table 6 also
highlights that the area of high shear stresses increases due to the proposed expansion of the
pit. In contrast, at the northern pit, the duration of erosive conditions are approximately 25%
shorter but the shear stresses are higher and occurring over a larger area (Table 6).
The changes in erosive conditions between the proposed and approved quarries are largely a
symptom of the proposed doubling of the volume of the southern pit (Section 7.2.3.2) and that,
under the hydrologic scenario modelled, flood flows are increasing throughout the time it takes
to fill both the proposed and approved pits. Hence in this scenario, after the time at which the
approved southern pit fills, the rate of spill into the proposed southern pit continues to increase
with the increasing stage of the flood. The continual increase in the rate of fill minimises the
difference between the duration it takes to fill the pits, only a 50% difference relative to the
97% difference in volume (Section 7.2.3.2). However, more rapid filling increases both the
magnitude of shear stresses and the area over which they occur.
As the southern pit must fill before floodwater reaches the northern pit under both quarry
designs, the proposed expansion delays the fill of the northern pit until a stage in the flood when
flows are higher. Hence, for the hydrograph used, the duration of high shear stresses on the
northern pit is shorter for the proposed expansion but the magnitude of shear stresses is
greater and the shear stresses are acting over a larger area (Table 6 and Figure 42 to Figure 44).
If for instance a smaller and hence more likely flood such as a 20 year ARI event were to occur,
and the flood stage was subsequently similar for the filling of both the proposed and approved
pits, then you would expect the duration of erosive conditions on the proposed southern pit to
be near double the approved, but negligible change in both the area and magnitude of high
VCAT Ref No: P2429/2014 – Expert witness Dr Dean Judd
Page 55
shear stresses. Erosive conditions at the northern pit would be essentially the same under this
hydrologic scenario.
9.1.6.7 Scenario 2: rehabilitated quarry (both approved and proposed)
9.1.6.7.1 Topography
For this scenario the geometry and initial conditions for the hydraulic model were changed to
what might be the conditions upon completion of the quarry pits. The changes included:
To replicate the cessation of dewatering at Seymour Quarry, initial water levels were set
in the northern and southern pits at 131 metres AHD. A range of groundwater levels are
quoted in the geotechnical assessments (Slade, 2014; Smith, 2011). A level of
131 metres AHD was adopted from Slade (2014, Table 5-3).
The proposed Seymour levee was included in the hydraulic model. The levee alignment
was straightened by the author over an approximate 170 metre length along the
northern edge of the northern pit. Over this length the alignment of the levee curves
substantially into the northern pit of Seymour Quarry to avoid a natural depression.
This modification to the levee was made to undertake the hydraulic assessment but it
appears VCAT has already required modification of the northern extent of extraction
(Section 7.2.2).
The filling in the urban flood zone (west of the rail corridor) and floodway overlay (east
of the rail corridor) shown in Figure 11 was removed to reflect the requirements of the
planning scheme and the quarry rehabilitation plan.
The above conditions were adopted for Scenario 2 to examine to what extent rehabilitation of
the site can mitigate risks. Removal of the banks of fill that concentrate spill into the quarry at
fewer locations has the potential to reduce the duration and magnitude of high shear stresses,
as does the cessation of dewatering. The construction of Seymour levee also has the potential to
partially mitigate the risk of avulsion by blocking the downstream flow path along Deep Creek.
9.1.6.7.2 Flow distribution
In the interests of brevity, the flow distribution figures from the Scenario 1 are not repeated.
The primary differences between the Scenario 1 and 2 (operating and rehabilitated quarry
respectively), in terms of flow distribution, are:
1. Water no longer flows through much of Deep Creek in Scenario 2 due to the presence of
the Seymour levee (Figure 45).
2. The removal of fill along the Goulburn River in Scenario 2 increased the breadth of the
spill of floodwater through Seymour Quarry (compare Figure 35 and Figure 45).
3. The loss of flood storage caused by the Seymour levee and the pits being partially filled
with groundwater in Scenario 2 increases the depth and area of inundation in the flood
(compare Figure 35 and Figure 45).
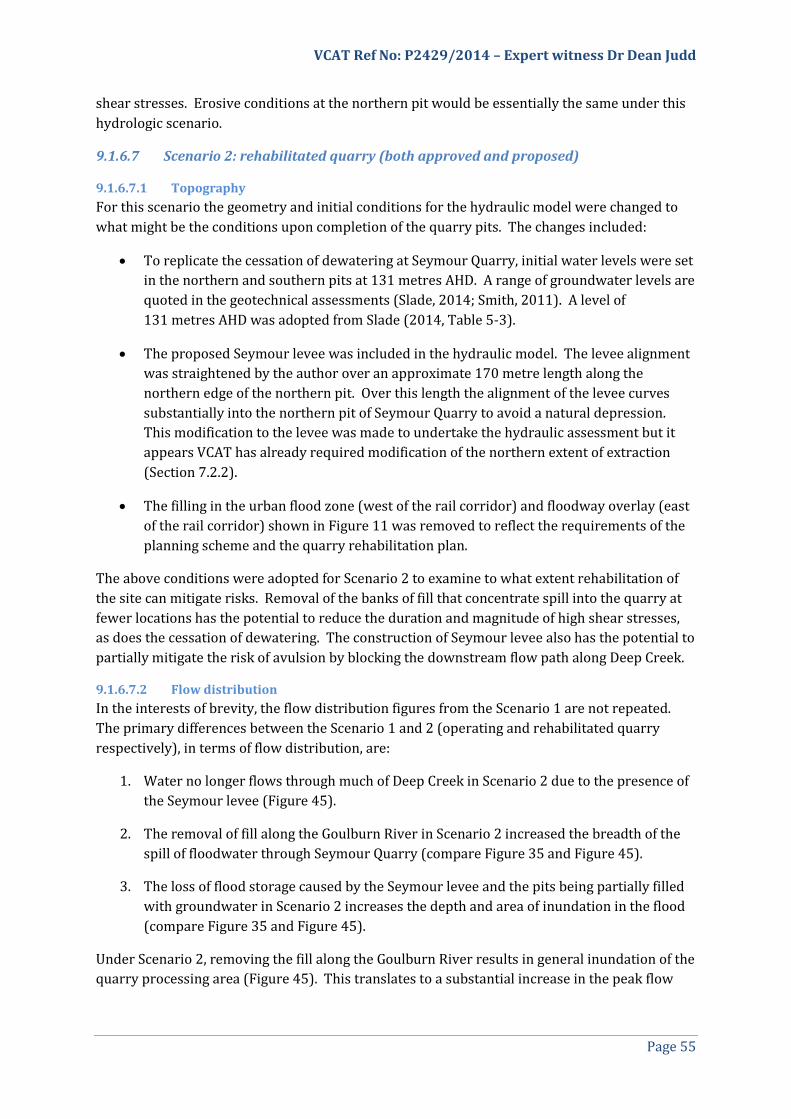
Under Scenario 2, removing the fill along the Goulburn River results in general inundation of the
quarry processing area (Figure 45). This translates to a substantial increase in the peak flow
VCAT Ref No: P2429/2014 – Expert witness Dr Dean Judd
Page 56
under the railway bridges on the northern floodplain and directly into the southern pit. For the
proposed quarry expansion, the peak flow through the northern railway bridges is just 15 m3/s
in Scenario 1, increasing to 67 m3/s in Scenario 2. Whilst this is a substantial increase, the
northern bridges take just 1% of total flood flow in Scenario 1 and 4% in Scenario 2. The flows
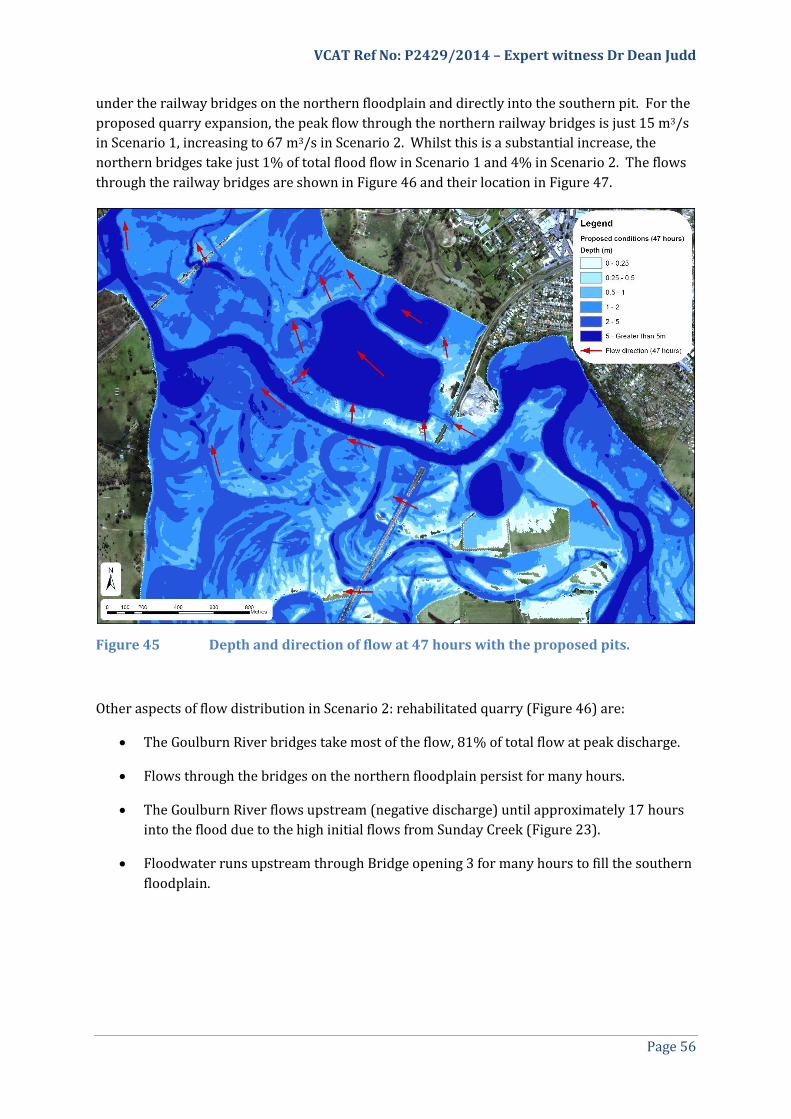
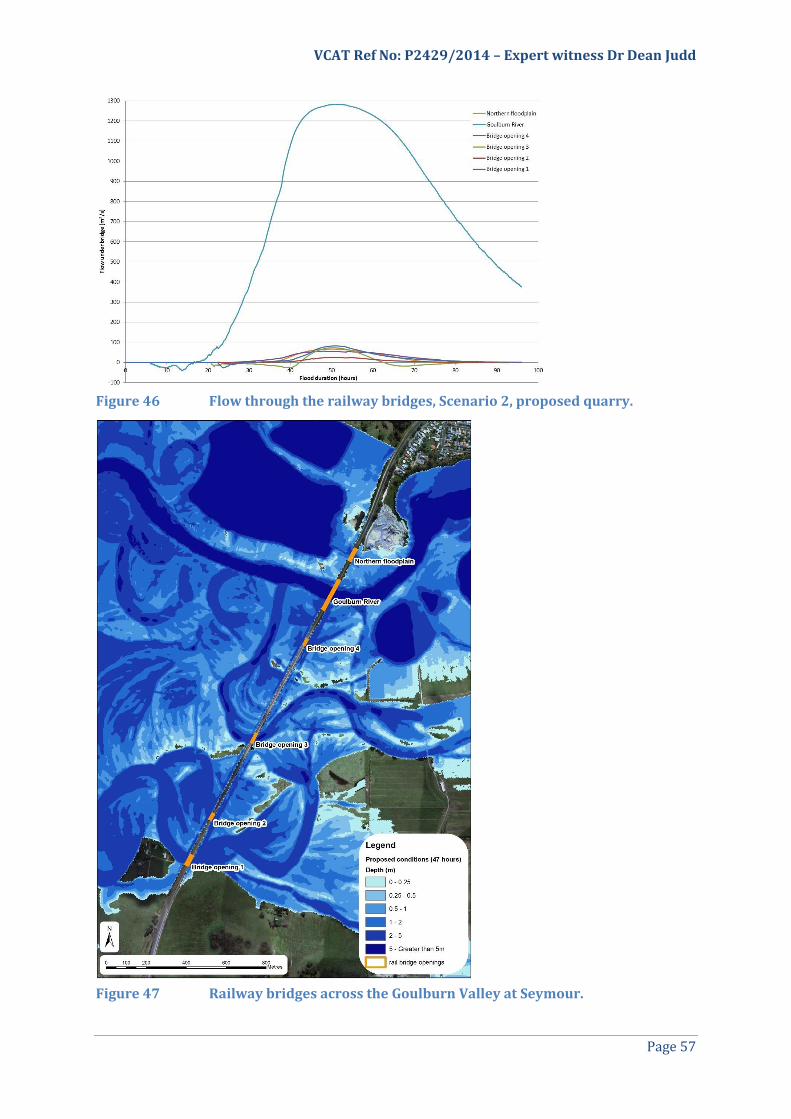
through the railway bridges are shown in Figure 46 and their location in Figure 47.
Figure 45 Depth and direction of flow at 47 hours with the proposed pits.
Other aspects of flow distribution in Scenario 2: rehabilitated quarry (Figure 46) are:
The Goulburn River bridges take most of the flow, 81% of total flow at peak discharge.
Flows through the bridges on the northern floodplain persist for many hours.
The Goulburn River flows upstream (negative discharge) until approximately 17 hours
into the flood due to the high initial flows from Sunday Creek (Figure 23).
Floodwater runs upstream through Bridge opening 3 for many hours to fill the southern
floodplain.
VCAT Ref No: P2429/2014 – Expert witness Dr Dean Judd
Page 57
Figure 46 Flow through the railway bridges, Scenario 2, proposed quarry.
Figure 47 Railway bridges across the Goulburn Valley at Seymour.