Embed Size (px)
Citation preview

AnalyzeIT
Ammonia Monitor
8232
Instruction ManualIM/8232_6

Health and SafetyTo ensure that our products are safe and without risk to health, the following points must be noted:
1. The relevant sections of these instructions must be read carefully before proceeding.
2. Warning labels on containers and packages must be observed.
3. Installation, operation, maintenance and servicing must only be carried out by suitably trained personnel and in accordance with theinformation given.
4. Normal safety precautions must be taken to avoid the possibility of an accident occurring when operating in conditions of high pressureand/or temperature.
5. Chemicals must be stored away from heat, protected from temperature extremes and powders kept dry. Normal safe handling proceduresmust be used.
6. When disposing of chemicals ensure that no two chemicals are mixed.
Safety advice concerning the use of the equipment described in this manual or any relevant hazard data sheets (where applicable) may beobtained from the Company address on the back cover, together with servicing and spares information.
ABB
The Company
We are an established world force in the design and manufacture of instrumentation forindustrial process control, flow measurement, gas and liquid analysis and environmentalapplications.
As a part of ABB, a world leader in process automation technology, we offer customersapplication expertise, service and support worldwide.
We are committed to teamwork, high quality manufacturing, advanced technology andunrivalled service and support.
The quality, accuracy and performance of the Company’s products result from over 100 yearsexperience, combined with a continuous program of innovative design and development toincorporate the latest technology.
The UKAS Calibration Laboratory No. 0255 is just one of the ten flow calibration plantsoperated by the Company and is indicative of our dedication to quality and accuracy.
EN ISO 9001:2000
Cert. No. Q 05907
REGISTERE
D
EN 29001 (ISO 9001)
Lenno, Italy – Cert. No. 9/90A
0255
Stonehouse, U.K.
Warning – Refer to the manual for instructions
Caution – Risk of electric shock
Protective earth (ground) terminal
Earth (ground) terminal
Direct current supply only
Alternating current supply only
Both direct and alternating current supply
The equipment is protectedthrough double insulation
Electrical Safety
This instrument complies with the requirements of CEI/IEC 61010-1:2001-2 "Safety requirements for electrical equipment formeasurement, control, and laboratory use". If the instrument is used in a manner NOT specified by the Company, the protectionprovided by the instrument may be impaired.
Symbols
One or more of the following symbols may appear on the instrument labelling:
Information in this manual is intended only to assist our customers in the efficient operation of our equipment. Use of this manualfor any other purpose is specifically prohibited and its contents are not to be reproduced in full or part without prior approval of theTechnical Publications Department.

1
CONTENTS
Section Page
1 INTRODUCTION .............................................................. 21.1 Description ............................................................... 21.2 Training .................................................................... 21.3 Location and Function of Main Components ........... 2
2 INSTALLATION ................................................................ 32.1 Accessories ............................................................. 32.2 Location ................................................................... 32.3 Mounting .................................................................. 32.4 Sampling Requirement ............................................ 32.5 Sample Connections ................................................ 32.6 External Electrical Connections ............................... 42.7 Relay Contact Protection and Interference
Suppression .......................................................... 5
3 SETTING UP .................................................................... 6
4 LIQUID HANDLING SECTION ........................................ 74.1 Principle of Operation .............................................. 74.2 General Operation ................................................... 8
5 ELECTRONICS SECTION ............................................... 85.1 Electronic Layout ..................................................... 85.2 User Junction Box .................................................... 85.3 Microprocessor Unit ................................................. 85.4 Front Panel Controls ................................................ 95.5 Displays ................................................................... 95.6 L.E.D. Indication ...................................................... 9
6 PROGRAMMING ........................................................... 106.1 Normal Operation .................................................. 116.2 Programming Pages .............................................. 11
6.2.1 Operating Page 1 .................................... 126.2.2 Operating Page 2 .................................... 136.2.3 Security Code Page ................................ 146.2.4 Set Up Input Page ................................... 156.2.5 Current Output Page ............................... 166.2.6 Set Up Alarms Page ................................ 196.2.7 Set Up Clock Page .................................. 216.2.8 Calibration User Code Page .................... 236.2.9 Set Up Temperature Control Page .......... 246.2.10 Electrical Calibration .............................. 246.2.11 Electrical Calibration Page ..................... 25
7 CALIBRATION ............................................................... 287.1 Calibration Sequence ............................................ 28
8 MAINTENANCE ............................................................. 298.1 Chemistry ............................................................... 29
8.1.1 Reagent Solutions ................................... 298.1.2 Standard Solutions .................................. 29
8.2 Scheduled Servicing .............................................. 298.2.1 Regular Visual Checks ............................ 298.2.2 Four Weekly ............................................ 308.2.3 Two Monthly ............................................ 308.2.4 Twelve Monthly ........................................ 308.2.5 Cleaning Sample Pipework ..................... 308.2.6 Consumables Spares Kit ......................... 318.2.7 Assembling/Refurbishing the Probe ........ 318.2.8 Peristaltic Pump ...................................... 328.2.9 Replacement of Plumbing Tubing ........... 32
8.3 Shutdown Procedure ............................................. 348.3.1 Short Term ............................................... 348.3.2 Long Term................................................ 34
8.4 Unscheduled Servicing .......................................... 348.4.1 Malfunction of the Monitor ....................... 348.4.2 Monitor Diagnostic Information ................ 358.4.3 Malfunction of the Probe ......................... 35
8.5 General Maintenance of the Probe ........................ 358.5.1 Ageing of the Glass Electrode ................. 358.5.2 Checking the Performance of the Glass
Electrode .................................................. 358.5.3 Reference Element .................................. 368.5.4 Procedure for Chloridising the Reference
Element .................................................... 368.6 Microprocessor Unit Error Messages .................... 36
9 SPECIFICATION ............................................................ 37
10 SPARES LIST .............................................................. 38
APENDIX A – REPLACING SOFTWARE EPROM ............. 39A.1 Access the Transmitter Unit .................................. 39A.2 Access the PCB .................................................... 39A.3 Removing the PCB ................................................ 40A.4 Changing the EPROM ........................................... 40A.5 Completing the Procedure ..................................... 40
Section Page

2
1.1 DescriptionThe Model 8232 Ammonia Monitor is a microprocessor basedanalyser using an ABB ammonia ion-selective probe. Thisequipment is used for environmental water monitoring.
1.2 TrainingDue to the specialised nature of the above instrument, it isrecommended that, where the end users personnel have had noprevious experience of maintaining this equipment, training beprovided by this Company.
Such training is available via the local Company in the UK, orOverseas Agent elsewhere and may be carried out either on theusers premises or at the factory.
1.3 Location and Function of Main Components –Fig. 1.1Monitoring of any sample by ion-selective electrodes usuallyrequires certain conditioning to be performed on the sample toallow accurate, trouble-free measurement. Such conditioninginvolves regulating flow, controlling temperature and adjustingchemical composition prior to presentation of the sample to thepoint of measurement. This monitor carries out theseadjustments for each parameter in simple and easily understoodsteps. The sample is presented from the user's pipework to aconstant head unit and any excess is allowed to overflow. This
allows sample, under controlled pressure conditions, to bepresented to a multi-channel peristaltic pump which proportionssample and reagent solutions through the monitor to the mixingpoint. The resulting combined solution is then temperaturecontrolled to remove the effects of sample and ambienttemperature variations. The conditioned solution is then deliveredto the probe, under constantly flowing conditions, where the ionmeasurement takes place.
The probe generates a millivolt output which is proportional to theion concentration. This output is processed by themicroprocessor-based electronics section to calculate the actualsample concentration.
To maintain optimum measurement accuracy it is necessary tointroduce standard solutions of known concentration forcalibration purposes. The monitor utilises solenoid valves tointroduce these standard solutions automatically, atpredetermined intervals, under the control of the microprocessor.
The electronics section consists of the main Microprocessor Unitsituated at the top left and a User Junction Box at the top rightbehind the hinged case.
Fig. 1.1 Location of Instrument Components
1 INTRODUCTION
Ammonia EIL8232
CalibrationSolution
Containers
Constant Head Unit(behind case)
with Sample Inlet andDrain Connections
PeristalticPump
Case Lock
TemperatureControlled
Block(cover removed)
Ammonia Probe
Cable Entry Glands
Case LockMicroprocessor
Unit
Hinged Case
Solenoid Valves(behind case)
User Junction Box(behind case)
Hinged Door
Push-to-ReleaseLatch
3
2.1 Accessories2 x reagent bottles 1 x ammonia probe kit4 x calibration bottles 1 x spares kit
2.2 LocationThe monitor should be installed in a clean, dry, well ventilated andvibration-free location giving easy access, and where shortsample lines can be used. Rooms containing corrosive gases orvapours (e.g., chlorination equipment or chlorine gas cylinders)should be avoided. It is also advisable to have adjacent drainsnear ground level, so that the waste outlet from the monitor can beas short as possible, together with maximum fall. Power suppliesshould also be adjacent. Ambient temperature: within the range 5to 40°C.
2.3 Mounting – Fig. 2.1The monitor has a moulded plastic case, mounted onto a flatmetal panel. To provide access, the case is hinged on the lefthand side and has two lockable catches on the right hand to holdthe case in position in normal operation.
One keyhole slot is provided at the top of the flat panel to provideeasy mounting on a wall or framework. Two further fixing holesare provided at the bottom of the flat panel. All holes are designedto take 8 mm bolts or studs.
Mains and signal cables are connected through cable glands inthe User Junction Box on the right hand side with the exception ofthe optional serial interface which connects directly into theMicroprocessor Unit. Sample and drain pipework are brought inthrough the bottom of the case.
2.4 Sampling RequirementIn addition to being as close as possible to the monitor, thesampling point must provide a thoroughly mixed representativesample. The sample must also conform to the followingconditions:
a) Sample flow rates must be between 5 ml min–1 and1250 ml min–1.
b) Sample temperature should be within 20 °C of the ambienttemperature and within the range 0 to 40°C.
c) Particles must be less than 10 mg l–1 and the size must notexceed 60 µm. Above these levels it is essential that the filtersupplied is fitted in both the sample and emergency inlets.
2.5 Sample Connections – Fig. 2.2 (overpage)The inlet and outlet pipe connections are both located at thebottom of the case. A 6 mm (1/4") hose adaptor is provided for thesample inlet and a 9 mm (3/8") hose connection for the drains. It isrecommended that the pipes used should be of inert material,e.g., silicone rubber or p.v.c. The inlet pipe must incorporate ashut-off valve at its upstream end, while the drain outlet pipesshould be short, venting to atmosphere as soon as possible.
Fig. 2.1 Overall Dimensions and Mounting Details
2 INSTALLATION
JunctionBox
60 Top of Case
30
Sample Inlet& DrainTubes
110mm minimum clearancerequired for accessto locks
Fixing Centres
Moulded CaseShown in
Open Position
780Fixing
Centres
278
482
220
CableEntryPoint
188
890
OpenPosition
95° Max.
angle ofopening
542
235
550
ClosedPosition
8mm KeyholeSlot
8mm FixingHoles
Top View
Edge ofCase
All dimensions in mm
4
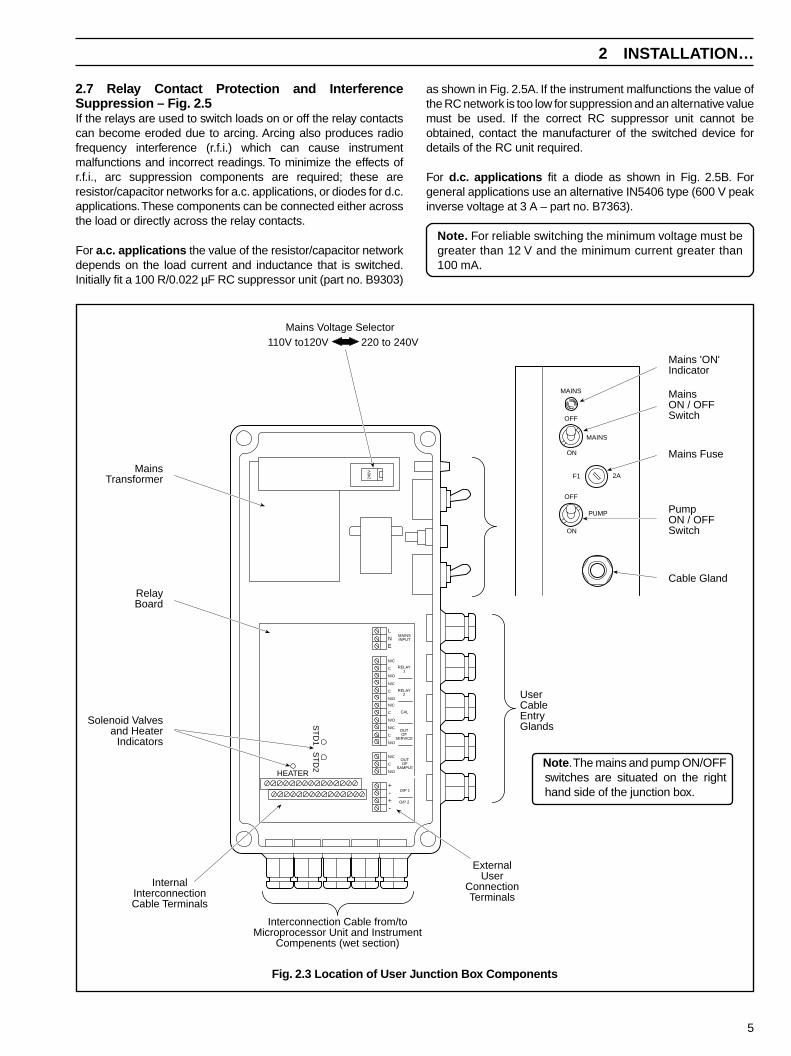
2.6 External Electrical Connections – Fig. 2.3
Warning.• Although certain instruments are fitted with internal fuse
protection, a suitably rated external protection device, e.g.a 3 A fuse or miniature circuit breaker (m.c.b.), must alsobe fitted by the installer.
• Before making any connections, ensure that the powersupply , any high voltage-operated control circuits, highcommon mode voltage, including externally poweredalarm circuits, are switched off.
• The power supply earth (ground) must be connected toensure safety to personnel, reduction of effects of radiofrequency interference (r.f.i.) and correct operation of thepower supply interference filter.
The external electrical connections are to be found in the UserJunction Box with the exception of the optional serial interfacewhich is connected directly into the Microprocessor Unit. Thecables are passed through the cable glands on the right hand sideof the junction box which are adjacent to the internal electricalterminals.
Caution. Slacken the terminal screws fully before makingconnections.
…2 INSTALLATION
Sample Inlet Pipe(6 mm i.d.)
Drain Tundish
Contaminated Drain pipe(9 mm i.d.)
Tube wall fixing clips
N.B. Sample, drain and overflow pipework in flexible silicone rubber or PVC
150 mm(approx)
Monitor Case
Case Hinge LinePush-on hose connectors
Constant-head unit
250 mm (approximate) lengthtubing
to allow the caseto open through 90°
OverflowDrain
Fig. 2.2 Suggested Layout
The connections are as follows:
a) Mains input 115 V or 240 V. The mains voltage is selected bymeans of the voltage selector – see Fig. 2.3.
b) Current outputs 1 and 2 – two independent current outputs forexternal recording or control. One output is supplied asstandard, the second is supplied as an optional extra – seeFig. 2.4 for details of current output range.
Information. Because the current output is isolated, thenegative terminal must be connected to earth (ground) ifconnecting to the isolated input of another device.
c) Relay 1 and 2 – two concentration alarms.
d) Relay 3 – calibration mode indication. This indicates when theinstrument is off line during a calibration.
e) Relay 4 – instrument 'OUT OF SERVICE' indication. Thisindicates that the monitor readings are suspect and it is inneed of attention.
f) Relay 5 – 'OUT OF SAMPLE' – indication of loss of sample.
g) Optional serial interface – connected into the MicroprocessorUnit. See supplementary instruction manual for details.
Note. It is essential that allsample pipework to themonitor is kept as short aspossible to reduce the effectson the sample due to thepresense of algæ which canbuild up. This problem isparticularly acute in thepipework between the filterand the monitor because ofthe small sample flow. Smallbore tubing is essential, e.g. 6mm i.d.
5
L
NE
N/C
C
N/O
N/C
C
N/O
N/C
C
N/O
N/C
C
N/O
N/C
C
N/O
+-+-
RELAY1
RELAY2
CAL
OUTOF
SERVICE
OUTOF
SAMPLE
O/P 1
O/P 2
MAINSINPUT
ST
D1
ST
D2
HEATER
240V
Mains Voltage Selector110V to120V 220 to 240V
UserCableEntryGlands
ExternalUser
ConnectionTerminals
Interconnection Cable from/toMicroprocessor Unit and Instrument
Compenents (wet section)
InternalInterconnectionCable Terminals
Solenoid Valvesand Heater
Indicators
RelayBoard
MainsTransformer
Mains Fuse
Cable Gland
MAINS
MAINS
F1 2A
PUMP
Mains 'ON'Indicator
MainsON / OFFSwitch
PumpON / OFFSwitch
OFF
ON
OFF
ON
as shown in Fig. 2.5A. If the instrument malfunctions the value ofthe RC network is too low for suppression and an alternative valuemust be used. If the correct RC suppressor unit cannot beobtained, contact the manufacturer of the switched device fordetails of the RC unit required.
For d.c. applications fit a diode as shown in Fig. 2.5B. Forgeneral applications use an alternative IN5406 type (600 V peakinverse voltage at 3 A – part no. B7363).
Note. For reliable switching the minimum voltage must begreater than 12 V and the minimum current greater than100 mA.
2 INSTALLATION…
2.7 Relay Contact Protection and InterferenceSuppression – Fig. 2.5If the relays are used to switch loads on or off the relay contactscan become eroded due to arcing. Arcing also produces radiofrequency interference (r.f.i.) which can cause instrumentmalfunctions and incorrect readings. To minimize the effects ofr.f.i., arc suppression components are required; these areresistor/capacitor networks for a.c. applications, or diodes for d.c.applications. These components can be connected either acrossthe load or directly across the relay contacts.
For a.c. applications the value of the resistor/capacitor networkdepends on the load current and inductance that is switched.Initially fit a 100 R/0.022 µF RC suppressor unit (part no. B9303)
Note. The mains and pump ON/OFFswitches are situated on the righthand side of the junction box.
Fig. 2.3 Location of User Junction Box Components

6
…2 INSTALLATION
OutputModule 1
Link for the CurrentOutput required
Output Module 2(if fitted)Temperature Input
Module
InputModule
ProtectionPlate
CaptiveScrews
0 to 1mA 0 to 10mA 0 to 20mA 4 to 20mA
1 8 1 8 1 8 1 8
Fig. 2.4 Selecting The Current Output Range
R C
LoadL N
External a.c. supply
Relay ContactsNC C NO
A – a.c. Applications
Load+ –
External d.c. supply
Relay Contacts
B – d.c. Applications
NC C NO
Diode
Fig. 2.5 Relay Contact Protection
3 SETTING UP
Note. Before proceeding any further, ensure that allswitches are set to OFF on the right hand side of theelectronics unit – see Fig. 2.3.
a) Ensure that all external electrical and plumbing connectionshave been made correctly.
b) Fill reagent and standard solution bottles and connect them tothe monitor. (See Section 8.1 for details of these solutions.)
c) Fit the probe according to the instructions in Section 8.2.7.
d) Connect the electrical supply and switch on.
Note. The temperature controlled block requires up to half anhour to reach the normal control temperature. During thistime, ‘Temp. Control Error’ is indicated on the display. Anycalibrations are prevented by the microprocessor during thistime.
e) Verify that there is an adequate supply of sample to themonitor constant head unit.
f) Fit the pump platen on the peristaltic pumps (see Section8.2.8) and switch the pumps on with the switch on the side ofthe monitor. Ensure that the peristaltic pumps rotate, andcheck that sample and reagents are being drawn into themonitor by observing the progress of any small bubblespresent in the inlet tubes.
g) Run the monitor for at least one hour to allow the temperatureto stabilize, solutions to be pumped into the system and topurge the air from the pipework. Check for any leaks aroundthe pipe connections and rectify as necessary.
h) If the monitor exhibits good stability, i.e. ±2% of reading, carryout a calibration – see Programming Page.
i) Check the condition of the sample filter and replace it ifnecessary. Ensure that new filters are fitted correctly by takingnote of the flow directions indicated on the filter bodies.

7
4 LIQUID HANDLING SECTION
4.1 Principle of Operation – Fig. 4.1The monitor uses an ABB Ammonia Probe. This contains a glasspH electrode, whose pH-sensitive glass membrane forms aslightly convex tip, and a robust, long-life reference electrode.The two electrodes are combined into a single assembly, and areconnected as a pH measuring pair through an internal reservoir offilling solution containing ammonium ions.
The filling solution is 0.1 M ammonium chloride saturated withsilver chloride and is separated from the sample by a gas-permeable hydrophobic membrane fitted in the tip of the probe.Sample is caused to flow past the probe membrane, whereuponthe partial pressures of ammonia gas in the two solutions oneither side of the membrane equilibrate, transferring gas acrossthe membrane. At equilibrium, the concentration of ammonia inthe thin film of filling solution between the probe membrane andthe glass electrode membrane equals that in the sample. Theresultant change in pH value of the thin film is measured by the pHelectrode pair which thus develops an output potential related tothe ammonia concentration in the sample. Like most ion-selectiveelectrodes, the Ammonia Probe produces an output which islogarithmic with respect to concentration.
Range of measurement can be set to any two consecutivedecades of concentration between 0.05 to 1000 mg l–1 as N, NH3,or NH4
+.
Under typical circumstances, with appropriate standard solutionsand calibration frequencies, accuracies better than ±5% ofreading or 0.1 mg l–1 whichever is the greater, can be achieved.
Fig. 4.2 Flow Schematic
Fig. 4.1 Ammonia Probe
pHElectrode
ReferenceElement
FillingSolution
FillingSolutionAperture
Membrane
Washer
Body
BodySeal
Washer
Membrane
End Cap
SampleInlet
Three ChannelPeristaltic Pump
To Electronics Section
Drain viaConstantHead Unit
Heat ExchangerBlock
SampleHeater Coil
AmmoniaProbe
Sample / CalibrateSolenoid Valves
EDTAReagentSolutionOrangeChannel
StandardSolution 1
(Low)
ReactionCoils
Constant Head Unit
OrangeChannel
HeaterMat
StandardSolution 2
(High)
NaOHReagentSolution
RedChannel
RedChannel
SV1 SV2
OverflowDrain
ContaminatedDrain
Out of SampleFloat Switch
FromFlowcell
TemperatureSensor
Note. In applications in the power industrywhere hardness is very low, the firstreagent (EDTA) is not required.

8
4.2 General Operation – Fig. 4.2The sequence of events is:a) The sample enters the constant head unit from below and any
excess is allowed to overflow to drain.The constant head unit is fitted with a float switch to signal an‘Out of Sample’ condition. This switch is used by the monitorto initiate the ‘Out of Sample’ alarm.
b) From the constant head unit the sample is drawn through thenormally open ports of the solenoid valves SV1 and SV2 byone channel of the peristaltic pump.
c) The reagents are drawn through another channel of theperistaltic pump, and then mixed with the sample. The tubediameters are arranged so as to obtain the correct ratio ofsample and reagents.
d) The probe is housed in a temperature controlled block whichincludes a heat exchanger to remove the effects of sampleand ambient temperature variations. The probe produces anelectrical potential when exposed to the reacted samplewhich changes in proportion to changes in concentration ofthe ion being measured. The probe is connected to theelectronic section where, after digital conversion, the signal isprocessed by the microprocessor.
e) After measurement the sample flows to waste via thecontaminated drain connection.
f) During calibration the monitor introduces two calibrationsolutions sequentially in place of the sample by means of thesolenoid valves SV1 and SV2.
Fig. 5.1 Electrical Connections Layout
Flow CellHeater Block
HeaterControl
Microprocessor Unit User JunctionBox
Mains Supply 115 to 230 V
Concentration Alarm Relays
Calibration Mode Relay
Out of Service Relay
Current Outputs
Out of Sample Relay
ExternalUserConnections
ExternalSerialInterfaceConnections
ReferenceElectrode
Ion-SelectiveElectrode
Sample/CalibrateSoleniod Valves
InterconnectionCables
Out of SampleFloat Switch
Pump andStirrer Motors
Liquid HandlingSection
…4 LIQUID HANDLING SECTION 5 ELECTRONICS SECTION
5.1 Electronic Layout – Fig. 5.1The electronic section comprises two separate sections:
• The User Junction Box at the top right hand side.• The Microprocessor Unit at the top left hand side.
5.2 User Junction BoxThe User Junction Box contains the relays for the heater, solenoidvalves and alarms, and all the user external connection terminals,with the exception of the serial interface (if fitted).
Once installed there should be no need to remove the junctionbox cover on a regular basis. However, to assist in any faultfinding procedure, there are l.e.d's on the p.c.b. to indicate if therelays and heater are being energised.
Switches for the mains and pump/heater are situated on the righthand side of the junction box, together with a mains indicationlamp and mains fuse – see Fig. 2.3.
5.3 Microprocessor UnitThe Microprocessor Unit contains the analogue input processing,microprocessor, alarm and current output generation, and (iffitted) the serial interface output.
The programme controls, digital and dot-matrix displays, alarmindication and status l.e.d's are all mounted on the front panel ofthe microprocessor unit.

9
5.4 Front Panel Controls – Fig. 5.2The programme controls comprise eight tactile membraneswitches. These switches are situated behind a hinged doorbelow the display, access is via a screwdriver-operated catch. Innormal operation the switches are used to view the measured ionconcentration value, initiate a manual calibration, or to activatethe 'alarm hold' facility.
When programming, the switches are used to sequence througha programming procedure as detailed. The procedure is set out inprogramming pages for Input, Current Output, Alarms, Real TimeClock and Monitor Calibration. Each programme page containsthe programme functions, the values or parameters of which areprogrammable.
Switch functions are as follows:Used for viewing the fluoride concentration, electrodemV output, flowcell control temperature, sensor slope,date, time, the time to the next calibration and the timefrom the last calibration.
Used to enable or disable the automatic calibrations,enter the standard solution values and manuallyinitiate a calibration sequence. Operating ‘Cal’during a calibration aborts the sequence and returnsto normal operation.
Used to inhibit any change in the alarm relay/l.e.d.status and the start of any auto calibration. The featureis used during maintenance (‘Hold’ l.e.d. illuminated).
Note. If the ‘Hold’ facility is inadvertently leftswitched-in, it is automatically cancelled after aperiod of approximately 3 hours has elapsed.
Used for storing the programmed function parametersand values in the instrument’s nonvolatile memory.
Note. The instrument responds instantly to anyprogramme change but the new value is lost inthe event of a power interruption if it has not been‘Entered’.
Parameter Advance – used for selecting a particularparameter from a programme page.
Used for increasing or decreasing a parameter valueor stepping up or down through a selection ofparameters applicable to a particular function.
Note. Continued pressure on the ‘Raise’ or‘Lower’ switches causes the rate of change of thedisplayed value to increase. To make smalladjustments, operate the switches momentarily.
Page Advance – used, via the security code, forselection of individual programme pages.
5-digit Display(Concentration)
AlarmsHold Cal Fail1 2
HoldCal EnterMode
20-characterDot-Matrix Display
Alarm and StatusL.E.D.s
ConnectionsCover
Fig. 5.2 Location of Controls, Displays and L.E.D.s
Mode
Cal
Hold
Enter
5.5 Displays – Fig. 5.2Two blue vacuum fluorescent displays are provided:
a) The upper is a 5-digit 7-segment type display which indicatesthe measured variable.
b) The lower is a 20-character dot matrix type which providesuser information during setting up and in normal operation.
5.6 L.E.D. Indication – Fig. 5.2There are five l.e.d's (indicators situated between the twodisplays) which provide information on the current status of themonitor. From left to right the indicators are as follows:
Used to indicate a concentration alarm state (eitherhigh or low). This indicator is used in association withan external alarm relay output.
Used to indicate when the ‘Hold’ button has beenoperated.
Indicates when a calibration sequence is taking place.
Indicates when the monitor was unable to carry out asuccessful calibration.
A1 or A2
Hold
Cal
Fail
5 ELECTRONICS SECTION
10 6P
RO
GR
AM
MIN
G
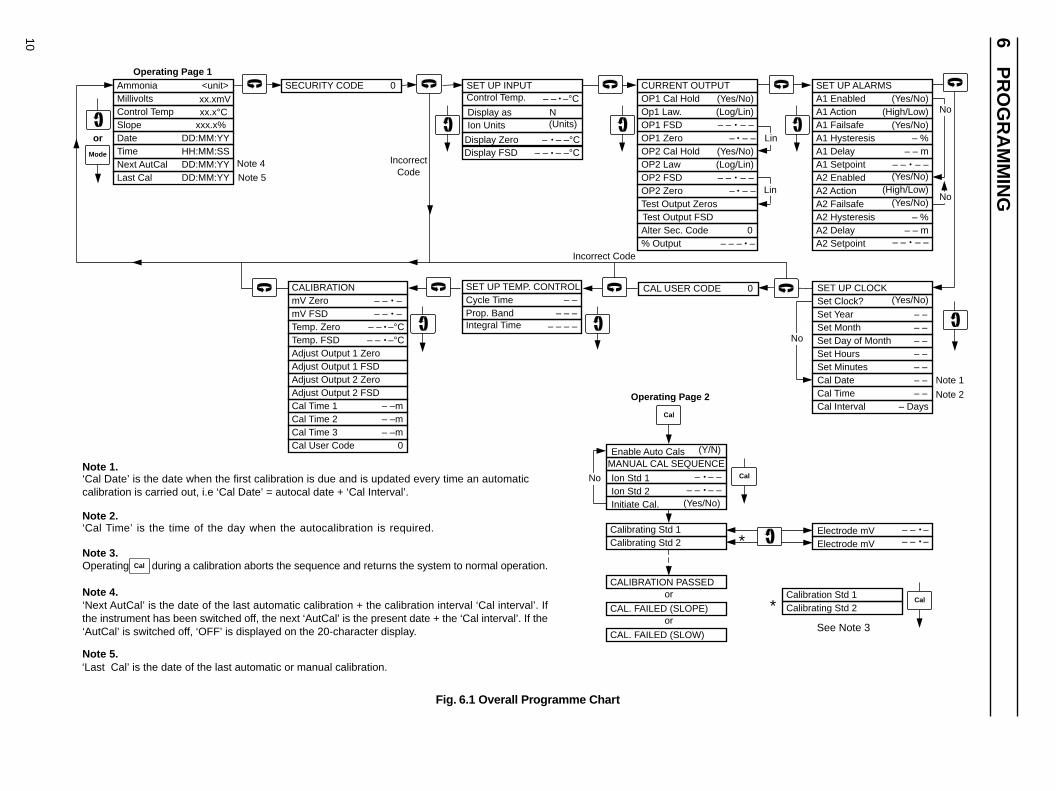
Fig. 6.1 Overall Programme Chart
Note 1.‘Cal Date’ is the date when the first calibration is due and is updated every time an automaticcalibration is carried out, i.e ‘Cal Date’ = autocal date + ‘Cal Interval’.
Note 2.‘Cal Time’ is the time of the day when the autocalibration is required.
Note 3.Operating during a calibration aborts the sequence and returns the system to normal operation.
‘Next AutCal’ is the date of the last automatic calibration + the calibration interval ‘Cal interval’. Ifthe instrument has been switched off, the next ‘AutCal’ is the present date + the ‘Cal interval’. If the‘AutCal’ is switched off, ‘OFF’ is displayed on the 20-character display.
Note 4.
‘Last Cal’ is the date of the last automatic or manual calibration.
Ammonia <unit>MillivoltsControl TempSlopeDateTimeNext AutCalLast Cal
SECURITY CODE 0 SET UP INPUTControl Temp.
Display as
SET UP TEMP. CONTROLCycle TimeProp. BandIntegral Time
CAL USER CODE 0
CURRENT OUTPUTOP1 Cal HoldOp1 Law.OP1 FSDOP1 ZeroOP2 Cal HoldOP2 LawOP2 FSDOP2 ZeroTest Output ZerosTest Output FSDAlter Sec. Code% Output
SET UP ALARMSA1 EnabledA1 ActionA1 FailsafeA1 HysteresisA1 DelayA1 SetpointA2 EnabledA2 ActionA2 FailsafeA2 HysteresisA2 DelayA2 Setpoint
SET UP CLOCKSet Clock?Set YearSet MonthSet Day of MonthSet HoursSet MinutesCal DateCal TimeCal Interval
CALIBRATIONmV ZeromV FSDTemp. ZeroTemp. FSDAdjust Output 1 ZeroAdjust Output 1 FSDAdjust Output 2 ZeroAdjust Output 2 FSDCal Time 1Cal Time 2Cal Time 3Cal User Code
or
Note 4
Note 5
Lin
Lin
No
IncorrectCode
Note 1
Note 2
Enable Auto CalsMANUAL CAL SEQUENCE
Ion Std 1Ion Std 2Initiate Cal.
Calibrating Std 1Calibrating Std 2
CALIBRATION PASSED
CAL. FAILED (SLOPE)
CAL. FAILED (SLOW)
Electrode mVElectrode mV
No
or
or
xx.x°C
DD:MM:YYHH:MM:SS
xxx.x%N
– – • –°C (Yes/No)(Log/Lin)
•
– • – –(Yes/No)(Log/Lin)
– • – –
0– – – • –
(Yes/No)
(Yes/No)(High/Low)
– %– – m
(Yes/No)
(Yes/No)
– – • – –
(High/Low)
– %– – m
(Yes/No)
– –– –– –– –– –
– –– –
– Days
(Y/N)
(Yes/No)
– –– – –
– – – –
– – • –
– – • –°C– – –°C
– –m– –m– –m
0
DD:MM:YYDD:MM:YY
No
No
Operating Page 1
Operating Page 2
Mode
Cal
– – – –•
– – – –
– – – –•
– – • –
•
– • – –– – – –•
– – –•
– – –•
Incorrect Code
Note 5.
Cal
xx.xmV
Calibration Std 1Calibrating Std 2
Cal
Cal
*
*See Note 3
Ion Units (Units)
– –°C•Display ZeroDisplay FSD – – – –°C•
–

11
6 PROGRAMMING…
6.1 Normal OperationIn normal operation (Operating Page 1) the lower, dot matrix,display gives indication of the units of measurement, millivoltvalue, sensor slope and time. Selection is made using the switch. Operation of the Cal switch gives access to a secondOperating Page (Operating Page 2) in which the standardsolution values can be set and a manual calibration can beinitiated. Either page can be selected at any time by using the Mode
or Cal switches.
6.2 Programming PagesOperation of the switch enables a series of 'programming'pages to be displayed. Unauthorised entries to this page areinhibited by a 5-digit security code which is displayed immediatelyafter the page header.
In the programming pages, displayed values indicated ‘xxxxx’ arefor viewing only and cannot be altered by the operator. Displayedvalues indicated ‘– – –’ can be altered using the and switches. When the desired reading is displayed, operate the Enter
switch. The l.e.d's flash momentarily, to indicate that the value hasbeen stored in the nonvolatile memory. Although the instrumentappears to operate satisfactorily, if the Enter switch is not operated,in the event of power interruption, the programmed values arelost. If previously programmed values are to be viewed only, it isunnecessary to operate the Enter switch.

12
…6 PROGRAMMING
6.2.1 Operating Page 1The values displayed in Operating Page 1 are for viewing only and cannot be altered in this page.
Ammonia <Unit>
Millivolts
Control Temp
Slope
Date
Time
Next AutCal
Last Cal
SECURITY CODE -----
or
xx•x°C
xxx •x%
or Mode
or Mode
or Mode
or Mode
or Mode
or Mode
or Mode
or Mode
xx•xmV
DD:MM:YY
HH:MM:SS
DD:MM:YY
DD:MM:YY
Measurement UnitsThe measurement units are displayed, e.g. Ammonia ppm.
Advance to next parameter.
Sensor OutputThe probe output is displayed in millivolts.
Advance to next parameter.
Control TemperatureThe heater block control temperature is displayed in degrees Celsius.
Advance to next parameter.
Slope Check ValueThe slope value should be between 80 and 110%. If the value is outside these limitscheck the electrode.
Advance to next parameter.
DateThe date is displayed.
Advance to next parameter.
TimeThe time is displayed.
Advance to next parameter.
Next Calibration DateThe date when the next automatic calibration is to be carried out is displayed. If theautomatic calibration is disabled, ‘OFF’ is displayed in place of the date.
Advance to next parameter.
Last Calibration DateThe date of the last automatic or manual calibration is displayed.
Return to top of Operating Page.
or
Advance to Security Page (Section 6.2.3).

13
6 PROGRAMMING…
6.2.2 Operating Page 2To gain access to the Calibration Page (Operating Page 2), operate the Cal switch.
Enable Automatic CalibrationsSelect ‘Yes’ to enable or ‘No’ to disable the automatic calibrations.
Store.
Advance to next parameter.
Page header.
Advance to next parameter.
Ion Standard 1Set the value of the ‘Low’ standard solution (Std 1).Low value ammonia standard solutions should be avoided. For example, atambient temperatures of about 25 °C, and under normal light conditions, a0.5 mg -1 NH3 solution is expected to lose at least 10% of its concentration over aseven day period. Because of the instability of such solutions, it is not possible toprogramme a standard solution of lower concentration than 0.2 mg l–1 NH3 on thismonitor. Solutions as low as 0.2 mg l–1 can be prepared with care, but must beused immediately, making it an unsuitable concentration for long term use with themonitor.
Store.
Advance to next parameter.
Ion Standard 2
Set the value of the ‘High’ standard solution (Std 2). The concentrations of the twostandard solutions must differ from each other by a factor of at least four.
Store.
Advance to next parameter.
Initiate Calibration (manual)Select ‘Yes’ to carry out a manual calibration or ‘No’ to return to the top of the page.
Enter must be pressed to initiate a manual calibration.
Calibrating Standard 1The upper display shows the ammonia concentration value. The display remainsuntil a stable output is obtained from the probe.
Toggle between the two displays.
Electrode Millivolts
Note. Pressing Cal during a calibration aborts the sequence and returns to
normal operation.
When a stable probe output is detected the display automatically advances to thenext parameter.
Continued on next page.
No
Enable Auto Cals Yes
No
MANUAL CAL SEQUENCE
Ion Std 1
or
Ion Std 2
or
Initiate Cal Yes
No
YesCalibrating Std 1
Electrode mV
– • – –
Enter
Cal
Cal
Enter
Cal
Enter
Cal
Enter
– – • – –
– – • –
or
or
Cal
14
…6 PROGRAMMING
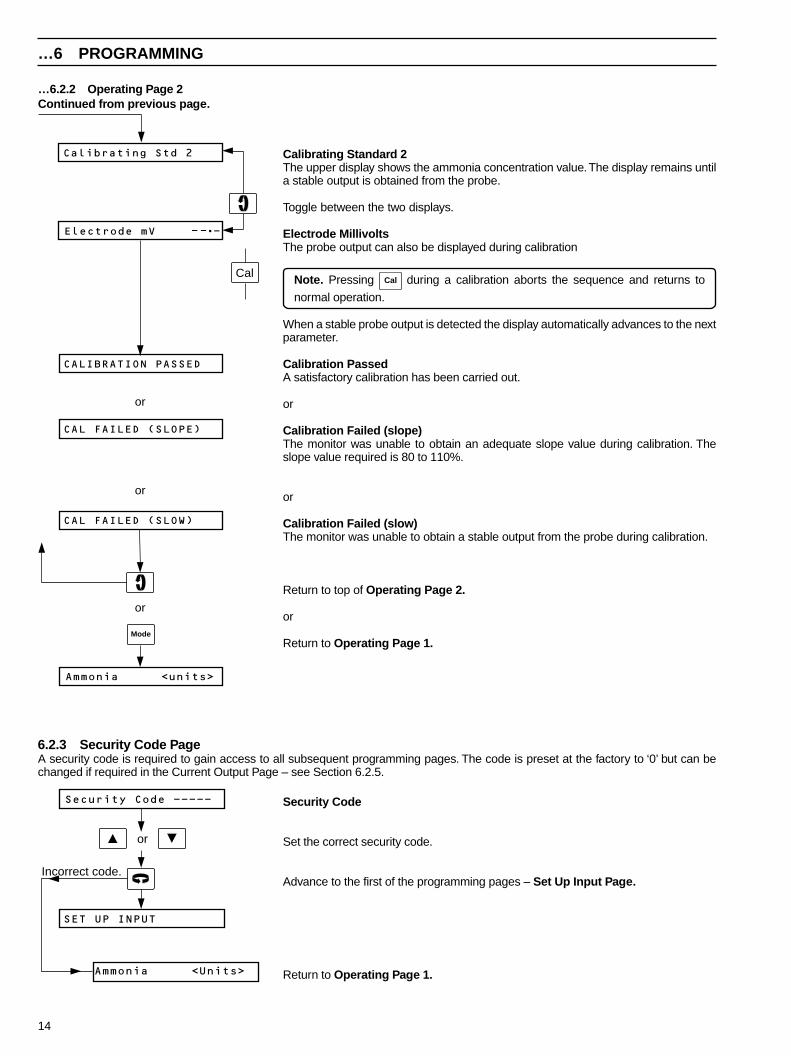
…6.2.2 Operating Page 2Continued from previous page.
6.2.3 Security Code PageA security code is required to gain access to all subsequent programming pages. The code is preset at the factory to ‘0’ but can bechanged if required in the Current Output Page – see Section 6.2.5.
Security Code
Set the correct security code.
Advance to the first of the programming pages – Set Up Input Page.
Return to Operating Page 1.
Incorrect code.
or
SET UP INPUT
Security Code -----
Ammonia <Units>
CALIBRATION PASSED
or
CAL FAILED (SLOPE)
or
CAL FAILED (SLOW)
or
Mode
Calibrating Std 2
Electrode mV – – • –
Cal
Ammonia <units>
Calibrating Standard 2The upper display shows the ammonia concentration value. The display remains untila stable output is obtained from the probe.
Toggle between the two displays.
Electrode MillivoltsThe probe output can also be displayed during calibration
Note. Pressing Cal during a calibration aborts the sequence and returns to
normal operation.
When a stable probe output is detected the display automatically advances to the nextparameter.
Calibration PassedA satisfactory calibration has been carried out.
or
Calibration Failed (slope)The monitor was unable to obtain an adequate slope value during calibration. Theslope value required is 80 to 110%.
or
Calibration Failed (slow)The monitor was unable to obtain a stable output from the probe during calibration.
Return to top of Operating Page 2.
or
Return to Operating Page 1.

15
6 PROGRAMMING…
6.2.4 Set Up Input Page
Page header.
Advance to next parameter.
Control Temperature
Set the required block control temperature within the range 5 to 45 °C in 0.1 °Cincrements.
Store.
Advance to next parameter.
Display Type (Ammonium, Ammonia or Nitrogen)Select display as ammonium (NH4
+), ammonia (NH3) or nitrogen (N).
Store.
Advance to next parameter.
Ion UnitsSelect the required display units for ammonia concentration.
Store.
Advance to next parameter.
Display Zero
Set the required value for display within the range 0.05 to 10.00.
Store.
Advance to next parameter.
Display Full ScaleThe full scale value is automatically set at two decades above Display Zero.
Example– If the setting is 1.0 the full scale is automatically set to 100.0.
Store.
Return to top of Set Up Input Page.
or
Advance to Current Output Page.
Enter
SET UP INPUT
Control Temp
or
Ion Units mg/kg
mg/l
ppm
°C
Enter
CURRENT OUTPUT
or
– – • –
Display Zero – – • –
Enter
Display FSD – – • –
Enter
Display as NH4?
N?
NH3?Enter
or
or

16
…6 PROGRAMMING
6.2.5 Current Output PageThe current output is assigned to the ammonia concentration but is only operative if the relevant output modules are fitted – see Fig. 2.4.
Log
Lin
CURRENT OUTPUT
OP1 FSD
OP1 Cal Hold
OP1 Law
OP1 Zero
Yes
No
or
Lin
Log
– – – • –
– • – –
or
or
Enter
Enter
Enter
or
Enter
Page header.
Advance to next parameter.
Output 1 Calibration HoldCurrent Output 1 can be held during calibration, if required. Select ‘YES’ or ‘NO’.
Store.
Advance to next parameter.
Output 1 LawCurrent Output 1 can be either logarithmic or linear. Select ‘Log’ or ‘Lin’.
Store.
Advance to next parameter.
Output 1 Full ScaleCurrent Output 1 full scale range: 0.5 to 1000 mg l–1 ammonia, i.e. minimum span is1 decade.
Set the required concentration value for Current Output 1 full scale.
Store.
Advance to next parameter.
Output 1 Zero
Set the required concentration value for Current Output 1 zero.
Note. If the output 1 Law is linear (Lin), this parameter is omitted and the zerocurrent output is automatically set to ‘0’.
Store.
Advance to next parameter.
Continued on next page.

17
6 PROGRAMMING…
Enter
Log
Lin
OP2 FSD
OP2 Cal Hold
OP2 Law
OP2 Zero
Yes
No
or
Lin
Log– • – –
or
or
Enter
Enter
or
Enter
– – – • –
Continued from previous page.
Output 2 Calibration HoldCurrent Output 2 can be held during calibration, if required. Select ‘YES’ or ‘NO’.
Store.
Advance to next parameter.
Output 2 LawCurrent Output 2 can be either logarithmic or linear. Select ‘Log’ or ‘Lin’.
Store.
Advance to next parameter.
Output 2 Full ScaleCurrent Output 2 full scale range: 0.5 to 1000 mg l–1 ammonia, i.e. minimum span is1 decade.
Set the required concentration value for Current Output 2 full scale.
Store.
Advance to next parameter.
Output 2 Zero
Set the required concentration value for Current Output 2 zero.
Note. If the Output 2 Law is linear (Lin), this parameter is omitted and the zerocurrent output is automatically set to ‘0’.
Store.
Advance to next parameter.
Continued on next page.
18
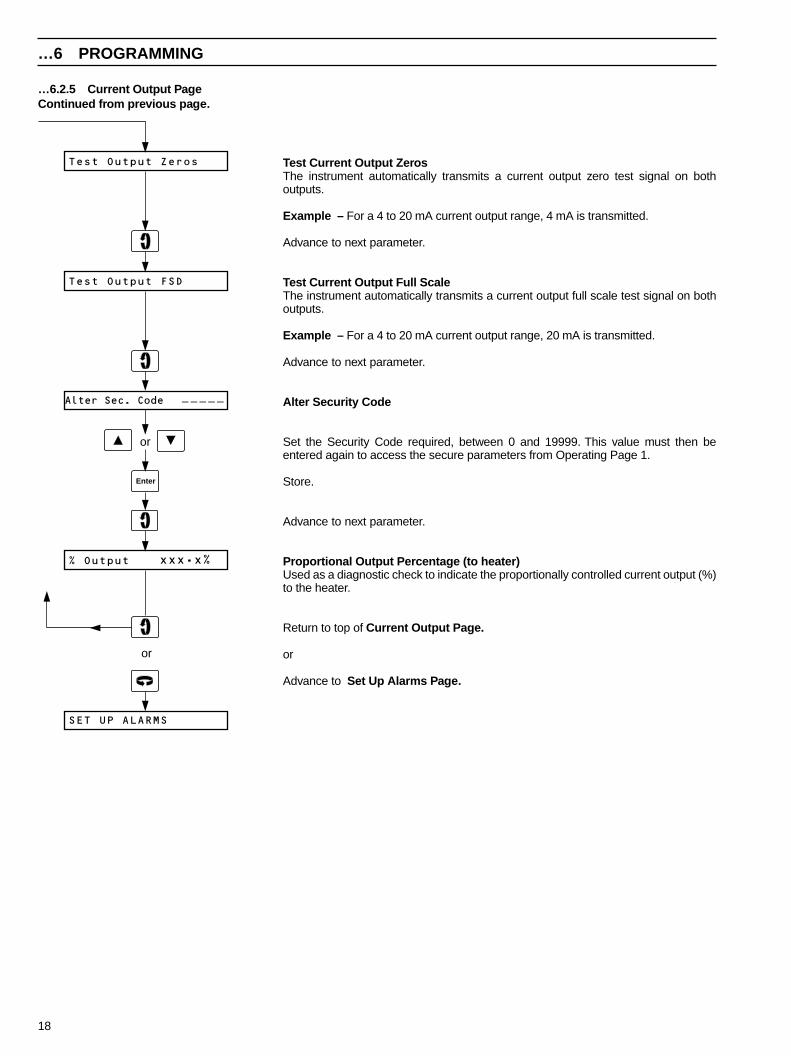
…6 PROGRAMMING
…6.2.5 Current Output PageContinued from previous page.
Enter
Alter Sec. Code – – – – –
Test Output Zeros
Test Output FSD
% Output
or
SET UP ALARMS
or
xxx•x%
Test Current Output ZerosThe instrument automatically transmits a current output zero test signal on bothoutputs.
Example – For a 4 to 20 mA current output range, 4 mA is transmitted.
Advance to next parameter.
Test Current Output Full ScaleThe instrument automatically transmits a current output full scale test signal on bothoutputs.
Example – For a 4 to 20 mA current output range, 20 mA is transmitted.
Advance to next parameter.
Alter Security Code
Set the Security Code required, between 0 and 19999. This value must then beentered again to access the secure parameters from Operating Page 1.
Store.
Advance to next parameter.
Proportional Output Percentage (to heater)Used as a diagnostic check to indicate the proportionally controlled current output (%)to the heater.
Return to top of Current Output Page.
or
Advance to Set Up Alarms Page.

19
6 PROGRAMMING…
6.2.6 Set Up Alarms PageAlarm l.e.d. indication and relay output can be assigned either to the ammonia concentration or switched off.
Enter
Yes
No
High
Low
SET UP ALARMS
A1 Failsafe
A1 Enabled
A1 Action
A1 Hysteresis –%
Yes
No
A1 Delay – –m
(a)
(b)
Yes
No
or
or
Enter
or
Enter
Enter
or
or
Enter
Page header.
Advance to next parameter.
Alarm A1 EnableSelect ‘YES’ to enable or ‘NO’ to disable.
Store.
Advance to next parameter.
Alarm A1 ActionSelect the alarm action required, ‘High’ or ‘Low’ – see Table 6.1.
Store.
Advance to next parameter.
Alarm A1 FailsafeIf failsafe action is required select ‘Yes’, otherwise select ‘No’ – see Table 6.1.
Store.
Advance to next parameter.
Alarm A1 HysteresisA differential set point can be set as a percentage of the set point value. The differentialsetting operates about the set point.
Example – A 5% differential setting operates 2.5% above and below the setpoint.
Select the differential required, between 0 and 5% in 1 % increments.
Store.
Advance to next parameter.
Alarm A1 DelayIf required, relay actuation and alarm l.e.d. indication can be delayed in the event of analarm condition. If the alarm condition clears within the programmed delay time, thealarm function is not activated and the delay time is reset.
Set the required delay time between 0 and 60 minutes in 1 minute increments.
Store.
Advance to next parameter.
Continued on next page.

20
…6 PROGRAMMING
…6.2.6 Set Up Alarms PageContinued from Previous page.
Enter
Yes
No
A1 Setpoint
or
A2 Enabled
or
A2 Setpoint
SET UP CLOCK
or
– – – • –
(a)(b)
or
Enter
– – – • – A1 Setpoint
Set the required setpoint value.
Store.
Advance to next parameter.
A2 EnabledRepeat the programming procedures as for Alarm Relay 1.
A2 Setpoint
Set the required set point value.
Store.
Return to top of Set Up Alarms Page.
or
Advance to Set Up Clock Page.
Table 6.1 Relay Action and Alarm Indication
noitcA efasliaF eulaVderusaeM sutatSyaleR noitacidnI.D.E.L
hgiH SEY tniopteSevobA
tniopteSwoleB
desigrene-eD
desigrenE
gnihsalF
ffO
hgiH ON tniopteSevobA
tniopteSwoleB
desigrenE
desigrene-eD
gnihsalF
ffO
woL SEY tniopteSevobA
tniopteSwoleB
desigrenE
desigrene-eD
ffO
gnihsalF
woL ON tniopteSevobA
tniopteSwoleB
desigrene-eD
desigrenE
ffO
gnihsalF
21
6 PROGRAMMING…
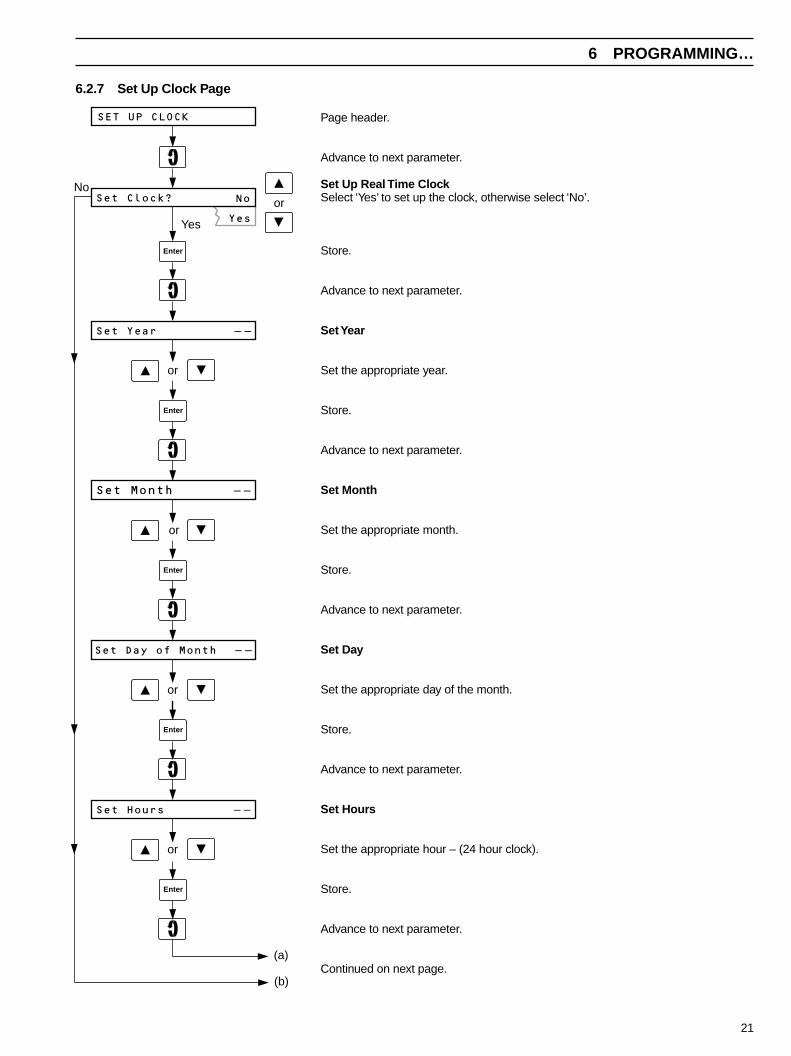
6.2.7 Set Up Clock Page
– –
SET UP CLOCK
orSet Clock?
Set Year
Yes
No
– –Set Month
Set Day of Month – –
or
Set Hours – –
(a)
(b)
Yes
No
or
Enter
Enter
Enter
Enter
or
Enter
or
Page header.
Advance to next parameter.
Set Up Real Time ClockSelect ‘Yes’ to set up the clock, otherwise select ‘No’.
Store.
Advance to next parameter.
Set Year
Set the appropriate year.
Store.
Advance to next parameter.
Set Month
Set the appropriate month.
Store.
Advance to next parameter.
Set Day
Set the appropriate day of the month.
Store.
Advance to next parameter.
Set Hours
Set the appropriate hour – (24 hour clock).
Store.
Advance to next parameter.
Continued on next page.
22
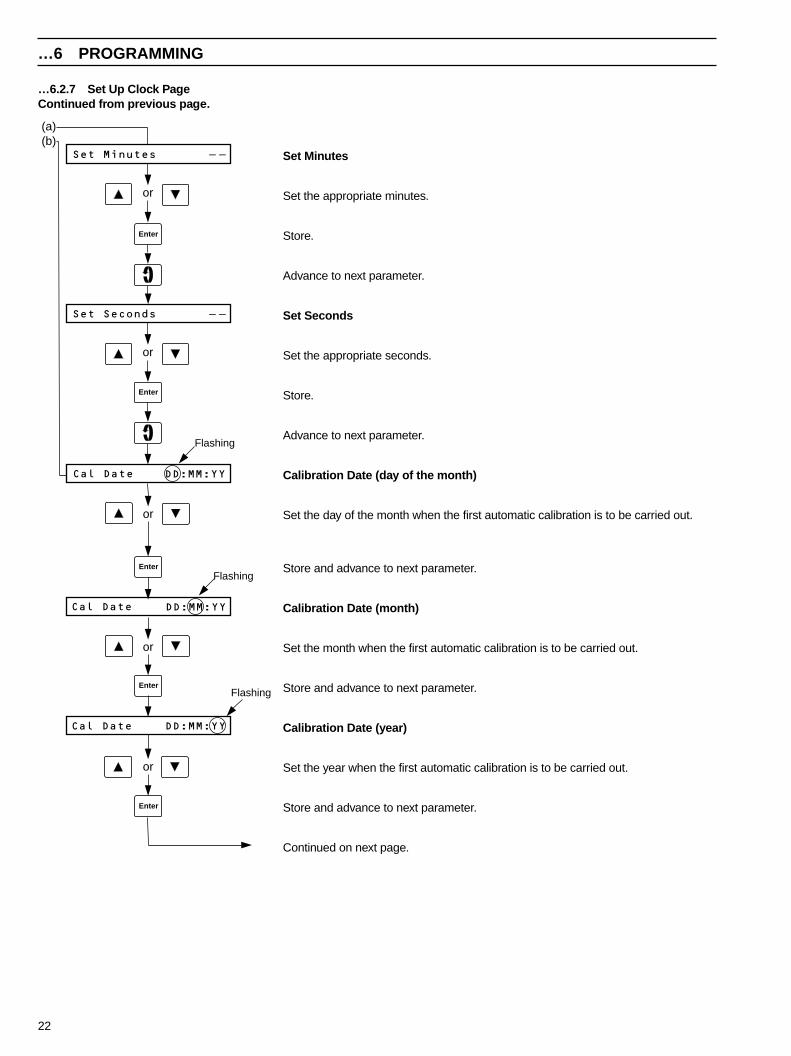
…6 PROGRAMMING
…6.2.7 Set Up Clock PageContinued from previous page.
Cal Date
Cal Date
Cal Date
Set Minutes – –
or
(a)(b)
Flashing
Flashing
Flashing
Enter
or
Enter
or
Enter
or
Enter
Set Seconds – –
or
Enter
DD:MM:YY
DD:MM:YY
DD:MM:YY
Set Minutes
Set the appropriate minutes.
Store.
Advance to next parameter.
Set Seconds
Set the appropriate seconds.
Store.
Advance to next parameter.
Calibration Date (day of the month)
Set the day of the month when the first automatic calibration is to be carried out.
Store and advance to next parameter.
Calibration Date (month)
Set the month when the first automatic calibration is to be carried out.
Store and advance to next parameter.
Calibration Date (year)
Set the year when the first automatic calibration is to be carried out.
Store and advance to next parameter.
Continued on next page.
23
6 PROGRAMMING…
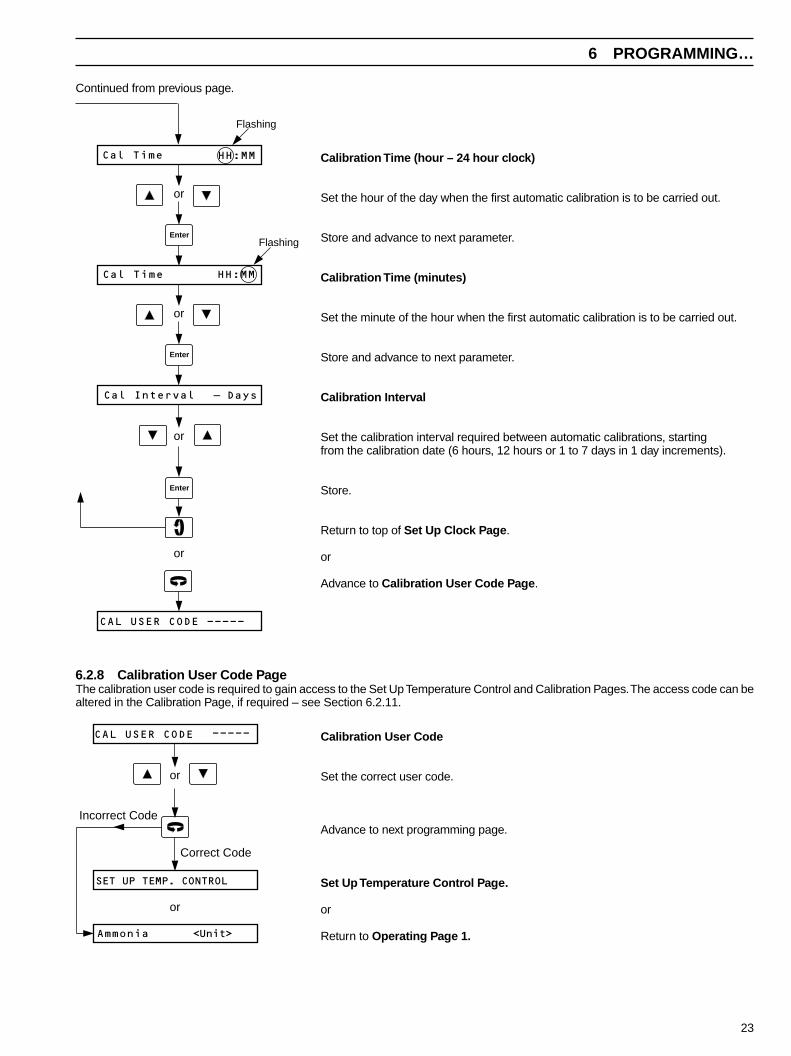
Continued from previous page.
Cal Time
Cal Time
Flashing
Flashing
or
Enter
or
Enter
Enter
CAL USER CODE -----
or
Cal Interval – Days
or
HH:MM
HH:MM
Calibration Time (hour – 24 hour clock)
Set the hour of the day when the first automatic calibration is to be carried out.
Store and advance to next parameter.
Calibration Time (minutes)
Set the minute of the hour when the first automatic calibration is to be carried out.
Store and advance to next parameter.
Calibration Interval
Set the calibration interval required between automatic calibrations, startingfrom the calibration date (6 hours, 12 hours or 1 to 7 days in 1 day increments).
Store.
Return to top of Set Up Clock Page.
or
Advance to Calibration User Code Page.
6.2.8 Calibration User Code PageThe calibration user code is required to gain access to the Set Up Temperature Control and Calibration Pages. The access code can bealtered in the Calibration Page, if required – see Section 6.2.11.
CAL USER CODE
or
-----
SET UP TEMP. CONTROL
Correct Code
or
Ammonia <Unit>
Incorrect Code
Calibration User Code
Set the correct user code.
Advance to next programming page.
Set Up Temperature Control Page.
or
Return to Operating Page 1.
24
…6 PROGRAMMING
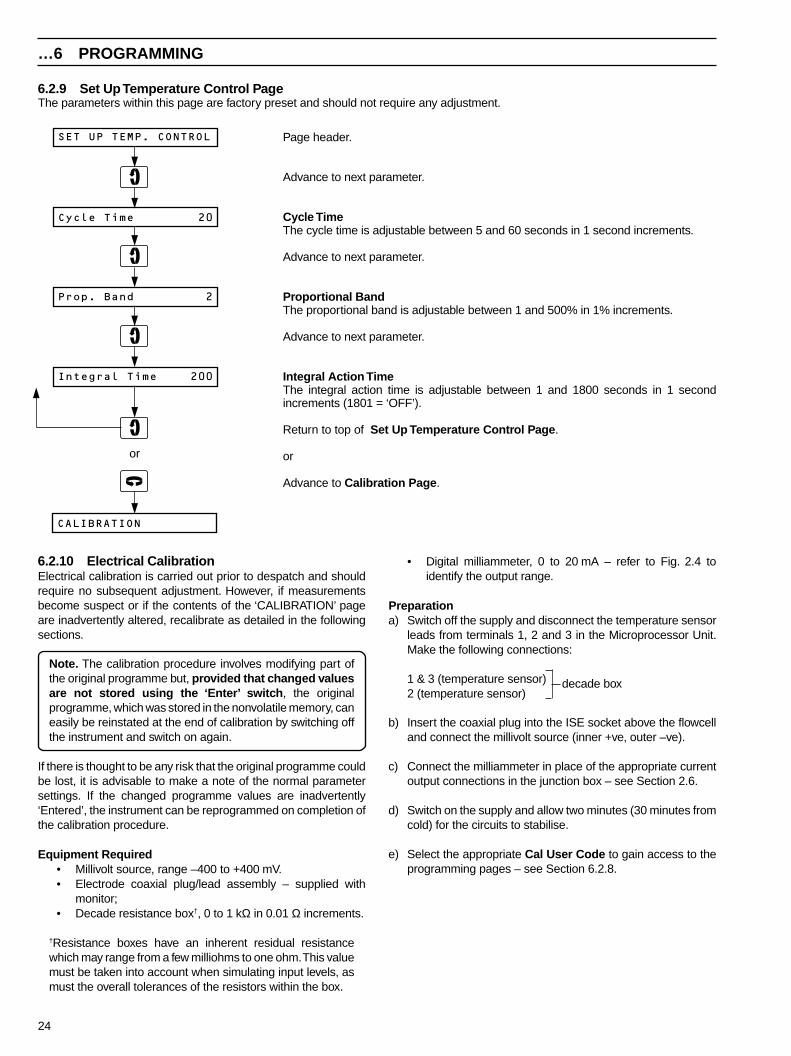
6.2.9 Set Up Temperature Control PageThe parameters within this page are factory preset and should not require any adjustment.
200
2
SET UP TEMP. CONTROL
Integral Time
Cycle Time
Prop. Band
20
CALIBRATION
or
6.2.10 Electrical CalibrationElectrical calibration is carried out prior to despatch and shouldrequire no subsequent adjustment. However, if measurementsbecome suspect or if the contents of the ‘CALIBRATION’ pageare inadvertently altered, recalibrate as detailed in the followingsections.
Note. The calibration procedure involves modifying part ofthe original programme but, provided that changed valuesare not stored using the ‘Enter’ switch, the originalprogramme, which was stored in the nonvolatile memory, caneasily be reinstated at the end of calibration by switching offthe instrument and switch on again.
If there is thought to be any risk that the original programme couldbe lost, it is advisable to make a note of the normal parametersettings. If the changed programme values are inadvertently‘Entered’, the instrument can be reprogrammed on completion ofthe calibration procedure.
Equipment Required• Millivolt source, range –400 to +400 mV.• Electrode coaxial plug/lead assembly – supplied with
monitor;• Decade resistance box†, 0 to 1 kΩ in 0.01 Ω increments.
†Resistance boxes have an inherent residual resistancewhich may range from a few milliohms to one ohm. This valuemust be taken into account when simulating input levels, asmust the overall tolerances of the resistors within the box.
• Digital milliammeter, 0 to 20 mA – refer to Fig. 2.4 toidentify the output range.
Preparationa) Switch off the supply and disconnect the temperature sensor
leads from terminals 1, 2 and 3 in the Microprocessor Unit.Make the following connections:
1 & 3 (temperature sensor)2 (temperature sensor)
Page header.
Advance to next parameter.
Cycle TimeThe cycle time is adjustable between 5 and 60 seconds in 1 second increments.
Advance to next parameter.
Proportional BandThe proportional band is adjustable between 1 and 500% in 1% increments.
Advance to next parameter.
Integral Action TimeThe integral action time is adjustable between 1 and 1800 seconds in 1 secondincrements (1801 = ‘OFF’).
Return to top of Set Up Temperature Control Page.
or
Advance to Calibration Page.
decade box
b) Insert the coaxial plug into the ISE socket above the flowcelland connect the millivolt source (inner +ve, outer –ve).
c) Connect the milliammeter in place of the appropriate currentoutput connections in the junction box – see Section 2.6.
d) Switch on the supply and allow two minutes (30 minutes fromcold) for the circuits to stabilise.
e) Select the appropriate Cal User Code to gain access to theprogramming pages – see Section 6.2.8.
25
6 PROGRAMMING…
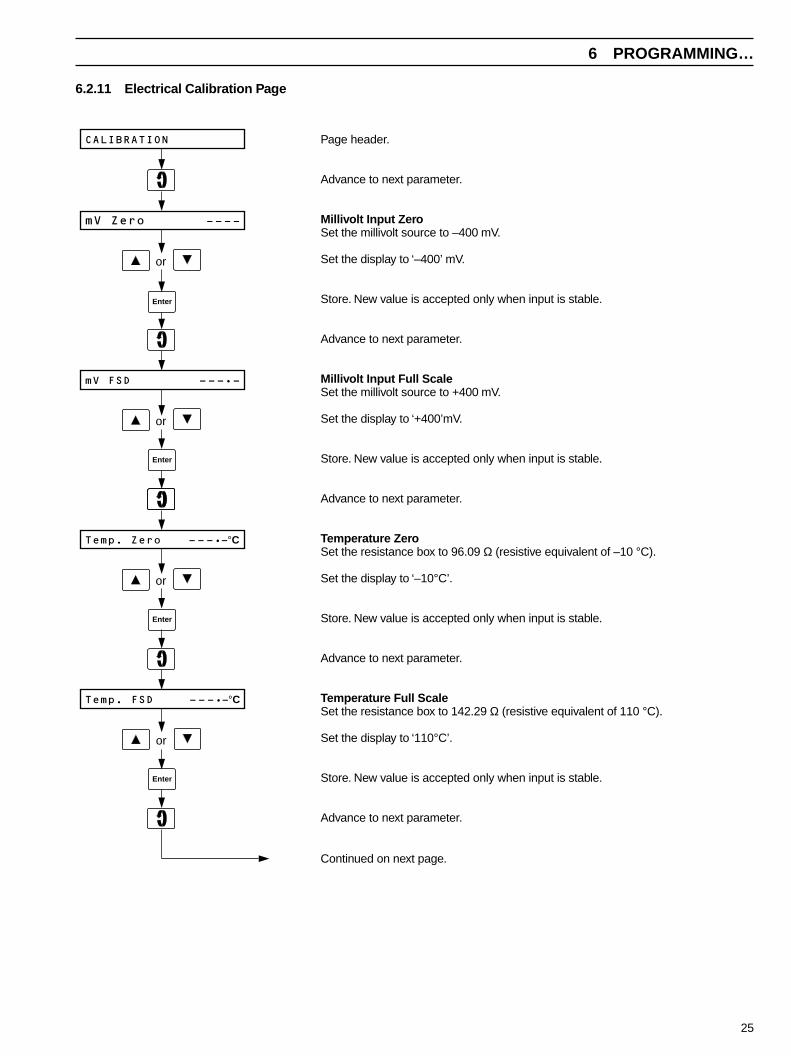
6.2.11 Electrical Calibration Page
Enter
CALIBRATION
Temp. Zero
mV Zero
mV FSD
Temp. FSD
– – – –
– – – • –
– – – • –°C
– – – • –°C
or
or
Enter
or
Enter
or
Enter
Page header.
Advance to next parameter.
Millivolt Input ZeroSet the millivolt source to –400 mV.
Set the display to ‘–400’ mV.
Store. New value is accepted only when input is stable.
Advance to next parameter.
Millivolt Input Full ScaleSet the millivolt source to +400 mV.
Set the display to ‘+400’mV.
Store. New value is accepted only when input is stable.
Advance to next parameter.
Temperature ZeroSet the resistance box to 96.09 Ω (resistive equivalent of –10 °C).
Set the display to ‘–10°C’.
Store. New value is accepted only when input is stable.
Advance to next parameter.
Temperature Full ScaleSet the resistance box to 142.29 Ω (resistive equivalent of 110 °C).
Set the display to ‘110°C’.
Store. New value is accepted only when input is stable.
Advance to next parameter.
Continued on next page.

26
…6 PROGRAMMING
…6.2.11 Electrical Calibration PageContinued from previous page.
Adjust Output 1 Zero
Adjust Output 1 FSD
Adjust Output 2
Adjust Output 2 FSD
Enter
or
Enter
or
Enter
or
Enter
or
zero
Adjust Current Output 1 ZeroThe monitor transmits a zero signal, e.g. for a 4 to 20 mA output range, 4 mA istransmitted.
Set the milliammeter reading to the current output 1 zero level, i.e. 0 mA (zero-basedranges) or 4 mA (4 to 20 mA range).
Store.
Advance to next parameter.
Adjust Current Output 1 Full ScaleThe monitor transmits a span signal, e.g. for a 4 to 20 mA output range, 20 mA istransmitted.
Set the milliammeter reading to the current output 1 full scale level, i.e. 1 mA, 10 mA or20 mA as applicable.
Store.
Advance to next parameter.
Adjust Current Output 2 ZeroThe monitor transmits a zero signal, e.g. for a 4 to 20 mA output range, 4 mA istransmitted.
Set the milliammeter reading to the current output 2 zero level, i.e. 0 mA (zero-basedranges) or 4 mA (4 to 20 mA range).
Store.
Advance to next parameter.
Adjust Current Output 2 Full ScaleThe monitor transmits a span signal, e.g. for a 4 to 20 mA output range, 20 mA istransmitted.
Set the milliammeter reading to the current output 2 full scale level, i.e. 1 mA, 10 mA or20 mA as applicable.
Store.
Advance to next parameter.
Continued on next page.
27
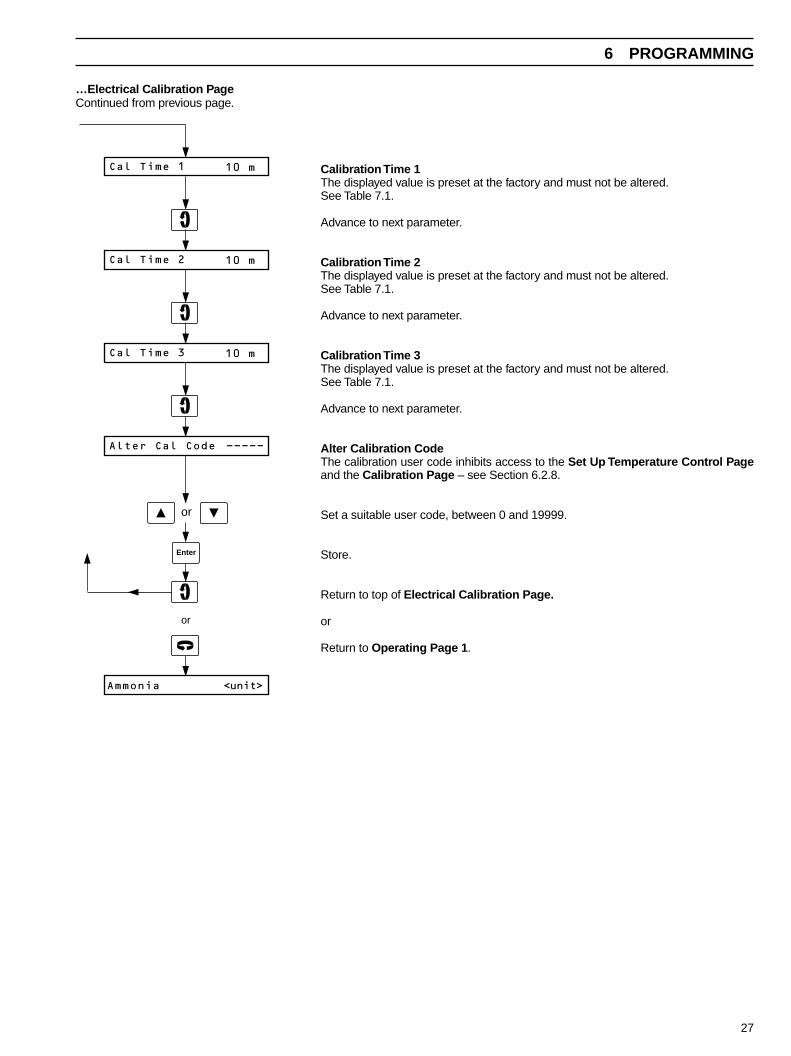
6 PROGRAMMING
…Electrical Calibration PageContinued from previous page.
Calibration Time 1The displayed value is preset at the factory and must not be altered.See Table 7.1.
Advance to next parameter.
Calibration Time 2The displayed value is preset at the factory and must not be altered.See Table 7.1.
Advance to next parameter.
Calibration Time 3The displayed value is preset at the factory and must not be altered.See Table 7.1.
Advance to next parameter.
Alter Calibration CodeThe calibration user code inhibits access to the Set Up Temperature Control Pageand the Calibration Page – see Section 6.2.8.
Set a suitable user code, between 0 and 19999.
Store.
Return to top of Electrical Calibration Page.
or
Return to Operating Page 1.
Enter
Cal Time 1 10 m
Cal Time 2
Cal Time 3
Ammonia <unit>
or
or
Alter Cal Code -----
10 m
10 m
28
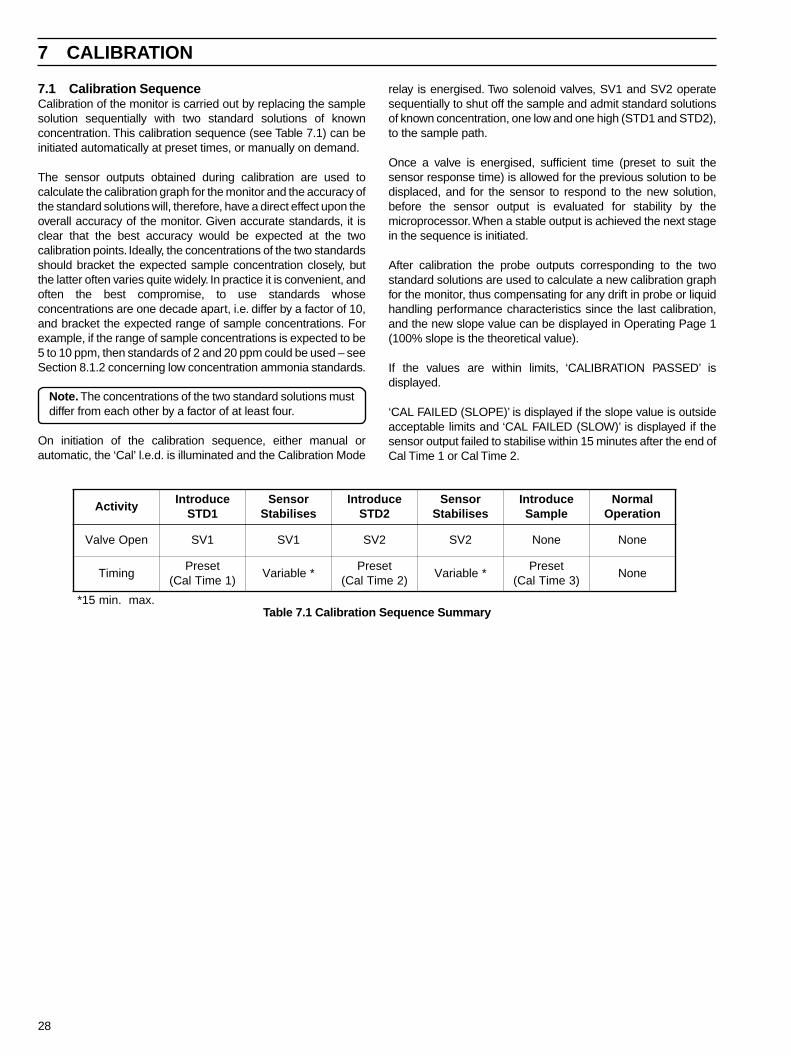
7.1 Calibration SequenceCalibration of the monitor is carried out by replacing the samplesolution sequentially with two standard solutions of knownconcentration. This calibration sequence (see Table 7.1) can beinitiated automatically at preset times, or manually on demand.
The sensor outputs obtained during calibration are used tocalculate the calibration graph for the monitor and the accuracy ofthe standard solutions will, therefore, have a direct effect upon theoverall accuracy of the monitor. Given accurate standards, it isclear that the best accuracy would be expected at the twocalibration points. Ideally, the concentrations of the two standardsshould bracket the expected sample concentration closely, butthe latter often varies quite widely. In practice it is convenient, andoften the best compromise, to use standards whoseconcentrations are one decade apart, i.e. differ by a factor of 10,and bracket the expected range of sample concentrations. Forexample, if the range of sample concentrations is expected to be5 to 10 ppm, then standards of 2 and 20 ppm could be used – seeSection 8.1.2 concerning low concentration ammonia standards.
Note. The concentrations of the two standard solutions mustdiffer from each other by a factor of at least four.
On initiation of the calibration sequence, either manual orautomatic, the ‘Cal’ l.e.d. is illuminated and the Calibration Mode
relay is energised. Two solenoid valves, SV1 and SV2 operatesequentially to shut off the sample and admit standard solutionsof known concentration, one low and one high (STD1 and STD2),to the sample path.
Once a valve is energised, sufficient time (preset to suit thesensor response time) is allowed for the previous solution to bedisplaced, and for the sensor to respond to the new solution,before the sensor output is evaluated for stability by themicroprocessor. When a stable output is achieved the next stagein the sequence is initiated.
After calibration the probe outputs corresponding to the twostandard solutions are used to calculate a new calibration graphfor the monitor, thus compensating for any drift in probe or liquidhandling performance characteristics since the last calibration,and the new slope value can be displayed in Operating Page 1(100% slope is the theoretical value).
If the values are within limits, ‘CALIBRATION PASSED’ isdisplayed.
‘CAL FAILED (SLOPE)’ is displayed if the slope value is outsideacceptable limits and ‘CAL FAILED (SLOW)’ is displayed if thesensor output failed to stabilise within 15 minutes after the end ofCal Time 1 or Cal Time 2.
7 CALIBRATION
Table 7.1 Calibration Sequence Summary
ytivitcAecudortnI
1DTSrosneSsesilibatS
ecudortnI2DTS
rosneSsesilibatS
ecudortnIelpmaS
lamroNnoitarepO
nepOevlaV 1VS 1VS 2VS 2VS enoN enoN
gnimiTteserP
)1emiTlaC(*elbairaV
teserP)2emiTlaC(
*elbairaVteserP
)3emiTlaC(enoN
.xam.nim51*

29
8.1 ChemistryNeither ammonium ion content nor total ammonia can bemeasured directly in an untreated sample, since the probe canrespond only to free ammonia gas. The ammonium ions musttherefore be converted to free ammonia by adjusting the pH of thesample solution to a value greater than 11. This is effected byaddition of a sodium hydroxide solution to the sample before it ispresented to the probe. This reagent also has a second function,i.e., to fix the total concentration of dissolved species in the finalsolution at approximately 0.2M.
In water industry applications a water softener, EDTA, is addedprior to the sodium hydroxide addition. Besides preventinghardness precipitation, this also overcomes inaccuracies causedby complexing of ammonia with some metal ions. In powerapplications where the hardness levels are very low this secondreagent is not required, so the bottle tube, pump tube and firstreaction coil can be removed.
The reagent and standard solutions described below are requiredto maintain the monitor in operation. Where possible, they shouldbe freshly made and stored in plastic (e.g. polythene) bottles.Typical reagent solution consumption for a continuouslyoperating monitor is approximately 10 litres per month. Themonitor uses 50 to 80 ml of each standard solution eachcalibration cycle; consumption of the standard solution, alsodepends on the frequency with which this cycle is carried out.
8.1.1 Reagent SolutionsTwo reagent solutions are used in the ammonia monitor. Caremust be exercised to ensure that the correct reagent is fed intoeach channel. They are prepared as follows:
Reagent 1 – Orange ChannelDissolve 315 (±5) g laboratory reagent grade di-sodium EDTA inapproximately 8 litres of high purity water and make up to 10 litreswith more high purity water.
Note. If the monitor is to be used on power plant applicationsthe reagent will not be required due to the insignificantconcentration of hardness in the sample.
Reagent 2 – Red ChannelDissolve 680 (±10) g analytical reagent grade sodium hydroxide(NaOH) in approximately 8 litres of high purity water. Allow thesolution to cool and then make up to ten litres with more highpurity water.
Warning. This solution is caustic; avoid contact with the skinand eyes. If contact occurs, wash with plenty of clean water.
8 MAINTENANCE
8.1.2 Standard SolutionsTwo standard solutions of known concentration appropriate to themeasuring range are required for calibration of the monitor. Toprepare a stock solution of 1000 mg l–1 follow instructions below:
a) Ammonia as N – Dissolve 3.821 (±0.001) g analyticalreagent grade ammonium chloride (NH4Cl) (dried) inapproximately 200 ml of high purity water.
Ammonia as NH3 – Dissolve 3.147 (±0.001) g analyticalreagent grade ammonium chloride (NH4Cl) (dried) inapproximately 200 ml of high purity water.
Ammonia as NH4+ – Dissolve 2.972 (±0.001) g analytical
reagent grade ammonium chloride (NH4Cl) (dried) inapproximately 200 ml of high purity water.
b) Transfer the solution to a one litre volumetric flask and makeup to the mark with more high purity water.
c) Dilute the appropriate stock solution with more high puritywater to make the two standard solutions for the measuringrange of the monitor. Store in plastic bottles.
Note. Low value ammonia standard solutions should beavoided. For example, at ambient temperatures of about 25°C, and under normal light conditions, a 0.5 mg -1 NH3
solution is expected to lose at least 10% of its concentrationover a seven day period. Because of the instability of suchsolutions, it is not possible to programme a standard solutionof lower concentration than 0.2 mg l–1 NH3 on this monitor.Solutions as low as 0.2 mg l–1 can be prepared with care, butmust be used immediately, making it an unsuitableconcentration for long term use with the monitor.
Note. The mass relationship of ammonium (NH4+) to
ammonia (NH3) is 18/17 and ammonia (NH3) to nitrogen (N)is 17/14.
8.2 Scheduled ServicingThe following servicing schedule has been produced as a generalguide only. Because the monitor has been designed for a verywide range of applications, where the nature of the sample canvary considerably, it may be necessary to amend the schedule tosuit the particular installation and sample conditions.
8.2.1 Regular Visual ChecksIt is recommended that the monitor and the sampling system isvisually inspected on a regular basis to assure correct functioningof the system and to check the integrity of the readings.a) Check for leaks, particularly around the sample and drain
pipework connections.
b) Confirm sample flow by checking delivery to the constanthead unit and effluent from the drain.
c) Check liquid flow over the probe membrane.
d) Check liquid levels in the reagent and standard solutioncontainers.

30
e) Check for malfunction indications on the instrument display.
Note. The mains and pump/heater switches are situated onthe right hand side of the User Junction Box.
8.2.2 Four Weeklya) Inspect all tubing and flowcell for leaks or deterioration, and
for signs of accumulation of solid deposits.
b) Clean monitor pipework if there are signs of algae visible.
c) Check the level of the filling solution in the probe and top-up ifnecessary.
d) Discard old reagent and standard solutions. Clean containersthoroughly before refilling with fresh solutions – see Section8.1.
Note. It is vital that the containers are not topped up.
e) Examine the sample input pipe for leaks and deterioration.
f) Ensure the drain is in good order and free from obstruction.
8.2.3 Two MonthlyRefurbish the probe – see Section 8.2.7.
8.2.4 Twelve Monthlya) Service pump, tubing and capstans – see Section 8.2.8.
b) Replace all internal plumbing tubing – see Section 8.2.9.
c) Carry out the normal 4 weekly schedule not already coveredabove.
8.2.5 Cleaning Sample PipeworkA common problem in measuring water samples from rivers,treatment works, etc., is the presence of bacteriological growth inthe sample.
In the form of algae it creates a problem by growing inside tubingsupplying sample to analysers, as well as in the monitors andassociated ABB Kent-Taylor Ultrafilters, if used. If severe, thisgrowth may cause blockages in tubing or valves and/or fouling offlowcells and sensors.
In addition, the algae may affect the concentration of themeasured parameter in the sample. This is particularly severe inammonia monitors, where algal growth in supply lines causes‘ammonia stripping’ and a reduction in the measuredconcentration. Other parameters, however, may also be affected.
It is therefore essential to maintain sterile conditions. Thisrequires periodic cleaning, at a frequency dependent on sampleconditions. It is suggested that a regular maintenanceprogramme is introduced, rather than wait for visible signs of thepresence of algal growth.
Note. Once growth is visible the problem is already serious.
…8 MAINTENANCE
The recommended agent for cleaning tubing and pipework issodium hypochlorite solution containing about 0.1% (1000 mg l–1)available chlorine.
Cleaning SolutionTo prepare 500 ml of cleaning solution, dilute 5 ml ofconcentrated sodium hypochlorite (NaOCl) solution (containingapproximately 10% available chlorine) with de-ionised water andmake up to 500 ml with more de-ionised water.
Note. The solution is unstable. Make only enough forimmediate requirements and discard any surplus after use.
Warning. Sodium hypochrorite is an irritant. Contact withacids liberates toxic gas. Avoid contact with skin and eyes. Ifcontact occurs, wash with plenty of clean water.
MethodWhere an Ultrafilter is used, clean according to the manual with a0.05% (500 mg l–1) chlorine solution (i.e. half the concentration ofthe above solution). Tubing between the Ultrafilter and theanalyser should also be flushed through, along with the constanthead tank.
a) Remove sensors for short-term storage before cleaning – seeSection 8.3.1
b) Remove the reagent and calibration solution take-up tubesfrom their respective containers. Fill a calibration containerwith the sodium hypochlorite cleaning solution, place it in thecalibration container recess and immerse the take-up tubes inthe solution.
c) Operate ‘Cal’ to initiate a calibration sequence to draw thesolution through the solenoid valves tubing and flowcell.
d) Remove any dislodged debris from the flowcell and clean theconstant-head unit with the cleaning solution using the bottlebrush provided. The tube between the constant-head unit andSV1 can be cleaned with the cleaning solution using thesyringe.
e) Repeat the process using high purity water to flush out thesodium hypochlorite solution.
If, after cleaning, there are still signs of discoloration or deposits inthe monitor tubing, it should be discarded and replaced with newtubing throughout. In cases where the monitor tubing is blockedor very heavy deposits are found, it may be necessary to simplyreplace the tubing without attempting to clean it.
Cleaning Solution ContainersGreat care should be taken to ensure that reagent and standardsolution containers are thoroughly cleaned whenever theircontents are changed, as algal growth can also occur in them.Under normal circumstances thorough rinsing of the containerswith high purity water may be adequate. However, if there is anyevidence of algal growth, the containers should be rinsed withsodium hypochlorite solution (containing about 0.1% availablechlorine) and thoroughly flushed out with water afterwards. Abottle brush may be useful to remove stubborn deposits.

31
It is advisable when changing standard or reagent solutions toreplace the container and remove the empty/used one forthorough cleaning.
Note. It must be emphasised that containers which are to beused for ammonia standard solutions must be verythoroughly washed out after chlorine treatment because anyresidual chlorine will react with ammonia and hence changethe standard concentration. In addition to thorough washingwith water, it is suggested that the containers are rinsed witha portion of the ammonia standard before finally filling.
8.2.6 Consumables Spares KitIf one is not supplied, it should be ordered before the end of thefirst year of operation. This kit includes all the components whichare recommended for replacement annually (see Section 10).This annual refurbishment ensures a high level of reliability fromthe monitor over a period of many years. Another kit should beordered when the old one is used so that all the items areavailable throughout the following year's operation. Theconsumable spares kit is in addition to the electrode spares kit.
The kit contains the following:
• one set of pump tubing
• one set of pump capstans
• a complete set of plumbing tubing
• sundry items – 'O' rings, tube connectors, pump tubebungs and fuses
• plastic syringe and bottle brush – for cleaning pipework,valves, flowcell and constant-head unit.
8.2.7 Assembling/Refurbishing the ProbeThe ammonia probe is a gas sensing combination electrodeassembly. It is supplied in kit form and must be assembled orrefurbished using one of the appropriate procedures below:
Refurbishinga) Dismantle the probe and rinse off the filling solution with
dimineralised water.
b) Remove the membrane from the end cap and retain thesealing washer; use a new washer if it is damaged.
c) Proceed from step c) in Assembling the Probe below.
Assembling the Probea) Unscrew the end cap from the probe body. Rinse the probe
body with distilled or de-ionised water. Allow to drain.
b) Remove the teat from the glass electrode. Rinse the electrodewith distilled or de-ionised water. Dry with a paper tissue.
c) Screw the glass electrode into the body until the tip of theelectrode is flush with the end face of the probe. Note thenumber on the electrode cap in line with the mark on the body.Unscrew the electrode cap four full turns.
d) Drop a membrane (coloured white) into the end cap and placethe sealing washer centrally upon it.
e) Screw the end cap firmly onto the body, taking care not towrinkle the membrane. Ensure that the body seal and themembrane sealing washer are both under compression.
f) Holding the probe upright, inject the filling solution providedthrough the filling hole until there is a 50 to 60 mm depth ofsolution inside so that the reference element is immersed inthe solution. Wipe any excess filling solution from the body.
g) Tap the end of the probe with the finger to dislodge any airbubbles which have been trapped between the end of theglass electrode and the membrane. Screw the glasselectrode down four turns to the flush position again and thena further 1.0 ±0.1 turns. The tip of the electrode should now bepressing against the membrane. In some circumstances,particularly if the electrode response is sluggish, the screwmay be given a further 0.2 to 0.3 turn. Beware ofovertightening, which can puncture the membrane.
h) Push the probe cap onto the top of the probe body so that itcovers the filling hole.
Note. A newly assembled probe should be run on sample for2 to 4 hours before a calibration is attempted.
8.2.7 continued overpage…
8 MAINTENANCE…
32
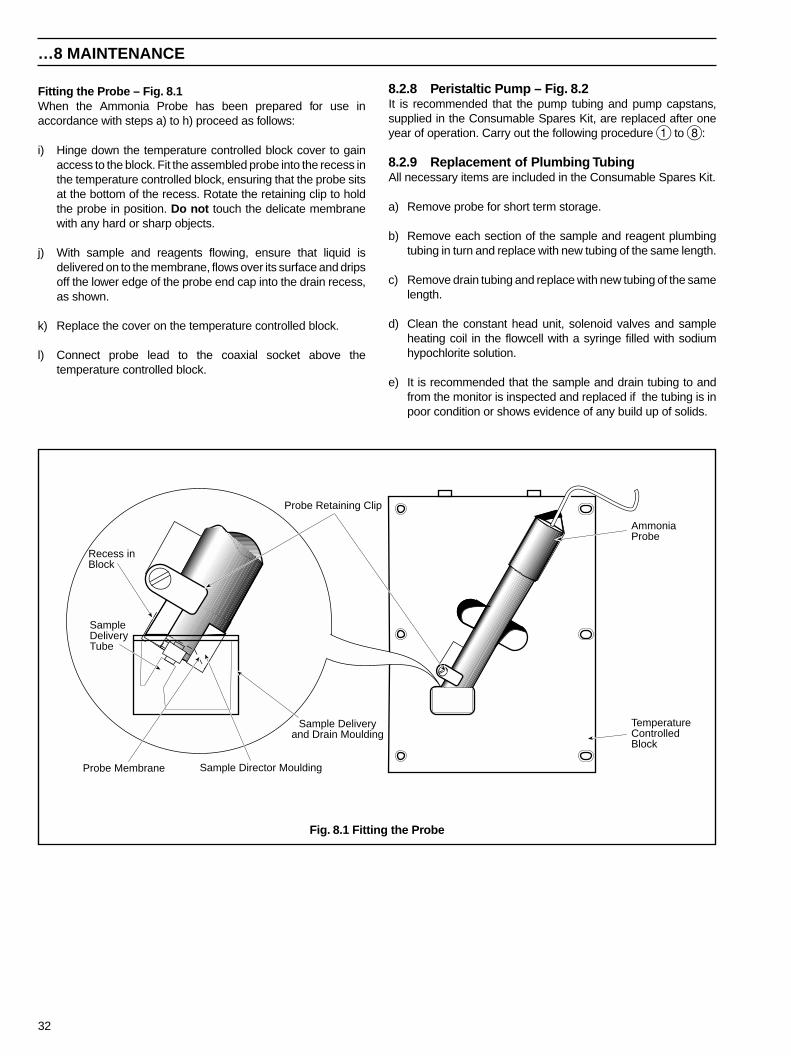
Fitting the Probe – Fig. 8.1When the Ammonia Probe has been prepared for use inaccordance with steps a) to h) proceed as follows:
i) Hinge down the temperature controlled block cover to gainaccess to the block. Fit the assembled probe into the recess inthe temperature controlled block, ensuring that the probe sitsat the bottom of the recess. Rotate the retaining clip to holdthe probe in position. Do not touch the delicate membranewith any hard or sharp objects.
j) With sample and reagents flowing, ensure that liquid isdelivered on to the membrane, flows over its surface and dripsoff the lower edge of the probe end cap into the drain recess,as shown.
k) Replace the cover on the temperature controlled block.
l) Connect probe lead to the coaxial socket above thetemperature controlled block.
…8 MAINTENANCE
8.2.8 Peristaltic Pump – Fig. 8.2It is recommended that the pump tubing and pump capstans,supplied in the Consumable Spares Kit, are replaced after oneyear of operation. Carry out the following procedure 1 to 8:
8.2.9 Replacement of Plumbing TubingAll necessary items are included in the Consumable Spares Kit.
a) Remove probe for short term storage.
b) Remove each section of the sample and reagent plumbingtubing in turn and replace with new tubing of the same length.
c) Remove drain tubing and replace with new tubing of the samelength.
d) Clean the constant head unit, solenoid valves and sampleheating coil in the flowcell with a syringe filled with sodiumhypochlorite solution.
e) It is recommended that the sample and drain tubing to andfrom the monitor is inspected and replaced if the tubing is inpoor condition or shows evidence of any build up of solids.
AmmoniaProbe
TemperatureControlledBlock
Sample Deliveryand Drain Moulding
SampleDeliveryTube
Recess inBlock
Probe Retaining Clip
Sample Director MouldingProbe Membrane
Fig. 8.1 Fitting the Probe
33
8 MAINTENANCE…
1
8
4
3
2
6
5
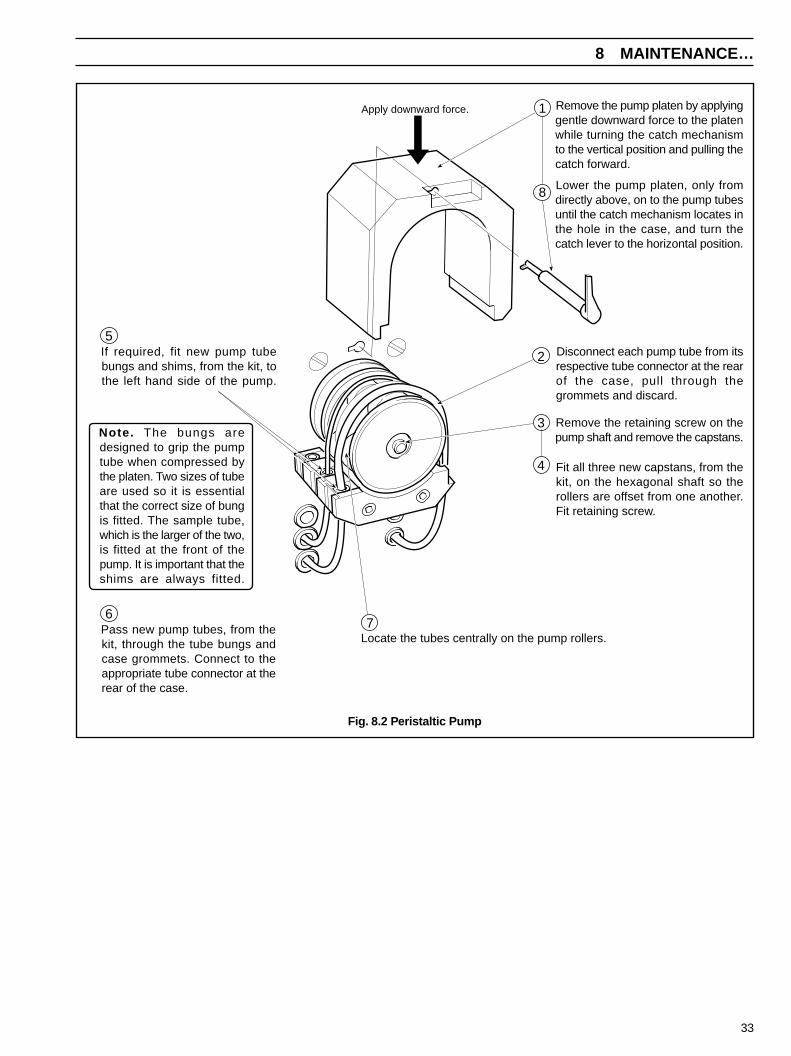
Remove the pump platen by applyinggentle downward force to the platenwhile turning the catch mechanismto the vertical position and pulling thecatch forward.
Lower the pump platen, only fromdirectly above, on to the pump tubesuntil the catch mechanism locates inthe hole in the case, and turn thecatch lever to the horizontal position.
Disconnect each pump tube from itsrespective tube connector at the rearof the case, pull through thegrommets and discard.
Remove the retaining screw on thepump shaft and remove the capstans.
Fit all three new capstans, from thekit, on the hexagonal shaft so therollers are offset from one another.Fit retaining screw.
If required, fit new pump tubebungs and shims, from the kit, tothe left hand side of the pump.
Pass new pump tubes, from thekit, through the tube bungs andcase grommets. Connect to theappropriate tube connector at therear of the case.
Note. The bungs aredesigned to grip the pumptube when compressed bythe platen. Two sizes of tubeare used so it is essentialthat the correct size of bungis fitted. The sample tube,which is the larger of the two,is fitted at the front of thepump. It is important that theshims are always fitted.
Locate the tubes centrally on the pump rollers.7
Apply downward force.
Fig. 8.2 Peristaltic Pump

34
8.3 Shutdown Procedure8.3.1 Short TermThe monitor can be left with the power switched off for up to 24hours without any detrimental effects. When returned to normalmonitoring mode, the monitor should be run on sample for 30minutes, followed by a calibration – see Section 7.
If the probe is left in the monitor with no liquids flowing, the internalfilling solution becomes more concentrated by evaporation ofwater through the membrane. The probe output drifts whennormal operation is resumed and many hours may be required tore–establish stability. In such cases normal performance cansometimes be restored by unscrewing the glass electrode 2 to 3turns and then returning it to its original position, thus allowingfresh filling solution to flow between it and the membrane. If thisprocedure is not successful replace the membrane and fillingsolution.
If the probe is likely to be out of use for more than one day, removefrom the monitor and store with the lower part of the bodyimmersed in a small quantity of liquid in a beaker or other suitablevessel. 0.1M ammonium chloride is the best storage solution (butit is essential that all traces of the storage solution are rinsed awaywith clean water before use); otherwise, a small amount of theEDTA reagent (Reagent 1) is suitable.
8.3.2 Long TermWhen the monitor is required to be shut down for more than 24hours, proceed as follows:a) Switch of the monitor.
b) Close the sample valve upstream of the monitor.
c) Dismantle the probe and return to its box. First the glasselectrode is unscrewed, then the rest of the probe emptied,rinsed and drained. Store the glass electrode with its end in ateat containing a neutral buffer solution, taking care not tocover the reference element.
d) Clean sample pipework both inside and outside the monitor,constant head unit, and filtration system (if used).
e) Remove pressure plate from peristaltic pump.
8.4 Unscheduled ServicingThe monitor indicates abnormal operation by means of signals onthe 20 character dot matrix display and l.e.d's. The indications arelisted in Table 8.1.
8.4.1 Malfunction of the MonitorIt should always be remembered that any unpredictableproblems may be due to the standard or reagent solutions, or theirflow through the flowcell. If any doubts exist regarding the integrityof the solutions, they should be replaced with freshly preparedsolutions in the early stages of the fault finding investigations.
Note. The accuracy of the monitor is governed by thecondition of these solutions which may be incorrectly madeor contaminated.
In general, any problems are likely to be due to the electrodes,which may require refurbishment (see Section 8.4.3), but may bedue to other parts of the liquid handling section of the monitor.
Mechanical components which are involved with the liquidhandling, for example, pumps, valves, tubing and tubingconnections etc., should be systematically checked for correctoperation, and for leaks or blockages which change the chemicalconditions around the sensor. The majority of all problems arefound to be associated with the chemistry and the liquid handlingsection.
…8 MAINTENANCE
Table 8.1 Unscheduled Servicing Messages
yalpsiD esuaCelbissoP
')2ro(1dtSGNITARBILAC'gnihsalf.D.E.LlaC
'2dtS'ro'1dtS'.ecalpgnikatsinoitarbilacnehwlamroN.emitehttadettimdagniebnoitulosdradnatsehtotsrefer
'DESSAPNOITARBILAC' .tuodeirracyllufsseccusneebsahnoitarbilactniopowttnecerA
')EPOLS(DELIAF.LAC'gnihsalf.D.E.LliaF
owtehtnistuptuoeborpehtmorfdetaluclaceulavepolsehT.stimilelbatpeccaehtedistuosawsnoitulosdradnats
')WOLS(DELIAF.LAC'gnihsalf.D.E.LliaF
ehtmorftuptuoelbatsaeveihcaotelbanusawrotinomehT.eborp
'RORRELORTNOC.PMET' ehtmorftnereffidyltnacifingissierutarepmetllecwolfrosnesehT.erutarepmeTlortnoC
'ELPMASFOTUO' .elpmasfossolsetacidnI
'NO'.D.E.LdloH ehtezeerfotdesserpneebsahnottubdloHehtsetacidnisihTecivreSfotuOehtetavitcaotdnasetatsmralanoitartnecnocotrotinomehtsnruterniaganottubehtgnisserP.yalermrala
.sruoh3fodoireparetfanoitarepolamron

35
b) Clean membrane by washing with a jet of clean water from awash–bottle or syringe.
c) Check, and top up as necessary, the filling solution in theprobe. There should be a 50 to 60 mm depth inside the probeso that the reference element is immersed in the solution.
d) Osmotic effects, i.e. total concentration of dissolved speciesin samples too high.
e) Puncture of the membrane (usually visible), disassembleprobe and reassemble – see Section 8.2.7.
f) Interference (from for example high concentrations of anionicdetergents).
g) Check glass electrode – see Section 8.5.
h) Check reference element – see Section 8.5.
In the ‘CAL. FAILED (SLOW)’ case the failure is usually due toslow sensor response, but may be due to an unstable (noisy ordrifting) sensor output:a) Check sensor connections in the coaxial plugs and sockets,
and inside the microprocessor unit.
b) See Malfunction of the Electrode/Probe – see Section8.4.3.
8.4.3 Malfunction of the ProbeInternal Filling SolutionThe internal filling solution incorporates a coloured indicatorwhich is normally yellow. The indicator changes to blue if theprobe membrane, or membrane seal, allows alkaline reagent toleak into the probe. If this occurs the membrane should bereplaced, and care taken to tighten the end cap sufficiently toprovide a good seal. The solution keeps indefinitely.
8.5 General Maintenance of the Probe
8.5.1 Ageing of the Glass ElectrodeAfter the probe has been in use for some months, theperformance of the glass electrode may eventually deterioratedue to its continued use in weakly buffered solutions at nearneutral pH. The response of the probe becomes sluggish and theresponse slope drops. The electrode may frequently be restoredto its initial condition by soaking for 12 hours in 0.1M hydrochloricacid. The performance of the electrode may be checked asdescribed below.
8.5.2 Checking the Performance of the GlassElectrodeThe glass electrode may be checked independently of the probewith a laboratory calomel reference electrode by testing the pair inpH buffer solutions.
Immerse the glass electrode to a depth of 5 to 10 mm. There mustbe no liquid contact with the reference element.
Connect the electrodes to a pH meter and calibrate with pHbuffers in the usual way. The glass electrode may be found to be
8 MAINTENANCE
8.4.2 Monitor Diagnostic InformationOut of Service AlarmThis alarm relay output is a normally energised relay which de-energises in the following circumstances:a) Loss of mains supply.
b) Calibration Failed – the calculated electrode slope value isoutside the acceptable limits or the response of the probe istoo slow. The ‘CAL FAIL’ l.e.d. on the front panel is illuminatedwith the appropriate text on the 20-character display.
c) Block temperature out of limits – the measuredtemperature of the Block is not within 5 °C of the ControlTemperature. ‘TEMP. CONTROL ERROR’ is indicated on the20-character display.
d) ‘OUT OF SAMPLE’ alarm – a float switch in the constanthead unit detects the loss of sample. ‘OUT OF SAMPLE’ isindicated on the 20-character display.
e) ‘OUT OF SERVICE’ alarm – displayed when the pump isswitched off.
Note. The heater is switched off by the software when an‘OUT OF SAMPLE’ condition is detected.
Calibration Fail AlarmA calibration failed condition occurs after a two point calibration ifthe calculated slope value is less than 80% or if the probe outputis unstable. The failure could be caused by a number of factorswhich should be investigated.
In the ‘CAL. FAILED (SLOPE)’ case some indication of theproblem may be obtained from the slope value.
Slope Value Just Below 80%a) Check liquid delivery on to the probe membrane – see
Section 8.2.7 (j).
b) Clean membrane by washing with a jet of clean water from awash–bottle or syringe.
c) Disassemble probe and reassemble – see Section 8.2.7.
d) Check glass electrode – see Section 8.5.
Slope Value Grossly Abnormala) Check, and top up as necessary, the filling solution in the
probe. There should be a 50 to 60 mm depth of solution insidethe probe.
b) Disassemble probe and reassemble – see Section 8.2.7.
c) Check glass electrode – see Section 8.5.
d) Check reference element – see Section 8.5.
Noisy, unstable response or slow responsea) Check liquid delivery on to the probe membrane – see
Section 8.2.7 (j).
36
somewhat slower in response than a conventional bulb–typeelectrode, but adequate scale length should be obtained, typicallybetter than 98% of the theoretical slope value.
8.5.3 Reference ElementDuring the lifetime of the probe, the internal reference elementmay show signs of deterioration, indicated by the removal of thegrey/brown silver chloride coating, exposing the buff/light greysilver element beneath. This is a normal process, the rate ofremoval depending on probe operating conditions andmaintenance.
When new and in good condition this element is completely andevenly coated. Loss of a large part of this coating causes probedrift, but can be restored by re–chloridising the element, using thefollowing procedure:
8.5.4 Procedure for Chloridising the ReferenceElement
Requirements –• Plating solution – hydrochloric acid (HCl) 0.1M, 500 ml.
Note. Do not use acid preserved with mercuric ions.
• Cleaning solutions – Ammonia solution (NH3) 50% vol./vol.,200 ml.To prepare, dilute 100 ml analytical reagent gradeconcentrated ammonia solution, s.g. 0.88, with 100 mldistilled water and stir.
• Nitric acid (HNO3), 25% vol./vol. 200 ml.To prepare; cautiously pour 50 ml analytical reagent grade,concentrated nitric acid, s.g. 1.42, into 150 ml distilledwater, stirring continuously. Allow to cool before use.
Warning. Stored ammonia solutions and concentrated nitricand hydrochloric acids are irritants and very corrosive. Takegreat care not to inhale the fumes of either or to get any on theskin or clothing. Any slight spillage on skin, clothing orworking surface must be washed away with plenty of water.
• Constant current supply, 2 mA d.c. output.
• Silver wire (counter electrode).
• 1 beaker.
Cleaning –a) Immerse the lower 50 mm of the combination electrode (i.e.
so that the silver reference element is covered) in theammonia solution for about 1 minute. Remove and rinse withdistilled water.
b) Immerse the electrode to the same depth in the 25% nitricacid until the silver element is a uniform creamy white. Thisprocess usually takes about 1 minute, but the element mustbe inspected frequently as prolonged immersion isdetrimental.
…8 MAINTENANCE
c) If the element is not uniform in colour repeat the ammonia/nitric acid process.
d) When clean, rinse with distilled water and immediatelytransfer to the plating solution such that the reference elementis completely immersed.
Chloridisation –a) Attach the screen of the combination electrode cable to the
negative terminal of the constant current supply and immersethe lower 50 mm of the electrode in the plating solution so thatthe reference element is covered. Immerse a silver counterelectrode in the plating solution and connect to the positiveterminal of the supply.
b) Pass a current of 2 mA for approximately 30 seconds.Carefully tap the electrode to remove all bubbles and thenreverse the connections to the supply (i.e. the electrode to beplated is connected to the positive terminal).
c) Pass a current of 2 mA for 30 minutes after which time theelectrode will be a dark brown or grey colour. A more uniformcoating may be obtained by employing moderate stirringduring the process.
d) Remove the electrode from the plating solution, rinse withdistilled water and dry with a tissue.
8.6 Microprocessor Unit Error MessagesThe instrument incorporates an automatic self-diagnosticchecking facility for detection of input and output errors. If such afault occurs, one of the error messages detailed below is shownon the dot matrix display.
‘CHAN 1 INPUT ERROR’This error message is usually caused by an open circuitsensor input allowing the input to drift outside the range of±400 mV. This may be due to any of the following:
a) Low level of filling solution in the probe.
b) Open circuit electrode internally, e.g. broken connection.
c) Broken electrical connections between the probe and theMicroprocessor Unit sensor input.
d) Sensor coaxial plugs not correctly inserted.
‘TEMP INPUT ERROR’‘PRT OUT OF LIMITS’‘TEMP REF. ERROR’‘THIRD LEAD ERROR’
The above four error messages refer to electrical problems withthe temperature sensor input – usually an open or short-circuitedconnection.

37
9 SPECIFICATION
RangeAmmonia Any two consecutive decades of concentration
between 0.05 and 1000mgl–1 as N, NH3 or NH4+
Repeatability±2% of reading
Reproducibility±3% of reading
Response timeLess than 5 minutes for 90% step change
Millivolt range–400mV to +400mV
Millivolt resolution±0.1mV
Control temperature range30 to 45°C (86 to 113°F)
Temperature resolution±0.1°C (±0.2°F)
DisplaysConcentration 5-digit blue fluorescent
Information 20-character dot matrix blue fluorescent
Status indicationTwo flashing LED’s in alarm state
Single LED lit when ‘HOLD’ switch operated
Single LED lit when calibration is in progress
Single LED lit when the monitor is ‘Out of Service’
Current outputsAs standard one isolated current output 0 to 1, 0 to 10,0 to 20 or 4 to 20mA selectable via plug-in links
Optional 2nd current output
Maximum voltage load 15V
Current output spanAny 1 to 2 decades of display range, logarithmic or linear
Computer interfaceModbus via RS433/RS423 serial interface
AlarmsTwo high or low concentration alarms
Remote calibration mode indication
Remote monitor ‘Out of Service’ indication,
includes: Loss of Mains Supply
Loss of Sample
Calibration Failed
Electronic Failure
All voltage-free 250V 5A non-inductive changeover relay contacts
Concentration alarm adjustmentProgrammable over assigned range
Concentration alarm differentialProgrammable 0 to 5%
Concentration alarm delayProgrammable 0 to 60 minutes
CalibrationFully automatic two-point, plus manual initiation on demand
Routine maintenanceFour-weekly: replenish reagents, clean flow system
Twelve-monthly: replace plumbing, pump tubing and pumpcapstans
Power supply110 to 120V or 220 to 240V 50/60Hz 100VA
Power supply tolerance+6% to –20%
Isolation voltageInput, output and power supply 1.5kV
WeightApproximately 35kg (77lb)
DimensionsHeight 893mm (35.2 in.)
Width 541mm (21.3 in.)
Depth 207mm (8.2 in.)
Degree of protectionElectronics section IP65
Liquid handling Case IP31
Critical internal components IP65
SS/8230 Issue 8

38
10 SPARES LIST
.oNtraP noitpircseD ytQ
0200328
gnisirpmoctikserapselbamusnoCgnibmulp,snatspacpmup,sebutpmup
sgnir'O'dnasrotcennocebut,gnibut.cte
1
0422008 noitulosgnilliflanretnieborpainommA 1
0622008 tikenarbmemeborpainommA 1
Consumable Spares
Refurbishment Spares
Strategic Spares
deriuqersawolebMORPEyficepSlootnoitcartxeCCLPlaicepsaeriuqers'MORPE.B.N
.oNtraP noitpircseD ytQ
0712328 )hsilgnE(MORPE 1
1712328 )namreG(MORPE 1
5712328 )hsilgnE(mmoClaireSMORPE 1
6712328 )namreG(mmoClaireSMORPE 1
71800054 ylbmessadraobylppusrewoP 1
04100054 ylbmessakcapdraobyalpsiD 1
54200054 draobO/IlaireS 1
55200054 draobP/OtnerruC 1
5500328 draobtupniVm 1
56200054 draobtupni.pmeT 1
52600054 ).cteevirdevlav(eludoMtuptuOESI 1
58200054 draobylppusrewoP 1
57200054 draobyalpsidtnemges–7tigid–5 1
34400054 tiucric-ixelfyalpsidtigid–5 1
30600054 tiucric-ixelfyalpsiD 1
59300054 hctiwsenarbmeM 1
51700054otdettiF(ylbmessadraobylppusrewoP
)ylnosrotinomdekramECerp1
.oNtraP noitpircseD ytQ
5082008 tikeborpainommA 1
1072008 edortcelerennieborpainommA 1
0872008 ydobedortcelE 1
0282008 pmalceborP 1
2622328 ebutretaehelpmaS 1
0722328 ylbmessaelttobtnegaerATDE 1
5722328 ylbmessaelttobtnegaerHOaN 1
9622328 liocrexiM 2
1220328–ylbmessareniatnocnoitulosdradnatS
'hgiH'1
0220328–ylbmessareniatnocnoitulosdradnatS
'woL'1
0173608 reknisebutreniatnoC 4
4154120mm6telnielpmas–rotcennocesoH
.d.i1
6254120mm9niardrotinom–rotcennocesoH
.d.i1
0992208llecwolf.d.imm9–rotcennocebuT
niard1
0420328 ylbmessarosneserutarepmeT 1
1622328 elcatpecereborprosneS 1
9822328 gnidluomrotceridniardelpmaS 1
9104320 *)epyT'trekruB'(evlavdioneloS 1
trap(evlav'smetsySnoitamotuAdiulF'secalperevlavsihT*.)2902320rebmun
evlavdionelosredro,evlavtrekruBehtottrevnocoTevlavehtsedulcnihcihw,7020328rebmuntrap,ylbmessa
.tekcarbgnitnuomdna
.oNtraP noitpircseD ytQ
0822328 tinudaehtnatsnoC 1
4681608 'elpmaSfotuO'–hctiwstaolF 1
802032801gnidulcnirotompmuP µ roticapacF
0785308 ylbmessagnilpuocrotompmuP 1
4522328 tamretaeH 1
2174320 tuo-tuclamrehtretaeH 1
0522328 ylbmessaetalpretaeH 1
5232320 xoBnoitcnuJresU–remrofsnartsniaM 1
3174320 hctiwspmupdnasniam–hctiwselggoT 2
4174320 toobhctiwselggoT 2
0310328 xoBnoitcnuJresU–ylbmessa.B.C.P 1
7119320 gulplaixaocedortcelE 1
8119320 tekcoslaixaocedortcelE 1
54800054 )MORPEtuohtiw(draoBrossecorP 1
suht,)[email protected](9602320secalperrotomsihT*.noitpmusnoctnegaergnicuder

39
APENDIX A – REPLACING SOFTWARE EPROM
Fig. A.1 Procedure to Open the Enclosure
A.2 Access the PCB – Fig. A.2Warning. Switch off the monitor and electrically isolate itbefore carrying out the following steps.
A.1 Access the Transmitter Unit – Fig. A.1
Caution. Employ normal antistatic precautions whilehandling chips and PCBs.
Caution. To avoid damaging EPROM, base or PCB, it isessential that you use an approved IC extractor in thisprocedure.For example, a PLCC Extractor, RS Stock Number:404-727
Fluoride EIL8231
Undo locks andswing open the caseto reveal themicroprocessor unit.
Microprocessor UnitHinged Case
1
2 Open microprocessor unit –see Fig. A.2.
Fig. A.2 Procedure to Access the Processor PCB
Remove processor PCB.See Fig. A.3
Unlock and open cover plate andhinge out to expose captivescrews.
Unscrew captive screws andswing front cover upwards. Lockinto position using the hingedstay on the right hand side.
1
2
3
Continued over…

40
…APPENDIX A
A.3 Removing the PCB – Fig. A.3
Fig. A.3 Procedure to Remove the PCB
Fig. A.4 Replacing the Software EPROM
Withdraw the PCB and turn it over toreveal the component side.
3
2
Locate and change the EPROM IC1 – see Fig. A.4.
Remove the four screws attaching the PCB tothe assembly.Note that there are washers between the PCBcover and the PCB.
1
A.4 Changing the EPROM – Fig. A.4
IC1 IC11IC3
IC2IC5 IC4
BA
T1
Extract IC1 using an approved tool– see Caution in Section A.1.1 Fit the replacement IC – press home firmly.2
Go to Section A.5 for reassembly instructions.3
A.5 Completing the Procedure1) Fit the PCB using the reverse
procedure in Fig. A.3.
Important Note. Ensure that thewashers are fitted between the PCBcover and the PCB.
2) Close the microprocessor sectionusing the reverse procedure inFig. A.2.
3) Close and lock the hinged cover –Fig. A.1.
4) The monitor may now be put intoservice.
5) Check program parameters – seeSection 6.
6) Carry out a routine 2-pointcalibration.

PRODUCTS & CUSTOMER SUPPORT
ProductsAutomation Systems
• for the following industries:– Chemical & Pharmaceutical– Food & Beverage– Manufacturing– Metals and Minerals– Oil, Gas & Petrochemical– Pulp and Paper
Drives and Motors• AC and DC Drives, AC and DC Machines, AC motors to 1kV• Drive systems• Force Measurement• Servo Drives
Controllers & Recorders• Single and Multi-loop Controllers• Circular Chart , Strip Chart and Paperless Recorders• Paperless Recorders• Process Indicators
Flexible Automation• Industrial Robots and Robot Systems
Flow Measurement• Electromagnetic Flowmeters• Mass Flow Meters• Turbine Flowmeters• Flow Elements
Marine Systems & Turbochargers• Electrical Systems• Marine Equipment• Offshore Retrofit and Refurbishment
Process Analytics• Process Gas Analysis• Systems Integration
Transmitters• Pressure• Temperature• Level• Interface Modules
Valves, Actuators and Positioners• Control Valves• Actuators• Positioners
Water, Gas & Industrial Analytics Instrumentation• pH, conductivity, and dissolved oxygen transmitters and
sensors• ammonia, nitrate, phosphate, silica, sodium, chloride,
fluoride, dissolved oxygen and hydrazine analyzers.• Zirconia oxygen analyzers, katharometers, hydrogen purity
and purge-gas monitors, thermal conductivity.
Customer Support
We provide a comprehensive after sales service via aWorldwide Service Organization. Contact one of the followingoffices for details on your nearest Service and Repair Centre.
United KingdomABB LimitedTel: +44 (0)1453 826661Fax: +44 (0)1453 829671
United States of AmericaABB Inc.Tel: +1 775 850 4800Fax: +1 775 850 4808
Client Warranty
Prior to installation, the equipment referred to in this manualmust be stored in a clean, dry environment, in accordance withthe Company's published specification.
Periodic checks must be made on the equipment's condition. Inthe event of a failure under warranty, the followingdocumentation must be provided as substantiation:
1. A listing evidencing process operation and alarm logs at timeof failure.
2. Copies of all storage, installation, operating and maintenancerecords relating to the alleged faulty unit.

IM/8
232
Issu
e 6
The Company’s policy is one of continuous productimprovement and the right is reserved to modify the
information contained herein without notice.
Printed in UK (08.04)
© ABB 2004
ABB LimitedOldends Lane, StonehouseGloucestershireGL10 3TAUKTel: +44 (0)1453 826661Fax: +44 (0)1453 829671
ABB Inc.Analytical Instruments9716 S. Virginia St., Ste. EReno, Nevada 89521USATel: +1 775 850 4800Fax: +1 775 850 4808
ABB has Sales & Customer Supportexpertise in over 100 countries worldwide
www.abb.com