Embed Size (px)
Citation preview
Raymo, M.E., Jansen, E., Blum, P., and Herbert, T.D. (Eds.), 1999Proceedings of the Ocean Drilling Program, Scientific Results, Vol. 162
8. MAGNETIC STRATIGRAPHY OF NORTH ATLANTIC SITES 980–984 1
J.E.T. Channell2 and B. Lehman3
ABSTRACT
Magnetic polarity stratigraphies for Sites 980–984 are based on shipboard measurements from the pass-through magnetom-eter after alternating field (AF) demagnetization at a peak field of 25 mT and shore-based stepwise AF demagnetization of dis-crete samples. The characteristic magnetization component was determined after AF demagnetization removed the steepdownward drill-string–related magnetic overprint. Peak AF fields in the 20–30 mT range were required to resolve the compo-nent, carried by magnetite, that was used to produce unambiguous Pliocene–Pleistocene magnetic stratigraphies at all five sites.At Sites 980 and 983, magnetic stratigraphies were resolved to the base of the recovered advanced hydraulic piston corer (APC)section, which lies in the Matuyama Chron (1r.2r) and Olduvai Subchron (2n), respectively. At Sites 981 and 982, magnetiza-tion intensities decrease sharply in the normal polarity zone corresponding to the Gauss Chron (2An), and magnetic stratigra-phies below this level could not be resolved. At Site 984, the resolution of magnetic stratigraphy was curtailed at ~250 metersbelow seafloor (Olduvai Subchron) by core deformation at the base of the APC section and in the underlying extended core bar-rel section.
As the magnetic stratigraphies at all four sites are unequivocal, polarity chron interpretations can be made without aid fromthe biostratigraphy. Mean sedimentation rates within polarity chrons have been calculated and Pliocene–Pleistocene biomagne-tostratigraphic correlations tested.
reteea-
uss/d not
ig.sticonag-
tingisticFig.hethend
dif-dingintoSeech-
mt isthis atose al-moft ofar-
INTRODUCTION AND METHODS
The North Atlantic sites drilled during Ocean Drilling Program(ODP) Leg 162 (Sites 980–984) were located on the Rockall Ba(Site 982), off its southern edge (Sites 980/981), and on the Ga(Site 983) and Bjorn Drifts (Site 984) (Fig. 1). Archive halves of acore sections were measured on board ship using the cryogenic through magnetometer. The high rate of core recovery at these required that cores be processed promptly and, therefore, stepwisternating field (AF) demagnetization was generally not feasible ding the cruise. Most core sections were measured on board shipsingle demagnetization step (generally 25 mT), the choice of pfield being based on stepwise demagnetization of a few core sectand a handful of discrete samples.
Subsequent shore-based discrete sample measurements weressary to “ground truth” the shipboard magnetic stratigraphy. Thsamples were collected during the cruise in standard 7-cm3 plasticboxes and measured at laboratories at Gif-sur-Yvette and at the versity of Florida. Natural remanent magnetization was measuredfore demagnetization and during stepwise AF demagnetization usa peak field increment of 5 mT in the 5–70 mT range, or until tmagnetization intensity fell below magnetometer noise level. Othogonal projections of AF demagnetization data indicated a chateristic magnetization component resolved at peak fields over ~mT. A lower coercivity component was observed in most sampparticularly those with a reverse polarity characteristic componeThe low-coercivity component is oriented steeply downcore andprobably partly a viscous remanent magnetization imposed by drill-string assembly and partly a stirred remanent magnetizationlated to sediment drilling disturbance. The AF range in which tcharacteristic magnetization component is isolated was picked byfrom orthogonal projections. The direction of the discrete samcharacteristic magnetization component was determined using
1Raymo, M.E., Jansen, E., Blum, P., and Herbert, T.D. (Eds.), 1999. Proc. ODP,Sci. Results, 162: College Station, TX (Ocean Drilling Program).
2Department of Geology, University of Florida, Gainesville, FL 32611-2120,U.S.A. [email protected]
3Laboratoire des Sciences du Climat et de l’Environnement, CNRS-CEA, Avede la Terrasse, 91198 Gif-sur-Yvette, France.
nkrdarll
pass-sitese al-ur- at aeakions
e nec-ese
Uni- be-ingher-
rac-20
les,nt. isthe re-he eyeple the
standard least-squares technique (Kirschvink, 1980). The discsample data generally confirmed the shipboard pass-through msurements, but in some cases, notably in the vicinity of the GaMatuyama boundary at Site 981, the shipboard measurements diisolate the characteristic magnetization component.
SITE 980
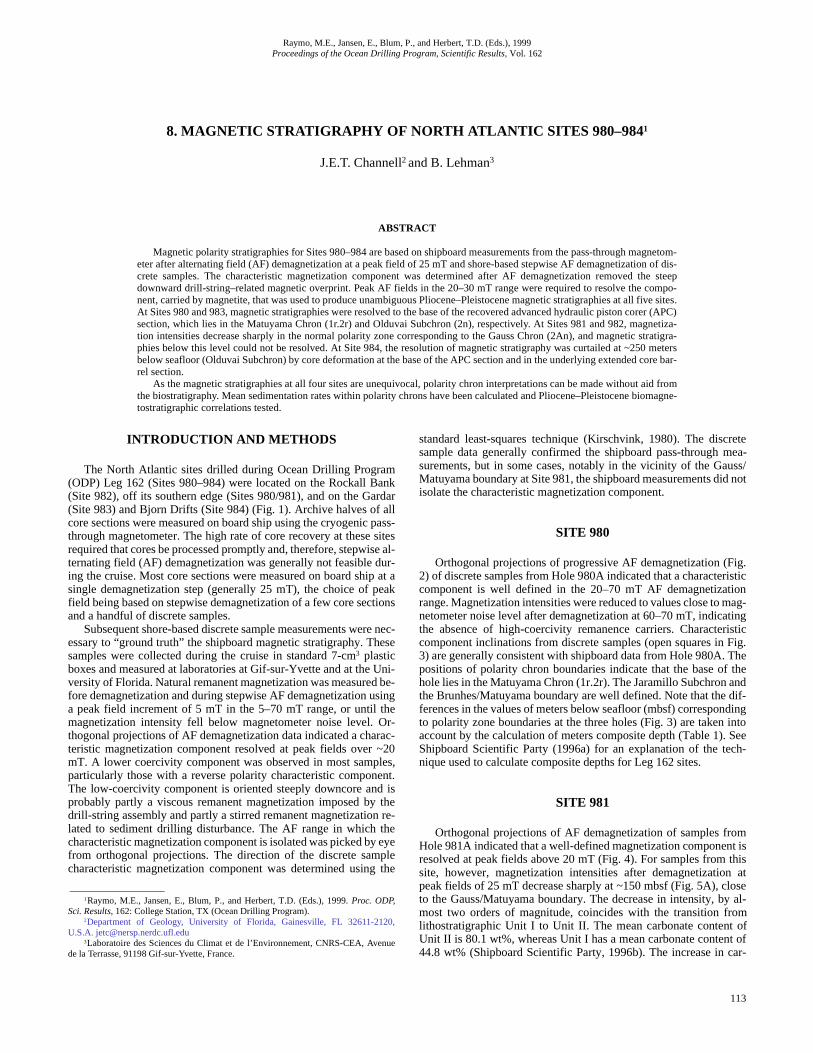
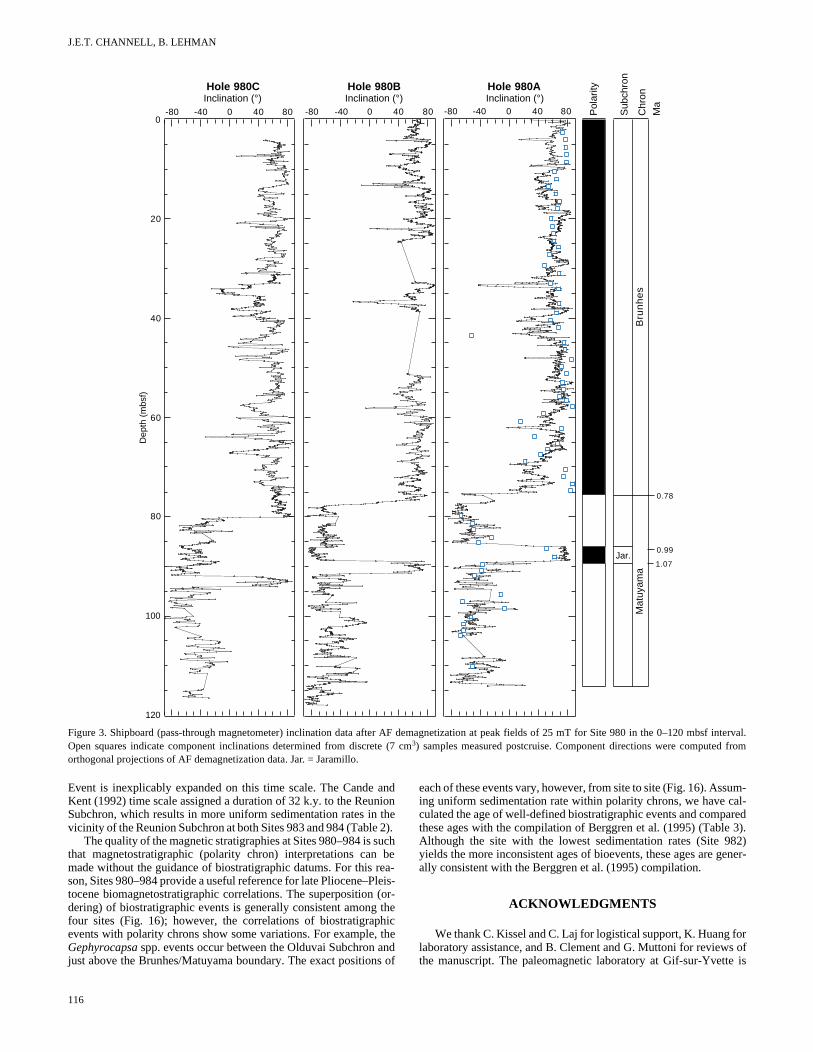
Orthogonal projections of progressive AF demagnetization (F2) of discrete samples from Hole 980A indicated that a charactericomponent is well defined in the 20–70 mT AF demagnetizatirange. Magnetization intensities were reduced to values close to mnetometer noise level after demagnetization at 60–70 mT, indicathe absence of high-coercivity remanence carriers. Charactercomponent inclinations from discrete samples (open squares in 3) are generally consistent with shipboard data from Hole 980A. Tpositions of polarity chron boundaries indicate that the base of hole lies in the Matuyama Chron (1r.2r). The Jaramillo Subchron athe Brunhes/Matuyama boundary are well defined. Note that the ferences in the values of meters below seafloor (mbsf) corresponto polarity zone boundaries at the three holes (Fig. 3) are taken account by the calculation of meters composite depth (Table 1). Shipboard Scientific Party (1996a) for an explanation of the tenique used to calculate composite depths for Leg 162 sites.
SITE 981
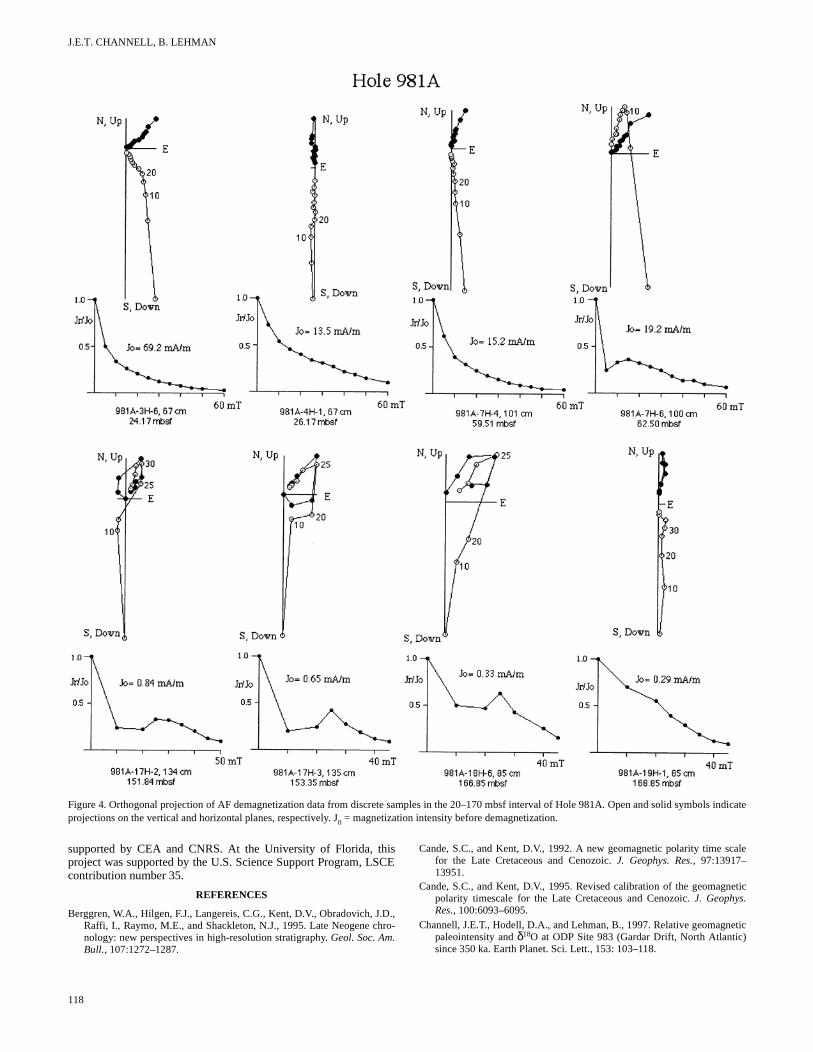
Orthogonal projections of AF demagnetization of samples froHole 981A indicated that a well-defined magnetization componenresolved at peak fields above 20 mT (Fig. 4). For samples from site, however, magnetization intensities after demagnetizationpeak fields of 25 mT decrease sharply at ~150 mbsf (Fig. 5A), clto the Gauss/Matuyama boundary. The decrease in intensity, bymost two orders of magnitude, coincides with the transition frolithostratigraphic Unit I to Unit II. The mean carbonate content Unit II is 80.1 wt%, whereas Unit I has a mean carbonate conten44.8 wt% (Shipboard Scientific Party, 1996b). The increase in c
nue
113
J.E.T. CHANNELL, B. LEHMAN
n
o
eur
n
9
2).in-rlyrityized
09Bto beatelyely 2),
omtionard
rateole
ling-corera is the geo-ti-ed-
theFeni,esedep-tig-able14;
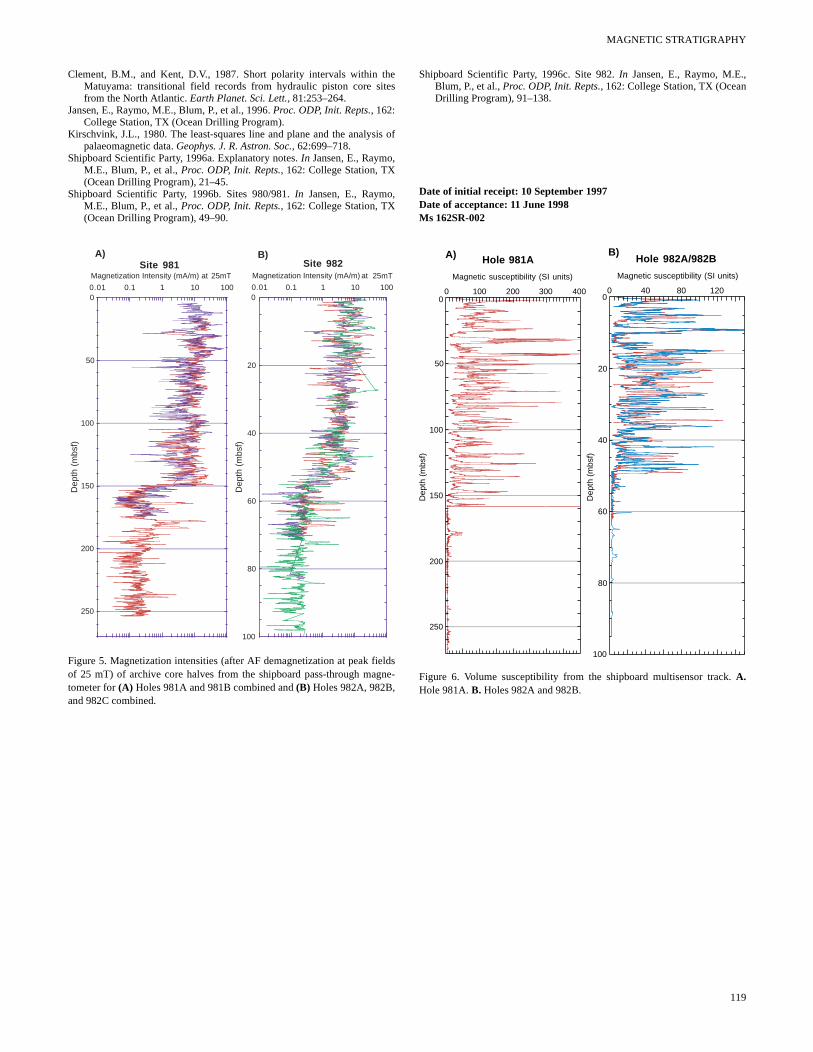
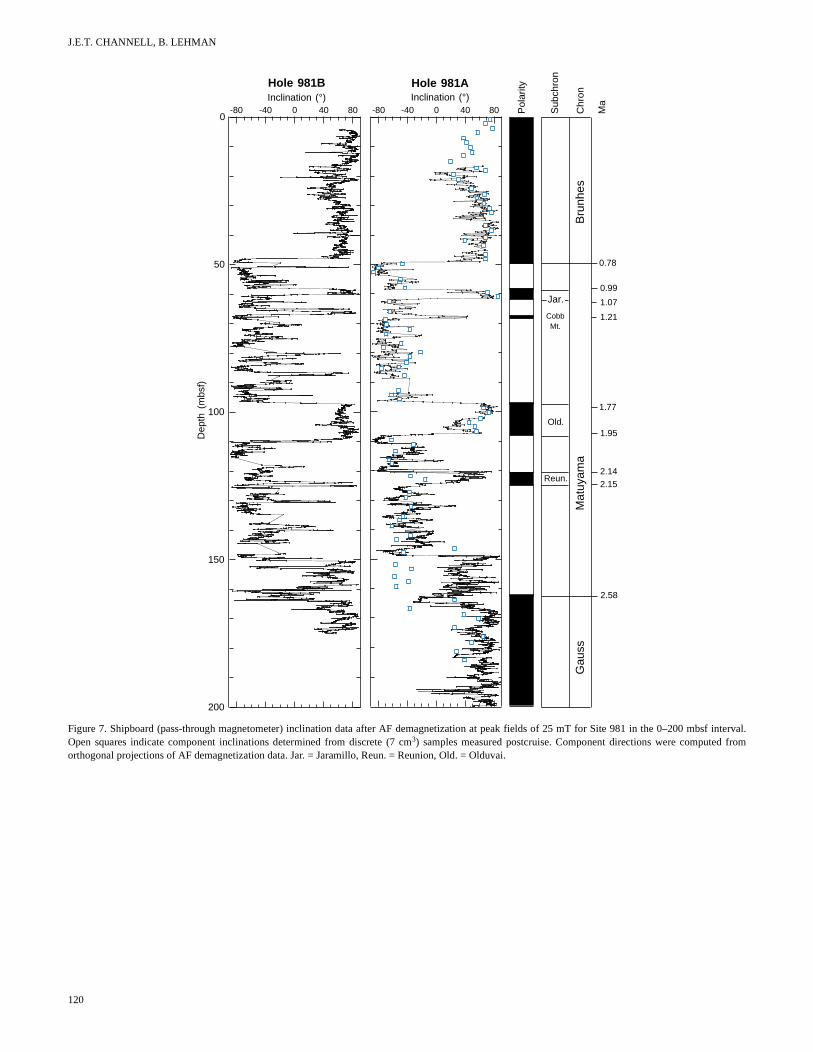
bonate content and the accompanying decrease in clay (detrital) con-tent coincides with the drop in magnetization intensity. Shipboardvolume susceptibility data indicate a distinct change in concentrationof magnetite at the same level (~150 mbsf) (Fig. 6A). The Gauss/Matuyama boundary at Site 981 was placed close to 150 mbsf on thebasis of data from the shipboard pass-through magnetometer (Fig. 7).The discrete sample data, however, indicate that this chron boundaryis at ~165 mbsf (Table 1, Fig. 7). The weak magnetization intensitiesand the strong drill-string overprint account for the misidentificationof this polarity chron boundary in the shipboard data.
SITE 982
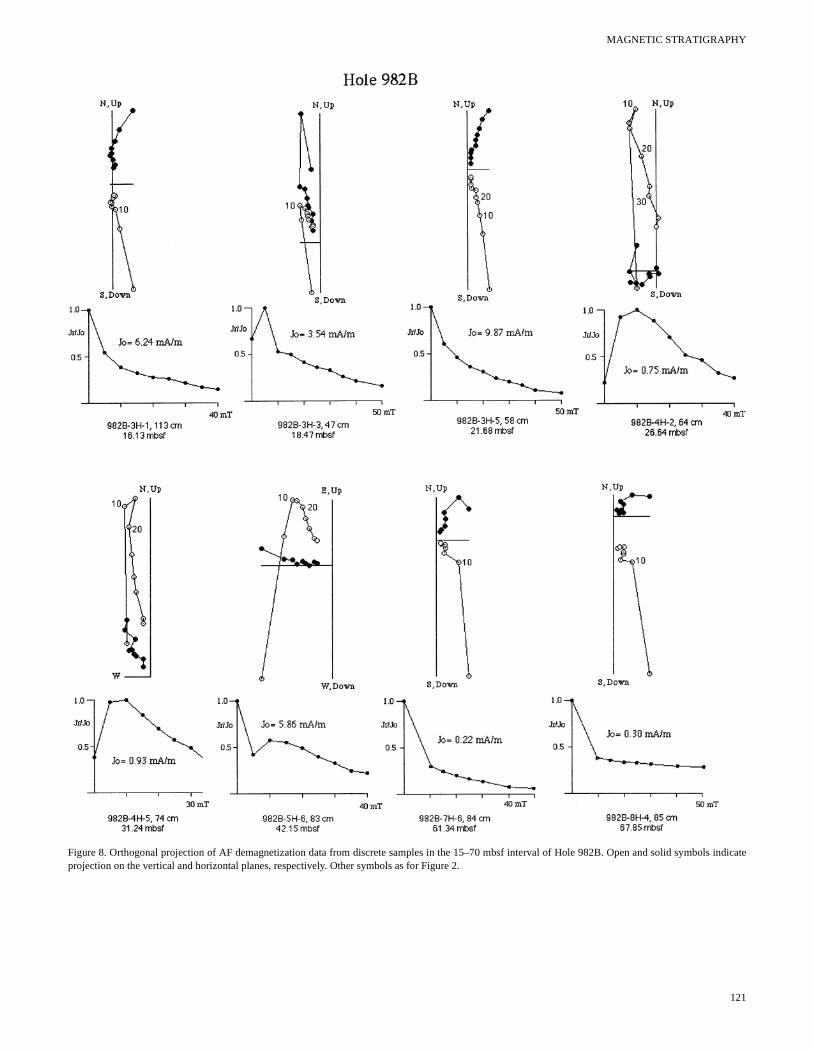
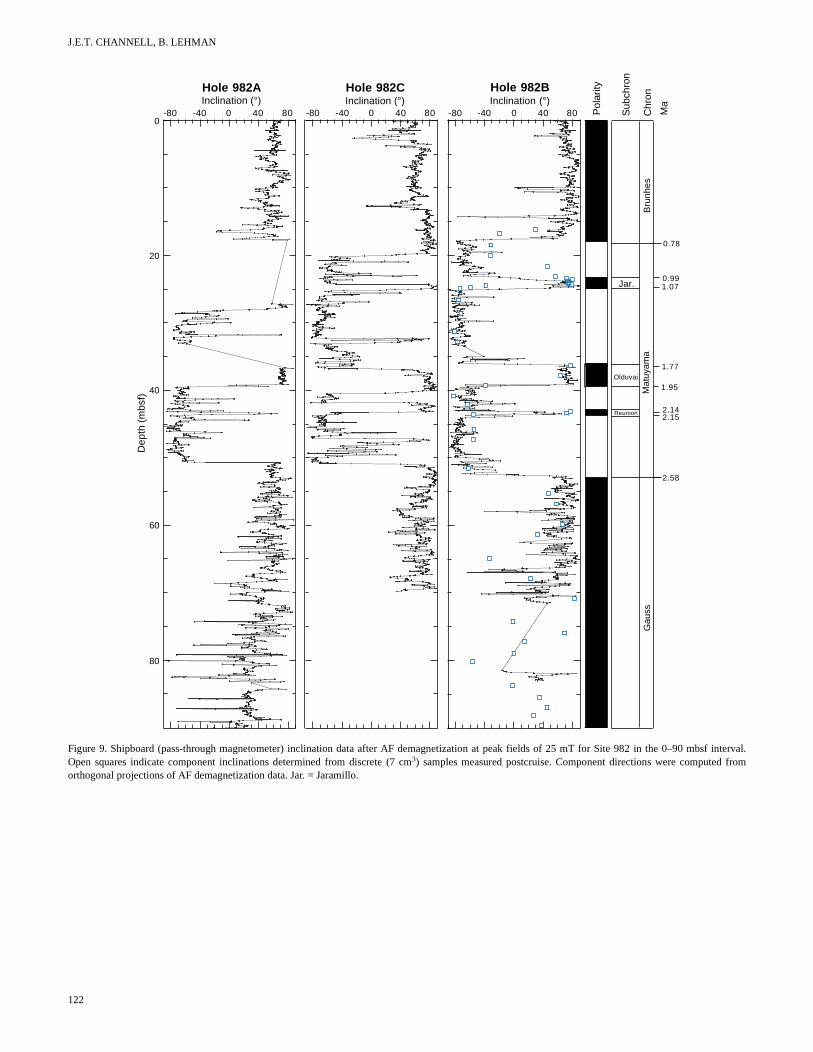
Orthogonal projections of AF demagnetization data for samplesfrom Hole 982B indicate that the characteristic magnetization com-ponents are well defined down to ~70 mbsf (Figs. 8, 9). Below thislevel, magnetization intensities are too low for precise definition ofthe characteristic component. In the shipboard pass-through data, thedecrease in magnetization intensity occurs in the 50–60 mbsf inte(Fig. 5B). As at Site 981, the abrupt decrease in magnetization insity coincides with the change in carbonate content from mean vaof 57.7 to 90.8 wt%, at the boundary between lithostratigraphic UI and II (Shipboard Scientific Party, 1996c). The concentrationmagnetite changes abruptly at the same level, as indicated bychange in multisensor track susceptibility values (Fig. 6B).
SITE 983
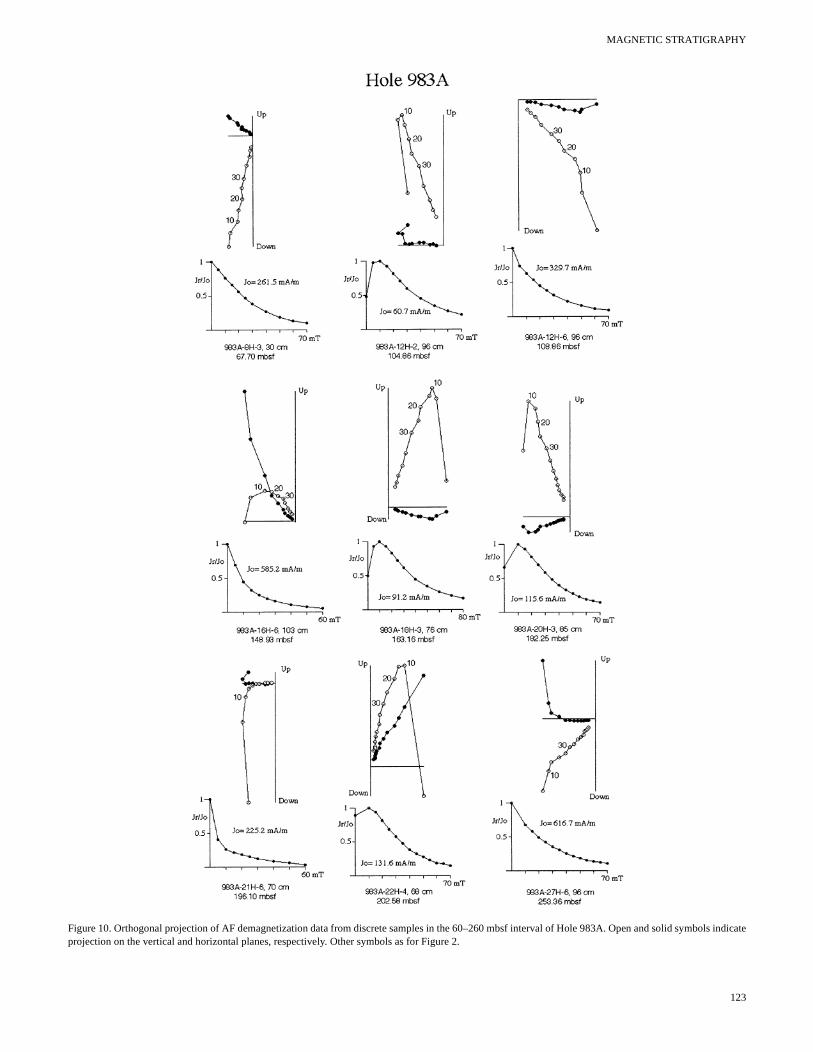
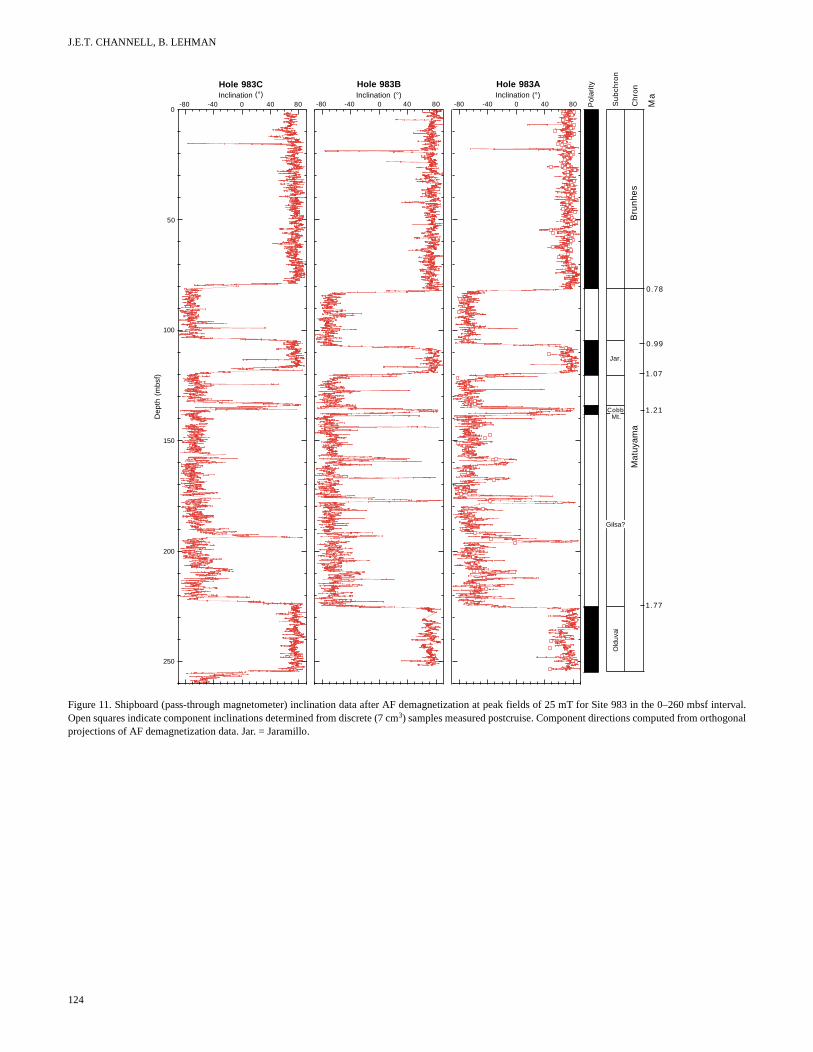
The ubiquitous downward magnetic overprint is also presenSite 983; however, it can be eliminated by AF demagnetizationpeak fields of 20 mT (Fig. 10). The characteristic magnetization cponent is particularly well defined at this site, with maximum angudeviation (MAD) values <5°. The base of the recovered section liwithin the Olduvai Subchron at Hole 983A and Hole 983B, and jbelow the Olduvai Subchron at Hole 983C (Fig. 11). Note the pence of one well-defined interval of negative inclinations within tBrunhes Chron in the 15–20 mbsf depth range. This event has aof 188 ka, occurring close to the oxygen isotopic Stage 6/7 boundand has been named the Iceland Basin Event (Channell et al., 1
2000
2000
2000
2000
2000
2000
2000
2000
980/981
982983
984
80°N
70°
60°
50°
40°W
20° 0°
20°
Figure 1. Location map for Sites 980–984. Site 981 lies 2 nmi southeast of Site 980.
114
rvalten-luesitsof the
t at atm-larsst
es-he ageary,97).
The event is included in calculation of sedimentation rates (TableThe variable inclination values within the Matuyama Chron may dicate both instability of the geomagnetic field at this time and pooresolved characteristic magnetization components. Short polaevents (Cobb Mountain and the Gilsa Events) have been recognbetween the Jaramillo and the Olduvai Subchrons at Hole 6(ODP Leg 94) (Clement and Kent, 1987). These events appear recorded at Site 983, where sedimentation rates are approximtwice those at Hole 609B. The Cobb Mountain Event is tentatividentified, included in the sedimentation rate calculations (Tableand assigned an age of 1.21 Ma (Berggren et al., 1995).
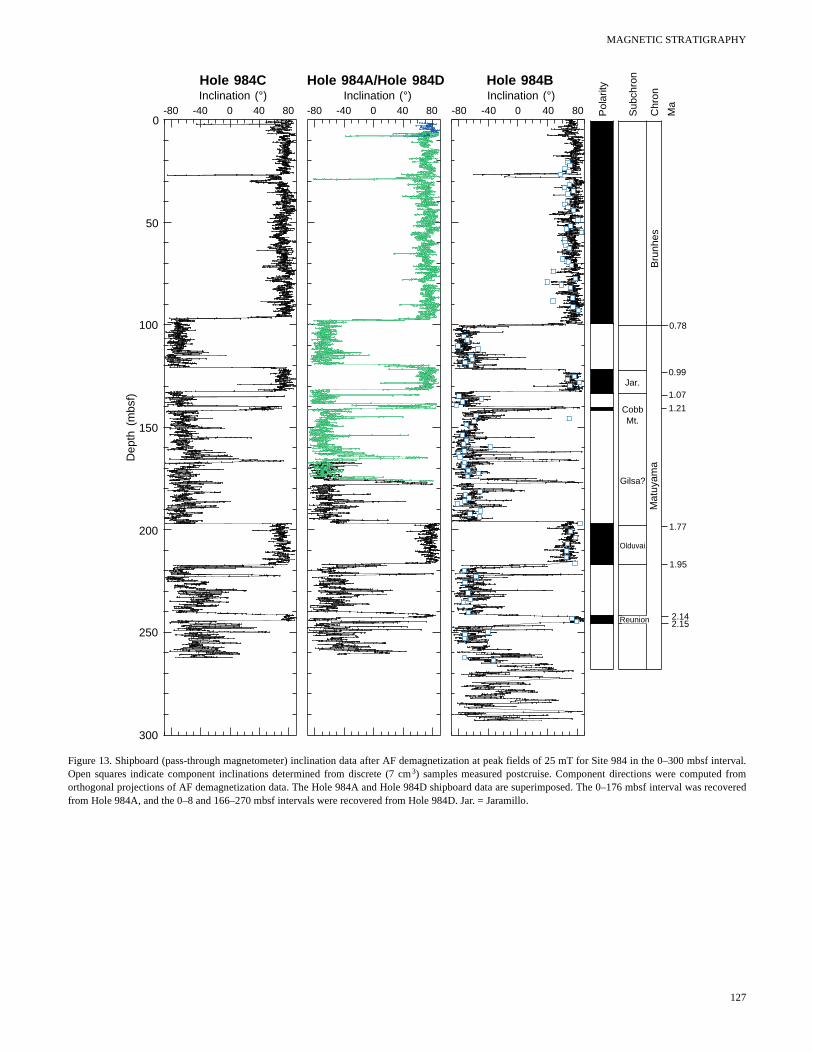
SITE 984
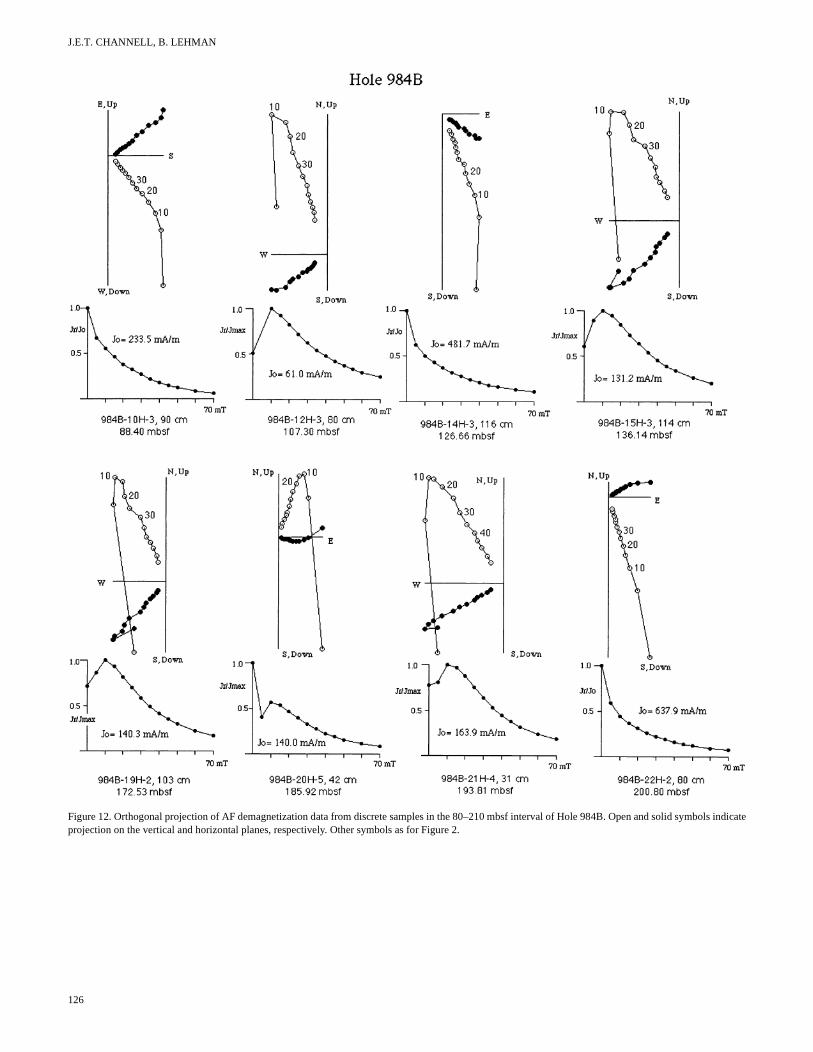
Orthogonal projections of AF demagnetization of samples frthis site indicated that a well-defined characteristic magnetizacomponent could be resolved after removal of the steep downwdrill-string overprint (Fig. 12). MAD values were usually <10°. Thediscrete sample component directions from Hole 984B corrobothe shipboard pass-through data (Fig. 13). Below 260 mbsf at H984B, the shipboard pass-through data are compromised by drilrelated deformation at the base of the advanced hydraulic piston (APC) section. As at Site 983, the Iceland Basin Event at 188 kobserved within the Brunhes Chron, and the interval betweenJaramillo and the Olduvai Subchrons appears to be an interval ofmagnetic instability. The Cobb Mountain Event is tentatively idenfied below the Jaramillo Subchron and is included in the interval simentation rate calculations (Table 2).
SEDIMENTATION RATES AND BIOSTRATIGRAPHIC CORRELATIONS
Before Leg 162, conventional piston cores had shown thatsedimentation rates were high in the uppermost ~15 m on the Gardar, and Bjorn Drifts. It was not known, however, whether thhigh sedimentation rates continued at depth or whether the drift osition was interrupted by unconformities. From the magnetic straraphy, sedimentation rates within the Brunhes Chron are comparat Feni (Site 980), Gardar (Site 983), and Bjorn (Site 984) (Fig.
MAGNETIC STRATIGRAPHY
S
m
ol,). AsSiteh. Attivert oftes81,withsedion
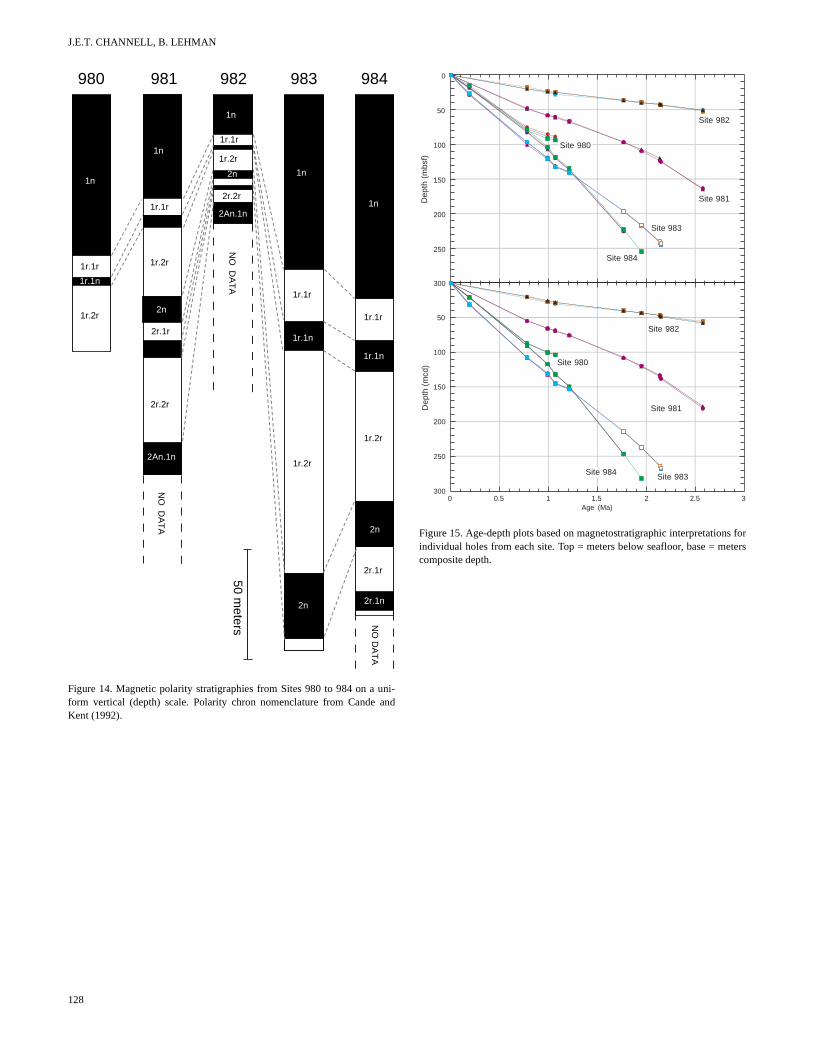
Table 2). At the second site on the Feni Drift (Site 981), Brunhes sed-imentation rates are lower than at Site 980. This was expected fromthe seismic stratigraphy linking Sites 980 and 981. The upper Pleis-tocene deposits are seen to thicken toward Site 980, and the Plioclower Pleistocene deposits thicken toward Site 981 (Shipboard entific Party, 1996b). The lack of data in the lower parts of the stions at Sites 981 and 982 (Fig. 14) was caused by decreasing netization intensities at ~150 and 60 mbsf, respectively, at thesesites (Fig. 5). The lack of data at the base of the section at Site(Fig. 14) resulted from core deformation at the base of the APC stion.
Figure 2. Orthogonal projection of AF demagnetization data from discrete samples in the 50–110 mbsf interval of Hole 980A. Open and solid symbols indicateprojections on the vertical and horizontal planes, respectively. J0 = magnetization intensity before demagnetization.
ene–ci-
ec-ag-
two 984ec-
In the intervals for which we have magnetostratigraphic contrno abrupt changes in sedimentation rates are apparent (Fig. 15expected from the seismic stratigraphy, sedimentation rates at 980 decrease with depth and those at Site 981 increase with deptthe top of the section, Site 984 sedimentation rates are high relato those at Site 983; however, the converse is true in the lower pathe two magnetostratigraphic sections (Fig. 15; Table 2). All sithat record the Reunion Event at 2.14–2.15 Ma, particularly Site 9show a step in the age-depth curve. This may indicate a problem the duration of the Reunion Event (10 k.y.) in the time scale u(Cande and Kent, 1995). At Sites 981, 982, and 984, the Reun
115
J.E.T. CHANNELL, B. LEHMAN
r
h
a
um-al-red
3).82)ener-
ors of is
. from
Event is inexplicably expanded on this time scale. The Cande andKent (1992) time scale assigned a duration of 32 k.y. to the ReunionSubchron, which results in more uniform sedimentation rates in thevicinity of the Reunion Subchron at both Sites 983 and 984 (Table 2).
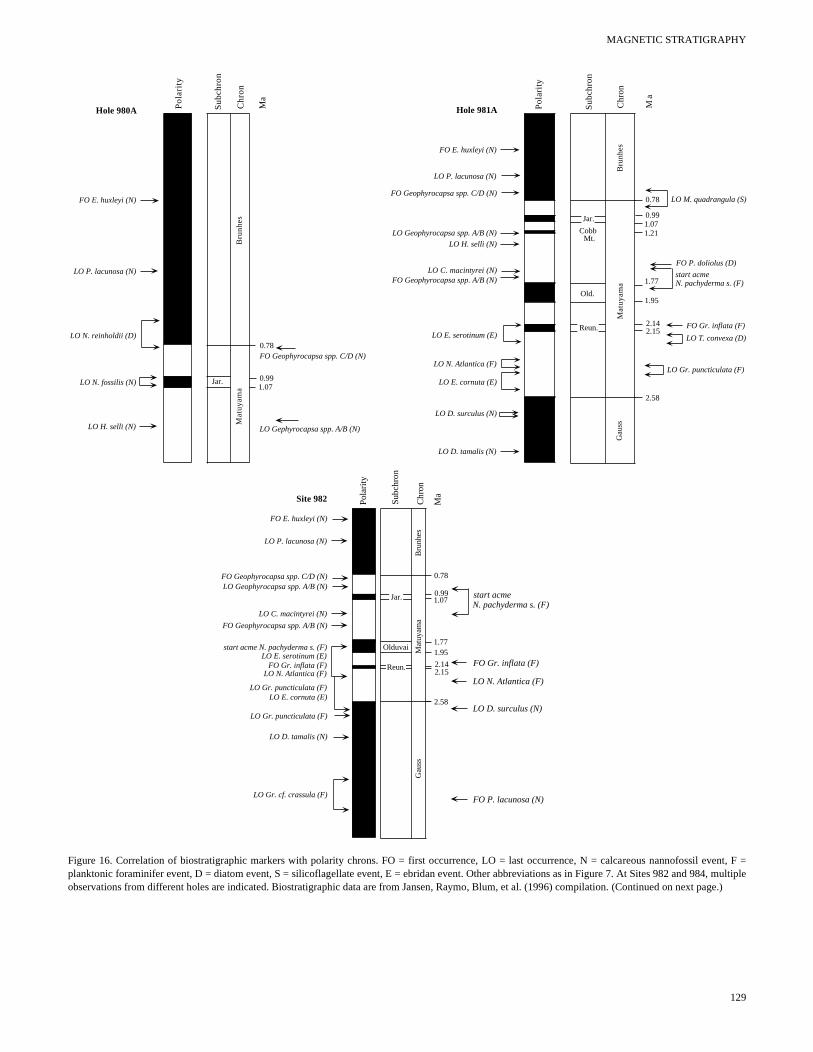
The quality of the magnetic stratigraphies at Sites 980–984 is sthat magnetostratigraphic (polarity chron) interpretations canmade without the guidance of biostratigraphic datums. For this son, Sites 980–984 provide a useful reference for late Pliocene–Ptocene biomagnetostratigraphic correlations. The superpositiondering) of biostratigraphic events is generally consistent amongfour sites (Fig. 16); however, the correlations of biostratigrapevents with polarity chrons show some variations. For example,Gephyrocapsa spp. events occur between the Olduvai Subchron just above the Brunhes/Matuyama boundary. The exact position
-80 -40 0 40 800
20
40
60
80
100
120
Hole 980CInclination (°)
Dep
th (
mbs
f)
-80 -40 0 40 80
Hole 980BInclination (°)
-80 -40 0 40 80
Hole 980AInclination (°)
Pol
arity
Sub
chro
n
Chr
on
Ma
Bru
nh
es
Mat
uyam
a
Jar.0.99
1.07
0.78
Figure 3. Shipboard (pass-through magnetometer) inclination data after AF demagnetization at peak fields of 25 mT for Site 980 in the 0–120 mbsf intervalOpen squares indicate component inclinations determined from discrete (7 cm3) samples measured postcruise. Component directions were computedorthogonal projections of AF demagnetization data. Jar. = Jaramillo.
116
uchbeea-leis-(or- theic
thends of
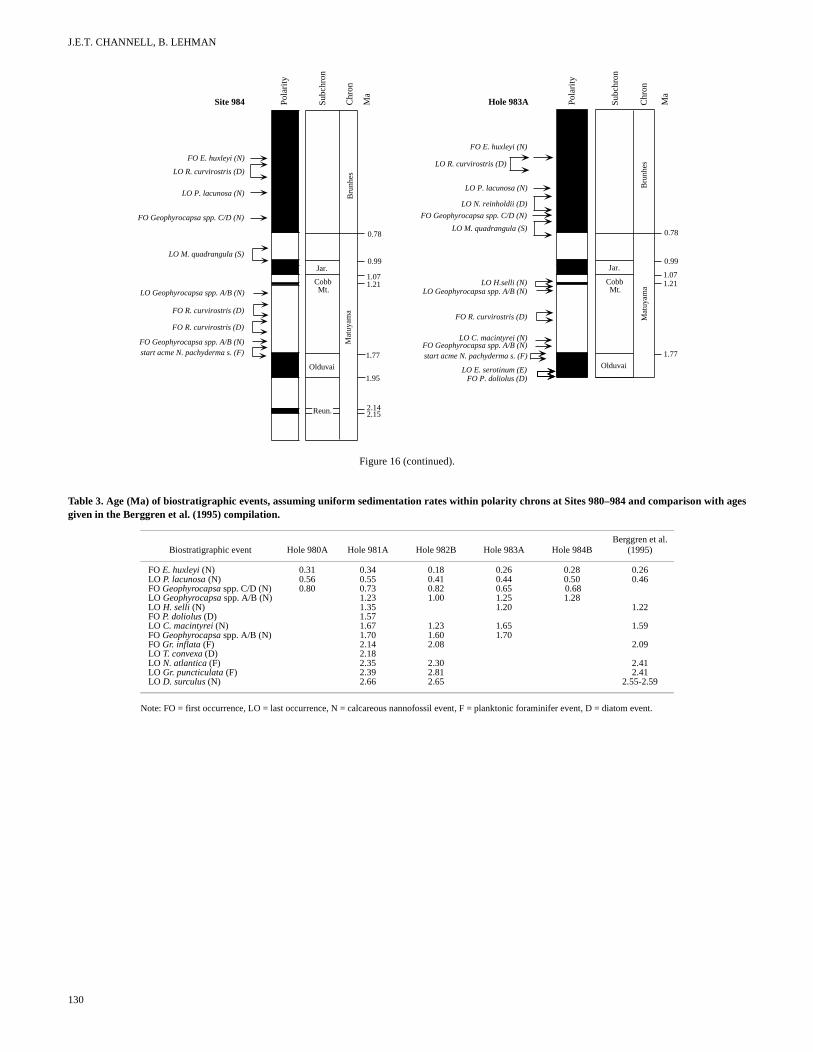
each of these events vary, however, from site to site (Fig. 16). Assing uniform sedimentation rate within polarity chrons, we have cculated the age of well-defined biostratigraphic events and compathese ages with the compilation of Berggren et al. (1995) (TableAlthough the site with the lowest sedimentation rates (Site 9yields the more inconsistent ages of bioevents, these ages are gally consistent with the Berggren et al. (1995) compilation.
ACKNOWLEDGMENTS
We thank C. Kissel and C. Laj for logistical support, K. Huang flaboratory assistance, and B. Clement and G. Muttoni for reviewthe manuscript. The paleomagnetic laboratory at Gif-sur-Yvette
MA
GN
ET
IC S
TR
AT
IGR
AP
HY
117
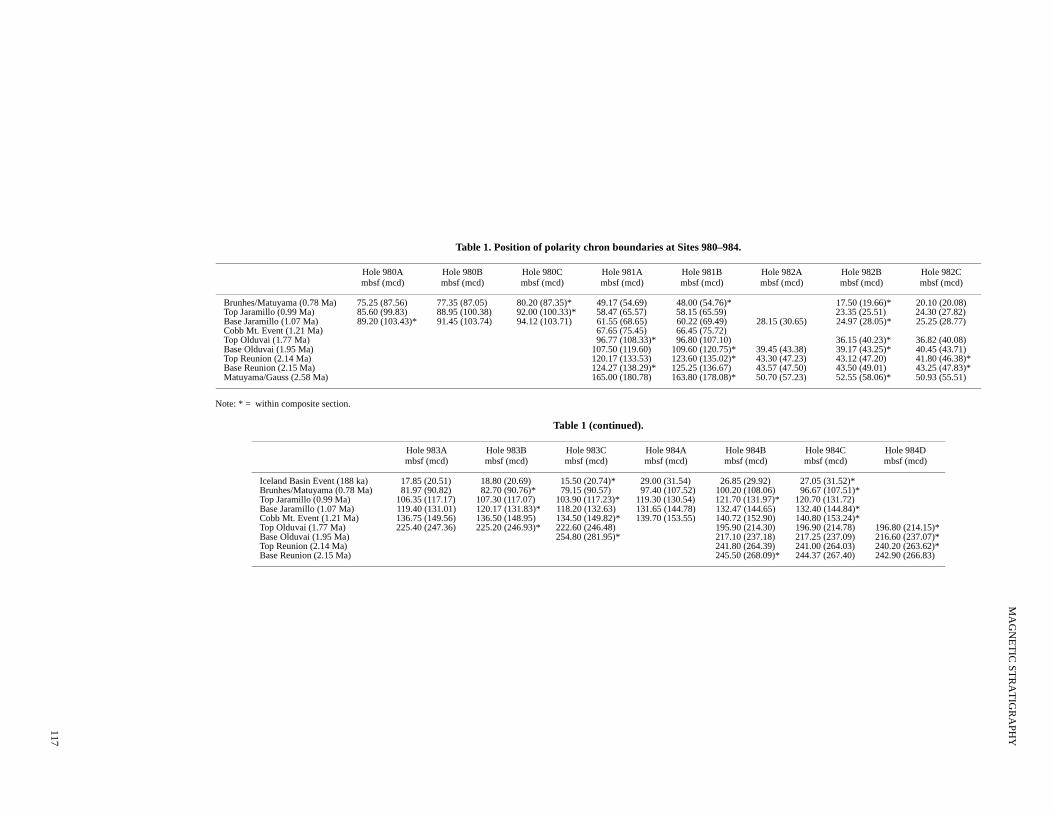
chron boundaries at Sites 980–984.
Note
1 (continued).
Hole 981Ambsf (mcd)
Hole 981Bmbsf (mcd)
Hole 982Ambsf (mcd)
Hole 982Bmbsf (mcd)
Hole 982Cmbsf (mcd)
Br 49.17 (54.69) 48.00 (54.76)* 17.50 (19.66)* 20.10 (20.08)To 58.47 (65.57) 58.15 (65.59) 23.35 (25.51) 24.30 (27.82)Ba 61.55 (68.65) 60.22 (69.49) 28.15 (30.65) 24.97 (28.05)* 25.25 (28.77)Co 67.65 (75.45) 66.45 (75.72)To 96.77 (108.33)* 96.80 (107.10) 36.15 (40.23)* 36.82 (40.08)Ba 107.50 (119.60) 109.60 (120.75)* 39.45 (43.38) 39.17 (43.25)* 40.45 (43.71)To 120.17 (133.53) 123.60 (135.02)* 43.30 (47.23) 43.12 (47.20) 41.80 (46.38)*Ba 124.27 (138.29)* 125.25 (136.67) 43.57 (47.50) 43.50 (49.01) 43.25 (47.83)*M 165.00 (180.78) 163.80 (178.08)* 50.70 (57.23) 52.55 (58.06)* 50.93 (55.51)
e 983Cf (mcd)
Hole 984Ambsf (mcd)
Hole 984B mbsf (mcd)
Hole 984Cmbsf (mcd)
Hole 984Dmbsf (mcd)
(20.74)* 29.00 (31.54) 26.85 (29.92) 27.05 (31.52)* (90.57) 97.40 (107.52) 100.20 (108.06) 96.67 (107.51)* (117.23)* 119.30 (130.54) 121.70 (131.97)* 120.70 (131.72) (132.63) 131.65 (144.78) 132.47 (144.65) 132.40 (144.84)* (149.82)* 139.70 (153.55) 140.72 (152.90) 140.80 (153.24)* (246.48) 195.90 (214.30) 196.90 (214.78) 196.80 (214.15)* (281.95)* 217.10 (237.18) 217.25 (237.09) 216.60 (237.07)*
241.80 (264.39) 241.00 (264.03) 240.20 (263.62)*245.50 (268.09)* 244.37 (267.40) 242.90 (266.83)
Table 1. Position of polarity
: * = within composite section.
Table
Hole 980Ambsf (mcd)
Hole 980Bmbsf (mcd)
Hole 980Cmbsf (mcd)
unhes/Matuyama (0.78 Ma) 75.25 (87.56) 77.35 (87.05) 80.20 (87.35)*p Jaramillo (0.99 Ma) 85.60 (99.83) 88.95 (100.38) 92.00 (100.33)*se Jaramillo (1.07 Ma) 89.20 (103.43)* 91.45 (103.74) 94.12 (103.71)bb Mt. Event (1.21 Ma)p Olduvai (1.77 Ma)se Olduvai (1.95 Ma)p Reunion (2.14 Ma)se Reunion (2.15 Ma)atuyama/Gauss (2.58 Ma)
Hole 983Ambsf (mcd)
Hole 983Bmbsf (mcd)
Holmbs
Iceland Basin Event (188 ka) 17.85 (20.51) 18.80 (20.69) 15.50Brunhes/Matuyama (0.78 Ma) 81.97 (90.82) 82.70 (90.76)* 79.15Top Jaramillo (0.99 Ma) 106.35 (117.17) 107.30 (117.07) 103.90Base Jaramillo (1.07 Ma) 119.40 (131.01) 120.17 (131.83)* 118.20Cobb Mt. Event (1.21 Ma) 136.75 (149.56) 136.50 (148.95) 134.50Top Olduvai (1.77 Ma) 225.40 (247.36) 225.20 (246.93)* 222.60Base Olduvai (1.95 Ma) 254.80Top Reunion (2.14 Ma)Base Reunion (2.15 Ma)
J.E.T. CHANNELL, B. LEHMAN
ale
etic
etic
supported by CEA and CNRS. At the University of Florida, thisproject was supported by the U.S. Science Support Program, LSCEcontribution number 35.
REFERENCES
Berggren, W.A., Hilgen, F.J., Langereis, C.G., Kent, D.V., Obradovich, J.D.,Raffi, I., Raymo, M.E., and Shackleton, N.J., 1995. Late Neogene chro-nology: new perspectives in high-resolution stratigraphy. Geol. Soc. Am.Bull., 107:1272–1287.
Figure 4. Orthogonal projection of AF demagnetization data from discrete samples in the 20–170 mbsf interval of Hole 981A. Open and solid symbols indicateprojections on the vertical and horizontal planes, respectively. J0 = magnetization intensity before demagnetization.
118
Cande, S.C., and Kent, D.V., 1992. A new geomagnetic polarity time scfor the Late Cretaceous and Cenozoic. J. Geophys. Res., 97:13917–13951.
Cande, S.C., and Kent, D.V., 1995. Revised calibration of the geomagnpolarity timescale for the Late Cretaceous and Cenozoic. J. Geophys.Res., 100:6093–6095.
Channell, J.E.T., Hodell, D.A., and Lehman, B., 1997. Relative geomagnpaleointensity and δ18O at ODP Site 983 (Gardar Drift, North Atlantic)since 350 ka. Earth Planet. Sci. Lett., 153: 103–118.
MAGNETIC STRATIGRAPHY
.,n
Clement, B.M., and Kent, D.V., 1987. Short polarity intervals within theMatuyama: transitional field records from hydraulic piston core sitesfrom the North Atlantic. Earth Planet. Sci. Lett., 81:253–264.
Jansen, E., Raymo, M.E., Blum, P., et al., 1996. Proc. ODP, Init. Repts., 162:College Station, TX (Ocean Drilling Program).
Kirschvink, J.L., 1980. The least-squares line and plane and the analyspalaeomagnetic data. Geophys. J. R. Astron. Soc., 62:699–718.
Shipboard Scientific Party, 1996a. Explanatory notes. In Jansen, E., Raymo,M.E., Blum, P., et al., Proc. ODP, Init. Repts., 162: College Station, TX(Ocean Drilling Program), 21–45.
Shipboard Scientific Party, 1996b. Sites 980/981. In Jansen, E., Raymo,M.E., Blum, P., et al., Proc. ODP, Init. Repts., 162: College Station, TX(Ocean Drilling Program), 49–90.
eg
is of
Shipboard Scientific Party, 1996c. Site 982. In Jansen, E., Raymo, M.EBlum, P., et al., Proc. ODP, Init. Repts., 162: College Station, TX (OceaDrilling Program), 91–138.
Date of initial receipt: 10 September 1997Date of acceptance: 11 June 1998Ms 162SR-002
0
20
40
60
80
100
Site 982
0.01 0.1 1 10 100
Magnetization Intensity (mA/m) at
Dep
th (
mbs
f)
B)
0
50
100
150
200
250
Site 981
0.01 0.1 1 10 100
Dep
th (
mbs
f)
Magnetization Intensity (mA/m) at 25mT 25mT
A)
Figure 5. Magnetization intensities (after AF demagnetization at peak fiof 25 mT) of archive core halves from the shipboard pass-through matometer for (A) Holes 981A and 981B combined and (B) Holes 982A, 982B,and 982C combined.
ldsne-
0 100 200 300 4000
50
100
150
200
250
Hole 981A
Magnetic susceptibility (SI units)
A)
0 40 80 1200
20
40
60
80
100
Hole 982A/982B
Magnetic susceptibility (SI units)
Dep
th (
mbs
f)
Dep
th (
mbs
f)
B)
Figure 6. Volume susceptibility from the shipboard multisensor track.A.Hole 981A. B. Holes 982A and 982B.
119
J.E.T. CHANNELL, B. LEHMAN
from
-80 -40 0 40 800
50
100
150
200
Hole 981BInclination (°)
Dep
th (
mbs
f)
-80 -40 0 40 80
Hole 981AInclination (°)
Pol
arity
Sub
chro
n
Chr
on
Ma
Bru
nhes
Mat
uyam
a
Old.
Reun.
Gau
ss
Jar.
CobbMt.
0.78
0.99
1.07
1.21
1.77
1.95
2.14
2.15
2.58
Figure 7. Shipboard (pass-through magnetometer) inclination data after AF demagnetization at peak fields of 25 mT for Site 981 in the 0–200 mbsf interval.Open squares indicate component inclinations determined from discrete (7 cm3) samples measured postcruise. Component directions were computedorthogonal projections of AF demagnetization data. Jar. = Jaramillo, Reun. = Reunion, Old. = Olduvai.
120
MAGNETIC STRATIGRAPHY
Figure 8. Orthogonal projection of AF demagnetization data from discrete samples in the 15–70 mbsf interval of Hole 982B. Open and solid symbols indicateprojection on the vertical and horizontal planes, respectively. Other symbols as for Figure 2.
121
J.E.T. CHANNELL, B. LEHMAN
. from
-80 -40 0 40 800
20
40
60
80
Hole 982AInclination (°)
Dep
th (
mbs
f)
-80 -40 0 40 80
Hole 982CInclination (°)
-80 -40 0 40 80
Hole 982BInclination (°)
Pol
arity
Sub
chro
n
Chr
on
Ma
Bru
nhes
Mat
uyam
a
Olduvai
Reunion
Gau
ss
Jar.
0.78
0.991.07
1.77
1.95
2.142.15
2.58
Figure 9. Shipboard (pass-through magnetometer) inclination data after AF demagnetization at peak fields of 25 mT for Site 982 in the 0–90 mbsf intervalOpen squares indicate component inclinations determined from discrete (7 cm3) samples measured postcruise. Component directions were computedorthogonal projections of AF demagnetization data. Jar. = Jaramillo.
122
MAGNETIC STRATIGRAPHY
e
Figure 10. Orthogonal projection of AF demagnetization data from discrete samples in the 60–260 mbsf interval of Hole 983A. Open and solid symbols indicatprojection on the vertical and horizontal planes, respectively. Other symbols as for Figure 2.123
J.E.T. CHANNELL, B. LEHMAN
.ogonal
-80 -40 0 40 800
50
100
150
200
250
Hole 983CInclination (°)
Dep
th (
mbs
f)
-80 -40 0 40 80
Hole 983BInclination (°)
-80 -40 0 40 80Inclination (°)
Pol
arity
Old
uvai
Mat
uyam
a
Cobb
Jar.
Bru
nh
es
Su
bch
ron
Ch
ron
Gilsa?
Ma
0.78
0.99
1.07
1.21
1.77
Mt.
Hole 983A
Figure 11. Shipboard (pass-through magnetometer) inclination data after AF demagnetization at peak fields of 25 mT for Site 983 in the 0–260 mbsf intervalOpen squares indicate component inclinations determined from discrete (7 cm3) samples measured postcruise. Component directions computed from orthprojections of AF demagnetization data. Jar. = Jaramillo.
124
MA
GN
ET
IC S
TR
AT
IGR
AP
HY
125
980–984.
nion Event (0.032 m.y.) from Cande and Kent (1992).
le 981Bsf/m.y.
cd/m.y.)
Hole 982Ambsf/m.y.(mcd/m.y.)
Hole 982Bmbsf/m.y.(mcd/m.y.)
Hole 982Cmbsf/m.y.(mcd/m.y.)
4 (70.21) 22.44 (25.21) 25.77 (25.74)
3 (51.57) 27.86 (27.86) 20.00 (36.86)
6 (48.75) 20.25 (31.75) 11.88 (11.88)
0 (44.50)
0 (56.04)
1 (75.56) 16.78 (16.78) 20.17 (20.17)
8 (75.37) 20.26 (20.26) 20.79 (20.79) 7.11 (14.05)
5 (165) 270 (270) 380 (181) 145 (145)6 (51.56)* 8.44 (8.44)* 11.87 (56.56)* 45.31 (45.31)*
5 (96.30) 16.58 (22.63) 21.05 (21.05) 17.86 (17.86)
Hole 984Bmbsf/m.y.(mcd/m.y.)
Hole 984Cmbsf/m.y.(mcd/m.y.)
Hole 984Dmbsf/m.y.(mcd/m.y.)
144.35 (160.86) 145.43 (169.46)
123.48 (131.55) 117.21 (127.93)
102.38 (113.86) 114.43 (115.29)
134.63 (158.50) 146.25 (164.00)
58.93 (58.93) 60.00 (60.00)
98.54 (109.64) 100.18 (109.89)
117.78 (127.11) 113.06 (123.94) 110.00 (128.44)
130.00 (143.21) 125.00 (141.79) 124.21 (138.68)
370 (370) 337 (337) 270 (321)115.63 (115.63) 105.31 (105.31)* 84.38 (100.31)*
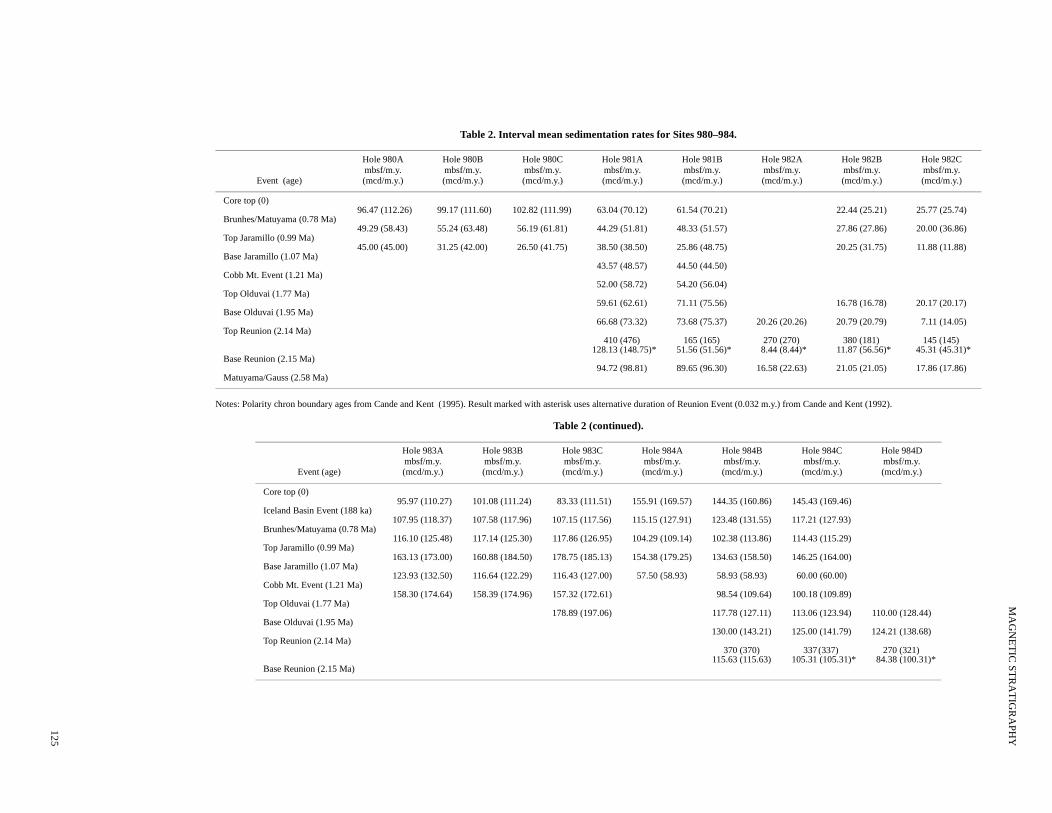
Table 2. Interval mean sedimentation rates for Sites
Notes: Polarity chron boundary ages from Cande and Kent (1995). Result marked with asterisk uses alternative duration of Reu
Table 2 (continued).
Event (age)
Hole 980Ambsf/m.y.(mcd/m.y.)
Hole 980Bmbsf/m.y.(mcd/m.y.)
Hole 980Cmbsf/m.y.(mcd/m.y.)
Hole 981Ambsf/m.y.(mcd/m.y.)
Homb(m
Core top (0)96.47 (112.26) 99.17 (111.60) 102.82 (111.99) 63.04 (70.12) 61.5
Brunhes/Matuyama (0.78 Ma)49.29 (58.43) 55.24 (63.48) 56.19 (61.81) 44.29 (51.81) 48.3
Top Jaramillo (0.99 Ma)45.00 (45.00) 31.25 (42.00) 26.50 (41.75) 38.50 (38.50) 25.8
Base Jaramillo (1.07 Ma)43.57 (48.57) 44.5
Cobb Mt. Event (1.21 Ma)52.00 (58.72) 54.2
Top Olduvai (1.77 Ma)59.61 (62.61) 71.1
Base Olduvai (1.95 Ma)66.68 (73.32) 73.6
Top Reunion (2.14 Ma)410 (476) 16
128.13 (148.75)* 51.5Base Reunion (2.15 Ma)
94.72 (98.81) 89.6Matuyama/Gauss (2.58 Ma)
Event (age)
Hole 983Ambsf/m.y.(mcd/m.y.)
Hole 983Bmbsf/m.y.(mcd/m.y.)
Hole 983Cmbsf/m.y.(mcd/m.y.)
Hole 984Ambsf/m.y.(mcd/m.y.)
Core top (0)95.97 (110.27) 101.08 (111.24) 83.33 (111.51) 155.91 (169.57)
Iceland Basin Event (188 ka)107.95 (118.37) 107.58 (117.96) 107.15 (117.56) 115.15 (127.91)
Brunhes/Matuyama (0.78 Ma)116.10 (125.48) 117.14 (125.30) 117.86 (126.95) 104.29 (109.14)
Top Jaramillo (0.99 Ma)163.13 (173.00) 160.88 (184.50) 178.75 (185.13) 154.38 (179.25)
Base Jaramillo (1.07 Ma)123.93 (132.50) 116.64 (122.29) 116.43 (127.00) 57.50 (58.93)
Cobb Mt. Event (1.21 Ma)158.30 (174.64) 158.39 (174.96) 157.32 (172.61)
Top Olduvai (1.77 Ma)178.89 (197.06)
Base Olduvai (1.95 Ma)
Top Reunion (2.14 Ma)
Base Reunion (2.15 Ma)
J.E.T. CHANNELL, B. LEHMAN
Figure 12. Orthogonal projection of AF demagnetization data from discrete samples in the 80–210 mbsf interval of Hole 984B. Open and solid symbols indicateprojection on the vertical and horizontal planes, respectively. Other symbols as for Figure 2.
126
MAGNETIC STRATIGRAPHY
from
-80 -40 0 40 800
50
100
150
200
250
300
Hole 984CInclination (°)
Dep
th (
mbs
f)
-80 -40 0 40 80
Hole 984A/Hole 984DInclination (°)
-80 -40 0 40 80
Hole 984BInclination (°)
Pol
arity
Sub
chro
n
Chr
on
Ma
Bru
nhes
Mat
uyam
a
Olduvai
Reunion
Jar.
CobbMt.
0.78
0.99
1.07
1.21
1.77
1.95
2.142.15
Gilsa?
Figure 13. Shipboard (pass-through magnetometer) inclination data after AF demagnetization at peak fields of 25 mT for Site 984 in the 0–300 mbsf interval.Open squares indicate component inclinations determined from discrete (7 cm3) samples measured postcruise. Component directions were computedorthogonal projections of AF demagnetization data. The Hole 984A and Hole 984D shipboard data are superimposed. The 0–176 mbsf interval was recoveredfrom Hole 984A, and the 0–8 and 166–270 mbsf intervals were recovered from Hole 984D. Jar. = Jaramillo.
127
J.E.T. CHANNELL, B. LEHMAN
983
1n
1r.1r
1r.1n
1r.2r
2n
50 meters
982
1n
1r.1r
1r.2r
2n
2r.2r
2An.1n
NO
DA
TA
984
1n
1r.1r
1r.1n
1r.2r
2n
2r.1n
2r.1r
NO
DA
TA
981
1n
1r.1r
1r.2r
2r.1r
2r.2r
2An.1n
2n
NO
DA
TA
980
1n
1r.1r
1r.2r
1r.1n
Figure 14. Magnetic polarity stratigraphies from Sites 980 to 984 on a uni-form vertical (depth) scale. Polarity chron nomenclature from Cande andKent (1992).
128
0
50
100
150
200
250
300
Dep
th (
mbs
f)
Site 982
Site 981
Site 980
Site 983
Site 984
50
100
150
200
250
3000 0.5 1 1.5 2 2.5 3
Dep
th (
mcd
)
Age (Ma)
Site 982
Site 981
Site 980
Site 983Site 984
Figure 15. Age-depth plots based on magnetostratigraphic interpretations forindividual holes from each site. Top = meters below seafloor, base = meterscomposite depth.
MAGNETIC STRATIGRAPHY
Pol
arit
y
Sub
chro
n
Chr
on
Ma
Bru
nhes
Mat
uyam
a
Old.
Gau
ss
CobbMt.
0.78
0.991.071.21
1.77
1.95
2.142.15
2.58
LO D. tamalis (N)
LO D. surculus (N)
LO E. cornuta (E)
LO N. Atlantica (F)
LO E. serotinum (E)
FO Geophyrocapsa spp. A/B (N)LO C. macintyrei (N)
LO H. selli (N)
LO Geophyrocapsa spp. A/B (N)
FO Geophyrocapsa spp. C/D (N)
LO P. lacunosa (N)
FO E. huxleyi (N)
LO M. quadrangula (S)
FO P. doliolus (D)
start acme N. pachyderma s. (F)
FO Gr. inflata (F)
LO T. convexa (D)
LO Gr. puncticulata (F)
Hole 981A Pol
arit
y
Sub
chro
n
Chr
on
Ma
Bru
nhes
Mat
uyam
a
Jar. 0.991.07
0.78
FO E. huxleyi (N)
LO P. lacunosa (N)
LO N. reinholdii (D)
FO Geophyrocapsa spp. C/D (N)
LO H. selli (N) LO Gephyrocapsa spp. A/B (N)
LO N. fossilis (N)
Hole 980A
Jar.
Reun.
Pola
rity
Subc
hron
Chr
on
Ma
Bru
nhes
Mat
uyam
a
Olduvai
Reun.
Gau
ss
0.78
0.991.07
1.771.95
2.142.15
2.58
LO D. tamalis (N)
LO D. surculus (N)LO E. cornuta (E)
LO N. Atlantica (F)
LO E. serotinum (E)
FO Geophyrocapsa spp. A/B (N)
LO C. macintyrei (N)
LO Geophyrocapsa spp. A/B (N)FO Geophyrocapsa spp. C/D (N)
LO P. lacunosa (N)
FO E. huxleyi (N)
start acme N. pachyderma s. (F)
FO Gr. inflata (F)
LO Gr. puncticulata (F)
FO P. lacunosa (N)
FO Gr. inflata (F)
LO Gr. cf. crassula (F)
LO Gr. puncticulata (F)
LO N. Atlantica (F)
start acmeN. pachyderma s. (F)
Site 982
Jar.
Figure 16. Correlation of biostratigraphic markers with polarity chrons. FO = first occurrence, LO = last occurrence, N = calcareous nannofossil event, F =planktonic foraminifer event, D = diatom event, S = silicoflagellate event, E = ebridan event. Other abbreviations as in Figure 7. At Sites 982 and 984, multipleobservations from different holes are indicated. Biostratigraphic data are from Jansen, Raymo, Blum, et al. (1996) compilation. (Continued on next page.)
129
J.E.T. CHANNELL, B. LEHMAN
130
Hole 983A Pola
rity
Subc
hron
Chr
on
Ma
Bru
nhes
Mat
uyam
a
Olduvai
Jar.
CobbMt.
CobbMt.
0.78
0.99
1.071.21
1.77FO Geophyrocapsa spp. A/B (N)
LO Geophyrocapsa spp. A/B (N)
FO Geophyrocapsa spp. C/D (N)
LO P. lacunosa (N)
FO E. huxleyi (N)
start acme N. pachyderma s. (F)
LO R. curvirostris (D)
LO M. quadrangula (S)
FO R. curvirostris (D)
LO H.selli (N)
LO E. serotinum (E)
LO C. macintyrei (N)
FO P. doliolus (D)
LO N. reinholdii (D)
Site 984 Pola
rity
Subc
hron
Chr
on
Ma
Bru
nhes
Mat
uyam
a
Olduvai
Reun.
Jar.
0.78
0.99
1.071.21
1.77
1.95
2.142.15
FO Geophyrocapsa spp. A/B (N)
LO Geophyrocapsa spp. A/B (N)
FO Geophyrocapsa spp. C/D (N)
LO P. lacunosa (N)
FO E. huxleyi (N)
start acme N. pachyderma s. (F)
LO R. curvirostris (D)
LO M. quadrangula (S)
FO R. curvirostris (D)
FO R. curvirostris (D)
Figure 16 (continued).
Table 3. Age (Ma) of biostratigraphic events, assuming uniform sedimentation rates within polarity chrons at Sites 980–984 and comparison with agesgiven in the Berggren et al. (1995) compilation.
Note: FO = first occurrence, LO = last occurrence, N = calcareous nannofossil event, F = planktonic foraminifer event, D = diatom event.
Biostratigraphic event Hole 980A Hole 981A Hole 982B Hole 983A Hole 984BBerggren et al.
(1995)
FO E. huxleyi (N) 0.31 0.34 0.18 0.26 0.28 0.26LO P. lacunosa (N) 0.56 0.55 0.41 0.44 0.50 0.46FO Geophyrocapsa spp. C/D (N) 0.80 0.73 0.82 0.65 0.68LO Geophyrocapsa spp. A/B (N) 1.23 1.00 1.25 1.28LO H. selli (N) 1.35 1.20 1.22FO P. doliolus (D) 1.57 LO C. macintyrei (N) 1.67 1.23 1.65 1.59FO Geophyrocapsa spp. A/B (N) 1.70 1.60 1.70 FO Gr. inflata (F) 2.14 2.08 2.09LO T. convexa (D) 2.18 LO N. atlantica (F) 2.35 2.30 2.41LO Gr. puncticulata (F) 2.39 2.81 2.41LO D. surculus (N) 2.66 2.65 2.55-2.59