Embed Size (px)
Citation preview
The Complex Influences of Backbarrier Deposition, Substrate Slope and UnderlyingStratigraphy in Barrier Island Response to Sea Level Rise: Insights from the Virginia
Barrier Islands, Mid-Atlantic Bight, U.S.A.
Owen Thomas Brenner
Ringoes, NJ
B.A., Colgate University, 2008
A Thesis Presented to the Graduate Facultyof the University of Virginia in Candidacy for the Degree
of Master of Science
Department of Environmental Sciences
University of Virginia
May 2012

ii
ABSTRACT
In order to persist during periods of relative sea level rise (RSLR) a barrier island
must migrate landward (primarily via storm related overwash processes) to maintain
elevation above sea level. While rates of landward migration are largely determined by
the rate of RSLR, island behavior (e.g., migration rates, island volume) is also influenced
by numerous other physical processes and factors. To better understand the relative
importance of contributing variables, I use GEOMBEST, a 2-D cross shore
morphological-behavior model, to conduct a series of sensitivity experiments based on
hindcast (late-Holocene) simulations of northern (marsh-backed) and southern (lagoon-
backed) Metompkin Island along the Virginia Coast in the Mid-Atlantic Bight of the
United States. I draw comparisons between these results and simulations of future (2000-
2100 AD) island response to RSLR to disentangle the relative influences of backbarrier
deposition, substrate slope, and underlying stratigraphy on barrier island behavior.
Results from late-Holocene sensitivity analyses indicate that Metompkin Island,
as a whole, is highly sensitive to factors that reduce overall sand availability (i.e., high
sand-loss rates and substrates that contain little sand). Southern Metompkin Island is
even more sensitive to sand-deficient conditions than its northern counterpart (as
evidenced by faster migration rates) due to a lower vertical position of the underlying
backbarrier unit. During simulations in which island migration occurs along different
portions of the substrate surface, variations in substrate slope alter the resulting
backbarrier and island configuration, such that low substrate slopes (<1m/km) promote an
expansion of the backbarrier region and a decrease in island volume, while higher
(>1m/km) substrate slopes limit or reduce backbarrier width and account for volume

iii
increases. I suggest that relatively rapid changes in the thickness of backbarrier deposits
in response to substrate slope variability modulate barrier island response to RSLR
allowing the barrier island migration trajectory, and therefore migration rates, to be more
consistent through time. However, future simulations suggests that if backbarrier
deposition rates—in both the salt marsh and open lagoon—do not sufficiently adjust to
future RSLRR, changes in the extent and thickness of backbarrier deposits may not occur
rapidly enough, thus requiring more drastic change in barrier island behavior in response
to substrate slope variability. Results from future simulations also indicate that for all
predicted future RSLR scenarios tested, Metompkin Island, if allowed to migrate freely,
will likely avoid disintegration or submergence due to sufficient substrate sand content
and landward elevation change.

iv
ACKNOWLEDGEMENTS
First, I would like to thank my advisor, Laura Moore, for her careful guidance and
constant support throughout all stages of this project. I would also like to thank the
members of my committee, Pat Wiberg, Alan Howard, and Brad Murray for all their
helpful feedback and advice. I am very grateful to so many of my fellow graduate
students and lab mates (Dana Oster, Amy Grady, Cat Wolner, Sean McLoughlin, Jenn
Holm, Kiki Patsch, etc.) for their unrelenting assistance and encouragement. Lastly, I
need to thank my family and friends for their ongoing support throughout my graduate
career. Funding for this project was provided by the Virginia Coastal Reserve Long-
Term Ecological Research (VCR LTER) site and the Department of Environmental
Sciences at the University of Virginia.

v
TABLE OF CONTENTS
Abstract…………………………………………………………………………………………… ii
Acknowledgements………………………………………………………………………………. iv
Table of Contents………………………………………………………………...……………….. v
List of Figures and Tables………………………………………….……………………………. vi
1. Introduction …………………………………………………………………………………... 1
1.1 Background……………………………………………………………………………… 1
1.2 Study Site………………………………………………………………………………... 4
2. Simulation Development………………………………………………………………...…… 8
2.1 Morphological-Behavior Modeling with GEOMBEST…………………………………. 8
2.2 Development of late-Holocene Simulation Inputs………………………………………. 9
2.3 Calibration of late-Holocene Base Simulations………………………………………... 15
3. Results and Interpretations…………………………………………………………………. 17
3.1 Sensitivity Analysis…………………………………………………………………….. 18
3.2 Future Simulations……………………………………………………………………... 26
5. Discussion…………………………………………………………………………………….. 31
4.1 Model Limitations……………………………………………………………………… 31
4.2 Insights on Geologic Constraints………………………………………………………. 32
4.3 Sand availability………………………………………………………………………... 33
4.4 Substrate Slope Effects…………………………………………………………………. 35
4.5 Implications of Future Simulations…………………………………………………….. 40
5. Conclusions……………………………………………………………………………...…… 43
Figures and Tables………………………………………………………………………………. 46
References…………………………………………………………………………...…………... 65

vi
LIST OF FIGURES AND TABLES
Figure 1 Map of Eastern Shore of Virginia
Figure 2 Image of Metompkin Island
Figure 3 Formation of mid-island offset
Figure 4 GEOMBEST diagram
Figure 5 Modern morphology and stratigraphy
Figure 6 Late-Holocene initial morphology and stratigraphy
Figure 7 Model calibration: surface profiles
Figure 8 Change in island migration rate during sensitivity analysis
Figure 9 Change in island volume change during sensitivity analysis
Figure 10 Sensitivity to changes in substrate sand content
Figure 11 Sensitivity to changes in substrate erodibility
Figure 12 Comparison of substrate slope, backbarrier width , and island volume
Figure 13 Island configuration during high RSLRR simulations
Figure 14 Modern island morphology and barrier island slope
Figure 15 Initial late-Holocene morphology and barrier island slope
Figure 16 Migration rate and island volume during future RSLR Scenarios
Figure 17 Cumulative substrate sand content
Figure 18 Backbarrier and island response to substrate slope variability
Table 1 Model input parameters
Table 2 Variations in island behavior with future RSLR scenarios

1
1. INTRODUCTION
1.1 Background
Barrier islands line the eastern margin of the United States and are found on most
tectonically passive margins worldwide. The seaward position, low elevation, and
unconsolidated nature of these landforms make them vulnerable to changing background
conditions (e.g., rising sea level, changing sand-supply) and changes in driving forces
(e.g., storm activity). With large percentages of the world’s population concentrated in
coastal regions, understanding how barrier islands evolve in response to changing
conditions is critical to the management of private, public, and commercial interest.
Modern global temperature changes have been linked to high sea surface
temperatures causing an expansion of sea water which contributes to eustatic sea level
rise (RSLR) (IPCC, 2007), and an increase in tropical storm activity (Knutson et al.,
2010), both of which are likely to impact barrier islands into the future. While immediate
implications of single storm events may seem most pressing, the slow, continuous nature
of human-induced climate change (and particularly relative sea level rise (RSLR)) will
alter landscape evolution across longer time scales.
Understanding the impacts of climate change on barrier island behavior is of
utmost importance to the management of coastal environments, and geomorphic models
are a useful way to begin quantifying the range of possible future barrier island
behaviors. Barrier island response to climate change is likely to be complex and variable,
especially since changing background conditions (e.g., RSLR) and shifting small-scale
driving forces (i.e., storm activity) vary spatially and temporally. Barrier island response
to sea level rise is determined, in part, by the availability of sediment (e.g., Wolinsky &
Murray, 2009, Moore et al., 2010). If incoming sand-supply is sufficient to maintain

2
elevation during RSLR, a barrier island will remain in place or even prograde seaward.
However, given that most modern barrier islands are sediment-starved, they generally
must transgress landward to maintain subaerial exposure as sea level rises (e.g., Curray,
1964; Hayden et al., 1980).
Sediment deficiencies initiate island transgression via shoreface erosion and
eventual destruction of the primary dune, leading to island narrowing. The resulting
island morphology is increasingly susceptible to storm overwash, a process which
mobilizes sediment from the shoreface and beach, transporting it landward beyond the
dune crest, and depositing it on the back side of the island (e.g., Inman and Dolan, 1989).
This cyclical transport regime, also called island rollover, results in a more landward
island position through time (e.g., Hayden et al., 1980; Sallenger, 2003). If the resulting
island position is sufficiently elevated (relative to sea level), the island may begin to
stabilize through dune building processes, otherwise, storm overwash and migration will
persist. While storm related overwash events drive island migration over short temporal
scales, over long time periods the vertical position of the island relative to sea level
dictates the need for landward migration via overwash processes, and therefore RSLR is
the primary influence on long term island migration.
Barrier island response to RSLR is determined by complex interactions between
the geologic framework, physical processes, sediment budget, and human activity (e.g.,
Pilkey et al., 2000; Gutierrez et al., 2007; Wolinsky & Murray 2009; Moore et al., 2010).
For example, the amount of sand in near-surface geologic units influences sand-supply
rates, (McBride & Moslow, 1991; Moore et al., 2010) while the presence of elevated
marsh deposits provides a platform for barrier migration necessitating less landward
3
migration and sediment input to preserve island elevation (e.g., Rice et al., 1976;
Finkelstein, 1986; Stolper et.al, 2005; Oertel & Woo, 1995). Throughout the latter half
of the Holocene, barrier islands have been able to persist during climate change, largely
due to roll over processes. However, given uncertainties regarding the effects of
anthropogenic climate change (e.g., on RSLR, storm activity, sand-supply), the effect
future climate change will have on these dynamic landscapes is not yet clear. To better
understand the likely effect of climate change on barrier islands, it is necessary to assess
how specific physical characteristics (e.g., sand availability, stratigraphic relationships,
morphologic inconsistencies) influence island migration as sea level rises.
While previous research within the VCR-LTER has described various aspects of
barrier island morphologic change over the past 150 years, the majority of the
geomorphic history of these islands (from island formation until earliest surveys) remains
poorly understood, largely because indicators of historic island transgression are not well
preserved. However, understanding mechanisms of barrier island response to sea level
rise over long time scales is important in describing current island configuration and in
assessing possible island response to future sea level rise. For this reason, my primary
objectives are:
1. To simulate the late-Holocene (4600ybp-present) evolution of northern and
southern Metompkin Island based on constraints on island evolution available in
the scientific literature.
2. To evaluate the relative importance of physical parameters (particularly those
involving interactions between the island and backbarrier environments) in
determining island response to RSLR.
3. To assess the potential range of barrier island response to future RSLR scenarios.

4
To meet these objectives, I applied the cross-shore morphological-behavior
model, GEOMBEST (Stolper et al., 2005; Moore et al., 2010), to a field site—
Metompkin Island—along the Virginia Coast. Using sub-aerial and sub-aqueous
elevation data and published core interpretations, I created a representative average
modern coastal morphology and stratigraphy for north and south Metompkin Island.
Using the modern configuration as a reference, along with available geologic constraints
from the literature, I then constructed a plausible initial (4600ybp) island condition that
successfully reproduces the modern morphology and stratigraphy. These calibrated
simulations (of both north and south Metompkin), and the associated input values, are
considered the “base” late-Holocene simulations from which I performed a series of
systematic sensitivity analyses, varying one parameter at a time, to assess the relative
importance of a range of factors in determining barrier island response to RSLR. The
base-simulations also provide the basis for future simulations of barrier island response to
different RSLR scenarios.
1.2 Study Site
The Virginia Coast Reserve (VCR) encompasses 12 barrier islands extending
along 120km of the Virginia portion of the Delmarva Peninsula along the mid-Atlantic
Bight of the U.S. East Coast (Figure 1). Virtually uninhabited since the 1930’s and
devoid of large-scale human influences, the VCR represents one of the most naturally
evolving barrier coastal systems in North America, and therefore provides an
unparalleled opportunity to study barrier island evolution in the absence of direct human
impacts.

5
The tide-dominated barrier islands found along the southern half of the VCR
range in length from 4 to 12km, and are separated by stable tidal inlets. An approximate
20th
century relative sea level rise rate (RSLRR) of 3.5mm/yr (Hicks et al., 1983; Inman
& Dolan, 1989) and widespread sediment deficiencies (Demarest & Leatherman, 1985)
contribute to high chain-wide landward migration rates averaging 5m/yr (Dolan et al.,
1979). Exhibiting rapid shore-parallel shoreline retreat, the northernmost islands of the
VCR (Wallops, Assawomen, Metompkin, and Cedar) form a 40km concave embayment
dominated by erosion (Demarest & Leatherman, 1985) (Figure 1). Here, a scarcity of
sediment has led to rapid landward migration of the barrier islands and relatively narrow
backbarrier environments (Rice & Leatherman, 1983). Mechanisms to explain island
behavior within this embayment include: limited longshore sediment input from
Assateague Island (Rice & Leatherman, 1983); low paleo-topography caused by presence
of the ancient Susquehanna or Potomac River valley (Mixon, 1985; Foyle & Oertel,
1995); and a combination of minimal cross-shore sediment input and topographic relief
due to infilling of paleo-channels with fine mud (Oertel et al., 2008). The confined
lagoonal environments in this area have promoted recent deposition and the accumulation
of thick backbarrier deposits, facilitating the establishment of continuous salt marshes
over the past thousand years throughout much of this area. (Newman & Munsart, 1965;
Van de Plassche, 1990; Oertel & Woo, 1994).
Within the northern section of the VCR, Metompkin Island stretches 10.8 km
from Gargathy Inlet south to Metompkin Inlet (Figure 2). The island has minimal
topographic relief (maximum elevation ~3m) and a relatively constant width of ~200m.
Consistent with the mean VCR migration rate, the island has been transgressing landward

6
~ 5 m/yr throughout much of the 20th
century (Leatherman et al., 1982; Byrnes, 1988).
Limited regional sand-supply and rapid transgression have led to minimal dune
development and persistent overwash nearly island-wide (e.g., Wolner, 2011).
Metompkin Island is divided into northern and southern halves by a mid-island shoreline
offset, such that the shoreline of the southern half lies ~200 m west of the northern half
(Figure 2). Following the opening of an ephemeral inlet in 1957, the southern half of
Metompkin Island migrated at a rate approximately 2.5 times faster than the northern
half, resulting in a maximum shoreline offset of 400 m in 1981 (Byrnes, 1988)(Figure
1.3). Following inlet closure in 1981, the pattern of dissimilar migration rates reversed
and the shoreline has been actively straightening, although a significant offset still
remains today.
The northern half of the island is devoid of significant dunes and is backed by a
continuous marsh platform. Here, relic marsh deposits protrude into the swash zone
providing evidence of active island transgression. The southern half of Metompkin is
fronted by discontinuous dunes (max elevation ~ 3.5 m) interspersed with recent
overwash deposits. A fringing marsh (maximum width ~50 m) is prevalent along the
landward margin of the southern half of the island, and is best established in areas of
recent overwash, likely due to higher sediment input (Figure 2).
Co-located with the offset on the beach and shoreface, is a transition in the
backbarrier environment from platform marsh in the north to shallow open lagoon in the
south (Figure 2 & 3). To explain this transition, Byrnes (1988) suggests the importance of
underlying pre-Holocene fluvial topography, which slopes downward to the south. More
elevated vertical positions along the northern half of the island are thought to have helped

7
marsh vegetation remain subaerial during past RSLR. To the south, sediment deposition
has not been sufficient to fill the larger void space created by lower initial topography;
thus the backbarrier remains inundated and lagoonal conditions persist (Byrnes, 1988).
To improve our understanding of barrier island evolution I applied a cross-shore
morphological-behavior model, GEOMBEST, to simulate the evolution of Metompkin
Island. The apparent correlation between differences in backbarrier environment and
historic migration behavior (i.e., migration rate, maintenance of island volume, and
preservation of general backbarrier/island configuration) on Metompkin make it an ideal
location for this study. Additionally, the rapid, shore-parallel migration of Metompkin
Island increases the applicability of the 2-D cross-shore model and similar island-wide
model constraints for the northern and southern halves of the island (e.g., sand-loss rate,
RSLRR, shoreface depth, etc.), allow me to decipher the influence of differences between
the two island halves, primarily in terms of stratigraphy and backbarrier environment, on
island response.

8
2. SIMULATION DEVOLOPMENT
2.1 Morphological-behavior modeling with GEOMBEST
To model barrier island response to sea level rise within the VCR, I used the
Geomorphic Model of Barrier, Estuarine, and Shoreface Translations (GEOMBEST).
Initially developed by Stolper et al. (2005), GEOMBEST is a two dimensional cross-
shore morphological-behavior model that simulates the evolution of island morphology
and stratigraphy in response to RSLR and sand availability across decadal to millennial
time scales (Stolper et al., 2005; Moore et al., 2010) (Figure 4).
Despite seasonal and periodic variations in shoreface morphology (largely
associated with storms), shoreface and barrier morphology is generally found to be
invariant over long time scales (e.g., Larson, 1991). Thus, I defined (in GEOMBEST)
an “equilibrium morphology,” which is the shape of the modern surface profile extending
from the backbarrier to the base of the shoreface. As sea level rises throughout model
simulations, this equilibrium shoreface and barrier profile is shifted landward and upward
(representing response to overwash processes) at each time step to the horizontal and
vertical position that conserves sand. Throughout model simulations the shape of the
barrier and shoreface profile will tend toward the shape of the equilibrium profile,
however, maintenance of the equilibrium profile is not prescribed by the model and
sufficiently low sand-supply rates, non-erodible substrates, and/or rapid RSLR rates will
cause the simulated profile to deviate from the equilibrium profile. What makes
GEOMBEST different from similar morphological-behavior models (Bruun 1962,
Cowell et al., 1995) is that the shoreface and barrier morphology at each time step is
influenced by physical characteristics of the underlying stratigraphy. While other models

9
(e.g. Bruun 1962, Cowell, et al., 1995), assume the sediment below the barrier to be
readily available unconsolidated sand, field data (cores, ground penetrating radar)
typically indicate compositional heterogeneity. The amount of sand in the substrate (i.e.
substrate composition), how easily the substrate can be eroded (i.e., substrate erodibility),
and extent of shoreface exposure of each underlying unit influences how rapidly sand can
be liberated from the shoreface. By including these physical constraints, GEOMBEST
captures the influence of underlying geology on barrier island migration.
2.2 Development of late-Holocene Simulation Inputs
To apply GEOMBEST to Metompkin Island, I interpreted findings from the
scientific literature to develop a set of plausible initial conditions and to provide estimates
for model inputs. These include geometric constraints necessary to reproduce spatial
geologic relationships of the landscape within the model (e.g., stratigraphic
relationships), as well as local values for physical processes (RSLR, sediment-supply or
loss rates, etc.) important to barrier island migration. GEOMBEST input parameters, and
the development of estimates specific to Metompkin Island, are described below. For a
summary of input parameters and sources see Table 1.
2.2.1 Initial Morphology and Stratigraphy
To assist in the development of a plausible set of initial conditions, I began by
developing an average representation of modern morphology (i.e., surface profile, Figure
5) and underlying stratigraphy for the northern and southern halves of Metompkin Island.
To construct a representative surface profile, I combined modern bathymetric data

10
(NOAA National Coastal Elevation Model), LIDAR elevations (NASA: Charts 2005),
and mainland Delmarva Peninsula topography (USGS Seamless DEM) extending from
the center of the peninsula, across the barrier island system to approximately 45 km
offshore. Following methods of Moore et al., (2010) I extended ten shore-perpendicular
transects at 1-km increments across the northern and southern halves of the model
domain (5 transects on each) and extracted continuous surface elevation along each
transect. To create a representative average surface profile for each half of the island,
which also serves as the corresponding equilibrium morphology in GEOMBEST, I then
calculated an average profile for each group of 5 transects.
Based on core data for Metompkin Island and the surrounding area, I positioned
the top of each identified stratigraphic unit within the upper 20 m at its modern elevation
below the surface profile (units include modern barrier island sands, lagoonal deposits
and pre-Holocene material) (Finkelstein, 1986; Finkelstein & Ferland, 1987; Byrnes
1988; Wolner, 2011). The sand proportion (i.e., percent of the layer that is sand-sized
sediment) and erodibility (i.e., an index relating to degree of consolidation) of each unit is
specified in the input parameters based on estimates for each unit from core log data
(Table 1). Due to compositional differences pre-Holocene material is divided into
distinct units, with the lowermost unit being a late-Pleistocene fluvial deposit (dark tan
unit in figure 5) composed primarily of fine to coarse unconsolidated fluvial sand. The
upper surface of this unit has been heavily reworked by coastal and fluvial incision and
slopes downward, from north to south, in the along-shore direction. Overlying this layer,
is an early-Holocene lagoonal unit (tan unit in Figure 5) consisting of unconsolidated
sandy-silt. The upper portion of this unit is greatly influenced by the position of the

11
underlying late-Pleistocene layer, and therefore also dips to the south. Since this is the
uppermost unit, modern erosional processes also impact this surface resulting in spatially
varying topography (Finkelstein & Ferland, 1987; Byrnes 1988). Furthermore, because
the barrier island and backbarrier units migrate across this topographic surface, the
variations in topography impact island geometric relationships (e.g., relative size of
backbarrier and island) during migration, ultimately influencing island migration. In
addition to the deeper position of the late-Pleistocene fluvial unit in the southern
Metompkin Island region, due to different depositional environments sediment
characteristics of the backbarrier unit differ between island halves—the northern
backbarrier unit consists of with silty marsh material while the southern unit is primarily
fine, silty sand (Byrnes 1988).
Development of an initial mid-Holocene morphology and stratigraphy for
northern and southern Metompkin Island (i.e., the two morphologies and stratigraphies
used to represent a plausible starting point for island evolution in the model) also requires
estimation of the cross-shore location of the barrier island at the start of the simulation.
Basal peat found 6.6m below mean sea level (MSL) landward of Metompkin suggests
initial submergence of a backbarrier environment during sea level rise 4650 ypb
(Finkelstein, 1986; Finkelstein & Ferland, 1987). Finkelstein and Ferland (1987) use this
evidence to suggest the island was located approximately 4km offshore and 6.6m below
the modern position 4650 years ago. This change in elevation over the past 4650yr
represents a RSLR rate of 1.44mm/yr, which is consistent with both local historic relative
sea level curves (Newman & Munsart, 1965; Byrnes, 1988) and regional late-Holocene
RSLRR estimates (Engelhart et al., 2009) further supporting the estimates of Finkelstein

12
and Ferland (1987). In contrast, Byrnes (1988) estimates that approximately 4,600 years
ago, when sea level was 6.6m below its modern position, Metompkin Island was 1.1km
seaward of its current position (though the basis for this estimate was not provided).
Pairing of geometric constraints imposed by the location of the modern surface profile
with published estimates of mid-Holocene island position and estimated values from the
literature for shoreface depth, indicates that the latter estimate for mid-Holocene island
position is geometrically implausible. Based on the current location of the shoreface,
island position 4600 BP must have been at least 2 km seaward of the current location, and
likely significantly more, assuming any degree of shoreface incision during migration
(Figures 5 & 6). Based on this analysis, I selected 4600 years ago as the starting point for
simulations with the initial barrier island located 4 km offshore and 6.6 m below the
modern barrier location. After positioning the barrier island in the model domain, I
extended each stratigraphic unit seaward to meet the newly positioned initial surface
profiles, resulting in initial island conditions for the late-Holocene simulations of
northern and southern Metompkin Island (Figure 6).
2.2.2 Shoreface Depth & Depth Dependent Response Rate
The shoreface depth, dependent mostly on local wave climate and offshore
bathymetry, defines the lower limit of the area across which wave energy moves
sediment at long (centurial to millennial) time scales. Expressed in GEOMBEST as the
lower limit of the equilibrium morphology and the depth at which shoreface erosion and
accretion rates decrease to zero, this parameter limits the extent of actively eroding
shoreface that can supply sand to the barrier island during transgression. Following

13
Evert’s (1978) method of identifying the base of the shoreface as a subtle break in
shoreface slope, I estimated a shoreface depth of 6.5m for Metompkin Island. The Depth
Dependent Response Rate (DDRR) defines the maximum potential rate of shoreface
erosion (or accretion) as a function of depth. This parameter accounts for the decrease in
wave orbital velocity with depth, and the corresponding decrease in the ability of wave
action to mobilize sediment. However, field studies do not provide guidance on a
reasonable estimate for this relationship, and therefore, similar to previous studies (e.g.,
Moore et al., 2010), a linear rate of 1 m/yr was extrapolated from sea level (0 m) to a rate
of 0 cm/yr at the shoreface depth (6.5 m).
2.2.3 Sand-Supply Rate
Unlike other morphological-behavior models (Bruun, 1965), GEOMBEST
captures the general, time-averaged effects of shore-parallel (longshore) sediment
transport processes via a sand-supply or -loss rate. Because GEOMBEST conserves sand
in the cross-shore direction, the sand-supply or -loss rate reflects the addition or removal
of sand (in m3/m/yr) in the alongshore direction. To date there are no published
estimates of longshore transport for Metompkin Island, and for this reason I estimated
sand-supply rates based on alongshore sediment transport rates (assuming the majority of
sediment transported is sand) for nearby islands (Wallops, Assawomen, and Cedar) (US
ACE, 1973; Byrne et. al, 1974; Byrnes, 1988). Given the somewhat broad range of
values (-13.6 − 1.4 m3/m/yr), I used other geologic constraints to further refine the sand-
supply rate to -0.5 m3/m/yr during late-Holocene simulation calibrations (see section 2.3).
14
2.2.4 Backbarrier Deposition
To simulate evolution of the backbarrier region during island migration, the
vertical position of the backbarrier depositional surface (relative to sea level) is
determined by a combination of the backbarrier deposition rate and a maximum
backbarrier elevation (formerly referred to in Stolper et al. (2005) as “resuspension
depth”). Within GEOMBEST, backbarrier deposition rates represent the rate of vertical
sediment accumulation upon the uppermost surface of the active backbarrier unit,
regardless of whether the backbarrier environment is a marsh or a lagoon. For a
particular backbarrier morphology to persist (both in the vertical and horizontal
dimensions) over long time periods, this rate of deposition must be comparable to the
RSLRR. When backbarrier sediment accumulates slowly, more sand, transported via
overwash processes, will be needed to fill the area behind the barrier (sometimes referred
to as backbarrier accommodation space), to maintain island elevation relative to sea level,
as sea level rises. When backbarrier sedimentation is rapid, the backbarrier may fill in,
allowing conversion of marsh to lagoon, for example. Acting to oppose such effects of
rapid backbarrier deposition within the model, the elevation of the backbarrier region
(relative to sea level) is limited by a maximum backbarrier elevation.
While backbarrier environments are variable throughout the VCR, the distribution
of marsh platform and open lagoon has remained unchanged since the earliest recorded
surveys (1852), suggesting the evolution of these backbarrier environments (i.e. infill
rate) has paralleled RSLR. Additionally, over long time scales, vertical deposition rates
of both subaerial marsh platforms (Van de Plassche, 1990; Oertel & Woo, 1994) and
shallow open bays (Nichols, 1989) have been shown to mirror the rate of RSLR.

15
Therefore, during late-Holocene simulations, infill rates of both salt marsh and open
lagoon are set to historic RSLRR (1.45mm/yr). A maximum backbarrier elevation of -0.4
m (average water depth of modern lagoon) for southern Metompkin Island maintains
lagoon depth through time to avoid backbarrier infilling, and a value of +0.14 m (modern
average marsh elevation) for northern Metompkin Island limits vertical marsh accretion
to within 0.14 m of sea level at any given time. In this way, and as suggested by
observations over the last 1.5 centuries, I do not allow salt marsh conversion to open
water (or vice-versa).
2.3 Calibration of Late-Holocene Base Simulations
After gathering model input parameters and creating plausible initial conditions
for northern and southern Metompkin Island, I calibrated the model by adjusting input
parameters, within the range of values reported in the scientific literature, to successfully
reproduce a backbarrier, barrier, and shoreface morphology similar to the modern
configuration over the course of a 4600-year (late-Holocene) simulation (Figure 2.4).
The resulting set of input values reflects estimated average rates and parameter values
across both the late-Holocene period and each island half (Table 1). Because the two
halves of the island are contiguous, therefore sharing similar values for parameters such
as longshore sediment transport rate, shoreface depth, etc., the only parameters that vary
between the northern and southern halves are those describing underlying stratigraphy
and backbarrier conditions for which I have geologic and modern evidence to support
differences. The 4600-year simulations (one for each island) resulting from this process
(hereafter referred to as the “base” scenarios) are not intended to be singular and accurate

16
portrayals of actual island evolution during the late-Holocene, but rather to provide a
baseline for comparison with additional simulations designed to assess sensitivity to
changes in input parameters. To provide a reference point for comparisons with
sensitivity experiments—during base simulations northern Metompkin Island migrated
slightly slower (at an average rate of 0.76 m/yr ) than the southern half (0.78 m/yr), but
had a slightly larger final barrier island volume (1280 m3/m/yr vs. 1000 m
3/m/yr for the
north and south, respectively.

17
3. RESULTS AND INTERPRETATIONS
To evaluate barrier island response to different input parameters and to compare
behaviors across multiple simulations, the average migration rate and final barrier island
volume are recorded for all simulation performed. Average island migration rate (m/yr)
was found by calculating the slope of the linear regression of shoreline position through
time. Barrier island volume, reported in m3 /m, represents island volume at the final
simulated time step and is calculated by integrating to find the cross-shore area under the
portion of the surface profile representing the barrier island. In addition to migration rate
and final island volume, to make for more detailed descriptions and comparisons of
island and backbarrier evolution, supplementary measurements (e.g., backbarrier width,
barrier island slope, and substrate slope) are recorded for certain simulations.
Many intrinsic differences (e.g., evolving backbarrier units, variability in
backbarrier composition, highly inconsistent substrate slopes) between the VCR and the
settings of earlier similar studies (e.g., Stolper et al., 2005; Moore et al., 2010; Moore et
al., submitted) add additional complexities to my interpretations of island response.
Unlike Moore et al. (2010), who describe the relationship between island migration
trajectory (which is equivalent to average barrier island slope when the sand budget is
balanced and equivalent to a less steep “effective” slope when sand-supply is negative)
and the slope of the underlying substrate in the absence of a backbarrier unit, simulations
of Metompkin Island include the evolution of backbarrier units. Here, base simulation
values for sand-loss rate are only slightly negative (-0.5 m3/m/yr) and therefore average
‘barrier island slope’ closely approximates effective barrier island slope—for this reason
I refer only to average barrier island slope when using this quantity to make comparisons.

18
As in Moore et al. (2010), average barrier island slope is defined by the slope of a line
extending from the base of the shoreface to the point where the island meets the
backbarrier (Figure 4). Additionally, because over long timescales backbarrier deposition
occurs increasingly landward on top of the underlying substrate as the island migrates, I
used the term substrate slope to characterize the slope of the surface of the uppermost
stratigraphic unit positioned beneath island and backbarrier deposits (rather than the slope
of the backbarrier depositional surface).
3.1 Sensitivity Analyses
To evaluate the relative influence of individual input parameters (and the
environmental factors they represent) in determining barrier island response to RSLR I
conducted a series of sensitivity experiments, altering one model parameter at a time and
assessing which factors most strongly influence measures of barrier island evolution.
Specifically, I systematically adjusted sand-supply rate, back-barrier sedimentation rate,
substrate composition, substrate erodibility, shoreface depth, DDRR, and RSLRR for
north and south Metompkin simulations independently (Table 1) and evaluated the effect
of changes in parameter values on final barrier island volume and average barrier island
migration rate by comparing these outputs with those of the corresponding base
simulation ( average migration rate of 0.76 m/yr and final volume of 1280 m3/m/yr in the
north, and average migration rate of 0.78 m/yr and final volume of 1000 m3/m/yr in the
south) . To extend the application of these results to other similar coastal environments I
varied input parameters not only within, but also just beyond, the range of published
values for the VCR. To test the sensitivity of the overall barrier system and to look for
19
possible thresholds that might induce changes in island state I also varied some
parameters (e.g., RSLRR) beyond expected natural variation.
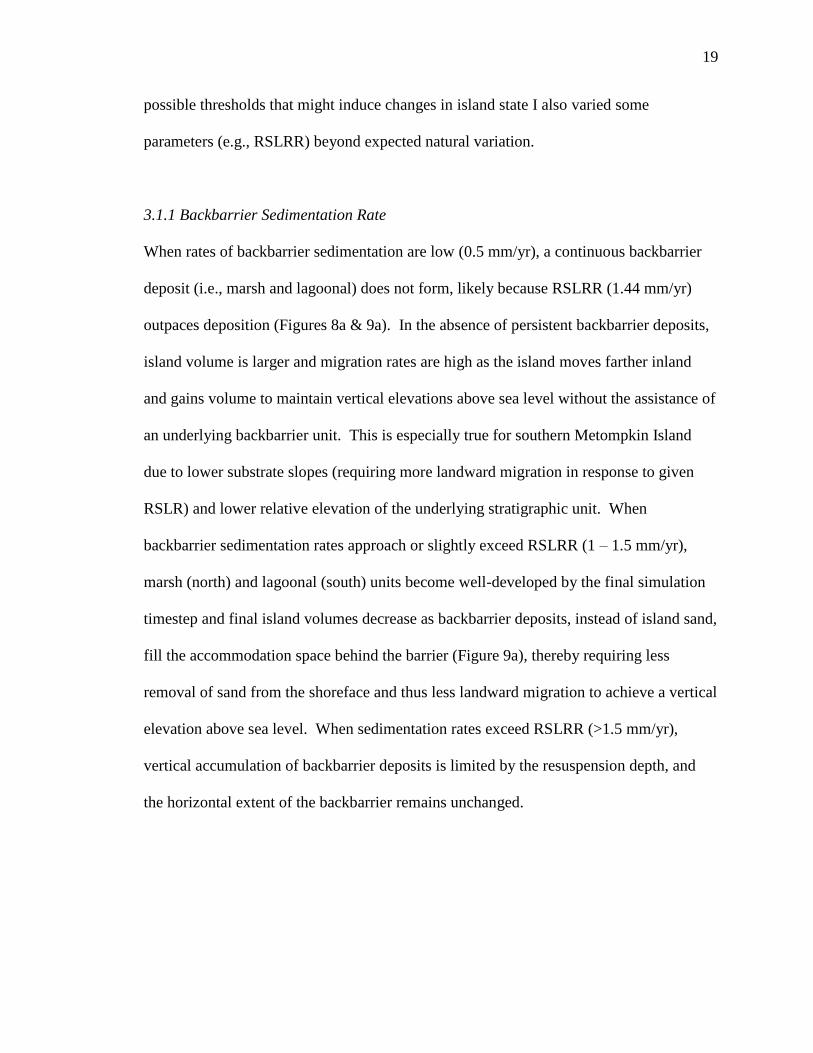
3.1.1 Backbarrier Sedimentation Rate
When rates of backbarrier sedimentation are low (0.5 mm/yr), a continuous backbarrier
deposit (i.e., marsh and lagoonal) does not form, likely because RSLRR (1.44 mm/yr)
outpaces deposition (Figures 8a & 9a). In the absence of persistent backbarrier deposits,
island volume is larger and migration rates are high as the island moves farther inland
and gains volume to maintain vertical elevations above sea level without the assistance of
an underlying backbarrier unit. This is especially true for southern Metompkin Island
due to lower substrate slopes (requiring more landward migration in response to given
RSLR) and lower relative elevation of the underlying stratigraphic unit. When
backbarrier sedimentation rates approach or slightly exceed RSLRR (1 – 1.5 mm/yr),
marsh (north) and lagoonal (south) units become well-developed by the final simulation
timestep and final island volumes decrease as backbarrier deposits, instead of island sand,
fill the accommodation space behind the barrier (Figure 9a), thereby requiring less
removal of sand from the shoreface and thus less landward migration to achieve a vertical
elevation above sea level. When sedimentation rates exceed RSLRR (>1.5 mm/yr),
vertical accumulation of backbarrier deposits is limited by the resuspension depth, and
the horizontal extent of the backbarrier remains unchanged.

20
3.1.2 Sand-Supply Rate
As anticipated, as the rate of sand-supply increases (from sand removal to addition of
sand) final barrier island volume rapidly increases and migration rates decline (Figures 8b
& 9b). An increase in the sand-supply rate of 2m3/m/yr (-1 – 1 m
3/m/yr) results in a
~100% increase in final island volume for both northern and southern Metompkin Island.
While changes in overall barrier volume are nearly identical between the north and south,
varying the sand-supply rate results in a greater disparity in migration rate fluctuation
between the two island halves. Southern Metompkin Island migrates considerably more
rapidly at lower sand-supply rates than northern Metompkin Island, suggesting that the
migration of the southern half is relatively more sensitive to changes in barrier volume
generated by lower sand-supply rates than northern Metompkin Island.
3.1.3 Substrate Sand Percentage
By assessing barrier island sensitivity to changes in the percentage of sand
contained in each stratigraphic unit, I aim to describe the relative importance of
individual units in supplying sand to the island. The effect of an individual stratigraphic
unit on final barrier island volume or average migration rate is largely determined by the
proportion of the total shoreface the unit covers, and how that proportion changes
throughout the simulation. Differences in underlying stratigraphy and topography
between island halves account for disproportionate amounts of exposure of each
stratigraphic unit along the shoreface, and therefore the relative importance of each
stratigraphic unit in island behavior varies between northern and southern Metompkin
Island (Figure 10). Being the most prevalent along the shoreface during the late-

21
Holocene simulation, island behavior (evidenced by changes in volume and/or migration
rates) is most sensitive to changes in the sand percentage of the early-Holocene lagoonal
unit in the north and the backbarrier unit (although only slightly) in the south (Figure 10).
Stratigraphic units that are less exposed along the shoreface, either because they are part
of the shoreface for only a short period of time or because they are limited in spatial
extent, have little effect on island behavior (i.e. northern backbarrier deposit, southern
late-Pleistocene fluvial unit)
3.1.4 Substrate Erodibility
Consistent with Moore et al. (2010), substrate erodibility minimally affects island
response to RSLR (Figures 11). Sensitivity analyses indicate island volume and
migration rate are only affected when underlying stratigraphic units are 1000 times less
erodible than fully unconsolidated material (erodibility values of .001; values of 1 being
fully erodible). However, given the loosely consolidated silty muds and fine sands
beneath the Virginia Barrier Islands (as opposed to lithified rock which might better
represent erodibility values of .001) it is unlikely that the stratigraphic units here can
resist erosion to a degree that would significantly impact large-scale island behavior.
Therefore, it is assumed that wave energy along the shoreface can sufficiently break
down the underlying substrate exposed along the shoreface readily supplying the island
with sand contained in these units.

22
3.1.5 Depth Dependent Response Rate
Island behavior appears insensitive to DDRR given that only DDRR values less
than 2 cm/yr impact barrier island response (Figures 8c & 9c). Given that average island
migration rates over the past 25 years have averaged 4.6 m/yr I assume the morphology
of the upper shoreface (i.e., equilibrium morphology) to remain nearly constant—thereby
requiring island migration and shoreface erosion rates to be of the same order of
magnitude. For this reason, it appears that actual response rates are likely to be far
beyond the 2 cm/yr threshold indentified in sensitivity experiments.
3.1.6 Shoreface Depth
As anticipated, greater shoreface depths (4 −9 m) result in a trend of increasing
island volumes and decreasing migration rates, because deeper shoreface depths allow
extraction of sand from a greater portion of the bathymetric profile (Figures 8d & 9d) and
therefore yield more sand per time step. Disparity in island behavior between northern
and southern Metompkin Island throughout this range of shoreface depth values is most
likely due to differences in underlying stratigraphy (i.e., a more vertically elevated sand
rich late-Pleistocene fluvial deposit in the north) which allow the northern half to liberate
more sand-rich sediment, particularly at shoreface depths >7.5 m. As reported above (in
section 3.1.2), while shallow shoreface depths (<6 m) result in similar patterns of island
volume decrease for both island halves, the migration rate of southern Metompkin Island
appears to be more highly sensitive to this reduction in sand availability associated with a
shorter active shoreface. While barrier island behavior appears sensitive to shoreface
depths ranging from 4-9m, when considering only response to the range of depths

23
reported in the literature (5.5 − 8m) volume and migration rate are fairly insensitive to
changes in shoreface depth.
3.1.6 Relative Sea Level Rise Rate (RSLRR)
To assess the sensitivity of island behavior to RSLRR, I increase the RSLRR from
0.5 mm/yr to 4 mm/yr while keeping the total amount of RSLR constant at 6.5 m of total
change across all simulations. Unlike simulations in which the duration of the simulation
was held constant (i.e., the constant duration RSLRR simulations discussed below), in the
constant total RSLR simulations the island traverses an identical substrate (slope and
composition) throughout each model run, thereby eliminating the effects of variable
substrate slopes on simulation results. This requires each simulation to run for a different
length of time ranging from 1,600 years for the 4 mm/yr simulation to 13,200 yrs for the
0.5 mm/yr simulation.
As expected, the barrier migrates landward faster at higher SLRRR (Figures 8e).
Interestingly and unexpectedly, at SLRRs ≤1 mm/yr, backbarrier environments struggle
to stabilize within the model for both northern and southern Metompkin Island. In order
to achieve a vertical position above sea level without the additional elevation provided by
a backbarrier platform, northern Metompkin Island primarily experiences increases in
island volume, whereas southern Metompkin Island experiences increases in landward
migration rates (Figures 8e & 9e). This disparity is likely explained by differences in the
position of underlying stratigraphy in the latter portion of the late-Holocene simulations
(Figure 6).

24
When RSLRR are faster than 1 mm/yr, increases in migration rates are linear for
both halves of Metompkin Island, final island volume changes little (Figures 8e & 9e),
and the general coastal configuration (i.e., island shape, backbarrier width) remains
unaffected. This suggests that final backbarrier, island, and shoreface morphology are
minimally affected by changes in island migration rate—which is more directly
controlled by RSLRR—when the length, composition, and slope of the underlying
substrate surface the island traverses are held constant.
For the second portion of the RSLRR sensitivity experiment I again increase
SLRRs from 0.5 – 4mm/yr in 0.5 mm/yr increments, however to assess the impact of
substrate slope variability on final island configuration, these simulations span a constant
4600yrs requiring the barrier island to migrate progressively farther landward across
mainland terrain of varying slope as RSLRR increase. Theoretically, increases in
RSLRR should lead to increases in island volume over time since faster RSLRRs require
the island to migrate across a larger portion of substrate allowing for a larger amount of
sand to be liberated from the shoreface, According to Moore et al. (2010) island volume
should increase until the barrier island slope (or “effective” barrier island slope in the
case of a negative sand-supply rate) approaches equilibrium with substrate slope,
however, the incorporation of a simultaneously evolving backbarrier unit limits the direct
applicability of these general relationships, requiring additional examination of substrate
slope, island, and backbarrier behavior at each individual RSLRR simulated.
At RSLRR less than 1.25mm/yr, both northern and southern Metompkin Island
increase in volume (67% in the north and 18% in the south compared to initial volume at
1 mm/yr), with more rapid increases in the north likely due to a greater cumulative

25
substrate sand percentage along the shoreface (Figure 9f). Sustained differences in
cumulative substrate sand content, most notably due to differences in backbarrier unit
composition, account for the general trends in volume change at SLRRs of 1 – 4 mm/yr,
over which the northern volume decreases by 46% and southern volume increases 66%.
Higher RSLRR cause a relatively steady increase in landward migration rates for both
halves of Metompkin Island. Due to substrate slope variability, southern Metompkin
Island migration rate decreases slightly (5-13% slower than north depending on RSLRR)
when SLRRs are faster than 1.5mm/yr, creating a maximum north/south difference in
total island migration distance of 0.9km at RSLRR of 4 mm/yr (Figure 8f).
A comparison of final backbarrier width and near-final substrate slope
(specifically, the slope of the additional length of substrate traversed as compared to that
of the next lowest RSLRR simulation) (Figure 12a) indicates that the horizontal width of
the backbarrier region (in both the north and south) tends to increase when the island is
migrating across a gently sloping substrate (i.e., slopes near or below 1 m/km). With
higher cumulative RSLR, northern Metompkin Island migrates over a steep substrate
allowing for only brief periods of rapid widening of the backbarrier. In contrast, the
substrate encountered by southern Metompkin Island is more consistently gentle (<1
m/km) (Figure 12a) leading to nearly continual widening of the backbarrier. In general,
when an island migrates across steep substrates backbarrier width remains constant (e.g.,
both islands) or even decrease (e.g., seen only in northern Metompkin Island. As
described by Stolper et al. (2005), low substrate slopes (congruent with backbarrier
widening) allow for the deposition of a more expansive backbarrier unit providing a more
vertically elevated and seaward-protruding platform upon which future island migration

26
can occur. Steeper slopes (which limit lateral backbarrier expansion) negate the potential
for backbarrier units to supply an elevated landward surface for subsequent island
migration (These relationships are perhaps best shown in comparing final timestep plots
of various RSLRR for northern and southern Metompkin Island; see figure 13).
While, island volume tends to decrease for northern Metompkin Island and
increase for southern Metompkin Island as RSLR increases, smaller fluctuations in
volume are associated with changes in backbarrier width (and therefore substrate slope),
such that increases in backbarrier width generally correspond to island volume decreases
(Figure 12b). This implies that a more extensive backbarrier unit (associated with a low
substrate slope) provides more vertical relief during island migration, thus requiring less
island sand (i.e., smaller volume) to maintain island elevation above sea level.
3.2 Future Simulations
To explore the range of potential future barrier island response to RSLR, I
conducted a suite of simulations extending from 2000 AD to 2100 AD in 5-year time
steps. While these future simulations are based on the same values derived from the
calibration of the late-Holocene simulation (Table 1), and incorporate well-supported
estimates of future SLRRs, they are not intended to be accurate representations of future
island evolution, but simply to capture the range of possible future response. Unlike the
late-Holocene simulations, here, northern and southern Metompkin Island will migrate
across known topographic surfaces which are far more variable (in slope) than the
conceptualized initial condition (Figures 14 & 15).
Reported values for eustatic RSLR by the year 2100 AD range from 0.2m to
1.6m, (IPCC 2007; Grinsted et al., 2009; Jevrejeva et al., 2010). Local RSLRR are

27
expected to be slightly faster than eustatic rates and therefore I choose to vary RSLR
between 0.6 – 1.6m of total rise over 100 years. With uncertainty involving the amount
of RSLR by 2100 and the nature of RSLR acceleration during that time, I simulated
multiple accelerated RSLR scenarios, including constantly increasing RSLR rates,
linearly increasing RSLRR, and RSLR rates that increase along a polynomial curve.
Various studies have shown that vertical accumulation rates within the
backbarrier, particularly in salt marshes, have a finite upper limit considerably below
some future RSLRR predictions (e.g. Craft et al., 2009). To explore how a backbarrier
sedimentation rate that is lower than the RSLRR may influence island migration I
performed additional simulations where back-barrier sedimentation rate is limited to
10mm/yr. This estimated rate is derived from model simulations of vertical marsh
accumulation during accelerated RSLR by Kirwan et al. (2010), and is meant to represent
a conservative upper limit to rates of back-barrier sedimentation. There is some
evidence in the literature (e.g., Craft et al., 2009) to suggest that back-barrier
sedimentation occurring in lagoonal environments may be unable to keep pace with
future RSLR acceleration thereby resulting in a deepening of backbarrier bays in the
future. For this reason, I applied a 10 mm/yr limit in simulations of southern Metompkin
Island as well to consider the greatest range of potential impacts. Furthermore, to explore
the effects of a possible lag period between accelerations in RSLRR and back-barrier
sedimentation rate, as reported by Kirwan and Temmerman (2009), I included a series of
simulations in which backbarrier sedimentation rates are offset from RSLRR by 20 years
while still being limited to 10 mm/yr.

28
Island migration rate and final island volume remain fairly constant for a given
amount of cumulative RSLR regardless of the rate of increase (Figure 16). This implies
that the rate at which the RSLRR increases over time has less of an impact on migration
rates than the cumulative amount of RSLR, and variations in substrate slope or
composition. Substrate slope and composition are relatively constant between 2000-2100
for all RSLR scenarios (0.6-1.6m), but differ between northern and southern Metompkin
Island (e.g., Figure 5). During the 100-year-long future simulations, northern Metompkin
Island migrates faster and gains more volume than southern Metompkin Island,
regardless of the RSLR scenario (Table 2 & Figure 16). Island migration rates during the
first 20 years of the future simulations (7-8.6 m/yr in the north versus 4.5-6 m/yr in the
south for a range of cumulative RSLR values) are in agreement with average observed
shoreline change rates for 1985 – 2009 (7m/yr in the north vs. 2m/yr in the south
calculated from shoreline position data from Wolner (2011)).
Consistent with the backbarrier sedimentation rate sensitivity experiments
presented in the previous section (3.1.1), when the backbarrier sedimentation rate is less
than the RSLRR (in future simulations with backbarrier sedimentation rate limited to
10mm/yr limits or lagging 20yr behind RSLRR) final volume of both island halves is
affected(Figure 16b), however the migration rate of southern Metompkin Island is
particularly sensitive to lower backbarrier sedimentation rates, particularly at high
cumulative RSLR (Figure 16a) Differences in the behavior of northern and southern
Metompkin are likely the result of distinct differences in landward substrate slope and
substrate sand content. At the start of future simulations northern Metompkin Island is
positioned atop a backbarrier unit containing limited sand (15%) and is backed by both

29
subaerial marsh and steeply inclined mainland topography, while the backbarrier unit
below southern Metompkin Island contains more sand (60%) and has a gently-sloped
mainland topographic surface along its landward edge (Figure 14). Because the
backbarrier units make up the bulk of the shoreface during future simulations (e.g.,
Figure 13), differences in the amount of sand in this unit affect overall sand availability,
and therefore migration rate. Additionally, the slope of the landward substrate appears to
influence the ability of the backbarrier to maintain its initial width during RSLR
conditions. Similar to the previously described relationship (section 3.1.7), steep
substrate slopes (i.e., behind northern Metompkin Island) do not allow for backbarrier
widening, and may even reduce backbarrier width, but when landward substrate slope is
gentle (<1 m/km) the area over which backbarrier deposition takes place increases
resulting in a thicker backbarrier deposit.
Limitations to backbarrier sedimentation rate appear to amplify the effect of steep
substrate slopes on backbarrier width. During future simulations when backbarrier
sedimentation rate equals RSLRR the substrate slope landward of southern Metompkin
Island is never sufficiently steep to cause backbarrier narrowing, regardless of the amount
of cumulative RSLR by 2100. However when simulating the same RSLRR scenario with
a limited backbarrier sedimentation rate, backbarrier width is constricted requiring faster
landward migration (e.g., at cumulative RSLR ≥ 1 m on southern Metompkin Island)
(Figure 16), suggesting that limitations on backbarrier deposition may influence future
island behavior.
To briefly explore how Metompkin Island might respond to conditions more
extreme than suggested by RSLR predictions, I ran additional simulations using
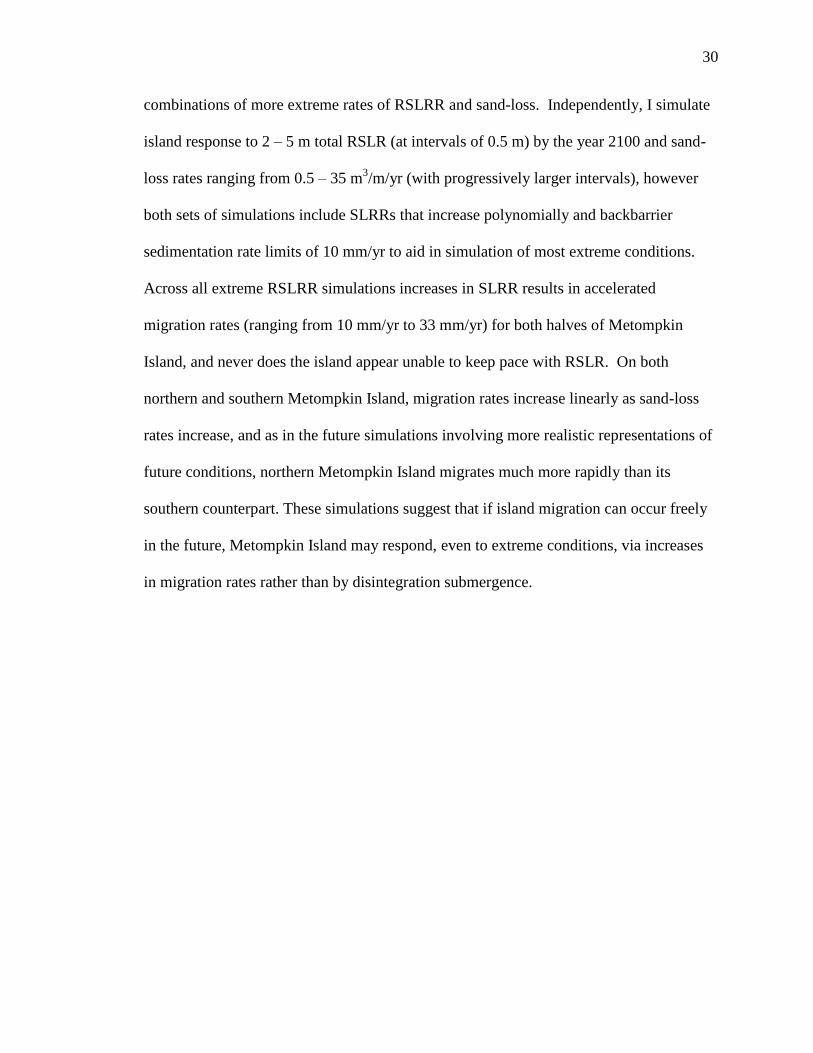
30
combinations of more extreme rates of RSLRR and sand-loss. Independently, I simulate
island response to 2 – 5 m total RSLR (at intervals of 0.5 m) by the year 2100 and sand-
loss rates ranging from 0.5 – 35 m3/m/yr (with progressively larger intervals), however
both sets of simulations include SLRRs that increase polynomially and backbarrier
sedimentation rate limits of 10 mm/yr to aid in simulation of most extreme conditions.
Across all extreme RSLRR simulations increases in SLRR results in accelerated
migration rates (ranging from 10 mm/yr to 33 mm/yr) for both halves of Metompkin
Island, and never does the island appear unable to keep pace with RSLR. On both
northern and southern Metompkin Island, migration rates increase linearly as sand-loss
rates increase, and as in the future simulations involving more realistic representations of
future conditions, northern Metompkin Island migrates much more rapidly than its
southern counterpart. These simulations suggest that if island migration can occur freely
in the future, Metompkin Island may respond, even to extreme conditions, via increases
in migration rates rather than by disintegration submergence.
31
4. DISCUSSION
4.1 Model Limitations
When using a morphological-behavior modeling approach to simulate past and
future island migration during RSLR, it is important to consider model limitations and
assumptions prior to discussion of results and interpretation of model simulations. The
morphological-behavior approach successfully elicits important mechanisms of island
migration within the given study site and beyond, but generally restricts interpretations to
theoretical and qualitative assessments of the range of potential island behavior. For
example, here, I condense the long-term migration of an 11-km long barrier island to two
sets (i.e., north and south) of 2-D cross-shore simulations each with < 12 input
parameters such that the resulting island behaviors represent the average response to
RSLR for that island segment. For this reason, model outputs are not meant to accurately
portray island response at any one location along Metompkin Island, or to be predictive
in a quantitative away.
To best assess on the role of variations in backbarrier environment and underlying
stratigraphy in island migration, I chose a study site where these differ within a single
island thereby reducing the number of dissimilar island characteristics influencing island
response. However, by treating each island half as an independent island and ignoring
the ability of longshore processes to redistribute sand and realign the beachface and
shoreface, simulated differences in the behavior of northern and southern Metompkin
Island are relative to actual island response. Thus, future island response to RSLR is more
likely to fall somewhere between the simulated behaviors of the two island halves and
only were the island to be breached would the island portions begin to migrate more

32
independently from one another in the future. Additionally, some island behaviors (i.e.,
opening of ephemeral inlet along southern Metompkin Islands, development of shoreline
offset, and subsequent closing of the inlet) are not included in my model simulations, but
would be expected to play a role in past and future island behavior. It is important to
note that despite giving extensive consideration to changes in sea level over long time
periods, GEOMBEST does not simulate changes in island behavior due to variations in
storm activity. Future deviations from time-averaged storm activity in the past (as
suggested by Knutson et al. (2010) and others) may alter future island response beyond
the range of potential future behavior simulated here.
Across all simulations of Metompkin Island, the accumulation of backbarrier deposits
through time assumes a constant input of sediment to the backbarrier environment
without accounting for where this sediment is derived from. In reality, much of the sand
deposited in the backbarrier originates from the nearshore zone and is transported
landward by overwash and/or inlet processes (particularly for southern Metompkin
Island) and thus, backbarrier sedimentations is actually closely linked with alongshore
sand supply. By simulating island response with backbarrier sedimentation acting
independently from sand supply processes, I have not accounted for reductions in sand
availability to the island due to this transfer of sand to the backbarrier. Future work
exploring and simulating explicit coupling of sand supply rates and backbarrier
sedimentations rates within GEOMEBST would be useful and allow more accurate
depictions of the interactions between the nearshore and backbarrier environments.

33
4.2 Insights on Geologic Constraints
Interestingly, through development of an initial late-Holocene morphology and
stratigraphy for northern and southern Metompkin Island and pairing of these
configurations with estimated values from the literature for shoreface depth and historic
island position it becomes evident that some published estimates of mid-Holocene island
position are geometrically implausible. Based on the constraints listed above I find that
island position 4600 BP must have been at least 2 km seaward of the current location, and
likely was significantly more, assuming any degree of shoreface incision during
migration (Figure 5). Just as preparations for conducting simulations sheds light on
island position ~4600 years ago, the simulations themselves are consistent with and
appear to corroborate published estimates for the timing of establishment of backbarrier
deposition. For the first ~3500yrs of the late-Holocene base simulations both halves of
Metompkin Island migrate landward with little to no accumulation of backbarrier
sediment. Once the island reached a portion of more gently sloping substrate (near 40000
km on the x-axis in Figure 15) a continuous backbarrier unit began to form. The timing
of initial backbarrier deposition, predicted by the simulations, matches well with reported
ages of the formation of the modern lagoon and marsh system within the VCR (Van de
Plassche, 1990).
4.3 Sand Availability
The sand composition within material exposed along the shoreface varies between
northern and southern Metompkin Island due to differences in underlying stratigraphy
(primarily position of the late-Pleistocene fluvial deposit) and the sand content of
34
backbarrier deposits. Additionally, the sand composition fluctuates throughout the
simulations as the island traverses across different substrate units. Because underlying
stratigraphic units exposed along the shoreface are critical in supplying the island with
sand and therefore in maintaining vertical island position during migration, these
differences in substrate sand composition have a substantial impact on island behavior.
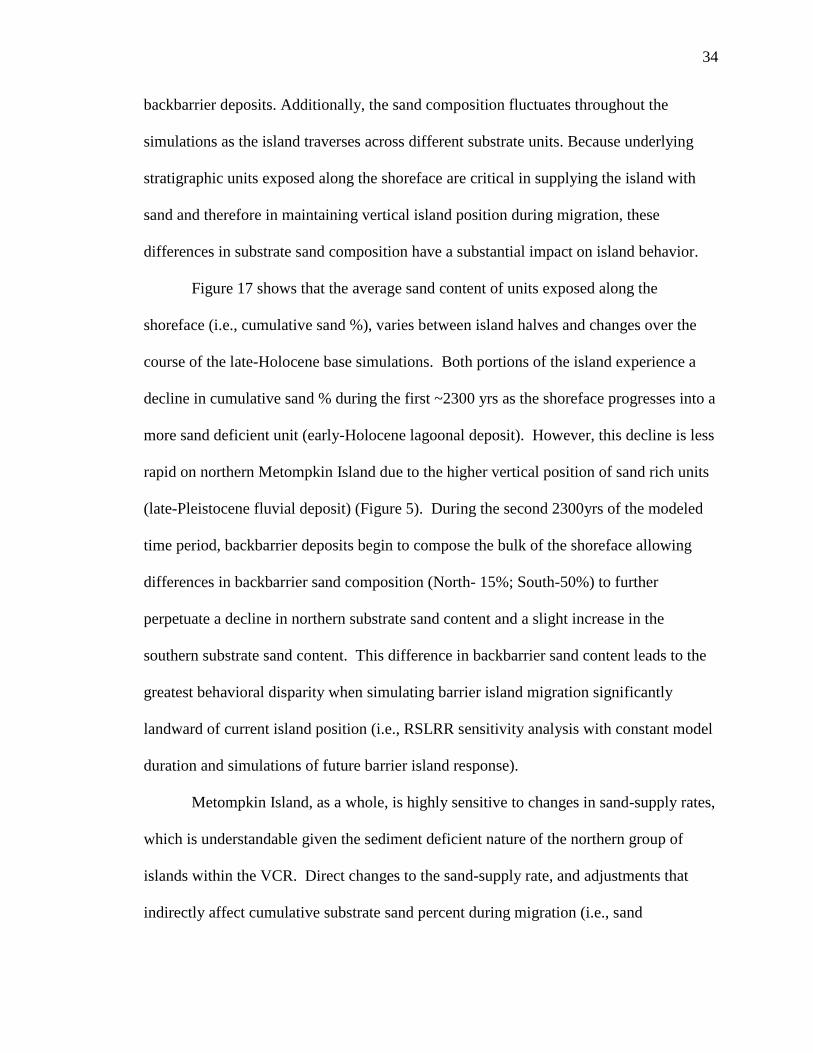
Figure 17 shows that the average sand content of units exposed along the
shoreface (i.e., cumulative sand %), varies between island halves and changes over the
course of the late-Holocene base simulations. Both portions of the island experience a
decline in cumulative sand % during the first ~2300 yrs as the shoreface progresses into a
more sand deficient unit (early-Holocene lagoonal deposit). However, this decline is less
rapid on northern Metompkin Island due to the higher vertical position of sand rich units
(late-Pleistocene fluvial deposit) (Figure 5). During the second 2300yrs of the modeled
time period, backbarrier deposits begin to compose the bulk of the shoreface allowing
differences in backbarrier sand composition (North- 15%; South-50%) to further
perpetuate a decline in northern substrate sand content and a slight increase in the
southern substrate sand content. This difference in backbarrier sand content leads to the
greatest behavioral disparity when simulating barrier island migration significantly
landward of current island position (i.e., RSLRR sensitivity analysis with constant model
duration and simulations of future barrier island response).
Metompkin Island, as a whole, is highly sensitive to changes in sand-supply rates,
which is understandable given the sediment deficient nature of the northern group of
islands within the VCR. Direct changes to the sand-supply rate, and adjustments that
indirectly affect cumulative substrate sand percent during migration (i.e., sand

35
composition of individual units and shoreface depth) have a significant impact on island
migration rates and final volume during late-Holocene simulations. Most often,
differences in the behavior of northern and southern Metompkin Island associated with
sand availability result from inconsistencies in the underlying stratigraphy (e.g., the
vertical position, sand content, and orientation of individual units). While the northern
marsh deposit provides an elevated platform for the barrier island unit, the submerged
lagoonal deposit of southern Metompkin Island increases the dependence on island
volume in maintaining a sub-aerial island position. Therefore, when sand availability is
limited (i.e., high sand-loss rate, low substrate sand content) and island volumes decrease
proportionally, the migration rate of southern Metompkin Island may be expected
increase more rapidly to maintain island position—possibly explaining the development
of the modern shoreline offset.
While the modern substrate composition is reasonably well described, when
simulating island migration over long timescales the factors that influence sediment
availability (e.g., stratigraphic composition, alongshore sand-supply rates) are highly
variable and usually site-specific, limiting the applicability of findings based long-term
island response to sand availability alone. Similar to other GEOMBEST applications
(Stolper et al., 2005; Moore et al., 2010), I also used relationships between substrate
topography (i.e., substrate slope) and shoreface geometry (i.e., barrier island slope and
island trajectory) to characterize long term island migration processes.
36
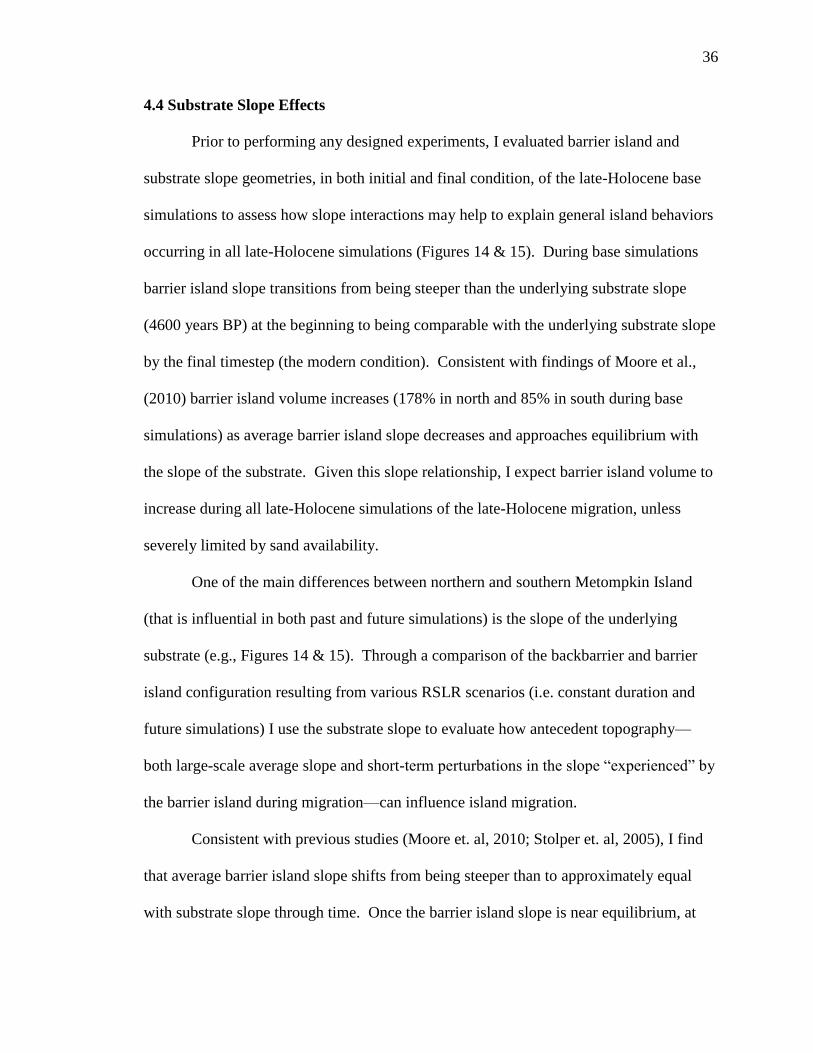
4.4 Substrate Slope Effects
Prior to performing any designed experiments, I evaluated barrier island and
substrate slope geometries, in both initial and final condition, of the late-Holocene base
simulations to assess how slope interactions may help to explain general island behaviors
occurring in all late-Holocene simulations (Figures 14 & 15). During base simulations
barrier island slope transitions from being steeper than the underlying substrate slope
(4600 years BP) at the beginning to being comparable with the underlying substrate slope
by the final timestep (the modern condition). Consistent with findings of Moore et al.,
(2010) barrier island volume increases (178% in north and 85% in south during base
simulations) as average barrier island slope decreases and approaches equilibrium with
the slope of the substrate. Given this slope relationship, I expect barrier island volume to
increase during all late-Holocene simulations of the late-Holocene migration, unless
severely limited by sand availability.
One of the main differences between northern and southern Metompkin Island
(that is influential in both past and future simulations) is the slope of the underlying
substrate (e.g., Figures 14 & 15). Through a comparison of the backbarrier and barrier
island configuration resulting from various RSLR scenarios (i.e. constant duration and
future simulations) I use the substrate slope to evaluate how antecedent topography—
both large-scale average slope and short-term perturbations in the slope “experienced” by
the barrier island during migration—can influence island migration.
Consistent with previous studies (Moore et. al, 2010; Stolper et. al, 2005), I find
that average barrier island slope shifts from being steeper than to approximately equal
with substrate slope through time. Once the barrier island slope is near equilibrium, at

37
long time scales island migration trajectories tend to reflect average substrate slope
(Wolinsky & Murray, 2009). (Note: Because the alongshore sand-budget used in my
simulations is nearly balanced (-0.5 m3/m/yr) and I do not include average barrier island
slopes from simulations with varied sand-loss rates, in this substrate slope effects
analysis, I used average barrier island slope in place of effective barrier island slope for
simplicity). However, when looking at smaller scale variations in substrate slope,
migration trajectory remains fairly constant (Figure 13) even when the island is traversing
substrates of varying slope. For island migration trajectory to mirror larger-scale
substrate slope constantly, migrations rates must remain reasonably stable despite these
(smaller-scale) periods of substrate variability.
It might be expected that lower slopes require more landward island movement
per given unit of RSLR in order to maintain vertical position. Instead, I propose a
feedback between short term substrate perturbations, backbarrier sedimentation, and
barrier island morphology that prevents the translation of smaller variants in substrate
slope into changes in the slope of the island migration trajectory. When a landward
migrating island encounters gently sloped topography (< 1 m/km) the backbarrier region
(regardless of whether it consists of marsh platform or shallow lagoon) is able to expand
laterally across the shallow substrate. As noted by Stolper et al. (2005), a wider
backbarrier results in a thicker, more voluminous backbarrier deposit. With continued
landward migration, this thicker backbarrier deposit not only reduces the backbarrier
accommodation space, but also provides an elevated, seaward-positioned platform for
migration, therefore allowing a stable vertical position relative to sea level to be achieved
with less landward migration. Consequently, island volume declines as slower migration

38
rates limit the liberation of sand from underlying stratigraphy, and the presence of an
elevated backbarrier unit allows the equilibrium morphology to be maintained by a
smaller island volume (Figure 18). If sufficiently low landward slopes persist over time,
this relationship may result in the development of a positive feedback where the decrease
in migration rate coupled with a low mainland slope promotes further backbarrier
widening and thicker backbarrier deposits. If sufficiently gentle landward substrate
slopes persist over an extended period of time a runaway backbarrier deposition scenario
may develop, similar to simulated southern Metompkin Island response to SLRRs ≥ 2.25
mm/yr in the constant duration RSLRR sensitivity experiments (Figure 13b). However,
given the undulating mainland slope characteristic of the study site (Figure 14), a more
likely scenario is that the low sloping substrate transitions into a section of steeply sloped
substrate which inhibits the feedback from continuing indefinitely.
Conversely, as an island encounters a substrate slope appreciably greater than the
barrier island slope (> 2 m/km), migration along a continuous trajectory confines the
backbarrier resulting in constant or decreased backbarrier width (as observed for northern
Metompkin Island during constant duration RSLRR sensitivity experiments and future
simulations). While steeper substrates may typically be associated with less landward
movement per unit of RSLR, I find that restricted backbarrier expansion, both horizontal
and vertical, requires island migration rates to remain fairly constant, or accelerate
slightly, when migrating over steep sections of the substrate (Figure 18). As backbarrier
deposits become less extensive, island volume increases to provide the vertical relief
necessary for the island to remain subaerial. If substrate slope is sufficiently steep to
induce backbarrier constriction, this process may lead to a narrow backbarrier,

39
increasingly landward island positions, and may ultimately set up an opposing positive
feedback where backbarrier narrowing promotes further narrowing of the backbarrier.
Again, slopes this steep rarely persist (within the study site) and highly inclined substrate
sections commonly progress into more gentle slopes along the undulating landward
substrate surface, thereby limiting the potential for a runaway feedback in this direction
as well.
Further influencing the potential for runaway feedback scenarios to develop, the
sand content along the shoreface will vary with changes in backbarrier thickness, and
these fluctuations in overall sand availability will likely influence island migration rates.
Therefore, as the percentage of the shoreface consisting of backbarrier deposit changes,
the relationship between the sand content of the backbarrier unit and the next lowest
stratigraphic unit (the sand-limited early-Holocene lagoonal deposit on Metompkin
Island) will be important in determining the degree to which changes in backbarrier
thickness influence island response. In the case of backbarrier expansion and thickening
caused by low substrate slopes, if the backbarrier deposit contains less sand than the
underlying unit (i.e., northern Metompkin Island), a negative feedback between sand
availability and backbarrier width could develop, where sand availability will decline as
the backbarrier thickens, resulting in accelerated island migration rates and less
backbarrier expansion, acting to diminish the potential for runaway backbarrier
expansion. Here, accelerated island migration will likely limit backbarrier expansion so
that a portion of the shoreface always remains within the underlying unit to insure
sufficient sand supply during migration.
40
Alternatively, if the backbarrier deposit contains more sand than the underlying
unit (i.e., southern Metompkin Island), a positive feedback could develop during
backbarrier expansion where overall sand availability increases, migration slows, and the
backbarrier expands. With continued migration, if the shoreface is entirely made up of
sand-rich backbarrier material, this reinforcing feedback would essentially decouple
backbarrier width and substrate slope interactions, so that backbarrier width would
continue to increase, regardless of substrate slope, due to overly abundant sand
availability (Figure 13b). If the backbarrier is instead progressively constricted in
response to steep substrate slopes, as the proportion of the shoreface composed of
backbarrier deposits decreases and sand availability changes, a similar, but opposite set of
potential feedbacks exist to either promote (i.e., less sand in the underlying unit) or
prevent (i.e., more sand in underlying unit) a backbarrier narrowing runaway feedback
situation.
Provided that backbarrier deposition is able to persist at rates similar to RSLRR,
the interaction between substrate slope and backbarrier sedimentation offers a mechanism
by which an island migration trajectory can reflect large-scale average topographic slope
with minimal adjustments to island migration rate due to smaller scale variations in
substrate slope. Controlled primarily by substrate slope and island migration rate, the
backbarrier deposit plays a passive, but potentially critical role in island migration by
quickly adapting its size. If the slope of the substrate is relatively constant, this size
remains invariable with little effect on island behavior (assuming all other variables are
held constant). But when traversing a hummocky landward substrate surface, changes in
the extent of the backbarrier unit (horizontally, and therefore vertically) allow for a more

41
constant island migration trajectory, in effect modulating the impact of small-scale
changes in substrate slope. Only when very high or very low substrate slopes persist over
a significant expanse will either runaway feedback scenario have the potential to become
established and persist for long periods of time. However, continuous extreme slope
values would also affect the larger-scale average substrate slope, perhaps resulting in a
different island migration trajectory altogether.
In addition to the rising and falling nature of the substrate topography landward of
Metompkin Island, a lag effect likely delays the response to substrate slope, further
discouraging rapid development of the positive feedback scenario. While the exact
length of substrate and amount of time necessary for substrate slope to adequately affect
backbarrier thickness and extent are unknown, the backbarrier unit must first adjust
(either by thickening through a wider backbarrier or thinning when high substrate slopes
limit backbarrier width) before slope effects are transferred to the island. Because of this
lag period, migration trajectories are likely never entirely constant, however the
responsive nature of backbarrier units makes island trajectory less variable than if the
backbarrier unit did not exist. Furthermore, to maintain a consistent island trajectory
without an adjustable backbarrier unit, island volume and migration rate would have to
fluctuate rapidly. Such rapid island volume change may not be possible given the overall
sediment deficient nature of this region, possibly threatening barrier island existence (in a
form similar to the modern configuration) over longer timescales.

42
4.5 Implications of Future Simulations
During simulations of island behavior between 2000 and 2100 AD, increased
rates of island-wide migration (North: 10-13.4m/yr; South: 5.6-9.6m/yr) are likely a
function of high RSLRR and low sand availability. While my intent is not to recreate or
to predict actual future island behavior in any detail, relative conformity between
observed shoreline change rates (North: 7m/yr; South: 2m/yr) and island migration rates
during the first 20 years of the future simulations (North: 7-8.75m/yr; South: 4.25-6m/yr,
dependent upon cumulative RSLR) suggests that GEOMBEST is able to simulate island
behavior at decadal timescales reasonably well. Similar to findings from late-Holocene
simulations, northern and southern Metompkin respond differently to identical RSLR
scenarios because of substrate composition and slope variability between the two halves
of the island. Differences in the cumulative substrate sand content contributor greatly to
differential island response, such that higher substrate sand content promotes slower
landward migration rates along southern Metompkin Island relative to the northern half
of the island. Additionally, while the migration trajectory of each island half reflects
long-term average substrate slope, similar to findings from late-Holocene simulations,
regional differences in landward substrate slope angle (Figure 14) result in backbarrier
constriction (i.e., high substrate slope) in the northern portion of the island and constant
backbarrier width (i.e., gentle substrate slope) in the south. As the northern backbarrier
region is unable to maintain width through time, the thickness of the resulting backbarrier
deposit decreases, adding to the disparity in migration rate between the two halves of the
island.

43
In comparing changes in island migration rate with changes in substrate slope for
the late-Holocene and future simulations, it appears that timestep length may influence
both the length of the lag period and the intensity of the substrate slope and backbarrier
response. As expected, changes in barrier island response (i.e., changes in thickness and
extent of backbarrier deposits) occur much more rapidly during simulations having 5 year
timesteps rather than simulations having 50 year timesteps (i.e., late-Holocene
simulations). Without a more accurate evaluation of the length of substrate and period of
time needed for substrate slope effects to trigger backbarrier response, it is difficult to
assess what time step length is most appropriate for simulating this relationship.
However, with SLRRs of <10 mm/yr and the considerable amount of time need for
backbarrier deposits to change in thickness, we hypothesize that substrate slope
interactions are far more likely to operate on centurial time scales.
During future simulations of island response having limited backbarrier
deposition rates, the width of the backbarrier region decreased when migrating over
substrate slopes that did not cause backbarrier narrowing when sedimentation rate was
equal to RSLRR. If backbarrier sedimentation rates are not able to keep pace with future
SLRRs, backbarrier regions would narrow in response to more moderate (i.e., less steep)
substrate slope values, likely resulting in backbarrier that are less expansive than in the
modern setting. Additionally decreased backbarriers deposition rates would reduce the
ability of backbarrier units to mitigate the effects of small-scale substrate slope
variability, thus requiring more extreme island behaviors (i.e., rapid changes in volume or
migration rate) to maintain a constant long-term migration trajectory. If backbarrier
sedimentation rates are unable to accelerate during future RSLR due to biological

44
processes (i.e., vertical accretion of salt marsh grasses) differential island behaviors may
develop based upon spatial variability in backbarrier composition.

45
5. CONCLUSIONS
Results from sensitivity analyses suggest barrier island behavior is most sensitive
to changes in factors that appreciably alter sand availability (i.e., sand-supply rates,
substrate sand content) and landward substrate slope, while island behavior is less
sensitive to changes in substrate erodibility, depth dependent response rate, and shoreface
depth. Reduced sand availability most commonly results in increases in island migration
rates (as much as ~110% increase relative to base simulation) and decreases in island
volume (up to 92% reduction) for both halves of the island. However, the migration rate
of southern Metompkin Island increases more rapidly than the migration rate of its
northern counterpart when sand availability is limited. This is likely due to the lower
elevation of the backbarrier (lagoonal) surface behind southern Metompkin which
requires vertical island position (relative to sea level) to be maintained by the barrier
island alone rather than being aided by migration onto an elevated backbarrier platform,
as in the north. This differential response to limited sand availability may partially
explain recently observed differences in island behavior between the northern and
southern halves of the island.
Sensitivity experiments which allow the island to migrate increasingly farther
landward along substrates of varying slope, reveal that interactions between substrate
slope and both the horizontal extent and vertical thickness of the backbarrier, appear to
influence island response. As the island traverses gentle substrate slopes (~ <1 m/km),
the backbarrier deposit expands horizontally resulting in thickening of the backbarrier
unit through time and a more seaward island position, while the incidences of relatively
steep substrate slopes (~ >2 m/km) appear to limit backbarrier expansion, or even reduce

46
backbarrier width, resulting thinner backbarrier deposits and more landward island
positions (Figure 18). If sufficiently gentle or steep slopes persist over long time periods,
either self-reinforcing scenario could begin to take off in a potentially “runaway”
feedback, however undulating substrate slopes within the study appear to regulate
backbarrier width thereby preventing this from occurring. Additionally, as the thickness
of backbarrier deposits continually adjusts to substrate slope, differences in sand content
between the backbarrier unit and uppermost underlying unit alter sand availability and
can either promote or prevent the establishment of runaway feedback scenarios.
Results from simulations of future island response to reported potential RSLR
scenarios for 2000- 2100 (ranging from 0.6 – 1.6 m RSLR) indicate that sand availability
and substrate slope interactions will likely continue to drive barrier island response. For
a given amount of total RSLR by the year 2100, barrier island response is less sensitive to
the exact nature (e.g., rates that increase linearly vs. polynomially) of RLSR and
primarily dependent on amount of total RSLR. If Metompkin Island is able to freely
migrate landward into the future, island disintegration or submergence is highly unlikely,
even for RSLRR considerably faster than reported, due to sufficient substrate sand
content and landward elevation change. As increased RSLRR cause the island to migrate
over increasingly larger portions of the landward substrate, similar to RSLRR sensitivity
experiments, variations in substrate slope influence the width and thickness of
backbarrier deposits. Given the steeper substrate landward of northern Metompkin
Island, the northern backbarrier constricts during future simulations requiring faster
landward migration, whereas more moderate substrate slopes in the south maintain
backbarrier width into the future. Disparate changes in backbarrier width, and

47
comparatively lower substrate sand content in the north, result in more rapid future
migration rates for northern Metompkin Island and continued straightening of the current
shoreline offset. However, simulations in which backbarrier deposition rates do not keep
pace with RSLRR (i.e., are limited to 10 mm/yr), suggest that the ability of the
backbarrier region to sufficiently respond to changes in substrate slope may be reduced if
backbarrier deposition rates cannot adequately accelerate into the future.
Theoretically, lower substrate slopes (compared to a steep substrate slope) would
require more rapid landward migration in order to achieve the same vertical position, but
given the relationship between substrate slope, changes in backbarrier extent and
thickness, and island position, backbarrier response to slope variability appears to be a
mechanism by which barrier islands are able to migrate along relatively constant
migration trajectories (as dictated by average long-term substrate slope) over long time
periods despite short-term substrate slope variation. In this case, the potential failure of
backbarrier deposition rates (either in salt marsh or open lagoon) to keep pace with future
RSLR, may limit the degree to which changes in backbarrier extent and thickness can
mitigate small-scale slope variations, thus potentially requiring more drastic changes in
island migration rate and volume in the future. Altogether, these findings highlight the
potentially critical role of backbarrier environments, substrate slope and underlying
stratigraphy in determining how Metompkin Island, as well as other islands within the
VCR, and similar barrier islands worldwide, respond to rising sea level.

48
FIGURES AND TABLES
Figure 1. Location of the Delmarva Penninsual along U.S. mid-Atlantic coastline (inset).
The large map of the southern Delmarva Peninsula shows landcover of mainland, marsh,
and barrier islands, and the red box denotes the study site, Metompkin Island. (figure
courtesy of L.W. Cole).

49
Figure 2. Image of Metompkin Island, VA (2007) showing the 200 m mid-island
shoreline offset co-located with the mid-island shift in backbarrier environment. Northern
Metompkin is backed by mostly continous platform marsh, while southern Metompkin
Island is backed by shallow open lagoon with a narrow, backbarrier fringing marsh
(Google Images, 2007).
South
North
Open
Lagoon
Marsh
Platform
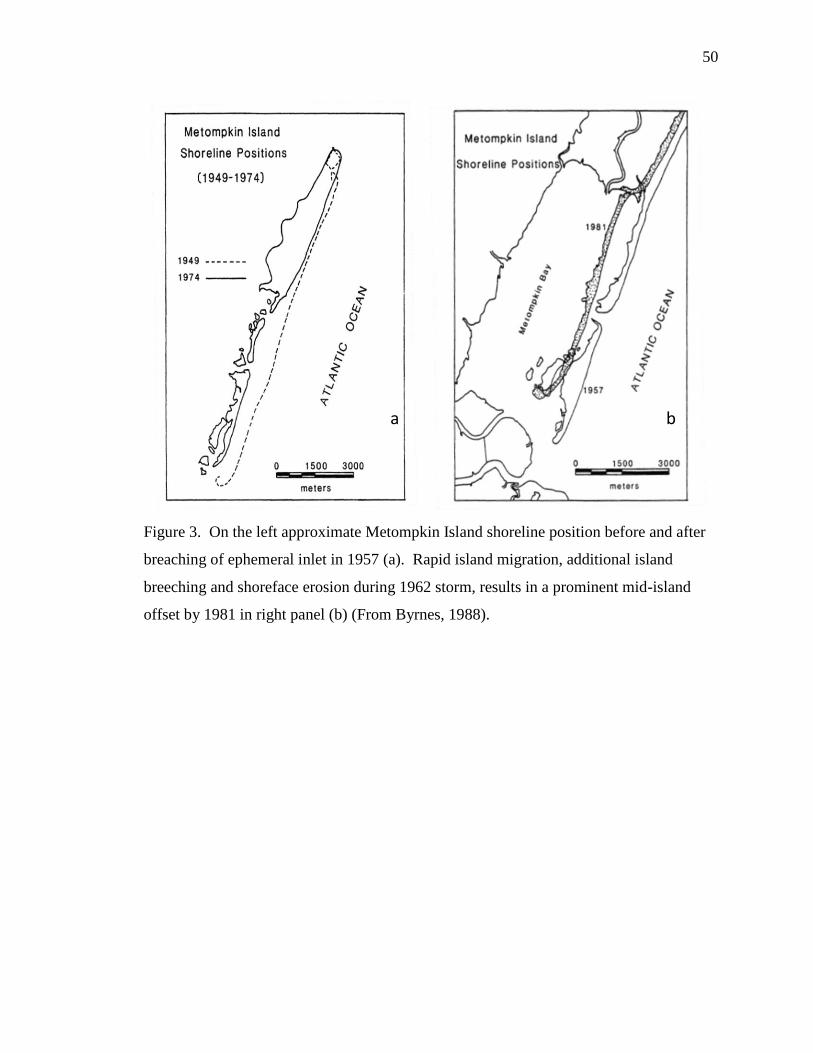
50
Figure 3. On the left approximate Metompkin Island shoreline position before and after
breaching of ephemeral inlet in 1957 (a). Rapid island migration, additional island
breeching and shoreface erosion during 1962 storm, results in a prominent mid-island
offset by 1981 in right panel (b) (From Byrnes, 1988).
a b

51
Figure 4. GEOMBEST combines the evolution of three functional realms (backbarrier,
barrier, shoreface) to simulate barrier island trangression. The three primary
stratigraphic units important in trangression include the barrier island, backbarrier
deposits, and underlying strata (From Stolper et al., 2005; Moore et al., 2010).
Backbarrier Shoreface
Underlying Substrate
Backbarrier Deposit Barrier Island
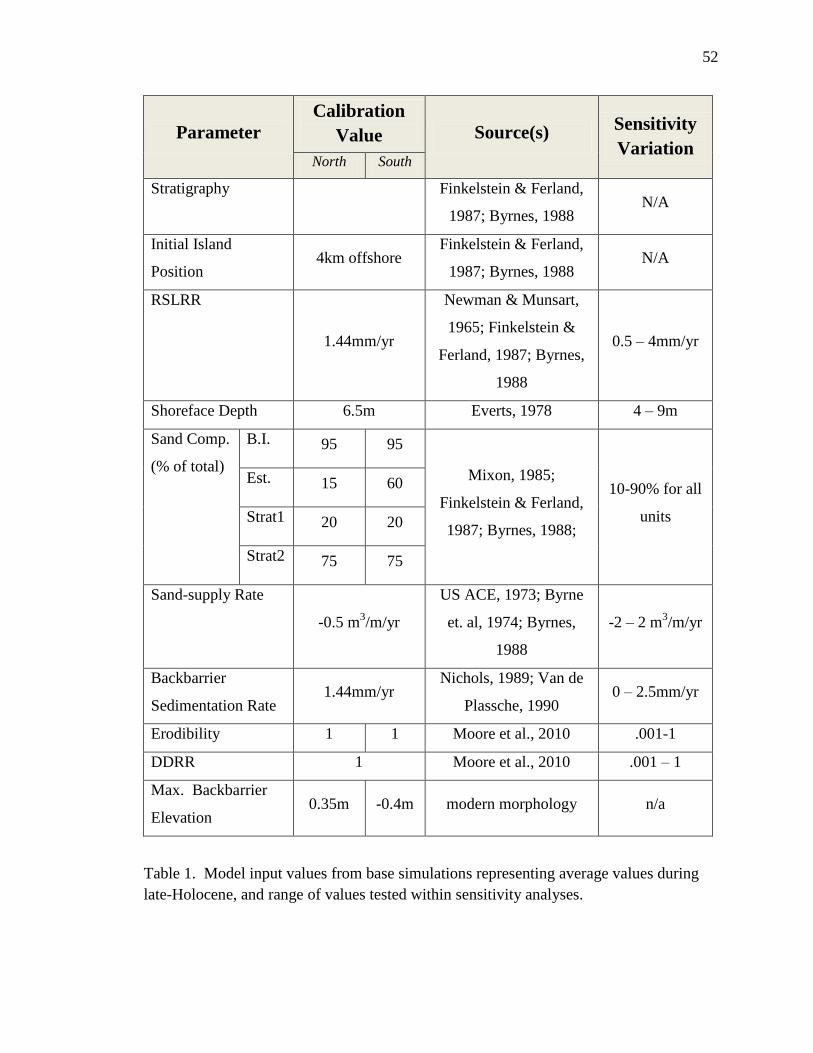
52
Parameter
Calibration
Value Source(s) Sensitivity
Variation North South
Stratigraphy
Finkelstein & Ferland,
1987; Byrnes, 1988 N/A
Initial Island
Position 4km offshore
Finkelstein & Ferland,
1987; Byrnes, 1988 N/A
RSLRR
1.44mm/yr
Newman & Munsart,
1965; Finkelstein &
Ferland, 1987; Byrnes,
1988
0.5 – 4mm/yr
Shoreface Depth 6.5m Everts, 1978 4 – 9m
Sand Comp.
(% of total)
B.I. 95 95
Mixon, 1985;
Finkelstein & Ferland,
1987; Byrnes, 1988;
10-90% for all
units
Est. 15 60
Strat1 20 20
Strat2 75 75
Sand-supply Rate
-0.5 m3/m/yr
US ACE, 1973; Byrne
et. al, 1974; Byrnes,
1988
-2 – 2 m3/m/yr
Backbarrier
Sedimentation Rate 1.44mm/yr
Nichols, 1989; Van de
Plassche, 1990 0 – 2.5mm/yr
Erodibility 1 1 Moore et al., 2010 .001-1
DDRR 1 Moore et al., 2010 .001 – 1
Max. Backbarrier
Elevation 0.35m -0.4m modern morphology n/a
Table 1. Model input values from base simulations representing average values during
late-Holocene, and range of values tested within sensitivity analyses.
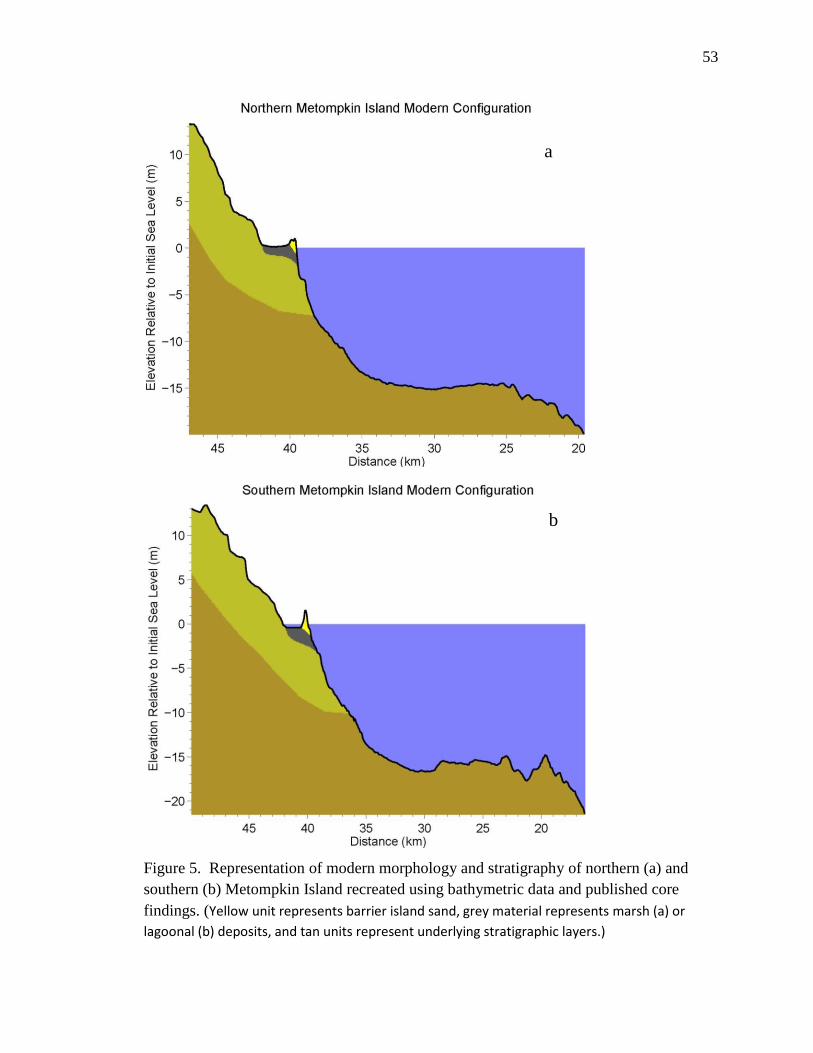
53
Figure 5. Representation of modern morphology and stratigraphy of northern (a) and
southern (b) Metompkin Island recreated using bathymetric data and published core
findings. (Yellow unit represents barrier island sand, grey material represents marsh (a) or
lagoonal (b) deposits, and tan units represent underlying stratigraphic layers.)
a
a
b

54
Figure 6. Based on available geological and geophysical data, plausible initial conditions
for late-Holocene simulations are developed for northern (a) and southern (b) Metompkin
Island. These configurations represent plausible coastal morphology and stratigraphy
4600yrs BP.
a
b

55
Figure 7. Initial (blue) and final (red) Morphologic surfaces resulting from calibration of
northern (a) and southern (b) Metompkin Island base simulations. Black line indicates
actual modern surface. Offshore position of model surface meant to represent
approximate island position in 1950, prior to island breach and development of mid-
island offset.
a
b
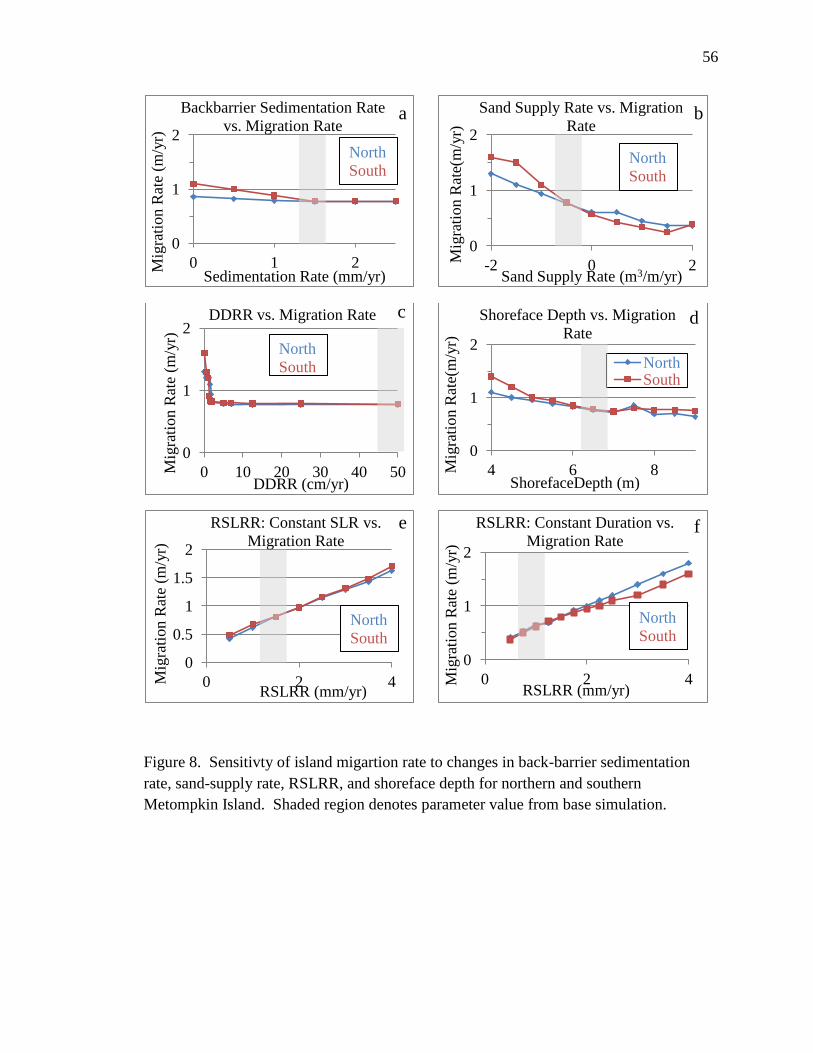
56
Figure 8. Sensitivty of island migartion rate to changes in back-barrier sedimentation
rate, sand-supply rate, RSLRR, and shoreface depth for northern and southern
Metompkin Island. Shaded region denotes parameter value from base simulation.
0
1
2
0 1 2 Mig
rati
on R
ate
(m/y
r)
Sedimentation Rate (mm/yr)
Backbarrier Sedimentation Rate
vs. Migration Rate
North
South
0
1
2
0 10 20 30 40 50 Mig
rati
on R
ate
(m/y
r)
DDRR (cm/yr)
DDRR vs. Migration Rate
North
South
0
0.5
1
1.5
2
0 2 4 Mig
rati
on R
ate
(m/y
r)
RSLRR (mm/yr)
RSLRR: Constant SLR vs.
Migration Rate
North
South
0
1
2
-2 0 2
Mig
rati
on R
ate(
m/y
r)
Sand Supply Rate (m3/m/yr)
Sand Supply Rate vs. Migration
Rate
North
South
0
1
2
4 6 8 Mig
rati
on R
ate(
m/y
r)
ShorefaceDepth (m)
Shoreface Depth vs. Migration
Rate
North South
0
1
2
0 2 4 Mig
rati
on R
ate
(m/y
r)
RSLRR (mm/yr)
RSLRR: Constant Duration vs.
Migration Rate
North
South
a b
c d
e f

57
Figure 9. Changes in island volume for northern and southern Metompkin Island
resulting from senstivity experiments. Shaded region denotes base simulation value.
0
100
200
300
0 1 2 Volu
me
(x10 m
3/m
)
Sedimentation Rate (mm/yr)
Backbarrier Sedimentation
Rate vs. Volume
North
South
0
100
200
300
0 10 20 30 40 50
Volu
me
(x10 m
3/m
)
DDRR (cm/yr)
DDRR vs. Barrier Volume
North
South
0
100
200
300
0 2 4 Volu
me
(x10 m
3/m
)
RSLRR (mm/yr)
RSLRR: Constant RSLR vs.
Volume
North
South
0
100
200
300
-2 0 2 Volu
me
(x10 m
3/m
)
Sand Supply Rate (m3/m/yr)
Sand Supply Rate vs. Volume
North
South
0
100
200
300
4 6 8 Volu
me
(x10 m
3/m
) Shoreface Depth (m)
Shoreface Depth vs. Volume
North
South
0
100
200
300
0 1 2 3 4
Vo
lum
e (x
10 m
3/m
)
RSLRR (mm/yr)
RSLRR: Constant Duration vs.
Volume
North
South
a b
c d
e f
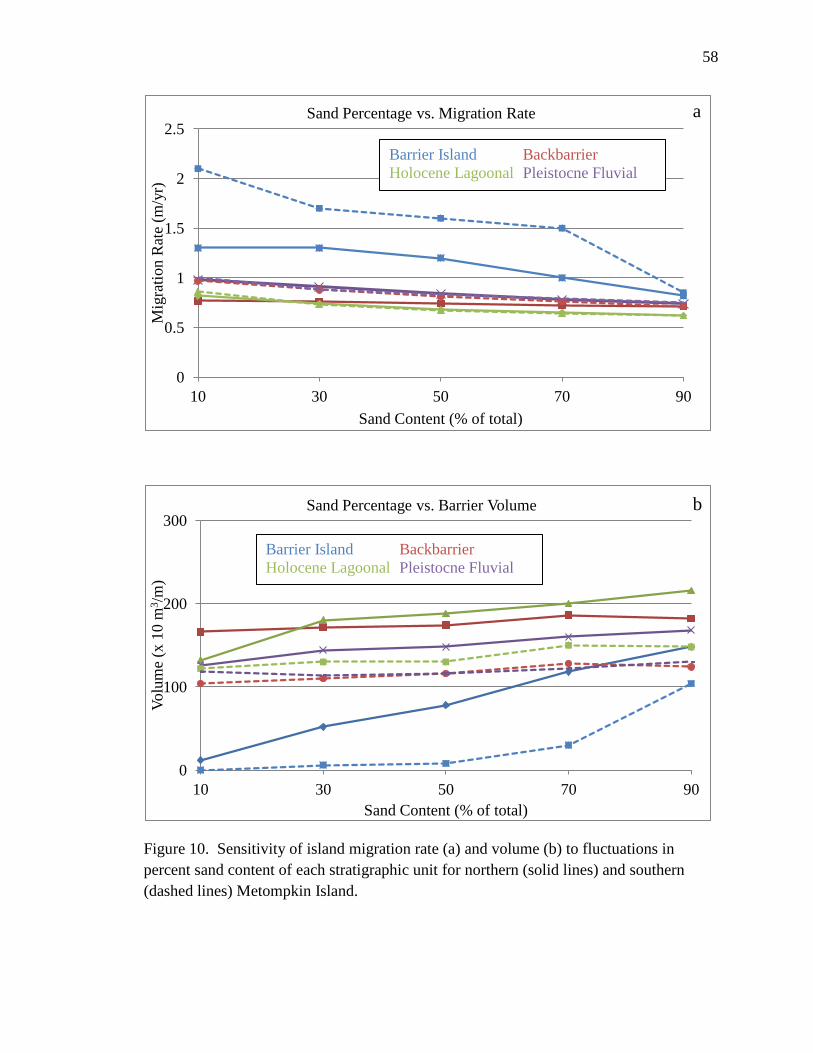
58
Figure 10. Sensitivity of island migration rate (a) and volume (b) to fluctuations in
percent sand content of each stratigraphic unit for northern (solid lines) and southern
(dashed lines) Metompkin Island.
0
0.5
1
1.5
2
2.5
10 30 50 70 90
Mig
rati
on R
ate
(m/y
r)
Sand Content (% of total)
Sand Percentage vs. Migration Rate
Barrier Island
Holocene Lagoonal
Backbarrier
Pleistocne Fluvial
0
100
200
300
10 30 50 70 90
Volu
me
(x 1
0 m
3/m
)
Sand Content (% of total)
Sand Percentage vs. Barrier Volume
Barrier Island
Holocene Lagoonal
Backbarrier
Pleistocne Fluvial
a
b
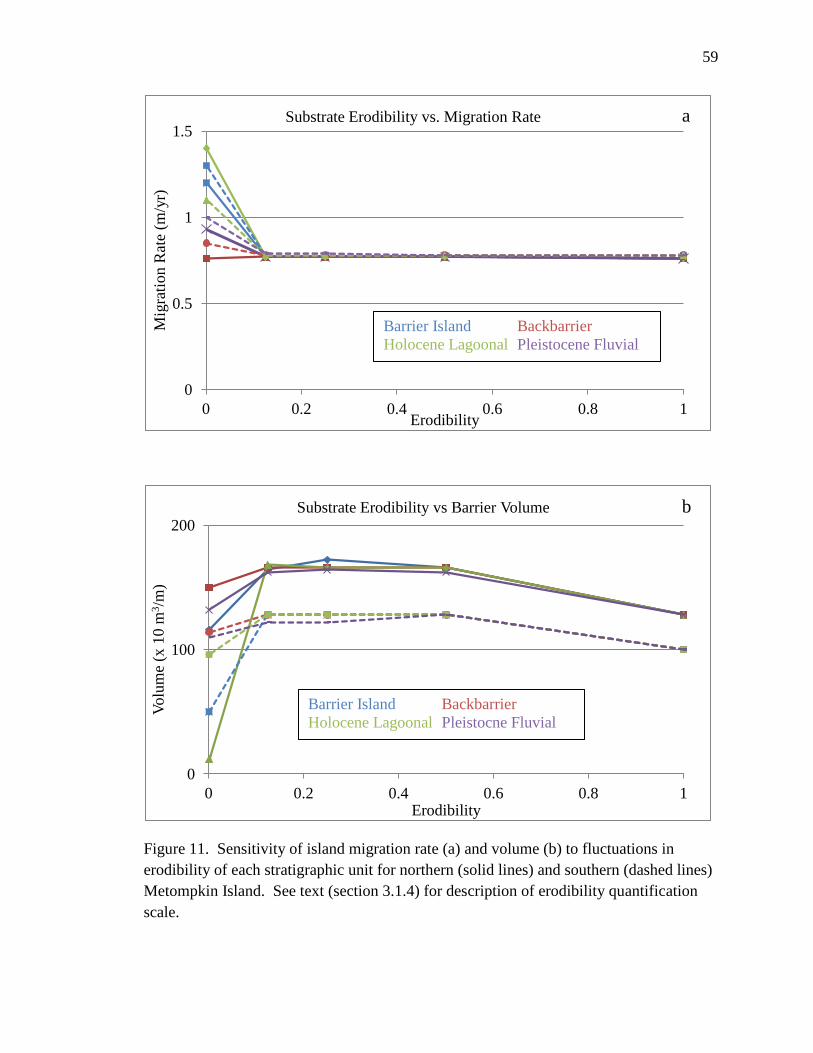
59
Figure 11. Sensitivity of island migration rate (a) and volume (b) to fluctuations in
erodibility of each stratigraphic unit for northern (solid lines) and southern (dashed lines)
Metompkin Island. See text (section 3.1.4) for description of erodibility quantification
scale.
0
0.5
1
1.5
0 0.2 0.4 0.6 0.8 1
Mig
rati
on R
ate
(m/y
r)
Erodibility
Substrate Erodibility vs. Migration Rate
Barrier Island
Holocene Lagoonal
Backbarrier
Pleistocene Fluvial
0
100
200
0 0.2 0.4 0.6 0.8 1
Volu
me
(x 1
0 m
3/m
)
Erodibility
Substrate Erodibility vs Barrier Volume
Barrier Island
Holocene Lagoonal
Backbarrier
Pleistocne Fluvial
a
b

60
Figure 12. Changes in backbarrier width (solid lines) with landward substrate slope
variability (dashed lines) during late-Holocene RSLLR sensitivity simulations shown
above (a). Changes final island volume (dashed lines) compared to backbarrier width
(solid lines) during late-Holocene RSLLR sensitivity simulations below (b).
0
2
4
6
0
1
2
3
4
5
0 1 2 3 4
Bac
kbar
rier
Wid
th (
km
)
Subst
rate
Slo
pe
(m
/km
)
RSLRR (mm/yr)
Substrate Slope vs. Backbarrier Width
0
50
100
150
200
250
0
1
2
3
4
5
6
0 1 2 3 4
Volu
me
(x10 m
3/m
)
Bac
kbar
rier
Wid
th (
km
)
RSLRR (mm/yr)
Island Volume vs. Backbarrier Width
North
South
North
South
a
b

61
Figure 13. Final stratigraphy and morphology of northern (a) and southern (b)
Metompkin Island with a 4mm/yr RSLRR during the late-Holocene time period. Gray
ghost traces depict island position through time.
a
b

62
1m RSLR 1.6m RSLR
Migration Rate
(m/yr)
Volume Increase
(m3/m)
Migration Rate
(m/yr)
Volume Increase
(m3/m)
North 1.02 726 1.31 851
South 0.55 309 0.88 549
Table 2. Average migration rate (m/yr) and volume change (initial subtracted from final
in m3/m) of all RSLRR scenarios when total RSLR is 1m and 1.6m RSLR for northern
and southern Metompkin Island.

63
Figure 14. Modern surface morphology of northern and southern Metompkin Island used
in creating initial morphology (Figure 5) and as the initial configuration for future
simulations. Notice substrate slope disparities landward of modern backbarrier and
differences in modern barrier island slopes.
Figure 15. Initial surface morphology for late-Holocene simulations. Notice difference
substrate units near modern island position (40,000-42,000 km on x-axis) between island
halves.
-8
-6
-4
-2
0
2
4
6
37000 39000 41000 43000 45000
Ele
vat
ion
(m
)
Distance (km)
Modern Morphology
North Surface
South Surface
North BI Slope
South BI Slope
-8
-6
-4
-2
0
2
4
6
8
10
32000 34000 36000 38000 40000 42000
Ele
vat
ion (
m)
Distance (km)
Initial late-Holocene Morphology
North Surface
South Surface
North BI Slope
South BI Slope
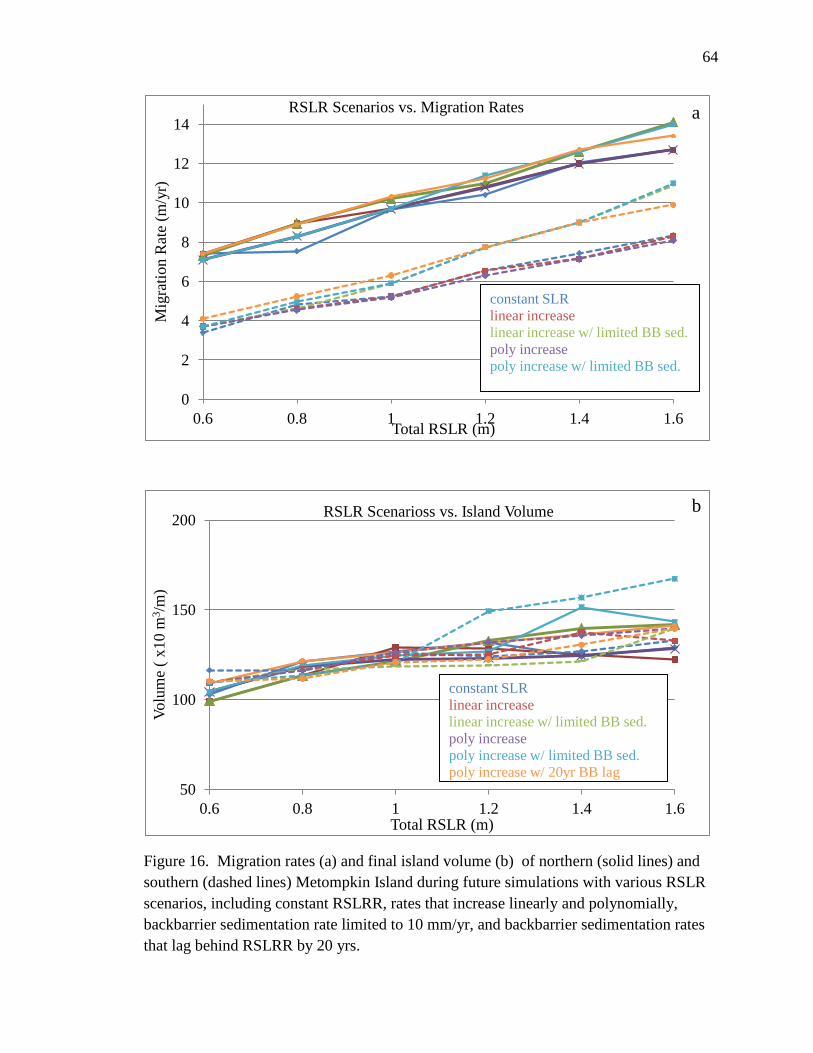
64
Figure 16. Migration rates (a) and final island volume (b) of northern (solid lines) and
southern (dashed lines) Metompkin Island during future simulations with various RSLR
scenarios, including constant RSLRR, rates that increase linearly and polynomially,
backbarrier sedimentation rate limited to 10 mm/yr, and backbarrier sedimentation rates
that lag behind RSLRR by 20 yrs.
0
2
4
6
8
10
12
14
0.6 0.8 1 1.2 1.4 1.6
Mig
rati
on R
ate
(m/y
r)
Total RSLR (m)
RSLR Scenarios vs. Migration Rates
constant SLR
linear increase
linear increase w/ limited BB sed.
poly increase
poly increase w/ limited BB sed.
50
100
150
200
0.6 0.8 1 1.2 1.4 1.6
Volu
me
( x
10 m
3/m
)
Total RSLR (m)
RSLR Scenarioss vs. Island Volume
constant SLR
linear increase
linear increase w/ limited BB sed.
poly increase
poly increase w/ limited BB sed.
poly increase w/ 20yr BB lag
a
b
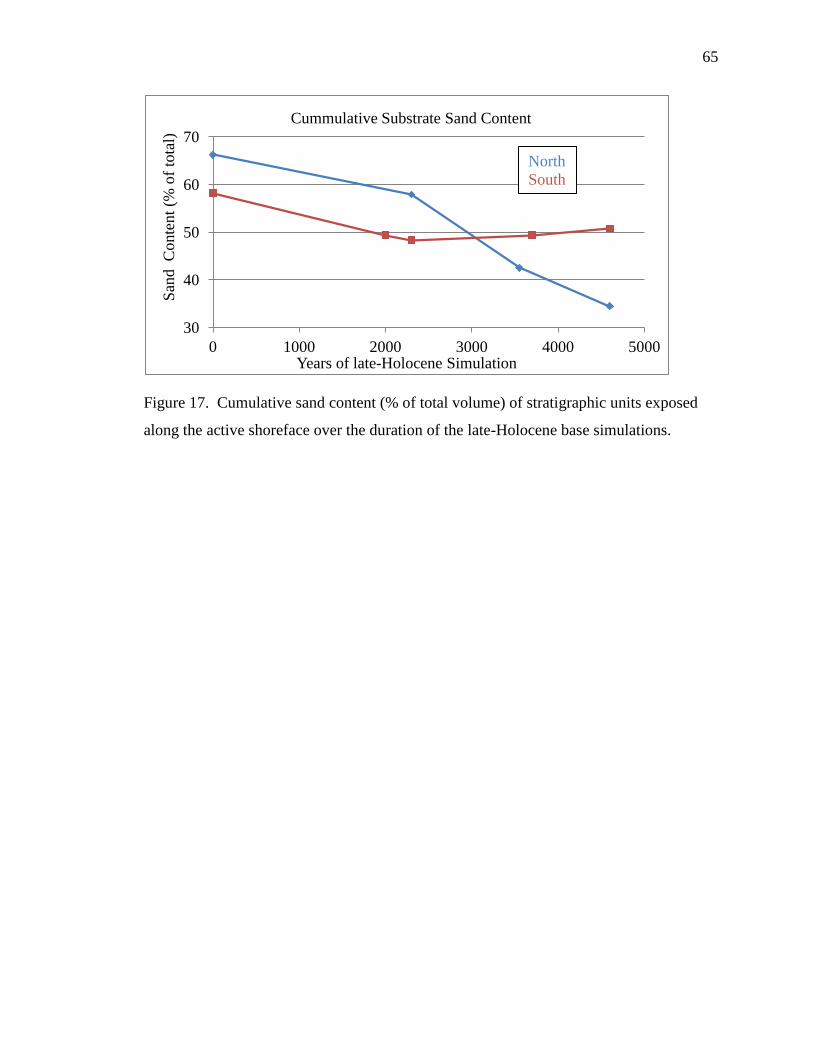
65
Figure 17. Cumulative sand content (% of total volume) of stratigraphic units exposed
along the active shoreface over the duration of the late-Holocene base simulations.
30
40
50
60
70
0 1000 2000 3000 4000 5000
San
d C
onte
nt
(% o
f to
tal)
Years of late-Holocene Simulation
Cummulative Substrate Sand Content
North
South

66
Figure 18. Starting at an initial condition with a moderate substrate slope (left panel), with temporary perturbations in substrate slopes
(center panel) backbarrier width adjusts to slope allowing island migration to remain more constant through time. However over
longer timescales (right panel), with continued slope variation and backbarrier response, initial configuration can be maintained (with
return to modern substrate slope), or feedbacks can become established (with persistent extreme substrate slope values).

67
REFERENCES
Bruun, P. Sea-level rise as cause of coastal erosion. Journal of the Waterways and Harbor
Division, ASCE 88, 117-130.
Byrne, R. J., Dealteris, J. T., & Bullock, P. A. (1974). Channel stability in tidal inlets: A case
study. Proceedings from the 14th Coastal Engineering Conference, ASCE, , 1585-1604.
Byrnes, M. R. (1988). Holocene geology and migration of a low-profile barrier island system,
Metompkin Island, Virginia. (PhD, Old Dominion University).
Church, J. A., & White, N. J. (2006). A 20th century acceleration in global sea-level rise.
Geophysical Research Letters, 33, L01602.
Cowell, P. J., Roy, P. S., & Jones, R. A. (1995). Simulation of large-scale coastal change using a
morphological behavior model. Marine Geology, 126, 45-61.
Craft, C., Clough, J., Ehman, J., Joye, S., Park, R., Pennings, S., Guo, H., & Machmuller, M.
(2009) Forecasting the effects of accelerated sea-level rise on tidal marsh ecosystem
services. Front. Ecol. Environ, 7, 73–78.
Curray, J. R. (Ed.). (1964). Transgressions and regressions. New York: Macmillan.
Demarest, J. M., & Leatherman, S. P. (1985). Mainland influence on coastal transgression:
Delmarva peninsula. Marine Geology, 63, 19-33.
Dolan, R., Hayden, B. P., & Jones, C. (1979). Barrier island configuration. Science, 204(4391),
401-403.
Dolan, R., Lins, H. F., & Hayden, B. P. (1988). Mid-Atlantic coastal storms. Journal of Coastal
Research, 4(3), 417-433.
Emmanuel, K. (2008). The hurricane-climate connection. Bulletin of the American
Meteorological Society, ES10-ES19
Engelhart, S. E., Horton, B. P., Douglas, B. C., Peltier, W. R., & Tornqvist, T. E. (2009). Spatial
variability of late Holocene and 20th century sea-level rise along the Atlantic coast of the
United States. Geology, 37(12), 1115-1118.
Erwin, M. R., Cahoon, D. R., Prosser, D. J., & Sanders, G. M. :. H., P. (2006). Surface elevation
dynamics in vegetated Spartina marshes versus unvegetated tidal ponds along the mid-
Atlantic coast, USA, with implications to waterbirds. Estuaries and Coasts, 29(1), 96-
106.

68
Everts, C. H. (1978). Geometry of profiles across inner continental shelves of the Atlantic and
gulf coasts of the United States. Fort Belvoir, Va.: U.S. Army Corps of Engineers;
Coastal Research Center.
Fagherazzi, S., & Wiberg, P. L. (2009). Importance of wind conditions, fetch, and water levels
on wave-generated shear stresses in shallow intertidal basins. Journal of Geophysical
Research, 114, F03022.
Finkelstein, K. H. (1986). Backbarrier contributions to a littoral sand budget, Virginia eastern
shore, USA. Journal of Coastal Research, 2(1), 33-42.
Finkelstein, K. H., & Ferland, M. A. (Eds.). (1987). Back-barrier response to sea-level rise,
eastern shore of Virginia (41st ed.). Special Publications: The Society of Economic
Paleontologists and Mineralogists.
FitzGerald, D. M., Fenster, M. S., Argow, B. A., & Buynevich, I. V. (2008). Coastal impacts due
to sea-level rise. Annual Review of Earth and Planetary Sciences, 36, 601-647.
Foyle, A. M., & Oertel, G. F. (1997). Transgressive systems tract development and incised-
valley fills within a quaternary estuary-shelf system; Virginia inner shelf, USA. Marine
Geology, 137(3-4), 227.
Gutierrez, B. T., Williams, S. J., & Thieler, E. R. (2007). Potential for shoreline changes due to
sea-level rise along the U.S. mid-Atlantic region. United States Geological Survey Report
Series, (1278).
Hayden, B. P., Dolan, R., & Ross, P. (1980). Barrier island migration; thresholds in
geomorphology. In D. R. Coates, & J. D. Vitek (Eds.), Thresholds in geomorphology ().
London: George Allen & Unwin.
Hicks, S. D., DeBaugh, H. A., & Hickman, L. E. (1983). Sea level variations for the United
States: 1855-1980. National Ocean Service, U.S. Department of Commerce.
Jevrejeva, S., Moore, J.C., Grinstad, A. (2010) How will sea level respond to changes in natural
and anthropogenic forcings by 2100? Geophyscial Research Letters, 37, L07703.
Inman, D. L., & Dolan, R. (1989). The outer banks of North Carolina: Budget of sediment and
inlet dynamics along a migrating barrier system. Journal of Coastal Research, 5(2), 193-
237.
International Panel on Climate Change (IPCC). (2007). Climate change 2007: The physical
science basis. Cambridge and New York: Cambridge University Press.

69
Knutson, T.R., Mcbride, J., Chan, J., Emanuel, K., Holland, G., Landsea, C., Held, I., Kossin,
J.P., Srivastava, A.K., Sugi, M. (2010) Tropical cyclones and climate change. Nature,
doi: 10.1038/ngeo779.
Larson, M. (1991). Equilibrium profile of a beach with varying grain size. Coastal Sediments.
ASCE-1991, 905-919.
Lawson, S. E., Wiberg, P. L., McGlathery, K. J., & Fugate, D. C. (2007). Wind-driven sediment
suspension controls light availability in a shallow coastal lagoon. Estuaries and Coasts,
30(1), 102-112.
Leatherman, S. P. (1979). Beach and dune interactions during storm conditions. Quarterly
Journal of Engineering Geology and Hydrogeology, 12(4), 281-290.
McBride, R. A., & Moslow, T. F. (1991). Origin, evolution, and distribution of shoreface sand
ridges, Atlantic inner shelf, U.S.A. Marine Geology, 97, 57-85.
McGlathery, K., Porter, J. H., & Wiberg, P. L. (2006). Long-term drivers, sate change and
disturbance on the Virginia Coast Reserve: LTER V. Proposal to National Science
Foundation,
Mixon, R. B. (1985). Stratigraphic and geomorphic framework of uppermost Cenozoic deposits
in the southern Delmarva Peninsula, Virginia and Maryland. U.S. U.S. Geological Survey
Professional Paper 1067-G,
Moore, L. J., List, J. H., Williams, S. J., & Stolper, D. (2010). Complexities in barrier island
response to sea level rise: Insights from numerical model experiments, North Carolina
outer banks. Journal of Geophysical Research, 115, 27.
Moore, L. J., List, J. H., Williams, S. J., Patsch, K. (2011). Barriers on the brink: the complex
intertwined roles of geologic framework, sediment availability, and sea-level rise in
island evolution. To appear in Coastal Sediments ’11.
Newman, W. S., & Rusnak, G. A. (1965). Holocene submergence of the eastern shore of
Virginia. Science, 148(3678), 1464-1466.
Nichols, M. M. (1989). Sediment accumulation rates and relative sea-level rise in lagoons.
Marine Geology, 88, 201-219.
Oertel, G. F., Allen, T. R., & Foyle, A. M. (2008). The influence of drainage hierarchy on
pathways of barrier retreat; an example from Chincoteague Bight, Virginia, U.S.A.
Southeastern Geology, 45(3), 179.

70
Oertel, G. F., & Woo, H. J. (1994). Landscape classification and terminology for marsh in deficit
coastal lagoons. Journal of Coastal Research, 10(4), 919-932.
Pilkey, O. H., Young, R. S., & Bush, D. M. (2000). Comment on sea level rise shown to drive
coastal erosion. EOS Transactions, 81(38), 437-441.
Rice, T. E., & Leatherman, S. P. (1983). Barrier island dynamics; the eastern shore of Virginia.
Southeastern Geology, 24(3), 125-137.
Rice, T. E., Niedoroda, A. W., & Pratt, A. P. (1976). The coastal processes and geology, Virginia
barrier islands. The Virginia Coast Reserve Study, 108-332.
Sallenger, A. H. (2000). Storm impacts scale for barrier islands. Journal of Coastal Research,
16(3), 890-895.
Shideler, G. L., Ludwick, J. C., Oertel, G. F., & Finkelstein, K. H. (1984). Quaternary
stratigraphic evolution of the southern Delmarva Peninsula coastal zone, Cape Charles,
Virginia. Bulletin of the Geological Society of America, 95(4), 489-502.
Stolper, D., List, J. H., & Thieler, E. R. (2005). Simulating the evolution of coastal morphology
and stratigraphy with a new morphological-behavior model (GEOMBEST). Marine
Geology, 218, 17-36.
Van de Plassche, O. (1990). Mid-Holocene sea-level change on the eastern shore of Virginia.
Marine Geology, 91(1-2), 149-154.
Vermeer, M. & Rahmstorf, S. (2009) Global sea level linked to global temperature. Proceedings
from National Academy of Sciences. 106:21527–21532.
Webster, P. J., Holland, G. J., Curry, J. A., & Chang, H. (2005). Changes in tropical cyclone
number, duration, and intensity in a warming environment. Science, 309, 1844-1847.
Wolner, C.W.V. (2011). Ecomorphodynamic feedbacks and barrier island evolution, Virginia
Coast Reserve, USA. Master's Thesis, University of Virginia, Charlottesville, VA, USA.