Embed Size (px)
Citation preview

Final Environmental Impact Statement
Chapter 8 – Financial Analysis
S o u t h e a s t C o r r i d o r January 2007 8-1
8. FINANCIAL ANALYSIS This chapter presents the financial analysis conducted for the Locally Preferred Alternative (LPA) selected by the Metropolitan Transit Authority of Harris County (METRO) for the Southeast Corridor.1 The financial plan presents estimated capital and operating costs, funding sources, and a 24-year cash flow analysis. The financial feasibility of the LPA was determined by developing a cash flow analysis which demonstrates that METRO can implement the project and still have a substantial positive cash balance at the end of the forecast year 2030.
The financial analysis prepared for the LPA is intended to:
• Demonstrate the financial viability of a METRO/Federal Transit Administration (FTA) partnership in implementing the LPA;
• Identify the financial resources required to fund the capital and operations and maintenance costs associated with the 6.03-mile LPA in the context of the existing light rail transit (LRT) line and bus service; and
• Demonstrate to the FTA the financial capacity of METRO to build, operate, and maintain the LPA while continuing to operate and expand their existing base transit system and complete the other components of the METRO Solutions plan.
The financial analysis assumes that the future bus operating plan for the Southeast Corridor implements transit service changes from the METRO Solutions Phase 2 plan. In addition, some routes will have reduced headways if they are operating parallel to the proposed Bus Rapid Transit (BRT) Convertible alignment. Specific details of the service changes are described in the New Starts Baseline Report for the Southeast Corridor, March 2005.
8.1 Background
In November 2003, Houston-area voters approved the METRO Solutions transit system plan and granted approval for METRO to issue up to $640 million in long-term bonds to help fund implementation of the system through 2012. METRO prepared a detailed financial analysis to support the plan that went to the voters in November 2003. The analysis demonstrated that METRO has the financial capacity to implement the plan through a partnership with the FTA. The plan is based upon 49.9 percent capital funding for the project from the FTA, Section 5309 New Starts funding, and 50.1 percent from committed METRO local resources.
1 Acronyms and abbreviations are defined at their first use in each chapter. A complete list of
acronyms and abbreviations used in this FEIS is contained in Appendix A.

Final Environmental Impact Statement Chapter 8 – Financial Analysis
S o u t h e a s t C o r r i d o r 8-2 January 2007
8.2 Project Sponsor and Funding Partners
8.2.1 Metropolitan Transit Authority of Harris County
METRO, the project sponsor, was created on December 16, 1977 pursuant to Chapter 451 of the Texas Transportation Code. Harris County voters approved METRO’s confirmation and tax rate referendum on August 12, 1978. With authorization of a one percent sales tax to fund the agency, this mandate by the voters gave Houston both the financial base and the regional authority to implement transportation solutions to improve mobility and relieve traffic congestion in the area.
The political jurisdictions participating in the METRO service area are:
• Portions of unincorporated Harris County,
• City of Houston,
• City of Bellaire,
• City of Bunker Hill Village,
• City of El Largo,
• City of Hedwig Village,
• City of Hilshire Village,
• City of Humble,
• City of Hunters Creek,
• City of Katy,
• City of Missouri City,
• City of Piney Point,
• City of Southside Place,
• City of Spring Valley,
• City of Taylor Lake Village, and
• City of West University Place.
Today METRO has a well-established bus system, including a peak fleet of approximately 1,250 (includes contract and METROLift vehicles) buses and a regional system of more than 100 miles of high occupancy vehicle (HOV) lanes.
8.2.2 Federal Transit Administration
FTA is proposed to have an important role as a 49.1 percent/50.1 percent shared capital expense funding partner in this corridor. The following FTA grant programs are included in the development of the financial plan:
• Section 5307 – These formula grants are based on various demographic, level of service (LOS), and ridership variables. Factors in the formula that allocate grants to urbanized areas were estimated based on annual growth in total Safe, Accountable, Flexible, Efficient Transportation Equity Act: A Legacy for Users (SAFETEA-LU) Section 5307 funds adjusted downward to account for a larger transit service and demographic base over which these grants are applied. SAFETEA-LU limits the application of these grants to capital purposes, but preventative maintenance expenses in the operating budget may be considered as “capital” for this purpose.
• Section 5309 New Starts – FTA requires that New Starts Project sponsors secure the adoption of the LPIS into the financially constrained regional long range transportation plan as a prerequisite to the sponsor seeking approval from

Final Environmental Impact Statement
Chapter 8 – Financial Analysis
S o u t h e a s t C o r r i d o r January 2007 8-3
FTA for Section 5309 New Starts funding for Preliminary Engineering, for Final Design, and Construction. The local metropolitan planning organization, Houston-Galveston Area Council (H-GAC), has programmed the Southeast LRT project into the regionally-adopted, financially constrained H-GAC 2025 Regional Transportation Plan (RTP), adopted on June 2005 and the regionally-adopted FY2006-FY2008 Transportation Improvement Plan (TIP), adopted April 22, 2005. In addition, H-GAC conducted a conformity consistency finding under the review and guidance of their conformity partners2 to substitute BRT Convertible for LRT in the 2025 RTP interim analysis year of 2015. The analysis was conducted in October 2005 and found that the technology change had no significant impact on the conformity findings of the adopted plan. After a 30-day public comment period and a public hearing, the Transportation Policy Council (TPC) adopted the interim technology change and notified all pertinent regulating and implementing agencies of the change in December 2005. With the conclusion of this exercise, the LPA is part of the current financially constrained and conforming long range transportation plan. This analysis assumes that METRO and the FTA would share 50.1 percent/49.9 percent responsibility for the capital costs of this project by FTA Section 5309 New Starts program monies.
• Section 5309 Bus Related – These discretionary grants are applied to the purchase of buses and bus-related assets.
• Congestion Mitigation/Air Quality (CMAQ) – This grant program is applied to capital projects and to support operation of some transit services.
8.3 Summary of the Financial Plan
Although METRO must consider the financial implications of the entire METRO Solutions Phase 2 plan through 2012, the financial plan presented in this chapter demonstrates the independent impact of the Southeast Corridor project or LPA on METRO’s cash flow. Table 8-1 summarizes the uses and sources of funds proposed for the LPA and for the rail and bus systems that will be in operation during the FY 2006 – FY 2030 period. The table indicates the total estimated capital costs and revenues as well as total operations and maintenance costs and revenues.
8.3.1 Uses of Funds
As shown in Table 8-1, the total cost of the LPA, systemwide bus program, METRO Solutions Phase 2 plan, and METRO’s non-transit programs is estimated to be $25.956 billion ($YOE) over the FY 2006 to FY 2030 period. Of this total, $10.556 billion are for non-transit bus, bus, METRO Solutions Phase 2, the Southeast Corridor project’s capital costs and debt service payments (collectively referred to as capital), and $15.399 billion are for on-going non-transit bus, and LRT operations and maintenance costs.
2 H-GAC’s conformity partners include the Texas Department of Transportation, Federal Highway
Administration, Environmental Protection Agency, Federal Transit Administration, and METRO.
Final Environmental Impact Statement Chapter 8 – Financial Analysis
S o u t h e a s t C o r r i d o r 8-4 January 2007
Table 8-1. Proposed Sources and Uses of Funds FY 2005 to 2030 (Year of Expenditure Dollars)
Capital Costs Total % of Total Bus $4,373,094,000 41% Southeast Corridor BRT (50%/50% federally funded project only) $169,839,000 2% All other METRO Solutions Phase 2 components $2,679,901,000 25% Non-Transit (General Mobility and Transitways) $1,502,463,000 14% Total Capital Costs $8,725,297,000 Debt Service Payments Debt Service Issued Beginning FY 2006 $1,831,597,000 Debt Service on Bonds Issued Prior to FY 2006 $- Total Debt Service Payments $1,831,597,000 17% Total Capital Costs and Debt Service Payments $10,556,894,000 100% Operating Costs Bus and Existing LRT $13,994,667,000 91% Southeast Corridor BRT (50%/50% federally funded project only) $170,419,000 1% All other METRO Solutions Phase 2 components $798,567,000 5% Non-Transit (Traffic Management) $435,599,000 3% Total O&M Costs $15,399,252,000 100% Total Capital, Debt Service, And O&M Costs $25,956,146,000 Revenues Federal 12% FTA Section 5307 Urbanized Area Formula Grant/CMAQ/Misc $2,815,058,000 FTA Section 5309 New Starts $1,082,578,000 Other Federal Discretionary plus prior FTA Sec 5307 $83,104,000 Subtotal, Federal $3,980,740,000 Local Sales Tax $23,095,942,000 88% Farebox Revenues $2,930,439,000 Miscellaneous Grants $66,751,000 Interest Income $2,475,307,000 Bond Proceeds $1,349,400,000 Subtotal, Local $29,917,839,000 Total Revenues $33,898,579,000 Beginning Balance in 2006 $114,050,000 Ending Balance in 2030 $8,056,483,000
Source: METRO Cash Flow Model, Sources and Uses of Funds, Office of Management & Budget, Case #696-1(YOE$), October 2006.
Of the $10.556 billion in estimated capital costs, two percent is for the Southeast Corridor project. A project capital, 41 percent for bus capital, and 14 percent for the non-transit programs, (general mobility and transitways), 25 percent for all other METRO Solutions Phase 2 components. Of the $15.399 billion in operating and maintenance (O&M) costs, 91 percent are for bus and existing LRT O&M, less than one percent for Southeast Corridor project O&M, and three percent for non-transit O&M (traffic management).
Final Environmental Impact Statement
Chapter 8 – Financial Analysis
S o u t h e a s t C o r r i d o r January 2007 8-5
8.3.2 Sources of Funds
The revenues required to fund the LPA are forecasted to be available from federal and local sources. Over and above this level, the project sponsor will use a portion of its $8.056 billion ending balance in 2030 that will be available for the elements to fund the remainder of the METRO Solutions plan. These other available and unexpended revenues accrue annually and are comprised of an annual cash balance plus the excess of annual revenues over expenses.
The revenues used for capital are derived from local and federal sources. Local sources include sales tax revenues, farebox revenues, and interest income. Federal sources include FTA Section 5309 New Starts funds. METRO is requesting FTA to participate as a 50.1 percent/49.9 percent shared capital expense partner, using Section 5309 New Starts program monies, to fund the Southeast Corridor project.
8.3.3 Reliance on Existing Sources of Funding
In 1978, voters approved a one percent sales tax dedicated to transit. In November 2003, voters in the METRO service area demonstrated their commitment to the METRO Solutions plan, including transit improvements to the Southeast Corridor, with majority approval of plan. With voter approval, authorization was given for the issuance of up to $640 million in bonds to fund the overall plan through 2012. The local sales tax and the new local funding provided by the bonding authorization will enable METRO to implement and operate the plan through 2012. No bond funds will be used for the Southeast Corridor project.
8.3.4 Summary
METRO’s financial plan for the Southeast Corridor project reflects a partnership between METRO and the FTA. This financial analysis confirms the ability of METRO to fund the capital and operating costs of its existing and expanded bus services and the LPA, through a shared capital expense responsibility. In this financing partnership, FTA’s contribution will be 49.9 percent of the overall capital cost.
8.4 Capital Plan
This section describes METRO’s capital spending plan and funding sources for the proposed project. Project estimated capital cost and expenditure schedules, funding sources, contingencies for potential cost over-runs and funding short falls, and METRO’s project-related debt burden are reviewed and analyzed. Finally, the project-specific capital plan is incorporated in METRO’s agency-wide capital plan, which serves as the foundation for the project capital plan.
8.4.1 Proposed Capital Plan for the LPA
The proposed capital plan integrates annual projections of capital expense and revenues. The capital plan includes the Southeast Corridor project, the METRO Solutions Phase 2 plan, maintenance of METRO’s fixed assets in good repair, and routine replacement of buses and other assets. The plan addresses detailed estimates of annual construction costs and includes contingencies for cost increases.

Final Environmental Impact Statement Chapter 8 – Financial Analysis
S o u t h e a s t C o r r i d o r 8-6 January 2007
It applies local tax and internally generated revenues and various sources of federal funding. Finally, the plan recognizes the practical limitations of METRO’s capital capacity and provides clear financial performance indicators addressing the level of working capital necessary and achieved in the plan.
8.4.1.1 Capital Costs and Schedule
Unit costs used in the preparation of the capital cost estimates for the New Starts Report were based on the actual costs experienced on the METRORail LRT line on Main Street. These LRT unit costs were developed in 2004 dollars with applicability to guided rail transit (GRT). This evaluation resulted in revised unit costs for the development of BRT in 2006 dollars.
Recognizing that the Consumer Price Index (CPI) may not reflect the changes in prices for the construction industry METRO has reviewed the trends going back as far as 1990 to determine how significant the differences are between the various construction indices and the Houston CPI. The construction indices selected are from Engineering News Record because of their availability, ease of use and widespread acceptance.
The indices selected are as follows:
• Dallas Building Cost Index (BCI)
• Dallas Construction Cost Index (CCI)
• National Construction Cost Index
• National Building Cost Index
Table 8-2 shows the compounded rate of change for various indices of the time periods shown:
Table 8-2. Compounded Rate of Change
Index 1990 to 2005 2002 to 2005 2005 to 2006 Dallas BCI 2.93% 5.87% 2.85% Dallas CCI 2.60% 6.44% 1.57% National CCI 3.19% 5.23% 3.25% National BCI 3.15% 5.95% 3.54% Houston CPI 2.41% 2.31% 2.97%
*Engineering News Record, Spring 2006.
As demonstrated in Table 8-2, the various construction indices are consistently higher than the consumer price index through 2005. This is especially true over the past three years. Recognizing this difference, it is prudent to reevaluate the use of the CPI inflation factor used to escalate from 2005 dollars to 2006 dollar. If one accepts the national CCI as a reasonable basis to adjust the construction price changes in Houston, the factor recommended for escalating 2005 dollars to 2006 dollars is 3.25 percent rather than the factor of 2.97 percent. This National CCI for

Final Environmental Impact Statement
Chapter 8 – Financial Analysis
S o u t h e a s t C o r r i d o r January 2007 8-7
the period August 2005 to August 2006 shows an increase of 3.25 percent and the national BCI shows an increase of 3.19 percent.
Historical data were used to estimate future inflation. The average annual National Construction Cost Index from 1990 to 2005 was 3.19 percent. As a conservative approach, we have assumed the same average performance from 2007 to 2030.
Units were confirmed based on preliminary engineering drawings prepared for the corridor. Capital costs estimates in 2006 and year of expenditure dollars were documented in the FTA’s Standard Cost Category (SCC) worksheets and submitted to FTA in October 2006. The cost estimates were reviewed by the Project Management Oversight Contractor.
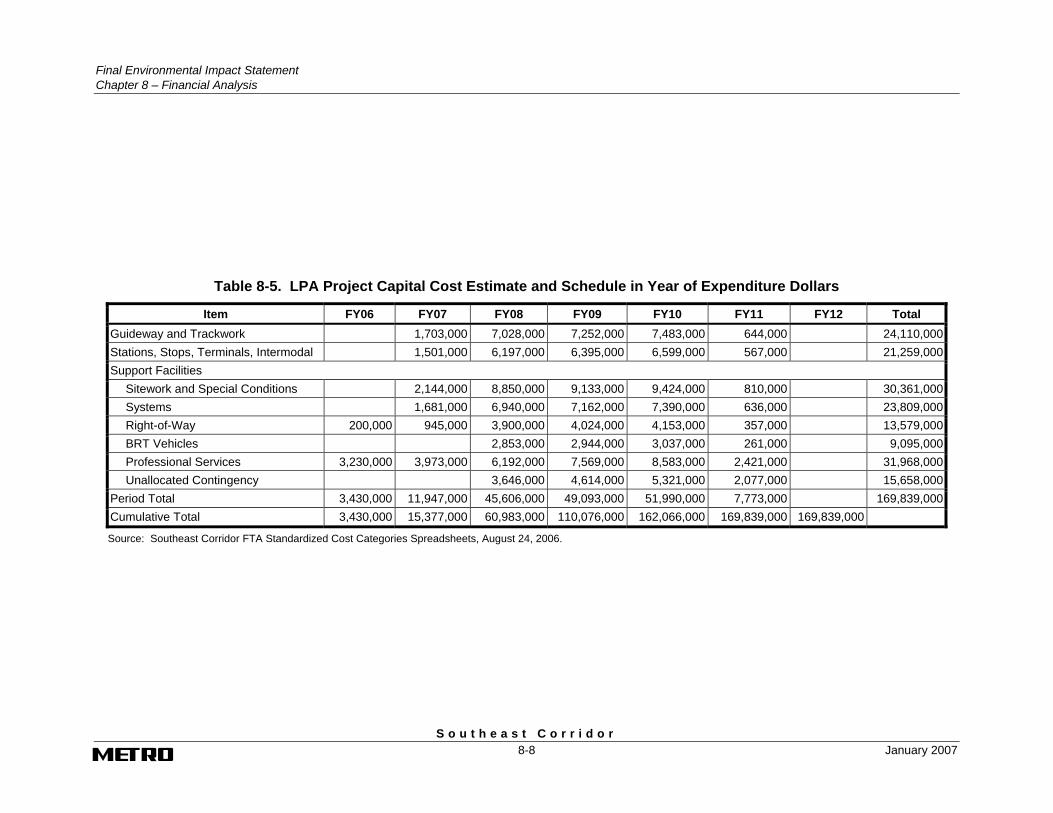
Table 8-3 through Table 8-5 summarize the capital cost estimate. Table 8-3 summarizes the project capital cost in constant 20056 Dollars. Table 8-4 summarizes the project estimated capital cost in Year of Expenditure Dollars. The annual cash flow of Project estimated capital costs in Year of Expenditure Dollars is presented in Table 8-5, based on the proposed project implementation schedule.
Table 8-3. LPA Project Cost Estimate in Constant 2006 Dollars
Item Quantity Unit Total Guideway and Trackwork 5.49 Miles 22,000,000 Stations, Stops, Terminals, Intermodal 8 Stations 19,400,000 Support Facilities Facility . Sitework and Special Conditions 5.49 Miles 27,705,000 Systems 5.49 Miles 21,726,000 Right-of-Way 5.49 Miles 12,408,000 BRT Vehicles 8 Vehicles 8,260,000 Professional Services 1 Lump Sum 29,423,000 Unallocated Contingency 1 10% 14,092,000 Total 155,014,000
Source: Southeast Corridor FTA Standardized Cost Categories Spreadsheets, August 24, 2006.
Table 8-4. LPA Project Cost Estimate in Year of Expenditure Dollars
Item Quantity Unit Total Guideway and Trackwork 5.49 Miles 24,110,000 Stations, Stops, Terminals, Intermodal 8 Stations 21,259,000 Support Facilities Facility Sitework and Special Conditions 5.49 Miles 30,361,000 Systems 5.49 Miles 23,809,000 Right-of-Way 5.49 Miles 13,579,000 BRT Vehicles 8 Vehicles 9,095,000 Professional Services 1 Lump Sum 31,968,000 Unallocated Contingency 1 10% 15,658,000 Total 169,839,000
Source: Southeast Corridor FTA Standardized Cost Categories Spreadsheets, August 24, 2006.
Final Environmental Impact Statement Chapter 8 – Financial Analysis
S o u t h e a s t C o r r i d o r 8-8 January 2007
Table 8-5. LPA Project Capital Cost Estimate and Schedule in Year of Expenditure Dollars
Item FY06 FY07 FY08 FY09 FY10 FY11 FY12 Total Guideway and Trackwork 1,703,000 7,028,000 7,252,000 7,483,000 644,000 24,110,000Stations, Stops, Terminals, Intermodal 1,501,000 6,197,000 6,395,000 6,599,000 567,000 21,259,000Support Facilities
Sitework and Special Conditions 2,144,000 8,850,000 9,133,000 9,424,000 810,000 30,361,000Systems 1,681,000 6,940,000 7,162,000 7,390,000 636,000 23,809,000Right-of-Way 200,000 945,000 3,900,000 4,024,000 4,153,000 357,000 13,579,000BRT Vehicles 2,853,000 2,944,000 3,037,000 261,000 9,095,000Professional Services 3,230,000 3,973,000 6,192,000 7,569,000 8,583,000 2,421,000 31,968,000Unallocated Contingency 3,646,000 4,614,000 5,321,000 2,077,000 15,658,000
Period Total 3,430,000 11,947,000 45,606,000 49,093,000 51,990,000 7,773,000 169,839,000Cumulative Total 3,430,000 15,377,000 60,983,000 110,076,000 162,066,000 169,839,000 169,839,000
Source: Southeast Corridor FTA Standardized Cost Categories Spreadsheets, August 24, 2006.

Final Environmental Impact Statement
Chapter 8 – Financial Analysis
S o u t h e a s t C o r r i d o r January 2007 8-9
8.4.2 LPA Funding Sources
Funding sources for implementation of LPA through 2012 include a mix of federal and local funds. METRO is asking FTA to participate as a partner in funding the -LPA as a 50.1 percent/49.9 percent shared capital expense.
This section of the project capital plan identifies the proposed sources of funds for constructing the LPA and details the non-federal share of funds for the project. Table 8-6 provides a summary of the federal and non-federal sources of funding proposed for design and construction of the LPA.
Table 8-6. LPA Sources of Capital Funding FY2006 – FY2030 In Year of Expenditure Dollars ($,000)
METRO % of Total BRT Capital Costs $169,839 100.00% BRT Capital Funding Federal Sources
Sec 5309 New Starts $84,750 49.90% Total Federal Sources $84,750 49.90%
Local Sources * Sales Tax $85,089 50.10% Total Local Sources $85,089 50.10%
Total, BRT Capital Funding 100.00%
Source: Southeast Corridor FTA Standardized Cost Categories Spreadsheets, August 24, 2006.
METRO’s capital reserve levels, projected future tax revenues, operating revenues, and FTA grants for purposes other than New Starts funding are projected to be sufficient to support existing transit services and non-transit programs, expansion of other transit services, and ongoing capital rehabilitation and replacement while maintaining a prudent level of working capital.
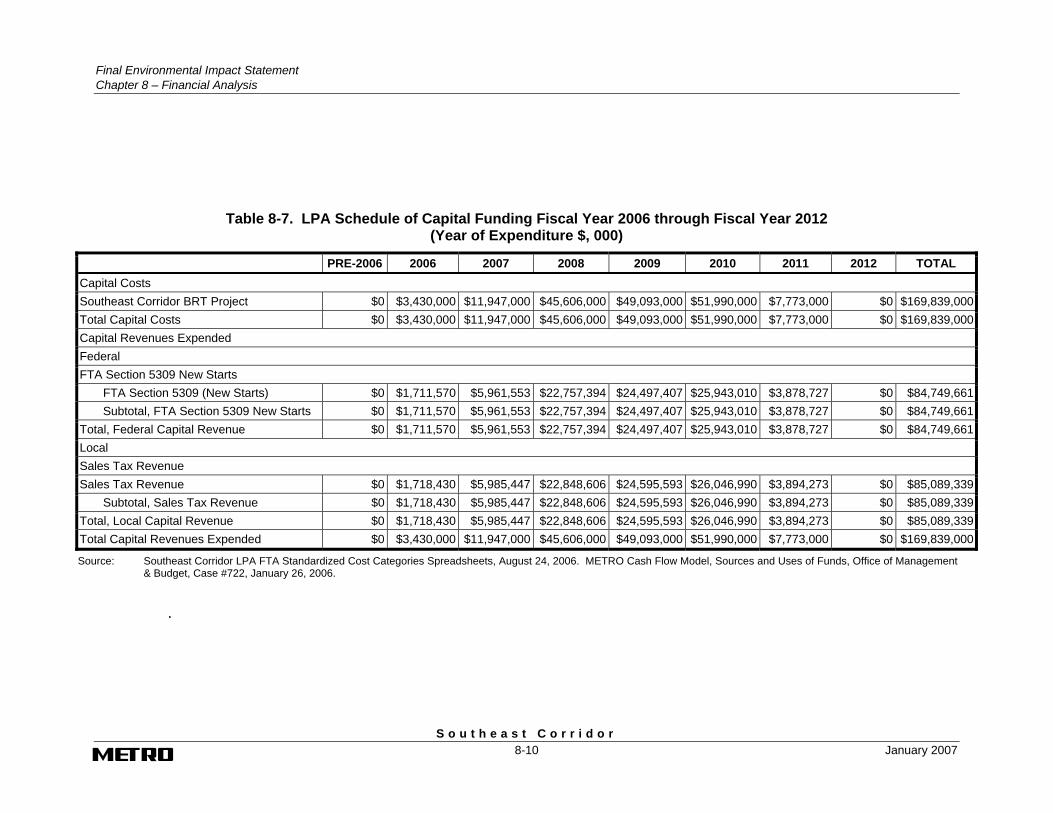
Table 8-7 summarizes the annual schedule of LPA capital funding to be provided over the FY 2006 to FY 2012 period in which the LPA is implemented and funded. The costs are provided in Year of Expenditure dollars.
8.4.2.1 FTA Section 5309 New Starts
FTA Section 5309 New Starts program is assumed to fund 49.9 percent of the preliminary and final engineering and construction cost of the LPA. New Starts funds totaling $84.8 million ($YOE) are assumed to be provided through a Full Funding Grant Agreement (FFGA). Analyzing the LPA alone, funds would be received at specified annual levels on Table 8-7 over the FY 2006 to FY 2012 period.
Final Environmental Impact Statement Chapter 8 – Financial Analysis
S o u t h e a s t C o r r i d o r 8-10 January 2007
Table 8-7. LPA Schedule of Capital Funding Fiscal Year 2006 through Fiscal Year 2012 (Year of Expenditure $, 000)
PRE-2006 2006 2007 2008 2009 2010 2011 2012 TOTAL Capital Costs Southeast Corridor BRT Project $0 $3,430,000 $11,947,000 $45,606,000 $49,093,000 $51,990,000 $7,773,000 $0 $169,839,000Total Capital Costs $0 $3,430,000 $11,947,000 $45,606,000 $49,093,000 $51,990,000 $7,773,000 $0 $169,839,000Capital Revenues Expended Federal FTA Section 5309 New Starts FTA Section 5309 (New Starts) $0 $1,711,570 $5,961,553 $22,757,394 $24,497,407 $25,943,010 $3,878,727 $0 $84,749,661 Subtotal, FTA Section 5309 New Starts $0 $1,711,570 $5,961,553 $22,757,394 $24,497,407 $25,943,010 $3,878,727 $0 $84,749,661Total, Federal Capital Revenue $0 $1,711,570 $5,961,553 $22,757,394 $24,497,407 $25,943,010 $3,878,727 $0 $84,749,661Local Sales Tax Revenue Sales Tax Revenue $0 $1,718,430 $5,985,447 $22,848,606 $24,595,593 $26,046,990 $3,894,273 $0 $85,089,339 Subtotal, Sales Tax Revenue $0 $1,718,430 $5,985,447 $22,848,606 $24,595,593 $26,046,990 $3,894,273 $0 $85,089,339Total, Local Capital Revenue $0 $1,718,430 $5,985,447 $22,848,606 $24,595,593 $26,046,990 $3,894,273 $0 $85,089,339Total Capital Revenues Expended $0 $3,430,000 $11,947,000 $45,606,000 $49,093,000 $51,990,000 $7,773,000 $0 $169,839,000
Source: Southeast Corridor LPA FTA Standardized Cost Categories Spreadsheets, August 24, 2006. METRO Cash Flow Model, Sources and Uses of Funds, Office of Management & Budget, Case #722, January 26, 2006.
.
Final Environmental Impact Statement
Chapter 8 – Financial Analysis
S o u t h e a s t C o r r i d o r January 2007 8-11
8.4.2.2 Local Sales Taxes
Dedicated transit sales tax will be a key source of local funding for the Southeast Corridor project and the rest of the METRO Solutions Phase 2. Tax revenues will provide annual capital and operating funding. To provide more detail regarding these sources
Sales tax revenues are assumed to grow approximately five percent annually. This growth is consistent with the prior 14 years. The projected sales tax growth is derived from the methodology used by Dr. Barton Smith (See METRO Forecasts of Economic Growth, Inflation, and Interest Rates: March June 15, 2005) who has consistently and reliably conducted sales tax forecasting for METRO for many years.
8.4.2.3 Bond Proceeds
The implementation of METRO Solutions Phase 2 plan through 2012 will require METRO to use bond financing. METRO has voter approval to issue up to $640 million in bonds. METRO will not require bond proceeds to help fund this individual project.
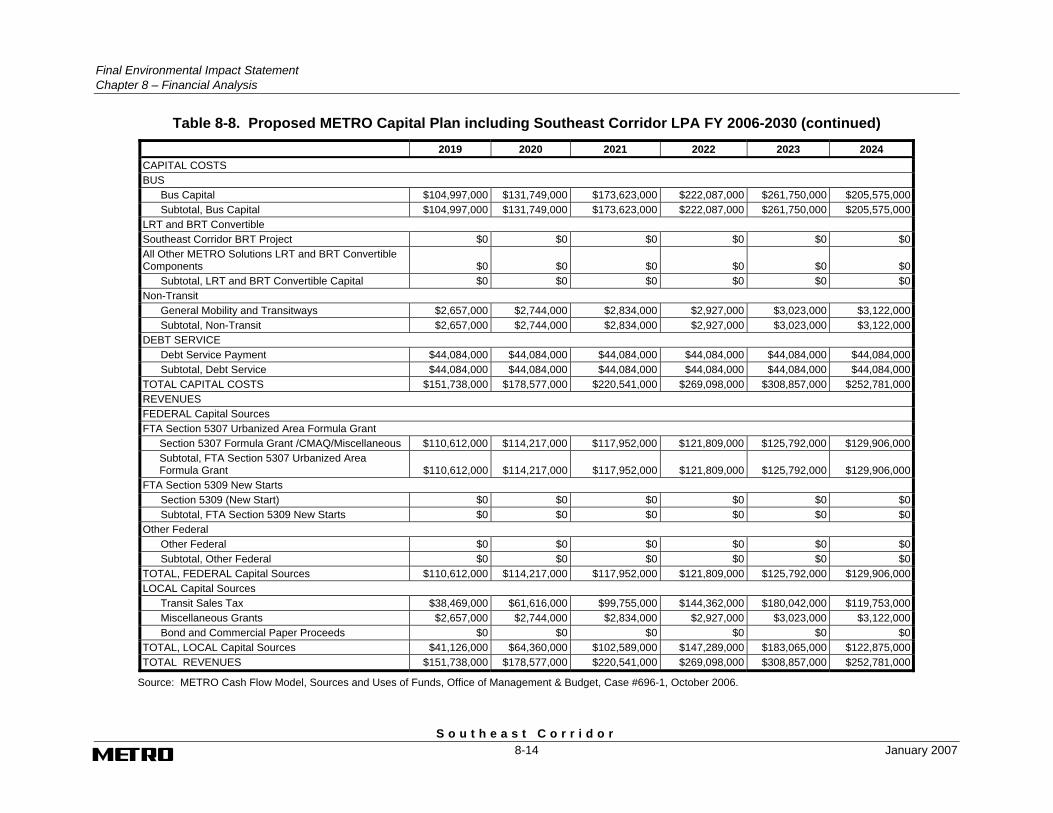
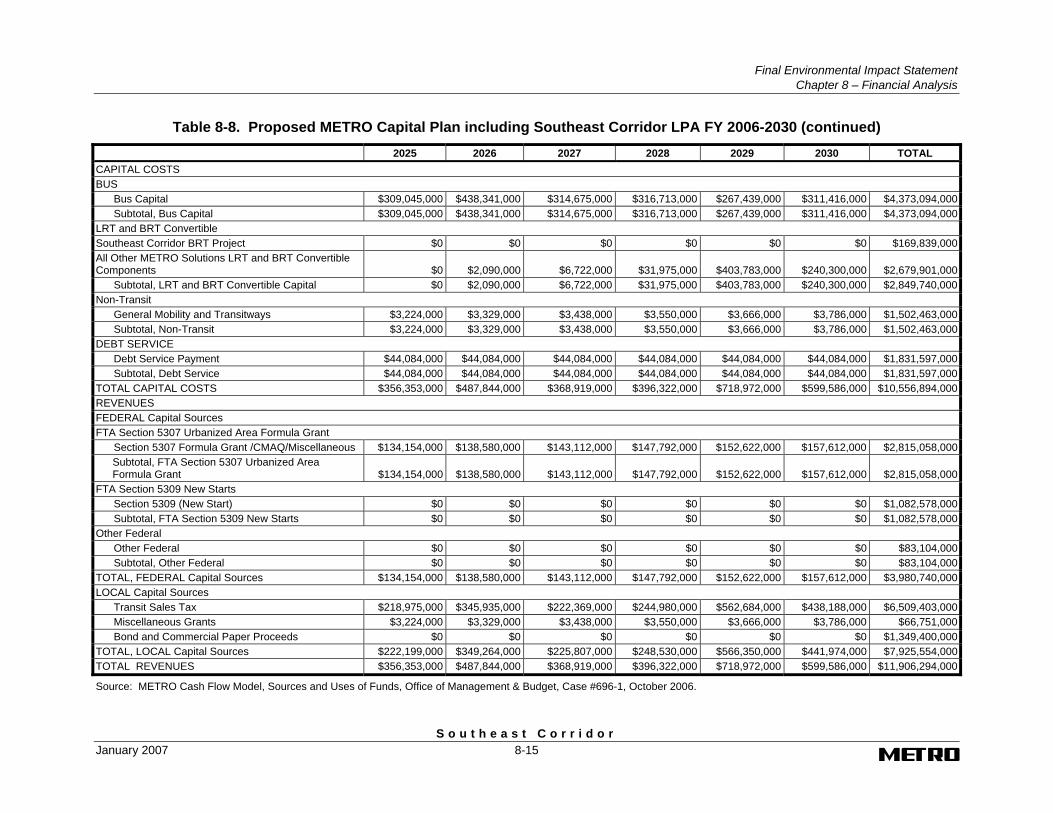
8.4.3 Twenty-Six Year Capital Plan
Table 8-8 summarizes the overall 24-year capital plan within which the LPA will be implemented. Bus capital and operating assumptions and costs used in this analysis are derived from short and long range plans. Estimated capital costs are reported in Year of Expenditure dollars, with both real growth and a base rate of inflation included.
8.4.4 Other Capital Costs
For the purpose of this analysis for FTA, capital costs included in the transit capital plan other than LPA costs include bus capital, transitway (HOV), and General Mobility project costs. Over the FY 2006 – FY 2030 period, bus capital costs are $4.373 billion (YOE $), transitway and General Mobility costs are $1.502 billion (YOE $). These costs include existing and proposed services by METRO.
8.4.5 Agency-Wide Funding Sources
No new revenue sources have been assumed in the financial plan nor are they required. The capital plan includes all existing local and federal sources of revenue. Principal sources include a dedicated local sales tax, federal formula and discretionary grants, and other miscellaneous income. Unlike costs, all of which increase with inflation, the only local revenue source assumed to increase with inflation is the local sales tax collected in the METRO service area. (Federal funds are assumed to increase as approved in the SAFETEA-LU authorization period).
8.4.5.1 Federal Funds
The construction of the LPA will not include debt financing. However, debt financing will be used in the overall financial program for the agency. With the voter approval

Final Environmental Impact Statement Chapter 8 – Financial Analysis
S o u t h e a s t C o r r i d o r 8-12 January 2007
Table 8-8. Proposed METRO Capital Plan including Southeast Corridor LPA FY 2006-2030 2006 2007 2008 2009 2010 2011
CAPITAL COSTS BUS Bus Capital $108,414,000 $111,044,000 $83,083,000 $107,769,000 $144,390,000 $149,852,000 Subtotal, Bus Capital $108,414,000 $111,044,000 $83,083,000 $107,769,000 $144,390,000 $149,852,000LRT and BRT Convertible Southeast Corridor BRT Project $3,430,000 $11,947,000 $45,606,000 $49,093,000 $51,990,000 $7,773,000All Other METRO Solutions LRT and BRT Convertible Components $90,730,000 $288,036,000 $531,504,000 $466,882,000 $363,605,000 $167,981,000 Subtotal, LRT and BRT Convertible Capital $94,160,000 $299,983,000 $577,110,000 $515,975,000 $415,595,000 $175,754,000Non-Transit General Mobility and Transitways $238,418,000 $127,443,000 $126,680,000 $135,174,000 $144,577,000 $154,774,000 Subtotal, Non-Transit $238,418,000 $127,443,000 $126,680,000 $135,174,000 $144,577,000 $154,774,000DEBT SERVICE Debt Service Payment $244,000 $4,375,000 $20,843,000 $47,981,000 $66,485,000 $72,265,000 Subtotal, Debt Service $244,000 $4,375,000 $20,843,000 $47,981,000 $66,485,000 $72,265,000TOTAL CAPITAL COSTS $441,236,000 $542,845,000 $807,716,000 $806,899,000 $771,047,000 $552,645,000REVENUES FEDERAL Capital Sources FTA Section 5307 Urbanized Area Formula Grant Section 5307 Formula Grant /CMAQ/Miscellaneous $126,095,000 $95,880,000 $72,087,000 $61,563,000 $97,066,000 $85,505,000 Subtotal, FTA Section 5307 Urbanized Area
Formula Grant $126,095,000 $95,880,000 $72,087,000 $61,563,000 $97,066,000 $85,505,000FTA Section 5309 New Starts Section 5309 (New Start) $57,686,000 $37,384,000 $90,031,000 $72,508,000 $164,967,000 $136,628,000 Subtotal, FTA Section 5309 New Starts $57,686,000 $37,384,000 $90,031,000 $72,508,000 $164,967,000 $136,628,000Other Federal Other Federal $40,414,000 $30,298,000 $6,768,000 $3,124,000 $2,500,000 $0 Subtotal, Other Federal $40,414,000 $30,298,000 $6,768,000 $3,124,000 $2,500,000 $0TOTAL, FEDERAL Capital Sources $224,195,000 $163,562,000 $168,886,000 $137,195,000 $264,533,000 $222,133,000LOCAL Capital Sources Transit Sales Tax $215,041,000 $377,283,000 $636,830,000 $667,704,000 $504,514,000 $328,454,000 Miscellaneous Grants $2,000,000 $2,000,000 $2,000,000 $2,000,000 $2,000,000 $2,058,000 Bond and Commercial Paper Proceeds $12,000,000 $191,000,000 $425,283,000 $437,117,000 $250,000,000 $34,000,000TOTAL, LOCAL Capital Sources $229,041,000 $570,283,000 $1,064,113,000 $1,106,821,000 $756,514,000 $364,512,000TOTAL REVENUES $453,236,000 $733,845,000 $1,232,999,000 $1,244,016,000 $1,021,047,000 $586,645,000
Source: METRO Cash Flow Model, Sources and Uses of Funds, Office of Management & Budget, Case #696-1, October 2006.

Final Environmental Impact Statement
Chapter 8 – Financial Analysis
S o u t h e a s t C o r r i d o r January 2007 8-13
Table 8-8. Proposed METRO Capital Plan including Southeast Corridor LPA FY 2006-2030 (continued) 2012 2013 2014 2015 2016 2017 2018
CAPITAL COSTS BUS Bus Capital $122,574,000 $126,830,000 $142,089,000 $77,396,000 $38,082,000 $58,176,000 $45,985,000 Subtotal, Bus Capital $122,574,000 $126,830,000 $142,089,000 $77,396,000 $38,082,000 $58,176,000 $45,985,000LRT and BRT Convertible Southeast Corridor BRT Project $0 $0 $0 $0 $0 $0 $0All Other METRO Solutions LRT and BRT Convertible Components $86,293,000 $0 $0 $0 $0 $0 $0 Subtotal, LRT and BRT Convertible Capital $86,293,000 $0 $0 $0 $0 $0 $0Non-Transit General Mobility and Transitways $165,306,000 $175,768,000 $186,208,000 $2,337,000 $2,413,000 $2,492,000 $2,573,000 Subtotal, Non-Transit $165,306,000 $175,768,000 $186,208,000 $2,337,000 $2,413,000 $2,492,000 $2,573,000DEBT SERVICE Debt Service Payment $138,967,000 $231,861,000 $231,661,000 $355,655,000 $44,084,000 $44,084,000 $44,084,000 Subtotal, Debt Service $138,967,000 $231,861,000 $231,661,000 $355,655,000 $44,084,000 $44,084,000 $44,084,000TOTAL CAPITAL COSTS $513,140,000 $534,459,000 $559,958,000 $435,388,000 $84,579,000 $104,752,000 $92,642,000REVENUES FEDERAL Capital Sources FTA Section 5307 Urbanized Area Formula Grant Section 5307 Formula Grant /CMAQ/Miscellaneous $88,389,000 $91,254,000 $94,220,000 $97,340,000 $100,462,000 $103,917,000 $107,120,000 Subtotal, FTA Section 5307 Urbanized Area
Formula Grant $88,389,000 $91,254,000 $94,220,000 $97,340,000 $100,462,000 $103,917,000 $107,120,000FTA Section 5309 New Starts Section 5309 (New Start) $124,569,000 $124,569,000 $124,569,000 $149,667,000 $0 $0 $0 Subtotal, FTA Section 5309 New Starts $124,569,000 $124,569,000 $124,569,000 $149,667,000 $0 $0 $0Other Federal Other Federal $0 $0 $0 $0 $0 $0 $0 Subtotal, Other Federal $0 $0 $0 $0 $0 $0 $0TOTAL, FEDERAL Capital Sources $212,958,000 $215,823,000 $218,789,000 $247,007,000 $100,462,000 $103,917,000 $107,120,000LOCAL Capital Sources Transit Sales Tax $298,059,000 $316,444,000 $338,906,000 $186,044,000 -$18,296,000 -$1,657,000 -$17,051,000 Miscellaneous Grants $2,123,000 $2,192,000 $2,263,000 $2,337,000 $2,413,000 $2,492,000 $2,573,000 Bond and Commercial Paper Proceeds $0 $0 $0 $0 $0 $0 $0TOTAL, LOCAL Capital Sources $300,182,000 $318,636,000 $341,169,000 $188,381,000 -$15,883,000 $835,000 -$14,478,000TOTAL REVENUES $513,140,000 $534,459,000 $559,958,000 $435,388,000 $84,579,000 $104,752,000 $92,642,000
Source: METRO Cash Flow Model, Sources and Uses of Funds, Office of Management & Budget, Case #696-1, October 2006.
Final Environmental Impact Statement Chapter 8 – Financial Analysis
S o u t h e a s t C o r r i d o r 8-14 January 2007
Table 8-8. Proposed METRO Capital Plan including Southeast Corridor LPA FY 2006-2030 (continued) 2019 2020 2021 2022 2023 2024 CAPITAL COSTS BUS Bus Capital $104,997,000 $131,749,000 $173,623,000 $222,087,000 $261,750,000 $205,575,000 Subtotal, Bus Capital $104,997,000 $131,749,000 $173,623,000 $222,087,000 $261,750,000 $205,575,000LRT and BRT Convertible Southeast Corridor BRT Project $0 $0 $0 $0 $0 $0All Other METRO Solutions LRT and BRT Convertible Components $0 $0 $0 $0 $0 $0 Subtotal, LRT and BRT Convertible Capital $0 $0 $0 $0 $0 $0Non-Transit General Mobility and Transitways $2,657,000 $2,744,000 $2,834,000 $2,927,000 $3,023,000 $3,122,000 Subtotal, Non-Transit $2,657,000 $2,744,000 $2,834,000 $2,927,000 $3,023,000 $3,122,000DEBT SERVICE Debt Service Payment $44,084,000 $44,084,000 $44,084,000 $44,084,000 $44,084,000 $44,084,000 Subtotal, Debt Service $44,084,000 $44,084,000 $44,084,000 $44,084,000 $44,084,000 $44,084,000TOTAL CAPITAL COSTS $151,738,000 $178,577,000 $220,541,000 $269,098,000 $308,857,000 $252,781,000REVENUES FEDERAL Capital Sources FTA Section 5307 Urbanized Area Formula Grant Section 5307 Formula Grant /CMAQ/Miscellaneous $110,612,000 $114,217,000 $117,952,000 $121,809,000 $125,792,000 $129,906,000 Subtotal, FTA Section 5307 Urbanized Area
Formula Grant $110,612,000 $114,217,000 $117,952,000 $121,809,000 $125,792,000 $129,906,000FTA Section 5309 New Starts Section 5309 (New Start) $0 $0 $0 $0 $0 $0 Subtotal, FTA Section 5309 New Starts $0 $0 $0 $0 $0 $0Other Federal Other Federal $0 $0 $0 $0 $0 $0 Subtotal, Other Federal $0 $0 $0 $0 $0 $0TOTAL, FEDERAL Capital Sources $110,612,000 $114,217,000 $117,952,000 $121,809,000 $125,792,000 $129,906,000LOCAL Capital Sources Transit Sales Tax $38,469,000 $61,616,000 $99,755,000 $144,362,000 $180,042,000 $119,753,000 Miscellaneous Grants $2,657,000 $2,744,000 $2,834,000 $2,927,000 $3,023,000 $3,122,000 Bond and Commercial Paper Proceeds $0 $0 $0 $0 $0 $0TOTAL, LOCAL Capital Sources $41,126,000 $64,360,000 $102,589,000 $147,289,000 $183,065,000 $122,875,000TOTAL REVENUES $151,738,000 $178,577,000 $220,541,000 $269,098,000 $308,857,000 $252,781,000
Source: METRO Cash Flow Model, Sources and Uses of Funds, Office of Management & Budget, Case #696-1, October 2006.
Final Environmental Impact Statement
Chapter 8 – Financial Analysis
S o u t h e a s t C o r r i d o r January 2007 8-15
Table 8-8. Proposed METRO Capital Plan including Southeast Corridor LPA FY 2006-2030 (continued) 2025 2026 2027 2028 2029 2030 TOTAL CAPITAL COSTS BUS Bus Capital $309,045,000 $438,341,000 $314,675,000 $316,713,000 $267,439,000 $311,416,000 $4,373,094,000 Subtotal, Bus Capital $309,045,000 $438,341,000 $314,675,000 $316,713,000 $267,439,000 $311,416,000 $4,373,094,000LRT and BRT Convertible Southeast Corridor BRT Project $0 $0 $0 $0 $0 $0 $169,839,000All Other METRO Solutions LRT and BRT Convertible Components $0 $2,090,000 $6,722,000 $31,975,000 $403,783,000 $240,300,000 $2,679,901,000 Subtotal, LRT and BRT Convertible Capital $0 $2,090,000 $6,722,000 $31,975,000 $403,783,000 $240,300,000 $2,849,740,000Non-Transit General Mobility and Transitways $3,224,000 $3,329,000 $3,438,000 $3,550,000 $3,666,000 $3,786,000 $1,502,463,000 Subtotal, Non-Transit $3,224,000 $3,329,000 $3,438,000 $3,550,000 $3,666,000 $3,786,000 $1,502,463,000DEBT SERVICE Debt Service Payment $44,084,000 $44,084,000 $44,084,000 $44,084,000 $44,084,000 $44,084,000 $1,831,597,000 Subtotal, Debt Service $44,084,000 $44,084,000 $44,084,000 $44,084,000 $44,084,000 $44,084,000 $1,831,597,000TOTAL CAPITAL COSTS $356,353,000 $487,844,000 $368,919,000 $396,322,000 $718,972,000 $599,586,000 $10,556,894,000REVENUES FEDERAL Capital Sources FTA Section 5307 Urbanized Area Formula Grant Section 5307 Formula Grant /CMAQ/Miscellaneous $134,154,000 $138,580,000 $143,112,000 $147,792,000 $152,622,000 $157,612,000 $2,815,058,000 Subtotal, FTA Section 5307 Urbanized Area
Formula Grant $134,154,000 $138,580,000 $143,112,000 $147,792,000 $152,622,000 $157,612,000 $2,815,058,000FTA Section 5309 New Starts Section 5309 (New Start) $0 $0 $0 $0 $0 $0 $1,082,578,000 Subtotal, FTA Section 5309 New Starts $0 $0 $0 $0 $0 $0 $1,082,578,000Other Federal Other Federal $0 $0 $0 $0 $0 $0 $83,104,000 Subtotal, Other Federal $0 $0 $0 $0 $0 $0 $83,104,000TOTAL, FEDERAL Capital Sources $134,154,000 $138,580,000 $143,112,000 $147,792,000 $152,622,000 $157,612,000 $3,980,740,000LOCAL Capital Sources Transit Sales Tax $218,975,000 $345,935,000 $222,369,000 $244,980,000 $562,684,000 $438,188,000 $6,509,403,000 Miscellaneous Grants $3,224,000 $3,329,000 $3,438,000 $3,550,000 $3,666,000 $3,786,000 $66,751,000 Bond and Commercial Paper Proceeds $0 $0 $0 $0 $0 $0 $1,349,400,000TOTAL, LOCAL Capital Sources $222,199,000 $349,264,000 $225,807,000 $248,530,000 $566,350,000 $441,974,000 $7,925,554,000TOTAL REVENUES $356,353,000 $487,844,000 $368,919,000 $396,322,000 $718,972,000 $599,586,000 $11,906,294,000
Source: METRO Cash Flow Model, Sources and Uses of Funds, Office of Management & Budget, Case #696-1, October 2006.
Final Environmental Impact Statement Chapter 8 – Financial Analysis
S o u t h e a s t C o r r i d o r 8-16 January 2007
of the METRO Solutions plan, authorization was provided for issuance of long-term debt. With the approval and adoption of a long-range plan that includes debt financing, the financial evaluation also addresses debt service coverage. This coverage ratio is the most common test of financial feasibility applied in debt financing. Simply stated, it is the minimum value in each year across the 30-year analysis period of the ratio of projected tax revenue divided by projected debt service.
8.5 Operations and Maintenance Plan
For the purpose of FTA evaluation, this section describes the operating plan for the LPA and METRO Solutions Phase 2. The operating plan documents five years of historic data (where available) and presents 24-year forecasts to demonstrate the capability of the agency to operate and maintain the system while continuing to provide and enhance existing transit service.
8.5.1 Operating Revenues
Operating revenues are presented in METRO’s Cash Flow Model in four line items: sales tax receipts, farebox revenue, miscellaneous income and operating grants, and external interest income.
METRO’s primary source of operating revenue is a dedicated one percent tax on all sales in the METRO service area. When METRO was created, service area voters approved the tax via referendum. METRO has collected the tax since 1979 and will continue to do so. This tax currently provides METRO around $394 million per year, and over the period from 1989 to 2005, sales tax revenues increased 4.93 percent (annual compounded rate). The growth rate of the sales tax receipts to METRO is forecasted by Dr, Barton A. Smith in METRO Forecasts of Economic Growth, Inflation, and Interest Rates: June 15, 2005. The annual forecast of sales tax receipts in Year of Expenditure dollars, is provided in the Cash Flow Model (refer to Table 8-15 in Section 8.4).
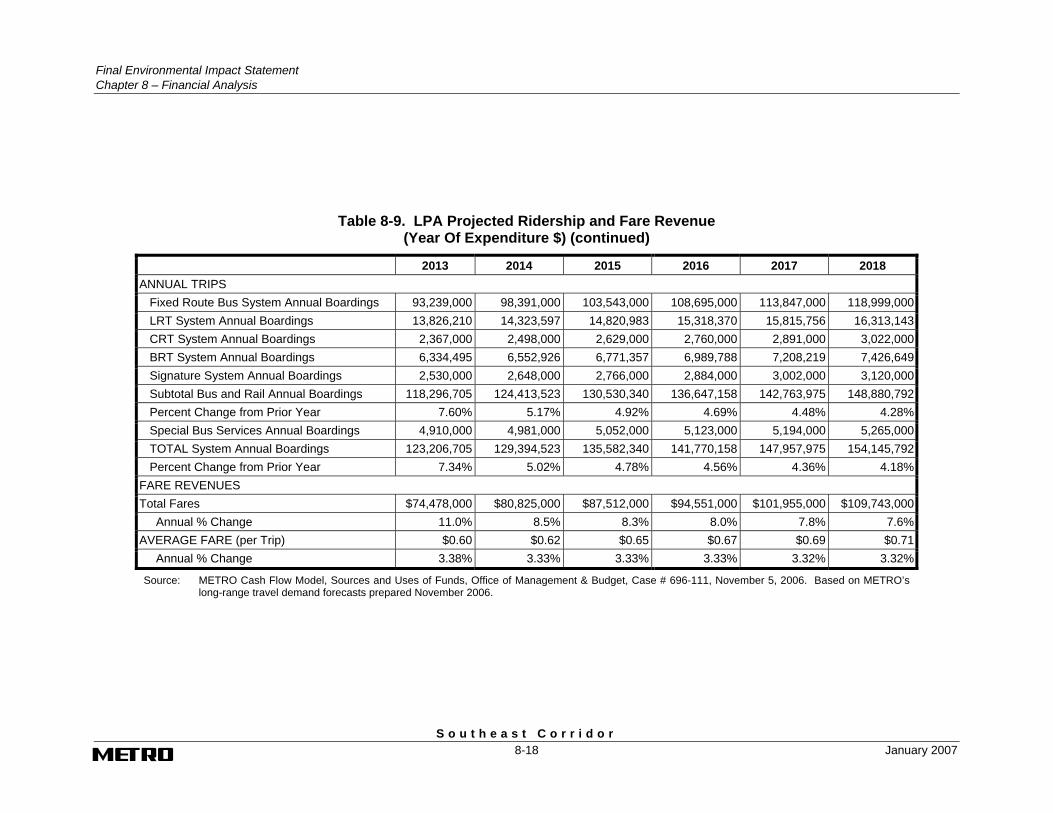
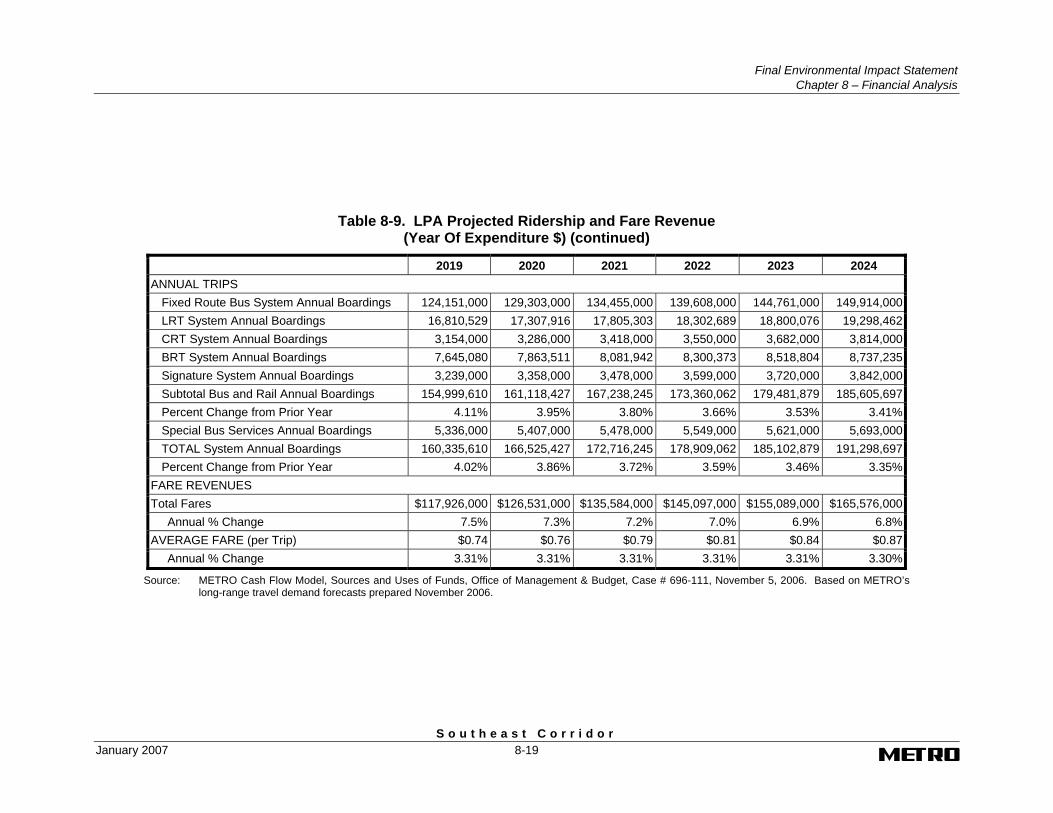
The second source of operating revenues is farebox revenues. In 1985, METRO’s fare was $0.55 cents. Over the years the fare has been increased by $0.10, $0.20, and with the last in 1994 by $0.15, which resulted in the current fare of $1.00. There have been no fare increases since 1994. METRO has hired an outside consultant to review its fare policy, structure, and levels. In conjunction with the implementation of new fare collection technology in 2006, METRO plans to make changes to its fare structure and levels to begin regular improvement of its fare recovery ratio. Passengers on the LPA will pay the local fare. Table 8-9 presents ridership, average fare, and fare revenue projections over the planning horizon, for existing and proposed transit services.
Over the 24-year period ridership is projected to increase by over 205 percent, the average systemwide fare would increase by the rate of inflation, ranging from 2.3 to 3.2 percent, and the fare revenue (in year of expenditure dollars) would increase by over 435 percent. The LPA will be implemented as BRT Convertible and begin

Final Environmental Impact Statement
Chapter 8 – Financial Analysis
S o u t h e a s t C o r r i d o r January 2007 8-17
Table 8-9. LPA Projected Ridership and Fare Revenue (Year Of Expenditure $)
2006 2007 2008 2009 2010 2011 2012 ANNUAL TRIPS
Fixed Route Bus System Annual Boardings 80,800,000 81,608,000 82,506,000 83,579,000 84,833,000 86,360,000 88,087,000LRT System Annual Boardings 10,161,000 10,263,000 10,376,000 10,511,000 10,669,000 13,031,437 13,328,824CRT System Annual Boardings 0 0 0 0 0 0 0BRT System Annual Boardings 0 0 0 0 0 5,897,633 6,116,064Signature System Annual Boardings 0 0 0 0 414,000 432,000 2,412,000Subtotal Bus and Rail Annual Boardings 90,961,000 91,871,000 92,882,000 94,090,000 95,916,000 105,721,070 109,943,888Percent Change from Prior Year 1.00% 1.00% 1.10% 1.30% 1.94% 10.22% 3.99%Special Bus Services Annual Boardings 4,443,000 4,487,000 4,532,000 4,591,000 4,660,000 4,744,000 4,839,000TOTAL System Annual Boardings 95,404,000 96,358,000 97,414,000 98,681,000 100,576,000 110,465,070 114,782,888Percent Change from Prior Year 1.00% 1.00% 1.10% 1.30% 1.92% 9.83% 3.91%
FARE REVENUES Total Fares $47,645,000 $49,316,000 $50,909,000 $52,804,000 $55,261,000 $62,578,000 $67,120,000 Annual % Change 3.5% 3.2% 3.7% 4.7% 13.2% 7.3%AVERAGE FARE (per Trip) $0.50 $0.51 $0.52 $0.54 $0.55 $0.57 $0.58 Annual % Change 2.48% 2.11% 2.39% 2.68% 3.10% 3.22%
Source: METRO Cash Flow Model, Sources and Uses of Funds, Office of Management & Budget, Case # 696-111, November 5, 2006. Based on METRO’s long-range travel demand forecasts prepared November 2006.
Final Environmental Impact Statement Chapter 8 – Financial Analysis
S o u t h e a s t C o r r i d o r 8-18 January 2007
Table 8-9. LPA Projected Ridership and Fare Revenue (Year Of Expenditure $) (continued)
2013 2014 2015 2016 2017 2018 ANNUAL TRIPS
Fixed Route Bus System Annual Boardings 93,239,000 98,391,000 103,543,000 108,695,000 113,847,000 118,999,000LRT System Annual Boardings 13,826,210 14,323,597 14,820,983 15,318,370 15,815,756 16,313,143CRT System Annual Boardings 2,367,000 2,498,000 2,629,000 2,760,000 2,891,000 3,022,000BRT System Annual Boardings 6,334,495 6,552,926 6,771,357 6,989,788 7,208,219 7,426,649Signature System Annual Boardings 2,530,000 2,648,000 2,766,000 2,884,000 3,002,000 3,120,000Subtotal Bus and Rail Annual Boardings 118,296,705 124,413,523 130,530,340 136,647,158 142,763,975 148,880,792Percent Change from Prior Year 7.60% 5.17% 4.92% 4.69% 4.48% 4.28%Special Bus Services Annual Boardings 4,910,000 4,981,000 5,052,000 5,123,000 5,194,000 5,265,000TOTAL System Annual Boardings 123,206,705 129,394,523 135,582,340 141,770,158 147,957,975 154,145,792Percent Change from Prior Year 7.34% 5.02% 4.78% 4.56% 4.36% 4.18%
FARE REVENUES Total Fares $74,478,000 $80,825,000 $87,512,000 $94,551,000 $101,955,000 $109,743,000 Annual % Change 11.0% 8.5% 8.3% 8.0% 7.8% 7.6%AVERAGE FARE (per Trip) $0.60 $0.62 $0.65 $0.67 $0.69 $0.71 Annual % Change 3.38% 3.33% 3.33% 3.33% 3.32% 3.32%
Source: METRO Cash Flow Model, Sources and Uses of Funds, Office of Management & Budget, Case # 696-111, November 5, 2006. Based on METRO’s long-range travel demand forecasts prepared November 2006.
Final Environmental Impact Statement
Chapter 8 – Financial Analysis
S o u t h e a s t C o r r i d o r January 2007 8-19
Table 8-9. LPA Projected Ridership and Fare Revenue (Year Of Expenditure $) (continued)
2019 2020 2021 2022 2023 2024 ANNUAL TRIPS
Fixed Route Bus System Annual Boardings 124,151,000 129,303,000 134,455,000 139,608,000 144,761,000 149,914,000LRT System Annual Boardings 16,810,529 17,307,916 17,805,303 18,302,689 18,800,076 19,298,462CRT System Annual Boardings 3,154,000 3,286,000 3,418,000 3,550,000 3,682,000 3,814,000BRT System Annual Boardings 7,645,080 7,863,511 8,081,942 8,300,373 8,518,804 8,737,235Signature System Annual Boardings 3,239,000 3,358,000 3,478,000 3,599,000 3,720,000 3,842,000Subtotal Bus and Rail Annual Boardings 154,999,610 161,118,427 167,238,245 173,360,062 179,481,879 185,605,697Percent Change from Prior Year 4.11% 3.95% 3.80% 3.66% 3.53% 3.41%Special Bus Services Annual Boardings 5,336,000 5,407,000 5,478,000 5,549,000 5,621,000 5,693,000TOTAL System Annual Boardings 160,335,610 166,525,427 172,716,245 178,909,062 185,102,879 191,298,697Percent Change from Prior Year 4.02% 3.86% 3.72% 3.59% 3.46% 3.35%
FARE REVENUES Total Fares $117,926,000 $126,531,000 $135,584,000 $145,097,000 $155,089,000 $165,576,000 Annual % Change 7.5% 7.3% 7.2% 7.0% 6.9% 6.8%AVERAGE FARE (per Trip) $0.74 $0.76 $0.79 $0.81 $0.84 $0.87 Annual % Change 3.31% 3.31% 3.31% 3.31% 3.31% 3.30%
Source: METRO Cash Flow Model, Sources and Uses of Funds, Office of Management & Budget, Case # 696-111, November 5, 2006. Based on METRO’s long-range travel demand forecasts prepared November 2006.

Final Environmental Impact Statement Chapter 8 – Financial Analysis
S o u t h e a s t C o r r i d o r 8-20 January 2007
Table 8-9. LPA Projected Ridership and Fare Revenue (Year Of Expenditure $) (continued)
2025 2026 2027 2028 2029 2030 ANNUAL TRIPS
Fixed Route Bus System Annual Boardings 155,066,000 155,066,000 155,066,000 155,066,000 155,066,000 155,066,000LRT System Annual Boardings 19,795,849 19,795,849 19,795,849 19,795,849 19,795,849 19,795,849CRT System Annual Boardings 3,945,000 3,945,000 3,945,000 3,945,000 3,945,000 3,945,000BRT System Annual Boardings 8,955,666 8,955,666 8,955,666 8,955,666 8,955,666 8,955,666Signature System Annual Boardings 3,960,000 3,960,000 3,960,000 3,960,000 3,960,000 3,960,000Subtotal Bus and Rail Annual Boardings 191,722,514 191,722,514 191,722,514 191,722,514 191,722,514 191,722,514Percent Change from Prior Year 3.30% 0.00% 0.00% 0.00% 0.00% 0.00%Special Bus Services Annual Boardings 5,765,000 5,765,000 5,765,000 5,765,000 5,765,000 5,765,000TOTAL System Annual Boardings 197,487,514 197,487,514 197,487,514 197,487,514 197,487,514 197,487,514Percent Change from Prior Year 3.24% 0.00% 0.00% 0.00% 0.00% 0.00%
FARE REVENUES Total Fares $176,578,000 $182,351,000 $188,313,000 $194,471,000 $200,830,000 $207,396,000 Annual % Change 6.6% 3.3% 3.3% 3.3% 3.3% 3.3%AVERAGE FARE (per Trip) $0.89 $0.92 $0.95 $0.98 $1.02 $1.05 Annual % Change 3.30% 3.27% 3.27% 3.27% 3.27% 3.27%
Source: METRO Cash Flow Model, Sources and Uses of Funds, Office of Management & Budget, Case # 696-111, November 5, 2006. Based on METRO’s long-range travel demand forecasts prepared November 2006.
Final Environmental Impact Statement
Chapter 8 – Financial Analysis
S o u t h e a s t C o r r i d o r January 2007 8-21
operations in FY 2011. The project is assumed to convert to LRT operations in FY 2030. Forecast 2030 total systemwide ridership of 197.5 million annual boardings is comprised of fixed-route bus ridership forecast of about 155.1 million annual boardings, 21.2 million annual light rail boardings and about 4.2 million annual boardings for other METRO services such as METROLift, charters, and special events. In all years prior to 2030, ridership for the LPA are shown as boardings. The pattern of ridership growth in the first five years is driven by planned service improvements, while the pattern in the later years is driven by expected population growth. As a comparison, population growth in the region is forecasted to grow over the same 24-year period by 64 percent.3
The growth in the forecasted systemwide average fare is driven by two factors. First, METRO plans to raise fares to keep pace with inflation, as indicated above. For this financial plan, fare increases are scheduled every two years. Second, METRO’s fare structure includes a base local fare, a slightly higher base fare for express service, and significantly higher fares for its park-and-ride services. METRO’s Park-and-Ride fares are distance-based fares for four geographic zones. METRO expects the service mix to change over the 24-year period. Even absent fare increases, this changing service mix will significantly increase the average systemwide fare.
The third source of operating revenue, miscellaneous income and operating grant, is usually very small. This line item averages $2.8 million per year and includes miscellaneous items such as billboard rental income on METRO-owned rail right-of-way and identification card fee.
The fourth source of operating revenues for METRO is external interest income. In the past, METRO developed a significant cash reserve as its operating revenues exceeded the needs of both the operating and capital budgets. METRO invests this reserve in interest-bearing accounts and other conservative, statute-allowed investments, generating the interest income line item. Interest income approached $60 million a year in the early 1990s when METRO’s reserve was very large. With the Regional Bus Program (RBP) close to completion this reserve has been significantly reduced. In FY 2005, interest income is forecasted at about $3.5 million consisting only interest on its working capital. As much of the current capital program nears completion, interest income will again begin to grow. By FY 2030, this revenue source will grow to $311.6 million in Year of Expenditure dollars (refer to Table 8-15).
While METRO funds its operations and maintenance programs from its operating revenues, these operating revenues far exceed the annual cost of operations and maintenance. The remainder of the operating revenues is then available to fund a portion of the capital program. METRO is not subject to any rules or limitations on how it may divide the use of its operating revenues between its operating and capital budgets.
3 Population and employment forecasts provided by H-GAC are included in Appendix A of the
Making The Case report of the Southeast Corridor New Starts Report, August 2005.

Final Environmental Impact Statement Chapter 8 – Financial Analysis
S o u t h e a s t C o r r i d o r 8-22 January 2007
8.5.2 Operating and Maintenance Costs
METRO uses a cost allocation methodology—rather than a cost build-up methodology-- for estimating its systemwide operations and maintenance costs that are used as inputs to the cost-effectiveness and operating efficiencies criteria. This methodology uses actual METRO operating experience as the foundation for the estimates. The methodology is described in more detail below. The O&M costs for bus, LRT, and BRT Convertible are summarized for 2006-2030 in Table 8-1.
8.5.2.1 Bus O&M Costs
METRO has an extensive and expanding bus and paratransit service that has remained the backbone of the METRO’s program even as light rail has been implemented on the METRORail Red Line. Within any new fixed guideway corridors, the bus, LRT, and BRT Convertible will be integrated to improve operating efficiencies. Therefore, selected bus routes will be restructured to eliminate segments that duplicate new fixed guideway service. Recognizing that bus rapid transit-convertible provides limited-stop, frequent service to stations, other adjacent or parallel bus routes will be restructured to provide local frequent service between Southeast Corridor BRT Convertible stations. With the addition of more light rail, and bus rapid transit-convertible, METRO’s service mix among its various types of bus service and LRT service will change, but the operating characteristics of each service type, and hence its unit, O&M costs - should remain similar to today’s services and service assumptions.
METRO has several systems that collect financial data and operating statistics. The agency uses the information to measure operating performance each month, to prepare the annual operating budget, and to support short and long range planning activities. METRO categorizes operating costs as either Transit or Traffic Management. METRO’s Transit O&M costs include the costs to operate its fixed-route bus service, its specialized services such as METROLift and METROVan, and light rail service. Traffic Management O&M costs include the cost to operate such non-transit functions as incident management on freeways. Transit and Traffic Management O&M costs for the existing and future systems are included in the Cash Flow Model, provided as Table 8-15 and Table 8-16.
METRO has a Cost Allocation Model in which actual operating expenditures and service levels are tracked by three major categories – Operations, Maintenance, and General Administration – and many subcategories. The Cost Allocation Model also allocates expenditures across many transit modes, such as METRO-operated local service or Contractor-operated Park-and-Ride service. This tracking method provides METRO the current cost of providing each service type and allows the accurate cost estimation for future levels of service. The model has since been run for FY 2006 audited financial data.
Historical unit costs, or cost factors, for FY 2004 were derived from METRO’s Cost Allocation Model over nine transit modes (METRO Local, METRO Express, METRO Park-and-Ride, Contract Local, Contract Park-and-Ride, METROLift, Special Events, Charter, and METRORail). With a few exceptions, operations cost are allocated on scheduled vehicle hours, maintenance costs on scheduled vehicle miles, and
Final Environmental Impact Statement
Chapter 8 – Financial Analysis
S o u t h e a s t C o r r i d o r January 2007 8-23
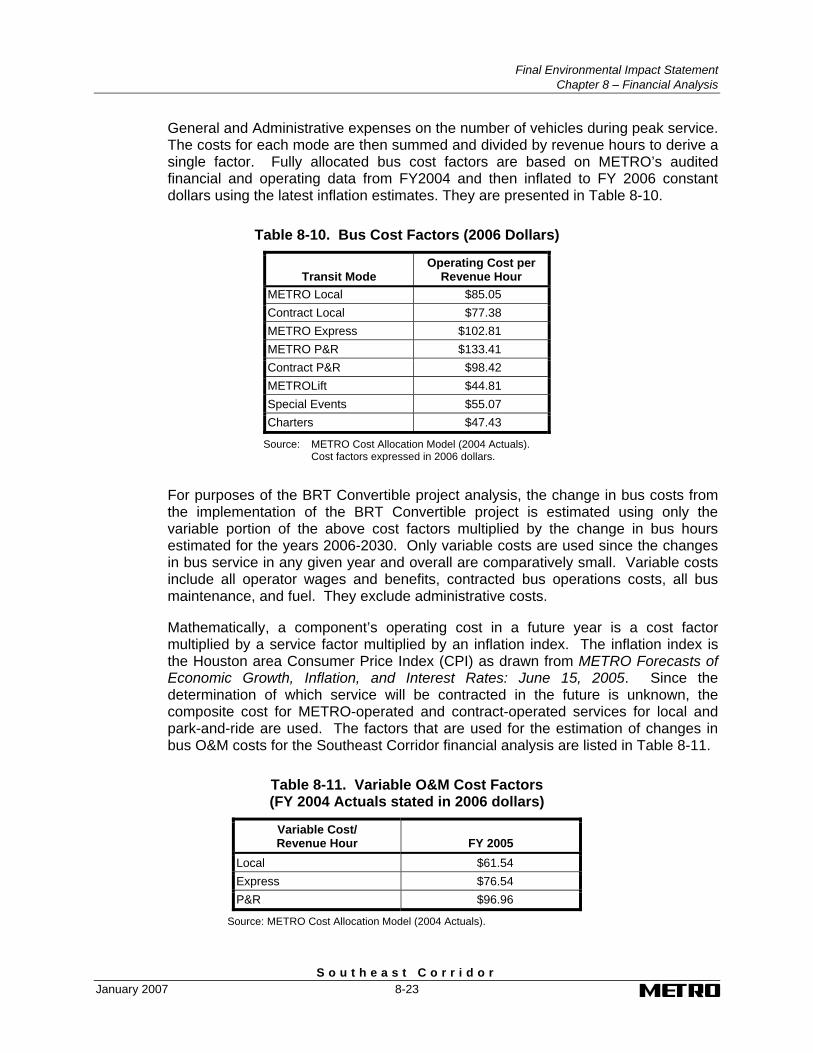
General and Administrative expenses on the number of vehicles during peak service. The costs for each mode are then summed and divided by revenue hours to derive a single factor. Fully allocated bus cost factors are based on METRO’s audited financial and operating data from FY2004 and then inflated to FY 2006 constant dollars using the latest inflation estimates. They are presented in Table 8-10.
Table 8-10. Bus Cost Factors (2006 Dollars)
Transit Mode
Operating Cost per Revenue Hour
METRO Local $85.05 Contract Local $77.38 METRO Express $102.81 METRO P&R $133.41 Contract P&R $98.42 METROLift $44.81 Special Events $55.07 Charters $47.43
Source: METRO Cost Allocation Model (2004 Actuals). Cost factors expressed in 2006 dollars.
For purposes of the BRT Convertible project analysis, the change in bus costs from the implementation of the BRT Convertible project is estimated using only the variable portion of the above cost factors multiplied by the change in bus hours estimated for the years 2006-2030. Only variable costs are used since the changes in bus service in any given year and overall are comparatively small. Variable costs include all operator wages and benefits, contracted bus operations costs, all bus maintenance, and fuel. They exclude administrative costs.
Mathematically, a component’s operating cost in a future year is a cost factor multiplied by a service factor multiplied by an inflation index. The inflation index is the Houston area Consumer Price Index (CPI) as drawn from METRO Forecasts of Economic Growth, Inflation, and Interest Rates: June 15, 2005. Since the determination of which service will be contracted in the future is unknown, the composite cost for METRO-operated and contract-operated services for local and park-and-ride are used. The factors that are used for the estimation of changes in bus O&M costs for the Southeast Corridor financial analysis are listed in Table 8-11.
Table 8-11. Variable O&M Cost Factors (FY 2004 Actuals stated in 2006 dollars)
Variable Cost/ Revenue Hour FY 2005
Local $61.54 Express $76.54 P&R $96.96
Source: METRO Cost Allocation Model (2004 Actuals).
Final Environmental Impact Statement Chapter 8 – Financial Analysis
S o u t h e a s t C o r r i d o r 8-24 January 2007
8.5.2.2 LRT O&M Costs
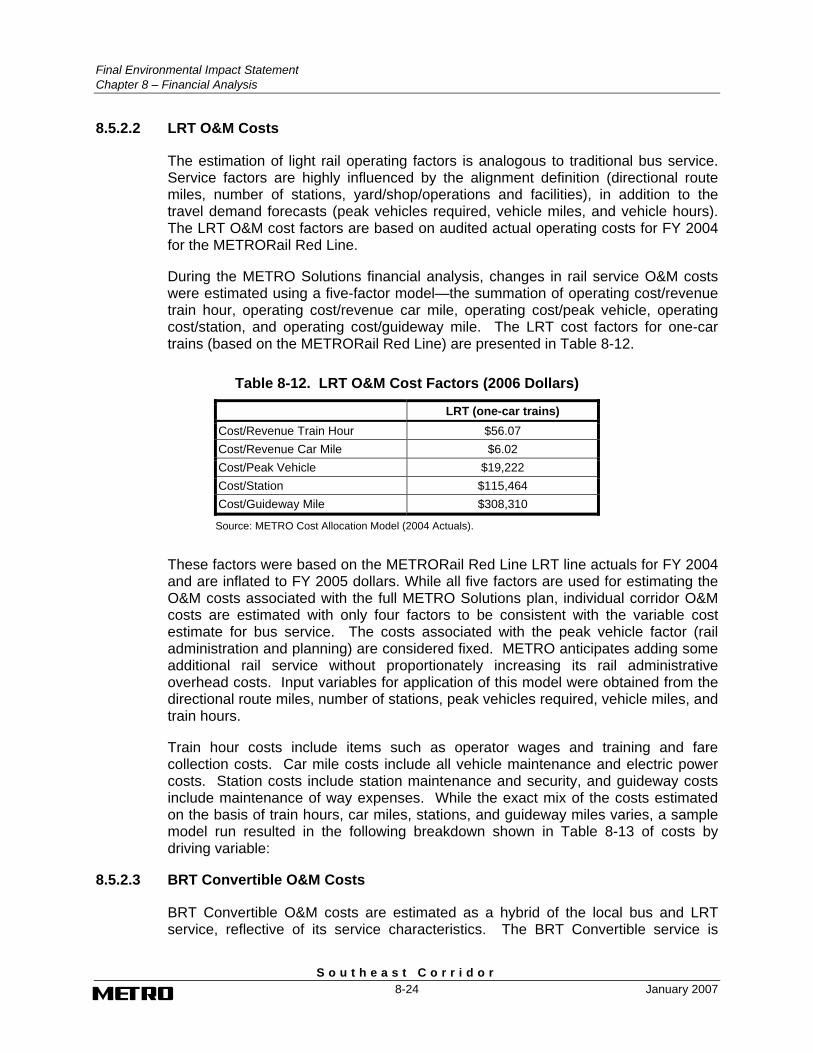
The estimation of light rail operating factors is analogous to traditional bus service. Service factors are highly influenced by the alignment definition (directional route miles, number of stations, yard/shop/operations and facilities), in addition to the travel demand forecasts (peak vehicles required, vehicle miles, and vehicle hours). The LRT O&M cost factors are based on audited actual operating costs for FY 2004 for the METRORail Red Line.
During the METRO Solutions financial analysis, changes in rail service O&M costs were estimated using a five-factor model—the summation of operating cost/revenue train hour, operating cost/revenue car mile, operating cost/peak vehicle, operating cost/station, and operating cost/guideway mile. The LRT cost factors for one-car trains (based on the METRORail Red Line) are presented in Table 8-12.
Table 8-12. LRT O&M Cost Factors (2006 Dollars)
LRT (one-car trains) Cost/Revenue Train Hour $56.07 Cost/Revenue Car Mile $6.02 Cost/Peak Vehicle $19,222 Cost/Station $115,464 Cost/Guideway Mile $308,310
Source: METRO Cost Allocation Model (2004 Actuals).
These factors were based on the METRORail Red Line LRT line actuals for FY 2004 and are inflated to FY 2005 dollars. While all five factors are used for estimating the O&M costs associated with the full METRO Solutions plan, individual corridor O&M costs are estimated with only four factors to be consistent with the variable cost estimate for bus service. The costs associated with the peak vehicle factor (rail administration and planning) are considered fixed. METRO anticipates adding some additional rail service without proportionately increasing its rail administrative overhead costs. Input variables for application of this model were obtained from the directional route miles, number of stations, peak vehicles required, vehicle miles, and train hours.
Train hour costs include items such as operator wages and training and fare collection costs. Car mile costs include all vehicle maintenance and electric power costs. Station costs include station maintenance and security, and guideway costs include maintenance of way expenses. While the exact mix of the costs estimated on the basis of train hours, car miles, stations, and guideway miles varies, a sample model run resulted in the following breakdown shown in Table 8-13 of costs by driving variable:
8.5.2.3 BRT Convertible O&M Costs
BRT Convertible O&M costs are estimated as a hybrid of the local bus and LRT service, reflective of its service characteristics. The BRT Convertible service is

Final Environmental Impact Statement
Chapter 8 – Financial Analysis
S o u t h e a s t C o r r i d o r January 2007 8-25
Table 8-13. Sample LRT O&M Cost Breakdown
LRT (one-car trains) Cost/Revenue Train Hour 21% Cost/Revenue Car Mile 42% Cost/Station 14% Cost/Guideway Mile 23%
Source: METRO Cost Allocation Model (2004 Actuals).
operated with buses and provides two-directional, all-day service. similar to the service profile of local bus service. The BRT Convertible vehicles are larger and more complex to maintain than local buses. In addition, the BRT Convertible service has stations similar to the LRT service. Therefore, the BRT Convertible O&M costs are the sum of its operating costs (which is estimated at 120 percent of the remaining one-third of the local bus O&M cost per hour component multiplied by the number of BRT Convertible hours operated), its vehicle fuel and maintenance costs (which is estimated at 120 percent of the remaining one-third of the local bus O&M cost per hour component times the number of BRT Convertible hours operated), and its station maintenance costs (estimated at 75 percent of the cost per station for the LRT service times the number of BRT Convertible stations built).
These calculations are demonstrated below:
• Variable Cost/Revenue Hour = Operating Cost + Vehicle Fuel & Maintenance Cost
- Operating Cost [.67 x (Local Variable O&M Cost per revenue hour)]
- Vehicle Fuel & Maintenance Cost [1.20 x (.33 x {Local Variable O&M Cost/Revenue Hour})]
• Cost/Station = Station Maintenance Cost [.75 x LRT O&M Cost Station]
• Cost/Guideway Mile = LRT Cost/Guideway Mile
The resulting O&M cost factors are shown in Table 8-14:
Table 8-14. BRT Convertible O&M Cost Factors (2005 Dollars)
Factor Cost Variable Cost/Revenue Hour $66.25 Cost/Station $86,600 Cost/Guideway Mile $308,317
Source: Cost/Revenue Hour is based on FY 2004 actual costs for Local bus service Cost/Station and Cost/Guideway Mile are based on FY 2005 actual costs for LRT.
In 2030, the annual cost to operate and maintain the LPA will be $10.0 million ($YOE).
Final Environmental Impact Statement Chapter 8 – Financial Analysis
S o u t h e a s t C o r r i d o r 8-26 January 2007
8.6 Cash Flow Analysis
For the purpose of FTA evaluation, this section presents the summary cash flow analysis for the LPA.
METRO developed its Cash Flow Model as its primary tool for long range financial management and forecasting in the early 1990s. The model has been updated and enhanced many times over the past decade. The model includes summary-level line items for all of the Authority’s revenues and expenditures, including a history of all revenues and expenditures from FY 1989 through FY 2005, budgeted revenue and expenditures for FY 2006, and forecasted revenues and expenditures from FY 2006 - FY 2030.
Where available (for example, capital expenditures covered by the Capital Improvement Program), the summary-level line items are supported by detailed schedules for each year. The Cash Flow Model information is developed in Year of Expenditure dollars. The data are forecasted in Year of Expenditure dollars and deflated using a consistent inflation factor (the CPI as developed by Dr. Barton A. Smith in the METRO Forecasts of Economic Growth, Inflation, and Interest Rates: June 15, 2005 for the constant dollar version. The model includes the ability to track debt and debt service. The model allows METRO to track its forecasted ending balances to identify years in which the expenditure stream may need to be revised or additional revenues developed. METRO’s historical cash flow dating 1989 to 2004 demonstrates how this model has enabled METRO to track cash flow, debt and debt service.
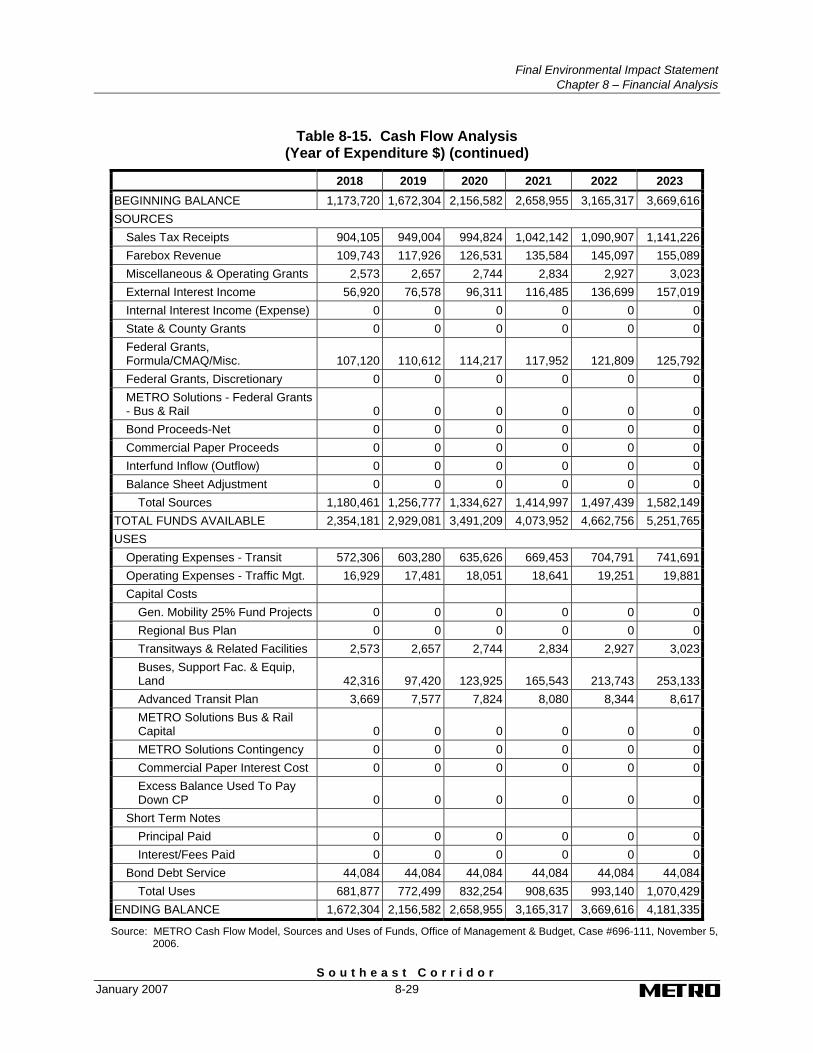
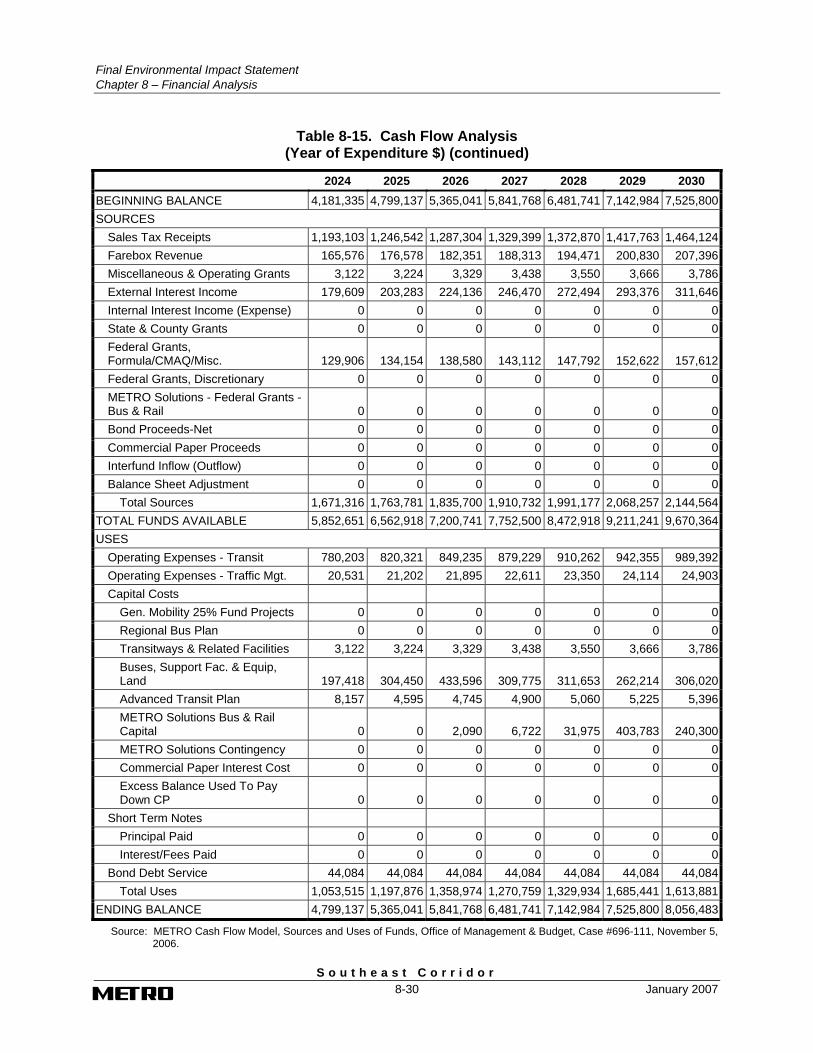
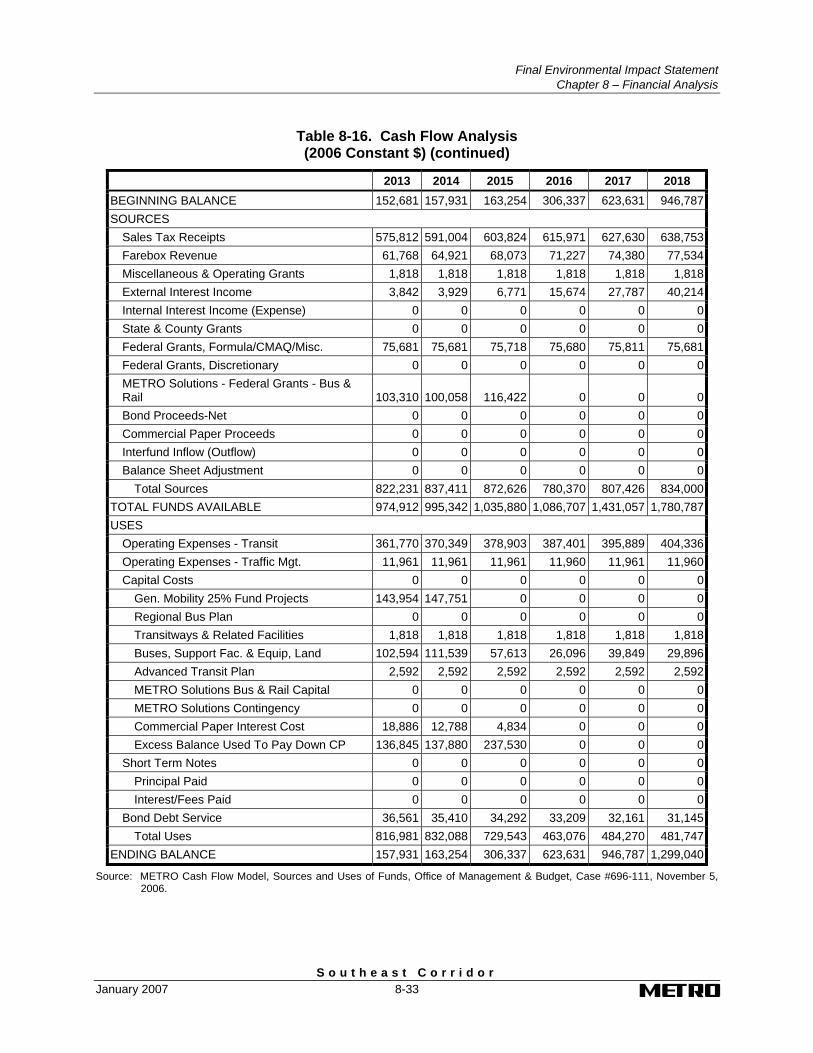
Table 8-15, METRO’s Cash Flow Model for the LPA, shows the projected revenues and expenditures for METRO’s capital and O&M programs, including the LPA project in year of expenditure dollars. The same information is provided in constant 2006 dollars in Table 8-16. Both tables indicate the adequacy of the combined revenues available to METRO to cover the cost of the system, both cumulatively and by year.
8.6.1 Financial Capacity
Evaluation of the financial feasibility of the LPA requires examination of several capital and operating financial indicators. The capital and operating financial indicators described below were considered in the evaluation of financial feasibility.
8.6.2 Capital Financial Indicators
METRO has historically maintained a working capital reserve to cover operating and capital expenses. This reserve was approximately 1.3 to 1.5 percent of the expenses over a three-month period. This working capital was necessary because the State of Texas paid METRO its sales tax revenue on a quarterly basis. In 1999, the Texas legislature changed the sales tax payment schedule, which called for monthly payments. This change in sales tax receipts reduced the amount that must be maintained to cover projected expenses. Although the absolute total of this reserve has decreased, the proportionate amount of reserve relative to the one-month period for which it is retained remains the same as when METRO kept a quarterly reserve – approximately 1.3 to 1.5 percent of expected expenses.

Final Environmental Impact Statement
Chapter 8 – Financial Analysis
S o u t h e a s t C o r r i d o r January 2007 8-27
Table 8-15. Cash Flow Analysis (Year of Expenditure $)
2006 2007 2008 2009 2010 2011 BEGINNING BALANCE 114,050 83,647 85,400 87,804 99,210 116,584SOURCES Sales Tax Receipts 445,560 467,437 498,718 532,697 570,306 610,862 Farebox Revenue 47,645 49,316 50,909 52,804 55,261 62,578 Miscellaneous & Operating Grants 2,000 2,000 2,000 2,000 2,000 2,058 External Interest Income 3,460 3,381 3,464 3,740 4,316 4,437 Internal Interest Income (Expense) 0 0 0 0 0 0 State & County Grants 0 0 0 0 0 0 Federal Grants,
Formula/CMAQ/Misc. 126,095 95,880 72,087 61,563 97,066 85,505 Federal Grants, Discretionary 40,414 30,298 6,768 3,124 2,500 0 METRO Solutions - Federal Grants
- Bus & Rail 57,686 37,384 90,031 72,508 164,967 136,628 Bond Proceeds-Net 0 0 228,283 411,717 0 0 Commercial Paper Proceeds 12,000 191,000 197,000 25,400 250,000 34,000 Interfund Inflow (Outflow) 0 0 0 0 0 0 Balance Sheet Adjustment 0 0 0 0 0 0 Total Sources 734,860 876,696 1,149,260 1,165,553 1,146,416 936,068TOTAL FUNDS AVAILABLE 848,910 960,343 1,234,660 1,253,357 1,245,626 1,052,652USES Operating Expenses - Transit 312,199 319,938 326,693 334,500 344,882 381,206 Operating Expenses - Traffic Mgt. 11,828 12,160 12,447 12,748 13,113 13,533 Capital Costs Gen. Mobility 25% Fund Projects 212,222 125,443 124,680 133,174 142,577 152,716 Regional Bus Plan 48,076 0 0 0 0 0 Transitways & Related Facilities 26,196 2,000 2,000 2,000 2,000 2,058 Buses, Support Fac. & Equip,
Land 42,662 92,599 79,284 107,769 144,390 146,919 Advanced Transit Plan 17,676 18,445 3,799 0 0 2,933 METRO Solutions Bus & Rail
Capital 94,160 299,983 577,110 515,975 415,595 175,754 METRO Solutions Contingency 0 0 0 0 0 0 Commercial Paper Interest Cost 244 4,375 12,271 16,797 22,401 28,181 Excess Balance Used To Pay
Down CP 0 0 0 0 0 0 Short Term Notes Principal Paid 0 0 0 0 0 0 Interest/Fees Paid 0 0 0 0 0 0 Bond Debt Service 0 0 8,572 31,184 44,084 44,084 Total Uses 765,263 874,943 1,146,856 1,154,147 1,129,042 947,384ENDING BALANCE 83,647 85,400 87,804 99,210 116,584 105,268
Source: METRO Cash Flow Model, Sources and Uses of Funds, Office of Management & Budget, Case #696-111, November 5, 2006.

Final Environmental Impact Statement Chapter 8 – Financial Analysis
S o u t h e a s t C o r r i d o r 8-28 January 2007
Table 8-15. Cash Flow Analysis (Year of Expenditure $) (continued)
2012 2013 2014 2015 2016 2017 BEGINNING BALANCE 105,268 112,661 118,993 125,621 309,565 730,757SOURCES Sales Tax Receipts 652,729 694,301 735,780 776,247 817,677 860,315 Farebox Revenue 67,120 74,478 80,825 87,512 94,551 101,955 Miscellaneous & Operating Grants 2,123 2,192 2,263 2,337 2,413 2,492 External Interest Income 4,359 4,633 4,892 8,704 20,806 38,089 Internal Interest Income (Expense) 0 0 0 0 0 0 State & County Grants 0 0 0 0 0 0 Federal Grants,
Formula/CMAQ/Misc. 88,389 91,254 94,220 97,340 100,462 103,917 Federal Grants, Discretionary 0 0 0 0 0 0 METRO Solutions - Federal Grants
- Bus & Rail 124,569 124,569 124,569 149,667 0 0 Bond Proceeds-Net 0 0 0 0 0 0 Commercial Paper Proceeds 0 0 0 0 0 0 Interfund Inflow (Outflow) 0 0 0 0 0 0 Balance Sheet Adjustment 0 0 0 0 0 0 Total Sources 939,289 991,427 1,042,549 1,121,807 1,035,909 1,106,768TOTAL FUNDS AVAILABLE 1,044,557 1,104,088 1,161,542 1,247,428 1,345,474 1,837,525USES Operating Expenses - Transit 404,787 436,214 461,071 487,100 514,260 542,659 Operating Expenses - Traffic Mgt. 13,969 14,422 14,891 15,376 15,877 16,395 Capital Costs Gen. Mobility 25% Fund Projects 163,183 173,576 183,945 0 0 0 Regional Bus Plan 0 0 0 0 0 0 Transitways & Related Facilities 2,123 2,192 2,263 2,337 2,413 2,492 Buses, Support Fac. & Equip,
Land 119,547 123,705 138,862 74,064 34,641 54,623 Advanced Transit Plan 3,027 3,125 3,227 3,332 3,441 3,553 METRO Solutions Bus & Rail
Capital 86,293 0 0 0 0 0 METRO Solutions Contingency 0 0 0 0 0 0 Commercial Paper Interest Cost 27,501 22,772 15,921 6,214 0 0 Excess Balance Used To Pay
Down CP 67,382 165,005 171,656 305,357 0 0 Short Term Notes Principal Paid 0 0 0 0 0 0 Interest/Fees Paid 0 0 0 0 0 0 Bond Debt Service 44,084 44,084 44,084 44,084 44,084 44,084 Total Uses 931,896 985,095 1,035,920 937,864 614,716 663,806ENDING BALANCE 112,661 118,993 125,621 309,565 730,757 1,173,720
Source: METRO Cash Flow Model, Sources and Uses of Funds, Office of Management & Budget, Case #696-111, November 5, 2006.
Final Environmental Impact Statement
Chapter 8 – Financial Analysis
S o u t h e a s t C o r r i d o r January 2007 8-29
Table 8-15. Cash Flow Analysis (Year of Expenditure $) (continued)
2018 2019 2020 2021 2022 2023 BEGINNING BALANCE 1,173,720 1,672,304 2,156,582 2,658,955 3,165,317 3,669,616SOURCES Sales Tax Receipts 904,105 949,004 994,824 1,042,142 1,090,907 1,141,226 Farebox Revenue 109,743 117,926 126,531 135,584 145,097 155,089 Miscellaneous & Operating Grants 2,573 2,657 2,744 2,834 2,927 3,023 External Interest Income 56,920 76,578 96,311 116,485 136,699 157,019 Internal Interest Income (Expense) 0 0 0 0 0 0 State & County Grants 0 0 0 0 0 0 Federal Grants,
Formula/CMAQ/Misc. 107,120 110,612 114,217 117,952 121,809 125,792 Federal Grants, Discretionary 0 0 0 0 0 0 METRO Solutions - Federal Grants
- Bus & Rail 0 0 0 0 0 0 Bond Proceeds-Net 0 0 0 0 0 0 Commercial Paper Proceeds 0 0 0 0 0 0 Interfund Inflow (Outflow) 0 0 0 0 0 0 Balance Sheet Adjustment 0 0 0 0 0 0 Total Sources 1,180,461 1,256,777 1,334,627 1,414,997 1,497,439 1,582,149TOTAL FUNDS AVAILABLE 2,354,181 2,929,081 3,491,209 4,073,952 4,662,756 5,251,765USES Operating Expenses - Transit 572,306 603,280 635,626 669,453 704,791 741,691 Operating Expenses - Traffic Mgt. 16,929 17,481 18,051 18,641 19,251 19,881 Capital Costs Gen. Mobility 25% Fund Projects 0 0 0 0 0 0 Regional Bus Plan 0 0 0 0 0 0 Transitways & Related Facilities 2,573 2,657 2,744 2,834 2,927 3,023 Buses, Support Fac. & Equip,
Land 42,316 97,420 123,925 165,543 213,743 253,133 Advanced Transit Plan 3,669 7,577 7,824 8,080 8,344 8,617 METRO Solutions Bus & Rail
Capital 0 0 0 0 0 0 METRO Solutions Contingency 0 0 0 0 0 0 Commercial Paper Interest Cost 0 0 0 0 0 0 Excess Balance Used To Pay
Down CP 0 0 0 0 0 0 Short Term Notes Principal Paid 0 0 0 0 0 0 Interest/Fees Paid 0 0 0 0 0 0 Bond Debt Service 44,084 44,084 44,084 44,084 44,084 44,084 Total Uses 681,877 772,499 832,254 908,635 993,140 1,070,429ENDING BALANCE 1,672,304 2,156,582 2,658,955 3,165,317 3,669,616 4,181,335
Source: METRO Cash Flow Model, Sources and Uses of Funds, Office of Management & Budget, Case #696-111, November 5, 2006.
Final Environmental Impact Statement Chapter 8 – Financial Analysis
S o u t h e a s t C o r r i d o r 8-30 January 2007
Table 8-15. Cash Flow Analysis (Year of Expenditure $) (continued)
2024 2025 2026 2027 2028 2029 2030 BEGINNING BALANCE 4,181,335 4,799,137 5,365,041 5,841,768 6,481,741 7,142,984 7,525,800SOURCES Sales Tax Receipts 1,193,103 1,246,542 1,287,304 1,329,399 1,372,870 1,417,763 1,464,124 Farebox Revenue 165,576 176,578 182,351 188,313 194,471 200,830 207,396 Miscellaneous & Operating Grants 3,122 3,224 3,329 3,438 3,550 3,666 3,786 External Interest Income 179,609 203,283 224,136 246,470 272,494 293,376 311,646 Internal Interest Income (Expense) 0 0 0 0 0 0 0 State & County Grants 0 0 0 0 0 0 0 Federal Grants,
Formula/CMAQ/Misc. 129,906 134,154 138,580 143,112 147,792 152,622 157,612 Federal Grants, Discretionary 0 0 0 0 0 0 0 METRO Solutions - Federal Grants -
Bus & Rail 0 0 0 0 0 0 0 Bond Proceeds-Net 0 0 0 0 0 0 0 Commercial Paper Proceeds 0 0 0 0 0 0 0 Interfund Inflow (Outflow) 0 0 0 0 0 0 0 Balance Sheet Adjustment 0 0 0 0 0 0 0 Total Sources 1,671,316 1,763,781 1,835,700 1,910,732 1,991,177 2,068,257 2,144,564TOTAL FUNDS AVAILABLE 5,852,651 6,562,918 7,200,741 7,752,500 8,472,918 9,211,241 9,670,364USES Operating Expenses - Transit 780,203 820,321 849,235 879,229 910,262 942,355 989,392 Operating Expenses - Traffic Mgt. 20,531 21,202 21,895 22,611 23,350 24,114 24,903 Capital Costs Gen. Mobility 25% Fund Projects 0 0 0 0 0 0 0 Regional Bus Plan 0 0 0 0 0 0 0 Transitways & Related Facilities 3,122 3,224 3,329 3,438 3,550 3,666 3,786 Buses, Support Fac. & Equip,
Land 197,418 304,450 433,596 309,775 311,653 262,214 306,020 Advanced Transit Plan 8,157 4,595 4,745 4,900 5,060 5,225 5,396 METRO Solutions Bus & Rail
Capital 0 0 2,090 6,722 31,975 403,783 240,300 METRO Solutions Contingency 0 0 0 0 0 0 0 Commercial Paper Interest Cost 0 0 0 0 0 0 0 Excess Balance Used To Pay
Down CP 0 0 0 0 0 0 0 Short Term Notes Principal Paid 0 0 0 0 0 0 0 Interest/Fees Paid 0 0 0 0 0 0 0 Bond Debt Service 44,084 44,084 44,084 44,084 44,084 44,084 44,084 Total Uses 1,053,515 1,197,876 1,358,974 1,270,759 1,329,934 1,685,441 1,613,881ENDING BALANCE 4,799,137 5,365,041 5,841,768 6,481,741 7,142,984 7,525,800 8,056,483
Source: METRO Cash Flow Model, Sources and Uses of Funds, Office of Management & Budget, Case #696-111, November 5, 2006.

Final Environmental Impact Statement
Chapter 8 – Financial Analysis
S o u t h e a s t C o r r i d o r January 2007 8-31
Table 8-15. Cash Flow Analysis (Year of Expenditure $) (continued)
2006-2010 2011-2025 2026-2030 2006-2030 BEGINNING BALANCE 114,050 116,584 5,365,041 114,050SOURCES Sales Tax Receipts 2,514,718 13,709,764 6,871,460 23,095,942 Farebox Revenue 255,935 1,701,143 973,361 2,930,439 Miscellaneous & Operating Grants 10,000 38,982 17,769 66,751 External Interest Income 18,361 1,108,824 1,348,122 2,475,307 Internal Interest Income (Expense) 0 0 0 0 State & County Grants 0 0 0 0 Federal Grants,
Formula/CMAQ/Misc. 452,691 1,622,649 739,718 2,815,058 Federal Grants, Discretionary 83,104 0 0 83,104 METRO Solutions - Federal Grants
- Bus & Rail 422,576 660,002 0 1,082,578 Bond Proceeds-Net 640,000 0 0 640,000 Commercial Paper Proceeds 675,400 34,000 0 709,400 Interfund Inflow (Outflow) 0 0 0 0 Balance Sheet Adjustment 0 0 0 0 Total Sources 5,072,785 18,875,364 9,950,430 33,898,579TOTAL FUNDS AVAILABLE 5,186,835 18,991,948 15,315,471 34,012,629USES Operating Expenses - Transit 1,638,212 8,754,969 4,570,472 14,963,653 Operating Expenses - Traffic Mgt. 62,296 256,430 116,873 435,599 Capital Costs 0 0 0 0 Gen. Mobility 25% Fund Projects 738,096 673,420 0 1,411,516 Regional Bus Plan 48,076 0 0 48,076 Transitways & Related Facilities 34,196 38,982 17,769 90,947 Buses, Support Fac. & Equip,
Land 466,704 2,090,309 1,623,258 4,180,271 Advanced Transit Plan 39,920 79,501 25,326 144,747 METRO Solutions Bus & Rail
Capital 1,902,823 262,047 684,870 2,849,740 METRO Solutions Contingency 0 0 0 0 Commercial Paper Interest Cost 56,088 100,589 0 156,677 Excess Balance Used To Pay
Down CP 0 709,400 0 709,400 Short Term Notes 0 0 0 0 Principal Paid 0 0 0 0 Interest/Fees Paid 0 0 0 0 Bond Debt Service 83,840 661,260 220,420 965,520 Total Uses 5,070,251 13,626,907 7,258,988 25,956,146ENDING BALANCE 116,584 5,365,041 8,056,483 8,056,483
Source: METRO Cash Flow Model, Sources and Uses of Funds, Office of Management & Budget, Case #696-111, November 5, 2006.

Final Environmental Impact Statement Chapter 8 – Financial Analysis
S o u t h e a s t C o r r i d o r 8-32 January 2007
Table 8-16. Cash Flow Analysis (2006 Constant $)
2006 2007 2008 2009 2010 2011 2012 BEGINNING BALANCE 114,050 83,647 87,372 99,195 121,831 148,885 143,940SOURCES Sales Tax Receipts 445,560 456,125 476,593 497,182 518,441 539,659 558,873 Farebox Revenue 47,645 48,123 48,650 49,284 50,235 55,284 57,469 Miscellaneous & Operating Grants 2,000 1,952 1,911 1,867 1,818 1,818 1,818 External Interest Income 3,460 3,299 3,310 3,491 3,923 3,920 3,732 Internal Interest Income (Expense) 0 0 0 0 0 0 0 State & County Grants 0 0 0 0 0 0 0 Federal Grants, Formula/CMAQ/Misc. 126,095 93,560 68,889 57,459 88,239 75,538 75,680 Federal Grants, Discretionary 40,414 29,565 6,468 2,916 2,273 0 0 METRO Solutions - Federal Grants - Bus &
Rail 57,686 36,479 86,037 67,674 149,965 120,702 106,657 Bond Proceeds-Net 0 0 218,156 384,268 0 0 0 Commercial Paper Proceeds 12,000 186,378 188,260 23,707 227,264 30,037 0 Interfund Inflow (Outflow) 0 0 0 0 0 0 0 Balance Sheet Adjustment 0 0 0 0 0 0 0 Total Sources 734,860 855,481 1,098,274 1,087,848 1,042,158 826,958 804,229TOTAL FUNDS AVAILABLE 848,910 939,128 1,185,646 1,187,043 1,163,989 975,843 948,169USES Operating Expenses - Transit 312,199 312,196 312,200 312,199 313,518 336,772 346,583 Operating Expenses - Traffic Mgt. 11,828 11,866 11,895 11,898 11,920 11,956 11,960 Capital Costs 0 0 0 0 0 0 0 Gen. Mobility 25% Fund Projects 212,222 122,407 119,149 124,295 129,611 134,915 139,719 Regional Bus Plan 48,076 0 0 0 0 0 0 Transitways & Related Facilities 26,196 1,952 1,911 1,867 1,818 1,818 1,818 Buses, Support Fac. & Equip, Land 42,662 90,358 75,767 100,584 131,259 129,794 102,357 Advanced Transit Plan 17,676 17,999 3,630 0 0 2,591 2,592 METRO Solutions Bus & Rail Capital 94,160 290,709 541,980 469,587 366,539 150,216 71,474 METRO Solutions Contingency 0 0 0 0 0 0 0 Commercial Paper Interest Cost 244 4,269 11,727 15,677 20,364 24,896 23,547 Excess Balance Used To Pay Down CP 0 0 0 0 0 0 57,693 Short Term Notes 0 0 0 0 0 0 0 Principal Paid 0 0 0 0 0 0 0 Interest/Fees Paid 0 0 0 0 0 0 0 Bond Debt Service 0 0 8,192 29,105 40,075 38,945 37,745 Total Uses 765,263 851,756 1,086,451 1,065,212 1,015,104 831,903 795,488ENDING BALANCE 83,647 87,372 99,195 121,831 148,885 143,940 152,681
Source: METRO Cash Flow Model, Sources and Uses of Funds, Office of Management & Budget, Case #696-111, November 5, 2006.
Final Environmental Impact Statement
Chapter 8 – Financial Analysis
S o u t h e a s t C o r r i d o r January 2007 8-33
Table 8-16. Cash Flow Analysis (2006 Constant $) (continued)
2013 2014 2015 2016 2017 2018 BEGINNING BALANCE 152,681 157,931 163,254 306,337 623,631 946,787SOURCES Sales Tax Receipts 575,812 591,004 603,824 615,971 627,630 638,753 Farebox Revenue 61,768 64,921 68,073 71,227 74,380 77,534 Miscellaneous & Operating Grants 1,818 1,818 1,818 1,818 1,818 1,818 External Interest Income 3,842 3,929 6,771 15,674 27,787 40,214 Internal Interest Income (Expense) 0 0 0 0 0 0 State & County Grants 0 0 0 0 0 0 Federal Grants, Formula/CMAQ/Misc. 75,681 75,681 75,718 75,680 75,811 75,681 Federal Grants, Discretionary 0 0 0 0 0 0 METRO Solutions - Federal Grants - Bus &
Rail 103,310 100,058 116,422 0 0 0 Bond Proceeds-Net 0 0 0 0 0 0 Commercial Paper Proceeds 0 0 0 0 0 0 Interfund Inflow (Outflow) 0 0 0 0 0 0 Balance Sheet Adjustment 0 0 0 0 0 0 Total Sources 822,231 837,411 872,626 780,370 807,426 834,000TOTAL FUNDS AVAILABLE 974,912 995,342 1,035,880 1,086,707 1,431,057 1,780,787USES Operating Expenses - Transit 361,770 370,349 378,903 387,401 395,889 404,336 Operating Expenses - Traffic Mgt. 11,961 11,961 11,961 11,960 11,961 11,960 Capital Costs 0 0 0 0 0 0 Gen. Mobility 25% Fund Projects 143,954 147,751 0 0 0 0 Regional Bus Plan 0 0 0 0 0 0 Transitways & Related Facilities 1,818 1,818 1,818 1,818 1,818 1,818 Buses, Support Fac. & Equip, Land 102,594 111,539 57,613 26,096 39,849 29,896 Advanced Transit Plan 2,592 2,592 2,592 2,592 2,592 2,592 METRO Solutions Bus & Rail Capital 0 0 0 0 0 0 METRO Solutions Contingency 0 0 0 0 0 0 Commercial Paper Interest Cost 18,886 12,788 4,834 0 0 0 Excess Balance Used To Pay Down CP 136,845 137,880 237,530 0 0 0 Short Term Notes 0 0 0 0 0 0 Principal Paid 0 0 0 0 0 0 Interest/Fees Paid 0 0 0 0 0 0 Bond Debt Service 36,561 35,410 34,292 33,209 32,161 31,145 Total Uses 816,981 832,088 729,543 463,076 484,270 481,747ENDING BALANCE 157,931 163,254 306,337 623,631 946,787 1,299,040
Source: METRO Cash Flow Model, Sources and Uses of Funds, Office of Management & Budget, Case #696-111, November 5, 2006.
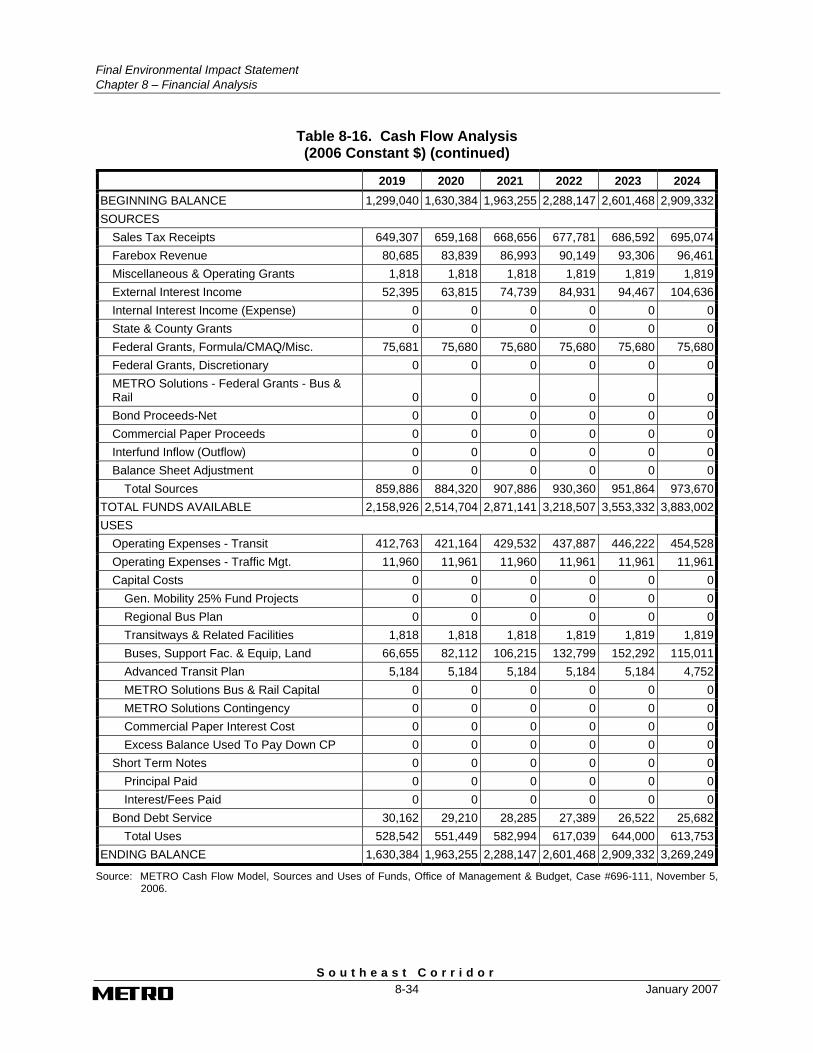
Final Environmental Impact Statement Chapter 8 – Financial Analysis
S o u t h e a s t C o r r i d o r 8-34 January 2007
Table 8-16. Cash Flow Analysis (2006 Constant $) (continued)
2019 2020 2021 2022 2023 2024 BEGINNING BALANCE 1,299,040 1,630,384 1,963,255 2,288,147 2,601,468 2,909,332SOURCES Sales Tax Receipts 649,307 659,168 668,656 677,781 686,592 695,074 Farebox Revenue 80,685 83,839 86,993 90,149 93,306 96,461 Miscellaneous & Operating Grants 1,818 1,818 1,818 1,819 1,819 1,819 External Interest Income 52,395 63,815 74,739 84,931 94,467 104,636 Internal Interest Income (Expense) 0 0 0 0 0 0 State & County Grants 0 0 0 0 0 0 Federal Grants, Formula/CMAQ/Misc. 75,681 75,680 75,680 75,680 75,680 75,680 Federal Grants, Discretionary 0 0 0 0 0 0 METRO Solutions - Federal Grants - Bus &
Rail 0 0 0 0 0 0 Bond Proceeds-Net 0 0 0 0 0 0 Commercial Paper Proceeds 0 0 0 0 0 0 Interfund Inflow (Outflow) 0 0 0 0 0 0 Balance Sheet Adjustment 0 0 0 0 0 0 Total Sources 859,886 884,320 907,886 930,360 951,864 973,670TOTAL FUNDS AVAILABLE 2,158,926 2,514,704 2,871,141 3,218,507 3,553,332 3,883,002USES Operating Expenses - Transit 412,763 421,164 429,532 437,887 446,222 454,528 Operating Expenses - Traffic Mgt. 11,960 11,961 11,960 11,961 11,961 11,961 Capital Costs 0 0 0 0 0 0 Gen. Mobility 25% Fund Projects 0 0 0 0 0 0 Regional Bus Plan 0 0 0 0 0 0 Transitways & Related Facilities 1,818 1,818 1,818 1,819 1,819 1,819 Buses, Support Fac. & Equip, Land 66,655 82,112 106,215 132,799 152,292 115,011 Advanced Transit Plan 5,184 5,184 5,184 5,184 5,184 4,752 METRO Solutions Bus & Rail Capital 0 0 0 0 0 0 METRO Solutions Contingency 0 0 0 0 0 0 Commercial Paper Interest Cost 0 0 0 0 0 0 Excess Balance Used To Pay Down CP 0 0 0 0 0 0 Short Term Notes 0 0 0 0 0 0 Principal Paid 0 0 0 0 0 0 Interest/Fees Paid 0 0 0 0 0 0 Bond Debt Service 30,162 29,210 28,285 27,389 26,522 25,682 Total Uses 528,542 551,449 582,994 617,039 644,000 613,753ENDING BALANCE 1,630,384 1,963,255 2,288,147 2,601,468 2,909,332 3,269,249
Source: METRO Cash Flow Model, Sources and Uses of Funds, Office of Management & Budget, Case #696-111, November 5, 2006.

Final Environmental Impact Statement
Chapter 8 – Financial Analysis
S o u t h e a s t C o r r i d o r January 2007 8-35
Table 8-16. Cash Flow Analysis (2006 Constant $) (continued)
2025 2026 2027 2028 2029 2030 BEGINNING BALANCE 3,269,249 3,588,492 3,848,937 4,187,542 4,526,598 4,720,649SOURCES Sales Tax Receipts 703,211 703,211 703,211 703,211 703,211 703,211 Farebox Revenue 99,613 99,612 99,612 99,612 99,612 99,611 Miscellaneous & Operating Grants 1,819 1,819 1,819 1,818 1,818 1,818 External Interest Income 114,678 122,438 130,375 139,577 145,515 149,682 Internal Interest Income (Expense) 0 0 0 0 0 0 State & County Grants 0 0 0 0 0 0 Federal Grants, Formula/CMAQ/Misc. 75,680 75,702 75,702 75,702 75,701 75,700 Federal Grants, Discretionary 0 0 0 0 0 0 METRO Solutions - Federal Grants - Bus &
Rail 0 0 0 0 0 0 Bond Proceeds-Net 0 0 0 0 0 0 Commercial Paper Proceeds 0 0 0 0 0 0 Interfund Inflow (Outflow) 0 0 0 0 0 0 Balance Sheet Adjustment 0 0 0 0 0 0 Total Sources 995,001 1,002,782 1,010,719 1,019,920 1,025,857 1,030,022TOTAL FUNDS AVAILABLE 4,264,250 4,591,274 4,859,656 5,207,462 5,552,455 5,750,671USES Operating Expenses - Transit 462,768 463,909 465,085 466,254 467,409 475,200 Operating Expenses - Traffic Mgt. 11,961 11,961 11,961 11,960 11,961 11,961 Capital Costs 0 0 0 0 0 0 Gen. Mobility 25% Fund Projects 0 0 0 0 0 0 Regional Bus Plan 0 0 0 0 0 0 Transitways & Related Facilities 1,819 1,819 1,819 1,818 1,818 1,818 Buses, Support Fac. & Equip, Land 171,749 236,859 163,862 159,635 130,058 146,980 Advanced Transit Plan 2,592 2,592 2,592 2,592 2,592 2,592 METRO Solutions Bus & Rail Capital 0 1,115 3,476 16,024 196,102 113,097 METRO Solutions Contingency 0 0 0 0 0 0 Commercial Paper Interest Cost 0 0 0 0 0 0 Excess Balance Used To Pay Down CP 0 0 0 0 0 0 Short Term Notes 0 0 0 0 0 0 Principal Paid 0 0 0 0 0 0 Interest/Fees Paid 0 0 0 0 0 0 Bond Debt Service 24,869 24,082 23,319 22,581 21,866 21,173 Total Uses 675,758 742,337 672,114 680,864 831,806 772,821ENDING BALANCE 3,588,492 3,848,937 4,187,542 4,526,598 4,720,649 4,977,850
Source: METRO Cash Flow Model, Sources and Uses of Funds, Office of Management & Budget, Case #696-111, November 5, 2006.

Final Environmental Impact Statement Chapter 8 – Financial Analysis
S o u t h e a s t C o r r i d o r 8-36 January 2007
Table 8-16. Cash Flow Analysis (2006 Constant $) (continued)
2006-2010 2011-2025 2026-2030 2006-2030BEGINNING BALANCE 114,050 148,885 3,588,492 114,050SOURCES Sales Tax Receipts 2,393,901 9,491,315 3,516,055 15,401,271 Farebox Revenue 243,937 1,161,702 498,059 1,903,698 Miscellaneous & Operating Grants 9,548 27,274 9,092 45,914 External Interest Income 17,483 695,530 687,587 1,400,600 Internal Interest Income (Expense) 0 0 0 0 State & County Grants 0 0 0 0 Federal Grants, Formula/CMAQ/Misc. 434,242 1,135,231 378,507 1,947,980 Federal Grants, Discretionary 81,636 0 0 81,636 METRO Solutions - Federal Grants - Bus &
Rail 397,841 547,149 0 944,990 Bond Proceeds-Net 602,424 0 0 602,424 Commercial Paper Proceeds 637,609 30,037 0 667,646 Interfund Inflow (Outflow) 0 0 0 0 Balance Sheet Adjustment 0 0 0 0 Total Sources 4,818,621 13,088,238 5,089,300 22,996,159TOTAL FUNDS AVAILABLE 4,932,671 13,237,123 8,677,792 23,110,209USES Operating Expenses - Transit 1,562,312 6,046,867 2,337,857 9,947,036 Operating Expenses - Traffic Mgt. 59,407 179,405 59,804 298,616 Capital Costs 0 0 0 0 Gen. Mobility 25% Fund Projects 707,684 566,339 0 1,274,023 Regional Bus Plan 48,076 0 0 48,076 Transitways & Related Facilities 33,744 27,274 9,092 70,110 Buses, Support Fac. & Equip, Land 440,630 1,426,571 837,394 2,704,595 Advanced Transit Plan 39,305 53,999 12,960 106,264 METRO Solutions Bus & Rail Capital 1,762,975 221,690 329,814 2,314,479 METRO Solutions Contingency 0 0 0 0 Commercial Paper Interest Cost 52,281 84,951 0 137,232 Excess Balance Used To Pay Down CP 0 569,948 0 569,948 Short Term Notes 0 0 0 0 Principal Paid 0 0 0 0 Interest/Fees Paid 0 0 0 0 Bond Debt Service 77,372 471,587 113,021 661,980 Total Uses 4,783,786 9,648,631 3,699,942 18,132,359ENDING BALANCE 148,885 3,588,492 4,977,850 4,977,850
Source: METRO Cash Flow Model, Sources and Uses of Funds, Office of Management & Budget, Case #696-111, November 5, 2006.

Final Environmental Impact Statement
Chapter 8 – Financial Analysis
S o u t h e a s t C o r r i d o r January 2007 8-37
8.6.3 Operating Financial Indicators
The financial analysis also addressed the farebox ratio (the portion of operating expenses covered by fares and other operating revenues). Consideration of operating financial indicators is important in the evaluation of financial feasibility because METRO has no legal limit on the application of its tax revenues on operations. As a practical matter, absent any debt financing, the first use of tax revenues is to support operations, with remaining funds applied to the ongoing capital improvement program and fixed guideway investment.
Historically, METRO has had a fairly low farebox ratio – only 15 percent in 2004. This ratio is expected to increase; however, averaging 27 percent over the 26-year period as METRO begins to implement regular fare increases.
Table 8-15 and Table 8-16 present the projection of passenger fares, total operating revenues, and operating cost. Projected values of both the farebox ratio and overall operating ratio are consistent with current and recent values.
8.6.4 Current Ratio
In FY 2004, METRO’s annual report shows investments totaling $234,127,000 as current assets and in the FY 2003 investments totaling $307,666,000 as current assets. Table 8-17 shows the current ratios based on the FY 2004 and the FY 2003 classifications by METRO’s external auditors:
Table 8-17. Current Ratio Calculations
$ in millions FY 2003 FY 2004
Total Current Assets $307.666 $234.127 Total Current Liability $167.942 $125.158 Current Ratio 1.83 1.87
Source: Annual Report 2004, The Metropolitan Transit Authority of Harris County, Texas, page F-10.
A copy of METRO’s basic financial statements as of September 30, 2003 and September 30, 2004 is represented in Figure 8-1.
8.6.5 Sensitivity and Risk Analysis
Decision makers committing public resources to large-scale infrastructure investments must be informed as to the likely range of financial results that may occur. For this reason, a risk analysis is undertaken to explore the range of possible outcomes in the financial analysis. The achievement of any financial projection may be affected by fluctuating economic conditions and depends on the occurrence of future events that cannot be assured. Therefore, actual results achieved may vary from point estimates and the variations could be material.

Final Environmental Impact Statement Chapter 8 – Financial Analysis
S o u t h e a s t C o r r i d o r 8-38 January 2007
Figure 8-1. Statement of Net Assets As of September 30, 2003 and September 30, 2004
Source: Annual Report 2004, The Metropolitan Transit Authority of Harris County, page F-10.
There are a number of uncertainty variables that cannot be directly controlled by management and governing bodies. These include inflation; interest rates; construction costs; ridership; and federal, state, and local grant funding levels. Undertaking a risk analysis reveals the combinations of management actions that result in financial outcomes that provide for the feasible implementation of the project, even in the more pessimistic of futures.

Final Environmental Impact Statement
Chapter 8 – Financial Analysis
S o u t h e a s t C o r r i d o r January 2007 8-39
8.6.5.1 Sensitivity Analysis
Sensitivity analyses were conducted to test the financial capacity of METRO to build and operate the proposed LPA as part of the METRO Solutions Phase 2 plan and continue to operate their existing transit systems in light of potential changes in three key variables:
• The annual rate of growth of the sales taxes;
• The annual rate of growth of O&M costs; and
• The level of estimated METRO Solutions Phase 2 capital costs.
METRO is projected to have the financial capacity to build and operate the METRO Solutions Phase 2 plan and other transit services even if projections for key variables negatively change. Previous projections for METRO Solutions have shown that METRO has the capacity to build and operate not only the METRO Solutions Phase 2 plan.
8.6.5.2 Conclusion and Implications in This Analysis
The foremost conclusion is that METRO has the financial capacity to build and operate the METRO Solutions Phase 2 and to build the Southeast Corridor project in the context of implementing METRO Solutions through 2012. This conclusion is shown to be valid with the current assumptions on revenues and costs and with possible negative variations in those factors in the future.
The financial results presented in this report are intended to chart a general course of action regarding project implementation, transit service expansion, and initiation of activities to establish new funding and financing approaches. The financial analysis results should not be applied or referred to any party in connection with the issuance of securities.


S o u t h e a s t C o r r i d o r
APPENDIX A LIST OF ACRONYMS AND
ABBREVIATIONS