Embed Size (px)
Citation preview
This electronic thesis or dissertation has been
downloaded from the King’s Research Portal at
https://kclpure.kcl.ac.uk/portal/
The copyright of this thesis rests with the author and no quotation from it or information derived from it
may be published without proper acknowledgement.
Take down policy
If you believe that this document breaches copyright please contact [email protected] providing
details, and we will remove access to the work immediately and investigate your claim.
END USER LICENCE AGREEMENT
This work is licensed under a Creative Commons Attribution-NonCommercial-NoDerivatives 4.0
International licence. https://creativecommons.org/licenses/by-nc-nd/4.0/
You are free to:
Share: to copy, distribute and transmit the work Under the following conditions:
Attribution: You must attribute the work in the manner specified by the author (but not in any way that suggests that they endorse you or your use of the work).
Non Commercial: You may not use this work for commercial purposes.
No Derivative Works - You may not alter, transform, or build upon this work.
Any of these conditions can be waived if you receive permission from the author. Your fair dealings and
other rights are in no way affected by the above.
Contribution of cholinergic innervation to adult hippocampal neurogenesis in dementia
Jantrachotechatchawan, Chanati
Awarding institution:King's College London
Download date: 28. Feb. 2020
1
Contribution of Cholinergic Innervation to Adult Hippocampal
Neurogenesis in Dementia
Chanati Jantrachotechatchawan
Thesis submitted for the degree of Doctor of Philosophy
King’s College London
Wolfson Centre for Age-Related Diseases
Institute of Psychiatry, Psychology & Neuroscience
King’s College London
2
Abstract
Aberrations in the adult hippocampal neurogenesis in AD patients include dysfunctional
maturation indicated by accumulated number of immature neurons. The hippocampus receives
cholinergic afferents from the medial septum/diagonal band of Broca (MS/DB). Plasticity of
septohippocampal cholinergic innervation in AD was reported by multiple studies including
higher hippocampal choline acetyltransferase (ChAT) activity in MCI cases with Braak stage III-
IV than control and AD cases. Septohippocampal cholinergic pathway is crucial to adult
hippocampal neurogenesis in rodents. While several studies have reported association between
these two factors in human cases, a range of markers investigated have been limited and the
mechanisms remain unclear.
The aim of this first project is to use immunohistochemistry (IHC) to measure the extents of
cholinergic innervation with ChAT and vesicular acetylcholine transporter (VAChT) and to
evaluate the changes in adult hippocampal neurogenesis with immature neuron markers DCX,
HuB/D, and proliferative marker PCNA. Statistical power for the main study was calculated from
the pilot study and reported to request for the main cohort cases. The main cohort consisted of
36 cases of all Braak stages with low to negligible vascular conditions from the MRC brain bank.
ChAT staining in the dentate gyrus (DG) was significantly higher in the cases with Braak III than
cases with Braak IV-VI. The number of HuB/D positive cells without PCNA was significantly
correlated with ChAT staining and significantly lower in Braak IV-V cases compared with others.
The number of DCX-positive cells, unlike the pilot study and other studies, was not different
across the groups.
Since the third year of the project, Dr Emily Clarke has started her project on D427V
heterozygous GBA1 mouse as a potential model for dementia with Lewy bodies (DLB). Several
studies demonstrated AD-like abnormal adult hippocampal neurogenesis in DLB and even more
severe degeneration of the septohippocampal cholinergic tracts in DLB than in AD cases. This
led to our collaboration and the second part of this thesis on characterising the cholinergic
innervation and adult hippocampal neurogenesis in this mouse model.
The aim is to use IHC to investigate the distribution of ChAT, VAChT, and synaptophysin; to
compare/confirm IHC findings on cholinergic profiles with Western blot; and to evaluate the
changes in adult hippocampal neurogenesis with immature neuron markers DCX, HuB/D, and
PCNA. Although ChAT staining was slightly higher in the hippocampus and cortex of the 12
month-old GBA1 D427V mice, VAChT staining was significantly reduced. The number of
cholinergic neurons in the basal forebrain was not different but upregulation of ChAT level and
ectopic fibre sprouting was observed. In the DG, 12 month-old GBA1 D427V mice had higher
density of DCX-positive neurons. Furthermore, cells double-positive for DCX and HuB/D are
more common in human than in mouse.
This study confirmed the potential of HuB/D as a human-specific biomarker for healthy adult
hippocampal neurogenesis and also demonstrated differential regulation of VAChT and ChAT in
different disease types that may have future diagnostic values.
3
Acknowledgments
I am very grateful to my supervisor Professor Paul Francis for the great advice and knowledge
(especially on cholinergic system and AD), encouragement, and patience throughout my PhD. I
would like to thank my supervisor Professor Clive Ballard for accepting me into this lab and giving
amazing inputs on my projects, transfer viva, and my thesis.
I would like to express my gratitude to the DPST scholarship and the IBO coordinators in the IPST
of Thai government for the invaluable education from undergraduate to PhD and stipend that
has saved my family many times; staffs of the Office of Educational Affairs Royal Thai Embassy
London who have been taking care of me; MRC Brain Bank including Sashika Selvakadunco for
providing brain sections and associated data which are essential to my projects.
I would like to thank my colleagues who have been closely involved in my research: Dr Emily
Clarke (nee Bell) for giving me an opportunity to work with her on D427V/WT GBA1 mouse
model; Dr David Howlett for his wisdom and advice on IHC, disease pathology, and image
analysis; and Carl Hobbs for his myriads of expertise in IHC and imaging.
I would like to express thanks to friends and colleagues of IoPPN for wonderful experiences of
my PhD and life in London; Dr Emily Clarke for being the amazing friend, role model, and GBA
expert that supports me this whole PhD; Hyunah Lee as the brilliant scientist who restores my
faith in adult hippocampal neurogenesis and anime appreciation and successfully commits to
the IPSC research that I had hoped to but could not achieve; Dr Elizabeth Mann for being a
radiant science friend and giving me rat brains for antibody testing; Dr Ariana Gatt for being an
encouraging neurogenesis scientist comrade with fly and mitochondria power; Thamir Eid for
motivation and support to learn more about synapses and statistics; Sotiris Kakanos for
bestowing the title of Bookage (ˈbʊkɑːʒ/bʊˈkɑːʒ) and igniting my interest in programming; Dr
David Whitfield for his knowledge with the western blot and statistics; Dr Edward Fletcher for
lunch time crosswords and old-school gaming discussion; Dr Elin Vinsland for being the first user
of my bin-dividing Imagej macro; Dr Priya Ghumatkar and Dr Hilda Ferrero for the enjoyable
science discussions during their collaboration with our group; Dr Martin Broadstock for insightful
advice in research; Dr Supanida Hongpoonsup for inspiring my interest in machine learning; Dr
Alyma Somani for her experience and thesis on AHN; Dr Nickolai Vysokov for demonstration of
advanced ImageJ macros; Tatum Cummins; Dr Olivia Duncan; Dr Emine Cigdem Gelegen; Yazead
Buhidma; Mai Alwesmi; Dr Bright Okine; Connor Horton; Mihail Dimitrov and other friends here
at WCARD or IoPPN.
I would like to express my thanks to Thai friends and supporters: Kannaporn Kusolsri and Karun
Saengdaeng the landlady and landlord of my house and the owners of Nang Thai restaurant who
have been taking care of me for 4 years in London; Dr Thanapong Intharah for inspiration and
lessons/advice on programming despite my lack of experience and for many enjoyable board
game/random times; Dr Nopparat Suthprasertporn for the kind encouragements that bring
forth my determination and happiness; Thanida Punyavorakunchai for being the wonderful
mentor-surpassing protégé who also told me about ImageJ ROI manager; Keawalee Meesang
for being the best housemate; Akkapon Wongkoblap, Dr Akara Supratak and Jenjira Jaimunk for
giving me the programming and fun hang out times; Nat Na-Ek for bringing me to the wonderful
career fair and many enjoyable dinner and karaoke events; Dr Nicha Puangmalai for introducing
me to the WCARD and Ballard group; Dr Arbthip Suwaluk for being a cool fellow GABAergic

4 enthusiast; Veerawut Veerapongchai for being a cheerful and passionate student; Jate
Ratanachina for introducing me to R and machine learning; and all of my other Thai friends.
I also would like to thank Professor Martin Gulliford for considerable advice on statistics of this
thesis; Professor Sandrine Thuret (IoPPN) for the insightful discussions on adult hippocampal
neurogenesis and inviting me to her lab meeting; Professor Steve Gentleman (Imperial College
London) and Professor Claudio Cuello (McGill University) for insightful feedback and advice on
cholinergic study; Professor Cheryl Hawkes (Open University) for sharing the methods and
discussions on co-staining of cholinergic markers and Aβ.
I would like to express my gratitude to Professor Wipawan Thangnipon my previous supervisor
at Mahidol University; Professor Paola Arlotta my supervisor during my undergraduate study;
and Dr Simona Lodato my mentor during my internship in Arlotta lab. My journey in science
would not be possible without their teachings, supports, and generosity in giving me research
opportunities and forgiving my mistakes.
Lastly, I would like to thank my mom for everything she has done for me.
5
List of Abbreviations
sec second
min minute
hr hour
mo month-old
5-HT 5-Hydroxytryptamine, serotonin
5-HTR 5-Hydroxytryptamine receptor
Aβ Amyloid-β
ACh Acetylcholine
AChE Acetylcholinesterase
AChR Acetylcholine receptor
AD Alzheimer’s disease
AGD Argyrophilic grain diseases
AHN Adult hippocampal neurogenesis
AICD APP intracellular domain
AMIGO2 Adhesion molecule with Ig-like domain 2
APOE Apolipoprotein E
APP Amyloid Precursor Protein
Arl8 Arf-like GTPase 8
BA Brodmann area
BDNF Brain-derived neurotrophic factor
BDR Brains for dementia research
BMP Bone morphogenetic protein
BrdU Bromodeoxyuridine
BSA Bovine serum albumin
BuChE Butyrylcholinesterase
6 CA Cornu Ammonis
CBD Corticobasal degeneration
CDR Clinical dementia rating
CERAD Consortium to Establish a Registry for Alzheimer’s Disease
ChAT Choline acetyltransferase
ChEI Cholinesterase inhibitor
CHT1 High-affinity choline transporter 1
CNS Central nervous system
CR Calretinin
DAT Dopamine transporter
DB Diagonal band of Broca
DBS Deep brain stimulation
DCX Doublecortin
dE9 deletion of exon 9 on PSEN1 gene
DG Dentate gyrus
DLB Dementia with Lewy bodies
DMN Default mode network
DnP DCX-positive cells with no PCNA
DP DCX-positive cells with PCNA
EC Entorhinal cortex
EEG Electroencephalogram
EMM Estimated marginal mean
EOAD Early-onset Alzheimer’s disease
EPO Erythropoietin
EPOR Erythropoietin receptor
FAD Familial Alzheimer’s disease
FDA Food and drug administration
FDG-PET Fluorodeoxyglucose positron emission tomography
7 FDR False discovery rate
FEOBV Fluoroethoxybenzovesamicol
fMRI functional magnetic resonance imaging
FTLD Frontotemporal lobar degeneration
GABA γ-Aminobutyric acid
GAD Glutamate decarboxylase
GCase Glucocerebrosidase
GCL Granule cell layer
GD Gaucher’s disease
GFAP Glial fibrillary acidic protein
GlcCer Glucosylceramide
GlcSph Glucosylsphingosine
GSK GlaxoSmithKline
HDB Horizontal limbs of the diagonal band of Broca
HMW High molecular weight
HnP HuB/D-positive cells with no PCNA
HP HuB/D-positive cells with PCNA
HPA Hypothalamic-pituitary-adrenal
HuB/C/D Human neuronal proteins B/C/D
IGF Insulin-like growth factor
IML Inner molecular layer
IMS Industrial methylated spirits
KCC2 K+-Cl- (potassium-chloride) cotransporter 2
LAMP Lysosomal-associated membrane protein
LC Locus coeruleus
LEC Lateral entorhinal cortex
LOAD Late-onset Alzheimer’s disease
LTP Long-term potentiation
8 mAChR Muscarinic acetylcholine receptor
MAP Microtubule-associated protein
MAPK Mitogen-activated protein kinase
MCI Mild cognitive impairment
MCPO Magnocellular preoptic nucleus
MCtx Motor cortex
MEC Medial entorhinal cortex
ML Molecular layer
MMSE Mini mental state examination
MRI Magnetic resonance imaging
MS Medial septum
Msi-1 Musashi-1
MWM Morris water maze
nAChR Nicotinic acetylcholine receptor
nbM/SI Nucleus basalis of Meynert / Substantia innominate
NegBin Negative binomial regression model
NeuN Neuronal nuclei
NeuroD Neurogenic differentiation
NFT Neurofibrillary tangles
NGF Nerve growth factor
NIA-AA The National Institute on Aging and the Alzheimer’s Association
NKCC1 Na+-K+-2Cl- (sodium-potassium-chloride) cotransporter 1
NMDA N-methyl-D-aspartate
NPC Neural precursor / progenitor cells
NPY Neuropeptide-Y
NREM Non-rapid eye movement
NSC Neural stem cells
OML Outer molecular layer
9 NTR Neurotrophin receptor
PBS Phosphate-buffered saline
PCNA Proliferating cell nuclear antigen
PD Parkinson’s disease
PDD Parkinson’s disease with dementia
PET Positron emission topography
PHF Paired helical filaments
PLV Presynaptic lysosome-like vesicle
PMI Postmortem interval
PRH Perirhinal cortex
Prox1 Prospero homeo box protein 1
PS1 Presenilin-1
PS2 Presenilin-2
PSA-NCAM Polysialylated neural cell adhesion molecule
PSP Progressive nuclear palsy
PV Parvalbumin
RE1/NRSE Repressor element 1/Neuron-restrictive silencer element
REM Rapid eye movement
REST/NRSF RE1-silencing transcription factor/neuron-restrictive silencer factor
RMS Rostral migratory stream
ROI Region of interest
SATB1 special AT-rich sequence-binding protein-1
SDS Sodium dodecyl sulphate
SEM Standard error of the mean
SGZ Subgranular zone
SNpc Substantia nigra pars compacta
Sox2 Sex-determining region Y -box 2
SPP Synaptophysin
10 SSRI Selective serotonin reuptake inhibitors
SST Somatostatin
SuM Supramammillary nucleus
Swe Swedish mutation on APP
TBS Tris-buffered saline
TDO Tryptophan 2,3-dioxygenase
Tg Transgenic
TRE Transentorhinal
Trk Tropomyosin receptor kinase
uniGLM Univariate general linear model
VAChT Vesicular acetylcholine transporter
VDB Vertical limbs of the diagonal band of Broca
VEGF Vascular endothelial growth factor
VGluT Vesicular glutamate transporter
VMAT2 Vesicular monoamine transporter 2
VP Ventral pallidum
VTA Ventral tegmental area
WT Wild type
xD cells exclusively positive for DCX
xH cells exclusively positive for HuB/D
xPH cells exclusively positive for PCNA and HuB/D
xHD cells exclusively positive for HuB/D and DCX
xPD cells exclusively positive for PCNA and DCX
xPHD cells exclusively positive for PCNA, HuB/D, and DCX
11
List of Tables
Table 1.1 – Cell types in the DG ................................................................................................................. 33
Table 1.2 – Biomarker profiles combined with syndromal cognitive staging ............................................ 52
Table 1.3 – Four brain regions stained with AT8 for Braak stage assessment ........................................... 55
Table 1.4 – Percentage of cases with Aβ deposition in each listed region at a given phase ..................... 58
Table 1.5 – Braak stages for anatomical distribution of Lewy bodies in the progression of PD ................ 59
Table 1.6 – List of some notable mutations and polymorphisms that cause AD or increases the risk of the
disease ........................................................................................................................................................ 64
Table 1.7 – Information on selected antibody candidates for clinical purposes ........................................ 78
Table 1.8 – Information on selected tau immunisation therapy candidates for clinical purposes ............ 79
Table 1.9 – Alterations in AHN in AD studies (i) ......................................................................................... 97
Table 1.9 – Alterations in AHN in AD studies (ii) ........................................................................................ 98
Table 1.10 – Changes in AHN in AD mouse models (i) ............................................................................... 99
Table 1.10 – Changes in AHN in AD mouse models (ii) ............................................................................ 100
Table 2.1 – List of antibodies and staining reagents used for IHC ........................................................... 105
Table 2.2 – List of antibodies and staining reagents used for Western blotting ...................................... 107
Table 3.1 – Clinical and demographic data of the pilot cases .................................................................. 110
Table 3.2 – Summary of covariates .......................................................................................................... 110
Table 3.3 – Comparisons between p-values of covariate predictive ability in a model by dementia status
and p-values of covariate correlations. .................................................................................................... 117
Table 3.4 – η2 and effect size from group statistics, and minimum sample size required for 80% power in
the future study ....................................................................................................................................... 118
Table 3.5 – Correlation coefficients and minimum sample size required for 80% power in the future
study ......................................................................................................................................................... 119
Table 4.1 – List of cases in this main cohort ............................................................................................. 135
Table 4.2 – Potential covariates for analyses of the main study cohort .................................................. 136
Table 4.3 – Cell types of interest represented by different combinations of markers and 6 basis groups
.................................................................................................................................................................. 139
Table 4.4 – Examples of significant correlations between selected covariates and variables of interest 140
Table 5.1 – List of D427V/WT GBA1 mice and their WT/WT littermates according to age at death ....... 154
Table A.1 – Mean and SEM of each marker by Braak stage in the pilot study ......................................... 241
Table A.2 – Brain bank ID and other information of the main cohort cases ............................................ 242
12 Table A.3 – Data on cholinergic markers of the main cohort cases ......................................................... 243
Table A.4 – Data on neurogenic markers of the main cohort cases ........................................................ 244
Table A.5 – Adjusted means of markers across CERAD NP scores ........................................................... 245
Table A.6 – Correlation between cholinergic and AHN markers .............................................................. 245
Table A.7 – ImageJ macro used for cholinergic quantification in GBA1 mice (i) ...................................... 247
Table A.7 – ImageJ macro used for cholinergic quantification in GBA1 mice (ii) ..................................... 248
Table A.7 – ImageJ macro used for cholinergic quantification in GBA1 mice (iii) .................................... 249
Table A.7 – ImageJ macro used for cholinergic quantification in GBA1 mice (iv) .................................... 250
Table A.8 – ImageJ macro for division of a polygonal selection into bins of equal thickness (i) .............. 251
Table A.8 – ImageJ macro for division of a polygonal selection into bins of equal thicness (ii) .............. 252
Table A.8 – ImageJ macro for division of a polygonal selection into bins of equal thickness (iii) ............ 253
Table A.9 – Permission to reuse a published figure for Figure 1.2 ........................................................... 254
Table A.10 – Permission to reuse a published figure for Figure 1.3 ......................................................... 255
Table A.11 – Permission to reuse a published figure for Figure 1.5 ......................................................... 256
Table A.12 – Permission to reuse a published figure for Figure 1.6 ......................................................... 257
Table A.13 – Permission to reuse a published figure for Figure 1.10 ....................................................... 258
Table A.14 – Approval letter for the main cohort tissue request (TRID 213) ........................................... 259
List of Figures
Figure 1.1 – Structure of the basal forebrain in human ............................................................................. 20
Figure 1.2 – Schematic of BFCN projections in the mouse brain ............................................................... 21
Figure 1.3 – Schematic for VAChT and ChAT transcription from the cholinergic locus ............................. 24
Figure 1.4 – A schematic of rodent hippocampal circuitry ........................................................................ 32
Figure 1.5 – Schematics of connectivity and functional inputs/outputs of the DG ................................... 40
Figure 1.6 – Comparison of hippocampal anatomy between human and mouse ..................................... 41
Figure 1.7 – A graph showing approximate tau pathology severity in different hippocampal regions ..... 56
Figure 1.8 – Characteristics of AD mouse models ...................................................................................... 69
Figure 1.9 – Overview of the adult hippocampal neurogenesis and markers of the DGCs........................ 82
Figure 1.10 – Potential mechanisms of how adult neurogenesis in the DG improves pattern separation 86
13 Figure 3.1 – IHC of cholinergic and synaptic markers in the DG of pilot cases ........................................ 113
Figure 3.2 – IHC of cholinergic and synaptic markers in the DG of pilot cases ........................................ 114
Figure 3.3 – IHC of neurogenic markers in the hippocampus of pilot cases ............................................ 115
Figure 3.4 – Overlap between HuC/D, HuB/D, and DCX .......................................................................... 120
Figure 3.5 – Validation of goat anti-DCX antibody sc-8066 ...................................................................... 122
Figure 3.6 – Antibody stripping was effective in removing cholinergic and Aβ staining.......................... 124
Figure 3.7 – Antibody stripping has not been optimised for intense pathology staining ........................ 125
Figure 3.8 – VAChT and ChAT as target candidates for the main study ................................................... 126
Figure 3.9 – Additional profiles of immature neurons with staining of NKCC1, KCC2, and Calretinin after
antibody stripping (i) ................................................................................................................................ 128
Figure 3.10 – Additional profiles of immature neurons with staining of NKCC1, KCC2, and Calretinin (ii)
.................................................................................................................................................................. 129
Figure 4.1 – Quantification of cholinergic axons in the DG ...................................................................... 138
Figure 4.2 – Representative images of cholinergic markers in the DG .................................................... 142
Figure 4.3 – Cholinergic changes across Braak stages.............................................................................. 143
Figure 4.4 – Representative images of the 6 basis cell groups ................................................................ 144
Figure 4.5 – Changes in HuB/D- or DCX-positive neurogenic populations across Braak stages............... 145
Figure 4.6 – Significant correlation between cholinergic and neurogenic markers ................................. 147
Figure 4.7 –Phosphorylated tau in the DG ............................................................................................... 148
Figure 5.1 – Image analysis steps for cholinergic axon quantification ..................................................... 157
Figure 5.2 – Representative images of SPP, VAChT, ChAT in the DG of GBA1 WT/WT mice ................... 160
Figure 5.3 – Representative images of SPP, VAChT, ChAT in the DG of GBA1 D427V/WT mice .............. 161
Figure 5.4 – Reduced VAChT and elevated ChAT in the DG of 12-month-old D427V/WT GBA1 mice .... 162
Figure 5.5 – Representative images of SPP, VAChT, ChAT in the MCtx of GBA1 WT/WT mice ............... 163
Figure 5.6 – Representative images of SPP, VAChT, ChAT in the MCtx of GBA1 D427V/WT mice .......... 164
Figure 5.7 – Reduction of VAChT in the MCtx of 12-month-old D427V/WT GBA1 mice ......................... 165
Figure 5.8 –Western blots of cholinergic synapse-related proteins in the hippocampus........................ 167
Figure 5.9 – Western blots of cholinergic synapse-related proteins in the cortex. ................................. 168
Figure 5.10 – Representative images of VAChT and CHAT in the VDB/HDB ............................................ 170
Figure 5.11 – Immunoreactivity of cholinergic markers and neurite density in the VDB/HDB ................ 171
Figure 5.12 – Abnormal adult hippocampal neurogenesis in the D427V/WT GBA1 mice ....................... 173
14 Figure 6.1 – Representative images of SPP, VAChT, ChAT in the DG of WT and 5XFAD mice ................. 182
Figure 6.2 – Cholinergic axons in the DG of 11-mo 5XFAD ...................................................................... 183
Figure 6.3 – Representative images of SPP, VAChT, ChAT in the somatosensory cortex of WT and 5XFAD
mice .......................................................................................................................................................... 184
Figure 6.4 – Cholinergic axons in the somatosensory cortex of 11-mo 5XFAD ........................................ 185
Figure 6.5 – Representative images of VAChT and ChAT in the VDB/HDB .............................................. 186
Figure 6.6 – Immunoreactivity of cholinergic markers and neurite density in the VDB/HDB .................. 187
Figure 6.7 – Adult hippocampal neurogenesis in 5XFAD mice ................................................................. 188
Figure A.1 – Morris Water Maze and Y-maze in D427V/WT GBA1 mice. ................................................ 246
Figure A.2 – Altered hippocampal gene expression in D427V/WT mice .................................................. 246

15
Table of Contents
1 Introduction ................................................................................................................ 20
1.1 Cholinergic basal forebrain system ......................................................................... 20
1.1.1 Background ...................................................................................................................... 20
1.1.2 Cholinergic neurons ......................................................................................................... 21
1.1.2.1 The structure of cholinergic synaptic terminals ........................................................ 22
1.1.2.2 Cholinergic locus: VAChT and ChAT .......................................................................... 23
1.1.2.3 CHT High-affinity Choline transporter ....................................................................... 25
1.1.2.4 Acetylcholine receptors ............................................................................................. 25
1.1.2.5 Acetylcholinesterase ................................................................................................. 26
1.1.3 Other types of neurons in the basal forebrain ................................................................. 27
1.1.3.1 GABAergic neurons ................................................................................................... 27
1.1.3.2 Glutamatergic neurons ............................................................................................. 27
1.1.3.3 Monoaminergic neurons ........................................................................................... 28
1.1.4 Cognitive functions of the basal forebrain and cholinergic signalling ............................. 28
1.1.4.1 Hippocampus-associated memory ............................................................................ 28
1.1.4.2 Wakefulness .............................................................................................................. 29
1.1.4.3 Attention and reward ................................................................................................ 30
1.2 The Hippocampus .................................................................................................. 31
1.2.1 Anatomy and historical backgrounds............................................................................... 31
1.2.2 Dentate gyrus ................................................................................................................... 33
1.2.2.1 Local cell types and architectures ............................................................................. 33
1.2.2.2 Functions ................................................................................................................... 34
1.2.3 CA3 ................................................................................................................................... 35
1.2.3.1 Local cell types and architectures ............................................................................. 35
1.2.3.2 Functions ................................................................................................................... 35
1.2.4 CA2 ................................................................................................................................... 36
1.2.4.1 Local cell types and architectures ............................................................................. 36
1.2.4.2 Functions ................................................................................................................... 36
1.2.5 CA1 ................................................................................................................................... 36
1.2.5.1 Local cell types and architectures ............................................................................. 36
1.2.5.2 Functions ................................................................................................................... 37
1.2.6 Distant projection from other brain regions .................................................................... 37
1.2.6.1 Glutamatergic innervation ........................................................................................ 37
1.2.6.2 GABAergic innervation .............................................................................................. 38
1.2.6.3 Cholinergic innervation ............................................................................................. 38
1.2.6.4 Dopaminergic and noradrenergic innervation .......................................................... 39
1.2.6.5 Serotonergic innervation ........................................................................................... 39
16
1.2.7 Comparative hippocampal features between human and mouse .................................. 40
1.3 Dementia ............................................................................................................... 42
1.3.1 Background and epidemiology ........................................................................................ 42
1.3.2 Symptoms ........................................................................................................................ 43
1.3.2.1 AD overview .............................................................................................................. 43
1.3.2.2 Mild cognitive impairment (MCI) overview ............................................................... 43
1.3.2.3 DLB and PDD overview .............................................................................................. 44
1.3.3 Cognitive and behavioural tests ....................................................................................... 44
1.3.3.1 CDR ............................................................................................................................ 45
1.3.3.2 MMSE ........................................................................................................................ 45
1.3.3.3 ADAS-Cog .................................................................................................................. 45
1.3.3.4 NPI ............................................................................................................................. 45
1.3.3.5 Differential cognitive diagnostic tests ....................................................................... 46
1.3.4 In vivo Biomarkers and imaging ....................................................................................... 46
1.3.4.1 Brain structural imaging ........................................................................................... 46
1.3.4.2 Radiolabelled ligands neuroimaging with PET and SPECT ........................................ 47
1.3.4.3 Functional brain imaging: FDG-PET, 99mTc-HMPAO SPECT, and fMRI ....................... 49
1.3.4.4 Cerebrospinal fluid and blood-based biomarkers ..................................................... 50
1.3.5 Pathology ......................................................................................................................... 52
1.3.5.1 Tau ............................................................................................................................ 53
1.3.5.2 Aβ .............................................................................................................................. 57
1.3.5.3 α-synuclein ................................................................................................................ 59
1.3.5.4 Mixed pathologies ..................................................................................................... 61
1.3.6 Genetic risk factors .......................................................................................................... 62
1.3.6.1 Familial AD (FAD) and early onset AD (EOAD) .......................................................... 63
1.3.6.2 Late-onset AD (LOAD) ............................................................................................... 65
1.3.6.3 LOAD – others ........................................................................................................... 66
1.3.6.4 DLB/PDD.................................................................................................................... 66
1.3.6.5 Transgenic mouse models ......................................................................................... 68
1.3.7 Cholinergic deficits in dementia ....................................................................................... 69
1.3.7.1 Alzheimer’s disease ................................................................................................... 69
1.3.7.2 Lewy body dementia ................................................................................................. 71
1.3.8 Abnormalities in other neurotransmitter systems .......................................................... 72
1.3.8.1 Glutamatergic system ............................................................................................... 72
1.3.8.2 GABAergic system ..................................................................................................... 72
1.3.8.3 Monoaminergic systems ........................................................................................... 73
1.3.9 Therapeutic options in dementia ..................................................................................... 74
1.3.9.1 Cholinesterase inhibitors ........................................................................................... 74
1.1.9.2 NMDAR antagonists .................................................................................................. 75
1.1.9.3 Antidepressants/SSRI ................................................................................................ 75
1.1.9.4 Disease-modifying approaches ................................................................................. 76
1.1.9.5 Antibodies and anti-aggregation drugs .................................................................... 78
17
1.4 Adult Hippocampal Neurogenesis ........................................................................... 80
1.4.1 Background ...................................................................................................................... 80
1.4.2 Adult neurogenesis in the hippocampus ......................................................................... 81
1.4.3 Adult neurogenesis in the subventricular zone ............................................................... 83
1.4.4 Neurogenic markers ......................................................................................................... 84
1.4.4.1 Proliferative markers................................................................................................. 84
1.4.4.2 Doublecortin .............................................................................................................. 84
1.4.4.3 Hu .............................................................................................................................. 84
1.4.4.4 NeuroD and Prox1 ..................................................................................................... 85
1.4.4.5 Calretinin ................................................................................................................... 85
1.4.4.6 GABA signalling-associated transporters: NKCC1 and KCC2 ..................................... 85
1.4.5 Functional roles of the DG granule neurons .................................................................... 86
1.4.5.1 The roles of DGC in a computational model of pattern separation .......................... 86
1.4.5.2 Functional characteristics of the DGCs...................................................................... 87
1.4.6 Effects of neurotransmitters and signalling peptides on adult hippocampal neurogenesis 88
1.4.6.1 Cholinergic inputs ...................................................................................................... 88
1.4.6.2 Glutamatergic inputs ................................................................................................ 88
1.4.6.3 GABAergic inputs ...................................................................................................... 89
1.4.6.3 Dopaminergic and noradrenergic inputs .................................................................. 89
1.4.6.4 Serotonergic inputs ................................................................................................... 90
1.4.6.5 Brain-derived neurotrophic factor (BDNF) ................................................................ 91
1.4.6.6 Nerve Growth Factor ................................................................................................. 92
1.4.7 Factors affecting adult hippocampal neurogenesis ......................................................... 92
1.4.7.1 Aging ......................................................................................................................... 92
1.4.7.2 Physical exercise ........................................................................................................ 93
1.4.7.3 Vascular system ........................................................................................................ 94
1.4.7.4 AD and associated factors......................................................................................... 95
1.4.7.4 Dementia and neurogenesis ................................................................................... 101
1.5 Hypotheses and Aims ........................................................................................... 101
1.5.1 Overarching Hypothesis ................................................................................................. 101
1.5.2 Human AD study: hypothesis and aims ......................................................................... 101
1.5.3 D427V/WT GBA1 mice study: hypothesis and aims ....................................................... 102
1.5.4 5XFAD mice study: hypothesis and aims........................................................................ 103
2 Materials and methods ............................................................................................ 104
2.1 Immunohistochemistry (IHC) ................................................................................ 104
2.2 Western blotting .................................................................................................. 106
3 Contribution of cholinergic innervation to adult hippocampal neurogenesis in
Alzheimer’s disease patients: Pilot cases .......................................................................... 108
3.1 Background .......................................................................................................... 108
18
3.2 Materials and Methods ........................................................................................ 109
3.2.1 Pilot human cohort and data management ................................................................... 109
3.2.2 Immunohistochemistry .................................................................................................. 110
3.2.3 Quantification ................................................................................................................ 111
3.2.4 Statistical analyses ......................................................................................................... 111
3.3 Results ................................................................................................................. 112
3.3.1 Changes in cholinergic and neurogenic markers between control and dementia ........ 112
3.3.2 Modelling data with covariates: screening with Pearson/Spearman correlation.......... 116
3.3.3 Power calculation and sample size estimation .............................................................. 117
3.3.4 Development of staining protocols for the main study ................................................. 119
3.4 Discussion ............................................................................................................ 130
4 Contribution of cholinergic innervation to adult hippocampal neurogenesis in
Alzheimer’s disease patients: Main cohort ....................................................................... 133
4.1 Introduction ......................................................................................................... 133
4.2 Materials and Methods ........................................................................................ 134
4.2.1 Human cohort and data management ........................................................................... 134
4.2.2 Immunohistochemistry .................................................................................................. 137
4.2.3 Quantification ................................................................................................................ 137
4.2.4 Statistical Analyses ......................................................................................................... 139
4.3 Results ................................................................................................................. 141
4.4 Discussion ............................................................................................................ 149
5 Cholinergic degeneration and adult hippocampal neurogenesis in a mouse model for
Lewy body dementia ....................................................................................................... 152
5.1 Background .......................................................................................................... 152
5.1.1 D427V GBA1 mutation and the heterozygous mouse model ........................................ 153
5.2 Materials and Methods ........................................................................................ 154
5.2.1 Mouse cohorts ............................................................................................................... 154
5.2.2 Immunohistochemistry .................................................................................................. 155
5.2.2.1 Imaging methods ..................................................................................................... 155
5.2.2.2 Quantification methods .......................................................................................... 155
5.2.3 Western blotting ............................................................................................................ 158
5.2.4 Statistical analysis .......................................................................................................... 158
5.3 Results ................................................................................................................. 159
5.4 Discussion ............................................................................................................ 174
5.4.1 Result discussion ............................................................................................................ 174
5.4.2 Limitations and Future directions .................................................................................. 178
6 Cholinergic system and adult hippocampal neurogenesis in a mouse model of
Alzheimer’s disease, 5XFAD ............................................................................................. 180
19
6.1 Introduction ......................................................................................................... 180
6.2 Materials and Methods ........................................................................................ 181
6.2.2 Immunohistochemistry .................................................................................................. 181
6.2.2.1 Imaging methods ....................................................................................................... 181
6.2.2.2 Quantification methods ............................................................................................. 181
6.3 Results ................................................................................................................. 181
6.4 Discussions .......................................................................................................... 189
7 General Discussion ................................................................................................... 190
7.1 Summary of findings ............................................................................................ 190
7.2 Abnormal cholinergic innervation in AD cases and mouse models ......................... 191
7.3 Comparisons of adult hippocampal neurogenesis between human and mouse models
192
7.4 Potential effects of tau on AHN ............................................................................ 193
7.5 Possible contributions of cholinergic innervation to adult hippocampal neurogenesis
194
7.6 Strengths and Weaknesses ................................................................................... 195
7.7 Future studies ...................................................................................................... 197
8 Bibliography ............................................................................................................ 201
9 Appendix ................................................................................................................. 241
20
1 Introduction
1.1 Cholinergic basal forebrain system
1.1.1 Background
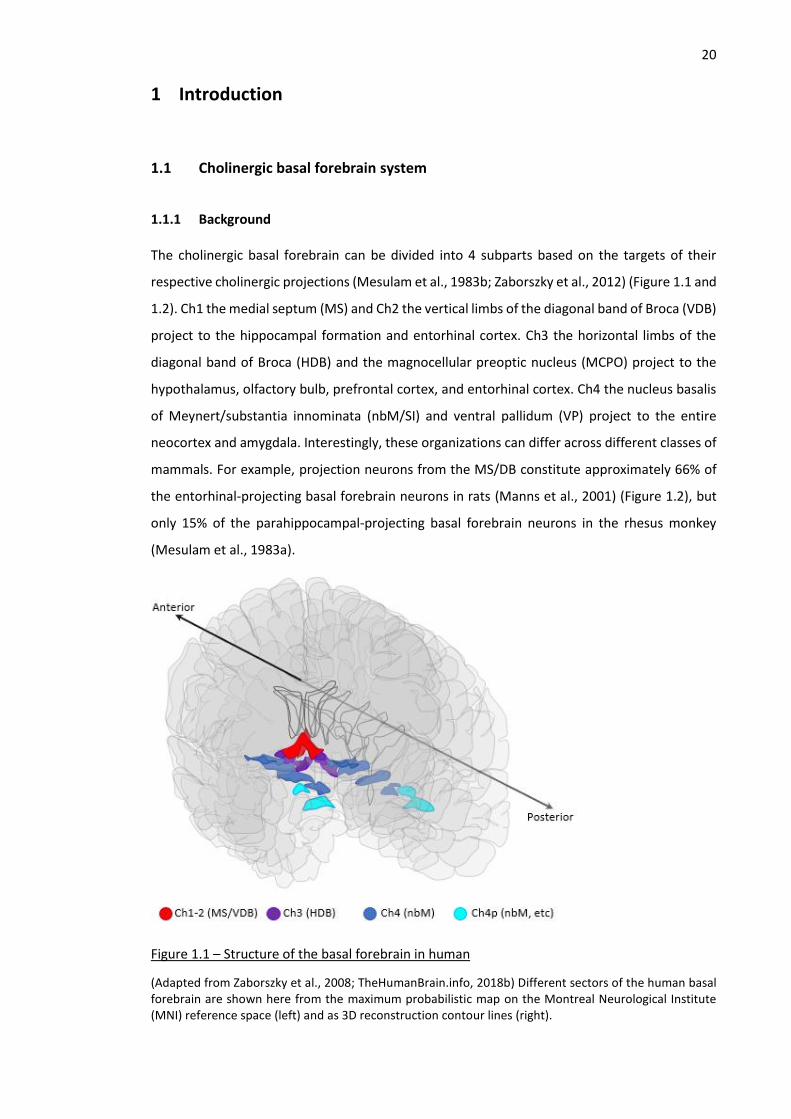
The cholinergic basal forebrain can be divided into 4 subparts based on the targets of their
respective cholinergic projections (Mesulam et al., 1983b; Zaborszky et al., 2012) (Figure 1.1 and
1.2). Ch1 the medial septum (MS) and Ch2 the vertical limbs of the diagonal band of Broca (VDB)
project to the hippocampal formation and entorhinal cortex. Ch3 the horizontal limbs of the
diagonal band of Broca (HDB) and the magnocellular preoptic nucleus (MCPO) project to the
hypothalamus, olfactory bulb, prefrontal cortex, and entorhinal cortex. Ch4 the nucleus basalis
of Meynert/substantia innominata (nbM/SI) and ventral pallidum (VP) project to the entire
neocortex and amygdala. Interestingly, these organizations can differ across different classes of
mammals. For example, projection neurons from the MS/DB constitute approximately 66% of
the entorhinal-projecting basal forebrain neurons in rats (Manns et al., 2001) (Figure 1.2), but
only 15% of the parahippocampal-projecting basal forebrain neurons in the rhesus monkey
(Mesulam et al., 1983a).
Figure 1.1 – Structure of the basal forebrain in human
(Adapted from Zaborszky et al., 2008; TheHumanBrain.info, 2018b) Different sectors of the human basal forebrain are shown here from the maximum probabilistic map on the Montreal Neurological Institute (MNI) reference space (left) and as 3D reconstruction contour lines (right).
21
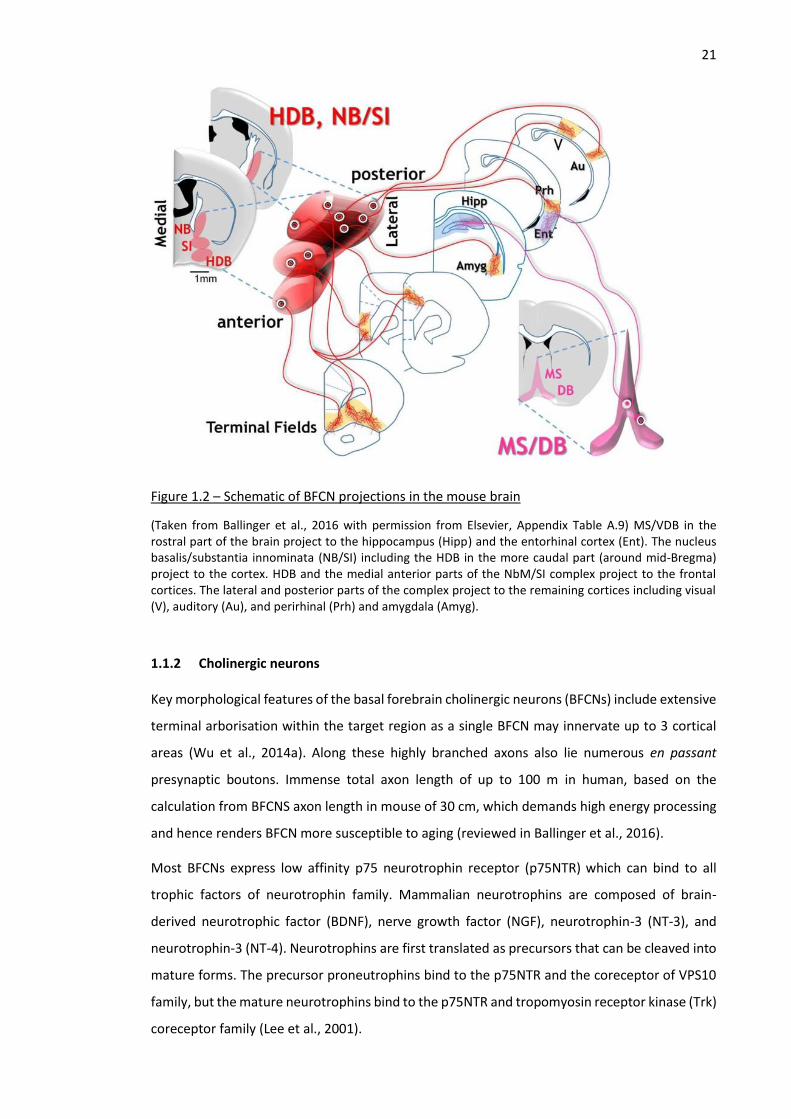
Figure 1.2 – Schematic of BFCN projections in the mouse brain
(Taken from Ballinger et al., 2016 with permission from Elsevier, Appendix Table A.9) MS/VDB in the rostral part of the brain project to the hippocampus (Hipp) and the entorhinal cortex (Ent). The nucleus basalis/substantia innominata (NB/SI) including the HDB in the more caudal part (around mid-Bregma) project to the cortex. HDB and the medial anterior parts of the NbM/SI complex project to the frontal cortices. The lateral and posterior parts of the complex project to the remaining cortices including visual (V), auditory (Au), and perirhinal (Prh) and amygdala (Amyg).
1.1.2 Cholinergic neurons
Key morphological features of the basal forebrain cholinergic neurons (BFCNs) include extensive
terminal arborisation within the target region as a single BFCN may innervate up to 3 cortical
areas (Wu et al., 2014a). Along these highly branched axons also lie numerous en passant
presynaptic boutons. Immense total axon length of up to 100 m in human, based on the
calculation from BFCNS axon length in mouse of 30 cm, which demands high energy processing
and hence renders BFCN more susceptible to aging (reviewed in Ballinger et al., 2016).
Most BFCNs express low affinity p75 neurotrophin receptor (p75NTR) which can bind to all
trophic factors of neurotrophin family. Mammalian neurotrophins are composed of brain-
derived neurotrophic factor (BDNF), nerve growth factor (NGF), neurotrophin-3 (NT-3), and
neurotrophin-3 (NT-4). Neurotrophins are first translated as precursors that can be cleaved into
mature forms. The precursor proneutrophins bind to the p75NTR and the coreceptor of VPS10
family, but the mature neurotrophins bind to the p75NTR and tropomyosin receptor kinase (Trk)
coreceptor family (Lee et al., 2001).
22 However, some BFCNs do not express p75NTR. Some subtypes of p75NTR-negative BFCNs also
express VGluT3, which transports glutamate into a synaptic vesicle and likely implies corelease
of acetylcholine and glutamate in these subpopulations (Yang et al., 2017). Only few BFCNs
express both VGluT3 and p75NTR (Nickerson Poulin et al., 2006). The majority of VGluT3-positive
BFCNs are in the Ch4 (nbM/SI, VP) and the rest are in the Ch3 (HDB, MCPO). Most VGluT3-
positive BFCNs especially in the Ch4 project to the basolateral amygdala. While VGluT3 enables
corelease of acetylcholine and glutamate by striatal fast-spiking interneurons (Nelson et al.,
2014), almost all VGluT3-positive BFCNs of the HDB innervate and co-transmit acetylcholine and
GABA to glomerulus-projecting GABAergic interneurons in the olfactory bulb (Case et al., 2017).
Acetylcholine (ACh) was one of the first neurotransmitters identified. Its synthesis from acetyl-
CoA and choline is catalysed by choline-acetyltransferase (ChAT) in the cytoplasm (Jones et al.,
2012). ACh is then transported into a synaptic vesicle by vesicular acetylcholine transporter
(VAChT) (reviewed in Prado et al., 2013). Upon depolarisation, ACh is released from a synaptic
bouton. ACh then can bind to either nAChRs or mAChRs before it is degraded by
acetylcholinesterase (AChE) into acetate and choline. Choline is transported back into a
presynaptic axon by high-affinity choline transporter (CHT1) and subsequently converted to ACh
by ChAT. The proteins ChAT, VAChT and CHT1 provide specific targets for identification of
cholinergic neurons. The catabolic enzyme AChE is produced mostly by both cholinergic neurons
and cholinoceptive cells. Understanding of the components in cholinergic synapses has allowed
the visualisation of cholinergic neurons and their processes. For example, BFCNs have been
identified using immunohistochemistry against ChAT and p75NTR, while cholinergic axons and
processes have been stained for VAChT, CHT1, and AChE. Early study focused on cholinergic
axons using histochemistry for AChE (Mesulam et al., 1983a)
1.1.2.1 The structure of cholinergic synaptic terminals
There are 2 modes of ACh signalling from cholinergic terminals: either a traditional synaptic
specialization or non-synaptic volume transmission. At the beginning, it was speculated that
volume transmission was the major mode of ACh transmission since several studies found low
density of synaptic specialization on cholinergic terminals in the rat parietal cortex (14% overall,
21% in the layer V) and monkey prefrontal cortex (40%) (Umbriaco et al., 1994; Mrzljak et al.,
1995), inconsistency between fluctuations of ACh level and local clearance pattern (reviewed in
Picciotto et al., 2012) and relatively distant locations of terminals and receptors. In contrast, a
later study on the rat parietal cortex specifically in the layer V (Turrini et al., 2001) showed 66%
synaptic specialization incidence from VAChT-positive cholinergic terminals, which was lower
than the 92% incidence from total unlabelled terminals but still much higher than which were
reported in previous literatures. A study in the human temporal cortex also revealed high
23 synaptic incidence from ChAT-positive varicosities of 67% (Smiley et al., 1997). Nonetheless,
most studies lent support to the notion that non-synaptic transmission still has significant
contribution. Furthermore, the local effects of non-synaptic ACh transmission can be regulated
by various factors including characteristics of the extracellular space around the terminals,
differential local concentration of AChE, and local density and subcellular compartmentalization
of the receptors (reviewed in Coppola et al., 2016). However, the concept of mixed synaptic and
non-synaptic cholinergic terminals was recently challenged by a discovery that all cholinergic
terminals in the hippocampus form synapses (Takács et al., 2018). Interestingly, without
immunogold labelling for neuroligin-2 and gephyrin, some of them would not have been
counted as synapses in older studies because of their thin postsynaptic densities and narrow
synaptic gap.
These incidences of synaptic specialization reported by electron microscopy studies likely
include synapse-like contacts between astrocyte and cholinergic terminals (Zhang et al., 2016).
Each of these synapse-like structures between cholinergic varicosities and astrocytes may be
directly connected to the synapse between that very same cholinergic terminal and a
postsynaptic structure of another neuron; this structure is referred to as a tripartite synapse.
Astrocyte-mediated cholinergic signalling phenomena have also been reported in ACh-induced
LTP at CA3-CA1 synapses (Navarrete et al., 2012) and ACh-induced dentate granule neuron
inhibition by mossy cells and hilar inhibitory interneurons (Pabst et al., 2016).
1.1.2.2 Cholinergic locus: VAChT and ChAT
Cholinergic locus refers the region with shared transcriptional regulatory regions and
juxtaposition of both VAChT and ChAT encoding genes. VAChT-encoding gene SLC18A3 is located
3' to the first shared untranslated exon of the locus namely the R-exon and 5' to the second (N-
exon) and third (M-exons) non-coding exons followed by the first coding exon of the ChAT gene.
Both VAChT and ChAT have various mRNA transcripts depending on a combination of 5' non-
coding exons and each transcript is usually named after the first 5' non-coding exon, which
contains the promoter, of that transcript (Figure 1.3) (Kengaku et al., 1993; Bejanin et al., 1994;
reviewed in Eiden, 1998). R-exon-containing VAChT transcripts are relatively rare in rat brain
and spinal cord and still have not been discovered in human (Hahm et al., 1997). Upstream to
the R-exon is a regulatory sequence RE1/NRSE which can recruit a silencing transcription factor
REST/NRSF to suppress VAChT and ChAT expression (De Gois et al., 2000). TrkA activation by
NGF upregulates cholinergic gene locus through the 2 AP-1 sites and cAMP response element
site upstream to the R-exon and produces 3.8 kb ChAT transcript and 3.0 kb VAChT transcript
(Berse et al., 1999).
24 VAChT is one of the Major Facilitator Superfamily transporters, which also include vesicular
monoamine transporter (VMAT) 1 and 2 (reviewed in Prado et al., 2013). Transporters of this
family use vesicular electrochemical proton gradient generated by V-ATPase to load
neurotransmitters into vesicles. Specifically, VAChT exchanges two luminal protons for one
cytoplasmic ACh molecule. VAChT has a dileucine motif in the C-terminal that facilitate clathrin-
dependent endocytosis. Phosphorylation at S480 regulates this dileucine-dependent
internalisation by shifting the localisation of VAChT from neurotransmitter rapid-releasing
synaptic vesicles toward slow-releasing large dense core vesicles (Krantz et al., 2000).
While all transcripts of ChAT in rat encode the same protein of 69 kDa, an M-transcript in human
has an extra start codon on M-exon and can also encode for an 82kDa ChAT protein (Misawa et
al., 1997). Subcellular localisation of the 82kDa ChAT has been shown to change during aging
and cognitive decline. In the basal forebrain, while the 69kDa ChAT is steadily decreased in
cognitively healthy aged and demented age individuals respectively, the cytoplasmic 82kDa
ChAT level is upregulated in normal aged individuals but drastically reduced in cognitively
impaired cases (Gill et al., 2007). In the claustrum, the 82kDa ChAT is absent in young adults,
abundant in the cell nucleus in aged individual, and significantly decreased again in demented
aged cases.
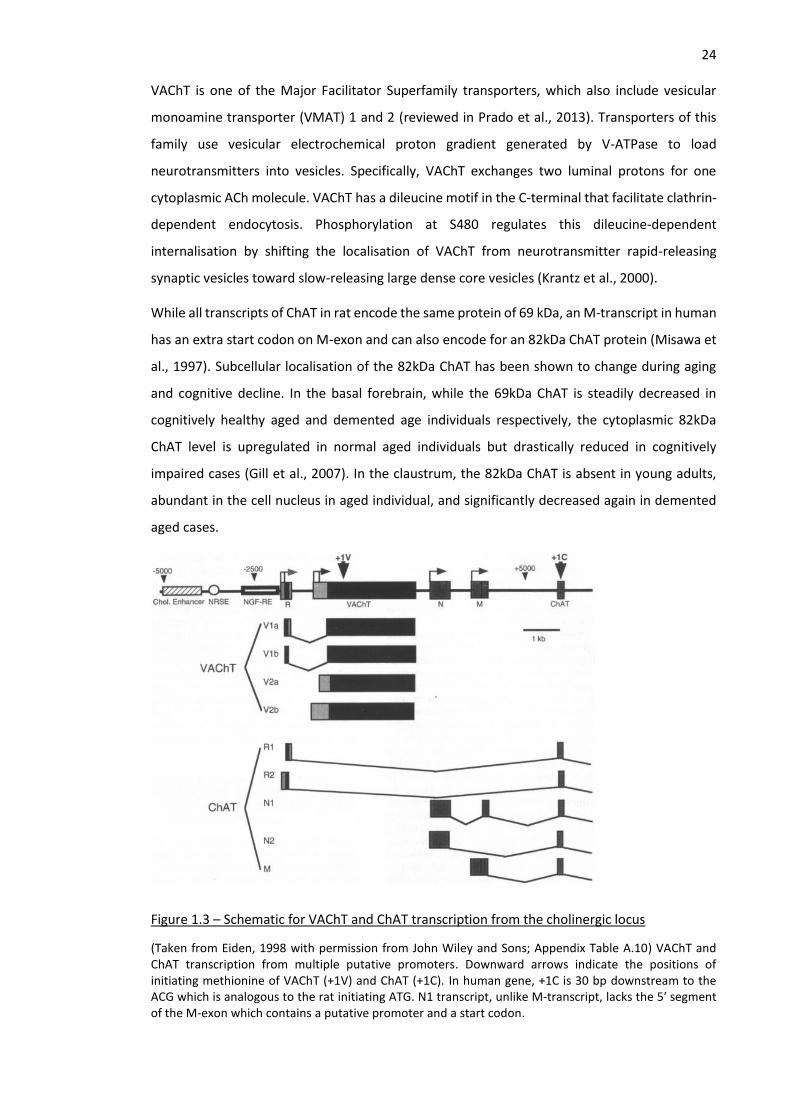
Figure 1.3 – Schematic for VAChT and ChAT transcription from the cholinergic locus
(Taken from Eiden, 1998 with permission from John Wiley and Sons; Appendix Table A.10) VAChT and ChAT transcription from multiple putative promoters. Downward arrows indicate the positions of initiating methionine of VAChT (+1V) and ChAT (+1C). In human gene, +1C is 30 bp downstream to the ACG which is analogous to the rat initiating ATG. N1 transcript, unlike M-transcript, lacks the 5ʹ segment of the M-exon which contains a putative promoter and a start codon.
25 1.1.2.3 CHT High-affinity Choline transporter
CHT1, encoded by the gene SLC5A7, is a transmembrane membrane sodium-dependent
transporter of choline. CHT1 is expressed as a single mRNA transcript of 5 kb. While it is
expressed at high level comparable to that of adult as early as E14 in the spinal cord during
mouse development, its expression in the septum is very low at E14 and steadily increases until
its peak at around P30 (Berse et al., 2005). Choline is an essential nutrient and important for
cognitive development (reviewed in Blusztajn et al., 2017). Therefore, choline needs to be
transported back to the presynaptic terminals for the production of ACh and this reuptake
process by CHT1 has been suggested to be a rate-limiting step of ACh synthesis (reviewed in
Kuhar and Murrin, 1978; Tucek, 1985). NGF also promotes expression of CHT1 and cholinergic
locus genes (VAChT/ChAT) through PI3K/Akt-dependent pathways (Berse et al., 2005).
Nonetheless, some factors may regulate CHT1 differently from cholinergic locus genes. For
example, higher level of cAMP decreases CHT1 mRNA expression but increases VAChT/ChAT
mRNA (Brock et al., 2007).
Similar to VAChT, CHT1 also has a C-terminal dileucine motif for clathrin-mediated endocytosis
(Ribeiro et al., 2005). However, there is an activity-dependent trafficking to the plasma
membrane for CHT1 but not VAChT (Ferguson et al., 2003). CHT1 and APP were found in Rab5-
positive endosome; and both presynaptic localisation and endocytic vesicular recycling of CHT1
required APP (Wang et al., 2007). Congruent with the finding that CHT1 was upregulated in AD
patients (Bissette et al., 1996), Rab5 gene expression in the BFCNs (Ginsberg et al., 2011) and
CA1 pyramidal neurons (Ginsberg et al., 2010) was also higher in MCI and AD patients. Activity-
dependent CHT1 plasma membrane trafficking induced by potassium pulse was also suppressed
by Aβ42 oligomers (Parikh et al., 2014).
1.1.2.4 Acetylcholine receptors
Acetylcholine receptors (AChR) can be classified into two types: muscarinic receptor (mAChR)
and nicotinic receptor (nAChR). The mAChR is a metabotropic receptor that, once it binds to the
ACh, activates heterotrimeric G protein to regulate potassium and calcium channels (reviewed
in Ballinger et al., 2016). The nAChR on the other hand is an ionotropic receptor that constitute
a non-selective cation channel. As their names suggest, the mAChR and nAChR are preferentially
sensitive to muscarine and nicotine respectively.
The mAChRs can be categorised into 2 main groups based on the types of G proteins in the
cascade: Gq/11 for M1, M3, and M5; and Gi/o for M2 and M4 (reviewed in Ballinger et al., 2016).
M1-mAChRs are generally expressed in the cell bodies and dendrites of both GABAergic
26 interneurons and glutamatergic pyramidal neurons and also in the axons of the DGCs (Martinello
et al., 2015). Activation of M1 mAChR usually increases cell excitability. M2-mAChRs, in contrast,
mainly have presynaptic inhibitory effects for decreasing the release of neurotransmitters such
as ACh or GABA.
There are multiple types of nAChR subunits: α2-10 and β2-4. In theory, the ion channel can be a
homomeric or heteromeric pentamer of these subunits in any order. Nonetheless, the α4β2-
and the α7-containing receptors are the most common in the brain. The α7-nAChRs have lower
affinity for an agonist but higher Ca2+ conductance than do the α4β2-nAChRs (Dani and Bertrand,
2007). The α7-nAChRs are potential targets for AD treatment because their expressions in
astrocytes are significantly elevated in AD patients (Teaktong et al., 2003; Teaktong et al., 2004)
and its binding to Aβ42 oligomer may induce glutamate release from the astrocytes and
consequently cause excitotoxicity (Talantova et al., 2013). Furthermore, there has been an
evidence of physiological interaction between the two proteins as monomeric Aβ42 can activate
α7-nAChR in the hippocampal presynaptic terminals to enhance glutamate release (Hascup and
Hascup, 2016). While the most common form of α7-containing nAChRs is the α7 homo-
pentameric nAChR, α7β2-nAChRs are expressed in the BFCNs (Liu et al., 2009) and in the
hippocampal CA1 GABAergic interneurons (Liu et al., 2012a) and have significantly higher affinity
to be inhibited by oligomeric Aβ42 than do the homopentameric α7-nAChRs.
1.1.2.5 Acetylcholinesterase
AChE is encoded by ACHE gene with multiple splicing combinations. The spliced form most
relevant to nervous functions is AChE-T, a subunit of tetrameric functional AChE. At a
neuromuscular junction, 2 AChE-T subunits are covalently linked to collagen Q (ColQ) by
disulphide bond and this ColQ-AChE unit together with a disulphide-linked homodimer AChE-T
form a functional AChE complex on the extracellular basal lamina (Noureddine et al., 2008). On
both pre- and post-synaptic membranes, all 4 AChE-T subunits are disulphide linked to a 20-kDa
transmembrane protein PRiMA (Perrier et al., 2002). Dimeric erythrocytic AChE or AChE-E is
anchored to phosphoinositol on the membrane of a mammalian red blood cell (Futerman et al.,
1985). Monomeric AChE-R is found during embryonic brain development (Muller et al., 1985)
and in some types of tumour cells such as glioblastoma (Karpel et al., 1996; Perry et al., 2004).
Furthermore, its expression can be upregulated during stress. AChE activity can be visualised by
enzyme histochemistry technique. Acetylthiocholine is hydrolysed by the AChE to produce
thiocholine and acetate. After thiocholine reduces hexacyanoferrate (III) to hexacyanoferrate
(II), the soluble hexacyanoferrate (II) reacts with Cu(II) ion to form Hatchett brown precipitate
(Karnovsky and Roots, 1964). This visualisation has been used to trace cholinergic innervation.
27
1.1.3 Other types of neurons in the basal forebrain
1.1.3.1 GABAergic neurons
GABAergic neurons in the basal forebrain are heterogeneous in terms of morphology and
functions. GAD67-GFP knock-in mice enable clearer visualization and identification of GABAergic
interneurons: most interneurons project locally but some of them are large projection neurons
(McKenna et al., 2013). Most of these projection neurons are fast-spiking parvalbumin (PV)-
positive and their highest density is in the MCPO. GABAergic projection neurons preferentially
innervate GABAergic interneurons of the projected region e.g. cortex or hippocampus McKenna
et al., 2013; Bao et al., 2017. Even in the same region of the basal forebrain, MS in this example,
a distinct subpopulation of GABAergic neurons may target a single subregion i.e. PV- and special
AT-rich sequence-binding protein-1 (SATB1)-positive Teevra cells in the MS selectively
innervating GABAergic interneurons of the CA3 (Joshi et al., 2017). In addition, while all
GABAergic projection neurons in the MS rhythmically fire action potential, their burst duration
and rhythmicity are diverse across different subpopulations. Teevra neurons exhibit short burst
duration but Komal neurons exhibit long burst duration. For the cortical projection, GABAergic
projection neurons can be categorized into 3 types based on specific markers. First, PV-positive
neurons have high firing rate and control cortical gamma oscillation. Second, voltage-gated
delayed-rectifier potassium channel (Kv2.2)-positive neurons comprise about 60% of GABAergic
projection neurons in the Ch3. Last, Neurokinin B receptor type 3 (NK3R)-positive neurons play
roles in the production of gonadotrophin-releasing hormone. Calbindin is also expressed in some
GABAergic projection neurons (Zaborszky et al., 2012).
GABAergic interneurons may express somatostatin (SST), neuropeptide-Y (NPY), neuronal nitric
oxide synthase, or calretinin (CR) and can be either wake or sleep active (Yang et al., 2017).
These neurons target local neurons in the basal forebrain or innervate neurons in a nearby
caudal brain region.
1.1.3.2 Glutamatergic neurons
Most glutamatergic neurons in the basal forebrain express VGluT2. Most VGluT2-positive
projection neurons innervate subcortical regions (Do et al., 2016). Nonetheless, a few of VGluT2-
positive neurons also express calbindin and target the cortex, while several others express
calretinin and project locally (Anaclet et al., 2015). Glutamatergic projection neurons of the basal
forebrain have been demonstrated to have diverse characteristics and functions. Cortically-
28 projecting VGluT2-positive neurons positively regulate wakefulness (Yang et al., 2017). A
subgroup of VGluT2-positive neurons in the Ch1-3 (MS/DB/MCPO) produce gonadotrophin-
releasing hormone in response to kisspeptin to promote reproductive maturation (Dumalska et
al., 2008; Wu et al., 2009). VGluT2-positive neurons of the MS/DB have been shown to control
locomotion speed-dependent firing of the hippocampus (Fuhrmann et al., 2015). These VGluT2-
positive neurons also relay this speed information to the spatial cells of the medial entorhinal
cortex (MEC) layer 2/3 for integration into dynamic representation of self-location (Justus et al.,
2017).
1.1.3.3 Monoaminergic neurons
Dopaminergic neurons in the basal forebrain have been found in humans (Gouras et al., 1992),
monkeys (Wisniowski et al., 1992), and even hamster (Vincent, 1988) despite the lack of
evidence of their presence in mice and rats. Nonetheless, there are conspicuous differences
between these neurons in humans and those in monkeys. The majority of dopaminergic neurons
found in the human basal forebrain were in the MS/DB and they did not express ChAT (Gouras
et al., 1992). However, the distribution of dopaminergic neurons in the marmoset basal
forebrain was the opposite: the majority in the NbM and almost none in the MS/DB (Wisniowski
et al., 1992). Functional characteristics and connections of these neurons have not been
investigated.
1.1.4 Cognitive functions of the basal forebrain and cholinergic signalling
1.1.4.1 Hippocampus-associated memory
Multiple reports have confirmed the significance of cholinergic system in learning and memory.
ACh is released at the dorsal CA3-CA1 during contextual fear inhibitory-avoidance learning to
strengthen both excitatory and inhibitory synaptic responses via M1-mAChR and nAChR
respectively (Mitsushima et al., 2013). Furthermore, plasticity types mediated by α7-nAChR,
whether long-term potentiation (LTP) or short-term depression (STD) depend on the relative
intermission between stimulation of CA3-CA1 input and innervating cholinergic axons; and this
plasticity-inducing effects have to be coordinated by both presynaptic and postsynaptic
cholinergic input (Gu et al., 2012). Stabilization of LTP in the CA1 involving S845 phosphorylation
of GluA1 subunits of AMPAR and F-actin production also depends on the activation α7-nAChR
(Galvez et al., 2016). Activation of α7-nAChR also mediates LTP at CA1-mPFC synapses
(Stoiljkovic et al., 2016).
Activation of M1 mAChR on the axon of dentate granule neurons increases axonal excitability
by sustaining influx of Ca2+ through T-type Ca2+ channels and therefore lowering action potential
29 threshold (Martinello et al., 2015). Although plasticity mechanisms of granule neurons include
lower excitability from axon initial segment shortening (Evans et al., 2015), the M1-mediated
plasticity does not change the length or location of the axon initial segment (Martinello et al.,
2015).
Accurate memory association needs a proper balance and separation between memory
encoding and retrieval, both of which are mediated by theta oscillation (Hasselmo, 2014;
Hasselmo and Stern, 2014). Theta peak and trough correspond to encoding and retrieval
respectively. Muscarinic antagonist scopolamine impairs CA1 encoding Newman et al., 2014
and knockout of α7-nAChR gene inhibits theta oscillation (Lu and Henderson, 2010).
1.1.4.2 Wakefulness
BFCNs are active when animals are awake or in rapid eye movement (REM) sleep, but less active
during non-REM (NREM) sleep. However, they are not the master regulator of sleep-/wake cycle
Yang et al., 2017. Optogenetic activation of cortical-projecting BFCNs transiently increased
wakefulness, promoted cortical electroencephalogram (EEG) theta activity and plasticity, and
suppressed cortical EEG delta activity (Zant et al., 2016). Inhibition of BFCNs slightly affected
wakefulness and prolonged activation also did not considerably enhance the amount of
wakefulness. In addition, the amount of wakefulness depends on the activity of other basal
forebrain neurons. Nevertheless, BFCNs have been demonstrated to play a crucial role in
homeostatic sleep response (Yang et al., 2017). Lesions of p75NTR-positive BFCNs subpopulation
by 192-IgG saporin relinquished sleep upregulation and increase in adenosine after sleep
deprivation (Kalinchuk et al., 2008).
Cortically-projecting GABAergic neurons exhibit EEG gamma activity-correlated maximal
discharge during wakefulness and REM sleep (Hassani et al., 2009). PV-positive neurons, the
major subtype of cortical-projecting GABAergic neurons, enhance cortical gamma band
oscillations and increase the amount of wakefulness (Yang et al., 2017). The other two subtypes
of projection GABAergic neurons – Kv2.2-positive and NK3R-positive – are also wake-active but
their electrophysiological characteristics have much to be studied. While the majority of local
GABAergic interneurons that express either SST or NPY are active during REM, stimulation of
these populations overall decreased wakefulness and promoted NREM sleep (Xu et al., 2015).
Another GABAergic subpopulation with REM-associated maximal discharge has not been
sufficiently investigated. For glutamatergic neurons, VGluT2-positive neurons are active during
wake and REM sleep and stimulation of these neurons was shown to promote wakefulness (Xu
et al., 2015). Glial cells in the basal forebrain have not been extensively studied but they were
30 shown to corelease ATP which is later converted to adenosine during sleep deprivation (Halassa
et al., 2009).
Overall, cortically projecting PV-positive neurons are the fundamental direct activator of
wakefulness. Cholinergic neurons, on the other hand, mediate the wakefulness both by distal
projection to cortical GABAergic interneurons and by local innervation to wake-inducing PV
projection neurons, VGluT2 glutamatergic neurons, and sleep-inducing SST interneurons (Xu et
al., 2015). Sleep deprivation induces accumulation of ATP-derived adenosine, which inhibits
glutamatergic signals from VGluT2 neurons to cholinergic and PV projection neurons, to
suppress wakefulness.
1.1.4.3 Attention and reward
Attention has been theorized to consist of two independent processes: “bottom-up” and “top-
down” (reviewed in Katsuki and Constantinidis, 2014). “Bottom-up” attention mainly involves a
feedforward process of automatic selection of highly distinguishable signals in the stimuli during
the transmission to the cortex. “Top-down” attention, on the other hand, is driven by a feedback
process of sensory signal modulation by the cortex to detect a task-relevant cue or goal. The
medial prefrontal cortex is innervated by all subregions of the basal forebrain from Ch1 to Ch4
(Bloem et al., 2014) and is essential to the “top-down” attention process (Ballinger et al., 2016).
Transient surge of ACh was induced when task-related cues were present in the stimuli (Howe
et al., 2013) and cue detection was also improved by ACh transients after optogenetic
stimulation of the basal forebrain (Gritton et al., 2016). In addition, stimulation during a cue-
lacking session induced detection of false cue and inhibition also caused failure to detect the
cues. Overall, cholinergic signalling induces and enhances “top-down” cue detection by the
medial prefrontal cortex.
Increased signal-to-noise ratio is crucial to the detection of task-relevant cue. This process
namely desynchronization can be achieved through decorrelation of increased activity of task-
relevant sensory cortical neurons. Desynchronization enhances neuronal response reliability to
task-relevant stimuli (Mitchell et al., 2009) and cholinergic signalling to the sensory cortex
facilitates the desynchronization with SST-positive interneurons as the major mediators (Chen
et al., 2015a). Congruent with the findings that the medial prefrontal cortex is also innervated
by the hippocampus-targeting MS/VDB, both wakefulness-predicting tonic ACh release during
spatial memory training and reward/attention-associated phasic ACh release are coordinated
between the medial prefrontal cortex and the dorsal hippocampus (Teles-Grilo Ruivo et al.,
2017).
31 In summary, BFCNs are important contributors to many higher mental functions including
cognition, attention, arousal, and reward. As such dysfunction of this system is likely to have
profound effects.
1.2 The Hippocampus
1.2.1 Anatomy and historical backgrounds
The hippocampus is a part of the limbic system in the medial temporal lobe (MTL) in human
(reviewed in Eichenbaum et al., 2016). Mammals have two hippocampi, each of which has a
fibre bundle called fimbriae that joins each other to form the fornix that curves along the corpus
callosum and branches to the supramammillary nucleus (SuM) of the hypothalamus, anterior
thalamic nuclei, and basal forebrain (reviewed in Nowrangi and Rosenberg, 2015). The
hippocampus is composed of the dentate gyrus and the hippocampal proper or Cornu Ammonis
with 3 subsectors: CA1-3. A summarizing schematic of major hippocampal circuitry is shown in
Figure 1.4 with descriptions in the legend. Its memory function was first revealed by anterograde
amnesia caused by the bilateral damage in the hippocampus. Numerous studies further proved
its roles in episodic memory, spatial navigation, and context-dependent memory. The
hippocampus was also involved in elements of emotion, reward, and time in memory encoding.
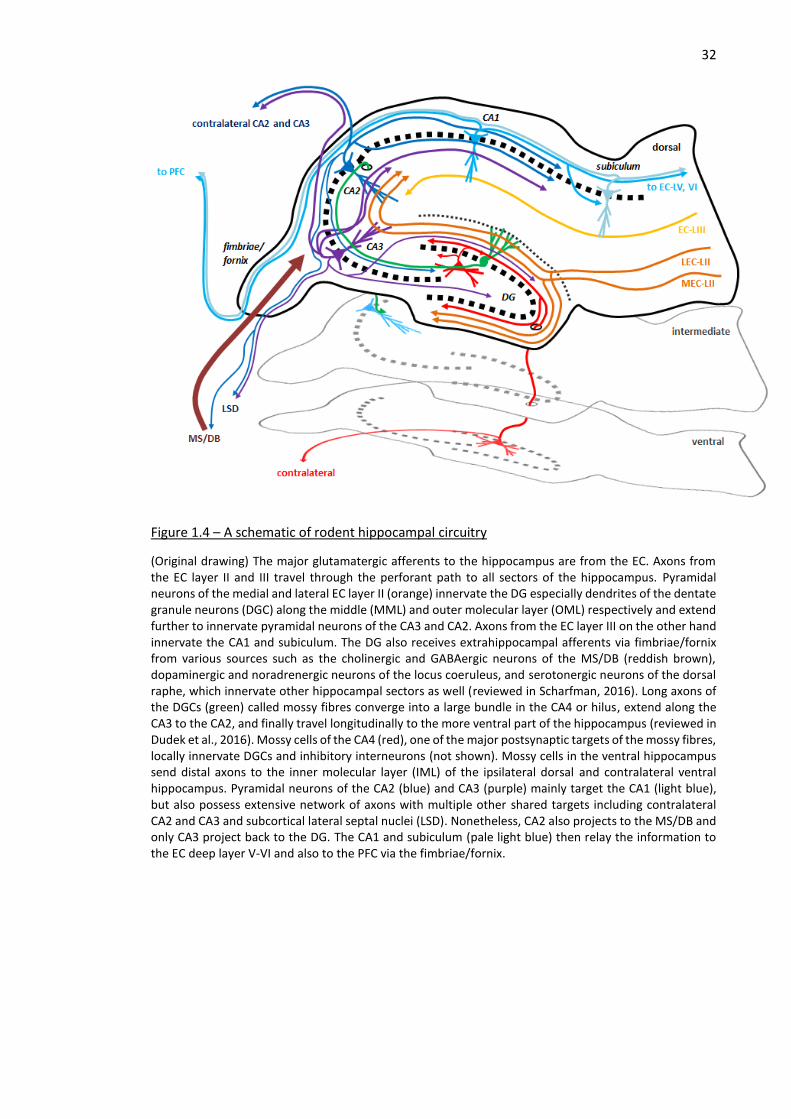
32
Figure 1.4 – A schematic of rodent hippocampal circuitry
(Original drawing) The major glutamatergic afferents to the hippocampus are from the EC. Axons from the EC layer II and III travel through the perforant path to all sectors of the hippocampus. Pyramidal neurons of the medial and lateral EC layer II (orange) innervate the DG especially dendrites of the dentate granule neurons (DGC) along the middle (MML) and outer molecular layer (OML) respectively and extend further to innervate pyramidal neurons of the CA3 and CA2. Axons from the EC layer III on the other hand innervate the CA1 and subiculum. The DG also receives extrahippocampal afferents via fimbriae/fornix from various sources such as the cholinergic and GABAergic neurons of the MS/DB (reddish brown), dopaminergic and noradrenergic neurons of the locus coeruleus, and serotonergic neurons of the dorsal raphe, which innervate other hippocampal sectors as well (reviewed in Scharfman, 2016). Long axons of the DGCs (green) called mossy fibres converge into a large bundle in the CA4 or hilus, extend along the CA3 to the CA2, and finally travel longitudinally to the more ventral part of the hippocampus (reviewed in Dudek et al., 2016). Mossy cells of the CA4 (red), one of the major postsynaptic targets of the mossy fibres, locally innervate DGCs and inhibitory interneurons (not shown). Mossy cells in the ventral hippocampus send distal axons to the inner molecular layer (IML) of the ipsilateral dorsal and contralateral ventral hippocampus. Pyramidal neurons of the CA2 (blue) and CA3 (purple) mainly target the CA1 (light blue), but also possess extensive network of axons with multiple other shared targets including contralateral CA2 and CA3 and subcortical lateral septal nuclei (LSD). Nonetheless, CA2 also projects to the MS/DB and only CA3 project back to the DG. The CA1 and subiculum (pale light blue) then relay the information to the EC deep layer V-VI and also to the PFC via the fimbriae/fornix.
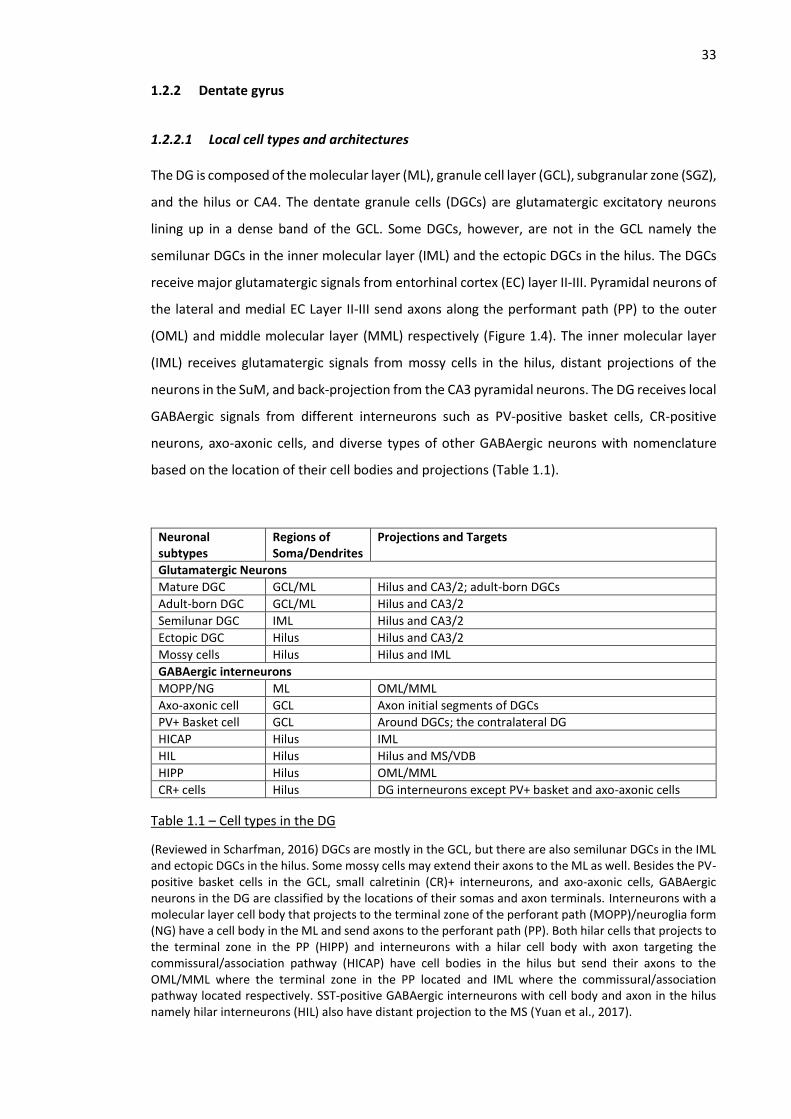
33 1.2.2 Dentate gyrus
1.2.2.1 Local cell types and architectures
The DG is composed of the molecular layer (ML), granule cell layer (GCL), subgranular zone (SGZ),
and the hilus or CA4. The dentate granule cells (DGCs) are glutamatergic excitatory neurons
lining up in a dense band of the GCL. Some DGCs, however, are not in the GCL namely the
semilunar DGCs in the inner molecular layer (IML) and the ectopic DGCs in the hilus. The DGCs
receive major glutamatergic signals from entorhinal cortex (EC) layer II-III. Pyramidal neurons of
the lateral and medial EC Layer II-III send axons along the performant path (PP) to the outer
(OML) and middle molecular layer (MML) respectively (Figure 1.4). The inner molecular layer
(IML) receives glutamatergic signals from mossy cells in the hilus, distant projections of the
neurons in the SuM, and back-projection from the CA3 pyramidal neurons. The DG receives local
GABAergic signals from different interneurons such as PV-positive basket cells, CR-positive
neurons, axo-axonic cells, and diverse types of other GABAergic neurons with nomenclature
based on the location of their cell bodies and projections (Table 1.1).
Neuronal subtypes
Regions of Soma/Dendrites
Projections and Targets
Glutamatergic Neurons
Mature DGC GCL/ML Hilus and CA3/2; adult-born DGCs
Adult-born DGC GCL/ML Hilus and CA3/2
Semilunar DGC IML Hilus and CA3/2
Ectopic DGC Hilus Hilus and CA3/2
Mossy cells Hilus Hilus and IML
GABAergic interneurons
MOPP/NG ML OML/MML
Axo-axonic cell GCL Axon initial segments of DGCs
PV+ Basket cell GCL Around DGCs; the contralateral DG
HICAP Hilus IML
HIL Hilus Hilus and MS/VDB
HIPP Hilus OML/MML
CR+ cells Hilus DG interneurons except PV+ basket and axo-axonic cells
Table 1.1 – Cell types in the DG
(Reviewed in Scharfman, 2016) DGCs are mostly in the GCL, but there are also semilunar DGCs in the IML and ectopic DGCs in the hilus. Some mossy cells may extend their axons to the ML as well. Besides the PV-positive basket cells in the GCL, small calretinin (CR)+ interneurons, and axo-axonic cells, GABAergic neurons in the DG are classified by the locations of their somas and axon terminals. Interneurons with a molecular layer cell body that projects to the terminal zone of the perforant path (MOPP)/neuroglia form (NG) have a cell body in the ML and send axons to the perforant path (PP). Both hilar cells that projects to the terminal zone in the PP (HIPP) and interneurons with a hilar cell body with axon targeting the commissural/association pathway (HICAP) have cell bodies in the hilus but send their axons to the OML/MML where the terminal zone in the PP located and IML where the commissural/association pathway located respectively. SST-positive GABAergic interneurons with cell body and axon in the hilus namely hilar interneurons (HIL) also have distant projection to the MS (Yuan et al., 2017).
34 Mossy cells are glutamatergic neurons in the hilus that are capable of directly stimulating DGCs
and disynaptically inhibiting DGCs by stimulating DGCs-innervating GABAergic interneurons
(reviewed in Scharfman, 2017; Scharfman, 2016). In mice, mossy cells have been demonstrated
to have dorso-ventral specialisation. While dorsal mossy cells do not express CR and mainly
innervate locally, ventral mossy cells are CR-positive, and they send distant axons to the
contralateral ventral and ipsilateral dorsal hippocampus. On the other hand, human mossy cells
in both the dorsal and ventral hippocampus do not contain CR but instead express cocaine-
amphetamine regulating transcript (CART) protein (Seress et al., 2008).
The DGCs send their axons namely mossy fibres to innervate mossy cells and pyramidal neurons
of the CA2 and CA3 with massive en passant mossy terminals along the axon (Acsady et al.,
1998). These large mossy boutons form multiple asymmetric synaptic contacts with specialised
postsynaptic spines called thorny excrescences. The density and complexity of thorny
excrescences of the hilar mossy cells are higher than that of pyramidal neurons in the CA3
(reviewed in Dudek et al., 2016). Mossy fibres also travel along the hippocampal longitudinal to
innervate the CA2 of the more ventral coordinate. However, the length is approximately half of
the hippocampal length so the dorsal DGCs can send their axons down to the intermediate CA2
and the intermediate DGCs to the ventral CA2. DGCs also innervate GABAergic interneurons with
asymmetric synaptic contacts from filopodia extended from the mossy boutons and small
boutons. The number of filopodia and small boutons together is approximately 10 times the
number of mossy boutons.
1.2.2.2 Functions
The DG is involved in the pattern separation and possesses several characteristics befitting such
function (reviewed in Deng et al., 2010; Petrantonakis and Poirazi, 2015). Pattern separation is
a computational process that convert overlapping or similar inputs into less similar outputs.
There are a higher number of neurons in the DGs than in the EC or the CA3. This is reminiscent
of kernel methods in the support vector machine (SVM) that map given inputs to a higher
dimensional space for better separation. In addition, lateral inhibition from the GABAergic
interneurons, which are activated by either direct monosynaptic or mossy cell-dependent
disynaptic inputs from the DGCs, facilitate sparse coding scheme such that only few DGCs can
be activated at a given time. Mossy cells provide excitatory inputs to both DGCs and GABAergic
interneurons especially PV-positive basket cells, but activation of mossy cells usually result in
net inhibition for sparse activation of the DGCs (Jinde et al., 2012). A process inspired by mossy
cell-mediated lateral inhibition has been shown to improve the performance of sparse
approximation algorithm “Iterative Soft Thresholding” (Petrantonakis and Poirazi, 2015). These
features together allow similar inputs to be encoded into distinct populations of DGCs. The firing
35 of DGCs is associated with stress (Snyder et al., 2011) and discrimination of spatial and temporal
contextual information but is not related to speed or reward (Danielson et al., 2016).
1.2.3 CA3
1.2.3.1 Local cell types and architectures
CA3 pyramidal neurons receive direct excitatory inputs and indirect interneuron-dependent
disynaptic inhibitory inputs by mossy fibres of the DGCs (reviewed in Prince et al., 2016). CA3
pyramidal neurons are large pyramidal neurons and exhibit vast and complex networks of
intrahippocampal projections. Approximately 80% of all intrahippocampal presynaptic terminals
are from the CA3 pyramidal neurons (Amaral and Witter, 1989). The majority 70% of axon
terminals expectedly lie within the CA1 region; 28% of them are in the CA3 for recurrent
signalling; and the remaining 2% for back projection to the DGCs and innervation to other
neurons in the hilus (Wittner et al., 2007).
GABAergic interneuron population in the CA3 are composed of numerous subtypes. Both basket
and chandelier axo-axonic cells express PV but axo-axonic cells are SATB1- and SST-negative and
some basket cells are also SST-positive (Viney et al., 2013).
1.2.3.2 Functions
Pattern completion is a process by which a network retrieves the whole memory patterns when
triggered with partial inputs. Extensive network of recurrent synapses of CA3 enables a partial
pattern that initially activate a subset of an ensemble of interconnected CA3 pyramidal neurons
to recruit the remaining cells of the ensemble of which recurrent synapses have been
potentiated by a more complete stimulus pattern (Lisman, 1999; Bush et al., 2010; reviewed in
Rolls, 2018). Despite superficial similarity to the neocortical pyramidal cell network, CA3
pyramidal cell network has lower connection probability (more sparse), more spatially uniform
synapses, more enriched in disynaptic connectivity motifs, and smaller number of more effective
functional synaptic contacts between individual CA3 pyramidal neurons (Guzman et al., 2016).
These characteristics increase efficiency and precision of encoding especially by a relatively small
ensemble of neurons.
36 1.2.4 CA2
1.2.4.1 Local cell types and architectures
Among hippocampal neurons, CA2 pyramidal neurons exclusively express IgG-domain
containing adhesion protein AMIGO2, plasticity-suppressing protein Regulator of G-protein
signalling 14 (RGS14), Purkinje cell protein-4 (PCP4), and striatum-enriched protein-tyrosine
phosphatase (STEP) (Hitti and Siegelbaum, 2014). Unlike CA3 pyramidal neurons that project to
different CA1 sublayers equally, CA2 pyramidal neurons preferentially innervate deep layer
calbindin-negative CA1 pyramidal neurons (Kohara et al., 2014). CA2 pyramidal neurons receive
bilateral yet weak inputs from the CA3. Furthermore, CA2 pyramidal neurons send subcortical
innervation to the MS/DB, dorsal part of the lateral septum (LSD), and SuM. Besides the MS/DB
and SuM, the CA2 is also innervated by the paraventricular nucleus. While CA2 pyramidal
neurons are also innervated by mossy fibres, unlike CA3 pyramidal neurons, they do not possess
conspicuous thorny excrescences.
1.2.4.2 Functions
Optogenetic inhibition of CA2 pyramidal neurons has been demonstrated to completely impair
social memory (Hitti and Siegelbaum, 2014). Perineuronal nets, high calcium buffering, and
expression of RGS14 contribute to the restriction of LTP in the CA2 (reviewed in Benoy et al.,
2018). As a result, plasticity in the CA2 is tightly regulated by CA2-exclusive mechanisms. For
example, both vasopressin from the paraventricular nucleus (Pagani et al., 2015) and substance-
P from the SuM (Dasgupta et al., 2017) mediate potentiation of social memory in the CA2.
1.2.5 CA1
1.2.5.1 Local cell types and architectures
The CA1 has two layers of pyramidal neurons with distinct functionalities (reviewed in Soltesz
and Losonczy, 2018). The early-born (E14) deep layer pyramidal neurons lack calbindin and
receive stronger excitatory inputs from the MEC and CA2. Conversely, the late-born (E17)
superficial pyramidal neurons express calbindin and receive excitatory inputs predominantly
from the LEC and CA3. Multiplexed barcode scheme sequential fluorescence in-situ
hybridisation (seqFISH) has provided an evidence of spatial heterogeneity in the CA1 pyramidal
neuron population and demonstrated that the degree of heterogeneity increases along the
dorsoventral axis (Shah et al., 2016). It was confirmed that seqFISH of the barcoded genes of low
average abundance, excluding the genes of high expression, are sufficient to provide the same
map of spatial heterogeneity (Shah et al., 2017).
37 CA1 is connected to the subiculum, both of which together serve as the main hippocampal
output structures that convey information to the cortex and other parts of the brain. In addition,
the activity of different subcortical systems is also linked through the CA1-subiculum path. For
example, stimulation of dopaminergic neurons in the ventral tegmental area (VTA) but inhibition
of dopaminergic neurons in the substantia nigra pars compacta (SNpc) in the midbrain by MS
stimulation requires the ventral subiculum (Bortz and Grace, 2018).
1.2.5.2 Functions
Theta oscillations in the CA1 correspond to the separate phases of encoding and retrieval such
that encoding occurs during the theta trough, but retrieval happens during the peak (reviewed
in Hasselmo and Stern, 2014). During the encoding phase, both the CA3 and CA1 receive strong
inputs from the EC but provide weak outputs to the CA1 and the cortex respectively.
Transmission of the signals is low, but plasticity is upregulated for potentiation at several
connections especially the CA3-CA1 synapse. During the retrieval phase, because of the prior
potentiation, weak input can induce strong recurrent activation of the CA3 pyramidal neurons
to intensely stimulate the CA1 pyramidal neurons to provide strong inputs to the entorhinal and
frontal cortices.
1.2.6 Distant projection from other brain regions
The hippocampus receives considerable innervation from distant regions and can be considered
on an anatomical and neurochemical basis. This innervation is summarised in Figure 1.5 and
described in detail below.
1.2.6.1 Glutamatergic innervation
Glutamatergic neurons of the MS/DB innervate the CA1 to control locomotion, theta oscillation,
and speed-correlated firing of CA1 pyramidal neurons (Fuhrmann et al., 2015). Locomotion-
dependent signals of these MS/DB glutamatergic neurons stimulate disinhibitory GABAergic
interneurons of the alveus/oriens regions, likely the O-LM interneurons to suppress GABAergic
interneurons of the SR and SLM that feedforward inhibit inputs from the Schaffer collateral
(CA2/3) and perforant path (MEC LIII) to the CA1. In short, elevated activity of MS/DB
glutamatergic projection neurons increases firing rates of CA1 pyramidal neurons during faster
locomotion.
Glutamatergic neurons of the SuM in the hypothalamus innervate the CA2 and the IML of the
DG (Pedersen et al., 2017). There are two types of hippocampal-projecting glutamatergic
neurons in the SuM: GABA-coreleasing neurons and NOS1-expressing neurons. While GABA-
38 coreleasing axons account for the majority of SuM-hippocampal tracts, NOS1-expressing
innervation is more potent at inducing wakefulness than the GABA-coreleasing counterpart.
Interestingly, ventral tegmental area (VTA) also contains projection neurons that express both
VGluT2 and GAD65 and corelease glutamate and GABA in the DG and CA2 (Ntamati and Luscher,
2016). However, unlike the band of SuM axons in the IML, VTA axons are dense in the outer
layer of the GCL beneath the IML. Overall activation of VTA glutamatergic neurons decreases
firing rates of the DGCs.
The basolateral amygdala (BLA) also sends glutamatergic projections to the ventral
hippocampus to modulate social behaviours and anxiety. Glutamatergic neurons of the BLA
provide direct excitatory inputs to CA1 pyramidal neurons in the ventral hippocampus to induce
anxiety (Felix-Ortiz et al., 2013). Nonetheless, glutamatergic inputs from the BLA also have
indirect inhibitory effects by stimulating local GABAergic interneurons. Furthermore,
optogenetic stimulation and inhibition of these glutamatergic projection neurons of the BLA has
been shown to repress and enhance social behaviours respectively (Felix-Ortiz and Tye, 2014).
1.2.6.2 GABAergic innervation
All hippocampal sectors including the DG receive distant GABAergic innervation from the
MS/DB. While all GABAergic projection neurons in the MS rhythmically fire action potential,
their burst duration and rhythmicity are diverse across different subpopulations. PV-positive
Teevra cells exhibit short burst duration but Komal cells exhibit long burst duration (Joshi et al.,
2017). During locomotion, firing rate of the Teevra cells increases, but that of Komal cells
decreases. Interestingly, several subtypes of GABAergic neurons project to specific sectors of
the hippocampus. For example, Teevra cells mainly project to cholecystokinin-positive
interneurons and axo-axonic interneurons of the CA3. Inhibition of CA3 interneurons by the
Teevra cells at the peak of the theta trough corresponds to the high signal transmission and
firing probability of the CA1 pyramidal neurons.
1.2.6.3 Cholinergic innervation
The majority of cholinergic axons in the hippocampus arise from the Ch1 and Ch2 or the MS and
VDB but some of the axons in the DG have cell bodies in the Ch3 or the HDB (Zhu et al., 2017).
Cholinergic signalling has been shown to enhance theta wave (Vandecasteele et al., 2014).
Activation of only BFCNs in the MS/DB induced frequency-dependent effects on non-cholinergic
neurons of the MS/DB and hippocampal interneurons during behavioural inactive state but was
not sufficient to significantly regulate hippocampal function during explorative behaviours
(Mamad et al., 2015).
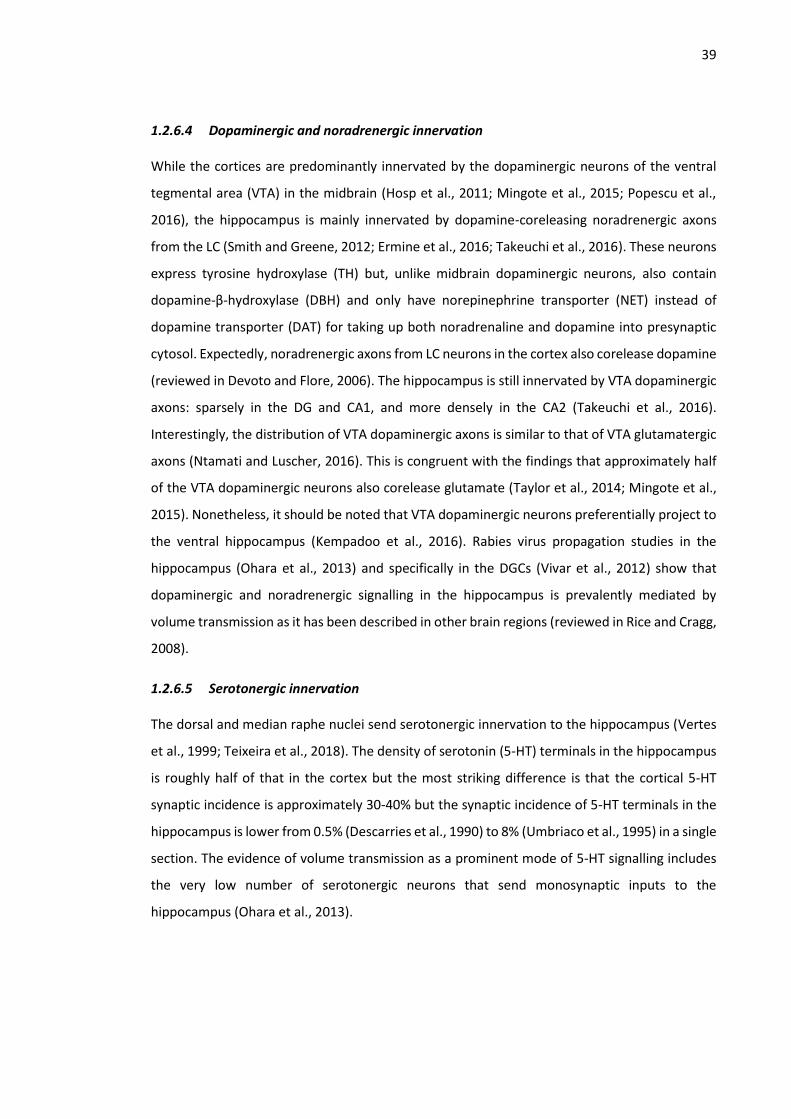
39
1.2.6.4 Dopaminergic and noradrenergic innervation
While the cortices are predominantly innervated by the dopaminergic neurons of the ventral
tegmental area (VTA) in the midbrain (Hosp et al., 2011; Mingote et al., 2015; Popescu et al.,
2016), the hippocampus is mainly innervated by dopamine-coreleasing noradrenergic axons
from the LC (Smith and Greene, 2012; Ermine et al., 2016; Takeuchi et al., 2016). These neurons
express tyrosine hydroxylase (TH) but, unlike midbrain dopaminergic neurons, also contain
dopamine-β-hydroxylase (DBH) and only have norepinephrine transporter (NET) instead of
dopamine transporter (DAT) for taking up both noradrenaline and dopamine into presynaptic
cytosol. Expectedly, noradrenergic axons from LC neurons in the cortex also corelease dopamine
(reviewed in Devoto and Flore, 2006). The hippocampus is still innervated by VTA dopaminergic
axons: sparsely in the DG and CA1, and more densely in the CA2 (Takeuchi et al., 2016).
Interestingly, the distribution of VTA dopaminergic axons is similar to that of VTA glutamatergic
axons (Ntamati and Luscher, 2016). This is congruent with the findings that approximately half
of the VTA dopaminergic neurons also corelease glutamate (Taylor et al., 2014; Mingote et al.,
2015). Nonetheless, it should be noted that VTA dopaminergic neurons preferentially project to
the ventral hippocampus (Kempadoo et al., 2016). Rabies virus propagation studies in the
hippocampus (Ohara et al., 2013) and specifically in the DGCs (Vivar et al., 2012) show that
dopaminergic and noradrenergic signalling in the hippocampus is prevalently mediated by
volume transmission as it has been described in other brain regions (reviewed in Rice and Cragg,
2008).
1.2.6.5 Serotonergic innervation
The dorsal and median raphe nuclei send serotonergic innervation to the hippocampus (Vertes
et al., 1999; Teixeira et al., 2018). The density of serotonin (5-HT) terminals in the hippocampus
is roughly half of that in the cortex but the most striking difference is that the cortical 5-HT
synaptic incidence is approximately 30-40% but the synaptic incidence of 5-HT terminals in the
hippocampus is lower from 0.5% (Descarries et al., 1990) to 8% (Umbriaco et al., 1995) in a single
section. The evidence of volume transmission as a prominent mode of 5-HT signalling includes
the very low number of serotonergic neurons that send monosynaptic inputs to the
hippocampus (Ohara et al., 2013).
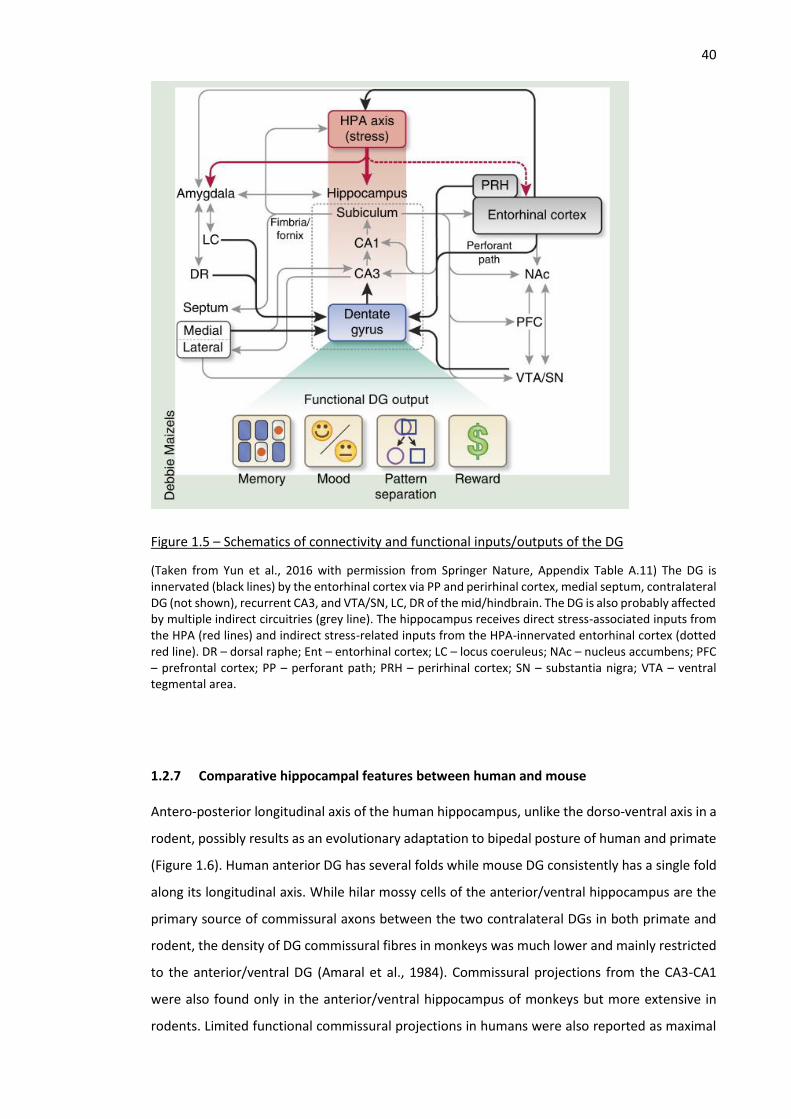
40
Figure 1.5 – Schematics of connectivity and functional inputs/outputs of the DG
(Taken from Yun et al., 2016 with permission from Springer Nature, Appendix Table A.11) The DG is innervated (black lines) by the entorhinal cortex via PP and perirhinal cortex, medial septum, contralateral DG (not shown), recurrent CA3, and VTA/SN, LC, DR of the mid/hindbrain. The DG is also probably affected by multiple indirect circuitries (grey line). The hippocampus receives direct stress-associated inputs from the HPA (red lines) and indirect stress-related inputs from the HPA-innervated entorhinal cortex (dotted red line). DR – dorsal raphe; Ent – entorhinal cortex; LC – locus coeruleus; NAc – nucleus accumbens; PFC – prefrontal cortex; PP – perforant path; PRH – perirhinal cortex; SN – substantia nigra; VTA – ventral tegmental area.
1.2.7 Comparative hippocampal features between human and mouse
Antero-posterior longitudinal axis of the human hippocampus, unlike the dorso-ventral axis in a
rodent, possibly results as an evolutionary adaptation to bipedal posture of human and primate
(Figure 1.6). Human anterior DG has several folds while mouse DG consistently has a single fold
along its longitudinal axis. While hilar mossy cells of the anterior/ventral hippocampus are the
primary source of commissural axons between the two contralateral DGs in both primate and
rodent, the density of DG commissural fibres in monkeys was much lower and mainly restricted
to the anterior/ventral DG (Amaral et al., 1984). Commissural projections from the CA3-CA1
were also found only in the anterior/ventral hippocampus of monkeys but more extensive in
rodents. Limited functional commissural projections in humans were also reported as maximal
41 single pulse stimulation did not evoke detectable responses in the contralateral hippocampus
(Wilson et al., 1990).
Spatial representations in the primate hippocampus are different from that of rodents because
of their different modes of vision. Rodents have no fovea and up to 320° of visual field with
limited eye movement control. Primates, on the other hand, have highly developed fovea and
narrow fields of vision with flexible eye movement control to explore the environment.
Therefore, rodents have neuronal representations of their locations namely place cells in the
hippocampus whereas primates have spatial view representations namely spatial view cells
(reviewed in Rolls and Wirth, 2018).
Expression of some genes/proteins in hippocampal cells may be different across species
including human and rodents. For example, mouse ventral mossy cells are CR-positive, but
human mossy cells in both the dorsal and ventral hippocampi do not contain CR but instead
express cocaine-amphetamine regulating transcript (CART) protein (Seress et al., 2008).
Figure 1.6 – Comparison of hippocampal anatomy between human and mouse
(Modified from Strange et al., 2014 with permission from Springer Nature, Appendix Table A.12) The longitudinal axes in human and mouse are anteroposterior and ventrodorsal respectively. Scale bar = 1 mm. A: anterior; P: posterior; D: dorsal; V: ventral;
42
1.3 Dementia
1.3.1 Background and epidemiology
Dementia or the code 6D8_ by the 11th revision of the International Classification of Disease
(ICD-11) (WHO, 2018) or major neurocognitive disorder by the 5th Diagnostic and Statistical
Manual on Mental Disorders (DSM-V) (Association, 2013) is a syndrome characterised by
progressive decline in cognitive performance with impairment in at least two of the following
cognitive domains: memory, executive functions, attention, language, social cognition and
judgment, psychomotor speed, and visuospatial abilities. Aging alone cannot account for the
impairments and these impairments have to debilitate daily life activities.
Dementia due to Alzheimer’s disease (AD) or 6D80 by ICD-11 (WHO, 2018) is a progressive
neurodegenerative disease and the most prevalent type of dementia. The current number of
patients worldwide is around 35.6 million and it is predicted to increase up to 65.7 million in
2030 (Wortmann, 2012). The causes of the disease remain elusive, but the major consistent
characteristics include the following; gross cerebral atrophy; cell and synapse loss; amyloid
depositions of misfolded proteins including extracellular plaques of β-amyloid protein (Aβ) and
intracellular neurofibrillary tangles of hyperphosphorylated tau.
Lewy body dementias consist of Dementia with Lewy bodies (DLB) and Parkinson’s disease with
dementia (PDD), which share similar pathology but different clinical progression. In ICD-11, DLB
or 6D82 is considered a separate type of dementia from PDD or 6D85.0, which belongs to the
type of dementia due to other classified diseases (WHO, 2018). DLB is the second most prevalent
type of dementia, estimated to account up to 15% of all dementia cases (Aarsland et al., 2008).
For PDD, a systematic review of prevalence studies conservatively estimates the dementia
frequency of 24% in all PD patients (Aarsland et al., 2005). On the contrary, prospective studies
over a period of 8 (Aarsland et al., 2003) and 20 years (Hely et al., 2008) reported that 75% and
80% of PD patients developed dementia respectively. Pathological hallmarks of both DLB and
PDD are intracellular inclusions predominantly composed of α-synuclein in neuronal cell bodies
namely Lewy bodies and dystrophic neurites that contain α-synuclein-rich inclusion namely
Lewy neurites (Spillantini et al., 1998). DLB and PDD patients may also have AD-associated
pathological features such as Aβ neuritic plaques and tau neurofibrillary tangles albeit generally
in milder extents (Duda, 2004; Howlett et al., 2014). Atrophy in the medial temporal lobe (MTL)
(Burton et al., 2009) may also be present, especially in the hippocampus and amygdala (Burton
et al., 2012) of DLB/PDD patients, but to a lesser degree compared with those of AD patients.
As DLB and PDD share multiple similarities, they are distinguished from each other by the onset
of dementia relative to Parkinsonism. According to this ‘1-year rule’, DLB is diagnosed if
43 dementia manifests earlier than Parkinsonism or after Parkinsonism for at most 1 year (McKeith
et al., 2005; McKeith et al., 2017).
1.3.2 Symptoms
1.3.2.1 AD overview
Typical AD symptoms include progressive loss of memory together with visuospatial and
executive functions and eventually impaired functional independence. Other important non-
amnestic symptoms in language domains include deficits in word finding and category naming
(reviewed in Stilwell et al., 2016). Declarative memory, in which implicated by the temporal lobe
including hippocampal and parahippocampal structures, is significantly affected. Patients may
forget the locations of objects, conversations, time-related elements such as appointments
(Erkkinen et al., 2018). Procedural memory, however, is less impaired. In addition to these
cognitive symptoms, a range of non-cognitive changes, including changes in behaviour and
mood, form parts of the syndrome of dementia (reviewed in Kratz, 2017). The most prominent
and most frequently occurring of these symptoms are depression and apathy (reviewed in
Ballard et al., 2009). Less common but particularly troublesome symptoms include agitation,
aggressive behaviour, night-time wandering, and psychosis
The original criteria from the National Institute of Neurological and Communitive Disorders and
Stroke and Alzheimer’s Disease and Related Disorders Association (NINCDS-ADRDA) has low
specificity and sensitivity of 70% because it strictly required amnestic symptoms (McKhann et
al., 2011). Atypical symptoms were later included to improve the criteria. These non-amnestic
variants are caused by degeneration of brain regions other than the medial temporal lobe. For
example, damaged frontal cortex is associated with impaired executive functions and abnormal
behaviours such as apathy and disinhibition. Atrophy of posterior cortical areas leads to occipito-
temporal-associated visuospatial deficits such as face and word recognition and parietal-
associated visuospatial impairment. In terms of language skills, word retrieval and sentence
repetition become significantly difficult despite relatively normal motor speech programming
and semantic knowledge (McKhann et al., 2011).
1.3.2.2 Mild cognitive impairment (MCI) overview
Mild cognitive impairment (MCI) describes a condition with cognitive deficits that are not
sufficiently severe to be diagnosed as dementia. Core clinical criteria for diagnosis of MCI have
been established by the National Institute on Aging and the Alzheimer’s Association (NIA-AA)
(Albert et al., 2011). Patients should have concerns over their cognitive changes and exhibit
44 evidence of deficits in at least one cognitive domain. These domains include memory,
visuospatial skills, executive function, attention, and language. In this regard, AD-transitioning
MCI patients commonly have impaired episodic memory. Importantly, MCI patients retain
independence in activities of daily living. While not all MCI cases progress to dementia, most
MCI cases develop dementia especially AD (Villemagne et al., 2011b).
1.3.2.3 DLB and PDD overview
Parkinsonism in DLB and PDD compared with cognitively healthy PD displays stronger degree of
postural instability and gait difficulty, but less rest tremors (reviewed in Erkkinen et al., 2018).
With respect to the above pattern, DLB exhibits poorer motor balance and less frequent tremor
compared with PDD. DLB and PDD share most dementia-associated deficits in executive
functions, visuospatial skills, memory retrieval, mood disturbance, REM sleep behavioural
disorder, and neuroleptic sensitivity. Fluctuation, delusions, and visual hallucination are more
frequent in DLB and PDD than controls and AD. Fluctuation in DLB affects arousal, attention, and
cognition. Visual hallucinations are also spontaneous in DLB but may be induced by levodopa
treatment in PDD. PDD patients have high mortality rate of approximately 4 years after
dementia manifestation while the survival time of DLB is slightly longer at 5-9 years. The recently
revised (McKeith et al., 2017) and previous (McKeith et al., 2005) criteria advise that the
dementia onset must be earlier than a year period after the parkinsonism onset for the diagnosis
of DLB instead of PDD.
1.3.3 Cognitive and behavioural tests
A general cognitive assessment may include the follow procedures. Subjects are examined either
at the neuropsychiatric memory department or clinic of the hospital or at home by experienced
psychiatric nurses. The examination covers psychiatric symptoms, personality changes,
executive functions, aphasia, ataxia, agnosia, and both short and long-term episodic memory.
This may include interviews of key informants after consent especially for the information on
family history of dementia, stroke, transient ischemia attack, and education. Final scorings of
the examination are assigned by a geriatric psychiatrist or neurologist. Definite clinical
characteristic in DLB and PDD that is not found in AD is spontaneous parkinsonism. Core features
of parkinsonism are combination of bradykinesia, a decrease in movement amplitude or speed,
and of either rest tremor or rigidity or both (Postuma et al., 2015; McKeith et al., 2017).
45 1.3.3.1 CDR
The Clinical Dementia Rating (CDR) assesses the performances in six cognitive ad functional
domains with a 5-point scale: 0 = normal, 0.5 = very mild, 1 = mild, 2 = moderate, 3 = severe
(Morris, 1993). The six domains are memory, orientation, judgment & problem solving,
community affairs, home & hobbies, and lastly personal care. Its fine scale allows this test to
diagnose even patients with very mild cognitive impairment. Nonetheless, assessment protocol
of the CDR, including patient interview and gathering data from collateral sources, can be time-
consuming. The test is subjective by nature and therefore reportedly less sensitive to
longitudinal changes. Nonetheless, the sum of CDR six domains or boxes or CDR-SOB was shown
to efficiently indicate progression of AD (O'Bryant et al., 2008).
1.3.3.2 MMSE
The Mini Mental State Examination (MMSE) is the most commonly used questionnaire that was
first designed to provide fast numerical evaluation of cognitive performance (Folstein et al.,
1975). MMSE has a total score of 30 that can be divided into 3 ranges of cognitive performance
levels: cognitively healthy [24-30], moderately impaired [11-23], and severely impaired [0-11].
MMSE can be used to distinguish MCI from AD and healthy controls based on cut-off scores
(Roalf et al., 2013) but it is still unsuitable for diagnosing DLB because it does not have criteria
for DLB-relevant symptoms such as visual hallucinations or fluctuating cognition (McKeith et al.,
2005).
1.3.3.3 ADAS-Cog
The Alzheimer’s disease assessment scale-cognition sub-scale (ADAS-Cog) was primarily
designed to measure 11 cognitive and 10 non-cognitive domains in dementia patients (Rosen et
al., 1984). It has become the most widely used measure for the effectiveness of dementia clinical
trials. The 11 cognitive items are as follows: 1) spoken language ability, 2) comprehension of
spoken language, 3) recall of test instructions, 4) word-finding difficulty, 5) following commands,
6) naming: objects, fingers, 7) constructions: drawing, 8) ideational praxis, 9) orientation, 10)
word recall, and 11) word recognition. Despite its prediction capacity for AD, effectiveness of
the classic ADAS-Cog for assessment in MCI patients seemed limited (Skinner et al., 2012).
Multiple approaches have been tested to improve the assessment power of ADAS-Cog for MCI
including the random forest-based
1.3.3.4 NPI
The Neuropsychiatric Inventory (NPI) questionnaire is a survey of non-cognitive behavioural and
mood changes in dementia (Cummings, 1997). It is designed to be completed on a monthly basis
46 by an informant who takes care of the patient on 12 domains, night-time behaviour changes,
appetite/eating changes, and 10 standard neuropsychiatric domains: hallucination, delusion,
agitation/aggression, dysphoria/depression, anxiety, irritability, disinhibition, euphoria, apathy,
and aberrant motor behaviour. The NPI is one of the most commonly used assessments of non-
cognitive behaviours and mood and It is relatively neither difficult to use nor time-consuming
(Cummings, 1997). Moreover, some of its domains are specific to certain types of dementia and
hence useful for dementia diagnosis, for example, euphoria is rare in AD. Nonetheless, the
scoring is prone to personal bias of the caregiver and it cannot effectively rate the severity of
dementia (de Medeiros et al., 2010).
1.3.3.5 Differential cognitive diagnostic tests
Impairment in attention, executive function, and visual processing are more severe relative to
naming and memory deficits in DLB and PDD than in AD (McKeith et al., 2017). Trail-making tests
and Stroop tasks are for attention and executive function assessment. Visual processing deficits
can be detected by figure copy, visual assembly, spatial matching, size matching, and perceptual
discrimination tasks. Story recall and confrontation naming tasks can be implemented to
measure naming and memory performance. Patients generally have difficulties identifying their
state of fluctuation themselves but a questionnaire on certain symptoms such as
absentmindedness, daylight drowsiness, and disorganised speech can reflect the extents of
fluctuation in DLB.
1.3.4 In vivo Biomarkers and imaging
1.3.4.1 Brain structural imaging
Computed tomography or a CT scan produces cross-sectional images of a brain from a
combination of X-ray results. According to the diagnostic guidelines by the National Institute on
Aging-Alzheimer Association, medial temporal lobe atrophy visualised by structural imaging is
an important marker to diagnose AD (McKhann et al., 2011). CT scan is cheaper and requires
shorter procedure and assessment time. While CT scan alone cannot diagnose AD patients with
relatively spared MTL volume, it still can improve the diagnostic ratios in combination with other
procedures (Firbank et al., 2016).
Magnetic resonance imaging (MRI) applies the concepts of nuclear magnetic resonance by
detecting different frequencies of hydrogen atom-emitted resonant signals which are influenced
by electronic environment surrounding those hydrogens within their respective molecules. Fat
and water have different T1 and T2 relaxation phase properties. Therefore, MRI distinguishes a
47 composition of these molecules in each brain anatomical area i.e. signals in the lipid-enriched
white matter are higher than in the cortex during T1-weighted visualisation. Fat loss and water
composition gain from demyelination and lesions are detectable by MRI. Presymptomatic
patients who later developed AD had progressive atrophy in the medial temporal lobe (Fox et
al., 2001). Global sulcal index and the span of the lateral sulcus were more sensitive for detecting
the early stages of AD than cortical thickness and subcortical volume (Cai et al., 2017). Relative
preservation of the medial temporal lobe from CT or MRI scan is also a supportive biomarker of
DLB diagnosis (McKeith et al., 2017).
Higher static field strength allows visualisation with greater resolution. An increase from 1.5
Tesla (T) to 3T facilitates detection of volume disparity of hippocampal subfields between
disease groups (Chow et al., 2015). A 7T MRI offers a better imaging resolution but also impose
a challenge of how to efficiently control field homogeneity and minimise distortion given a
considerable increase in static field strength (reviewed in McKiernan and O'Brien, 2017).
Notwithstanding, 7T-increased resolution has so far been sufficient to detect abnormalities
which have not been observable in vivo but have been confirmed postmortem e.g. a significant
decrease in the thickness of CA1 apical neuropil layer or stratum radiatum and stratum
lacunosum-moleculare in mild AD patients compared with controls (Kerchner et al., 2010).
1.3.4.2 Radiolabelled ligands neuroimaging with PET and SPECT
Positron emission tomography (PET) and single photon emission compound tomography
(SPECT) are nuclear medicine imaging techniques that measure gamma radiation from
radioisotope-containing compounds often called tracer which had been injected into patients.
One of the most well-known PET tools is radioactive glucose analogue [18F]fluorodeoxyglucose
(FDG) which has been implemented to evaluate tissue metabolism in terms of glucose uptake.
As 2-OH group is required for conversion to fructose in glycolysis, [18F]FDG of which 2-OH is
substituted by 18F cannot be further metabolised. The uptake of glucose or [18F]FDG is recently
demonstrated to be driven by GLT-1 (glutamate transporter 1)-dependent transport of
astrocytic glutamate (Zimmer et al., 2017). The potential of FDG-PET in diagnosis will be
reviewed further in the next section 1.1.4.3 on brain activity imaging.
Pittsburgh compound B ([11C]PiB) was the first Aβ-selective ligand used in PET scan to visualise
brain amyloid deposition (Klunk et al., 2004). Although [11C]PiB is a thioflavin analogue, it does
not bind to amyloid fibrils of tau or α-synuclein. Retention of [11C]PiB is increased in specific
regions of AD patient brains including frontal, parietal, temporal, occipital cortices,
parahippocampal regions, anterior cingulate gyrus, and striatum (Klunk et al., 2004). Several
48 studies have confirmed the association between postmortem amyloid deposition and [11C]PiB
results in human cases (Burack et al., 2010; Sojkova et al., 2011; Kantarci et al., 2012) especially
in AD cases with region-matched analyses (Ikonomovic et al., 2008). High [11C]PiB may
potentially predict conversion of MCI to AD as 67% (30/45) of high [11C]PiB MCI cases progressed
to AD compared with only 5% (1/20) of low [11C]PiB MCI (Villemagne et al., 2011b). There was
an inverse correlation between baseline episodic memory performance and Aβ burden
especially in MCI patients. The increase in neocortical Aβ deposition is correlated with the
number of ApoE ε4 alleles and the decline in MMSE score, but not the episodic memory
performance deficits
With a short radioactive half-life of 20 mins, long scanning time of 30 min, and limited
production of 11C, [11C]PiB is deemed impractical for clinical purposes (Yeo et al., 2015). This
results in the development and practical investigation of the following three novel compounds
that contain a 110-min long half-life radioisotope 18F with reliable diagnostic odds-ratio:
[18F]florbetapir, [18F]florbetaben, and [18F]flutemetamol (Villemagne et al., 2011a; Clark et al.,
2012; Yeo et al., 2015).
Challenges in tau imaging stem from diversity in strains of tau aggregates (e.g. AD neurofibrillary
tangles, Pick bodies, astrocytic plaques, tufted astrocytes, argyrophilic grains), maturity of tau
deposits (e.g. pre-, mature-, ghost-tangles), and splicing isoform ratio (3R: 4R) in different
tauopathies (reviewed in Leuzy et al., 2019). Regardless, development of tau PET tracer has been
steadily progressing with promise. The first-generation ligands are [18F]THK5317, [18F]THK5351,
[18F]AV1451 (or [18F]flortacipir), and [11C]PBB3. The second-generation ligands – [18F]MK-6240,
[18F]RO-948, [18F]PI-2620, [18F]GTP1, [18F]PM-PBB3, [18F]JNJ64349311, and [18F]JNJ-067 – were
developed since first-generation ligands have off-target binding affinity to dense Aβ plaques or
MAO-B (monoamine oxidase B). Furthermore, imaging of tau does not always follow the
pathological Braak staging (reviewed in Leuzy et al., 2019). Taken together these concerns mean
that further research is needed before these ligands can become part of routine clinical workup
of dementia diagnosis.
It can be difficult to differentiate DLB from AD especially prior to the manifestation of motor
symptoms and hence the development of supporting diagnostic tests has been a priority.
Autoradiography imaging on cryostat sections with a D2 receptor specific ligand [3H]raclopride
showed significantly reduced D2 binding in the caudal putamen in DLB cases compared with
controls and in all levels of the basal ganglia compared with PD; and there was no change
between AD and controls (Piggott et al., 1999). SPECT for a presynaptic dopamine transporter
ligand [123I]N-ω-fluoropropyl-2β-carbomethoxy-3β-(4-iodophenyl)nortropane (FP-CIT) a cocaine
analogue has been implemented for imaging for dopaminergic system and it has demonstrated
49 significantly reduced retention in the DLB patients compared with AD and controls (Walker et
al., 2007; Walker and Walker, 2009). Neuropathological autopsy following the [123I]FP-CIT scan
within a 10 year period confirmed the promising specificity and sensitivity of 88% and 100%
respectively (Walker et al., 2007). PET imaging for VMAT2-specific ligand [18F]AV-133 showed
significantly decreased retention in DLB and PD cases compared with controls and no difference
between AD and controls (Villemagne et al., 2012).
1.3.4.3 Functional brain imaging: FDG-PET, 99mTc-HMPAO SPECT, and fMRI
Glucose hypometabolism detected by [18F]FDG-PET in AD is prevalently found in the medial
temporal cortices, the posterior lateral part of the temporal lobe, the posterior cingulate gyrus,
the inferior parietal lobule, and the precuneus (De Santi et al., 2001). In the parietal region,
[18F]FDG retention is also negatively correlated with amyloid burden measured by [11C]PiB
(Edison et al., 2007). Optimisation of single-subject statistical parametric mapping [18F]FDG-PET
enables significant prediction of MCI conversion to either AD and FTLD in each individual
(Caminiti et al., 2018). The DLB- and AD-like patterns of hypometabolism have been
demonstrated as best predictors for dementia progression in PD cases (Pilotto et al., 2018).
Benefits of in vivo imaging include an opportunity of a longitudinal study. A study on 8 AD
patients showed that signal of [11C]-(R)-PK11195, a ligand of neuroinflammatory microglial
activation marker TSPO (18-kDa translocator protein), is inversely correlated with [18F]FDG-PET
signal but positively correlated with [11C]PiB over disease progression (Fan et al., 2015).
Regional cerebral blood flow is measured by SPECT imaging of 99mTc-HMPAO in the brain and is
correlated with brain regional metabolism. The general gradient of cerebral perfusion is the
same for both AD and control groups with low perfusion in the hippocampus and the highest in
the striatum, thalamus, and cerebellum; and there is no difference between AD and controls in
those mentioned regions (Trollor et al., 2005). In the prefrontal cortex, AD cases exhibit bilateral
reduction of blood flow in the frontal pole and unilateral reduction in the left dorsolateral
region. Cerebral perfusion SPECT helps improve the specificity of episodic memory score to
predict MCI-AD progression (Quaranta et al., 2018). Combination of EEG-biomarkers and 99mTc-
HMPAO SPECT with machine learning technique also show potentials for diagnosis of amnestic
disorders: AD, MCI, DCI, and SCC (Höller et al., 2017).
PET imaging is a potentially invaluable tool to observe in vivo cholinergic degeneration.
Degeneration of the cholinergic system in AD was one of the earliest neurochemical changes
discovered in AD (Bowen et al., 1976). Vesamicol is a high-affinity binding ligand to vesicular
acetylcholine transporter (VAChT) and multiple derivatives/analogues have been developed as
potential PET ligands. Benzovesamicol was found to have higher affinity than vesamicol (Rogers
50 et al., 1989) and several analogues of benzovesamicol such as [123I]-iodobenzovesamicol and
[18F]-Fluoro-ethoxybenzovesamicol (FEOBV) have been widely in multiple human brain imaging
studies (Aghourian et al., 2017; Mazère et al., 2017; Nejad-Davarani et al., 2018). For CHT-1, only
[3H]-hemicholinium has been used in several research studies on animal models and human
autopsy but not human in vivo screening (Bissette et al., 1996; Noshita et al., 2015).
1.3.4.4 Cerebrospinal fluid and blood-based biomarkers
Cerebrospinal fluid (CSF) is generally collected from the lumbar spinal cord by lumbar puncture.
The use of CSF biomarkers as an adjunct to the differential diagnosis of dementia has been
increasingly popular, especially in Scandinavian countries (Simonsen et al., 2017). While there is
not enough evidence to evaluate cost effectiveness of CSF biomarker procedure, complications
of lumbar puncture are not significant and are considered by many outweighed by its diagnostic
benefits. To date the focus of these biomarkers has been two of the neuropathological hallmarks
of AD, Aβ and hyperphosphorylated tau. There are currently no definite diagnostic cut-offs for
Aβ (AD ~ 50% of control), total tau (AD ~ 250% of control), and p-tau (AD ~ 200% of control) but
the sensitivity for AD and prodromal AD can be higher than 90% (reviewed in Blennow, 2017).
Linear scaling values of [11C]PiB is also negatively correlated with the level of Aβ42 in the CSF
(Leuzy et al., 2016). Reduction in CSF Aβ42 level even without detectable amyloid burden PET is
correlated with abnormal connectivity in the default mode network (DMN) (Pereira et al., 2018).
DMN refers to connected brain regions with highly correlated activity as follow: the medial
temporal lobes, the medial prefrontal cortex, the posterior cingulate and precuneus, and the
bilateral angular gyri. However, it was also demonstrated that Aβ burden PET outperformed CSF
Aβ42 and phosphorylated tau in predicting MCI progression to dementia (Caminiti et al., 2018).
While CSF Aβ42 with a cut-off of 507.5 pg/ml could differentiate AD from stable MCI and that
reduction in CSF Aβ42 was correlated with the hippocampal atrophy, lateral ventricle volume,
and white matter lesion, CSF Aβ42 alone is still not a biomarker to efficiently diagnose AD from
PDD or DLB (Janelidze et al., 2016). On the other hand, decreased CSF Aβ42/Aβ40 and
Aβ42/Aβ38 ratios with cut-offs of 0.10 and 0.29 respectively were demonstrated to be
diagnostic biomarkers of AD not DLB/PDD. The same study also reported that patients with
DLB/PDD or vascular dementia had lower levels of the three Aβ isoforms in the CSF, supporting
an idea that an exclusive decrease in CSF Aβ42 is specific to AD.
Screening for blood biomarkers have been continuously investigated in the hope that a test that
was less invasive than those based on CSF could be developed for diagnosis. One definite
diagnostic factor has not yet been discovered as most studies showed diagnostic power only
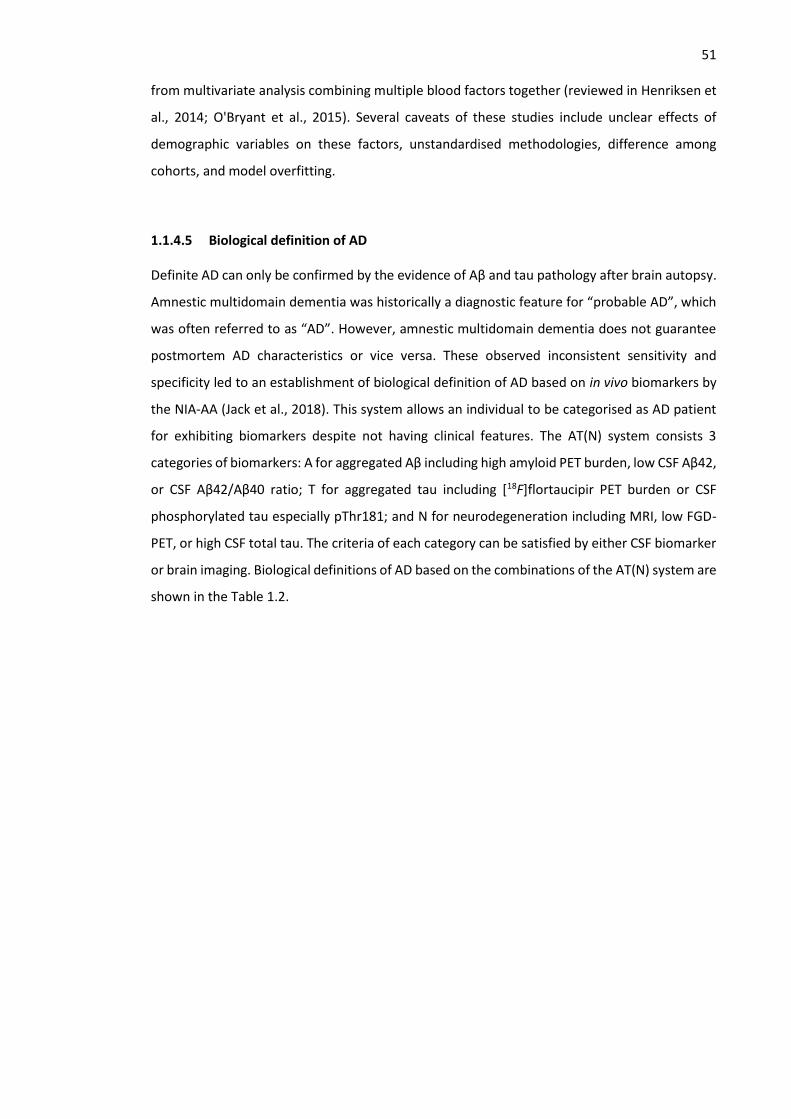
51 from multivariate analysis combining multiple blood factors together (reviewed in Henriksen et
al., 2014; O'Bryant et al., 2015). Several caveats of these studies include unclear effects of
demographic variables on these factors, unstandardised methodologies, difference among
cohorts, and model overfitting.
1.1.4.5 Biological definition of AD
Definite AD can only be confirmed by the evidence of Aβ and tau pathology after brain autopsy.
Amnestic multidomain dementia was historically a diagnostic feature for “probable AD”, which
was often referred to as “AD”. However, amnestic multidomain dementia does not guarantee
postmortem AD characteristics or vice versa. These observed inconsistent sensitivity and
specificity led to an establishment of biological definition of AD based on in vivo biomarkers by
the NIA-AA (Jack et al., 2018). This system allows an individual to be categorised as AD patient
for exhibiting biomarkers despite not having clinical features. The AT(N) system consists 3
categories of biomarkers: A for aggregated Aβ including high amyloid PET burden, low CSF Aβ42,
or CSF Aβ42/Aβ40 ratio; T for aggregated tau including [18F]flortaucipir PET burden or CSF
phosphorylated tau especially pThr181; and N for neurodegeneration including MRI, low FGD-
PET, or high CSF total tau. The criteria of each category can be satisfied by either CSF biomarker
or brain imaging. Biological definitions of AD based on the combinations of the AT(N) system are
shown in the Table 1.2.
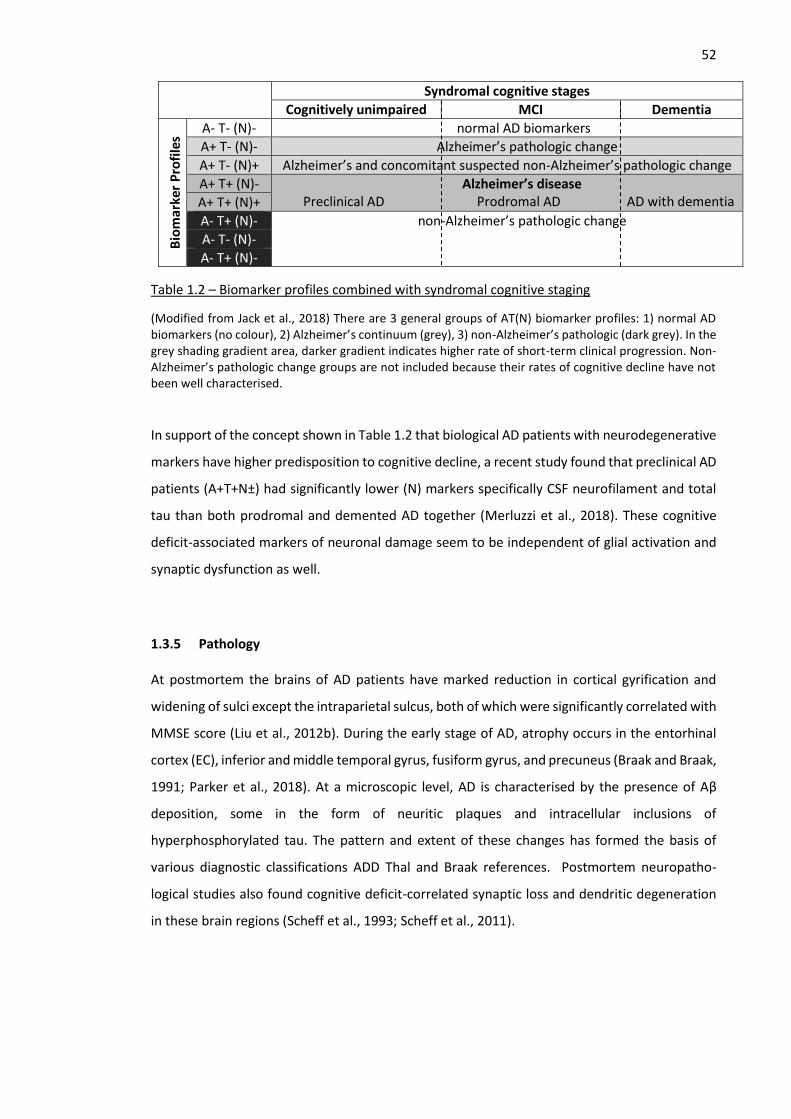
52
Syndromal cognitive stages
Cognitively unimpaired MCI Dementia
Bio
mar
ker
Pro
file
s
A- T- (N)- normal AD biomarkers
A+ T- (N)- Alzheimer’s pathologic change
A+ T- (N)+ Alzheimer’s and concomitant suspected non-Alzheimer’s pathologic change
A+ T+ (N)- Alzheimer’s disease Preclinical AD Prodromal AD AD with dementia A+ T+ (N)+
A- T+ (N)- non-Alzheimer’s pathologic change
A- T- (N)-
A- T+ (N)-
Table 1.2 – Biomarker profiles combined with syndromal cognitive staging
(Modified from Jack et al., 2018) There are 3 general groups of AT(N) biomarker profiles: 1) normal AD biomarkers (no colour), 2) Alzheimer’s continuum (grey), 3) non-Alzheimer’s pathologic (dark grey). In the grey shading gradient area, darker gradient indicates higher rate of short-term clinical progression. Non-Alzheimer’s pathologic change groups are not included because their rates of cognitive decline have not been well characterised.
In support of the concept shown in Table 1.2 that biological AD patients with neurodegenerative
markers have higher predisposition to cognitive decline, a recent study found that preclinical AD
patients (A+T+N±) had significantly lower (N) markers specifically CSF neurofilament and total
tau than both prodromal and demented AD together (Merluzzi et al., 2018). These cognitive
deficit-associated markers of neuronal damage seem to be independent of glial activation and
synaptic dysfunction as well.
1.3.5 Pathology
At postmortem the brains of AD patients have marked reduction in cortical gyrification and
widening of sulci except the intraparietal sulcus, both of which were significantly correlated with
MMSE score (Liu et al., 2012b). During the early stage of AD, atrophy occurs in the entorhinal
cortex (EC), inferior and middle temporal gyrus, fusiform gyrus, and precuneus (Braak and Braak,
1991; Parker et al., 2018). At a microscopic level, AD is characterised by the presence of Aβ
deposition, some in the form of neuritic plaques and intracellular inclusions of
hyperphosphorylated tau. The pattern and extent of these changes has formed the basis of
various diagnostic classifications ADD Thal and Braak references. Postmortem neuropatho-
logical studies also found cognitive deficit-correlated synaptic loss and dendritic degeneration
in these brain regions (Scheff et al., 1993; Scheff et al., 2011).
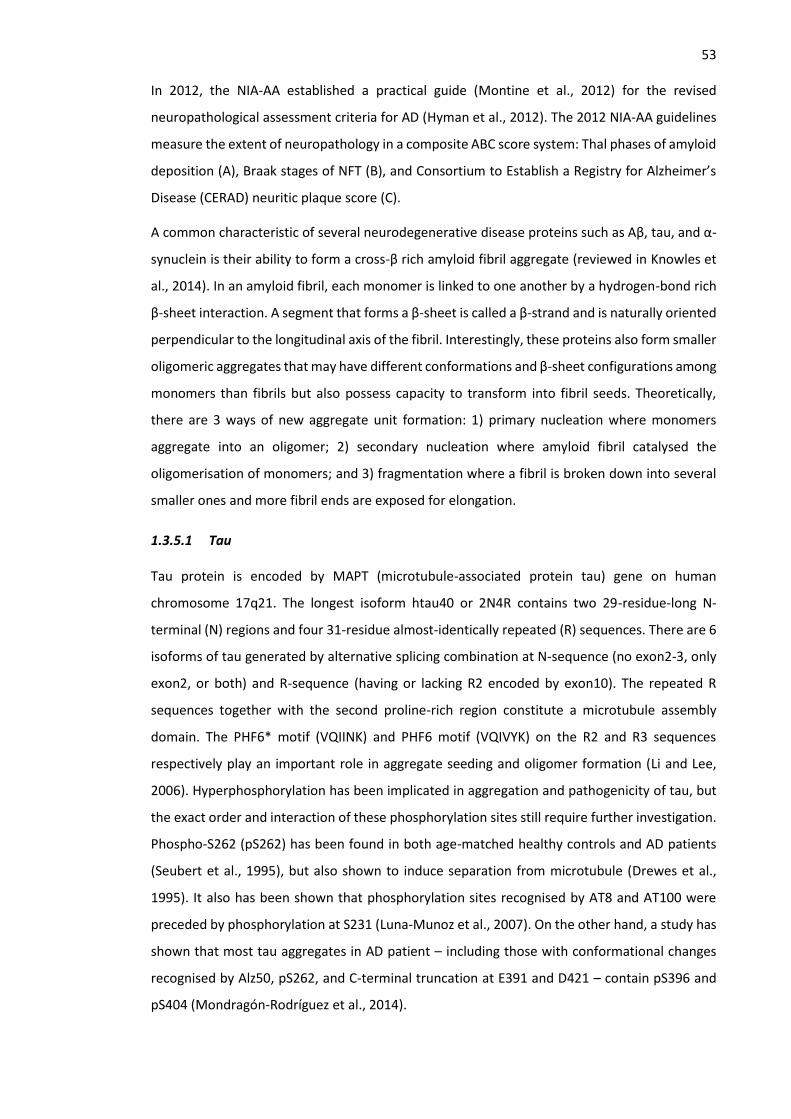
53 In 2012, the NIA-AA established a practical guide (Montine et al., 2012) for the revised
neuropathological assessment criteria for AD (Hyman et al., 2012). The 2012 NIA-AA guidelines
measure the extent of neuropathology in a composite ABC score system: Thal phases of amyloid
deposition (A), Braak stages of NFT (B), and Consortium to Establish a Registry for Alzheimer’s
Disease (CERAD) neuritic plaque score (C).
A common characteristic of several neurodegenerative disease proteins such as Aβ, tau, and α-
synuclein is their ability to form a cross-β rich amyloid fibril aggregate (reviewed in Knowles et
al., 2014). In an amyloid fibril, each monomer is linked to one another by a hydrogen-bond rich
β-sheet interaction. A segment that forms a β-sheet is called a β-strand and is naturally oriented
perpendicular to the longitudinal axis of the fibril. Interestingly, these proteins also form smaller
oligomeric aggregates that may have different conformations and β-sheet configurations among
monomers than fibrils but also possess capacity to transform into fibril seeds. Theoretically,
there are 3 ways of new aggregate unit formation: 1) primary nucleation where monomers
aggregate into an oligomer; 2) secondary nucleation where amyloid fibril catalysed the
oligomerisation of monomers; and 3) fragmentation where a fibril is broken down into several
smaller ones and more fibril ends are exposed for elongation.
1.3.5.1 Tau
Tau protein is encoded by MAPT (microtubule-associated protein tau) gene on human
chromosome 17q21. The longest isoform htau40 or 2N4R contains two 29-residue-long N-
terminal (N) regions and four 31-residue almost-identically repeated (R) sequences. There are 6
isoforms of tau generated by alternative splicing combination at N-sequence (no exon2-3, only
exon2, or both) and R-sequence (having or lacking R2 encoded by exon10). The repeated R
sequences together with the second proline-rich region constitute a microtubule assembly
domain. The PHF6* motif (VQIINK) and PHF6 motif (VQIVYK) on the R2 and R3 sequences
respectively play an important role in aggregate seeding and oligomer formation (Li and Lee,
2006). Hyperphosphorylation has been implicated in aggregation and pathogenicity of tau, but
the exact order and interaction of these phosphorylation sites still require further investigation.
Phospho-S262 (pS262) has been found in both age-matched healthy controls and AD patients
(Seubert et al., 1995), but also shown to induce separation from microtubule (Drewes et al.,
1995). It also has been shown that phosphorylation sites recognised by AT8 and AT100 were
preceded by phosphorylation at S231 (Luna-Munoz et al., 2007). On the other hand, a study has
shown that most tau aggregates in AD patient – including those with conformational changes
recognised by Alz50, pS262, and C-terminal truncation at E391 and D421 – contain pS396 and
pS404 (Mondragón-Rodríguez et al., 2014).
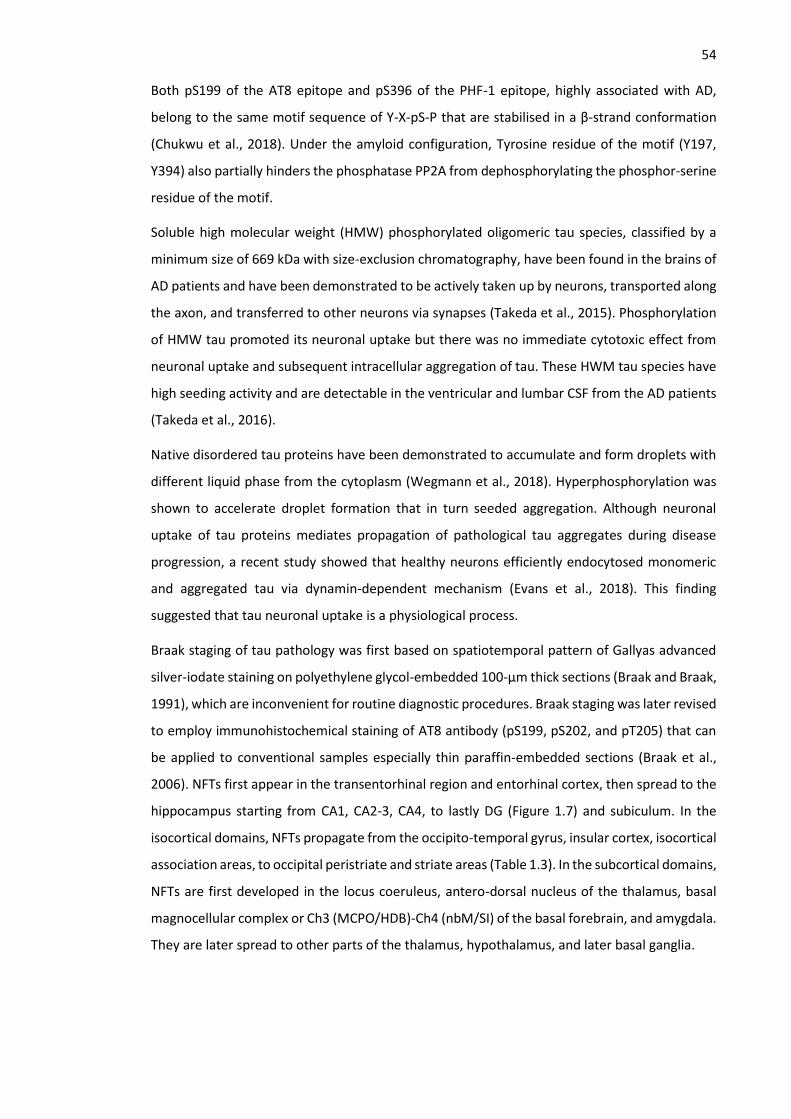
54 Both pS199 of the AT8 epitope and pS396 of the PHF-1 epitope, highly associated with AD,
belong to the same motif sequence of Y-X-pS-P that are stabilised in a β-strand conformation
(Chukwu et al., 2018). Under the amyloid configuration, Tyrosine residue of the motif (Y197,
Y394) also partially hinders the phosphatase PP2A from dephosphorylating the phosphor-serine
residue of the motif.
Soluble high molecular weight (HMW) phosphorylated oligomeric tau species, classified by a
minimum size of 669 kDa with size-exclusion chromatography, have been found in the brains of
AD patients and have been demonstrated to be actively taken up by neurons, transported along
the axon, and transferred to other neurons via synapses (Takeda et al., 2015). Phosphorylation
of HMW tau promoted its neuronal uptake but there was no immediate cytotoxic effect from
neuronal uptake and subsequent intracellular aggregation of tau. These HWM tau species have
high seeding activity and are detectable in the ventricular and lumbar CSF from the AD patients
(Takeda et al., 2016).
Native disordered tau proteins have been demonstrated to accumulate and form droplets with
different liquid phase from the cytoplasm (Wegmann et al., 2018). Hyperphosphorylation was
shown to accelerate droplet formation that in turn seeded aggregation. Although neuronal
uptake of tau proteins mediates propagation of pathological tau aggregates during disease
progression, a recent study showed that healthy neurons efficiently endocytosed monomeric
and aggregated tau via dynamin-dependent mechanism (Evans et al., 2018). This finding
suggested that tau neuronal uptake is a physiological process.
Braak staging of tau pathology was first based on spatiotemporal pattern of Gallyas advanced
silver-iodate staining on polyethylene glycol-embedded 100-µm thick sections (Braak and Braak,
1991), which are inconvenient for routine diagnostic procedures. Braak staging was later revised
to employ immunohistochemical staining of AT8 antibody (pS199, pS202, and pT205) that can
be applied to conventional samples especially thin paraffin-embedded sections (Braak et al.,
2006). NFTs first appear in the transentorhinal region and entorhinal cortex, then spread to the
hippocampus starting from CA1, CA2-3, CA4, to lastly DG (Figure 1.7) and subiculum. In the
isocortical domains, NFTs propagate from the occipito-temporal gyrus, insular cortex, isocortical
association areas, to occipital peristriate and striate areas (Table 1.3). In the subcortical domains,
NFTs are first developed in the locus coeruleus, antero-dorsal nucleus of the thalamus, basal
magnocellular complex or Ch3 (MCPO/HDB)-Ch4 (nbM/SI) of the basal forebrain, and amygdala.
They are later spread to other parts of the thalamus, hypothalamus, and later basal ganglia.
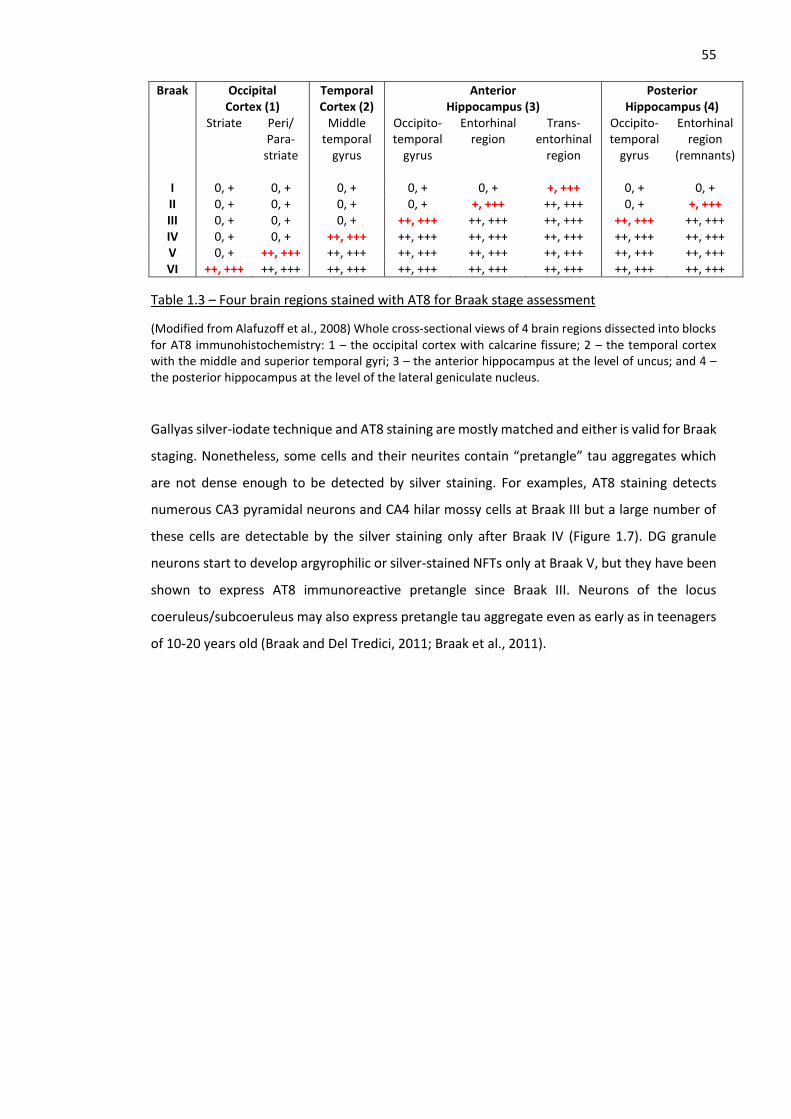
55 Braak Occipital
Cortex (1) Temporal Cortex (2)
Anterior Hippocampus (3)
Posterior Hippocampus (4)
Striate Peri/ Para-
striate
Middle temporal
gyrus
Occipito-temporal
gyrus
Entorhinal region
Trans-entorhinal
region
Occipito-temporal
gyrus
Entorhinal region
(remnants) I 0, + 0, + 0, + 0, + 0, + +, +++ 0, + 0, + II 0, + 0, + 0, + 0, + +, +++ ++, +++ 0, + +, +++ III 0, + 0, + 0, + ++, +++ ++, +++ ++, +++ ++, +++ ++, +++ IV 0, + 0, + ++, +++ ++, +++ ++, +++ ++, +++ ++, +++ ++, +++ V 0, + ++, +++ ++, +++ ++, +++ ++, +++ ++, +++ ++, +++ ++, +++ VI ++, +++ ++, +++ ++, +++ ++, +++ ++, +++ ++, +++ ++, +++ ++, +++
Table 1.3 – Four brain regions stained with AT8 for Braak stage assessment
(Modified from Alafuzoff et al., 2008) Whole cross-sectional views of 4 brain regions dissected into blocks for AT8 immunohistochemistry: 1 – the occipital cortex with calcarine fissure; 2 – the temporal cortex with the middle and superior temporal gyri; 3 – the anterior hippocampus at the level of uncus; and 4 – the posterior hippocampus at the level of the lateral geniculate nucleus.
Gallyas silver-iodate technique and AT8 staining are mostly matched and either is valid for Braak
staging. Nonetheless, some cells and their neurites contain “pretangle” tau aggregates which
are not dense enough to be detected by silver staining. For examples, AT8 staining detects
numerous CA3 pyramidal neurons and CA4 hilar mossy cells at Braak III but a large number of
these cells are detectable by the silver staining only after Braak IV (Figure 1.7). DG granule
neurons start to develop argyrophilic or silver-stained NFTs only at Braak V, but they have been
shown to express AT8 immunoreactive pretangle since Braak III. Neurons of the locus
coeruleus/subcoeruleus may also express pretangle tau aggregate even as early as in teenagers
of 10-20 years old (Braak and Del Tredici, 2011; Braak et al., 2011).
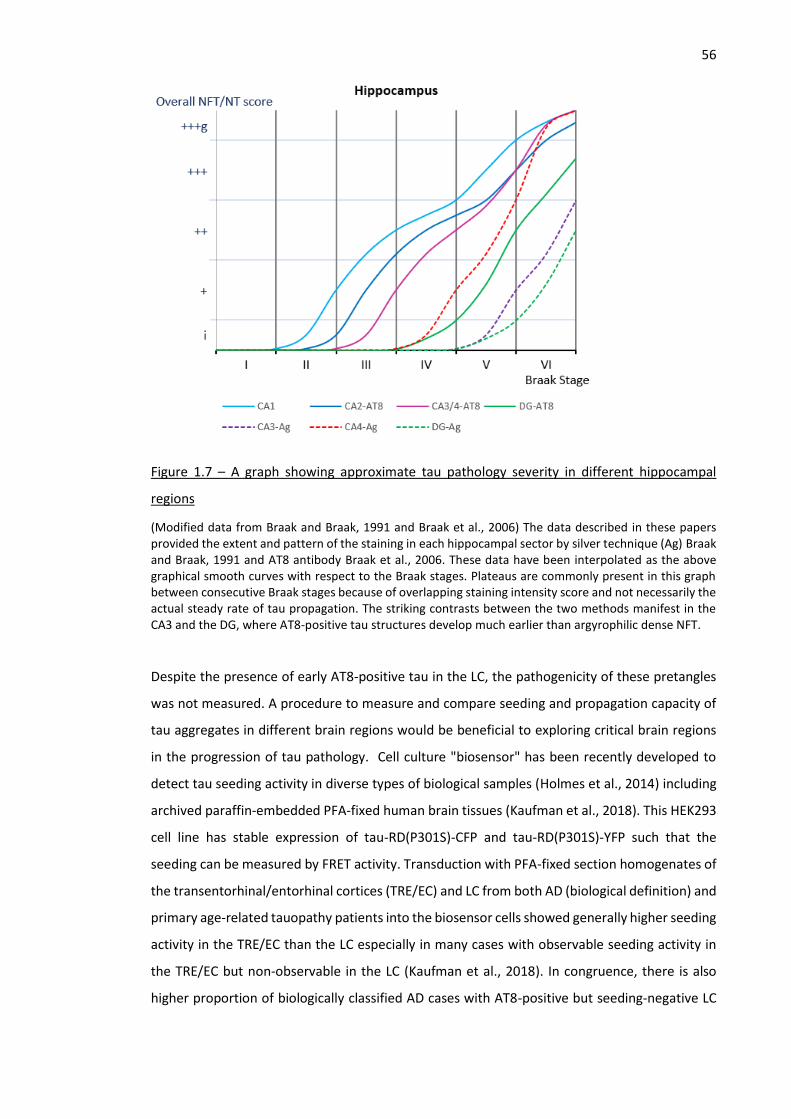
56
Figure 1.7 – A graph showing approximate tau pathology severity in different hippocampal
regions
(Modified data from Braak and Braak, 1991 and Braak et al., 2006) The data described in these papers provided the extent and pattern of the staining in each hippocampal sector by silver technique (Ag) Braak and Braak, 1991 and AT8 antibody Braak et al., 2006. These data have been interpolated as the above graphical smooth curves with respect to the Braak stages. Plateaus are commonly present in this graph between consecutive Braak stages because of overlapping staining intensity score and not necessarily the actual steady rate of tau propagation. The striking contrasts between the two methods manifest in the CA3 and the DG, where AT8-positive tau structures develop much earlier than argyrophilic dense NFT.
Despite the presence of early AT8-positive tau in the LC, the pathogenicity of these pretangles
was not measured. A procedure to measure and compare seeding and propagation capacity of
tau aggregates in different brain regions would be beneficial to exploring critical brain regions
in the progression of tau pathology. Cell culture "biosensor" has been recently developed to
detect tau seeding activity in diverse types of biological samples (Holmes et al., 2014) including
archived paraffin-embedded PFA-fixed human brain tissues (Kaufman et al., 2018). This HEK293
cell line has stable expression of tau-RD(P301S)-CFP and tau-RD(P301S)-YFP such that the
seeding can be measured by FRET activity. Transduction with PFA-fixed section homogenates of
the transentorhinal/entorhinal cortices (TRE/EC) and LC from both AD (biological definition) and
primary age-related tauopathy patients into the biosensor cells showed generally higher seeding
activity in the TRE/EC than the LC especially in many cases with observable seeding activity in
the TRE/EC but non-observable in the LC (Kaufman et al., 2018). In congruence, there is also
higher proportion of biologically classified AD cases with AT8-positive but seeding-negative LC
57 than those with AT8-positive but seeding-negative TRE/EC. This finding supports the notion that
early tau aggregation in the LC even in the pre-tangle stages is seeded by tau from the TRE/EC.
1.3.5.2 Aβ
Aβ is generated by proteolytic processing from a precursor protein, amyloid precursor protein
(APP) (Glenner and Wong, 1984). APP is a type I integral protein encoded by APP gene in the
chromosome 21 in human (Tanzi et al., 1987). There are 3 major APP isoforms generated via
alternative splicing: APP695, APP751, and APP770. APP is first excised either by α-secretase
ADAM10 into a luminal sAPP-α and a non-amyloidogenic substrate α-C terminal fragment (CTF)
or by β-secretase BACE1 into a luminal sAPP-β and an amyloidogenic substrate β-CTF. The
segment β-CTF then is cleaved into AICD and different Aβ fragments by γ-secretase complex that
comprises 4 protein subunits: PEN-2, APH-1, substrate-recruiting nicastrin, and catalytic
presenilin (reviewed in De Strooper et al., 2012).
Aβ protein has a natively unfolded conformation instead of a globular structure. The hierarchy
of aggregation follows from an oligomer to a fibril. Different forms of Aβ oligomers have been
observed and artificially reproduced but they can be categorised based on their binding affinity
to a conformation-specific antibody A11: A11-recognisable prefibrillar oligomer and A11-
unrecognisable fibrillar oligomer (reviewed in Glabe, 2008). A11-positive prefibrillar oligomers
of Aβ42 have been reported by several articles to be the main toxic species (Cerf et al., 2009;
Stroud et al., 2012). One type of prefibrillar oligomer contains a stack of 4 β-sheets, each of
which connect four Aβ42 monomers together through their three intramolecular antiparallel
equally segmented β-strands (Gu et al., 2014). These oligomers may undergo strand rotation
conversion to become fibril seeds that have continuous cross-β sheets along the fibril
longitudinal axis and do not contain an intramolecular β-sheet. Several studies have shown Aβ42
fibril structures containing a monomer with a relatively disordered N-terminus and three β-
strand turns (Xiao et al., 2015), but one recent study found a fibril that contains monomers with
four β-strand turns including the N-terminus (Gremer et al., 2017). These findings pointed out
the strain diversity in multiple hierarchies of Aβ aggregates even in systems with wild-type APP.
It has been shown that secondary nucleation plays a significant role in proliferation of Aβ42
fibrils (Cohen et al., 2013; Cohen et al., 2018). This is also consistent with the finding that neuritic
plaques were surrounded by a diffusing halo of oligomers and the density of glutamatergic
synapses is correlated with the distance from the plaque circumference (Koffie et al., 2009). The
rate constant for primary nucleation of Aβ42 is 100 times of the primary nucleation rate constant
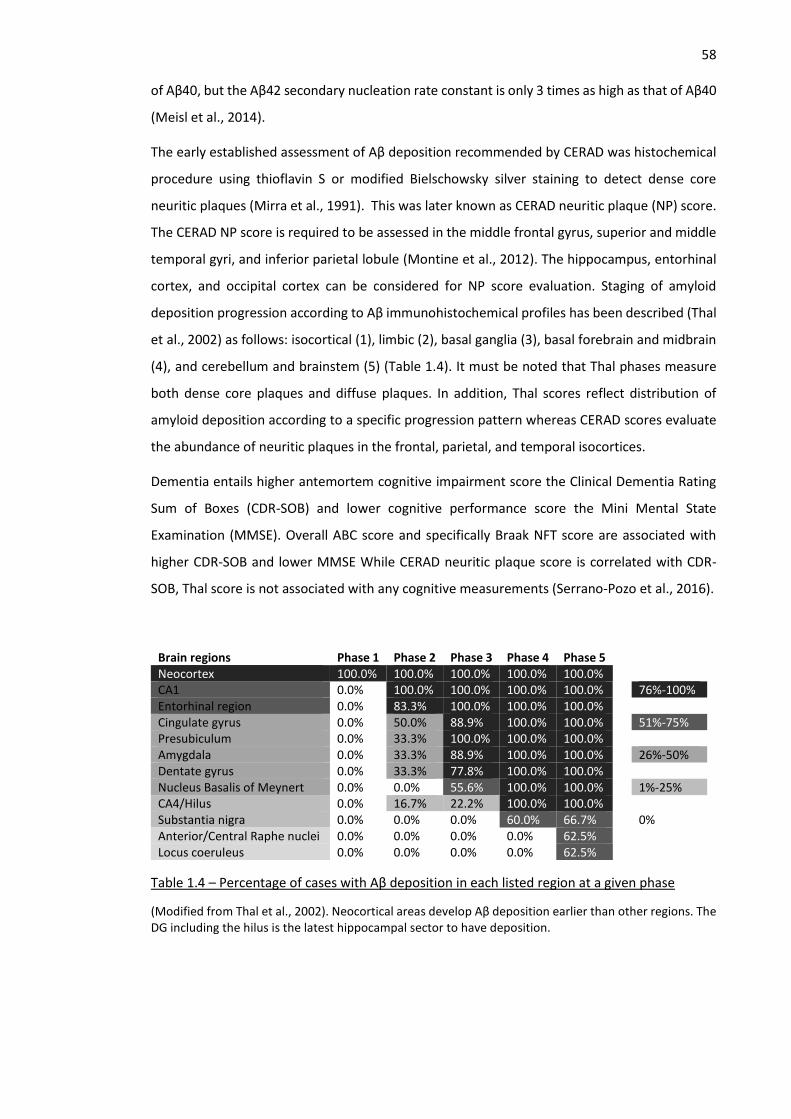
58 of Aβ40, but the Aβ42 secondary nucleation rate constant is only 3 times as high as that of Aβ40
(Meisl et al., 2014).
The early established assessment of Aβ deposition recommended by CERAD was histochemical
procedure using thioflavin S or modified Bielschowsky silver staining to detect dense core
neuritic plaques (Mirra et al., 1991). This was later known as CERAD neuritic plaque (NP) score.
The CERAD NP score is required to be assessed in the middle frontal gyrus, superior and middle
temporal gyri, and inferior parietal lobule (Montine et al., 2012). The hippocampus, entorhinal
cortex, and occipital cortex can be considered for NP score evaluation. Staging of amyloid
deposition progression according to Aβ immunohistochemical profiles has been described (Thal
et al., 2002) as follows: isocortical (1), limbic (2), basal ganglia (3), basal forebrain and midbrain
(4), and cerebellum and brainstem (5) (Table 1.4). It must be noted that Thal phases measure
both dense core plaques and diffuse plaques. In addition, Thal scores reflect distribution of
amyloid deposition according to a specific progression pattern whereas CERAD scores evaluate
the abundance of neuritic plaques in the frontal, parietal, and temporal isocortices.
Dementia entails higher antemortem cognitive impairment score the Clinical Dementia Rating
Sum of Boxes (CDR-SOB) and lower cognitive performance score the Mini Mental State
Examination (MMSE). Overall ABC score and specifically Braak NFT score are associated with
higher CDR-SOB and lower MMSE While CERAD neuritic plaque score is correlated with CDR-
SOB, Thal score is not associated with any cognitive measurements (Serrano-Pozo et al., 2016).
Brain regions Phase 1 Phase 2 Phase 3 Phase 4 Phase 5 Neocortex 100.0% 100.0% 100.0% 100.0% 100.0% CA1 0.0% 100.0% 100.0% 100.0% 100.0% 76%-100% Entorhinal region 0.0% 83.3% 100.0% 100.0% 100.0% Cingulate gyrus 0.0% 50.0% 88.9% 100.0% 100.0% 51%-75% Presubiculum 0.0% 33.3% 100.0% 100.0% 100.0% Amygdala 0.0% 33.3% 88.9% 100.0% 100.0% 26%-50% Dentate gyrus 0.0% 33.3% 77.8% 100.0% 100.0% Nucleus Basalis of Meynert 0.0% 0.0% 55.6% 100.0% 100.0% 1%-25% CA4/Hilus 0.0% 16.7% 22.2% 100.0% 100.0% Substantia nigra 0.0% 0.0% 0.0% 60.0% 66.7% 0% Anterior/Central Raphe nuclei 0.0% 0.0% 0.0% 0.0% 62.5% Locus coeruleus 0.0% 0.0% 0.0% 0.0% 62.5%
Table 1.4 – Percentage of cases with Aβ deposition in each listed region at a given phase
(Modified from Thal et al., 2002). Neocortical areas develop Aβ deposition earlier than other regions. The DG including the hilus is the latest hippocampal sector to have deposition.
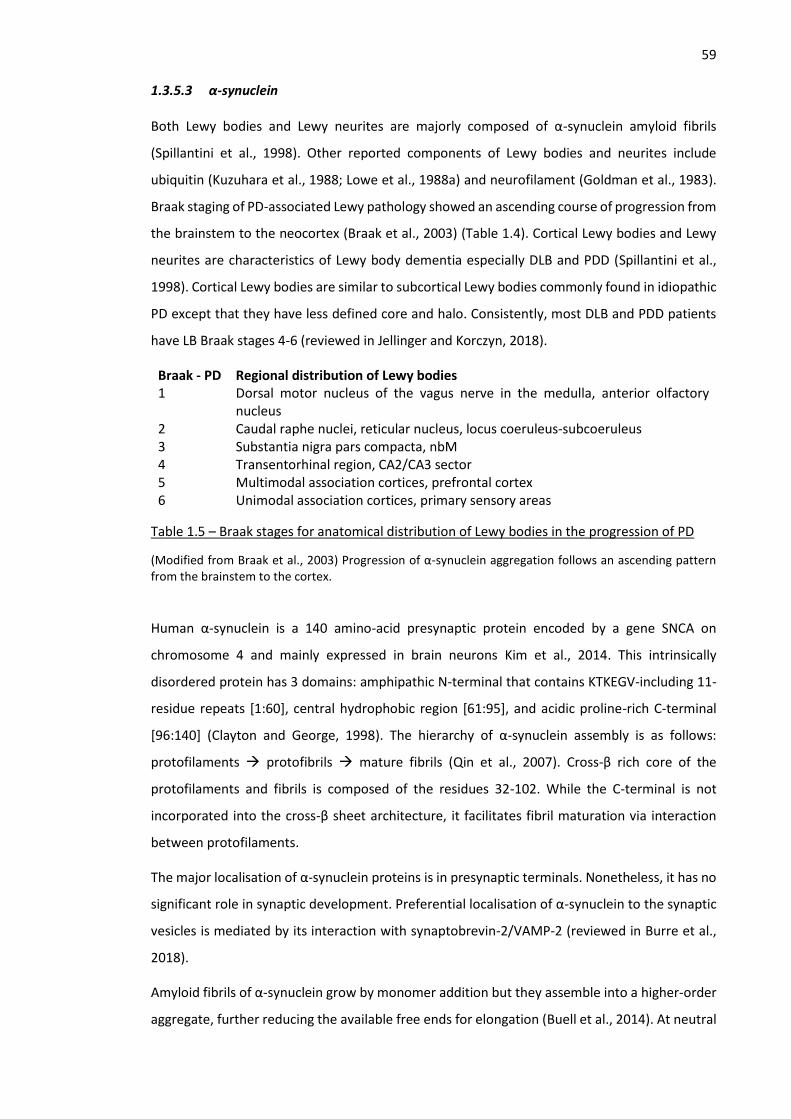
59 1.3.5.3 α-synuclein
Both Lewy bodies and Lewy neurites are majorly composed of α-synuclein amyloid fibrils
(Spillantini et al., 1998). Other reported components of Lewy bodies and neurites include
ubiquitin (Kuzuhara et al., 1988; Lowe et al., 1988a) and neurofilament (Goldman et al., 1983).
Braak staging of PD-associated Lewy pathology showed an ascending course of progression from
the brainstem to the neocortex (Braak et al., 2003) (Table 1.4). Cortical Lewy bodies and Lewy
neurites are characteristics of Lewy body dementia especially DLB and PDD (Spillantini et al.,
1998). Cortical Lewy bodies are similar to subcortical Lewy bodies commonly found in idiopathic
PD except that they have less defined core and halo. Consistently, most DLB and PDD patients
have LB Braak stages 4-6 (reviewed in Jellinger and Korczyn, 2018).
Braak - PD Regional distribution of Lewy bodies 1 Dorsal motor nucleus of the vagus nerve in the medulla, anterior olfactory
nucleus 2 Caudal raphe nuclei, reticular nucleus, locus coeruleus-subcoeruleus 3 Substantia nigra pars compacta, nbM 4 Transentorhinal region, CA2/CA3 sector 5 Multimodal association cortices, prefrontal cortex 6 Unimodal association cortices, primary sensory areas
Table 1.5 – Braak stages for anatomical distribution of Lewy bodies in the progression of PD
(Modified from Braak et al., 2003) Progression of α-synuclein aggregation follows an ascending pattern from the brainstem to the cortex.
Human α-synuclein is a 140 amino-acid presynaptic protein encoded by a gene SNCA on
chromosome 4 and mainly expressed in brain neurons Kim et al., 2014. This intrinsically
disordered protein has 3 domains: amphipathic N-terminal that contains KTKEGV-including 11-
residue repeats [1:60], central hydrophobic region [61:95], and acidic proline-rich C-terminal
[96:140] (Clayton and George, 1998). The hierarchy of α-synuclein assembly is as follows:
protofilaments → protofibrils → mature fibrils (Qin et al., 2007). Cross-β rich core of the
protofilaments and fibrils is composed of the residues 32-102. While the C-terminal is not
incorporated into the cross-β sheet architecture, it facilitates fibril maturation via interaction
between protofilaments.
The major localisation of α-synuclein proteins is in presynaptic terminals. Nonetheless, it has no
significant role in synaptic development. Preferential localisation of α-synuclein to the synaptic
vesicles is mediated by its interaction with synaptobrevin-2/VAMP-2 (reviewed in Burre et al.,
2018).
Amyloid fibrils of α-synuclein grow by monomer addition but they assemble into a higher-order
aggregate, further reducing the available free ends for elongation (Buell et al., 2014). At neutral
60 pH, rates of primary nucleation, fragmentation, and secondary nucleation are negligible.
However, mildly acidic environment such as in endosome or lysosome substantially increases
the rate of secondary nucleation. Presence of metal ions such as Cu2+ also affects α-synuclein
aggregation and characteristics of the resulting aggregates (Villar-Pique et al., 2016). Addition
of Cu2+ enhances aggregate formation in neurites and perikarya. Nuclear α-synuclein aggregates
are also observed only under Cu2+ treatment. While neuritic and perikaryal inclusions mainly
comprise of added recombinant α-synuclein, nuclear inclusions are strictly composed of
endogenous α-synuclein.
Despite varying sizes, β-sheet contents, and hydrophobicity, all oligomers of α-synuclein share
hollow cylindrical architectures (Chen et al., 2015b). While monomers have no effects on ROS
production in rat midbrain neuronal culture, oligomers facilitate higher ROS production than
fibrils do. Oligomers effectively disrupt the membrane with high content of acidic phospholipids
and low content of proteins. Interestingly, the mechanism may not directly involve pore
formation despite the hollow structure of the oligomer. While oligomers exhibit greater toxicity
than fibrils in neuronal cultures, inoculation of various aggregate species (oligomers, ribbons,
and fibrils) demonstrated that fibrils are the most toxic species in vivo as indicated by loss of TH-
positive neurons and striatal axon volume, impaired motor function, and long persistence in the
brain (Peelaerts et al., 2015).
The most prevalent posttranslational modification of α-synuclein is phosphorylation. In the brain
of DLB patients, phosphorylation at S129 is found in 90% of the deposited α-synucleins but only
in 4% of the soluble population Anderson et al., 2006. Fibrils of phosphorylated S129 α-synuclein
injected into the mouse striatum have higher capacity to seed inclusions in both SNpc and cortex
than wild-type fibrils (Karampetsou et al., 2017). Neuronal uptake of phosphorylated S129 fibrils
is also greater than that of wild-type fibrils. Ubiquitination at K12, K21, and K23 are only found
on Lewy body-incorporated α-synuclein and the majority of these α-synuclein have
phosphorylated S129 (Anderson et al., 2006). Less common sites of phosphorylation are S87,
Y125, Y133, and Y135 (Okochi et al., 2000).
Both PDD and DLB have been proposed to be characterised by ascending propagation of α-
synuclein-associated pathology from the medulla to the cortex (Braak et al., 2003; Jellinger,
2008). Lewy body pathologies were extensive in the substantia nigra, ventral tegmental area,
raphe nuclei, pedunculopontine nuclei, locus coeruleus, reticular formation, and dorsal motor
vagal nucleus (Seidel et al., 2015). Coiled bodies are α-synuclein aggregates in oligodendrocytes
and they were present in most brainstem nuclei. Lewy bodies are also present in the cerebellar
nuclei and adjacent white matter of both PDD and DLB patients (Seidel et al., 2017). Within the
hippocampal formation of DLB patients, α-synuclein pathology is highest in the CA2 and the
61 entorhinal cortex but the decline in cognitive performance is more correlated with Lewy
pathology in the CA1 than that in the CA2 (Adamowicz et al., 2017). DLB and PDD, nonetheless,
have pathological dissimilarities (reviewed in Jellinger and Korczyn, 2018). Lewy body load in the
temporal and parietal cortex is higher in DLB than in PDD and this burden is also correlated to
cognitive decline only in DLB but not PDD (Howlett et al., 2014).
1.3.5.4 Mixed pathologies
A cross-sectional community-based study in Brazil reported that 20% among 480 subjects that
met the criteria for neuropathological diagnosis had mixed pathologies (Suemoto et al., 2017).
AD pathology of at least Braak III and CERAD 2 in combination with other pathologies namely
vascular disease (7.7%), Lewy body disease with Braak PD stage of at least 3 (5.2%), or others
including TDP-43 (4.4%) were the most common types of mixed pathologies. Another
community-based study in Mayo Clinic Study of Aging in Minnesota on neuropathology with
similar NFT tau criteria but more flexible Aβ and synuclein pathological criteria found that up to
16%, 10%, and 8% of 161 clinically normal subjects had AD pathology mixed with vascular
disease, synuclein, and TDP-43 respectively (Wennberg et al., 2019). Both studies also reported
that tau pathology was the best predictor of cognitive decline.
DLB generally have higher AD-associated pathologies namely tau and Aβ loads in the cortex and
striatum than PDD (reviewed in Jellinger and Korczyn, 2018). Aβ40 burden and Aβ42:Aβ40 ratio
in the prefrontal cortex were correlated with MMSE decline in PDD but not DLB (Howlett et al.,
2014). AD patients also developed multiple patterns of Lewy body pathology. A study
categorised 146 AD cases with Lewy bodies into 3 major types: amygdala (62), transitional (32),
and diffuse (52) (Uchikado et al., 2006). While most (92%) of the amygdala type did not fit the
PD Braak staging, only 19% and 6% of the transitional and diffuse did not fit the standard Lewy
pathology Braak scheme. Furthermore, Lewy body density in the amygdala was also correlated
with Lewy body density in the EC and with NFT in the amygdala, but there was no difference in
clinical features between AD cases with amygdala Lewy bodies and AD cases without
synucleinopathy.
Tar-DNA binding protein-43 (TDP-43) is a major protein in an inclusion commonly found in
frontotemporal lobar degeneration (FTLD) TDP subtype and amyotrophic lateral sclerosis
(reviewed in Rahimi and Kovacs, 2014). TDP-43 inclusion in the hippocampus was significantly
associated with higher rates of hippocampal atrophy in subjects with Braak III-IV and to a slightly
lesser extent in those with Braak V-VI (Josephs et al., 2017). A recent study demonstrated that
62 APOE ε4 allele was associated with higher TDP-43 burden that in turn mediated higher odds of
hippocampal sclerosis through AD pathology-independent mechanisms (Yang et al., 2018).
Different neuropathological proteins can facilitate progression of one another through various
mechanisms (reviewed in Spires-Jones et al., 2017). Insoluble and soluble pS129 α-synuclein
levels were differentially correlated with insoluble and soluble Aβ in different brain regions and
the insoluble pS129 α-synuclein in the midfrontal cortex was also correlated with Braak stages
in a PD/DLB cohort (Swirski et al., 2014). The same study also demonstrated that Aβ42 aggregate
significantly induced S129 phosphorylation in SH-SY5Y cells and more effectively than Aβ40 did.
Overexpression of α-synuclein in J20 transgenic AD mouse model by crossing with human α-syn
overexpressing mouse line significantly reduced Aβ deposition but aggravated apoptosis-
associated cell-cycle re-entry, production of Aβ oligomers, and memory impairment (Khan et al.,
2018). Conversely, knock-out of SNCA by crossing J20 with SNCA-null mice increased amyloid
burden but also significantly decreased all of the above synuclein overexpression-associated
deleterious effects. Another study also showed that reducing endogenous α-synuclein
expression in APPSwe/Lon transgenic mice rescued reduction in hippocampal ChAT-positive axons,
degeneration of CA3 pyramidal neurons, and memory deficits (Spencer et al., 2016). On the
other hand, α-synuclein could stimulate GSK-3β-mediated tau phosphorylation by directly
forming a heterotrimeric complex (Kawakami et al., 2011). Another important mechanism is
called cross-seeding where a misfolded aggregate of one protein can incorporate different
proteins with aggregation propensity and similar potential conformation into a heterologous
aggregate (reviewed in Soto and Pritzkow, 2018). For example, it was recently demonstrated
that α-synuclein can cross-seed tau into a unique and stable toxic tau oligomeric strain that does
not naturally undergo fibrillization (Castillo-Carranza et al., 2018).
1.3.6 Genetic risk factors
It was estimated by studies on twin and families that genetic inheritance is likely to contribute
in up to 80% of AD cases (Gatz et al., 2006). Early onset AD (EOAD) is defined by the age onset
below 65 years. Multiple rare mutations in APP, PSEN1, and PSEN2 have autosomal dominant
effects to cause early-onset familial AD (FAD), which constitute about 5% of AD patients
(reviewed in Tanzi, 2012). A population-based study calculated the prevalence of EOAD and FAD-
caused EOAD to be 41.2 and 5.3 per 100,000 persons at risk respectively; FAD hence account for
12.9% of EOAD (Campion et al., 1999). Late-onset AD (LOAD) is the most common form.
Polymorphisms in ApoE gene have the greatest influence on the risk of LOAD: ε3/ε4 and ε4/ε4
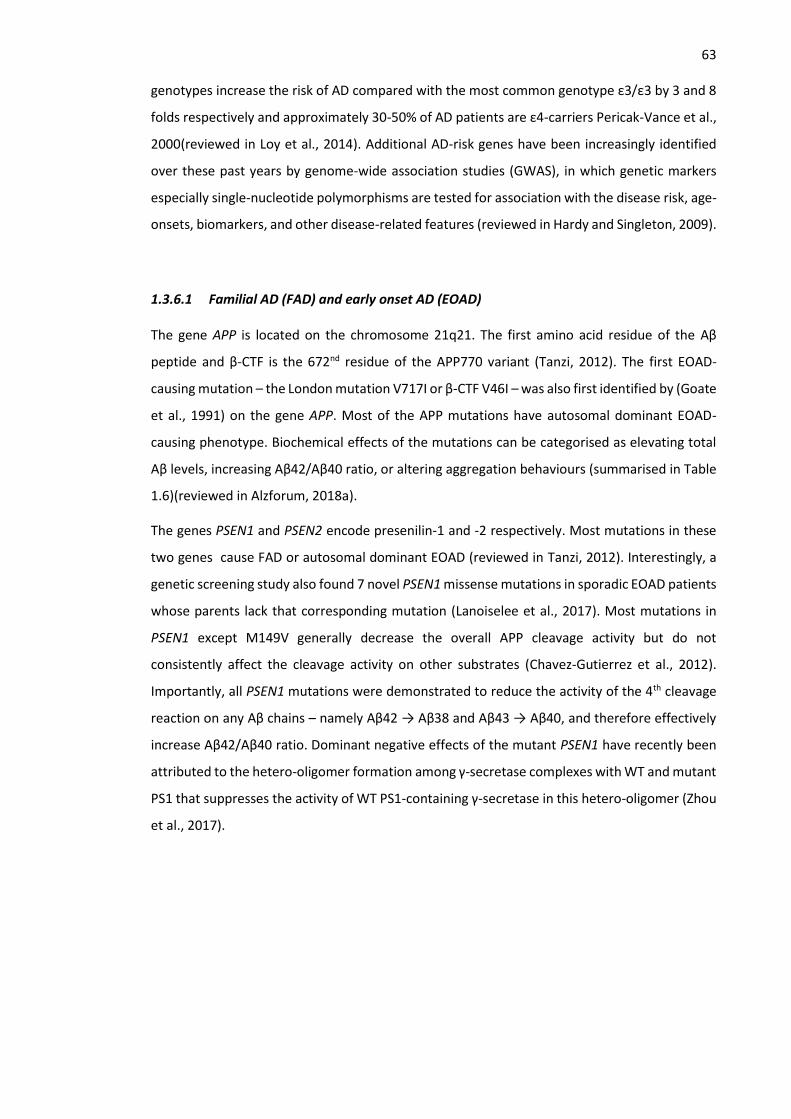
63 genotypes increase the risk of AD compared with the most common genotype ε3/ε3 by 3 and 8
folds respectively and approximately 30-50% of AD patients are ε4-carriers Pericak-Vance et al.,
2000(reviewed in Loy et al., 2014). Additional AD-risk genes have been increasingly identified
over these past years by genome-wide association studies (GWAS), in which genetic markers
especially single-nucleotide polymorphisms are tested for association with the disease risk, age-
onsets, biomarkers, and other disease-related features (reviewed in Hardy and Singleton, 2009).
1.3.6.1 Familial AD (FAD) and early onset AD (EOAD)
The gene APP is located on the chromosome 21q21. The first amino acid residue of the Aβ
peptide and β-CTF is the 672nd residue of the APP770 variant (Tanzi, 2012). The first EOAD-
causing mutation – the London mutation V717I or β-CTF V46I – was also first identified by (Goate
et al., 1991) on the gene APP. Most of the APP mutations have autosomal dominant EOAD-
causing phenotype. Biochemical effects of the mutations can be categorised as elevating total
Aβ levels, increasing Aβ42/Aβ40 ratio, or altering aggregation behaviours (summarised in Table
1.6)(reviewed in Alzforum, 2018a).
The genes PSEN1 and PSEN2 encode presenilin-1 and -2 respectively. Most mutations in these
two genes cause FAD or autosomal dominant EOAD (reviewed in Tanzi, 2012). Interestingly, a
genetic screening study also found 7 novel PSEN1 missense mutations in sporadic EOAD patients
whose parents lack that corresponding mutation (Lanoiselee et al., 2017). Most mutations in
PSEN1 except M149V generally decrease the overall APP cleavage activity but do not
consistently affect the cleavage activity on other substrates (Chavez-Gutierrez et al., 2012).
Importantly, all PSEN1 mutations were demonstrated to reduce the activity of the 4th cleavage
reaction on any Aβ chains – namely Aβ42 → Aβ38 and Aβ43 → Aβ40, and therefore effectively
increase Aβ42/Aβ40 ratio. Dominant negative effects of the mutant PSEN1 have recently been
attributed to the hetero-oligomer formation among γ-secretase complexes with WT and mutant
PS1 that suppresses the activity of WT PS1-containing γ-secretase in this hetero-oligomer (Zhou
et al., 2017).
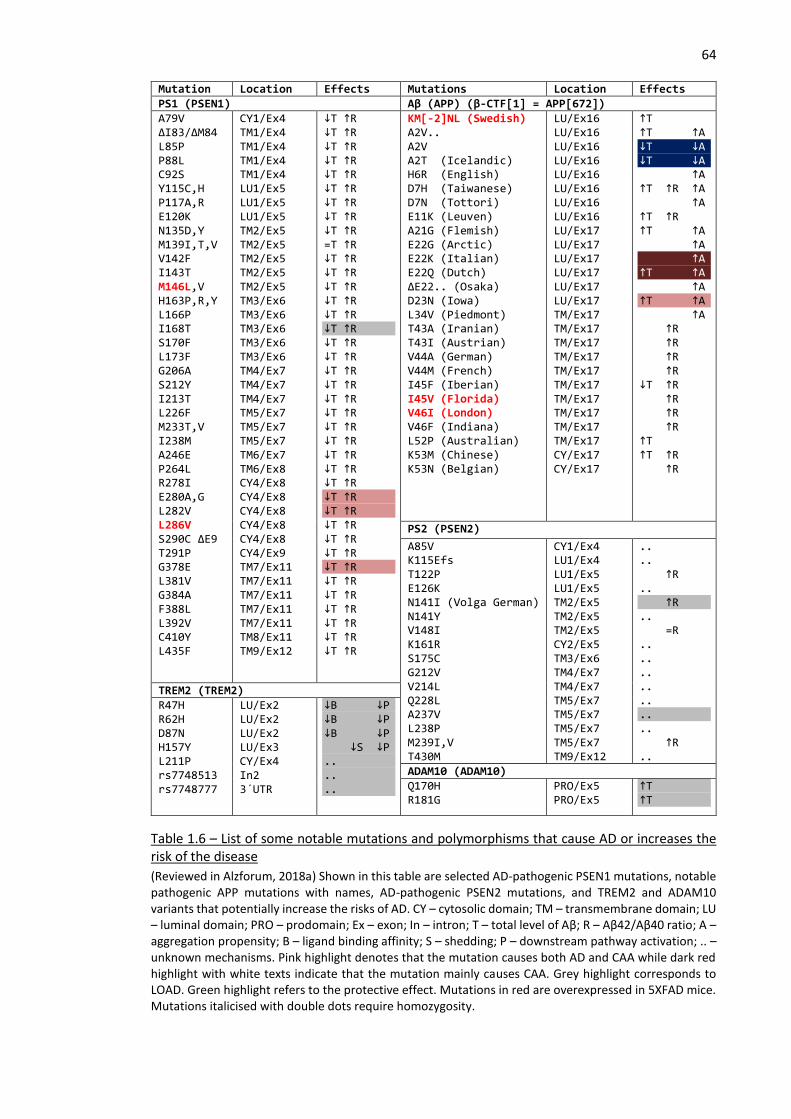
64 Mutation Location Effects Mutations Location Effects PS1 (PSEN1) Aβ (APP) (β-CTF[1] = APP[672]) A79V ΔI83/ΔM84 L85P P88L C92S Y115C,H P117A,R E120K N135D,Y M139I,T,V V142F I143T M146L,V H163P,R,Y L166P I168T S170F L173F G206A S212Y I213T L226F M233T,V I238M A246E P264L R278I E280A,G L282V L286V S290C ΔE9 T291P G378E L381V G384A F388L L392V C410Y L435F
CY1/Ex4 TM1/Ex4 TM1/Ex4 TM1/Ex4 TM1/Ex4 LU1/Ex5 LU1/Ex5 LU1/Ex5 TM2/Ex5 TM2/Ex5 TM2/Ex5 TM2/Ex5 TM2/Ex5 TM3/Ex6 TM3/Ex6 TM3/Ex6 TM3/Ex6 TM3/Ex6 TM4/Ex7 TM4/Ex7 TM4/Ex7 TM5/Ex7 TM5/Ex7 TM5/Ex7 TM6/Ex7 TM6/Ex8 CY4/Ex8 CY4/Ex8 CY4/Ex8 CY4/Ex8 CY4/Ex8 CY4/Ex9 TM7/Ex11 TM7/Ex11 TM7/Ex11 TM7/Ex11 TM7/Ex11 TM8/Ex11 TM9/Ex12
↓T ↑R ↓T ↑R ↓T ↑R ↓T ↑R ↓T ↑R ↓T ↑R ↓T ↑R ↓T ↑R ↓T ↑R =T ↑R ↓T ↑R ↓T ↑R ↓T ↑R ↓T ↑R ↓T ↑R ↓T ↑R ↓T ↑R ↓T ↑R ↓T ↑R ↓T ↑R ↓T ↑R ↓T ↑R ↓T ↑R ↓T ↑R ↓T ↑R ↓T ↑R ↓T ↑R ↓T ↑R ↓T ↑R ↓T ↑R ↓T ↑R ↓T ↑R ↓T ↑R ↓T ↑R ↓T ↑R ↓T ↑R ↓T ↑R ↓T ↑R ↓T ↑R
KM[-2]NL (Swedish) A2V.. A2V A2T (Icelandic) H6R (English) D7H (Taiwanese) D7N (Tottori) E11K (Leuven) A21G (Flemish) E22G (Arctic) E22K (Italian) E22Q (Dutch) ΔE22.. (Osaka) D23N (Iowa) L34V (Piedmont) T43A (Iranian) T43I (Austrian) V44A (German) V44M (French) I45F (Iberian) I45V (Florida) V46I (London) V46F (Indiana) L52P (Australian) K53M (Chinese) K53N (Belgian)
LU/Ex16 LU/Ex16 LU/Ex16 LU/Ex16 LU/Ex16 LU/Ex16 LU/Ex16 LU/Ex16 LU/Ex17 LU/Ex17 LU/Ex17 LU/Ex17 LU/Ex17 LU/Ex17 TM/Ex17 TM/Ex17 TM/Ex17 TM/Ex17 TM/Ex17 TM/Ex17 TM/Ex17 TM/Ex17 TM/Ex17 TM/Ex17 CY/Ex17 CY/Ex17
↑T ↑T ↑A ↓T ↓A ↓T ↓A ↑A ↑T ↑R ↑A ↑A ↑T ↑R ↑T ↑A ↑A ↑A ↑T ↑A ↑A ↑T ↑A ↑A ↑R ↑R ↑R ↑R ↓T ↑R ↑R ↑R ↑R ↑T ↑T ↑R ↑R
PS2 (PSEN2)
A85V K115Efs T122P E126K N141I (Volga German) N141Y V148I K161R S175C G212V V214L Q228L A237V L238P M239I,V T430M
CY1/Ex4 LU1/Ex4 LU1/Ex5 LU1/Ex5 TM2/Ex5 TM2/Ex5 TM2/Ex5 CY2/Ex5 TM3/Ex6 TM4/Ex7 TM4/Ex7 TM5/Ex7 TM5/Ex7 TM5/Ex7 TM5/Ex7 TM9/Ex12
..
.. ↑R .. ↑R .. =R .. .. .. .. .. .. .. ↑R ..
TREM2 (TREM2) R47H R62H D87N H157Y L211P rs7748513 rs7748777
LU/Ex2 LU/Ex2 LU/Ex2 LU/Ex3 CY/Ex4 In2 3΄UTR
↓B ↓P ↓B ↓P ↓B ↓P ↓S ↓P .. .. ..
ADAM10 (ADAM10) Q170H R181G
PRO/Ex5 PRO/Ex5
↑T ↑T
Table 1.6 – List of some notable mutations and polymorphisms that cause AD or increases the risk of the disease
(Reviewed in Alzforum, 2018a) Shown in this table are selected AD-pathogenic PSEN1 mutations, notable pathogenic APP mutations with names, AD-pathogenic PSEN2 mutations, and TREM2 and ADAM10 variants that potentially increase the risks of AD. CY – cytosolic domain; TM – transmembrane domain; LU – luminal domain; PRO – prodomain; Ex – exon; In – intron; T – total level of Aβ; R – Aβ42/Aβ40 ratio; A – aggregation propensity; B – ligand binding affinity; S – shedding; P – downstream pathway activation; .. – unknown mechanisms. Pink highlight denotes that the mutation causes both AD and CAA while dark red highlight with white texts indicate that the mutation mainly causes CAA. Grey highlight corresponds to LOAD. Green highlight refers to the protective effect. Mutations in red are overexpressed in 5XFAD mice. Mutations italicised with double dots require homozygosity.
65 1.3.6.2 Late-onset AD (LOAD)
The APOE gene is located on chromosome 19q13.2 and encodes 299-amino acid protein
apolipoprotein E (apoE). The 3 major alleles ε2, ε3, and ε4 encode the 3 isoforms: apoE2 (Cys112,
Cys158), apoE3 (Cys112, Arg158), and apoE4 (Arg112, Arg158) respectively (reviewed in
Kanekiyo et al., 2014). The residues 136-150 and 244-272 of apoE are binding regions for Aβ and
heparin. ApoE4 with R112 and R158 has a specific conformation that allows a strong interaction
between R61 and E255, rendering it more prone to aggregation. A meta-analysis found that 50%
of AD patient had at least a copy of APOE ε4 and that the presence of ε4 allele increases the risk
of developing AD by 12 fold (Farrer et al., 1997). Patients lacking ε4 allele have low probability
of AD progression regardless of their Aβ deposition by PET imaging and Bdnf V66M mutation
(Lim et al., 2015).
Since the discovery of the linkage between ApoE and BDNF in the context of AD, this has been a
subject of extensive research. This is in part because it provides a mechanistic link between Aβ
pathology, cholinergic function, and adult neurogenesis (Lim et al., 2015; Sen et al., 2015).
Each ApoE isoform has different effects upon astrocytic production of BDNF protein (Sen et al.,
2017). Compared with ApoE3-treated astrocytes, ApoE2 treatment increased production of pre-
pro-BDNF only by 19% but interestingly elevated mature BDNF production by 3 folds and
decreased pro-BDNF secretion by 43%. ApoE4, on the other hand, completely diminished
secretion of any BDNF forms. ApoE4 was also shown to potentiate Aβ seeding and lengthen
brain Aβ half-life (Liu et al., 2017). Treatment with antisense oligonucleotide for APOE in
APP/PS1 APOE-ε4 homozygous reduced the levels of both oligomeric and plaque Aβ species
when conducted at birth and also decreased neuritic degeneration despite enlarging the plaques
when conducted during initial amyloid seeding stage at 6 weeks of age (Huynh et al., 2017).
ApoE4 is more susceptible to cleavage by serine protease into 12-20 kDa smaller toxic N-terminal
fragments specifically in neurons but not astrocytes (Harris et al., 2004). Homozygous APOE-ε4
also increased multiple tau phosphorylation sites and both Aβ42 and Aβ40 levels in iPSC-
differentiated neurons especially GABAergic interneurons (Wang et al., 2018).
In addition to increasing the risk of AD, the presence of APOE-ε4 allele has been shown to
increase the risk of dementia in Lewy body diseases specifically DLB and PDD (Tsuang et al.,
2013). A recent study supported this notion by showing that the APOE-ε4 allele is associated
with higher severity of Lewy pathology regardless of tau or Aβ burden (Dickson et al., 2018).
66 1.3.6.3 LOAD – others
Genome-wide association studies (GWAS) (reviewed in Hardy and Singleton, 2009; Harold et al.,
2009; Lambert et al., 2009; Seshadri et al., 2010; Hollingworth et al., 2011; Naj et al., 2011) have
identified 9 genes, besides APOE, with AD-associated single nucleotide polymorphisms (SNPs)
namely: CR1, BIN1, CD2AP, EPHA1, CLU, MS4A6A, PICALM, ABCA7, and CD33. Two-stage large
meta-analysis on the above GWAS studies identified 11 additional genes with SNPs of significant
AD risk: (stage 1) HLA-DRB5-HLA-DRB1, PTK2B, SORL1, and SLC24A4-RIN3; (stage 1 and 2
combined) ZCWPW1, CELF1, NME8, FERMT2, CASS4, INPP5D, and MEF2C (Lambert et al., 2013).
Some mutations of PSEN1 and PSEN2 cause LOAD instead of EOAD such as PSEN1-I168T, PSEN2-
A237V (Sassi et al., 2014), and PSEN2-N141I (Rogaev et al., 1995). The non-amyloidogenic α-
secretase ADAM10, encoded by the gene ADAM10 on the chromosome 15q22, has also been
reported to have at least 2 mutations that significantly increase the risk of LOAD: Q170H and
R181G (Kim et al., 2009) that have been demonstrated to impair chaperone function of the
prodomain, and hence induce misfolding and decrease enzymatic activity (Suh et al., 2013).
Two examples of LOAD-associated circulatory protein transport genes are CLU and PICALM
which encode clusterin or apolipoprotein J and phosphoinositol binding clathrin assembly
protein respectively (Harold et al., 2009). Clusterin reduces transport of Aβ from the vascular
system to the brain (DeMattos et al., 2004) and PICALM facilitates clathrin-endocytosis of Aβ for
degradation (reviewed in Tanzi, 2012).
TREM2 is a transmembrane protein of immunoglobulin family expressed in microglia. Its
interaction with an adaptor protein DAP12 transduces the signalling by recruiting tyrosine kinase
SYK to activate mTOR pathway (reviewed in Ulland and Colonna, 2018). TREM2 ectodomain can
also be cleaved by ADAM10 or ADAM17, the enzymes also responsible for shedding of APP and
p75NTR. After shedding, its intramembrane domain is later digested by γ-secretase and later
separated from the DAP12. R47H is one of the several rare variants associated with an increased
risk in AD (Guerreiro et al., 2013). TREM2-mutant and TREM2-deficient microglia, due to their
defects in mTOR pathway, undergo excessive autophagy and eventually apoptosis in response
to Aβ plaque exposure (Ulland et al., 2017). Elevated soluble TREM2 ectodomain in the CSF was
correlated with increased white matter diffusivity, which preceded symptom onset, in
autosomal dominant AD patients (Araque Caballero et al., 2018).
1.3.6.4 DLB/PDD
Mutations in the LRRK2 gene, which encodes a large 2527-residued multidomain protein
Leucine-rich repeat kinase 2 (LRRK2), are important risk factors for PD. Postmortem
investigation revealed different neuropathology associated with different LRRK2 mutations
67 (reviewed in Li et al., 2014). For example, R1441C, Y1699C, and G2019S polymorphisms were
associated with Lewy bodies, neurofibrillary tangles, ubiquitin accumulation, and substantia
nigra neuronal loss. Some mutations/polymorphisms are not associated with Lewy bodies and
the neuropathological features of some others remain unclear. Major LRRK2 mutations are
located in the highly conserved ROC and COR domains and kinase domain.
The gene GBA1 on chromosome 1q21 encodes for a lysosomal enzyme glucocerebrosidase
(GCase) (reviewed in Creese et al., 2017). GBA1 is highly susceptible to genetic recombination
because it is located only 16 bp upstream to its 96%-exonic homologous pseudogene
counterpart GBAP Hruska et al., 2008. A subject with homozygous GBA1 mutations may develop
Gaucher’s disease (GD) a lysosomal storage disorder. There are 4 main GD-associated mutations
of GBA1: three missense mutations N370S, D443N, and L444P; and one splicing mutation
IVS10+1G>T (Asselta et al., 2014). N370S and L444P are the most common GD-associated
mutations and they are categorised as non-neuropathic and neuropathic respectively such that
the former and the latter correspond to the type 1 and type 2-3 GD. Type 1 GD involves mild
CNS damage but also higher chance of developing parkinsonism, but type 2-3 is marked by
severe damage and fast progression in the CNS.
Importantly, heterozygous GBA1 mutations are the most prevalent genetic risk for PD and DLB,
but their aetiological mechanisms remain unclear (Nalls et al., 2013). A study (Aharon-Peretz et
al., 2004) has shown that in the populations of Ashkenazi Jews, 31.3% of PD patients but only
4% of AD patients and 6.2% of healthy controls have GBA1 mutations. Other studies have
demonstrated that the frequencies of GBA1 mutations are ethnic-specific with the range of
3.21% (Choi et al., 2012) to 21% (Lwin et al., 2004) in non-Ashkenazi PD patients. Among all 2,766
cases with primary degenerative Parkinsonism from Parkinson Institute Biobank, DLB and
PD/PDD patients have the high frequencies of all 4 GD-associated GBA1 mutations of 13.8% and
4.5% respectively but other parkisonisms show insignificant frequencies of the pathogenic
mutations Asselta et al., 2014. E326K and T369M are two GBA1 variants of which homozygosity
do not lead to GD but their encoded GCase have lower enzymatic activity (Mallett et al., 2016).
E326K is associated with DLB and PDD (Gámez-Valero et al., 2016). An association between
T369M and PD requires further investigation. PD patients with GBA1 mutation are as 3 times
and 2 times at risk for dementia and death as non-carrier PD patients (Cilia et al., 2016). In
addition, GBA1 mutations are also disproportionately found in males (Gámez-Valero et al.,
2016).
The mechanisms of the effects of GBA1 mutations on parkinsonism are still unclear. One study
(Mazzulli et al., 2011) first demonstrated a positive feedback loop between α-synuclein
pathology and GCase dysfunction. Accumulation of glucosylceramide (GlcCer) from the
68 depletion of GCase increases the level of α-synuclein by inhibiting lysosomal protein degradation
and further promoting toxicity by stabilizing α-synuclein oligomers. Patients homozygous or
heterozygous for GBA1 mutation also have higher levels of α-synuclein oligomers. Higher levels
of α-synuclein from overexpression in cell culture in turn induced GCase retention within the
endoplasmic reticulum and hence reduced enzymatic activity. This finding is further supported
by a 40% decrease in GCase activity of PD patients without GBA1 mutations compared with
controls (Mazzulli et al., 2011). It was later demonstrated that GlcCer converted a soluble non-
toxic non-seeding α-synuclein oligomer into a more compact soluble toxic fibril-seeding
oligomer (Zunke et al., 2017). This study also showed that GlcCer-associated oligomers were
resistant to both SDS and proteinase-K, but the physiological oligomers are not. Furthermore,
reduction of GlcCer shifts the equilibrium and decreases the level of toxic α-synuclein oligomers.
Although GCase is ubiquitously expressed in the brain, the following specific neurons in the non-
human primate have been reported to have high levels of GCase: cholinergic neurons of the
nbM, dopaminergic neurons of the SNpc, serotoninergic neurons of the raphe nuclei, and
noradrenergic neurons of the locus coeruleus (Dopeso-Reyes et al., 2018). The significance of
this distribution is not fully understood but it is of particular interest given the vulnerability of
these cellular populations in DLB/PDD.
1.3.6.5 Transgenic mouse models
The discovery of autosomal dominant mutations in APP and PSEN1 has provided the opportunity
for the development of transgenic mouse models. The most widely used models are summarised
in Figure 1.8. While these models have provided significant mechanistic information of the
disease, there are significant limitations. A major limitation of these mice, unlike humans, is that
they do not develop NFT without the presence of non-AD mutations in tau (Kitazawa et al.,
2012). It is therefore best to consider these models as early pre-tau, AD.
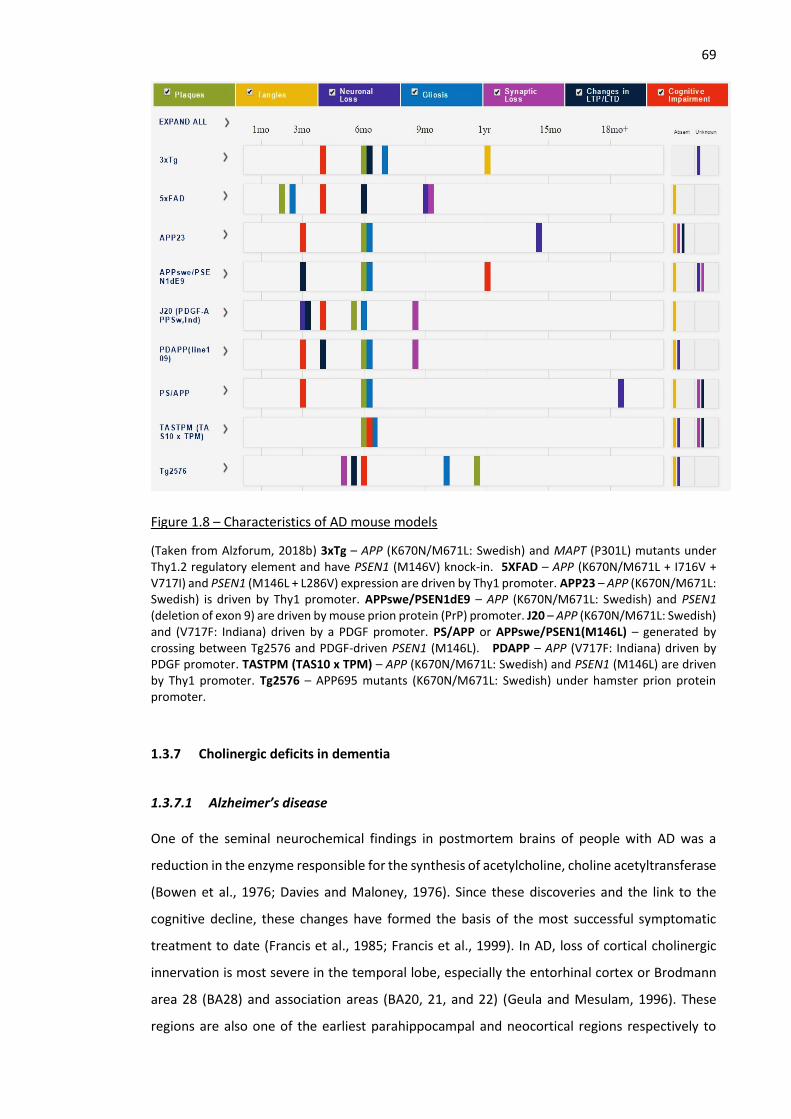
69
Figure 1.8 – Characteristics of AD mouse models
(Taken from Alzforum, 2018b) 3xTg – APP (K670N/M671L: Swedish) and MAPT (P301L) mutants under Thy1.2 regulatory element and have PSEN1 (M146V) knock-in. 5XFAD – APP (K670N/M671L + I716V + V717I) and PSEN1 (M146L + L286V) expression are driven by Thy1 promoter. APP23 – APP (K670N/M671L: Swedish) is driven by Thy1 promoter. APPswe/PSEN1dE9 – APP (K670N/M671L: Swedish) and PSEN1 (deletion of exon 9) are driven by mouse prion protein (PrP) promoter. J20 – APP (K670N/M671L: Swedish) and (V717F: Indiana) driven by a PDGF promoter. PS/APP or APPswe/PSEN1(M146L) – generated by crossing between Tg2576 and PDGF-driven PSEN1 (M146L). PDAPP – APP (V717F: Indiana) driven by PDGF promoter. TASTPM (TAS10 x TPM) – APP (K670N/M671L: Swedish) and PSEN1 (M146L) are driven by Thy1 promoter. Tg2576 – APP695 mutants (K670N/M671L: Swedish) under hamster prion protein promoter.
1.3.7 Cholinergic deficits in dementia
1.3.7.1 Alzheimer’s disease
One of the seminal neurochemical findings in postmortem brains of people with AD was a
reduction in the enzyme responsible for the synthesis of acetylcholine, choline acetyltransferase
(Bowen et al., 1976; Davies and Maloney, 1976). Since these discoveries and the link to the
cognitive decline, these changes have formed the basis of the most successful symptomatic
treatment to date (Francis et al., 1985; Francis et al., 1999). In AD, loss of cortical cholinergic
innervation is most severe in the temporal lobe, especially the entorhinal cortex or Brodmann
area 28 (BA28) and association areas (BA20, 21, and 22) (Geula and Mesulam, 1996). These
regions are also one of the earliest parahippocampal and neocortical regions respectively to
70 develop NFTs (Braak et al., 2006). Depletion of cholinergic innervation in a specific cortical area
is associated with degeneration of cholinergic neurons in a corresponding projecting sector of
the Ch4 NbM/SI (Mufson et al., 1989; Geula and Mesulam, 1996). While ChAT activity and M1-
mAChR/G-protein coupling were reduced more in the frontal than in the temporal cortex, M2-
mAChR and α4β2-nAChR density were decreased more in the frontal cortex (Lai et al., 2006).
Relative preservation of cholinergic fibres in the cingulate cortex, of which most cholinergic
axons are from the MS/DB and Ch4am (Mesulam et al., 1983a), is congruent with the notion
that Ch4am has the lowest neuronal loss (35%) compared with Ch4i (62%), Ch4al (76%), and
Ch4p (77%). Although loss of cholinergic innervation in the hippocampus especially CA1 can be
up to 53%, the remaining cholinergic axon density in the hippocampus was still relatively higher
than in other brain regions and neuronal loss (17%) in the MS/DB in AD patients was not
significant reduced compared with controls (Mesulam et al., 1983a). Decline in ChAT-positive
cholinergic axon density in different hippocampal sectors has also been observed: CA4, CA3-2,
and CA1 Kooi et al., 2011; and DG (Perry et al., 2012). This may be associated with a decrease in
the size of MS/DB BFCNs (Fujishiro et al., 2006).
Nonetheless, multiple pieces of evidence suggested relative preservation or compensation of
hippocampal innervation and MS/DB cholinergic neurons. ChAT activity in the hippocampus was
upregulated in MCI patients compared with controls and AD patients (DeKosky et al., 2002)
especially among cases with NFT Braak stage 3-4 (Ikonomovic et al., 2003). Hippocampal ChAT
activity was also significantly correlated with the density of neuritic plaques in the entorhinal
cortex (Ikonomovic et al., 2003) which is congruent with the findings that entorhinal cortex
lesion can induce cholinergic axon sprouting in the rat hippocampus and that some individual
AD cases had more dense cholinergic innervation in the OML of the DG, where axons from the
entorhinal cortex connect to the dendrites of DG granule neurons, than did controls (Geddes et
al., 1985). Surprisingly, one AD case with extensive cholinergic axon sprouting in the dentate
OML and CA1 stratum moleculare had severe loss of BFCNs in the MS/DB unlike the majority of
AD cases (Hyman et al., 1987). However, two AD cases from the above study exhibited massive
loss of cholinergic axons, visualised by AChE histochemical assay, in the DG and subiculum.
Similarly, another study showed that AD cases with NFT Braak stages IV-VI had a significant
decrease in ChAT immunoreactivity in the DG (Perry et al., 2012). Both in-vivo PET imaging
(Aghourian et al., 2017) and postmortem autoradiography (Parent et al., 2013) of a novel VAChT
tracer [18F]fluoroethoxybenzovesamicol (FEOBV) showed severe reduction in many cortical
regions but no difference in the hippocampus, thalamus, and cerebellum. This observed
plasticity of VAChT in the hippocampus was possibly associated with upregulation in
hippocampal ChAT activity during MCI (DeKosky et al., 2002). Higher levels of CHT1 and choline
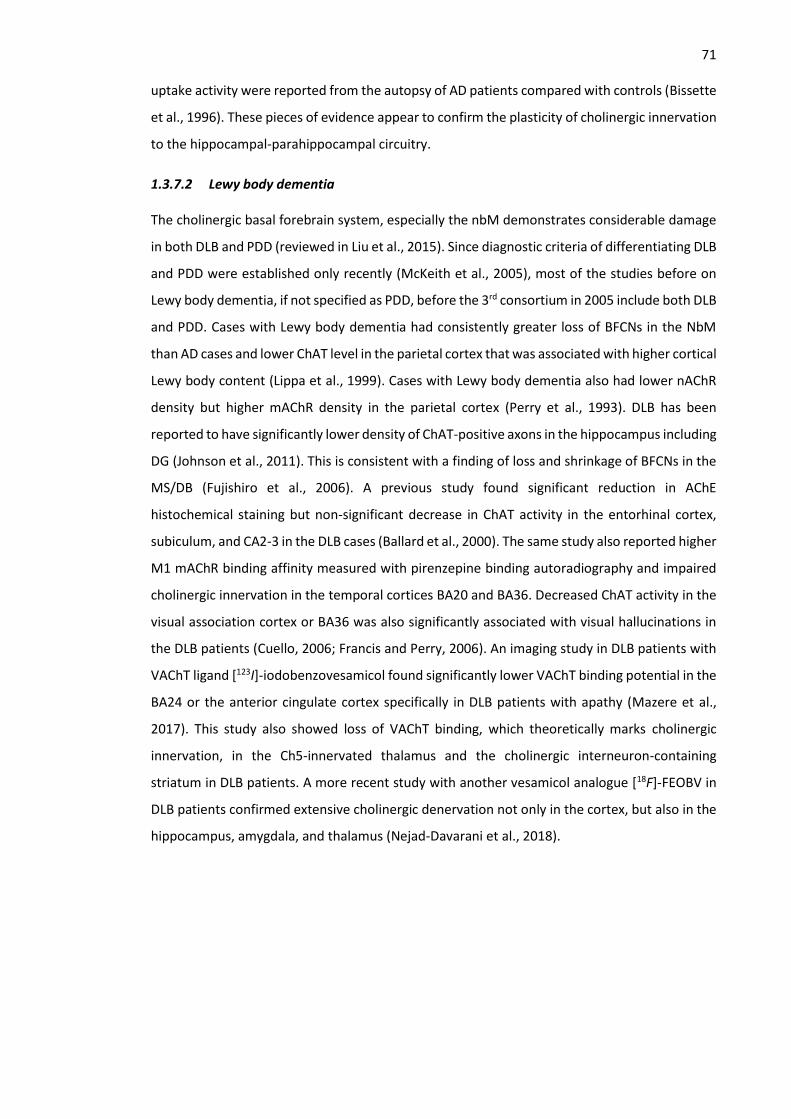
71 uptake activity were reported from the autopsy of AD patients compared with controls (Bissette
et al., 1996). These pieces of evidence appear to confirm the plasticity of cholinergic innervation
to the hippocampal-parahippocampal circuitry.
1.3.7.2 Lewy body dementia
The cholinergic basal forebrain system, especially the nbM demonstrates considerable damage
in both DLB and PDD (reviewed in Liu et al., 2015). Since diagnostic criteria of differentiating DLB
and PDD were established only recently (McKeith et al., 2005), most of the studies before on
Lewy body dementia, if not specified as PDD, before the 3rd consortium in 2005 include both DLB
and PDD. Cases with Lewy body dementia had consistently greater loss of BFCNs in the NbM
than AD cases and lower ChAT level in the parietal cortex that was associated with higher cortical
Lewy body content (Lippa et al., 1999). Cases with Lewy body dementia also had lower nAChR
density but higher mAChR density in the parietal cortex (Perry et al., 1993). DLB has been
reported to have significantly lower density of ChAT-positive axons in the hippocampus including
DG (Johnson et al., 2011). This is consistent with a finding of loss and shrinkage of BFCNs in the
MS/DB (Fujishiro et al., 2006). A previous study found significant reduction in AChE
histochemical staining but non-significant decrease in ChAT activity in the entorhinal cortex,
subiculum, and CA2-3 in the DLB cases (Ballard et al., 2000). The same study also reported higher
M1 mAChR binding affinity measured with pirenzepine binding autoradiography and impaired
cholinergic innervation in the temporal cortices BA20 and BA36. Decreased ChAT activity in the
visual association cortex or BA36 was also significantly associated with visual hallucinations in
the DLB patients (Cuello, 2006; Francis and Perry, 2006). An imaging study in DLB patients with
VAChT ligand [123I]-iodobenzovesamicol found significantly lower VAChT binding potential in the
BA24 or the anterior cingulate cortex specifically in DLB patients with apathy (Mazere et al.,
2017). This study also showed loss of VAChT binding, which theoretically marks cholinergic
innervation, in the Ch5-innervated thalamus and the cholinergic interneuron-containing
striatum in DLB patients. A more recent study with another vesamicol analogue [18F]-FEOBV in
DLB patients confirmed extensive cholinergic denervation not only in the cortex, but also in the
hippocampus, amygdala, and thalamus (Nejad-Davarani et al., 2018).
72 1.3.8 Abnormalities in other neurotransmitter systems
1.3.8.1 Glutamatergic system
In AD patients, presynaptic glutamate reuptake and vesicular glutamate transport are
significantly downregulated in accordance with the severe reduction in cortical synapses
(reviewed in Francis, 2009). These changes have been suggested to lead to higher extrasynaptic
glutamate concentration and less synaptic glutamate signal transmission, hence resulting in
lower signal-to-noise ratio. Several studies found that Aβ42 oligomers stimulated astrocytic
glutamate release to activate extrasynaptic NMDAR (Talantova et al., 2013), decreased neuronal
glutamate uptake (Li et al., 2009b), and impeded astrocytic glutamate reuptake by internalising
the transporter (Scimemi et al., 2013). These findings are in agreement with the notion that LTD
is induced by Aβ42 and activation of perisynaptic NMDAR by leaking glutamate (reviewed in
Palop and Mucke, 2010).
1.3.8.2 GABAergic system
Early studies indicated that GABA was reduced in AD towards the end of the disease while being
relatively preserved early on (Lowe et al., 1988b). Relative preservation of GABAergic
neurotransmission has provided an attractive therapeutic target although such an approach
would not be without problems in disrupting the circuitry. The approach of using a partial
agonist or inverse-agonist has been considered (reviewed in Nava-Mesa et al., 2014). In addition,
there may be mechanistic links between preserved GABA function in AD and the function of
hippocampal circuitry. For example, astrocytes in the DG of AD patients and AD mouse models
produced abnormally high level of GABA, which induced tonic inhibition in the DG circuitry and
subsequently memory impairment in the mouse models, with two potential mechanisms either
through canonical GAD67-dependent pathway (Wu et al., 2014b) or monoamine oxidase B-
catalysed synthesis from putrescine (Jo et al., 2014). Physical brain injury was also demonstrated
to transform resting astrocytes into inhibitory GABA-producing hypertrophic astrocyte in
contrast to enriched environment that increases the number of proBDNF-positive but GABA-
negative hypertrophic astrocytes (Chun et al., 2018). Patients with amnestic MCI exhibited fMRI-
measured hyperactivity at the hippocampal DG/CA3 connections (Yassa et al., 2010; Bakker et
al., 2012) and APOE-ε4 carriers also had fMRI-hyperactivity in the hippocampus (Bookheimer et
al., 2000; Dickerson et al., 2005; Filippini et al., 2009). Loss of hilar GABAergic interneurons in
apoE4 knock-in mice and rescue of cognitive deficits in this model by transplantation lend
support to the notion that apoE4-associated hippocampal hyperactivity in human is attributed
to aberrant GABAergic system (Tong et al., 2014).
73 1.3.8.3 Monoaminergic systems
The serotonergic raphe nuclei also contain a high level of NFTs (Chen et al., 2000; Šimić et al.,
2017) and Aβ deposition (Thal et al., 2002). However, serotonergic nuclei were still not one of
the recommended regions to be investigated for diagnosis (Hyman et al., 2012). AD patients also
experienced severe denervation of neocortical and hippocampal serotonergic axons and loss of
serotonergic neurons in the raphe nuclei (Chen et al., 2000; Lyness et al., 2003; reviewed in Trillo
et al., 2013). Several postmortem studies unanimously showed the reduction in 5-HT in the AD
temporal cortex compared with the controls (Palmer et al., 1987; Garcia-Alloza et al., 2005).
Patients with severe AD also had lower 5-HT in the hippocampus, a part of the temporal gyrus
BA22, and cerebellum (Vermeiren et al., 2014). PET with a selective ligand for 5-HT1A receptor
revealed a decrease in binding densities in the AD hippocampus and this binding decrease was
correlated with MMSE decline and lower glucose metabolism measured by FDG-PET (Kepe et
al., 2006). Serotonergic system-related symptoms observed in AD patients include sleep
fragmentation, depression, and agitation (reviewed in Šimić et al., 2017).
The LC is the major if not the only source of noradrenergic innervation to the cortex and
hippocampus (Foote and Morrison, 1987) and one of the most vulnerable regions to AD
pathology. The severe loss of adrenergic neurons in the LC was also correlated with earlier onset
and duration of dementia (Zarow et al., 2003). Loss of neurons in the LC was significantly
correlated with that in the nbM in both AD and PD patients. The proportion of LC neurons
containing AT8-positive NFT was significantly higher in cases with cognitive impairment than in
cognitively healthy controls (Grudzien et al., 2007). Noradrenaline has also been demonstrated
to protect hippocampal neurons from Aβ42 possibly via stimulation of autocrine or paracrine
release of NGF or BDNF (Counts and Mufson, 2010). AD patients were shown to have lower
levels of noradrenaline in the temporal cortex (Nazarali and Reynolds, 1992). Connectivity
between the left LC and the left parahippocampal gyrus was correlated with memory
performance and was impaired in prodromal AD patients (Jacobs et al., 2015). Interestingly,
among prodromal AD group, patients with higher cognitive performance had higher
compensatory connectivity between the right LC and the left parahippocampal gyrus. A
combination of significant neuronal loss in the LC and relative sparing of neurons in the nbM
was also associated with depression in AD (Förstl et al., 1994).
The two major dopaminergic pathways of interest here are the nigrostriatal tract from the SNpc
to the striatum and the mesocorticolimbic tract from the ventral tegmental area to the
neocortex, hippocampus, subcortical areas and nucleus accumbens. There have been
contradicting results on dopaminergic changes in AD. Some found decreased level of
homovanillic acid in the CSF in vivo (Blennow et al., 1992) and reduced dopamine in postmortem
74 AD brains (reviewed in Trillo et al., 2013) whereas others found increased homovanillic acid in
the CSF in vivo (van der Cammen et al., 2006) and postmortem frontal cortex (Palmer et al.,
1987) of AD patients.
1.3.9 Therapeutic options in dementia
1.3.9.1 Cholinesterase inhibitors
The consistent reduction in cholinergic markers in AD coupled with the correlation of these
changes with symptoms provided the main target for treatment of cognitive symptoms (Francis
et al., 1999). Of the possible approaches, inhibition of the breakdown of acetylcholine by
acetylcholinesterase has proved the most reliable and effective mechanism. Tacrine was the first
approved AChEI for patient treatment (Knapp et al., 1994) but its adverse effects on the liver led
to its discontinuation (Watkins et al., 1994). There are currently 3 licensed AChEIs for AD in UK:
galantamine (Razadyne™ and Reminyl™), donepezil (Aricept™), and rivastigmine (Exelon™)
(reviewed in O'Brien et al., 2017). Galantamine is a reversible competitive inhibitor but
donepezil is a non-competitive inhibitor as it decreases Vmax but not Km of the enzyme (Barnes
et al., 2000). Galantamine is also an α7-nAChR allosteric modulator and its long-term treatment
preserve cognitive performance for at least a year (Lilienfeld and Kurz, 2002). Several studies
with small (Moraes et al., 2008) and large patient cohorts (Rogers et al., 1998) reported
significant cognitive improvement assessed by a lower ADAS-Cog score or higher MMSE score.
Donepezil was demonstrated to decrease dementia progression rate in MCI patients only within
the first 12 months of treatment but not after 3 years (Petersen et al., 2005). Rivastigmine is a
slowly-reversible non-competitive inhibitor of AChE and also Butyryl cholinesterase (BuChE); this
dual inhibition was beneficial as BuChE activity was progressively increased in dementia
especially in the hippocampus and temporal cortex and BuChE also increases neurotoxicity of
associated Aβ plaques (reviewed in Ballard, 2002). Rivastigmine has selectively higher efficacy
in the hippocampus and neocortex than other regions (Weinstock et al., 1994). This is possibly
due to its preferential binding to the mostly cytoplasmic monomeric G1 form of both AChE and
BuChE rather than their mostly membrane-bound tetrameric G4 form; activities of G4 forms of
AChE and BuChE are reduced in AD by 50-70% and 20% respectively, but BuChE G1 activity is
elevated by 30-60% despite a stable activity of AChE G1 (reviewed in Giacobini, 2006).
Rivastigmine is also a potential substitute for donepezil in AChEI treatment switching (reviewed
in Blesa et al., 2018). Donepezil and Rivastigmine are also prescribed for DLB/PDD (reviewed in
75 O'Brien et al., 2017). Overall, these drugs provide modest symptomatic benefit in many AD
patients.
1.1.9.2 NMDAR antagonists
The second class of drug to be approved for symptomatic treatment of AD was memantine, a
moderate affinity NMDA antagonist. Clinical trials indicated some efficacy (Reisberg et al., 2003)
before the mechanism of action was clearly understood. It was proposed that prolonged
extrasynaptic NMDAR-dependent Ca2+ influx decreased signal-to-noise ratio and eventually this
may lead to a form of excitotoxicity (reviewed in Francis, 2005). Memantine, NMDAR antagonist
with characteristics similar to Mg2+, reduces aberrant NMDA receptor activation together with
baseline Ca2+ concentration and hence has the potential to improve signal sensitivity of neurons
in AD patients. A meta-analysis found that memantine monotherapy without ChEIs significantly
improved cognitive performance and global functions (Matsunaga et al., 2015). A later meta-
analysis from the same group also showed a benefit of memantine in reducing behavioural
disturbances when cotreated with ChEIs (Kishi et al., 2017). In addition, memantine-induced
delay in cognitive decline was associated with slower rate of FDG-PET reduction in AD-
susceptible brain regions but not with any CSF protein markers (Wang et al., 2013).
Nevertheless, another meta-analysis study did find a significant effect of memantine on AD
symptoms (Blanco-Silvente et al., 2018). Memantine, together with cholinesterase inhibitors,
form the frontline treatment for the symptoms of AD in the absence of disease-modifying
treatments.
1.1.9.3 Antidepressants/SSRI
The dysfunction of the serotonergic system in AD and the clear links to changes in mood
provided a rationale for treatment by this route. Selective serotonin reuptake inhibitors (SSRIs)
are a commonly used class of antidepressant drugs that are considered to increase the level of
serotonin in the synapse by decreasing its presynaptic reuptake. Nonetheless, each SSRI may
also act upon distinct cellular mechanisms that contribute to its antidepressant effects. The best
evidence from the DIASDS-II (Rosenberg et al., 2010) and the SADD studies (Banerjee et al.,
2011) suggests that this class of drug has very limited benefit against depressive symptoms in
AD. A meta-analysis found only few studies that reported cognitive improvement after SSRI
treatment (Jones et al., 2016). Aside from possible symptomatic treatments, some studies
suggest potential impacts on disease progression. Treatment with an SSRI citalopram decreased
Aβ production without affecting clearance in patients and halted amyloid formation in
APPswe/PS1dE9 transgenic mice (Sheline et al., 2014). In contrast, treatment with another SSRI
paroxetine also in APPswe/PS1dE9 transgenic mice had no effect on Aβ pathology. A 2-year follow-
76 up study after SSRI treatment in MCI and AD patients did not alter PET-measured Aβ burden but
significantly delay cognitive decline (Brendel et al., 2018). Interestingly, different serotonin
receptor subtypes may have opposing effects (Klempin et al., 2010). Therefore, some non-SSRI
antidepressants alleviate the symptoms by suppressing specific serotonin receptors.
Pimavanserin, an inverse agonist of serotonin receptor 5-HTR2A, has been prescribed mainly to
alleviate PD-associated hallucination and delusion with caveats for higher mortality risk on
dementia patients with psychosis (Cruz, 2017). However, recent clinical trials showed
significantly higher efficacy of Pimavanserin than placebo in AD patients with psychosis (Ballard
et al., 2018; Ballard et al., 2019). The potential role of 5-HTR2 inverse agonist in promoting adult
hippocampal neurogenesis will be discussed in section 1.4.6.4.
1.1.9.4 Disease-modifying approaches
The proceeding approaches are based on treating symptoms and do not alter the underlying
causes of the disease. Disease-modifying approaches refer to therapeutic measures that change
pathological processes which contribute to a lasting effect, especially cell death, during the
disease progression (reviewed in Cummings and Fox, 2017). Cell death-contributing factors
include Aβ-related toxicity, tau-related toxicity, membrane disruption, inflammation, oxidative
stress, synaptic loss, mitochondrial dysfunction, demyelination, etc. As a molecular
neuropathology of AD has become clearer, approaches that target Aβ and tau have been the
major focus. Tackling the overproduction and deposition of Aβ was the first focus, partly due to
the genetic links and the availability of transgenic mice (Kitazawa et al., 2012). Only more
recently has tau become a significant therapeutic target largely in a response to the successive
clinical failures of Aβ-based approaches. The main classes of Aβ agents that went through to late
stage clinical trials were inhibitors of the Aβ production including inhibitors of β-secretase and
those based on antibodies directed against Aβ (reviewed in Cline et al., 2018).
BACE inhibitors are promising therapeutic candidates since β-secretase cleavage of APP by
BACE1 or BACE2 is a key process in Aβ production. Most of the ongoing drugs were developed
to inhibit BACE1 but they usually inhibit both BACE1 and BACE2. MK-8931 or Verubecestat is
currently in Phase III clinical trial and has been demonstrated to dose-dependently reduce Aβ
levels but it still could not improve cognitive performance in prodromal AD patients (reviewed
in Zhu et al., 2018b). However, BACE1 has diverse substrates and excessive inhibition of BACE1
activity impairs synaptic plasticity.
77 Tau-associated cytotoxicity can be targeted from various pathways (reviewed in Congdon and
Sigurdsson, 2018). Memantine and sodium selenate can enhance PP2A phosphatase activity by
blocking its natural inhibitor (Chohan et al., 2006) and by activating regulatory subunit (van
Eersel et al., 2010) respectively. Tideglusib, an irreversible inhibitor of GSK-3β, successfully
improved cognitive performance in a pilot study (del Ser et al., 2013) but its phase II trial did not
show significant result (Lovestone et al., 2015). Lithium chloride, another GSK-3β inhibitor, also
significantly reduced CSF phospho-tau and improved cognitive performance of MCI patients
(Forlenza et al., 2011). Tau acetylation inhibitor such as Salsalate is also currently in an
unpublished early trial for progressive nuclear palsy (PSP) (ClinicalTrials.gov, 2015) after its
remedial outcomes in tau P301S transgenic mice including lowered tau level and acetylation,
preserved cognitive performance and less hippocampal atrophy (Min et al., 2015). Inhibitors of
tau deglycosylation and truncation are also gaining medical interests. Both methylene blue and
associated derivatives (reviewed in Congdon and Sigurdsson, 2018) and curcumin (reviewed in
Hu et al., 2015) are potent tau aggregation inhibitors in vitro and in mouse models in vivo with
history of safe uses in humans, but there has been no record of cognitive improvement in clinical
trials
Neuroinflammation exacerbates neuronal damage through excessive activation of astrocytes
and microglia (reviewed in Ahmad et al., 2019). Significant increase in the levels of
proinflammatory cytokines such as TNF-α, IL-1β, and IL-6 impairs clearance of tau and Aβ,
induces abnormal synaptic pruning, and contributed to dysregulation of brain insulin signalling
(reviewed in Frozza et al., 2018). Regardless of their theoretical potentials, anti-inflammatory
drugs such as TNF-α pathway inhibitor, PPAR-γ activator, or NSAIDs (non-steroidal anti-
inflammatory drugs) have not produced significant improvement in any trials.
Enhancement of mitochondrial homeostasis such as unfolded protein responses and mitophagy
by NAD+ booster nicotinamide riboside (NR) and translation inhibitor doxycycline significantly
reduces Aβ aggregation and improves memory in APP/PSEN1 mice and decreased Aβ staining in
APPswe-expressing neuroblastoma respectively (Sorrentino et al., 2017). Another independent
study also showed that nicotinamide riboside (NR) rescued DNA damage, neuroinflammation,
hippocampal neurons apoptosis, and cognitive impairment in 3xTg mice (Hou et al., 2018). A
clinical trial of chronic NR supplementation to produce calorie restriction-like anti-aging effects
found a significant increase in NAD+ level in middle-aged and older adults without side-effects
(Martens et al., 2018). Mitochondrial homeostasis-promoting compounds are promising
candidates for future clinical trials in AD patients.
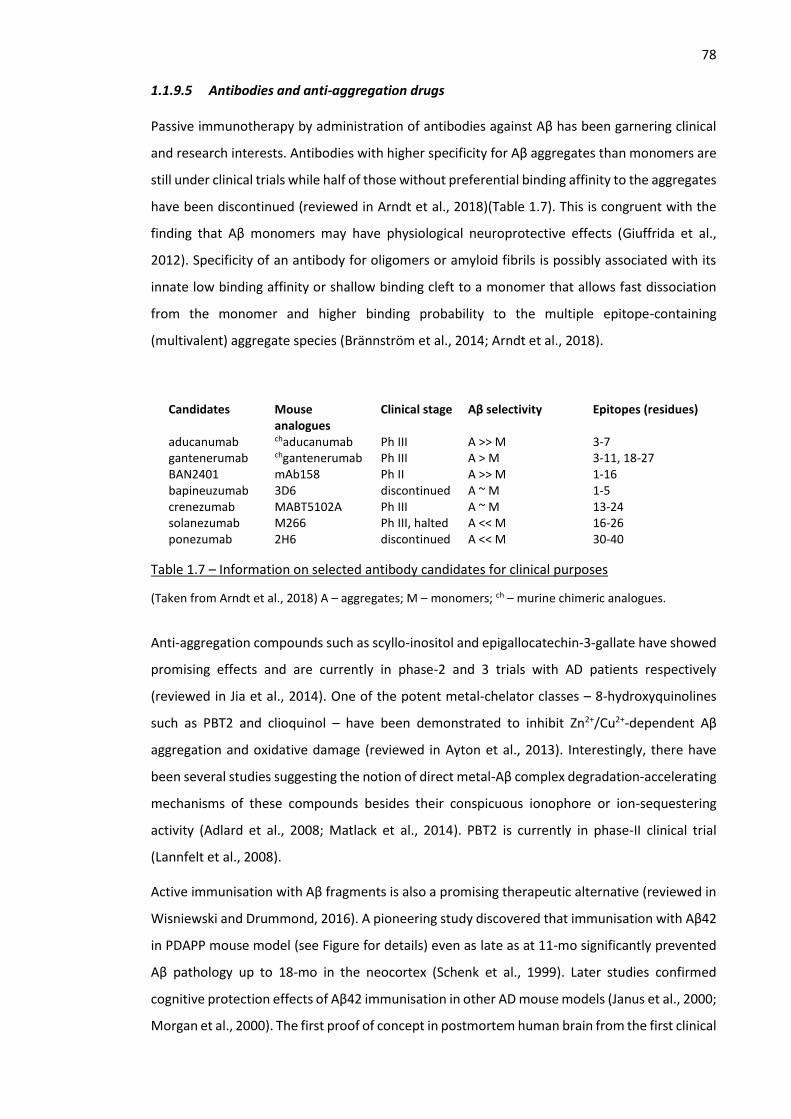
78 1.1.9.5 Antibodies and anti-aggregation drugs
Passive immunotherapy by administration of antibodies against Aβ has been garnering clinical
and research interests. Antibodies with higher specificity for Aβ aggregates than monomers are
still under clinical trials while half of those without preferential binding affinity to the aggregates
have been discontinued (reviewed in Arndt et al., 2018)(Table 1.7). This is congruent with the
finding that Aβ monomers may have physiological neuroprotective effects (Giuffrida et al.,
2012). Specificity of an antibody for oligomers or amyloid fibrils is possibly associated with its
innate low binding affinity or shallow binding cleft to a monomer that allows fast dissociation
from the monomer and higher binding probability to the multiple epitope-containing
(multivalent) aggregate species (Brännström et al., 2014; Arndt et al., 2018).
Candidates Mouse analogues
Clinical stage Aβ selectivity Epitopes (residues)
aducanumab chaducanumab Ph III A >> M 3-7 gantenerumab chgantenerumab Ph III A > M 3-11, 18-27 BAN2401 mAb158 Ph II A >> M 1-16 bapineuzumab 3D6 discontinued A ~ M 1-5 crenezumab MABT5102A Ph III A ~ M 13-24 solanezumab M266 Ph III, halted A << M 16-26 ponezumab 2H6 discontinued A << M 30-40
Table 1.7 – Information on selected antibody candidates for clinical purposes
(Taken from Arndt et al., 2018) A – aggregates; M – monomers; ch – murine chimeric analogues.
Anti-aggregation compounds such as scyllo-inositol and epigallocatechin-3-gallate have showed
promising effects and are currently in phase-2 and 3 trials with AD patients respectively
(reviewed in Jia et al., 2014). One of the potent metal-chelator classes – 8-hydroxyquinolines
such as PBT2 and clioquinol – have been demonstrated to inhibit Zn2+/Cu2+-dependent Aβ
aggregation and oxidative damage (reviewed in Ayton et al., 2013). Interestingly, there have
been several studies suggesting the notion of direct metal-Aβ complex degradation-accelerating
mechanisms of these compounds besides their conspicuous ionophore or ion-sequestering
activity (Adlard et al., 2008; Matlack et al., 2014). PBT2 is currently in phase-II clinical trial
(Lannfelt et al., 2008).
Active immunisation with Aβ fragments is also a promising therapeutic alternative (reviewed in
Wisniewski and Drummond, 2016). A pioneering study discovered that immunisation with Aβ42
in PDAPP mouse model (see Figure for details) even as late as at 11-mo significantly prevented
Aβ pathology up to 18-mo in the neocortex (Schenk et al., 1999). Later studies confirmed
cognitive protection effects of Aβ42 immunisation in other AD mouse models (Janus et al., 2000;
Morgan et al., 2000). The first proof of concept in postmortem human brain from the first clinical
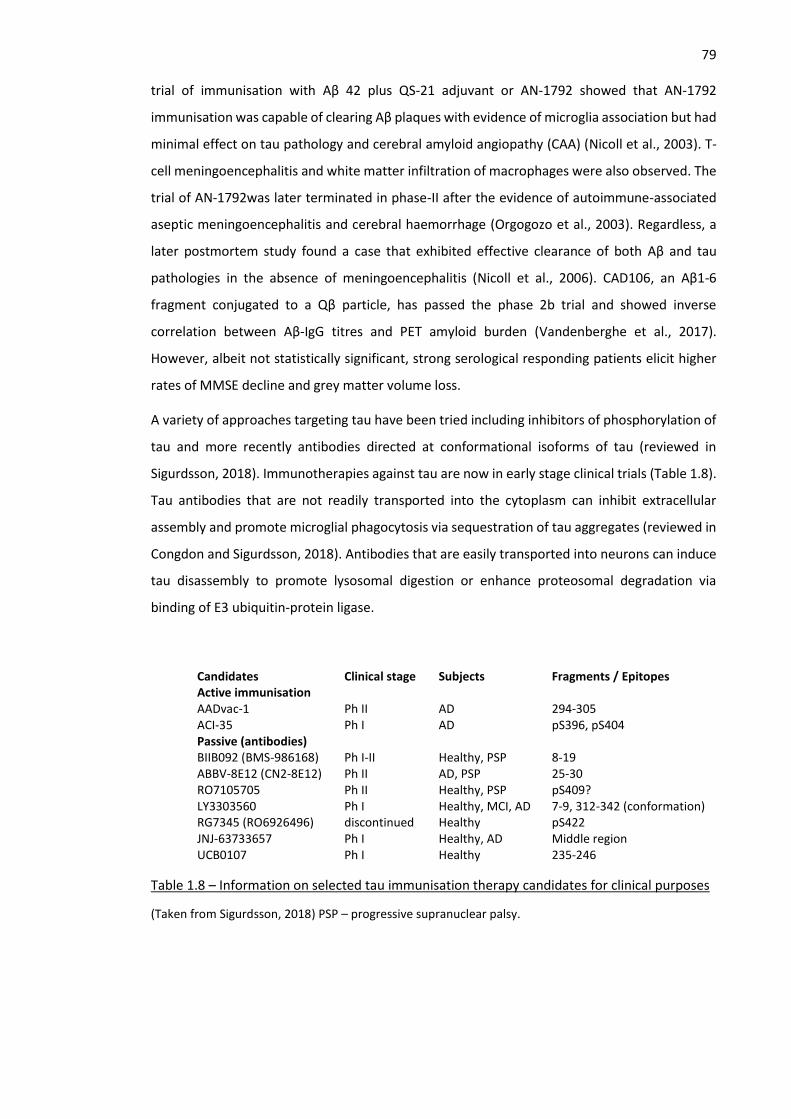
79 trial of immunisation with Aβ 42 plus QS-21 adjuvant or AN-1792 showed that AN-1792
immunisation was capable of clearing Aβ plaques with evidence of microglia association but had
minimal effect on tau pathology and cerebral amyloid angiopathy (CAA) (Nicoll et al., 2003). T-
cell meningoencephalitis and white matter infiltration of macrophages were also observed. The
trial of AN-1792was later terminated in phase-II after the evidence of autoimmune-associated
aseptic meningoencephalitis and cerebral haemorrhage (Orgogozo et al., 2003). Regardless, a
later postmortem study found a case that exhibited effective clearance of both Aβ and tau
pathologies in the absence of meningoencephalitis (Nicoll et al., 2006). CAD106, an Aβ1-6
fragment conjugated to a Qβ particle, has passed the phase 2b trial and showed inverse
correlation between Aβ-IgG titres and PET amyloid burden (Vandenberghe et al., 2017).
However, albeit not statistically significant, strong serological responding patients elicit higher
rates of MMSE decline and grey matter volume loss.
A variety of approaches targeting tau have been tried including inhibitors of phosphorylation of
tau and more recently antibodies directed at conformational isoforms of tau (reviewed in
Sigurdsson, 2018). Immunotherapies against tau are now in early stage clinical trials (Table 1.8).
Tau antibodies that are not readily transported into the cytoplasm can inhibit extracellular
assembly and promote microglial phagocytosis via sequestration of tau aggregates (reviewed in
Congdon and Sigurdsson, 2018). Antibodies that are easily transported into neurons can induce
tau disassembly to promote lysosomal digestion or enhance proteosomal degradation via
binding of E3 ubiquitin-protein ligase.
Candidates Clinical stage Subjects Fragments / Epitopes Active immunisation AADvac-1 Ph II AD 294-305 ACI-35 Ph I AD pS396, pS404 Passive (antibodies) BIIB092 (BMS-986168) Ph I-II Healthy, PSP 8-19 ABBV-8E12 (CN2-8E12) Ph II AD, PSP 25-30 RO7105705 Ph II Healthy, PSP pS409? LY3303560 Ph I Healthy, MCI, AD 7-9, 312-342 (conformation) RG7345 (RO6926496) discontinued Healthy pS422 JNJ-63733657 Ph I Healthy, AD Middle region UCB0107 Ph I Healthy 235-246
Table 1.8 – Information on selected tau immunisation therapy candidates for clinical purposes
(Taken from Sigurdsson, 2018) PSP – progressive supranuclear palsy.
80
1.4 Adult Hippocampal Neurogenesis
1.4.1 Background
Mammalian adult neurogenesis in the hippocampal dentate gyrus (DG) and olfactory
bulb/subventricular zone was first discovered by the use of [3H]-thymidine incorporation into
newly synthesised DNA and autoradiography (Altman and Das, 1965; Altman, 1969; Kaplan and
Hinds, 1977). Injection with bromodeoxyuridine (BrdU) a thymidine analogue was later
introduced as an alternative method to detect cell proliferation in the brain because BrdU is
incorporated into the DNA during replication (Miller and Nowakowski, 1988). This led to
compelling evidence of adult neurogenesis in rat (Kuhn et al., 1996) and was quickly followed by
the first report of adult hippocampal neurogenesis in the human brain where BrdU had been
administered for cancer diagnosis (Eriksson et al., 1998). The first stage of investigation to
understand adult neurogenesis was the discovery of asymmetric cell division, which helps
sustain self-renewing population while producing new differentiating cells, and fate
specification in cerebral cortex development by combining the lineage marker BAC retrovirus
and keeping track of new neurons generated at specific date by BrdU injection at said time
(Mione et al., 1997). Soon afterwards, multipotent neural progenitors were first isolated from
the rat hippocampus and induced to proliferate and differentiate into neural cells both in vitro
and in vivo after transplantation (Gage et al., 1998). Asymmetric division was later confirmed by
live-cell imaging and found to involve asymmetric cellular distribution of Numb (Shen et al.,
2002).
Postnatal renewal of human hippocampal neurons was confirmed by correspondence between
the 14C concentration in neuronal genomic DNA and the atmospheric 14C concentration after the
date of birth of the subject (Spalding et al., 2013). Specifically, genomic DNA of hippocampal
neurons of individuals born before the nuclear bomb testing during the Cold War had higher 14C
concentration than the atmosphere and that of individuals born after the tests had lower 14C
concentration than the bomb curve. The observed genomic 14C data was best fitted by a model
where there are two subpopulations, one of which is renewing but the other is not. From this
model, annual turnover rate of human adult hippocampal granule neurons was estimated at
1.75% which is comparable to that of middle-aged mice. This turnover rate corresponds to
approximately 700 newly born granule neurons in each hippocampus. Interestingly,
approximately 35% of hippocampal neurons constituted a homogeneous subgroup of neurons
undergoing a single mode of turnover. Since the proportion of DGCs among hippocampal
neurons is slightly more than 35%, the above finding supported the notion that most DGCs are
subject to turnover.
81 1.4.2 Adult neurogenesis in the hippocampus
In the hippocampus, there are two types of slowly-dividing neural stem cells (NSC) which can
switch between quiescent and active states. Type-1 cells have radial-glia-like morphology with
their cell bodies in the subgranular zone (SGZ) and their radial processes through the granular
cell layer (GCL). Type-1 NSCs express glial fibrillary acidic protein (GFAP), Sox2, and nestin (Figure
1.9). NG2-expressing oligodendrocyte precursors (Encinas et al., 2011) and astrocytes (Steiner
et al., 2004) may also serve as actively proliferating progenitors similar to NSCs in the DG under
specific conditions. Type-1 cells once activated can produce rapidly-dividing intermediate
progenitor cells with limited self-renewability or type-2a via asymmetric cell division. Type-2a
cells lack glial features as they neither have radial process nor express GFAP but still express
Sox2 and nestin. Interestingly, Type-2b cells, produced by type-2a cells, are committed to the
neuronal fate as indicated by their expression of doublecortin (DCX), NeuroD, and Prospero
homeobox protein-1 (Prox1). Type-2b cells rapidly divide for only several cycles and eventually
asymmetrically divide into type-3 cells or neuroblasts, which express neuronal markers MAP2ab
and βIII-tubulin but still can proliferate. Neuroblasts migrate tangentially along the blood
vessels, then migrate a short distance radially into the GCL before completely exiting a mitotic
stage and starting to express NeuN (Sun et al., 2015). Postmitotic granule neurons express
calretinin when they are still immature but later express calbindin instead once they fully
mature.
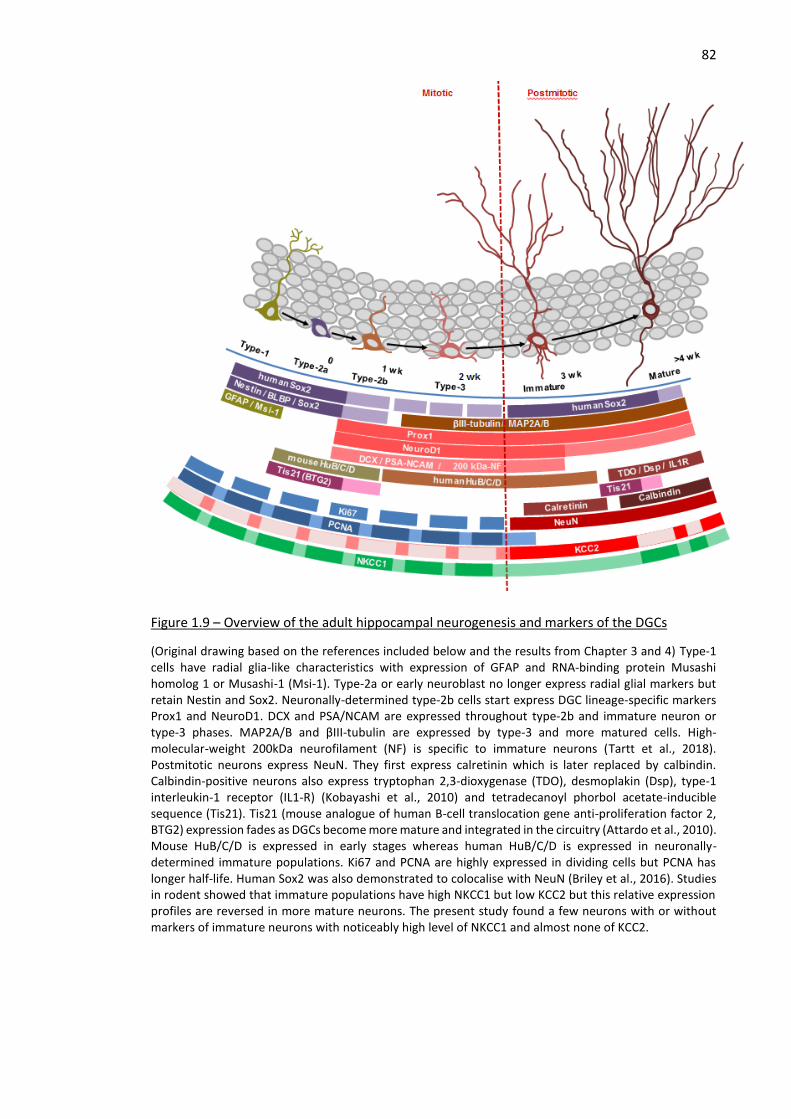
82
Figure 1.9 – Overview of the adult hippocampal neurogenesis and markers of the DGCs
(Original drawing based on the references included below and the results from Chapter 3 and 4) Type-1 cells have radial glia-like characteristics with expression of GFAP and RNA-binding protein Musashi homolog 1 or Musashi-1 (Msi-1). Type-2a or early neuroblast no longer express radial glial markers but retain Nestin and Sox2. Neuronally-determined type-2b cells start express DGC lineage-specific markers Prox1 and NeuroD1. DCX and PSA/NCAM are expressed throughout type-2b and immature neuron or type-3 phases. MAP2A/B and βIII-tubulin are expressed by type-3 and more matured cells. High-molecular-weight 200kDa neurofilament (NF) is specific to immature neurons (Tartt et al., 2018). Postmitotic neurons express NeuN. They first express calretinin which is later replaced by calbindin. Calbindin-positive neurons also express tryptophan 2,3-dioxygenase (TDO), desmoplakin (Dsp), type-1 interleukin-1 receptor (IL1-R) (Kobayashi et al., 2010) and tetradecanoyl phorbol acetate-inducible sequence (Tis21). Tis21 (mouse analogue of human B-cell translocation gene anti-proliferation factor 2, BTG2) expression fades as DGCs become more mature and integrated in the circuitry (Attardo et al., 2010). Mouse HuB/C/D is expressed in early stages whereas human HuB/C/D is expressed in neuronally-determined immature populations. Ki67 and PCNA are highly expressed in dividing cells but PCNA has longer half-life. Human Sox2 was also demonstrated to colocalise with NeuN (Briley et al., 2016). Studies in rodent showed that immature populations have high NKCC1 but low KCC2 but this relative expression profiles are reversed in more mature neurons. The present study found a few neurons with or without markers of immature neurons with noticeably high level of NKCC1 and almost none of KCC2.
83 1.4.3 Adult neurogenesis in the subventricular zone
The subventricular zone (SVZ) along the wall of the lateral ventricle is an adult neurogenic niche
(Figure 1.12). GFAP-positive astrocytic NSC is attached to a blood vessel and may remain
quiescent (Lim and Alvarez-Buylla, 2016). Around 20 % of GFAP-positive NSCs sustain the
population via repeated symmetric self-renewing division, but the rest majority undergo
symmetric consuming division into transiently amplifying cells (Obernier et al., 2018).
Transiently amplifying cells usually divide few times before they produce migratory neuroblasts.
Migratory neuroblast of the SVZ, similar to that of the DG, starts expressing DCX and PSA-NCAM.
These neuroblasts migrate using each other as their platform and forming a path structure called
rostral migratory stream toward the olfactory bulb to differentiate into GABAergic neurons. The
fates of these progenitors are innately determined by their original positions on the lateral
ventricle (Merkle et al., 2007). NSCs from the dorsal wall produce olfactory granule cells of the
superficial layer and TH-positive calretinin-positive calbindin-negative periglomerular cells. On
the other hand, NSCs from the ventral wall produce calretinin-positive GABAergic granule cells
of the deep layer and TH-negative calbindin-positive periglomerular cells. Moreover,
heterotopic transplantation of ventral NSCs into the dorsal wall does not change their fate.
Humans, however, have very few neurogenic cells in the SVZ and the SVZ itself is also instead
filled with a ribbon layer populated by astrocytes and ependymal cells followed by a thick gap
layer filled by dense interconnected processes from those cells (Sanai et al., 2004). Chain
migration to the olfactory bulb similar to rodent RMS has also never been observed in humans
(Bergmann et al., 2015). A recent study found evidence of adult-born neurons in the human
striatum (Ernst et al., 2014). However, a later study argued that almost all striatal interneurons
in humans and rhesus monkeys are Sp8-negative unlike neurons differentiated from the NSCs
of the SVZ (Wang et al., 2014b).
The neurogenic niche of the SVZ also has various unique characteristics such as distinct subtypes
of microglia that lack ATP-induced chemotaxis and exhibit low phagocytic activity (Ribeiro Xavier
et al., 2015). Local ablation of the specific microglia significantly disrupts survival and migration
of neuroblasts.
84 1.4.4 Neurogenic markers
1.4.4.1 Proliferative markers
Proliferating cell nuclear antigen (PCNA) and Ki-67 have been used as endogenous cell cycle
marker to detect adult neurogenesis. PCNA is a critical DNA polymerase cofactor of which
expression is activated during G1 and S phase (Moldovan et al., 2007). The functions of Ki-67 are
much less understood. Ki-67 has been reported to be involved in ribosomal RNA transcription
but the mechanisms still remain unclear (Bullwinkel et al., 2006). Ki67 also binds to chromatin
surface directly to prevent different chromosomes from aggregating (Cuylen et al., 2016). Ki67
plays a direct crucial role during mitotic exit by specifically recruiting protein phosphatase 1γ for
histone dephosphorylation, chromatin reorganisation, and nuclear membrane assembly (Kumar
et al., 2016).
As PCNA and Ki67 have different functions and characteristics, they cannot be used as
endogenous proliferation markers equivalently or interchangeably. PCNA has a half-life of
approximately 20 times as long as that of Ki67 (Khoshyomn et al., 1993) and this has been
demonstrated by the presence of PCNA even in postmitotic cells (Mandyam et al., 2007).
Furthermore, PCNA plays a role in DNA repair (Yin et al., 2015) and can be upregulated in dying
immature neurons as indicated by cellular colocalisation with caspase-3 (Knoth et al., 2010).
1.4.4.2 Doublecortin
DCX is a microtubule-stabilizing protein in the brain. Its functions remain elusive but several
pieces of evidence suggest its contribution to migration (Gleeson et al., 1998; Gleeson et al.,
1999; Koizumi et al., 2011) and neurite development (Friocourt et al., 2003). While DCX is mostly
expressed in rapidly dividing intermediate progenitors and migrating neuroblasts of both SVZ
and SGZ, DCX can also be found in mature astrocytes of adult human neocortex and astrocytes
(Verwer et al., 2007) in the vicinity of mouse ischemic infarcts (Kunze et al., 2015).
Another neurogenic marker which closely overlaps with DCX in both rodents and human brain
is polysialylated form of the neural cell adhesion molecule (PSA-NCAM). PSA-NCAM is a
membrane glycoprotein that also plays a role in neuronal migration and neurite extension.
However, level and distribution of PSA-NCAM and DCX may differ in several pathological
conditions (Johnson et al., 2011; Perry et al., 2012).
1.4.4.3 Hu
Hu proteins are neuron-specific RNA-binding proteins which have been identified as target
antigens in a paraneoplastic neurological syndrome. There are 4 main Hu family members: A, B,
85 C, and D. According to in-situ hybrization experiments on the adult mouse hippocampus, HuC
is the major Hu member expressed by granule neurons where HuB and HuD are almost absent
(Okano and Darnell, 1997). Nevertheless, HuD plays a role in axon outgrowth of immature
granule neurons by stabilizing GAP-43 mRNA (Bolognani et al., 2007). This finding was further
confirmed by an increased length of DG-CA3 mossy fibres in HuD-overexpressing transgenic
mice (Perrone-Bizzozero et al., 2011). In mouse DG, Hu proteins are also expressed in a wide
range of neurogenic populations from GFAP-positive type-1 cells to DCX-positive neuroblasts
(Liu et al., 2010). This is complementary to the findings in human that HuC/D-positive cells
consist of both mitotic and post-mitotic cells and that their density in the DG is higher than of
DCX-positive cells (Ekonomou et al., 2015).
1.4.4.4 NeuroD and Prox1
Expressions of NeuroD1 and Prox1 start in type-2b cells and determine the fate of DG granule
neuron lineage (Steiner et al., 2006; Hodge et al., 2008; Beckervordersandforth et al., 2015).
Expression of NeuroD1 and Prox1 are activated by canonical Wnt pathway and overexpression
of both transcription factors induces neuronal differentiation of NSCs in vitro (Gao et al., 2009;
Karalay et al., 2011). Furthermore, both NeuroD1 (Gao et al., 2009) and Prox1 (Lavado et al.,
2010) are necessary to survival of immature granule neurons.
1.4.4.5 Calretinin
Calretinin or also known as calbindin D-29k is a calcium-binding protein of the troponin C
superfamily. As a calcium modulator, Calretinin regulates neuronal excitability. Calretinin is
expressed in retinal neurons, cortical and hippocampal GABAergic interneurons, and immature
DG granule neurons. After exiting mitotic phase and starting to express NeuN, immature granule
neurons transiently express calretinin for about 3-4 weeks before calretinin is completely
replaced by calbindin (Brandt et al., 2003).
1.4.4.6 GABA signalling-associated transporters: NKCC1 and KCC2
Electrophysiological effect of GABA signalling either depolarising or hyperpolarising depends on
the concentration of Cl- in the target cell (Ben-Ari, 2002). High level of Na+-K+-2Cl- cotransporter
NKCC1, a Cl- importer, elevates intracellular Cl- concentration and hence induces depolarising Cl-
efflux when GABAA receptor is activated. Conversely, high level of K+-Cl- cotransporter KCC2
decreases intracellular Cl- level and induces hyperpolarising Cl- influx upon GABA signalling. For
development of young neurons, excitatory GABA signal and eventual transition to inhibitory
signal via sequential expression of NKCC1 to KCC2 are necessary (Ge et al., 2006).
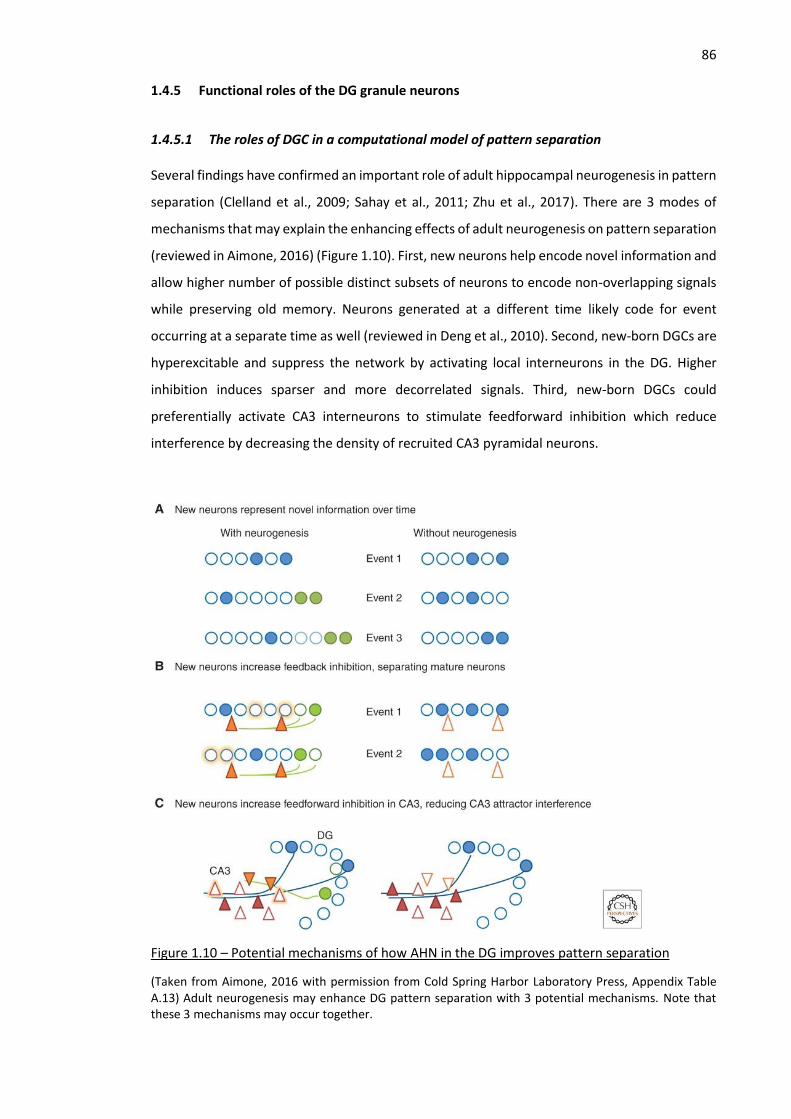
86 1.4.5 Functional roles of the DG granule neurons
1.4.5.1 The roles of DGC in a computational model of pattern separation
Several findings have confirmed an important role of adult hippocampal neurogenesis in pattern
separation (Clelland et al., 2009; Sahay et al., 2011; Zhu et al., 2017). There are 3 modes of
mechanisms that may explain the enhancing effects of adult neurogenesis on pattern separation
(reviewed in Aimone, 2016) (Figure 1.10). First, new neurons help encode novel information and
allow higher number of possible distinct subsets of neurons to encode non-overlapping signals
while preserving old memory. Neurons generated at a different time likely code for event
occurring at a separate time as well (reviewed in Deng et al., 2010). Second, new-born DGCs are
hyperexcitable and suppress the network by activating local interneurons in the DG. Higher
inhibition induces sparser and more decorrelated signals. Third, new-born DGCs could
preferentially activate CA3 interneurons to stimulate feedforward inhibition which reduce
interference by decreasing the density of recruited CA3 pyramidal neurons.
Figure 1.10 – Potential mechanisms of how AHN in the DG improves pattern separation
(Taken from Aimone, 2016 with permission from Cold Spring Harbor Laboratory Press, Appendix Table A.13) Adult neurogenesis may enhance DG pattern separation with 3 potential mechanisms. Note that these 3 mechanisms may occur together.
87 1.4.5.2 Functional characteristics of the DGCs
Young adult-born granule neurons integrate into the circuitry when they are 3-4 weeks old.
However, all of them fully change electrophysiological behaviours before they reach 10 weeks
old. The young granule neurons are referred to as S-group for their high sensitivity to a specific
range of input and the fully matured ones are called L-group for exhibiting incremental and less
sensitive response (Brunner et al., 2014). It has been demonstrated that young neurons switch
their electrophysiological nature independently to their ages and potentially according to their
experience. Therefore, two granule neurons of at most 9 weeks old which were born on the
same day may have two distinct functions. Two-photon Ca2+ imaging in awake mice also revealed
young DGCs of 3-6 weeks of age have higher firing rates but convey less spatial information than
mature DGCs (Danielson et al., 2016).
Young DGCs was demonstrated to have net inhibitory effects on the circuitry because X-
irradiation to destroy young adult-born neurons also increased gamma burst amplitude in the
DG (Lacefield et al., 2012 1755). One possible mechanism is that these highly sensitive young
neurons preferentially target local GABAergic interneurons (reviewed in Aimone, 2016). This
would induce sparser and more orthogonal activity of mature DGCs and hence enhance pattern
separation.
Adult neurogenesis also induces forgetting (Akers et al., 2014) and facilitates reversal learning
by decreasing proactive interference, a process where old memory interferes with learning new
similar information (Epp et al., 2016). For example, mice with running-enhanced neurogenesis
stay in the target quadrant shorter than controls during the retention session but they swim to
the hidden platform of Morris water maze (MWM) faster than controls after platform position
is switched to the opposite quadrant. Neurogenesis-induced forgetting has been speculated
through computational modelling (Weisz and Argibay, 2012). Adult-born neurons also influence
excitability of the existing mature granule neurons (Adlaf et al., 2017). Conditional knockout of
apoptotic protein Bax only in new-born neurons through Nestin expression enhances survival of
adult-born neurons and reduce EPSPs and spine density of mature neurons. In accordance,
ablation of new-born neurons increases excitability. Surprisingly, Bax in a mature neuron is also
a key mediator in new-born neuron-induced synaptic suppression.
88 1.4.6 Effects of neurotransmitters and signalling peptides on adult hippocampal
neurogenesis
1.4.6.1 Cholinergic inputs
Hippocampus is innervated by cholinergic axons from MS/VDB. Loss of Msi-1, a marker of radial-
glia like type-1 cells, in both DLB and AD was correlated with loss of hippocampal ChAT
immunohistochemical signal (Ziabreva et al., 2007; Perry et al., 2012). Furthermore, lesion of
the basal forebrain with 192IgG-saporin decreased the number of adult-born neurons identified
with BrdU and NeuN and increased cell death in the DG (Cooper-Kuhn et al., 2004). Granule
neuron precursors also express both m1 and m4 cholinergic receptors (Mohapel et al., 2005)
and it has been demonstrated that BFCNs of the DB directly innervate immature granule neurons
with m1-dependent signal transduction (Zhu et al., 2017). The density of direct cholinergic
terminals on dendrites of the new-born granule neurons in Tg2576-APPswe mice was less than
that in controls, and theta burst stimulation increased cholinergic terminal density in Tg2576-
APPswe mice to that in controls. Theta burst stimulation of the DB also activated immature
granule neurons and improved only pattern separation behaviour task without affecting the
performances of other hippocampal-associated cognitive tests including MWM and novel object
recognition. Treatment with AChE inhibitor physostigmine promoted adult hippocampal
neurogenesis in both proliferation and survival (Mohapel et al., 2005). Cholinergic signals also
induced differentiation of granule neuron progenitors from expressing NKCC1 to expressing
KCC2 via α7-nAChR-dependent pathway (Campbell et al., 2010).
1.4.6.2 Glutamatergic inputs
New-born DG granule neurons receive intrahippocampal glutamatergic inputs from mossy cells
of the hilus, pyramidal neurons of the CA3, and mature granule neurons (Vivar et al., 2012). After
the new-born neuron integrates into the circuitry, the inputs from mature granule neurons start
to fade but the inputs from hilar mossy cells increase over time. The inputs from CA3 pyramidal
neurons, similar to those from cholinergic septohippocampal tract, remain stable. Immature
new-born neurons receive cortical glutamatergic innervation from the PRH and LEC, which
induces paired-pulse facilitation and steadily increases after they reach 3 weeks old. These
glutamatergic inputs have been shown to be received very early even by 1-week-old adult-born
granule neurons (Sah et al., 2017). Mature granule neurons, on the other hand, receive inputs
of paired-pulse depression plasticity from MEC. Lesions in the PRH and LEC impaired pattern
separation but not MWM-associated spatial memory.
89 Under virtual enriched environment, activity from integrated adult-born granule neurons
enhanced neurogenesis in both proliferation and maturation (Kirschen et al., 2017). By contrast,
optogenetically silencing these active granule neurons with light-stimulated chloride channel
halorhodopsin abolished beneficial effects of enriched environment on adult hippocampal
neurogenesis. Mossy cells are the first glutamatergic neurons that provide synaptic input to the
adult born neurons (Chancey et al., 2014). However, specific ablation of mossy cells with
Cre/loxP-driven diphtheria toxin receptor system had no effect on the number of DCX- and
PCNA-positive cells (Jinde et al., 2012).
1.4.6.3 GABAergic inputs
Depolarization by ambient GABA in the DG is necessary to maturation and synaptic integration
of adult-born granule neurons as well (Ge et al., 2006). Additionally, direct synaptic signalling
from PV-positive GABAergic neurons promoted survival and maturation of young adult-born
neurons (Song et al., 2013). While SST-positive interneurons have been shown to innervate
mature adult-born granule neurons (Vivar et al., 2012), suppression or activation of SST-positive
interneurons did not affect survival of young granule neurons (Song et al., 2013). This is
congruent with a recent finding that both PV-positive and PV-negative GABAergic projection
neurons in the MS stimulate PV-positive interneurons in the DG to control NSC quiescence and
ablation of MS GABAergic neurons induced excessive neurogenesis and exhaustion of NSC pool
(Bao et al., 2017). Moreover, MS is not the only source of distant GABAergic projection to the
DG. Glutamatergic neurons of the SuM also release GABA together with glutamate to the DG
granule neurons and CA2 neurons but its effects on adult hippocampal neurogenesis still have
not been discovered (Pedersen et al., 2017).
1.4.6.3 Dopaminergic and noradrenergic inputs
Dopaminergic neurons of the VTA were shown to be more resistant to 1-methyl-4-phenyl-
1,2,3,6-tetrahydropyridine (MPTP) than those of the SNpc (Phani et al., 2010). Nonetheless, a
study found that MPTP-administered mice also had significantly reduced level of dopamine in
the hippocampus, accumulation of membrane-associated insoluble truncated α-synuclein in the
hippocampus, elevated hippocampal calpain activity, and deficits in survival and maturation of
adult-born DGCs (Schlachetzki et al., 2016). Depletion of dopamine reduced the number of NPCs
in the SGZ which was congruent with the lower number of NPCs in PD cases (Höglinger et al.,
2004). Dopamine signal was also demonstrated to reduce input from the entorhinal cortex to
hyperactive new-born DGCs and suppress LTP (Mu et al., 2011). However, specific ablation of
noradrenergic neurons in the LC or dopaminergic neurons in the SNpc/VTA using anti-dopamine-
90 β-hydroxylase-saporin or desipramine-administration followed by 6-hydroxydopamine (6-
OHDA) respectively had no effect on proliferation or mutation of adult-born neurons despite
successful lesion of noradrenergic or dopaminergic axons in the hippocampus (Ermine et al.,
2018).
1.4.6.4 Serotonergic inputs
Serotonin (5-HT) is a major monoamine neurotransmitter released from the raphe nuclei which
regulates cognition, appetite, emotion, and sleep (Alenina and Klempin, 2015). Serotonin
synthesis from tryptophan is catalysed by tryptophan hydroxylase (TPH2) and aromatic L-amino
acid decarboxylase (AACD) respectively. Serotonin is transported into synaptic vesicles by
vesicular monoamine transporter 2 (VMAT2). After being released, serotonin can be recycled
back into the presynaptic cell by the serotonin transporter.
Serotonergic system has been demonstrated to contribute to adult hippocampal neurogenesis.
Raphe nuclei lesion by 5,7-dihydroxytryptamine administration reduced PSA-NCAM-positive
cells and BrDU-positive cells and these aberrations were later reversed by natural reinnervation
(Brezun and Daszuta, 2000). Another finding (Jha et al., 2006) conversely showed that 5,7-
dihydroxy-tryptamine, after pre-treatment with desipramine to protect noradrenergic terminals
and therefore to render the lesion serotonergic-specific, was not sufficient to suppress adult
hippocampal neurogenesis but p-chlorophenylalanine which inhibits both serotonin and
noradrenaline synthesis can do so. Mice with innate lack of serotonin Tph2-/- showed an
increased baseline number of Sox2-positive NSCs (Klempin et al., 2013). Nonetheless, the
serotonin-devoid mice still have defects in exercise-induced serotonin-dependent adult
neurogenesis. As Pet1 is specifically expressed in developing and mature serotonergic neurons
and that Pet1 knockout induced up to 80% loss of serotonergic neurons (Hendricks et al., 2003),
Pet1-/- mice also exhibits higher proliferation and survival of adult-born neurons, which can be
reversed by serotonin receptor agonist (Diaz et al., 2013).
Multiple types of serotonin receptors are expressed in the DG. DCX-positive type-2b cells and
neuroblasts express 5-HTR1a that promotes self-renewal (Klempin et al., 2010). The
hippocampus exhibits increasing gradient of 5-HTR1a expression along its dorsal to ventral axis
(Tanaka et al., 2012). This is congruent with the finding that either 5-HTR1a agonist or selective
serotonin reuptake inhibitor fluoxetine specifically stimulated rapid proliferation of type-2b cells
and neuroblasts in the ventral hippocampus (Zhou et al., 2016). Another type of serotonin
receptor is 5-HTR2. The hilus and mature granule neurons prevalently express 5-HTR2a and 5-
HTR2b/c respectively (Klempin et al., 2010). Unlike 5-HTR1a, 5-HTR2 agonists have opposing
91 effects of suppressing proliferation and specific agonist of 5-HTR2c was demonstrated to
promote differentiation of dividing progenitors to DCX-positive neuroblasts. However, another
finding showed that 5-HTR2c specific agonist is more effective than 5-HTR2 pan agonist in
reducing the number of DCX-positive cells in mouse models with conditional ablation of
serotonergic neurons (Song et al., 2016).
Chronic fluoxetine treatment induced the dematuration of DG granule neurons by significantly
reducing the level of mature granule neuron markers including calbindin, tryptophan 2,3-
dioxygenase (TDO), desmoplakin, and type-I interleukin-1 receptor via 5-HTR4-dependent
mechanisms (Kobayashi et al., 2010). These neurons also exhibit immature characteristics
including lower spike threshold and hypoactivity. This similar dematuration phenomenon also
occurred in α-CaMKII+/- mice (Yamasaki et al., 2008). Fluoxetine also increased the level of
dopamine D1-like receptor at the DG-CA3 mossy fibre synapse and thereby enhanced
dopamine-induced potentiation (Kobayashi et al., 2012). Electroconvulsive therapy for
depression also similarly induced dematuration of granule neurons by antagonising NMDAR
signal (Imoto et al., 2017).
1.4.6.5 Brain-derived neurotrophic factor (BDNF)
BDNF is involved in various functions such as synaptic plasticity, neuronal survival, and circuitry
development (Bekinschtein et al., 2014). There are multiple promoters that can drive
transcription of BDNF (Aid et al., 2007) but any of them always produce two populations of
mRNA via alternative polyadenylation: one with short 3'UTR and the other with long 3'UTR
(Pruunsild et al., 2007). The additional sequence of the long 3'UTR allows transcripts with long
3'UTR, but not short 3'UTR, to be targeted and regulated by various proteins or recruited to
specific neuronal parts such as dendrites (Lau et al., 2010). RNA-binding protein HuD also
stabilises the long 3'UTR BDNF transcripts and consequently promotes its translation Allen et al.,
2013. HuD-induced BDNF translation in the dendrite is also activity-dependent (Vanevski and
Xu, 2015). BDNF has been shown to enhance consolidation of pattern-separated memory
through adult-born immature granule neurons (Bekinschtein et al., 2013, 2014). It was first
hypothesised that the acute improvement in pattern separation by BDNF was mainly due to
direct plasticity induction on immature granule neurons Bekinschtein et al., 2014 but it was later
reported that BDNF-induced LTP at the entorhinal-DG synapses can also rapidly stimulate adult
neurogenesis via Arc/Arg3.1-associated mechanisms (Kuipers et al., 2016).
BDNF is first translated into endoplasmic reticulum as prepro-BDNF. Its signal peptide is later
excised leaving proBDNF. The proBDNF is cleaved into the N-terminal pro-peptide and C-
92 terminal mature BDNF (mBDNF). This last cleavage may be carried out inside or outside the cells.
Intracellular cleavage by furin/P3 plays a role in dendrite outgrowth, hippocampal adult
neurogenesis, and LTP (Zhu et al., 2018a). Extracellular cleavage by tPA/plasmin is required for
hippocampal LTP (Pang et al., 2004). Unlike mBDNF, proBDNF and pro-peptide can have adverse
regulatory effects. An increase in proBDNF level in aged mouse hippocampus was correlated
with cognitive deficits (Buhusi et al., 2017). BDNF pro-peptide also activates caspase-3,
promotes mitochondria elongation, and reduces dendritic spine density (Guo et al., 2016).
Furthermore, BDNF binds to TrkB but proBDNF binds to apoptosis-associated p75NTR. Normal
aging in both mouse (Buhusi et al., 2017) and human (Costantini et al., 2006) was accompanied
by elevation in p75NTR level. Interestingly, the level of p75NTRin the basal forebrain was
decreased in MCI and AD patients.
An important role for BDNF was demonstrated in a study where transplantation of NSCs into the
hippocampus of 3xTg transgenic AD model rescued deficits in spatial memory and contextual-
dependent object recognition. This effect was shown to be BDNF-dependant by using lentiviral-
delivery of shRNA to stably knockdown BDNF which abolished the rescue (Blurton-Jones et al.,
2009). Interestingly, when a later study performed a similar stereotactic injection but with
BDNF-overexpressing NSCs into Tg2576 APP-transgenic AD model, these NSCs differentiated
into granule neurons instead (Wu et al., 2016).
1.4.6.6 Nerve Growth Factor
Continuous intracerebroventricular infusion of NGF enhanced cell proliferation evaluated by the
number of BrdU-positive cells (Birch and Kelly, 2013). On the other hand, proNGF has been
shown to reduce the number of DCX-positive and BrdU/DCX-double-positive cells but conversely
activate astrocyte and microglia in the DG (Guo et al., 2013) possibly via p75NTR-dependent
pathways (Bernabeu and Longo, 2010). Polarized distribution of p75NTR in adult-born DG
neuroblast was necessary for axon development after cell-cycle exit (Zuccaro et al., 2014).
1.4.7 Factors affecting adult hippocampal neurogenesis
1.4.7.1 Aging
Aged mice have significantly lower number of adult-born DGCs but higher number of astrocytes
(van Praag et al., 2005). Measurement of nuclear bomb 14C incorporated in nuclei of human
hippocampal neurons showed that the aging-induced relative decline in humans was smaller
than that reported in mice (Spalding et al., 2013). A study focusing on DCX-positive cells also
found a similar rate of aging-induced decline in this population of neuroblast or immature
93 neurons (Knoth et al., 2010). A recent thorough investigation on postmortem human brains also
showed that only the anterior DG was susceptible to aging-induced adult neurogenesis decline
accompanied by a significant decrease in capillary area and number (Boldrini et al., 2018). These
above findings were in contrast with another recent article that claims the paucity or even lack
of neurogenesis in adult human (Sorrells et al., 2018).
1.4.7.2 Physical exercise
Running has been demonstrated to increase proliferation, new-born functionally mature
neurons, and MWM spatial learning and memory in mice (van Praag et al., 1999b). These
neurogenic effects were strictly associated with voluntary exercise and enriched environment
because neither forced swimming exercise nor maze learning induced significant changes in
adult hippocampal neurogenesis (van Praag et al., 1999a).
As angiogenesis and adult hippocampal neurogenesis are coordinated (Palmer et al., 2000; Jin
et al., 2002), MRI-detectable cerebral blood volume (CBV) has been used to confirm the
beneficial effects of exercise on mouse and human adult hippocampal neurogenesis, together
with cognitive performance and aerobic fitness in vivo (Pereira et al., 2007). Exercise also
increased CBV specifically in the DG and has no effect on CBV of the CA1, subiculum, or the
entorhinal cortex. This is congruent with a later study that demonstrated the necessity of VEGF
from skeletal muscle in acute treadmill exercise-induced adult hippocampal neurogenesis and
exercise improvement in terms of both speed and endurance (Rich et al., 2017).
Running reorganises the glutamatergic innervation to young 1-week-old adult-born neurons by
reducing the inputs from CA1 pyramidal neurons and also enhances dendritic growth of these
adult-born neurons (Sah et al., 2017).
Exercise has been demonstrated to improve pathological conditions of several dementia mouse
models. Voluntary wheel running in APPswe/PS1ΔE9 AD transgenic mice alleviated Aβ plaque
burden and tau hyperphosphorylation, reduced neuronal loss in CA3, increased proliferation
and development of neuroblasts, and slightly improved spatial memory performance (Tapia-
Rojas et al., 2016). Physical exercise significantly improved contextual fear memory and novel
object recognition in the trisomic Ts65Dn mouse model of Down’s syndrome (Parrini et al.,
2017). This behavioural finding is in accordance with higher proliferation and maturation of
adult-born neurons as indicated by the number of BrdU-positive and BrdU/NeuN-positive cells
respectively. Exercise also increased glutamatergic/GABAergic synapses ratio and BDNF
expression REF. To elucidate the mechanism of exercise-induced cognitive repair, BDNF mimetic
drug 7,8-dihydroxyflavone was also shown to augment TrkB phosphorylation in the
94 hippocampus and replicate the cognitive improvement in this mouse model similar to the
exercise.
1.4.7.3 Vascular system
Angiogenesis is a formation of new blood vessels from the existing vasculature and its purposes
are to provide nutrients and remove metabolites from new tissues. It is therefore an important
aspect of sustaining existing and new neuronal architectures. The major protein mediator
between angiogenesis and neurogenesis is vascular endothelial growth factor (VEGF) that has
been demonstrated to stimulate proliferation of neuronal precursors in primary cortical neuron
cultures and DCX-positive neuroblasts in the DG through VEGF receptor-2 (VEGFR2) pathway
(Jin et al., 2002) (Figure 1.14). The finding of a correlation between stable formation of vascular
system and adult hippocampal neurogenesis in vivo (Pereira et al., 2007) is congruent with
another discovery that neurogenesis-enhancing effects of VEGF require stable vasculature
beforehand (Licht et al., 2016). VEGF preconditioning to increase vessel density promotes the
neurogenic effects of subsequent short-term VEGF treatment to persist for several months
without exhausting the NSC pool. Furthermore, VEGF induces type-1 neurogenic cells to change
their apical processes from dense fine arbours ensheathing synapses and vasculatures in the IML
(Moss et al., 2016) to long extensions that envelope around blood vessels along the whole range
of the ML (Licht et al., 2016). One classic example of angiogenesis-neurogenesis coordination is
in the adult songbird higher vocal centre (Louissaint et al., 2002). Testosterone induced release
of BDNF from endothelial cells and VEGF from androgen receptor-expressing neurons to
enhance adult neurogenesis and angiogenesis respectively. Inhibition of VEGFR2 tyrosine kinase
negates testosterone-induced angiogenesis and neurogenesis. Overall perivascular interactions
within the neurogenic niche are as follows (reviewed in Goldman and Chen, 2011). Perivascular
astrocytes and potentially pericytes express CD39L1 that hydrolyse ATP into ADP to activate
metabotropic purinergic P2Y receptor (P2YR) signalling for the self-renewal of type-I NSCs. Nitric
oxide produced by endothelial nitric oxide synthase promotes both neurogenesis and
angiogenesis. Type-I cells communicate with endothelial cells via CD24 P-selectin signalling.
Endothelial cells also release BDNF and VEGF to stimulate neurogenesis and angiogenesis.
95 1.4.7.4 AD and associated factors
Aberrant AHN in AD was observed in multiple studies (reviewed in Martinez-Canabal, 2014) with
a prevalent trend of higher number of immature neurons and neuroblasts with dementia (Jin et
al., 2004a) and increasing Braak stages (Perry et al., 2012) (Table 1.9). The most recent study by
our group (Ekonomou et al., 2015) supported the notion of maturation deficits previously
reported (Li et al., 2008) by showing a reduction in HuC/D-positive postmitotic immature
neurons in Braak V-VI. However, there have also been contradicting results of no changes in AHN
(Boekhoorn et al., 2006), lower number of immature neurons (Crews et al., 2010) or
upregulation in both proliferation and survival/maturation (Gomez-Nicola et al., 2014).
The discovery of point mutation in APP and presenilin led to the construction and generation of
APP/PSEN1 transgenic mice which have been extensively used in AD research (section 1.1.6.4).
Such models have made considerable contributions to the understanding of the roles of Aβ and
APP in AHN. The results of the main studies are summarised in Table 1.8. In general, the studies
show that the presence of the transgenes and overproduction and deposition of Aβ have a
negative impact on neurogenesis. In some cases, there can be a biphasic pattern of early
enhancement of neurogenesis and subsequent decline or vice versa. A complication of many of
these models is that they overexpress the transgenes which in most cases include the whole of
the APP gene which result in the overexpression of APP protein. This protein has been shown to
promote neurogenesis and therefore there may be potential pro- and anti-neurogenic effects in
the same mouse (reviewed in Wirths, 2017).
A study on APP knockout mice demonstrated that lack of APP increased survival of adult-born
DGCs with no effect on proliferation, but at the same time also suppressed dendrite outgrowth
and complexity (Wang et al., 2016). In congruence with the above study, APP has been shown
to regulate the release of GABA by GABAergic interneurons to promote maintenance and
dendrite development of the adult-born neurons (Wang et al., 2014a). Specific deletion of APP
in GABAergic interneurons increases proliferation but induces maturation defects and impairs
contextual discrimination behaviour.
Regarding proteolytic cleavage products of APP, sAPP has been shown to inhibit growth of NSCs
in the SVZ (Sato et al., 2017). On the other hand, another study demonstrated that both secreted
extracellular fragments sAPPα and sAPPβ enhance proliferation of GFAP-positive type-1 cells in
the DG and partially suppress neuronal differentiation (Baratchi et al., 2012).
Overexpression of APP intracellular domain and its direct interactor Fe65 reduced proliferation
in the DG without affecting maturation via an inflammation-associated but Aβ-independent,
pathway (Ghosal et al., 2010). This overexpression impaired Y-maze-tested working memory,
96 and induced the DG to be more susceptible to excitotoxicity indicated by loss of granule neurons,
NMDAR phosphorylation, and Neuropeptide Y upregulation (Ghosal et al., 2016). These APP
intracellular domain-induced neurogenesis impairment effects are also exacerbated by tau
overexpression and in turn prevented by tau knockout. It has also been reported in the SVZ that
the neural recognition molecule TAG1 binds to APP as a ligand and stimulates intracellular
production of the APP intracellular domain via Fe65-dependent pathway to suppress
neurogenesis (Ma et al., 2008). However, this phenomenon has not been observed in the DG.
Toxic oligomeric species of Aβ42 have been shown to induce senescence in adult hippocampal
NSCs in vitro which was further confirmed in APPswe/PS1dE9 transgenic mice (He et al., 2013). Aβ-
induced senescence, marked by expression of the cyclin-dependent kinase inhibitor p16 and β-
galactosidase, required membrane-bound FRBP2 and ROS-p38 MAPK signalling. Injection of
Aβ42 into the CA1 causes amyloid aggregation at the injection site, degeneration of CA3
pyramidal neurons marked by condensed nuclei and cell shrinkage, and a reduction in the
number of cells positive for BrdU and double positive for BrdU and DCX (Zheng et al., 2013).
Overexpression of Aβ limited to CAMKII-expressing mature glutamatergic neurons, including DG
granule neurons and CA pyramidal neurons, resulted in widespread amyloid deposition and
inflammation indicated by proliferation of astrocytes and microglia in the hippocampus but did
not affect maturation or proliferation of new-born neurons (Yetman and Jankowsky, 2013).
Two copies of APOE-ε4 alleles as well as complete lack of APOE in mice did not affect
proliferation or survival of adult-born neurons but significantly decreased dendritic complexity
of these young adult-born DGCs (Tensaouti et al., 2018). On the other hand, earlier study on
ApoE4-knockin mice did not only show defects in dendritic structures, but also an increase in
proliferation and decrease in maturation measured by the number of BrdU/Nestin and
BrdU/NeuN-positive cells respectively (Li et al., 2009a). Furthermore, this deficient neurogenesis
was associated with loss of GABAergic interneurons and was successfully reversed with a GABAA
receptor agonist.
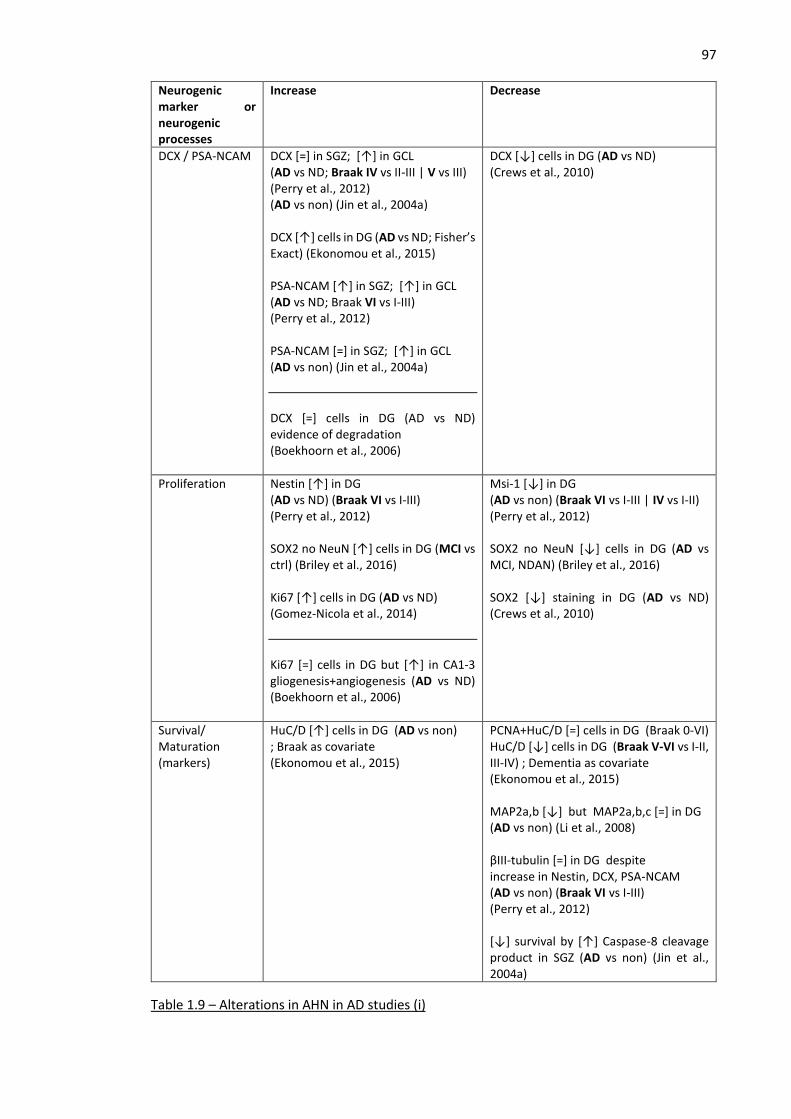
97
Neurogenic marker or neurogenic processes
Increase Decrease
DCX / PSA-NCAM DCX [=] in SGZ; [↑] in GCL (AD vs ND; Braak IV vs II-III | V vs III) (Perry et al., 2012) (AD vs non) (Jin et al., 2004a) DCX [↑] cells in DG (AD vs ND; Fisher’s Exact) (Ekonomou et al., 2015) PSA-NCAM [↑] in SGZ; [↑] in GCL (AD vs ND; Braak VI vs I-III) (Perry et al., 2012) PSA-NCAM [=] in SGZ; [↑] in GCL (AD vs non) (Jin et al., 2004a)
DCX [=] cells in DG (AD vs ND) evidence of degradation (Boekhoorn et al., 2006)
DCX [↓] cells in DG (AD vs ND) (Crews et al., 2010)
Proliferation Nestin [↑] in DG (AD vs ND) (Braak VI vs I-III) (Perry et al., 2012) SOX2 no NeuN [↑] cells in DG (MCI vs ctrl) (Briley et al., 2016) Ki67 [↑] cells in DG (AD vs ND) (Gomez-Nicola et al., 2014)
Ki67 [=] cells in DG but [↑] in CA1-3 gliogenesis+angiogenesis (AD vs ND) (Boekhoorn et al., 2006)
Msi-1 [↓] in DG (AD vs non) (Braak VI vs I-III | IV vs I-II) (Perry et al., 2012) SOX2 no NeuN [↓] cells in DG (AD vs MCI, NDAN) (Briley et al., 2016) SOX2 [↓] staining in DG (AD vs ND) (Crews et al., 2010)
Survival/ Maturation (markers)
HuC/D [↑] cells in DG (AD vs non) ; Braak as covariate (Ekonomou et al., 2015)
PCNA+HuC/D [=] cells in DG (Braak 0-VI) HuC/D [↓] cells in DG (Braak V-VI vs I-II, III-IV) ; Dementia as covariate (Ekonomou et al., 2015) MAP2a,b [↓] but MAP2a,b,c [=] in DG (AD vs non) (Li et al., 2008) βIII-tubulin [=] in DG despite increase in Nestin, DCX, PSA-NCAM (AD vs non) (Braak VI vs I-III) (Perry et al., 2012) [↓] survival by [↑] Caspase-8 cleavage product in SGZ (AD vs non) (Jin et al., 2004a)
Table 1.9 – Alterations in AHN in AD studies (i)
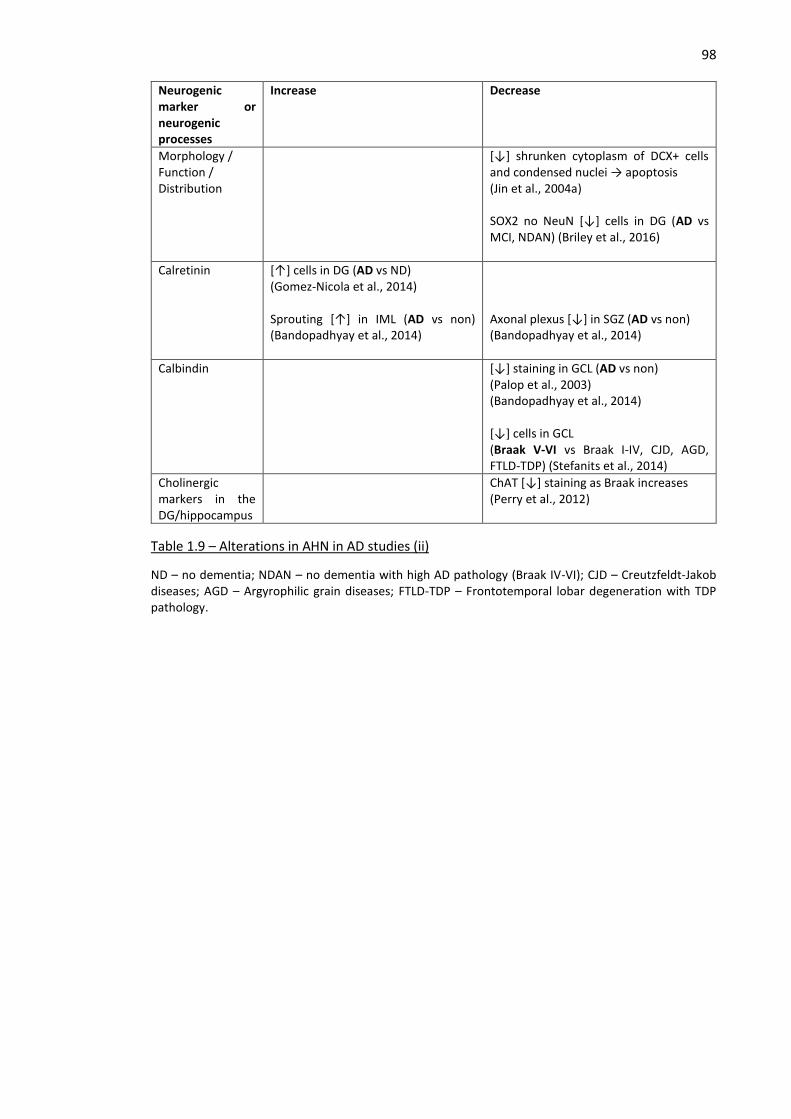
98
Neurogenic marker or neurogenic processes
Increase Decrease
Morphology / Function / Distribution
[↓] shrunken cytoplasm of DCX+ cells and condensed nuclei → apoptosis (Jin et al., 2004a) SOX2 no NeuN [↓] cells in DG (AD vs MCI, NDAN) (Briley et al., 2016)
Calretinin [↑] cells in DG (AD vs ND) (Gomez-Nicola et al., 2014) Sprouting [↑] in IML (AD vs non) (Bandopadhyay et al., 2014)
Axonal plexus [↓] in SGZ (AD vs non) (Bandopadhyay et al., 2014)
Calbindin [↓] staining in GCL (AD vs non) (Palop et al., 2003) (Bandopadhyay et al., 2014) [↓] cells in GCL (Braak V-VI vs Braak I-IV, CJD, AGD, FTLD-TDP) (Stefanits et al., 2014)
Cholinergic markers in the DG/hippocampus
ChAT [↓] staining as Braak increases (Perry et al., 2012)
Table 1.9 – Alterations in AHN in AD studies (ii)
ND – no dementia; NDAN – no dementia with high AD pathology (Braak IV-VI); CJD – Creutzfeldt-Jakob diseases; AGD – Argyrophilic grain diseases; FTLD-TDP – Frontotemporal lobar degeneration with TDP pathology.
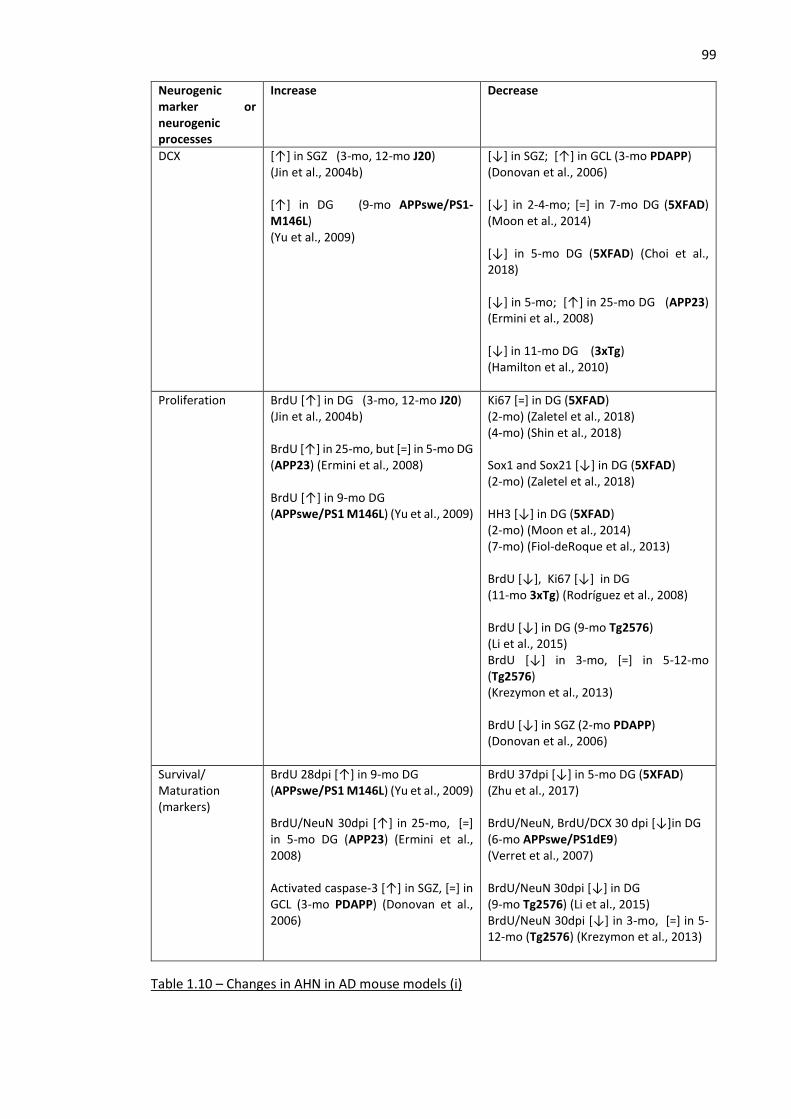
99
Neurogenic marker or neurogenic processes
Increase Decrease
DCX [↑] in SGZ (3-mo, 12-mo J20) (Jin et al., 2004b) [↑] in DG (9-mo APPswe/PS1-M146L) (Yu et al., 2009)
[↓] in SGZ; [↑] in GCL (3-mo PDAPP) (Donovan et al., 2006) [↓] in 2-4-mo; [=] in 7-mo DG (5XFAD) (Moon et al., 2014) [↓] in 5-mo DG (5XFAD) (Choi et al., 2018) [↓] in 5-mo; [↑] in 25-mo DG (APP23) (Ermini et al., 2008) [↓] in 11-mo DG (3xTg) (Hamilton et al., 2010)
Proliferation BrdU [↑] in DG (3-mo, 12-mo J20) (Jin et al., 2004b) BrdU [↑] in 25-mo, but [=] in 5-mo DG (APP23) (Ermini et al., 2008) BrdU [↑] in 9-mo DG (APPswe/PS1 M146L) (Yu et al., 2009)
Ki67 [=] in DG (5XFAD) (2-mo) (Zaletel et al., 2018) (4-mo) (Shin et al., 2018) Sox1 and Sox21 [↓] in DG (5XFAD) (2-mo) (Zaletel et al., 2018) HH3 [↓] in DG (5XFAD) (2-mo) (Moon et al., 2014) (7-mo) (Fiol-deRoque et al., 2013) BrdU [↓], Ki67 [↓] in DG (11-mo 3xTg) (Rodríguez et al., 2008) BrdU [↓] in DG (9-mo Tg2576) (Li et al., 2015) BrdU [↓] in 3-mo, [=] in 5-12-mo (Tg2576) (Krezymon et al., 2013) BrdU [↓] in SGZ (2-mo PDAPP) (Donovan et al., 2006)
Survival/ Maturation (markers)
BrdU 28dpi [↑] in 9-mo DG (APPswe/PS1 M146L) (Yu et al., 2009) BrdU/NeuN 30dpi [↑] in 25-mo, [=] in 5-mo DG (APP23) (Ermini et al., 2008) Activated caspase-3 [↑] in SGZ, [=] in GCL (3-mo PDAPP) (Donovan et al., 2006)
BrdU 37dpi [↓] in 5-mo DG (5XFAD) (Zhu et al., 2017) BrdU/NeuN, BrdU/DCX 30 dpi [↓]in DG (6-mo APPswe/PS1dE9) (Verret et al., 2007) BrdU/NeuN 30dpi [↓] in DG (9-mo Tg2576) (Li et al., 2015) BrdU/NeuN 30dpi [↓] in 3-mo, [=] in 5-12-mo (Tg2576) (Krezymon et al., 2013)
Table 1.10 – Changes in AHN in AD mouse models (i)
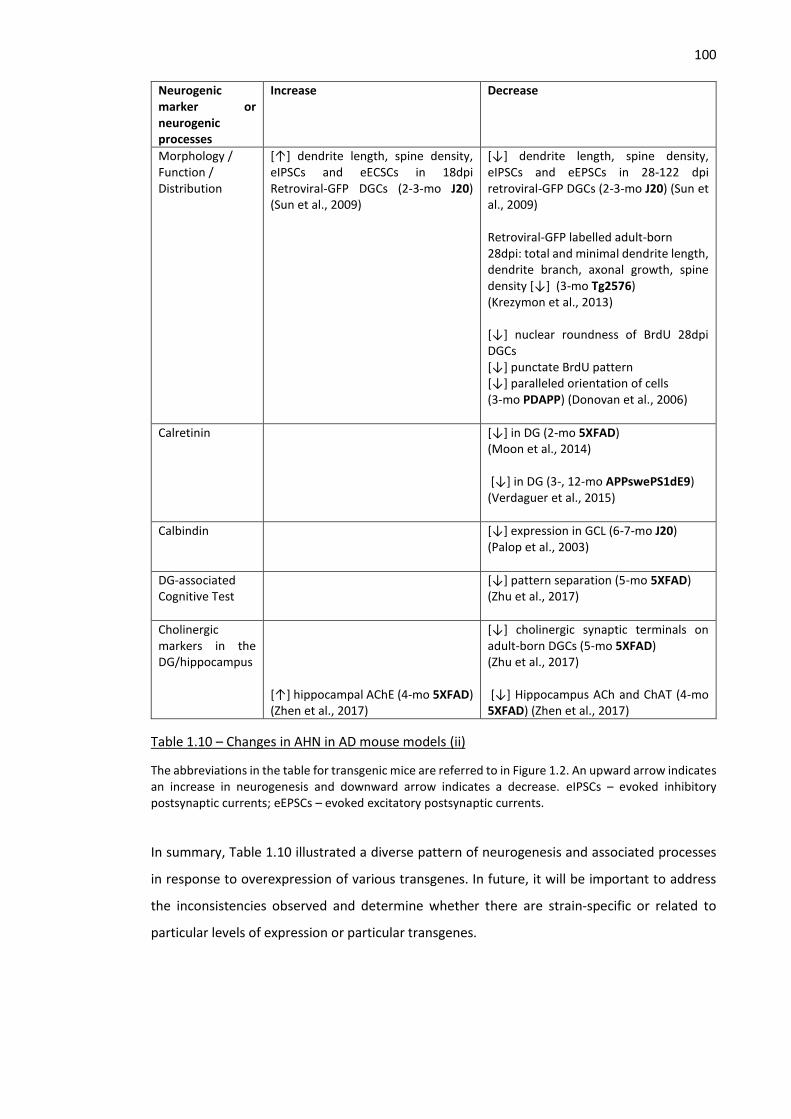
100
Neurogenic marker or neurogenic processes
Increase Decrease
Morphology / Function / Distribution
[↑] dendrite length, spine density, eIPSCs and eECSCs in 18dpi Retroviral-GFP DGCs (2-3-mo J20) (Sun et al., 2009)
[↓] dendrite length, spine density, eIPSCs and eEPSCs in 28-122 dpi retroviral-GFP DGCs (2-3-mo J20) (Sun et al., 2009) Retroviral-GFP labelled adult-born 28dpi: total and minimal dendrite length, dendrite branch, axonal growth, spine density [↓] (3-mo Tg2576) (Krezymon et al., 2013) [↓] nuclear roundness of BrdU 28dpi DGCs [↓] punctate BrdU pattern [↓] paralleled orientation of cells (3-mo PDAPP) (Donovan et al., 2006)
Calretinin [↓] in DG (2-mo 5XFAD) (Moon et al., 2014) [↓] in DG (3-, 12-mo APPswePS1dE9) (Verdaguer et al., 2015)
Calbindin [↓] expression in GCL (6-7-mo J20) (Palop et al., 2003)
DG-associated Cognitive Test
[↓] pattern separation (5-mo 5XFAD) (Zhu et al., 2017)
Cholinergic markers in the DG/hippocampus
[↑] hippocampal AChE (4-mo 5XFAD) (Zhen et al., 2017)
[↓] cholinergic synaptic terminals on adult-born DGCs (5-mo 5XFAD) (Zhu et al., 2017) [↓] Hippocampus ACh and ChAT (4-mo 5XFAD) (Zhen et al., 2017)
Table 1.10 – Changes in AHN in AD mouse models (ii)
The abbreviations in the table for transgenic mice are referred to in Figure 1.2. An upward arrow indicates an increase in neurogenesis and downward arrow indicates a decrease. eIPSCs – evoked inhibitory postsynaptic currents; eEPSCs – evoked excitatory postsynaptic currents.
In summary, Table 1.10 illustrated a diverse pattern of neurogenesis and associated processes
in response to overexpression of various transgenes. In future, it will be important to address
the inconsistencies observed and determine whether there are strain-specific or related to
particular levels of expression or particular transgenes.
101 1.4.7.4 Dementia and neurogenesis
Changes in adult neurogenesis in dementia have been of interest for a long time but the
mechanisms have been unclear. A common finding that further complicated this area of study
is the upregulation of adult hippocampal neurogenesis in several types of dementia including
AD and DLB/PDD. This phenomenon could be compensatory for the dementia-induced abnormal
hippocampal circuitry or even contribute to the defects of the system. At the same time, greater
AHN after drug treatment were reportedly associated with higher cognitive performance (Gatt
et al., 2018). To understand the difference between healthy neurogenesis and disease-induced
neurogenesis, more thorough profiling of neurogenic population and deeper comprehension of
fundamental human adult hippocampal neurogenesis mechanisms are necessary. In that regard,
currently the only method to study neurogenesis in the DG is from postmortem samples.
Biomarkers of dementia-sensitive subpopulation in vivo and super high-resolution live imaging
could be crucial to future longitudinal studies and even diagnosis.
Changes in AHN as a function of dementia progression have been unclear since there has not
been a complete profile of relevant neurogenic markers and there are multiple interconnected
disease-related pathways that affect the DG which have not been understood. One of these
crucial factors is the septophippocampal cholinergic innervation.
1.5 Hypotheses and Aims
1.5.1 Overarching Hypothesis
Cholinergic innervation in the hippocampus is associated with adult neurogenesis in the dentate
gyrus.
1.5.2 Human AD study: hypothesis and aims
Background: Documented defects in adult hippocampal neurogenesis in AD patients include loss
of type-1 cells and dysfunctional maturation that results in accumulated population of
intermediate neurogenic populations. Cholinergic axons from the medial septum and vertical
diagonal band of Broca (MS/VDB) innervate the hippocampus. MS/VDB have been shown to be
resilient in AD as demonstrated by an elevation in hippocampal ChAT activity of Braak stage III
and MCI patients. This compensatory increase in hippocampal ChAT activity is correlated with
preserved cognitive functions. Septohippocampal cholinergic signals have also been reported to
regulate adult hippocampal neurogenesis.
Hypothesis: Upregulation of hippocampal cholinergic innervation is associated with specific
changes in adult neurogenesis that potentially contributes to cognitive preservation.
102 The aims of the study are
• To measure the extents of adult hippocampal neurogenesis, cholinergic innervation, and
correlation between the two using immunohistochemistry on 8 pilot cases of 4 controls
and 4 AD patients.
• The pilot study provides the information of whether our markers of choice show
interesting trend across Braak stages and dementia status. The number of cases
required for the main study is calculated from the pilot data to give the power of
approximately 80% for multiple comparison and correlation.
• To measure the number of intermediate neurogenic population (DCX, HuB/D, PCNA)
and extents of cholinergic innervation (ChAT, VAChT) using immunohistochemistry on a
cohort of 36 cases with Braak 0 (4), I (2), II (8), III (6), IV (4), V (5), VI (7).
The benefits of the study
• It may provide better understanding of the relationships between changes in cholinergic
systems and adult hippocampal neurogenesis in humans especially in AD patients, which
have been difficult to replicate in animal models.
• It may suggest potential markers of either cholinergic or hippocampal neurogenesis for
future disease diagnosis.
1.5.3 D427V/WT GBA1 mice study: hypothesis and aims
Background: Similar to AD, DLB patients exhibit significant degeneration of hippocampal
cholinergic innervation, loss of DG type-1 cells, and higher number of proliferative intermediate
populations. However, compensatory biphasic regulation of septohippocampal cholinergic
systems has not been found. Heterozygous GBA1 mutations are the most prevalent risk factors
for DLB. D427V/WT GBA1 heterozygous mice have lower GBA activity and impaired
hippocampal-associated cognitive performance.
Hypothesis: D427V/WT mice have hippocampal cholinergic deficits that are associated with
cognitive deficits and aberrant neurogenesis
The aims of the study are:
• To profile the changes of cholinergic innervation (ChAT, VAChT) in various parts of the
brain in D427V/WT mice compared to WT/WT using immunohistochemistry.
• To evaluate the changes of adult hippocampal neurogenesis (DCX, HuB/D, PCNA)
between the D427V/WT and WT/WT mice.
103
• To confirm the immunohistochemical findings on cholinergic aberration with western
blot analysis.
The benefits of the study
• This mouse model has not been extensively studied before. Profiles of its cholinergic
and adult neurogenic will contribute to the evaluation of its potential as a DLB model.
• A clean genetic model will help us understand mechanistic links between GCase
functions, cholinergic basal forebrain systems, and adult hippocampal neurogenesis.
1.5.4 5XFAD mice study: hypothesis and aims
Background: 5XFAD mice develop early and extensive amyloid plaque burden, loss of BFCNs,
impaired AHN, and cognitive deficits. Nonetheless, there has not been a study on changes in the
density of cholinergic axons in the cortex or hippocampus or on HuB/D-positive cells in the DG.
A previous study investigated AHN at earlier ages of up to 7 mo but not at later age of 11-12 mo
Hypothesis: 5XFAD mice have hippocampal cholinergic deficits that are associated with AHN
The aims of the study are:
• To profile the changes of cholinergic innervation (ChAT, VAChT) in various parts of the
brain in 5XFAD compared with WT using immunohistochemistry.
• To evaluate the changes of adult hippocampal neurogenesis (DCX, HuB/D, PCNA)
between the 5XFAD and WT mice.
The benefits of the study
• Since 5XFAD does not develop NFT pathology, abnormalities in cholinergic and AHN
system observed in this model can be attributed to the Aβ-associated effects
104
2 Materials and methods
This section covers the two main methodological approaches used in this thesis namely
immunohistochemistry and Western blotting. Details of the individual studies and the
description the cases and materials used are provided at the beginning of the chapter.
2.1 Immunohistochemistry (IHC)
Paraffin-embedded 8-µm-thick sections were obtained at the level of the hippocampus.
Sections were dewaxed with Histo-Clear (National Diagnostics) (2 x 3 min), subsequently
rehydrated with graded dilutions of alcohol (100%, 2 x 3 min; 90%, 1 x 3 min; 70%, 1x 3 min),
and washed under running tap water. Antigen retrieval solution, 10 mM citric acid (pH 6.4), was
pre-heated to boil in a pressure cooker for 10 min. Slides were immersed in the solution and the
lid was sealed tight. The cooker was heated again for 5 min 30 sec and left to cool down until
the pressure valve dropped (~ 10 min). The lid was removed and the cooker was placed under
gently running tap water for 5 min. Excess water on slides was drained and sections were
covered with PBS for at least 5 min. Sections were incubated in primary antibody solution for
overnight at 4°C. Slides were washed with PBS (3 x 3 min). Sections were then incubated in Alexa
Fluor secondary antibody solution for 1 hr 45 min at room temperature (RT). After the secondary
antibody was discarded, DAPI solution (D3571, ThermoFisher Scientific) (300 nM, 1 µl of the 5
mg/ml stock solution in 36.3 ml PBS) was applied to sections for 3 min. Slides were washed in
PBS (3 x 3 min) and incubated in Sudan Black B (0.1% in 70% ethanol) for 20 min at RT. Slides
were washed under running tap water and then mounted in Vectamount AQ (H-5501, Vector
Laboratories)
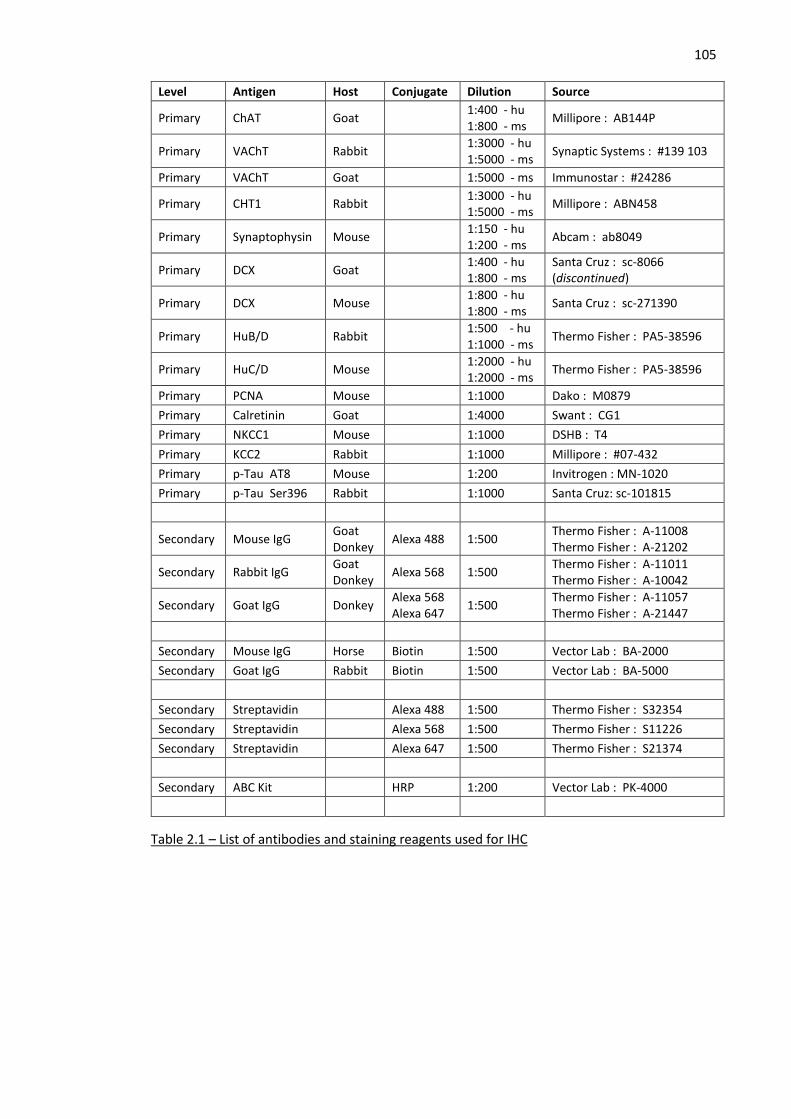
105
Level Antigen Host Conjugate Dilution Source
Primary ChAT Goat 1:400 - hu 1:800 - ms
Millipore : AB144P
Primary VAChT Rabbit 1:3000 - hu 1:5000 - ms
Synaptic Systems : #139 103
Primary VAChT Goat 1:5000 - ms Immunostar : #24286
Primary CHT1 Rabbit 1:3000 - hu 1:5000 - ms
Millipore : ABN458
Primary Synaptophysin Mouse 1:150 - hu 1:200 - ms
Abcam : ab8049
Primary DCX Goat 1:400 - hu 1:800 - ms
Santa Cruz : sc-8066 (discontinued)
Primary DCX Mouse 1:800 - hu 1:800 - ms
Santa Cruz : sc-271390
Primary HuB/D Rabbit 1:500 - hu 1:1000 - ms
Thermo Fisher : PA5-38596
Primary HuC/D Mouse 1:2000 - hu 1:2000 - ms
Thermo Fisher : PA5-38596
Primary PCNA Mouse 1:1000 Dako : M0879
Primary Calretinin Goat 1:4000 Swant : CG1
Primary NKCC1 Mouse 1:1000 DSHB : T4
Primary KCC2 Rabbit 1:1000 Millipore : #07-432
Primary p-Tau AT8 Mouse 1:200 Invitrogen : MN-1020
Primary p-Tau Ser396 Rabbit 1:1000 Santa Cruz: sc-101815
Secondary Mouse IgG Goat Donkey
Alexa 488 1:500 Thermo Fisher : A-11008 Thermo Fisher : A-21202
Secondary Rabbit IgG Goat Donkey
Alexa 568 1:500 Thermo Fisher : A-11011 Thermo Fisher : A-10042
Secondary Goat IgG Donkey Alexa 568 Alexa 647
1:500 Thermo Fisher : A-11057 Thermo Fisher : A-21447
Secondary Mouse IgG Horse Biotin 1:500 Vector Lab : BA-2000
Secondary Goat IgG Rabbit Biotin 1:500 Vector Lab : BA-5000
Secondary Streptavidin Alexa 488 1:500 Thermo Fisher : S32354
Secondary Streptavidin Alexa 568 1:500 Thermo Fisher : S11226
Secondary Streptavidin Alexa 647 1:500 Thermo Fisher : S21374
Secondary ABC Kit HRP 1:200 Vector Lab : PK-4000
Table 2.1 – List of antibodies and staining reagents used for IHC
106
2.2 Western blotting
Proteins from mouse brains were extracted with TRIzol reagent by Dr Emily Clarke. In brief, 1.5
ml of TRIzol was added per 100 mg tissue. Tissues were homogenised using the IKA Ultra Turrax
handheld homogeniser. Homogenates were centrifuged at 12,000 ×g for 5 min at 8 °C.
Supernatant was transferred to new tube and incubated for 5 min at RT before 0.2 ml of
chloroform was added per 1.5ml of TRIzol. After incubation for 2-3 min at RT, the mixture was
centrifuged at 12,000 ×g for 15 min at 4°C. The mixture should be separated into 3 layers: RNA-
concentrated aqueous phase, thin interface, and red phenol-chloroform phase at the bottom.
Aqueous phase was removed from the interface (for qPCR by Dr Emily Clarke) and 450 µl 100%
ethanol was added before followed by several times of inversion. The mixture was incubated for
2-3 min at RT and then centrifuged at 2,000 ×g for 5 min at 4°C. Protein-concentrated
supernatant was transferred to a new tube and 2.25 ml isopropanol was added. The protein
solution was incubated for 10 min at RT and then centrifuged at 12,000 ×g for 10 min at 4°C to
precipitate the proteins and discard the supernatant. Pellets were resuspended and washed in
3ml of 0.3M Guanidine HCl in 95% ethanol. The protein suspension was incubated for 20 min
and centrifuged at 7,500 ×g for 5 min at 4°C. The washing process was repeated again before
the last vigorous wash by vortexing with 2ml 100% ethanol. The same incubation and centrifuge
were performed, and the pellets were air-dried for 5-10 min. Pellets were resuspended in 200ml
1% SDS approximately for 15 min at 50°C to ensure that most proteins were solubilised. The
solution was centrifuged at 10,000 ×g for 10min at 4°C and the supernatant was collected for
protein assay.
Protein concentration was determined using the ThermoScientific™ Pierce™ Coomassie
(Bradford) Protein Assay (# 23200) exactly according to the provided user guide.
For loading sample preparation, 5X bromophenol blue-containing Laemmli sample buffer for
SDS-PAGE was added to the TRIzol-extracted protein solution. The sample were then either
boiled at 95°C for 5 min and then stored at -20°C for SDS-PAGE of most proteins or simply stored
at 4°C without heating for SDS-PAGE of hydrophobic residue-rich integral membrane proteins
such as VAChT and VMAT2.
Electrophoresis was run with a 10% SDS-polyacrylamide gel at 80 V for the first 30 min and at
130 V for the latter 1 hr. On each gel, 2.5 µl of full range rainbow molecular weight (RPN800E,
GE Healthcare) was loaded in a central lane and flanked by two lanes of mouse cortex crude
homogenate as positive controls.
Proteins in the gel were transferred to nitrocellulose membrane (10600001, GE Healthcare) by
wet electroblotting at 60 V for 90 min. Membranes were treated with 10% non-fat dry milk in
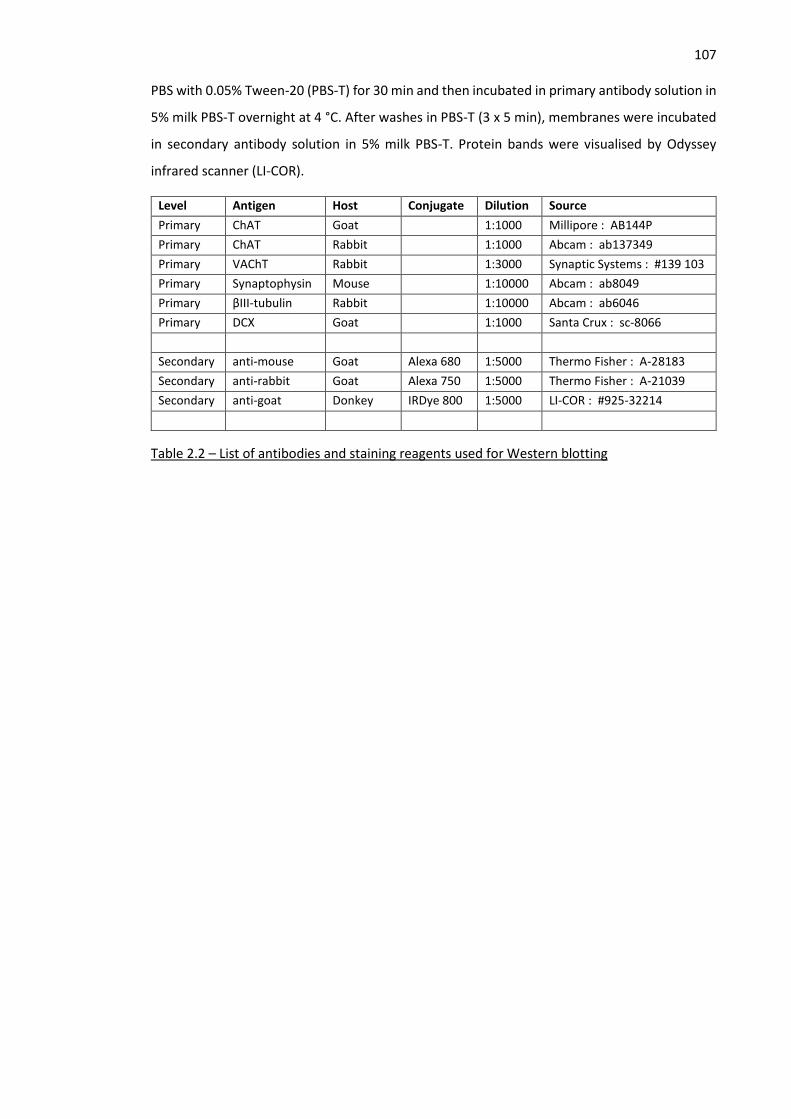
107 PBS with 0.05% Tween-20 (PBS-T) for 30 min and then incubated in primary antibody solution in
5% milk PBS-T overnight at 4 °C. After washes in PBS-T (3 x 5 min), membranes were incubated
in secondary antibody solution in 5% milk PBS-T. Protein bands were visualised by Odyssey
infrared scanner (LI-COR).
Level Antigen Host Conjugate Dilution Source
Primary ChAT Goat 1:1000 Millipore : AB144P
Primary ChAT Rabbit 1:1000 Abcam : ab137349
Primary VAChT Rabbit 1:3000 Synaptic Systems : #139 103
Primary Synaptophysin Mouse 1:10000 Abcam : ab8049
Primary βIII-tubulin Rabbit 1:10000 Abcam : ab6046
Primary DCX Goat 1:1000 Santa Crux : sc-8066
Secondary anti-mouse Goat Alexa 680 1:5000 Thermo Fisher : A-28183
Secondary anti-rabbit Goat Alexa 750 1:5000 Thermo Fisher : A-21039
Secondary anti-goat Donkey IRDye 800 1:5000 LI-COR : #925-32214
Table 2.2 – List of antibodies and staining reagents used for Western blotting
108
3 Contribution of cholinergic innervation to adult hippocampal
neurogenesis in Alzheimer’s disease patients: Pilot cases
3.1 Background
The study of neurogenesis in AD has become an increasing focus of research (Kempermann et
al., 2018) see section 1.4. Apart from a deeper understanding of disease mechanisms the
prospect of supporting neurogenesis as new therapeutic target in AD is attractive (Han et al.,
2016). The levels of neuroblast markers and neuronal fate-determined progenitor markers in
the DG such as DCX, PSA-NCAM, and TUC-4 have been evaluated to be higher in AD patients
than in controls by using immunohistochemistry and western bloting (Jin et al., 2004a; Perry et
al., 2012). The number of DCX-positive neurons may vary among individuals from none to several
cells, but AD patients still show higher incidence of possessing DCX-positive cells. Interestingly,
the level of βIII-tubulin is not different between AD patients and controls. This result is
congruent with the lower number of HuC/D-positive cells without PCNA expression in patients
with Braak stage V-VI, which indicates defects in maturation past mitotic phase (Ekonomou et
al., 2015). Interestingly, the number of calretinin-positive immature neurons is also increased in
AD patients, which suggests that there is also a defect in late maturation step and circuitry
integration (Gomez-Nicola et al., 2014). This notion is supported by the lower number of
calbindin-positive neurons in the DG (Palop et al., 2003; Bandopadhyay et al., 2014; Stefanits et
al., 2014). However, western blotting of the whole hippocampus shows a contradictory result of
unchanged calbindin level across between AD and controls (Jin et al., 2004a). The level of type-
1 marker Msi-1 is reduced in AD patients but the level of type-2 marker nestin is increased Perry
et al., 2012. The number of Sox2-positive cells is not different between AD and controls, but the
number of Sox-2 positive postmitotic granule neurons is lower in AD than in controls and non-
demented individuals with high pathology scores (Briley et al., 2016).
The overall hypothesis of this study is that there is a relationship between cholinergic
innervation in the DG and changes in adult hippocampal neurogenesis across progressing Braak
stage (section 1.5)
The purposes of the pilot study were to find suitable markers that truthfully characterise
cholinergic axons in the DG and subpopulation of neuroblasts or immature DGCs, to optimise
IHC procedures and quantification methods for corresponding markers, to perform exploratory
statistics that helped identifying appropriate statistical models and potential covariates, and
lastly to provide approximate effect sizes of different markers of interest to estimate 80%-power
sample size for the main study.
109 The hypotheses of this chapter were as follows. First, ChAT and VAChT staining would reflect
overall morphology or enzyme capacity and punctate characteristics of cholinergic axons
respectively. Second, immunoreactivity for DCX and HuC/D would represent two different but
overlapping neurogenic subpopulations in the course of adult-born DGC development. Last,
effect size calculated from this pilot data of various markers should be sufficiently large that an
estimated sample size of approximately 35-40 could achieve 80% power in the main study.
3.2 Materials and Methods
3.2.1 Pilot human cohort and data management
All brain sections were requested from London Neurodegenerative Diseases Brain Bank, part of
the Brains for Dementia Research & the Medical Research Council networks (LNDBB, BDR &
MRC). Originally, 5 cases of control and dementia each were selected, but sections from one of
the non-demented cases with Braak IV did not contain the DG. Therefore, there were 9 cases in
total available for study. Demographic variables together PMI and pH are shown in the Table
3.1. The only Braak IV ND case also had no reported pH data and had to be excluded from the
regression analyses. To account for the effect of different longitudinal parts of the hippocampus,
the distance in cm of each coronal section from the front of the brain was estimated from the
shape of the hippocampus and parahippocampal gyrus with reference to high resolution Nissl-
stained sections provided in Virtual Microscopy page of TheHumanBrain.info
(TheHumanBrain.info, 2018a). We planned to examine cm from front, sex, age, PMI, and pH as
covariates for this study and also for the main study. Amyloid angiopathy was not included since
we intended to minimize the number of cases with vascular pathology. Student’s t-test with
Welch’s correction showed that none of the selected covariates was significantly different
between no dementia and dementia groups (Table 3.2).
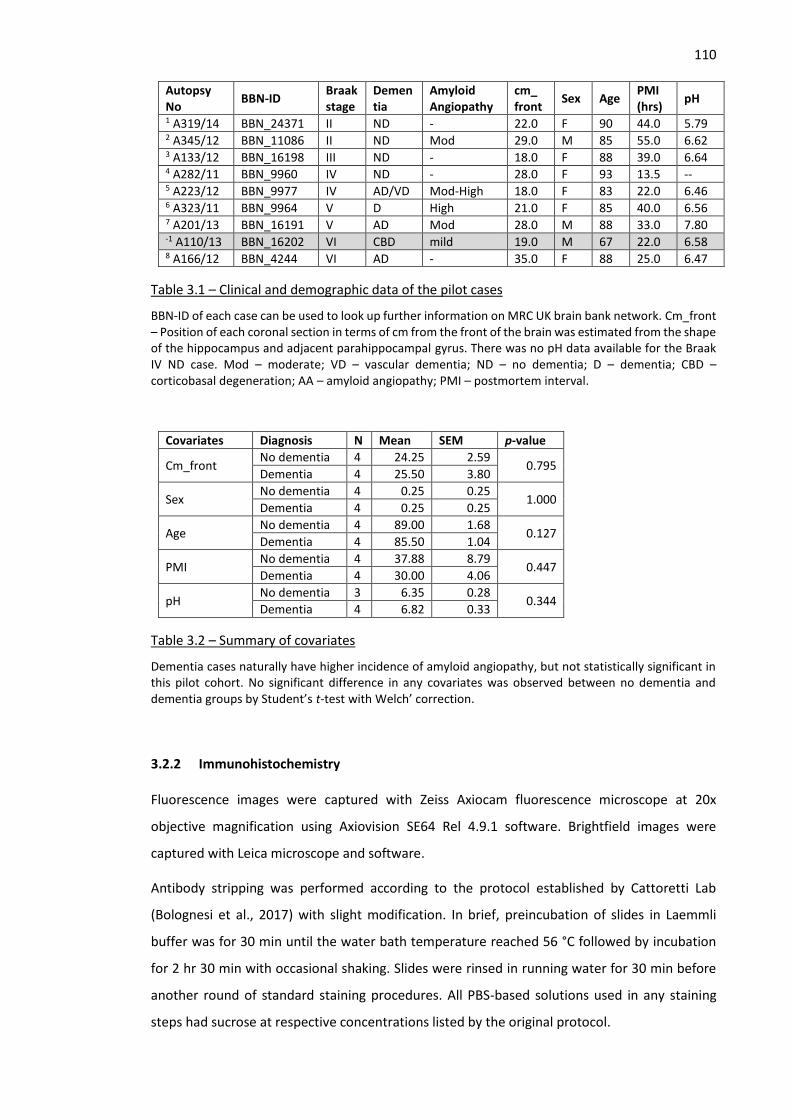
110
Autopsy No
BBN-ID Braak stage
Dementia
Amyloid Angiopathy
cm_ front
Sex Age PMI (hrs)
pH
1 A319/14 BBN_24371 II ND - 22.0 F 90 44.0 5.79 2 A345/12 BBN_11086 II ND Mod 29.0 M 85 55.0 6.62 3 A133/12 BBN_16198 III ND - 18.0 F 88 39.0 6.64 4 A282/11 BBN_9960 IV ND - 28.0 F 93 13.5 -- 5 A223/12 BBN_9977 IV AD/VD Mod-High 18.0 F 83 22.0 6.46 6 A323/11 BBN_9964 V D High 21.0 F 85 40.0 6.56 7 A201/13 BBN_16191 V AD Mod 28.0 M 88 33.0 7.80 -1 A110/13 BBN_16202 VI CBD mild 19.0 M 67 22.0 6.58 8 A166/12 BBN_4244 VI AD - 35.0 F 88 25.0 6.47
Table 3.1 – Clinical and demographic data of the pilot cases
BBN-ID of each case can be used to look up further information on MRC UK brain bank network. Cm_front – Position of each coronal section in terms of cm from the front of the brain was estimated from the shape of the hippocampus and adjacent parahippocampal gyrus. There was no pH data available for the Braak IV ND case. Mod – moderate; VD – vascular dementia; ND – no dementia; D – dementia; CBD – corticobasal degeneration; AA – amyloid angiopathy; PMI – postmortem interval.
Covariates Diagnosis N Mean SEM p-value
Cm_front No dementia 4 24.25 2.59
0.795 Dementia 4 25.50 3.80
Sex No dementia 4 0.25 0.25
1.000 Dementia 4 0.25 0.25
Age No dementia 4 89.00 1.68
0.127 Dementia 4 85.50 1.04
PMI No dementia 4 37.88 8.79
0.447 Dementia 4 30.00 4.06
pH No dementia 3 6.35 0.28
0.344 Dementia 4 6.82 0.33
Table 3.2 – Summary of covariates
Dementia cases naturally have higher incidence of amyloid angiopathy, but not statistically significant in this pilot cohort. No significant difference in any covariates was observed between no dementia and dementia groups by Student’s t-test with Welch’ correction.
3.2.2 Immunohistochemistry
Fluorescence images were captured with Zeiss Axiocam fluorescence microscope at 20x
objective magnification using Axiovision SE64 Rel 4.9.1 software. Brightfield images were
captured with Leica microscope and software.
Antibody stripping was performed according to the protocol established by Cattoretti Lab
(Bolognesi et al., 2017) with slight modification. In brief, preincubation of slides in Laemmli
buffer was for 30 min until the water bath temperature reached 56 °C followed by incubation
for 2 hr 30 min with occasional shaking. Slides were rinsed in running water for 30 min before
another round of standard staining procedures. All PBS-based solutions used in any staining
steps had sucrose at respective concentrations listed by the original protocol.
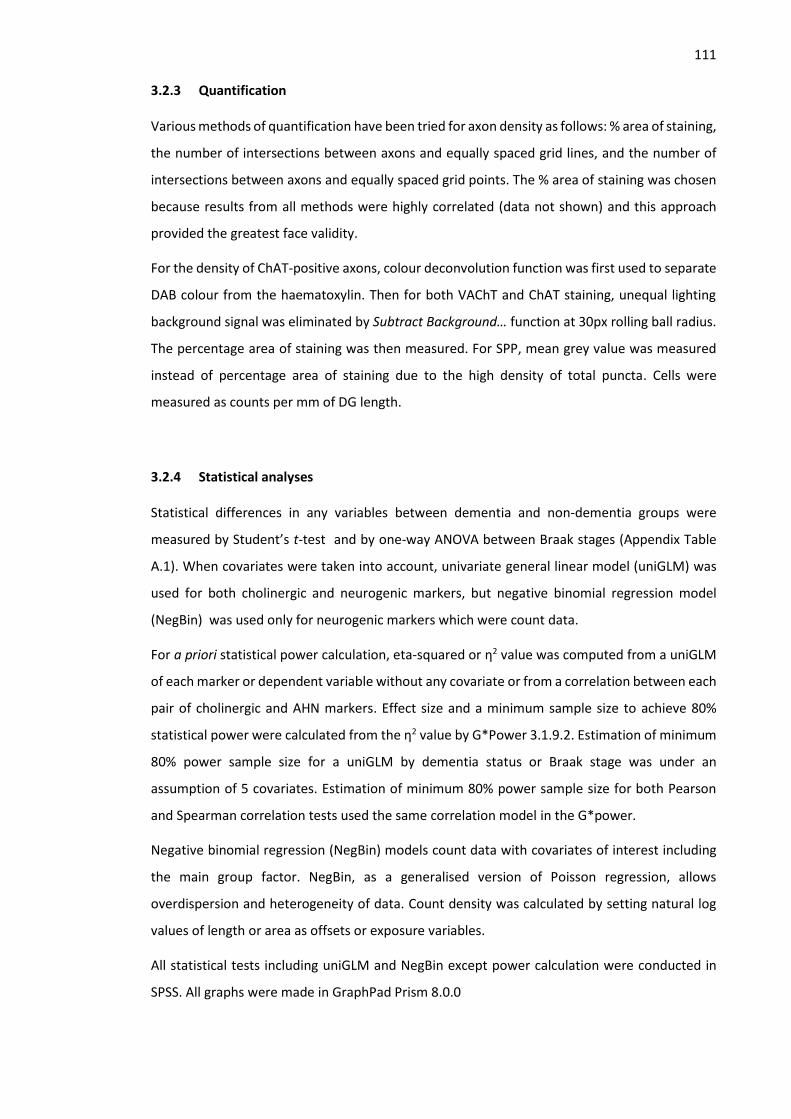
111 3.2.3 Quantification
Various methods of quantification have been tried for axon density as follows: % area of staining,
the number of intersections between axons and equally spaced grid lines, and the number of
intersections between axons and equally spaced grid points. The % area of staining was chosen
because results from all methods were highly correlated (data not shown) and this approach
provided the greatest face validity.
For the density of ChAT-positive axons, colour deconvolution function was first used to separate
DAB colour from the haematoxylin. Then for both VAChT and ChAT staining, unequal lighting
background signal was eliminated by Subtract Background… function at 30px rolling ball radius.
The percentage area of staining was then measured. For SPP, mean grey value was measured
instead of percentage area of staining due to the high density of total puncta. Cells were
measured as counts per mm of DG length.
3.2.4 Statistical analyses
Statistical differences in any variables between dementia and non-dementia groups were
measured by Student’s t-test and by one-way ANOVA between Braak stages (Appendix Table
A.1). When covariates were taken into account, univariate general linear model (uniGLM) was
used for both cholinergic and neurogenic markers, but negative binomial regression model
(NegBin) was used only for neurogenic markers which were count data.
For a priori statistical power calculation, eta-squared or η2 value was computed from a uniGLM
of each marker or dependent variable without any covariate or from a correlation between each
pair of cholinergic and AHN markers. Effect size and a minimum sample size to achieve 80%
statistical power were calculated from the η2 value by G*Power 3.1.9.2. Estimation of minimum
80% power sample size for a uniGLM by dementia status or Braak stage was under an
assumption of 5 covariates. Estimation of minimum 80% power sample size for both Pearson
and Spearman correlation tests used the same correlation model in the G*power.
Negative binomial regression (NegBin) models count data with covariates of interest including
the main group factor. NegBin, as a generalised version of Poisson regression, allows
overdispersion and heterogeneity of data. Count density was calculated by setting natural log
values of length or area as offsets or exposure variables.
All statistical tests including uniGLM and NegBin except power calculation were conducted in
SPSS. All graphs were made in GraphPad Prism 8.0.0
112
3.3 Results
3.3.1 Changes in cholinergic and neurogenic markers between control and dementia
Staining of cholinergic axons with ChAT in the present study was consistent with what has been
described in previous studies (Figure 3.1A-C) (Kooi et al., 2011; Perry et al., 2012). VAChT-
positive axons in the ML share similar morphological characteristics with ChAT-positive axons
but were thinner and more punctate as expected of a synaptic vesicle marker (Figure 3.1D-F).
The non-specific staining in cell bodies, especially in the GCL, was intense such that
determination of the extent of axon staining in the GCL was not feasible. For comparison, a more
general marker of presynaptic terminals synaptophysin (SPP) was also examined. SPP staining
was, as expected of presynaptic markers, very intense in the ML and hippocampal parenchyma
but absent in the cell body and low in the cell-dense GCL (Figure 3.1G-I). In terms of the purpose
of this pilot study, exploratory statistical analysis was undertaken. This analysis showed that
staining of axons for ChAT in the ML (Figure 3.2A) and GCL (Figure 3.1B) was lower in the
dementia cases than controls by 34.5% and 28.2% respectively but the difference was not
statically significant. VAChT %area of staining in the ML (Figure 3.2C) was significantly reduced
in the dementia group by 50.6% (p = 0.0095). SPP mean grey value in the ML (Figure 3.2D) was
also slightly reduced by 15.6%.
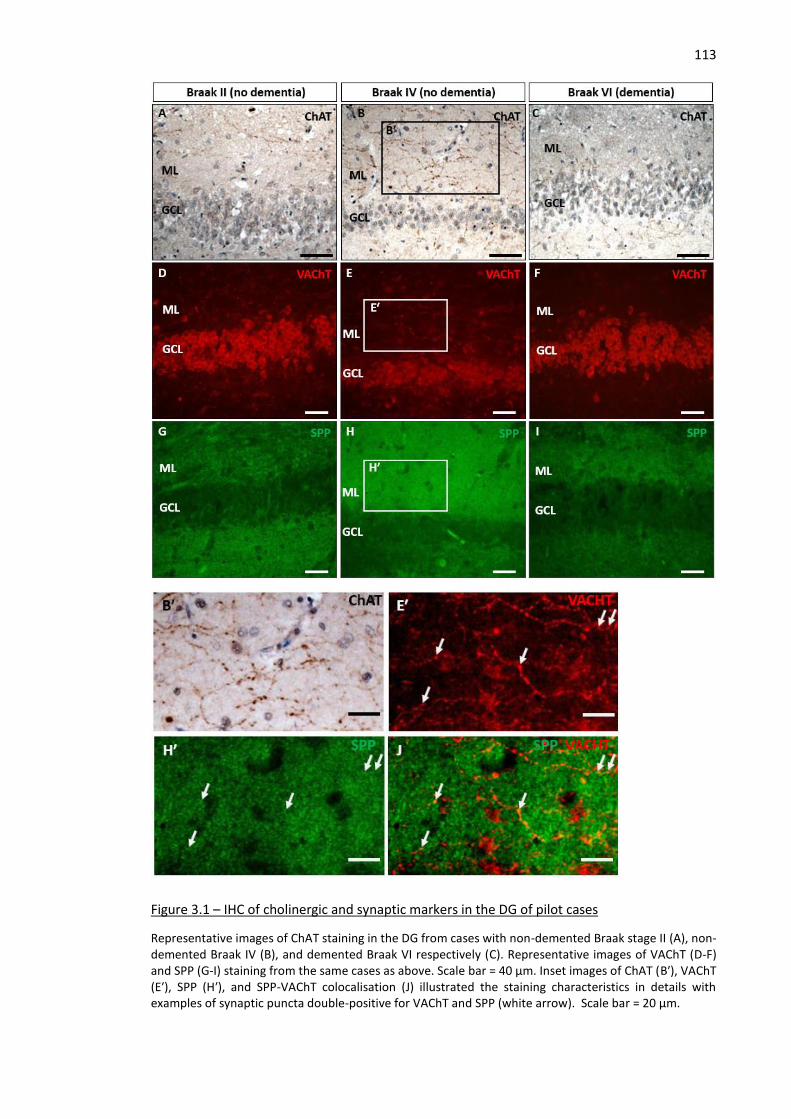
113
Figure 3.1 – IHC of cholinergic and synaptic markers in the DG of pilot cases
Representative images of ChAT staining in the DG from cases with non-demented Braak stage II (A), non-demented Braak IV (B), and demented Braak VI respectively (C). Representative images of VAChT (D-F) and SPP (G-I) staining from the same cases as above. Scale bar = 40 µm. Inset images of ChAT (Bʹ), VAChT (Eʹ), SPP (Hʹ), and SPP-VAChT colocalisation (J) illustrated the staining characteristics in details with examples of synaptic puncta double-positive for VAChT and SPP (white arrow). Scale bar = 20 µm.
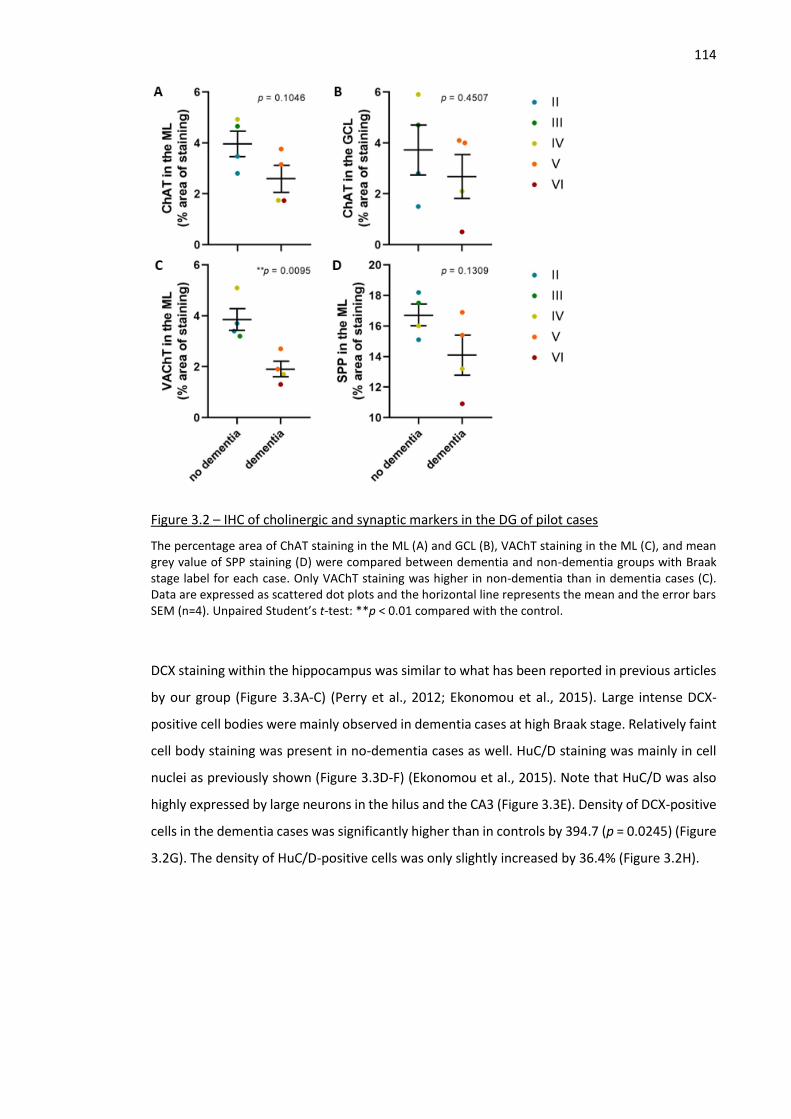
114
Figure 3.2 – IHC of cholinergic and synaptic markers in the DG of pilot cases
The percentage area of ChAT staining in the ML (A) and GCL (B), VAChT staining in the ML (C), and mean grey value of SPP staining (D) were compared between dementia and non-dementia groups with Braak stage label for each case. Only VAChT staining was higher in non-dementia than in dementia cases (C). Data are expressed as scattered dot plots and the horizontal line represents the mean and the error bars SEM (n=4). Unpaired Student’s t-test: **p < 0.01 compared with the control.
DCX staining within the hippocampus was similar to what has been reported in previous articles
by our group (Figure 3.3A-C) (Perry et al., 2012; Ekonomou et al., 2015). Large intense DCX-
positive cell bodies were mainly observed in dementia cases at high Braak stage. Relatively faint
cell body staining was present in no-dementia cases as well. HuC/D staining was mainly in cell
nuclei as previously shown (Figure 3.3D-F) (Ekonomou et al., 2015). Note that HuC/D was also
highly expressed by large neurons in the hilus and the CA3 (Figure 3.3E). Density of DCX-positive
cells in the dementia cases was significantly higher than in controls by 394.7 (p = 0.0245) (Figure
3.2G). The density of HuC/D-positive cells was only slightly increased by 36.4% (Figure 3.2H).
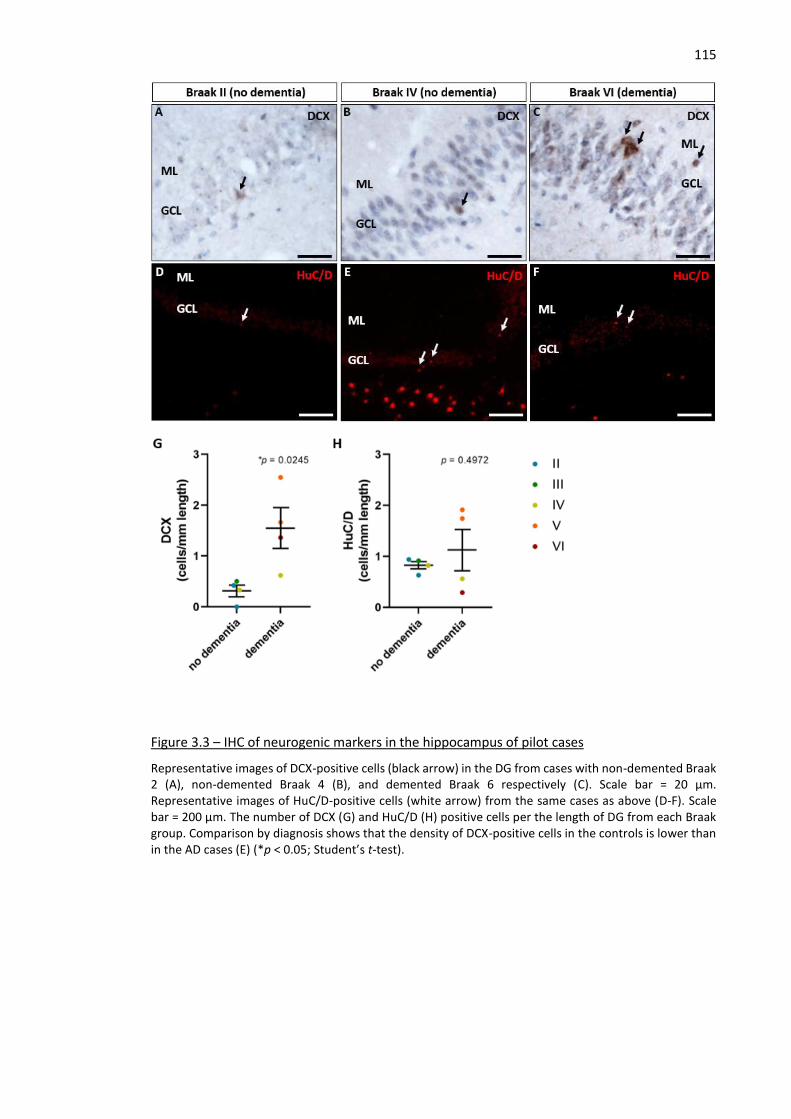
115
Figure 3.3 – IHC of neurogenic markers in the hippocampus of pilot cases
Representative images of DCX-positive cells (black arrow) in the DG from cases with non-demented Braak 2 (A), non-demented Braak 4 (B), and demented Braak 6 respectively (C). Scale bar = 20 µm. Representative images of HuC/D-positive cells (white arrow) from the same cases as above (D-F). Scale bar = 200 µm. The number of DCX (G) and HuC/D (H) positive cells per the length of DG from each Braak group. Comparison by diagnosis shows that the density of DCX-positive cells in the controls is lower than in the AD cases (E) (*p < 0.05; Student’s t-test).
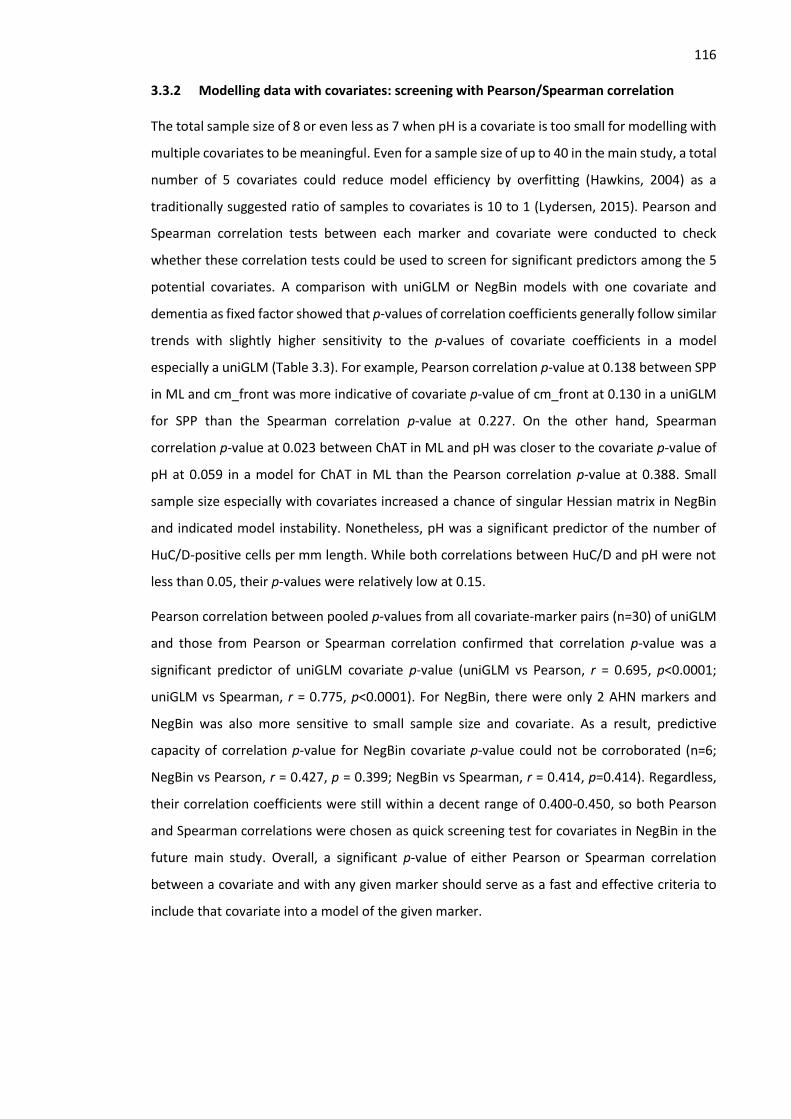
116 3.3.2 Modelling data with covariates: screening with Pearson/Spearman correlation
The total sample size of 8 or even less as 7 when pH is a covariate is too small for modelling with
multiple covariates to be meaningful. Even for a sample size of up to 40 in the main study, a total
number of 5 covariates could reduce model efficiency by overfitting (Hawkins, 2004) as a
traditionally suggested ratio of samples to covariates is 10 to 1 (Lydersen, 2015). Pearson and
Spearman correlation tests between each marker and covariate were conducted to check
whether these correlation tests could be used to screen for significant predictors among the 5
potential covariates. A comparison with uniGLM or NegBin models with one covariate and
dementia as fixed factor showed that p-values of correlation coefficients generally follow similar
trends with slightly higher sensitivity to the p-values of covariate coefficients in a model
especially a uniGLM (Table 3.3). For example, Pearson correlation p-value at 0.138 between SPP
in ML and cm_front was more indicative of covariate p-value of cm_front at 0.130 in a uniGLM
for SPP than the Spearman correlation p-value at 0.227. On the other hand, Spearman
correlation p-value at 0.023 between ChAT in ML and pH was closer to the covariate p-value of
pH at 0.059 in a model for ChAT in ML than the Pearson correlation p-value at 0.388. Small
sample size especially with covariates increased a chance of singular Hessian matrix in NegBin
and indicated model instability. Nonetheless, pH was a significant predictor of the number of
HuC/D-positive cells per mm length. While both correlations between HuC/D and pH were not
less than 0.05, their p-values were relatively low at 0.15.
Pearson correlation between pooled p-values from all covariate-marker pairs (n=30) of uniGLM
and those from Pearson or Spearman correlation confirmed that correlation p-value was a
significant predictor of uniGLM covariate p-value (uniGLM vs Pearson, r = 0.695, p<0.0001;
uniGLM vs Spearman, r = 0.775, p<0.0001). For NegBin, there were only 2 AHN markers and
NegBin was also more sensitive to small sample size and covariate. As a result, predictive
capacity of correlation p-value for NegBin covariate p-value could not be corroborated (n=6;
NegBin vs Pearson, r = 0.427, p = 0.399; NegBin vs Spearman, r = 0.414, p=0.414). Regardless,
their correlation coefficients were still within a decent range of 0.400-0.450, so both Pearson
and Spearman correlations were chosen as quick screening test for covariates in NegBin in the
future main study. Overall, a significant p-value of either Pearson or Spearman correlation
between a covariate and with any given marker should serve as a fast and effective criteria to
include that covariate into a model of the given marker.
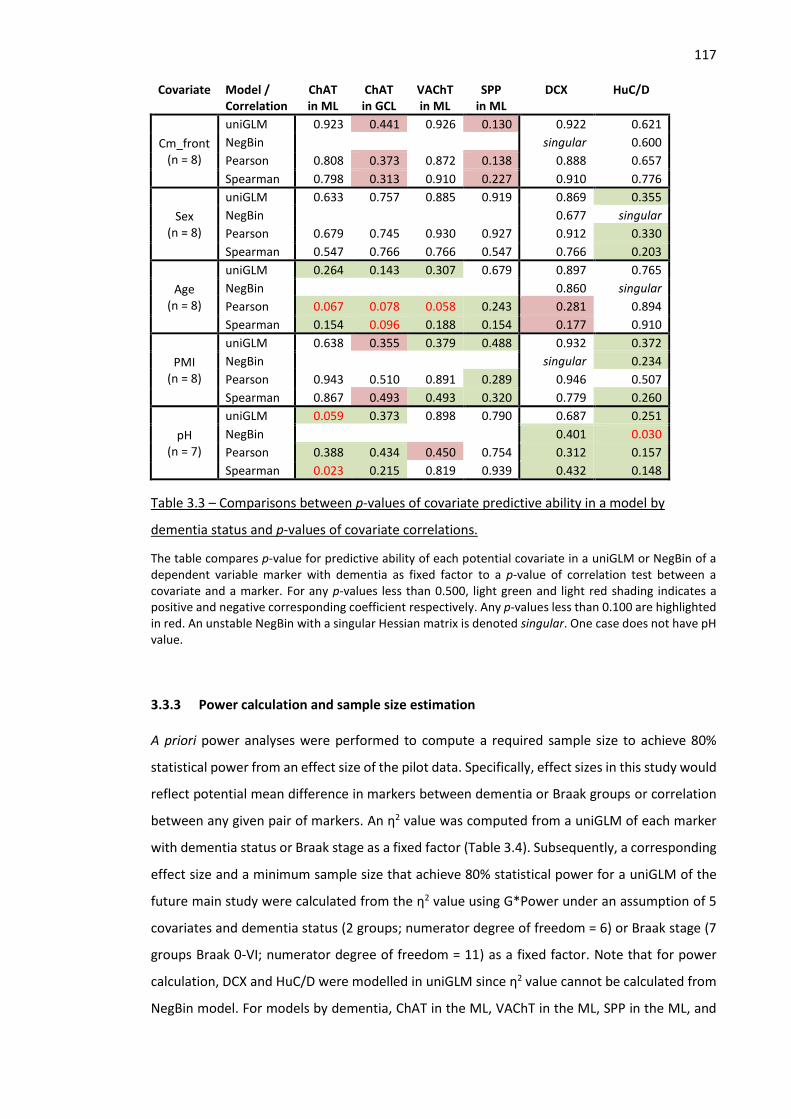
117
Covariate Model / Correlation
ChAT in ML
ChAT in GCL
VAChT in ML
SPP in ML
DCX HuC/D
Cm_front (n = 8)
uniGLM 0.923 0.441 0.926 0.130 0.922 0.621
NegBin singular 0.600
Pearson 0.808 0.373 0.872 0.138 0.888 0.657
Spearman 0.798 0.313 0.910 0.227 0.910 0.776
Sex (n = 8)
uniGLM 0.633 0.757 0.885 0.919 0.869 0.355
NegBin 0.677 singular
Pearson 0.679 0.745 0.930 0.927 0.912 0.330
Spearman 0.547 0.766 0.766 0.547 0.766 0.203
Age (n = 8)
uniGLM 0.264 0.143 0.307 0.679 0.897 0.765
NegBin 0.860 singular
Pearson 0.067 0.078 0.058 0.243 0.281 0.894
Spearman 0.154 0.096 0.188 0.154 0.177 0.910
PMI (n = 8)
uniGLM 0.638 0.355 0.379 0.488 0.932 0.372
NegBin singular 0.234
Pearson 0.943 0.510 0.891 0.289 0.946 0.507
Spearman 0.867 0.493 0.493 0.320 0.779 0.260
pH (n = 7)
uniGLM 0.059 0.373 0.898 0.790 0.687 0.251
NegBin 0.401 0.030
Pearson 0.388 0.434 0.450 0.754 0.312 0.157
Spearman 0.023 0.215 0.819 0.939 0.432 0.148
Table 3.3 – Comparisons between p-values of covariate predictive ability in a model by
dementia status and p-values of covariate correlations.
The table compares p-value for predictive ability of each potential covariate in a uniGLM or NegBin of a dependent variable marker with dementia as fixed factor to a p-value of correlation test between a covariate and a marker. For any p-values less than 0.500, light green and light red shading indicates a positive and negative corresponding coefficient respectively. Any p-values less than 0.100 are highlighted in red. An unstable NegBin with a singular Hessian matrix is denoted singular. One case does not have pH value.
3.3.3 Power calculation and sample size estimation
A priori power analyses were performed to compute a required sample size to achieve 80%
statistical power from an effect size of the pilot data. Specifically, effect sizes in this study would
reflect potential mean difference in markers between dementia or Braak groups or correlation
between any given pair of markers. An η2 value was computed from a uniGLM of each marker
with dementia status or Braak stage as a fixed factor (Table 3.4). Subsequently, a corresponding
effect size and a minimum sample size that achieve 80% statistical power for a uniGLM of the
future main study were calculated from the η2 value using G*Power under an assumption of 5
covariates and dementia status (2 groups; numerator degree of freedom = 6) or Braak stage (7
groups Braak 0-VI; numerator degree of freedom = 11) as a fixed factor. Note that for power
calculation, DCX and HuC/D were modelled in uniGLM since η2 value cannot be calculated from
NegBin model. For models by dementia, ChAT in the ML, VAChT in the ML, SPP in the ML, and
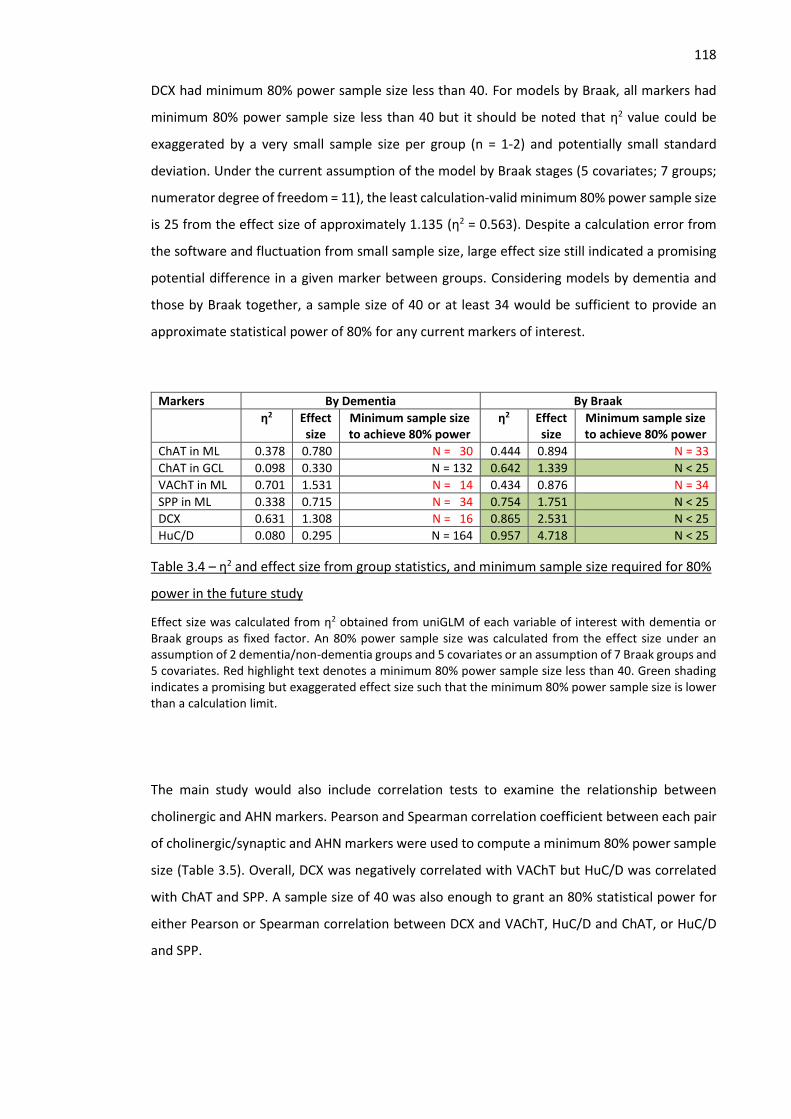
118 DCX had minimum 80% power sample size less than 40. For models by Braak, all markers had
minimum 80% power sample size less than 40 but it should be noted that η2 value could be
exaggerated by a very small sample size per group (n = 1-2) and potentially small standard
deviation. Under the current assumption of the model by Braak stages (5 covariates; 7 groups;
numerator degree of freedom = 11), the least calculation-valid minimum 80% power sample size
is 25 from the effect size of approximately 1.135 (η2 = 0.563). Despite a calculation error from
the software and fluctuation from small sample size, large effect size still indicated a promising
potential difference in a given marker between groups. Considering models by dementia and
those by Braak together, a sample size of 40 or at least 34 would be sufficient to provide an
approximate statistical power of 80% for any current markers of interest.
Markers By Dementia By Braak
η2 Effect size
Minimum sample size to achieve 80% power
η2 Effect size
Minimum sample size to achieve 80% power
ChAT in ML 0.378 0.780 N = 30 0.444 0.894 N = 33
ChAT in GCL 0.098 0.330 N = 132 0.642 1.339 N < 25
VAChT in ML 0.701 1.531 N = 14 0.434 0.876 N = 34
SPP in ML 0.338 0.715 N = 34 0.754 1.751 N < 25
DCX 0.631 1.308 N = 16 0.865 2.531 N < 25
HuC/D 0.080 0.295 N = 164 0.957 4.718 N < 25
Table 3.4 – η2 and effect size from group statistics, and minimum sample size required for 80%
power in the future study
Effect size was calculated from η2 obtained from uniGLM of each variable of interest with dementia or Braak groups as fixed factor. An 80% power sample size was calculated from the effect size under an assumption of 2 dementia/non-dementia groups and 5 covariates or an assumption of 7 Braak groups and 5 covariates. Red highlight text denotes a minimum 80% power sample size less than 40. Green shading indicates a promising but exaggerated effect size such that the minimum 80% power sample size is lower than a calculation limit.
The main study would also include correlation tests to examine the relationship between
cholinergic and AHN markers. Pearson and Spearman correlation coefficient between each pair
of cholinergic/synaptic and AHN markers were used to compute a minimum 80% power sample
size (Table 3.5). Overall, DCX was negatively correlated with VAChT but HuC/D was correlated
with ChAT and SPP. A sample size of 40 was also enough to grant an 80% statistical power for
either Pearson or Spearman correlation between DCX and VAChT, HuC/D and ChAT, or HuC/D
and SPP.
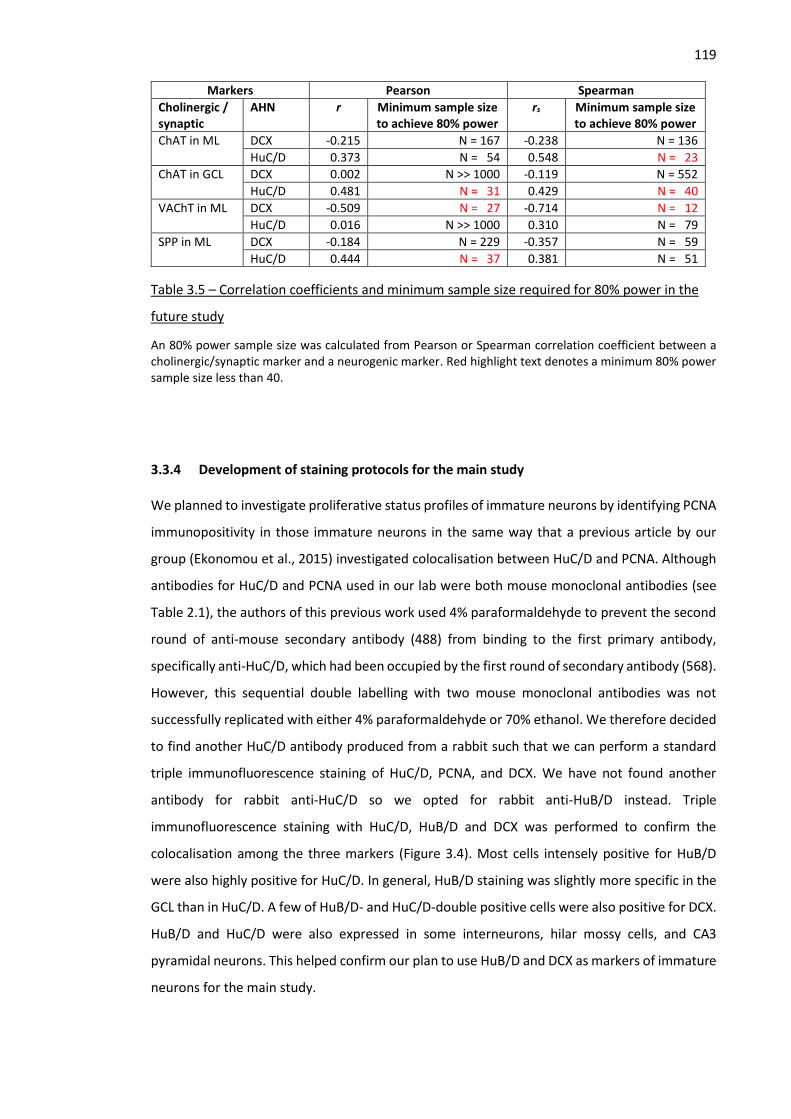
119
Markers Pearson Spearman
Cholinergic / synaptic
AHN r Minimum sample size to achieve 80% power
rs Minimum sample size to achieve 80% power
ChAT in ML DCX -0.215 N = 167 -0.238 N = 136
HuC/D 0.373 N = 54 0.548 N = 23
ChAT in GCL DCX 0.002 N >> 1000 -0.119 N = 552
HuC/D 0.481 N = 31 0.429 N = 40
VAChT in ML DCX -0.509 N = 27 -0.714 N = 12
HuC/D 0.016 N >> 1000 0.310 N = 79
SPP in ML DCX -0.184 N = 229 -0.357 N = 59
HuC/D 0.444 N = 37 0.381 N = 51
Table 3.5 – Correlation coefficients and minimum sample size required for 80% power in the
future study
An 80% power sample size was calculated from Pearson or Spearman correlation coefficient between a cholinergic/synaptic marker and a neurogenic marker. Red highlight text denotes a minimum 80% power sample size less than 40.
3.3.4 Development of staining protocols for the main study
We planned to investigate proliferative status profiles of immature neurons by identifying PCNA
immunopositivity in those immature neurons in the same way that a previous article by our
group (Ekonomou et al., 2015) investigated colocalisation between HuC/D and PCNA. Although
antibodies for HuC/D and PCNA used in our lab were both mouse monoclonal antibodies (see
Table 2.1), the authors of this previous work used 4% paraformaldehyde to prevent the second
round of anti-mouse secondary antibody (488) from binding to the first primary antibody,
specifically anti-HuC/D, which had been occupied by the first round of secondary antibody (568).
However, this sequential double labelling with two mouse monoclonal antibodies was not
successfully replicated with either 4% paraformaldehyde or 70% ethanol. We therefore decided
to find another HuC/D antibody produced from a rabbit such that we can perform a standard
triple immunofluorescence staining of HuC/D, PCNA, and DCX. We have not found another
antibody for rabbit anti-HuC/D so we opted for rabbit anti-HuB/D instead. Triple
immunofluorescence staining with HuC/D, HuB/D and DCX was performed to confirm the
colocalisation among the three markers (Figure 3.4). Most cells intensely positive for HuB/D
were also highly positive for HuC/D. In general, HuB/D staining was slightly more specific in the
GCL than in HuC/D. A few of HuB/D- and HuC/D-double positive cells were also positive for DCX.
HuB/D and HuC/D were also expressed in some interneurons, hilar mossy cells, and CA3
pyramidal neurons. This helped confirm our plan to use HuB/D and DCX as markers of immature
neurons for the main study.
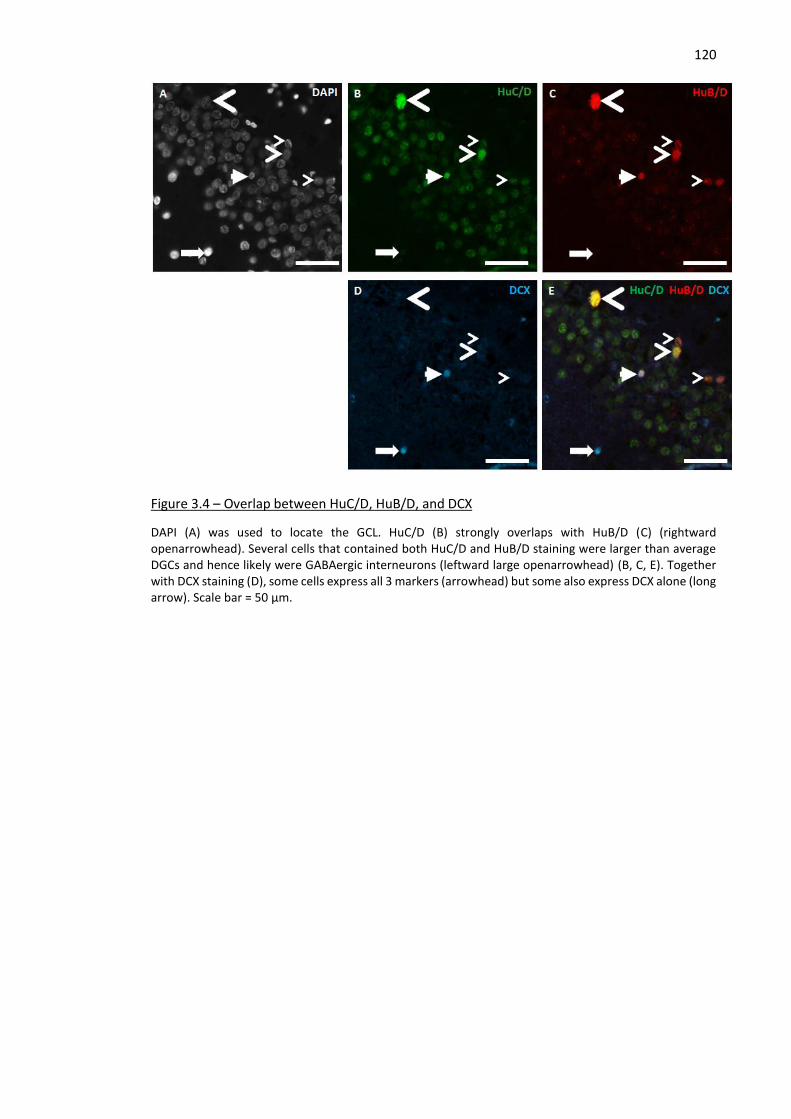
120
Figure 3.4 – Overlap between HuC/D, HuB/D, and DCX
DAPI (A) was used to locate the GCL. HuC/D (B) strongly overlaps with HuB/D (C) (rightward openarrowhead). Several cells that contained both HuC/D and HuB/D staining were larger than average DGCs and hence likely were GABAergic interneurons (leftward large openarrowhead) (B, C, E). Together with DCX staining (D), some cells express all 3 markers (arrowhead) but some also express DCX alone (long arrow). Scale bar = 50 µm.
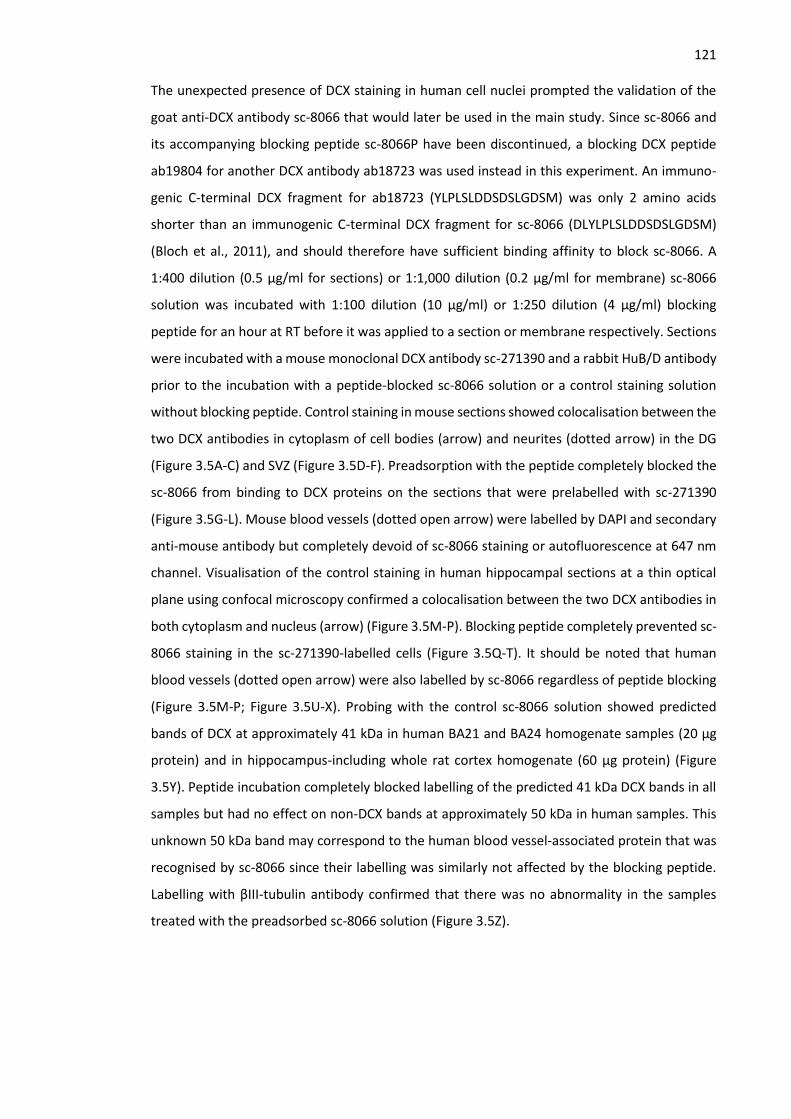
121 The unexpected presence of DCX staining in human cell nuclei prompted the validation of the
goat anti-DCX antibody sc-8066 that would later be used in the main study. Since sc-8066 and
its accompanying blocking peptide sc-8066P have been discontinued, a blocking DCX peptide
ab19804 for another DCX antibody ab18723 was used instead in this experiment. An immuno-
genic C-terminal DCX fragment for ab18723 (YLPLSLDDSDSLGDSM) was only 2 amino acids
shorter than an immunogenic C-terminal DCX fragment for sc-8066 (DLYLPLSLDDSDSLGDSM)
(Bloch et al., 2011), and should therefore have sufficient binding affinity to block sc-8066. A
1:400 dilution (0.5 µg/ml for sections) or 1:1,000 dilution (0.2 µg/ml for membrane) sc-8066
solution was incubated with 1:100 dilution (10 µg/ml) or 1:250 dilution (4 µg/ml) blocking
peptide for an hour at RT before it was applied to a section or membrane respectively. Sections
were incubated with a mouse monoclonal DCX antibody sc-271390 and a rabbit HuB/D antibody
prior to the incubation with a peptide-blocked sc-8066 solution or a control staining solution
without blocking peptide. Control staining in mouse sections showed colocalisation between the
two DCX antibodies in cytoplasm of cell bodies (arrow) and neurites (dotted arrow) in the DG
(Figure 3.5A-C) and SVZ (Figure 3.5D-F). Preadsorption with the peptide completely blocked the
sc-8066 from binding to DCX proteins on the sections that were prelabelled with sc-271390
(Figure 3.5G-L). Mouse blood vessels (dotted open arrow) were labelled by DAPI and secondary
anti-mouse antibody but completely devoid of sc-8066 staining or autofluorescence at 647 nm
channel. Visualisation of the control staining in human hippocampal sections at a thin optical
plane using confocal microscopy confirmed a colocalisation between the two DCX antibodies in
both cytoplasm and nucleus (arrow) (Figure 3.5M-P). Blocking peptide completely prevented sc-
8066 staining in the sc-271390-labelled cells (Figure 3.5Q-T). It should be noted that human
blood vessels (dotted open arrow) were also labelled by sc-8066 regardless of peptide blocking
(Figure 3.5M-P; Figure 3.5U-X). Probing with the control sc-8066 solution showed predicted
bands of DCX at approximately 41 kDa in human BA21 and BA24 homogenate samples (20 µg
protein) and in hippocampus-including whole rat cortex homogenate (60 µg protein) (Figure
3.5Y). Peptide incubation completely blocked labelling of the predicted 41 kDa DCX bands in all
samples but had no effect on non-DCX bands at approximately 50 kDa in human samples. This
unknown 50 kDa band may correspond to the human blood vessel-associated protein that was
recognised by sc-8066 since their labelling was similarly not affected by the blocking peptide.
Labelling with βIII-tubulin antibody confirmed that there was no abnormality in the samples
treated with the preadsorbed sc-8066 solution (Figure 3.5Z).
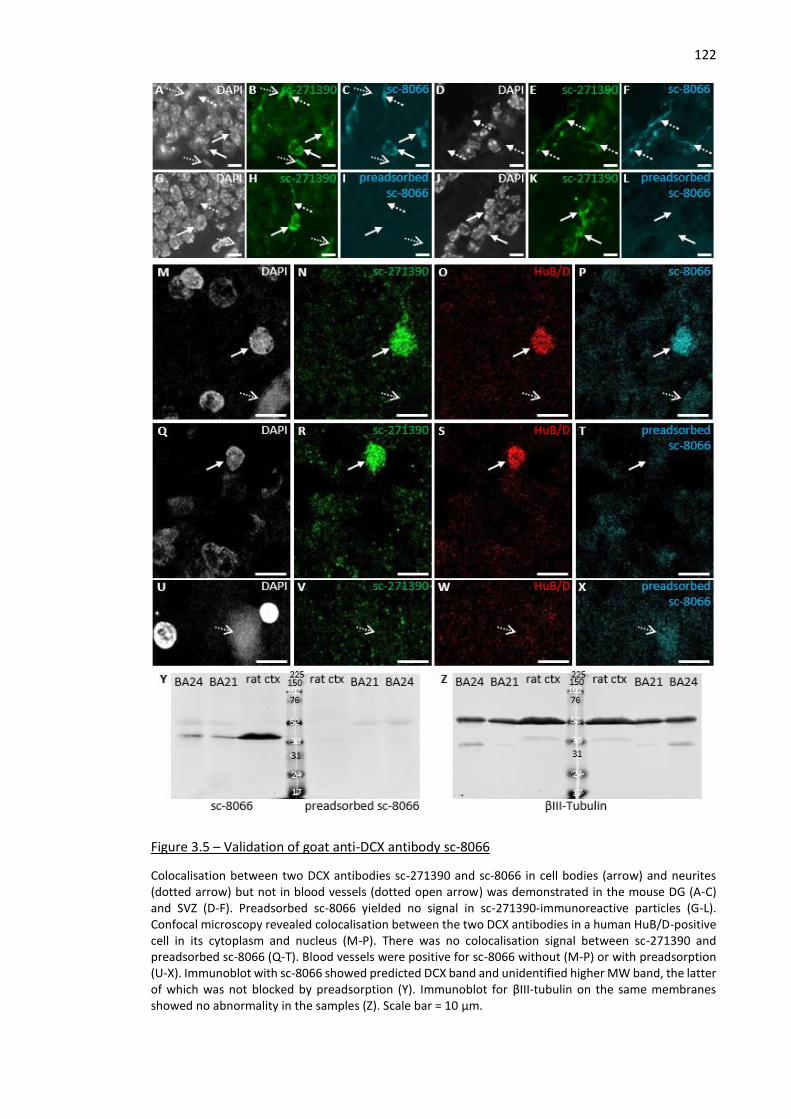
122
Figure 3.5 – Validation of goat anti-DCX antibody sc-8066
Colocalisation between two DCX antibodies sc-271390 and sc-8066 in cell bodies (arrow) and neurites (dotted arrow) but not in blood vessels (dotted open arrow) was demonstrated in the mouse DG (A-C) and SVZ (D-F). Preadsorbed sc-8066 yielded no signal in sc-271390-immunoreactive particles (G-L). Confocal microscopy revealed colocalisation between the two DCX antibodies in a human HuB/D-positive cell in its cytoplasm and nucleus (M-P). There was no colocalisation signal between sc-271390 and preadsorbed sc-8066 (Q-T). Blood vessels were positive for sc-8066 without (M-P) or with preadsorption (U-X). Immunoblot with sc-8066 showed predicted DCX band and unidentified higher MW band, the latter of which was not blocked by preadsorption (Y). Immunoblot for βIII-tubulin on the same membranes showed no abnormality in the samples (Z). Scale bar = 10 µm.
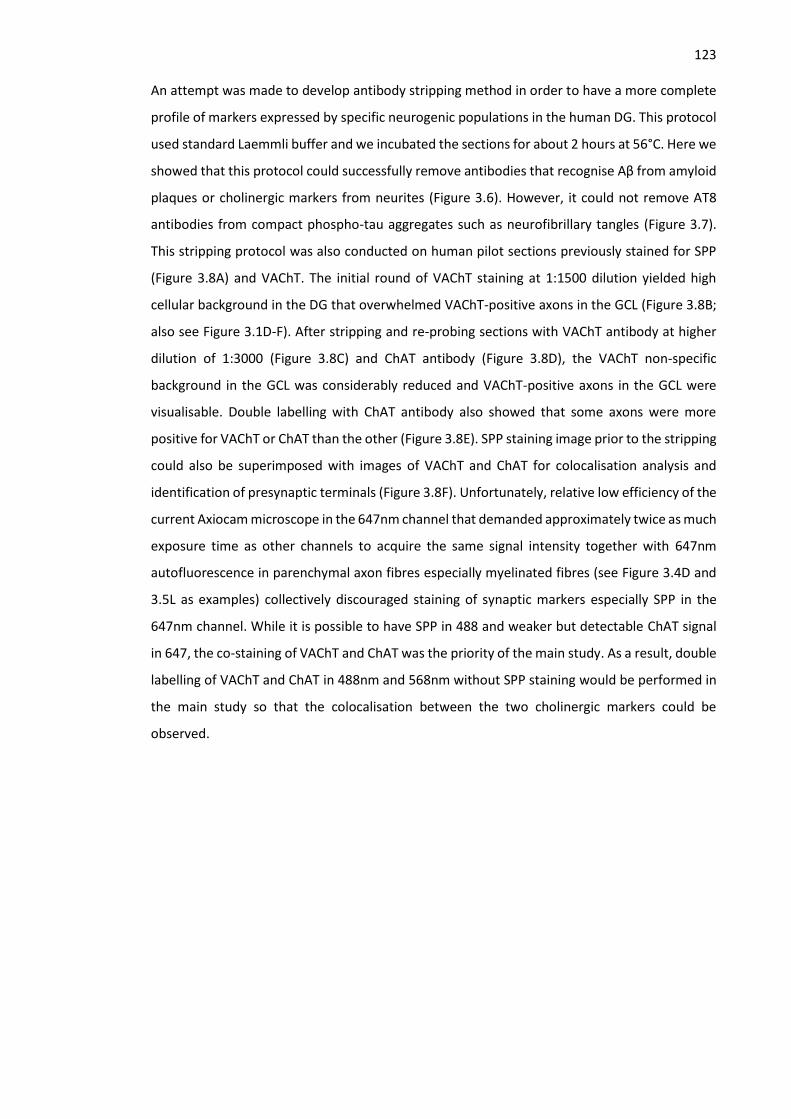
123 An attempt was made to develop antibody stripping method in order to have a more complete
profile of markers expressed by specific neurogenic populations in the human DG. This protocol
used standard Laemmli buffer and we incubated the sections for about 2 hours at 56°C. Here we
showed that this protocol could successfully remove antibodies that recognise Aβ from amyloid
plaques or cholinergic markers from neurites (Figure 3.6). However, it could not remove AT8
antibodies from compact phospho-tau aggregates such as neurofibrillary tangles (Figure 3.7).
This stripping protocol was also conducted on human pilot sections previously stained for SPP
(Figure 3.8A) and VAChT. The initial round of VAChT staining at 1:1500 dilution yielded high
cellular background in the DG that overwhelmed VAChT-positive axons in the GCL (Figure 3.8B;
also see Figure 3.1D-F). After stripping and re-probing sections with VAChT antibody at higher
dilution of 1:3000 (Figure 3.8C) and ChAT antibody (Figure 3.8D), the VAChT non-specific
background in the GCL was considerably reduced and VAChT-positive axons in the GCL were
visualisable. Double labelling with ChAT antibody also showed that some axons were more
positive for VAChT or ChAT than the other (Figure 3.8E). SPP staining image prior to the stripping
could also be superimposed with images of VAChT and ChAT for colocalisation analysis and
identification of presynaptic terminals (Figure 3.8F). Unfortunately, relative low efficiency of the
current Axiocam microscope in the 647nm channel that demanded approximately twice as much
exposure time as other channels to acquire the same signal intensity together with 647nm
autofluorescence in parenchymal axon fibres especially myelinated fibres (see Figure 3.4D and
3.5L as examples) collectively discouraged staining of synaptic markers especially SPP in the
647nm channel. While it is possible to have SPP in 488 and weaker but detectable ChAT signal
in 647, the co-staining of VAChT and ChAT was the priority of the main study. As a result, double
labelling of VAChT and ChAT in 488nm and 568nm without SPP staining would be performed in
the main study so that the colocalisation between the two cholinergic markers could be
observed.
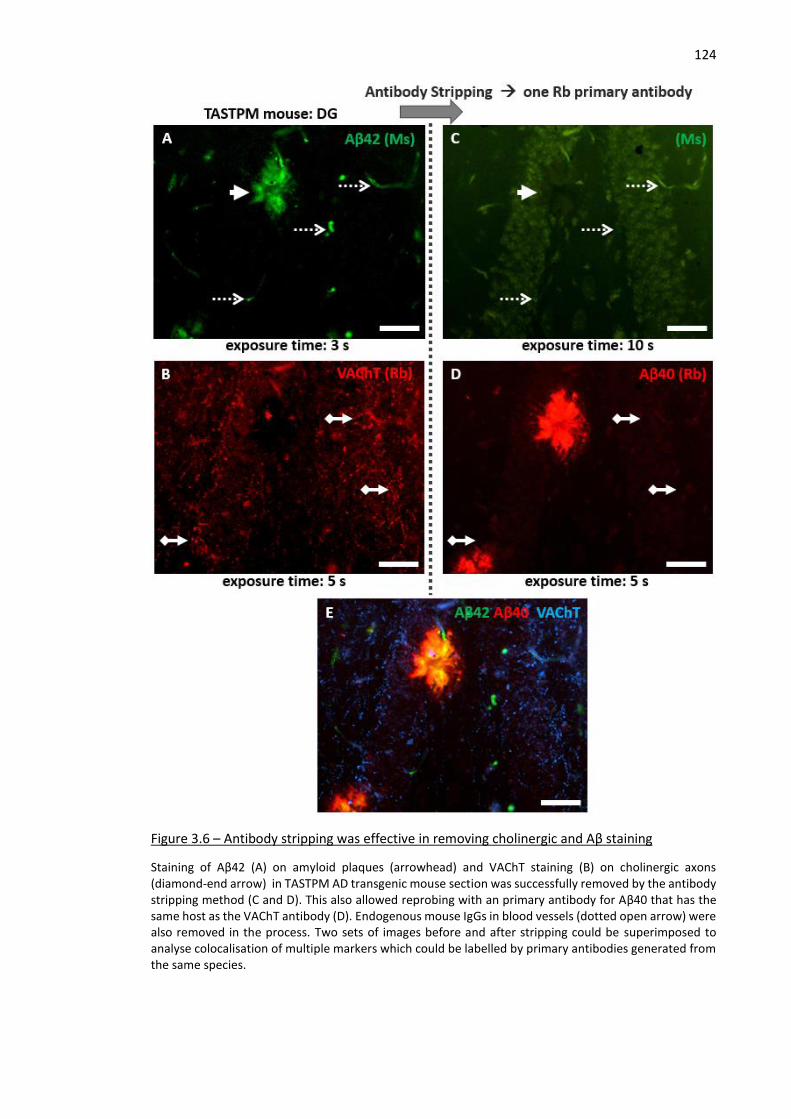
124
Figure 3.6 – Antibody stripping was effective in removing cholinergic and Aβ staining
Staining of Aβ42 (A) on amyloid plaques (arrowhead) and VAChT staining (B) on cholinergic axons (diamond-end arrow) in TASTPM AD transgenic mouse section was successfully removed by the antibody stripping method (C and D). This also allowed reprobing with an primary antibody for Aβ40 that has the same host as the VAChT antibody (D). Endogenous mouse IgGs in blood vessels (dotted open arrow) were also removed in the process. Two sets of images before and after stripping could be superimposed to analyse colocalisation of multiple markers which could be labelled by primary antibodies generated from the same species.
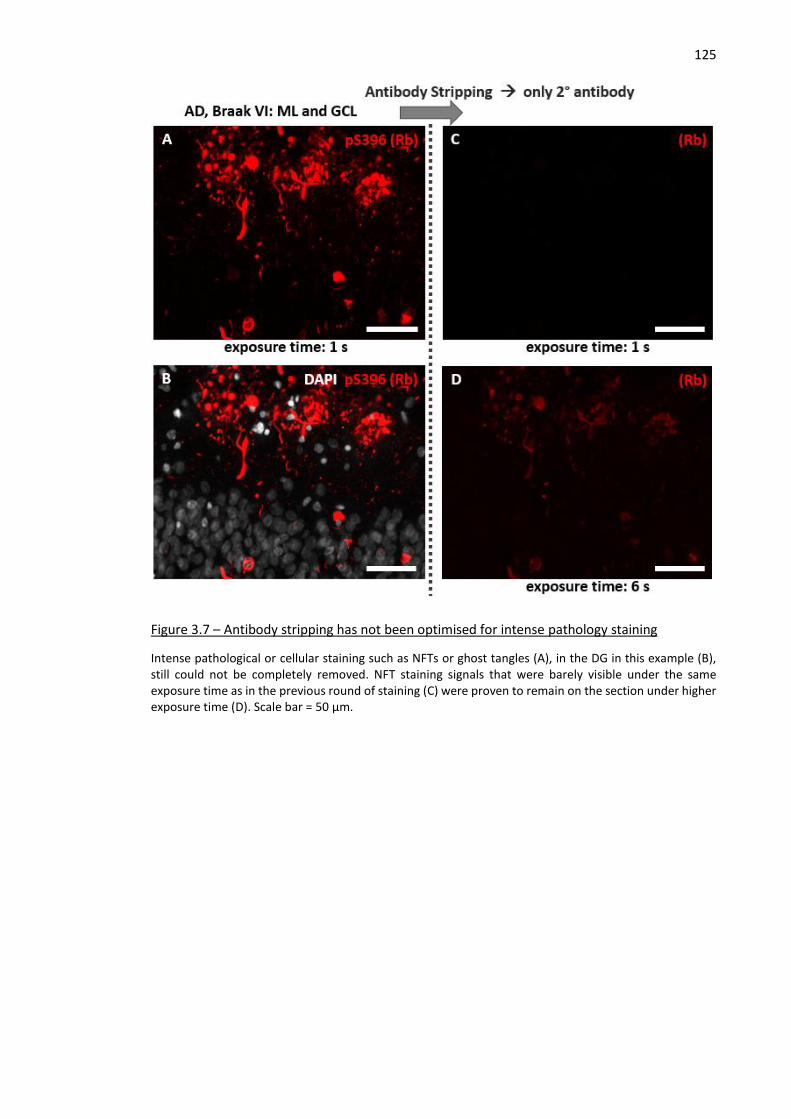
125
Figure 3.7 – Antibody stripping has not been optimised for intense pathology staining
Intense pathological or cellular staining such as NFTs or ghost tangles (A), in the DG in this example (B), still could not be completely removed. NFT staining signals that were barely visible under the same exposure time as in the previous round of staining (C) were proven to remain on the section under higher exposure time (D). Scale bar = 50 µm.
126
Figure 3.8 – VAChT and ChAT as target candidates for the main study
After SPP (A) and 1:1500 dilution VAChT (B) signals were eliminated by antibody stripping protocol, sections were reprobed with VAChT antibody at 1:3000 dilution which reduced background staining in cell bodies and improved visualisation of axons (C). While fibre and punctate staining was completely cleared, staining residuals in blood vessels still remained (leftward arrow). ChAT antibody (D) was also added together with VAChT antibody for potential colocalisation analysis (E). Images from two rounds of staining could be merged to investigate colocalisation patterns of at least 3 markers (F). Scale bar = 50 µm.
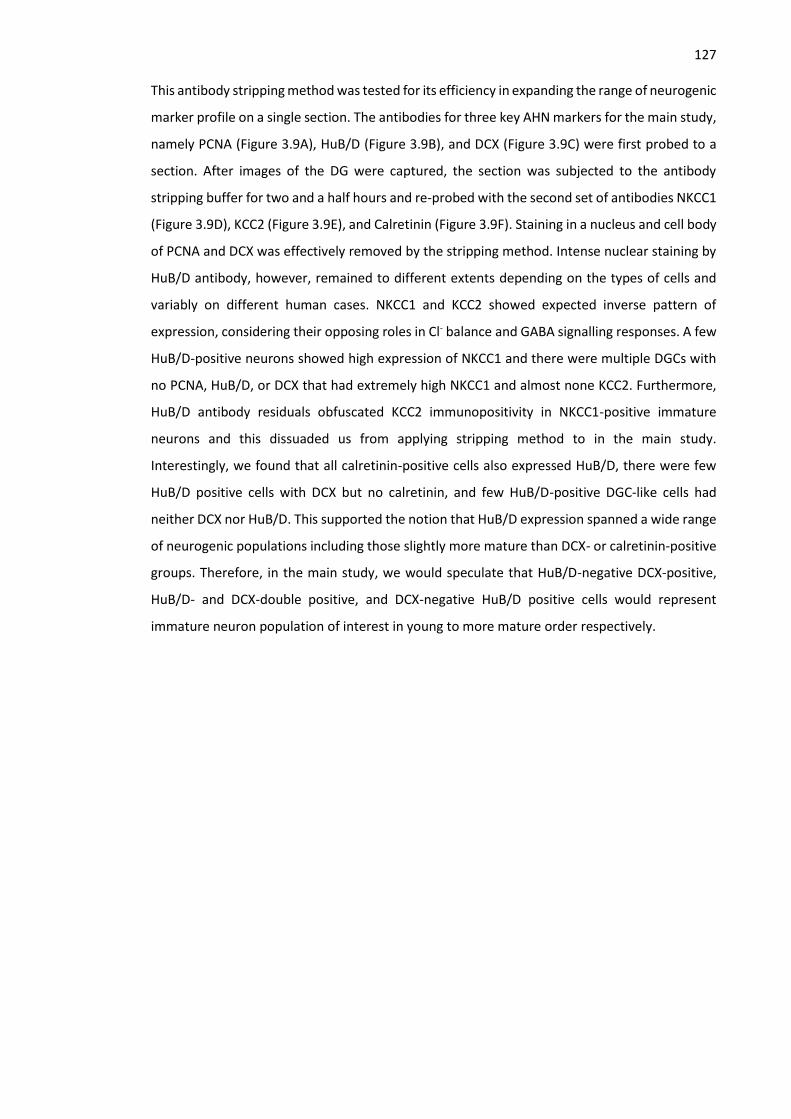
127 This antibody stripping method was tested for its efficiency in expanding the range of neurogenic
marker profile on a single section. The antibodies for three key AHN markers for the main study,
namely PCNA (Figure 3.9A), HuB/D (Figure 3.9B), and DCX (Figure 3.9C) were first probed to a
section. After images of the DG were captured, the section was subjected to the antibody
stripping buffer for two and a half hours and re-probed with the second set of antibodies NKCC1
(Figure 3.9D), KCC2 (Figure 3.9E), and Calretinin (Figure 3.9F). Staining in a nucleus and cell body
of PCNA and DCX was effectively removed by the stripping method. Intense nuclear staining by
HuB/D antibody, however, remained to different extents depending on the types of cells and
variably on different human cases. NKCC1 and KCC2 showed expected inverse pattern of
expression, considering their opposing roles in Cl- balance and GABA signalling responses. A few
HuB/D-positive neurons showed high expression of NKCC1 and there were multiple DGCs with
no PCNA, HuB/D, or DCX that had extremely high NKCC1 and almost none KCC2. Furthermore,
HuB/D antibody residuals obfuscated KCC2 immunopositivity in NKCC1-positive immature
neurons and this dissuaded us from applying stripping method to in the main study.
Interestingly, we found that all calretinin-positive cells also expressed HuB/D, there were few
HuB/D positive cells with DCX but no calretinin, and few HuB/D-positive DGC-like cells had
neither DCX nor HuB/D. This supported the notion that HuB/D expression spanned a wide range
of neurogenic populations including those slightly more mature than DCX- or calretinin-positive
groups. Therefore, in the main study, we would speculate that HuB/D-negative DCX-positive,
HuB/D- and DCX-double positive, and DCX-negative HuB/D positive cells would represent
immature neuron population of interest in young to more mature order respectively.
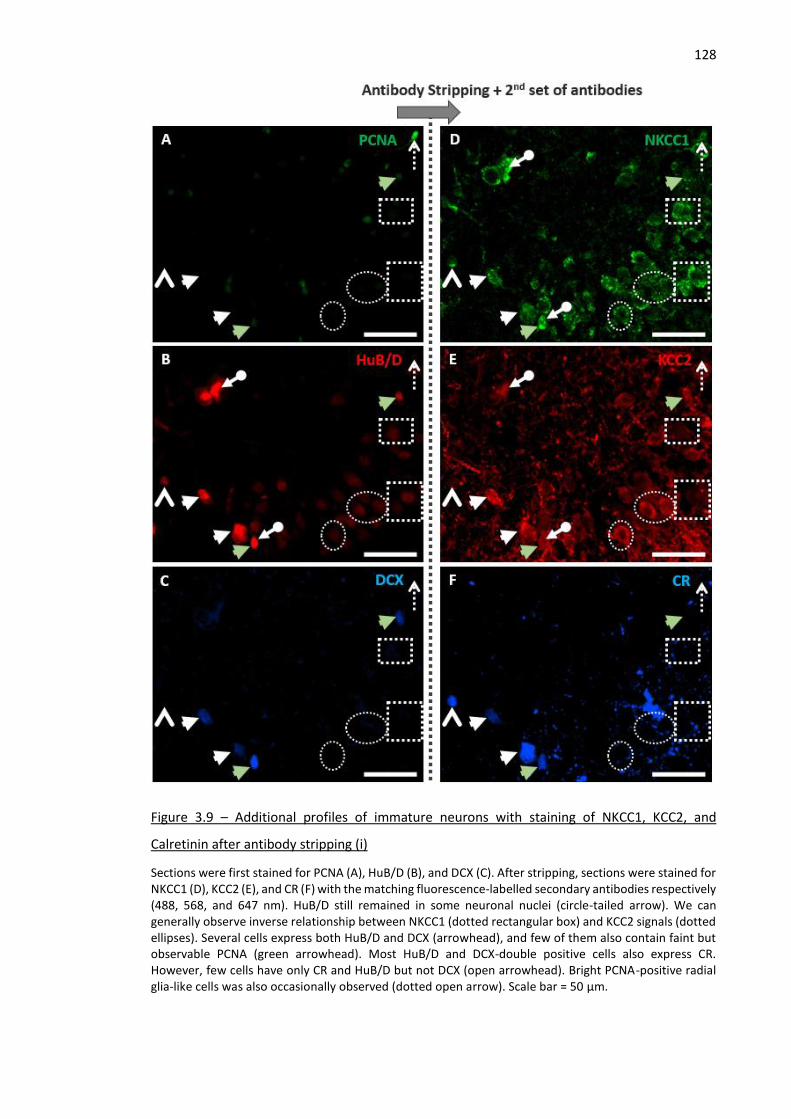
128
Figure 3.9 – Additional profiles of immature neurons with staining of NKCC1, KCC2, and
Calretinin after antibody stripping (i)
Sections were first stained for PCNA (A), HuB/D (B), and DCX (C). After stripping, sections were stained for NKCC1 (D), KCC2 (E), and CR (F) with the matching fluorescence-labelled secondary antibodies respectively (488, 568, and 647 nm). HuB/D still remained in some neuronal nuclei (circle-tailed arrow). We can generally observe inverse relationship between NKCC1 (dotted rectangular box) and KCC2 signals (dotted ellipses). Several cells express both HuB/D and DCX (arrowhead), and few of them also contain faint but observable PCNA (green arrowhead). Most HuB/D and DCX-double positive cells also express CR. However, few cells have only CR and HuB/D but not DCX (open arrowhead). Bright PCNA-positive radial glia-like cells was also occasionally observed (dotted open arrow). Scale bar = 50 µm.
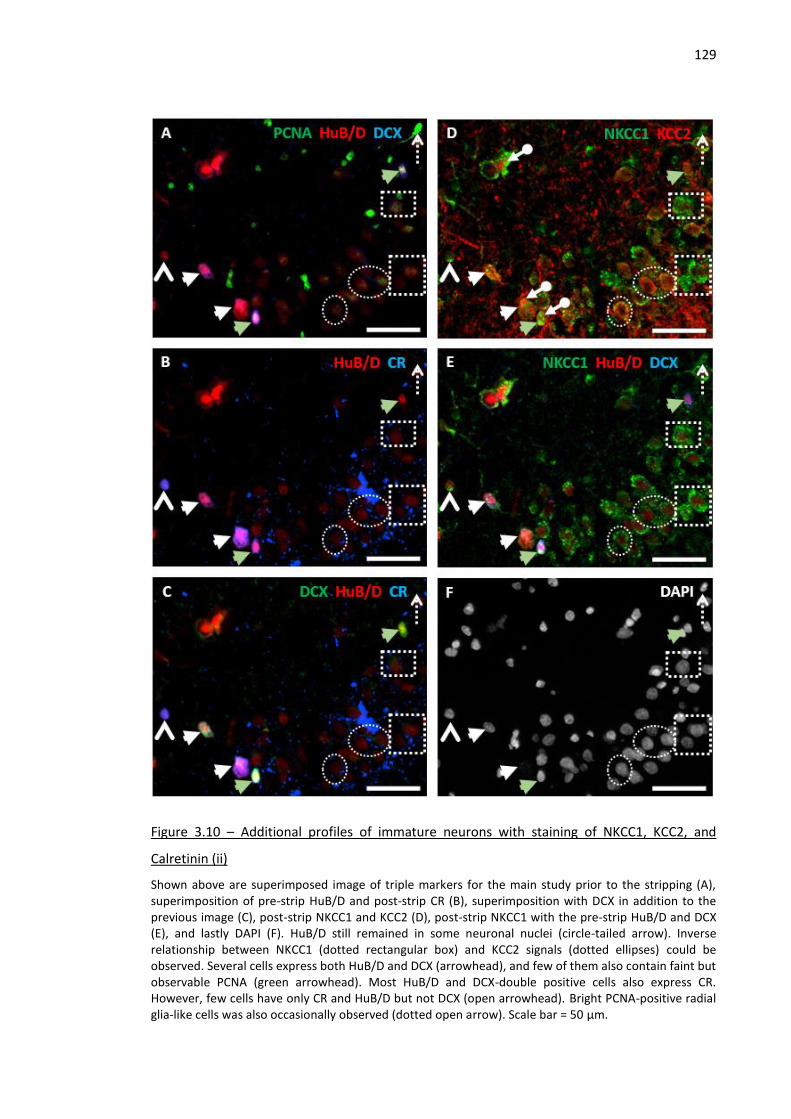
129
Figure 3.10 – Additional profiles of immature neurons with staining of NKCC1, KCC2, and
Calretinin (ii)
Shown above are superimposed image of triple markers for the main study prior to the stripping (A), superimposition of pre-strip HuB/D and post-strip CR (B), superimposition with DCX in addition to the previous image (C), post-strip NKCC1 and KCC2 (D), post-strip NKCC1 with the pre-strip HuB/D and DCX (E), and lastly DAPI (F). HuB/D still remained in some neuronal nuclei (circle-tailed arrow). Inverse relationship between NKCC1 (dotted rectangular box) and KCC2 signals (dotted ellipses) could be observed. Several cells express both HuB/D and DCX (arrowhead), and few of them also contain faint but observable PCNA (green arrowhead). Most HuB/D and DCX-double positive cells also express CR. However, few cells have only CR and HuB/D but not DCX (open arrowhead). Bright PCNA-positive radial glia-like cells was also occasionally observed (dotted open arrow). Scale bar = 50 µm.
130
3.4 Discussion
The findings of this chapter were as follows;
- Accurate staining patterns of cholinergic markers VAChT and ChAT and AHN markers
DCX and HuC/D, as described in previous literatures.
- Percentage area of staining with univariate GLM model and cell count per mm DG length
with negative binomial regression models were chosen as methods of quantification and
statistics
- Results in this pilot study yielded a promising estimated effect size such that a moderate
sample size of at least 40 should be sufficient to achieve a statistical power of 80%.
- HuB/D is an adequate substitute for HuC/D for easier double labelling with PCNA.
- DCX nuclear immunopositivity in human was validated.
- ChAT and VAChT double labelling will also be performed in the main study.
- Antibody stripping method has not been optimised but it was effective enough to
confirm that HuB/D is expressed in some DCX-positive and in most calretinin-positive
immature neurons.
The pilot cases provided by the brain bank allowed us to establish the methods, find suitable
choices of markers, examine potential confounding variables, and estimate statistical power in
order to justify the feasibility of our main study to the brain bank. The pilot study was successful
in that we were able to identify suitable markers of cholinergic and adult neurogenesis and
determine that there were very few confounding variables that needed to be considered in the
main study. Finally, statistical power analysis determined that the study investigating the
relationship between cholinergic marker and neurogenesis was feasible with moderate number
of samples.
The most widely used marker of cholinergic neurons in the literature was acetylcholine-
synthesizing enzyme ChAT. Immunohistochemistry of ChAT has been proved to be a reliable
marker of cholinergic axons allowed us to properly visualise the beads and chain-like
morphology of varicosity-abundant cholinergic axons in target brain area. In the basal forebrain,
ChAT also provides a good visualisation of the cholinergic cell bodies and processes. The
cholinergic synaptic marker, VAChT, has been less widely used but in general provides a reliable
marker for cholinergic terminals. The present study is consistent with these previous results in
that it shows the expected distribution of cholinergic terminals within the hippocampus (Kooi et
al., 2011; Schafer et al., 1995).
There were 5 potential covariates: cm_front, sex, age, PMI, and pH. The reason we included
estimated distance of coronal section in cm from the front was that different part of the DG
131 reportedly had different adult neurogenesis patterns in human (Boldrini et al., 2018) and they
also have different functions based on experiments in rodents. Sex may have effect on disease
pathology. Aging was shown to reduce rates of adult hippocampal neurogenesis in human
(Knoth et al., 2010; Spalding et al., 2013; Boldrini et al., 2018). Longer PMI was shown to reduce
DCX expression in postmortem rat brains (Boekhoorn et al., 2006) and here it was correlated
with VAChT %area of staining in our study. Lastly, pH was correlated with ChAT %area of staining.
For choices of cholinergic markers, VAChT and ChAT were chosen as our IHC methods. Another
possible marker for cholinergic was CHT1 but its immunohistochemical protocol has not been
optimised. Percentage area of staining was selected as the main quantification method for
cholinergic axons since it took into account the total area of selection and also reflected the
morphology and distribution of axons. For neurogenic markers, a previous study of our group
(Ekonomou et al., 2015) has established the method of HuC/D and PCNA containing to
determine pre- and postmitotic faction of specific neurogenic subpopulation in human. This pilot
study confirmed the staining pattern of HuC/D and further showed that the immunopositivity
pattern of our new candidate marker HuB/D closely resembled that of HuC/D. We showed the
difference in the number of DCX-positive cells across Braak stages and that the expression of
DCX and HuB/D share a common phase during new-born DGC development but not completely
overlapped by one another. Not only that PCNA was found in some DCX- or HuB/D-positive cells,
it was also intensely expressed by cells with radial glia-like morphology which helped ensure the
validity of the staining. The cell quantification method of choice was the number of cells per mm
DG length since sections from different cases had different shapes and hence length of the DG.
One weakness of this pilot study was that the sample size of n=8 was too small for analyses with
several covariates. Nonetheless, it was still possible to calculate effect size from η2 value
computed from uniGLM of each marker without any covariate. While AHN markers would be
modelled with NegBin in the main study, the process of calculating effect size for NegBin was
too complex and not suitable considering the instable this model under small sample size.
Human DCX nuclear staining has been shown in several studies that used paraffin-embedded
sections (Boekhoorn et al., 2006; Knoth et al., 2010; Gatt et al., 2018). One study demonstrated
in adult rat DG sections that longer PMI continuously degraded cytoplasmic DCX staining
especially in the neurites and eventually resulted in DCX-positive granules after 12 hrs of PMI
(Boekhoorn et al., 2006). Interestingly, they observed DCX nuclear staining even in a cohort of
AD patients that had a PMI average of 5.1 hrs. Considering that DCX nuclear staining was not
explicitly shown or discussed in the above varying PMI experiment in rat brains, it is possible
that this phenomenon is specific to human tissues. Standard human tissue processing from
prolonged formalin incubation at RT up to paraffin embedding may contribute to DCX nuclear
132 staining since there was no or minimal DCX nuclear staining in the latest study that incubated
the tissues in 4% PFA o/n at 4°C without freezing or paraffin embedding (Moreno-Jiménez et al.,
2019) or in studies that used frozen samples (Boldrini et al., 2018; Sorrells et al., 2018). The non-
specific staining in human blood vessels by sc-8066 was observed in the recent study (Moreno-
Jiménez et al., 2019) but it was also demonstrated to be successfully minimised by proper
antigen retrieval procedures. Colocalisation between sc-8066 and the monoclonal mouse anti-
DCX sc-271390 was also confirmed by the above recent study. Regarding the WB of sc-8066, one
study on a cohort of AD patients and age-matched controls found a faint band of undetermined
size above the predicted band in several human cases (Jin et al., 2004a). Another study also
observed a small band above the predicted band but at an approximate size of 60 kDa instead
of 50 kDa in the current experiment (Knoth et al., 2010). Both studies, however, did not conduct
a peptide blocking experiment in parallel.
It would be a considerable advantage that multiple rounds of staining with different antibodies
even from the same animal hosts could be performed on a single section. This would allow a
more complete marker profile which could partially elucidate the interactions between different
markers in a system. This antibody stripping method, despite its claimed success for multiple
rounds of fluorescence IHC, has not been optimised for our staining of interest.
This pilot study also demonstrated that our current antibody stripping protocol has not been
effective enough especially for the staining of neurogenic markers in the main study.
Nonetheless, it helped us improve VAChT staining protocol by removing non-specific
background from the staining at 1:1500 and revealed that staining at 1:3000 visualised more
VAChT-positive axons especially in the GCL without having to spend 2-3 more slides to optimise
the staining method.
In summary, the pilot study was successful in identifying the markers of cholinergic and adult
neurogenesis. Potential confounding variables were identified and the moderate sample size to
achieve 80% statistical power was calculated on the basis of these results,
133
4 Contribution of cholinergic innervation to adult hippocampal
neurogenesis in Alzheimer’s disease patients: Main cohort
4.1 Introduction
Adult neurogenesis in the DG is abnormally regulated in AD cases (Jin et al., 2004a; Perry et al.,
2012) with one of the main characteristics commonly reportedly being maturation defect (Li et
al., 2008; Ekonomou et al., 2015). The relationships with cognitive performance were supported
by several studies which reported the associations between AHN impairment and disease
severity indicators such as astrocyte density (Ekonomou et al., 2015) and between AHN and
preserved MMSE score despite extensive pathology (Briley et al., 2016). The plasticity of the
AHN system was reflected by a relative tolerance of the DG to the NFT pathology (Braak and
Braak, 1991) and its important roles in cognition have garnered increasing interest in its
potentials as a therapeutic target. Plasticity of the septohippocampal cholinergic innervation in
AD has also been demonstrated by higher hippocampal ChAT activity in MCI patients (DeKosky
et al., 2002 and relative sparring of BFCNs in the Ch2 MS/VDB (Mesulam et al., 1983a). With
multiple findings that direct cholinergic presynaptic signalling on adult-born DGCs regulates
their maturation (Campbell et al., 2010) and survival (Zhen et al., 2017; Zhu et al., 2017), the
notion of upregulated cholinergic innervation contributing to preservation of AHN and cognitive
performance is appealing as a topic of research interest.
The pilot study on 9 cases revealed a promising result of differences in % staining areas of ChAT
and VAChT and in density of DCX- and HuC/D-positive cells across Braak stages such that it is
possible to achieve at least an 80% statistical power in a main cohort of 36 cases given estimated
sample sizes of each marker from the pilot study. The pilot study also confirmed the choices or
these cholinergic or neurogenic markers and their respective antibodies for IHC analyses
including the use of HuB/D antibody instead of the HuC/D antibody for double-labelling IHC with
PCNA antibody. Paraffin-embedded sections from a total number of 41 cases were subsequently
requested from the London Neurodegenerative Disease Brain Bank (LNDBB)/ Brain for Dementia
Research (BDR) for this main study.
The hypotheses of this chapter are as follows: % staining area of VAChT and ChAT would be
lower in higher Braak V-VI, and ChAT may reach its peak in Braak III or IV in the same manner as
ChAT activity in previous studies. In upper Braak stages, HuB/D is a marker of maturation so
HuB/D positive cells with no PCNA would decrease, but the immature marker DCX would
increase. As suggested by the pilot data, ChAT would be correlated with HuB/D, but VAChT
would be negatively correlated with DCX and to less extents with HuB/D.
134
4.2 Materials and Methods
4.2.1 Human cohort and data management
All brain sections were requested from London Neurodegenerative Diseases Brain Bank, part of
the Brains for Dementia Research & the Medical Research Council networks (LNDBB, BDR &
MRC). A total of 41 cases were originally requested according to the power analysis in chapter
3, but 36 cases were included for this study (Table 4.1). Sections from 2 cases did not contain
the DG. Percentage area of ChAT staining on sections from 1 case with Braak V was the highest
among the entire cohort and was also an extreme outlier of the Braak V group. There was no pH
data available for another 2 cases. Those were the reasons of excluding 5 cases. Braak 0 and
Braak I were grouped together. All 20 cases with Braak 0-III (Braak 0 = 4; Braak I = 2; Braak II =
8; Braak III = 6) were diagnosed to not have dementia and all 16 cases with Braak IV-VI (Braak IV
= 4; Braak V = 5; Braak VI = 8) were diagnosed as AD dementia. Nevertheless, one supposedly
non-demented Braak III case had an MMSE record of 15. This small evidence of cognitive
diagnosis inconsistency and lack of MMSE scoring for most cases warranted the focus of this
study on Braak staging instead of cognitive status. The 5 potential covariates including
demographic variables to be included in our models were the same as those in the pilot study:
namely cm_front or estimated cm of sections from the front with reference to the online virtual
microscopy (TheHumanBrain.info, 2018a), sex, age, PMI, and pH (Table 4.2). Additional
information such as BBN-ID, BDR no, or APOE genotypes (Appendix Table A.1) and the raw data
(Appendix Table A.2-A.3) are in the Appendix.
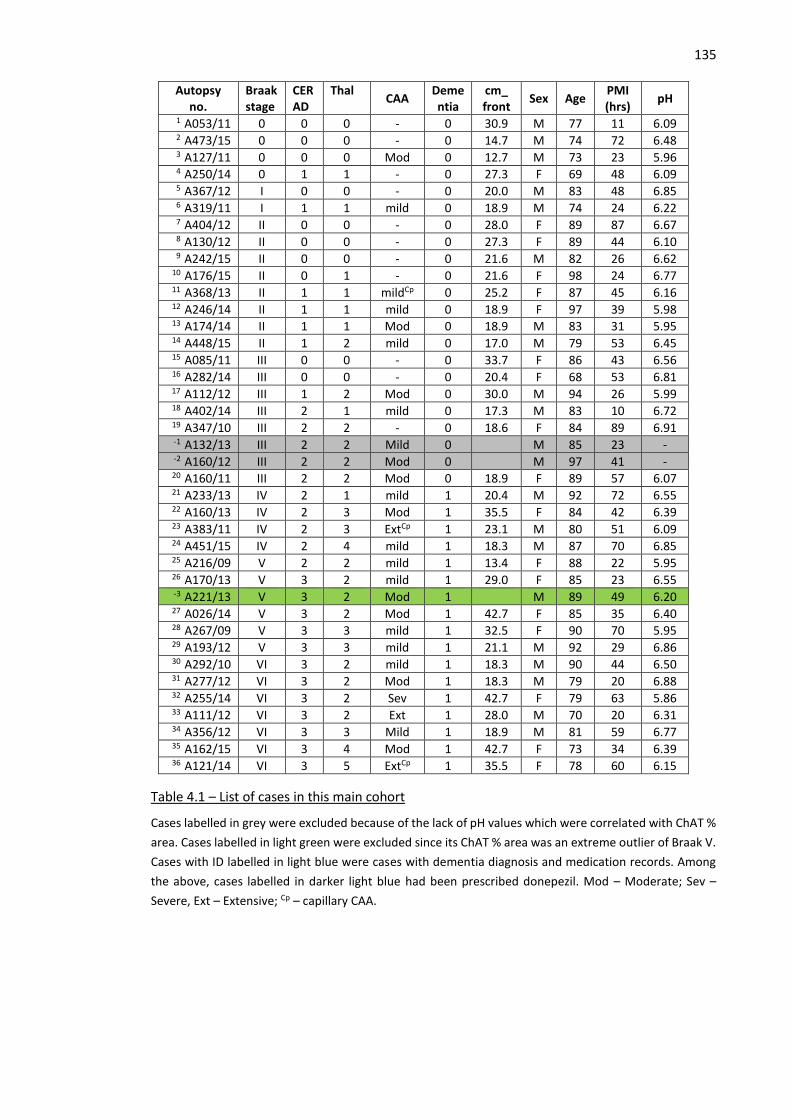
135
Autopsy no.
Braak stage
CERAD
Thal CAA
Dementia
cm_ front
Sex Age PMI (hrs)
pH
1 A053/11 0 0 0 - 0 30.9 M 77 11 6.09 2 A473/15 0 0 0 - 0 14.7 M 74 72 6.48 3 A127/11 0 0 0 Mod 0 12.7 M 73 23 5.96 4 A250/14 0 1 1 - 0 27.3 F 69 48 6.09 5 A367/12 I 0 0 - 0 20.0 M 83 48 6.85 6 A319/11 I 1 1 mild 0 18.9 M 74 24 6.22 7 A404/12 II 0 0 - 0 28.0 F 89 87 6.67 8 A130/12 II 0 0 - 0 27.3 F 89 44 6.10 9 A242/15 II 0 0 - 0 21.6 M 82 26 6.62
10 A176/15 II 0 1 - 0 21.6 F 98 24 6.77 11 A368/13 II 1 1 mildCp 0 25.2 F 87 45 6.16 12 A246/14 II 1 1 mild 0 18.9 F 97 39 5.98 13 A174/14 II 1 1 Mod 0 18.9 M 83 31 5.95 14 A448/15 II 1 2 mild 0 17.0 M 79 53 6.45 15 A085/11 III 0 0 - 0 33.7 F 86 43 6.56 16 A282/14 III 0 0 - 0 20.4 F 68 53 6.81
17 A112/12 III 1 2 Mod 0 30.0 M 94 26 5.99 18 A402/14 III 2 1 mild 0 17.3 M 83 10 6.72 19 A347/10 III 2 2 - 0 18.6 F 84 89 6.91 -1 A132/13 III 2 2 Mild 0 M 85 23 - -2 A160/12 III 2 2 Mod 0 M 97 41 - 20 A160/11 III 2 2 Mod 0 18.9 F 89 57 6.07 21 A233/13 IV 2 1 mild 1 20.4 M 92 72 6.55 22 A160/13 IV 2 3 Mod 1 35.5 F 84 42 6.39 23 A383/11 IV 2 3 ExtCp 1 23.1 M 80 51 6.09 24 A451/15 IV 2 4 mild 1 18.3 M 87 70 6.85 25 A216/09 V 2 2 mild 1 13.4 F 88 22 5.95 26 A170/13 V 3 2 mild 1 29.0 F 85 23 6.55 -3 A221/13 V 3 2 Mod 1 M 89 49 6.20 27 A026/14 V 3 2 Mod 1 42.7 F 85 35 6.40 28 A267/09 V 3 3 mild 1 32.5 F 90 70 5.95 29 A193/12 V 3 3 mild 1 21.1 M 92 29 6.86 30 A292/10 VI 3 2 mild 1 18.3 M 90 44 6.50 31 A277/12 VI 3 2 Mod 1 18.3 M 79 20 6.88 32 A255/14 VI 3 2 Sev 1 42.7 F 79 63 5.86 33 A111/12 VI 3 2 Ext 1 28.0 M 70 20 6.31 34 A356/12 VI 3 3 Mild 1 18.9 M 81 59 6.77 35 A162/15 VI 3 4 Mod 1 42.7 F 73 34 6.39 36 A121/14 VI 3 5 ExtCp 1 35.5 F 78 60 6.15
Table 4.1 – List of cases in this main cohort
Cases labelled in grey were excluded because of the lack of pH values which were correlated with ChAT %
area. Cases labelled in light green were excluded since its ChAT % area was an extreme outlier of Braak V.
Cases with ID labelled in light blue were cases with dementia diagnosis and medication records. Among
the above, cases labelled in darker light blue had been prescribed donepezil. Mod – Moderate; Sev –
Severe, Ext – Extensive; Cp – capillary CAA.
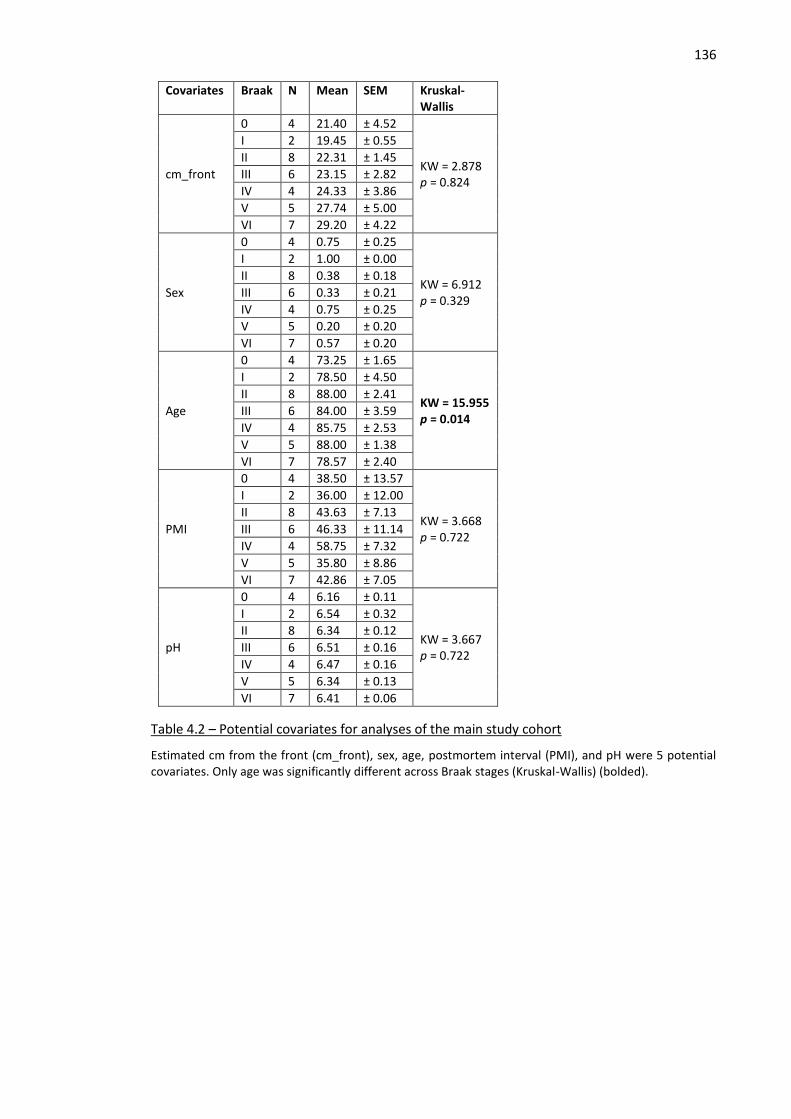
136
Covariates Braak N Mean SEM Kruskal-Wallis
cm_front
0 4 21.40 ± 4.52
KW = 2.878 p = 0.824
I 2 19.45 ± 0.55
II 8 22.31 ± 1.45
III 6 23.15 ± 2.82
IV 4 24.33 ± 3.86
V 5 27.74 ± 5.00
VI 7 29.20 ± 4.22
Sex
0 4 0.75 ± 0.25
KW = 6.912 p = 0.329
I 2 1.00 ± 0.00
II 8 0.38 ± 0.18
III 6 0.33 ± 0.21
IV 4 0.75 ± 0.25
V 5 0.20 ± 0.20
VI 7 0.57 ± 0.20
Age
0 4 73.25 ± 1.65
KW = 15.955 p = 0.014
I 2 78.50 ± 4.50
II 8 88.00 ± 2.41
III 6 84.00 ± 3.59
IV 4 85.75 ± 2.53
V 5 88.00 ± 1.38
VI 7 78.57 ± 2.40
PMI
0 4 38.50 ± 13.57
KW = 3.668 p = 0.722
I 2 36.00 ± 12.00
II 8 43.63 ± 7.13
III 6 46.33 ± 11.14
IV 4 58.75 ± 7.32
V 5 35.80 ± 8.86
VI 7 42.86 ± 7.05
pH
0 4 6.16 ± 0.11
KW = 3.667 p = 0.722
I 2 6.54 ± 0.32
II 8 6.34 ± 0.12
III 6 6.51 ± 0.16
IV 4 6.47 ± 0.16
V 5 6.34 ± 0.13
VI 7 6.41 ± 0.06
Table 4.2 – Potential covariates for analyses of the main study cohort
Estimated cm from the front (cm_front), sex, age, postmortem interval (PMI), and pH were 5 potential covariates. Only age was significantly different across Braak stages (Kruskal-Wallis) (bolded).
137 4.2.2 Immunohistochemistry
IHC was performed according to the standard protocol in Chapter 2. For each case, three
sections were subjected to IHC: one for VAChT (488) and ChAT (568); one for PCNA (488), HuB/D
(568), and DCX (647); and the last one for AT8 (488) and p-S396 (568). Fluorescence images were
captured with Zeiss Axiocam fluorescence microscope at 20x objective magnification using
Axiovision SE64 Rel 4.9.1 software. All images taken with Axiocam microscope have a conversion
ratio of 1px equal to 0.324 µm in length and 0.105 µm2 in area.
4.2.3 Quantification
For each case, at least 4 montage images, each of which contain several fields to cover the ML,
GCL, SGZ, and hilus. Images were analysed on ImageJ software as demonstrated in Figure 4.1.
Background was subtracted from each image by Subtract Background… function with a rolling
ball radius of 6px. Threshold for the grey values of at least 15 was applied to both VAChT and
ChAT images. Images after thresholding were converted into binary masks and image with
colocalisation between two images were produced by Image Calculator… command with AND
function. Only particles with size of at least 5px on VAChT, ChAT, and colocalised images were
analysed to exclude background noises. Percentage area of staining per selection area spanning
the ML to the hilus of each marker was calculated.
For dystrophic neurite quantification, images were subjected to Subtract Background… function
with a rolling ball radius of 25px. The grey value threshold of at least 45 was applied and only
particles with size of at least 150px were quantified. Percentage areas of dystrophic neurite
particles were quantified in the ML, GCL, SGZ, and hilus separately.
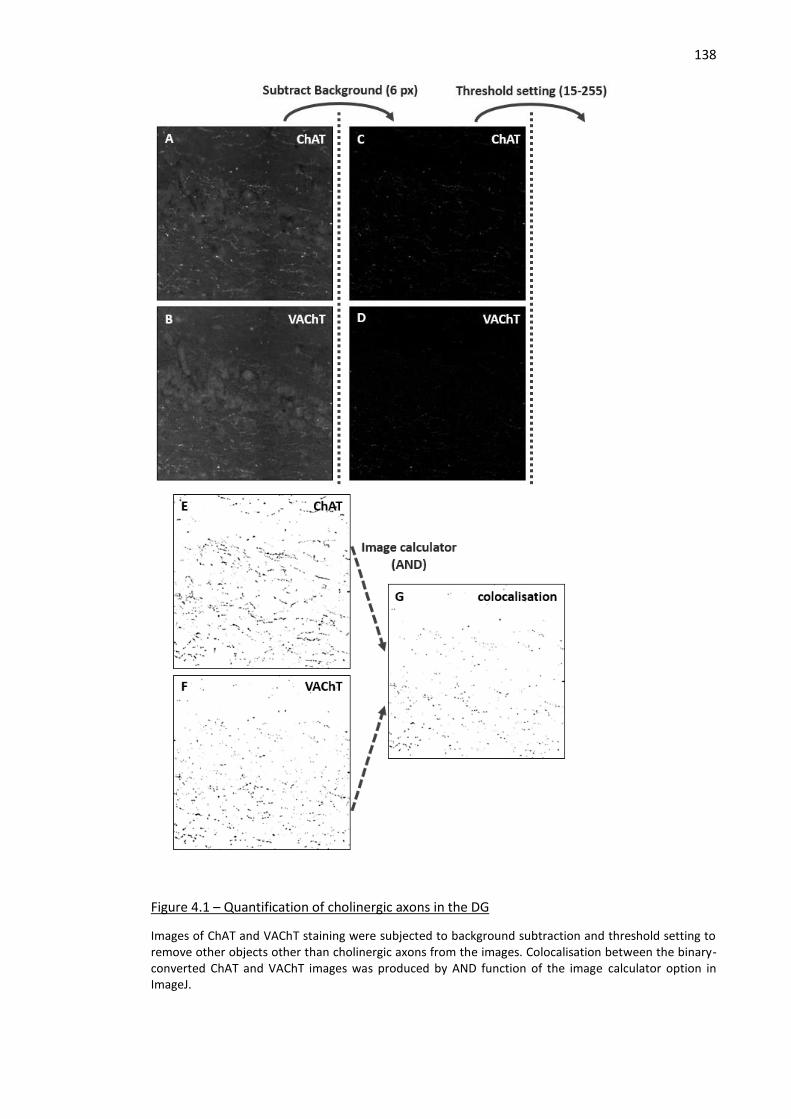
138
Figure 4.1 – Quantification of cholinergic axons in the DG
Images of ChAT and VAChT staining were subjected to background subtraction and threshold setting to remove other objects other than cholinergic axons from the images. Colocalisation between the binary-converted ChAT and VAChT images was produced by AND function of the image calculator option in ImageJ.
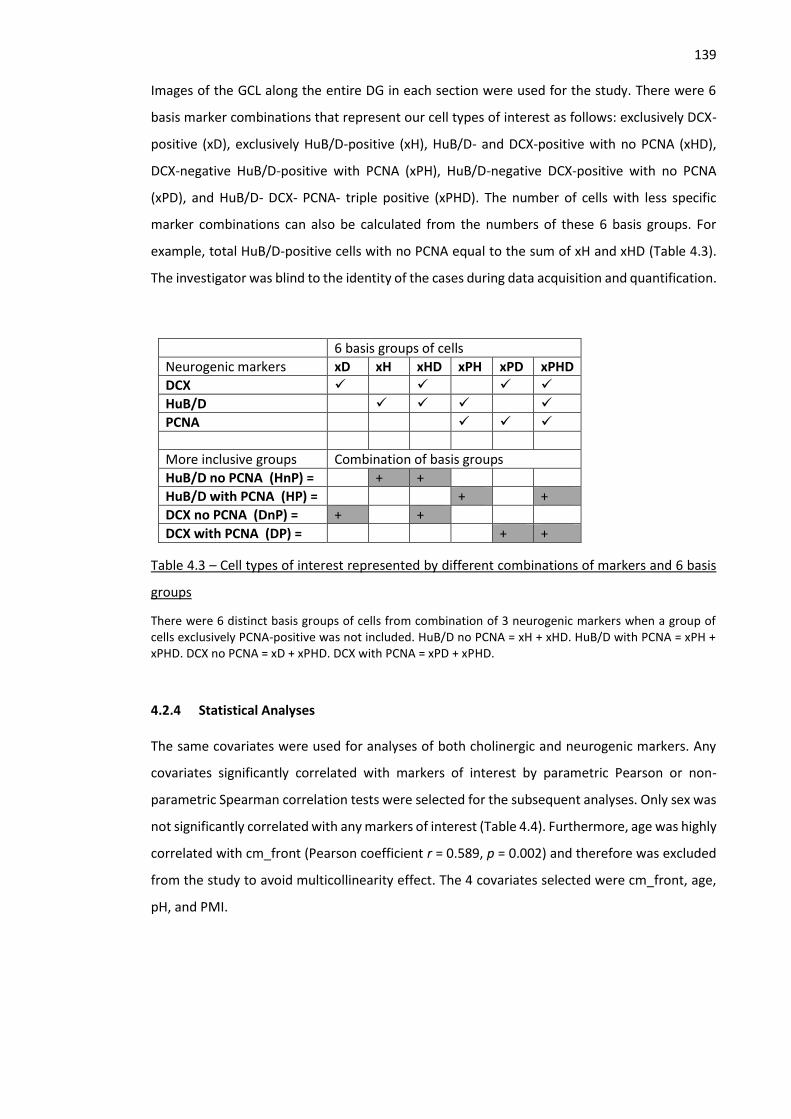
139 Images of the GCL along the entire DG in each section were used for the study. There were 6
basis marker combinations that represent our cell types of interest as follows: exclusively DCX-
positive (xD), exclusively HuB/D-positive (xH), HuB/D- and DCX-positive with no PCNA (xHD),
DCX-negative HuB/D-positive with PCNA (xPH), HuB/D-negative DCX-positive with no PCNA
(xPD), and HuB/D- DCX- PCNA- triple positive (xPHD). The number of cells with less specific
marker combinations can also be calculated from the numbers of these 6 basis groups. For
example, total HuB/D-positive cells with no PCNA equal to the sum of xH and xHD (Table 4.3).
The investigator was blind to the identity of the cases during data acquisition and quantification.
6 basis groups of cells
Neurogenic markers xD xH xHD xPH xPD xPHD
DCX ✓ ✓ ✓ ✓ HuB/D ✓ ✓ ✓ ✓ PCNA ✓ ✓ ✓
More inclusive groups Combination of basis groups
HuB/D no PCNA (HnP) = + +
HuB/D with PCNA (HP) = + +
DCX no PCNA (DnP) = + +
DCX with PCNA (DP) = + +
Table 4.3 – Cell types of interest represented by different combinations of markers and 6 basis
groups
There were 6 distinct basis groups of cells from combination of 3 neurogenic markers when a group of cells exclusively PCNA-positive was not included. HuB/D no PCNA = xH + xHD. HuB/D with PCNA = xPH + xPHD. DCX no PCNA = xD + xPHD. DCX with PCNA = xPD + xPHD.
4.2.4 Statistical Analyses
The same covariates were used for analyses of both cholinergic and neurogenic markers. Any
covariates significantly correlated with markers of interest by parametric Pearson or non-
parametric Spearman correlation tests were selected for the subsequent analyses. Only sex was
not significantly correlated with any markers of interest (Table 4.4). Furthermore, age was highly
correlated with cm_front (Pearson coefficient r = 0.589, p = 0.002) and therefore was excluded
from the study to avoid multicollinearity effect. The 4 covariates selected were cm_front, age,
pH, and PMI.
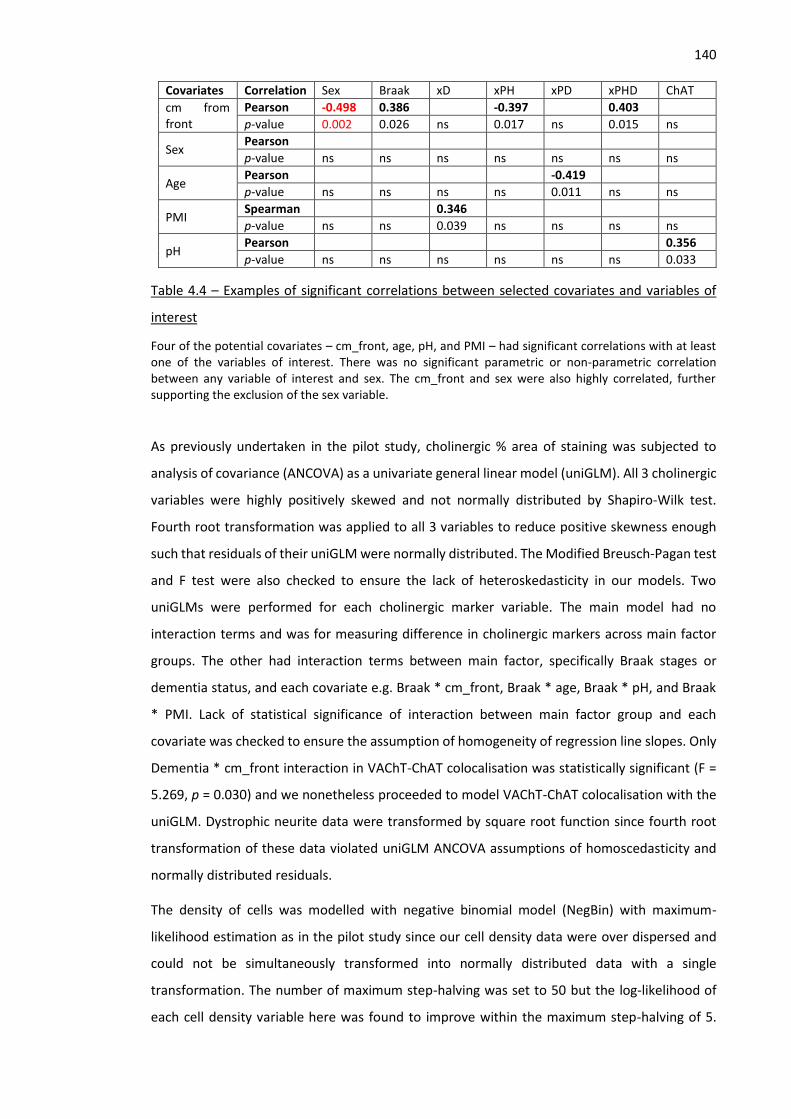
140
Covariates Correlation Sex Braak xD xPH xPD xPHD ChAT
cm from front
Pearson -0.498 0.386 -0.397 0.403
p-value 0.002 0.026 ns 0.017 ns 0.015 ns
Sex Pearson
p-value ns ns ns ns ns ns ns
Age Pearson -0.419
p-value ns ns ns ns 0.011 ns ns
PMI Spearman 0.346
p-value ns ns 0.039 ns ns ns ns
pH Pearson 0.356
p-value ns ns ns ns ns ns 0.033
Table 4.4 – Examples of significant correlations between selected covariates and variables of
interest
Four of the potential covariates – cm_front, age, pH, and PMI – had significant correlations with at least one of the variables of interest. There was no significant parametric or non-parametric correlation between any variable of interest and sex. The cm_front and sex were also highly correlated, further supporting the exclusion of the sex variable.
As previously undertaken in the pilot study, cholinergic % area of staining was subjected to
analysis of covariance (ANCOVA) as a univariate general linear model (uniGLM). All 3 cholinergic
variables were highly positively skewed and not normally distributed by Shapiro-Wilk test.
Fourth root transformation was applied to all 3 variables to reduce positive skewness enough
such that residuals of their uniGLM were normally distributed. The Modified Breusch-Pagan test
and F test were also checked to ensure the lack of heteroskedasticity in our models. Two
uniGLMs were performed for each cholinergic marker variable. The main model had no
interaction terms and was for measuring difference in cholinergic markers across main factor
groups. The other had interaction terms between main factor, specifically Braak stages or
dementia status, and each covariate e.g. Braak * cm_front, Braak * age, Braak * pH, and Braak
* PMI. Lack of statistical significance of interaction between main factor group and each
covariate was checked to ensure the assumption of homogeneity of regression line slopes. Only
Dementia * cm_front interaction in VAChT-ChAT colocalisation was statistically significant (F =
5.269, p = 0.030) and we nonetheless proceeded to model VAChT-ChAT colocalisation with the
uniGLM. Dystrophic neurite data were transformed by square root function since fourth root
transformation of these data violated uniGLM ANCOVA assumptions of homoscedasticity and
normally distributed residuals.
The density of cells was modelled with negative binomial model (NegBin) with maximum-
likelihood estimation as in the pilot study since our cell density data were over dispersed and
could not be simultaneously transformed into normally distributed data with a single
transformation. The number of maximum step-halving was set to 50 but the log-likelihood of
each cell density variable here was found to improve within the maximum step-halving of 5.
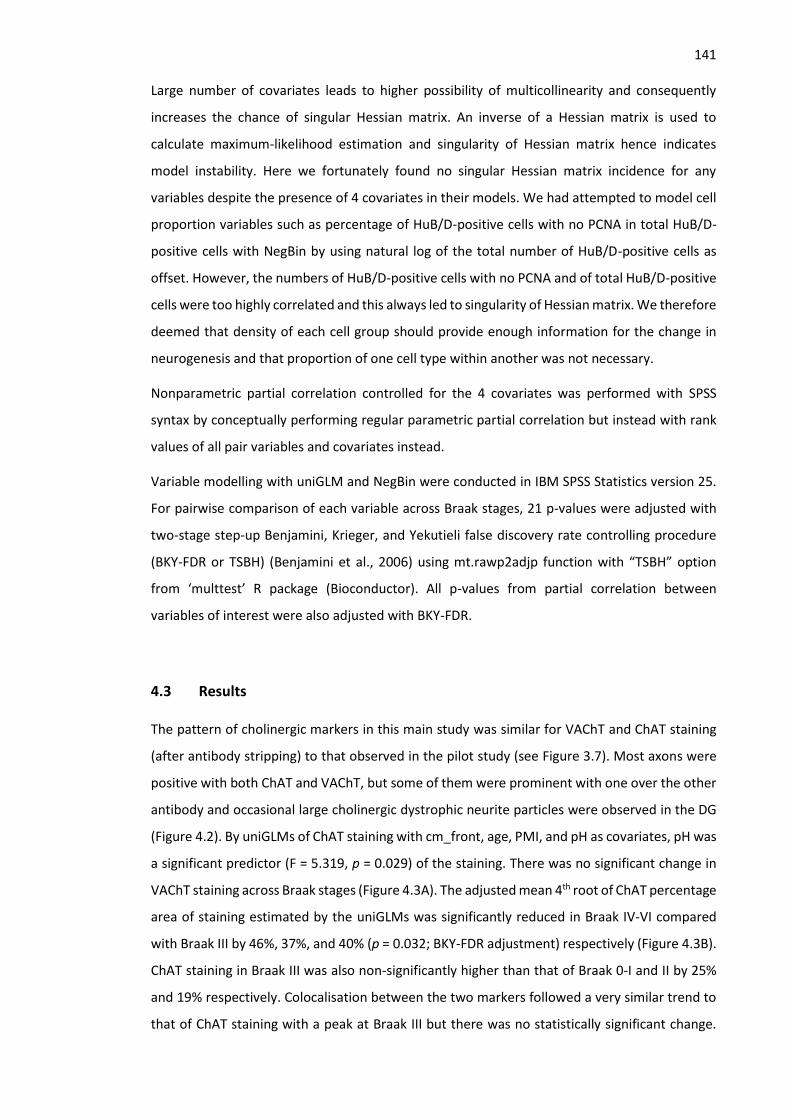
141 Large number of covariates leads to higher possibility of multicollinearity and consequently
increases the chance of singular Hessian matrix. An inverse of a Hessian matrix is used to
calculate maximum-likelihood estimation and singularity of Hessian matrix hence indicates
model instability. Here we fortunately found no singular Hessian matrix incidence for any
variables despite the presence of 4 covariates in their models. We had attempted to model cell
proportion variables such as percentage of HuB/D-positive cells with no PCNA in total HuB/D-
positive cells with NegBin by using natural log of the total number of HuB/D-positive cells as
offset. However, the numbers of HuB/D-positive cells with no PCNA and of total HuB/D-positive
cells were too highly correlated and this always led to singularity of Hessian matrix. We therefore
deemed that density of each cell group should provide enough information for the change in
neurogenesis and that proportion of one cell type within another was not necessary.
Nonparametric partial correlation controlled for the 4 covariates was performed with SPSS
syntax by conceptually performing regular parametric partial correlation but instead with rank
values of all pair variables and covariates instead.
Variable modelling with uniGLM and NegBin were conducted in IBM SPSS Statistics version 25.
For pairwise comparison of each variable across Braak stages, 21 p-values were adjusted with
two-stage step-up Benjamini, Krieger, and Yekutieli false discovery rate controlling procedure
(BKY-FDR or TSBH) (Benjamini et al., 2006) using mt.rawp2adjp function with “TSBH” option
from ‘multtest’ R package (Bioconductor). All p-values from partial correlation between
variables of interest were also adjusted with BKY-FDR.
4.3 Results
The pattern of cholinergic markers in this main study was similar for VAChT and ChAT staining
(after antibody stripping) to that observed in the pilot study (see Figure 3.7). Most axons were
positive with both ChAT and VAChT, but some of them were prominent with one over the other
antibody and occasional large cholinergic dystrophic neurite particles were observed in the DG
(Figure 4.2). By uniGLMs of ChAT staining with cm_front, age, PMI, and pH as covariates, pH was
a significant predictor (F = 5.319, p = 0.029) of the staining. There was no significant change in
VAChT staining across Braak stages (Figure 4.3A). The adjusted mean 4th root of ChAT percentage
area of staining estimated by the uniGLMs was significantly reduced in Braak IV-VI compared
with Braak III by 46%, 37%, and 40% (p = 0.032; BKY-FDR adjustment) respectively (Figure 4.3B).
ChAT staining in Braak III was also non-significantly higher than that of Braak 0-I and II by 25%
and 19% respectively. Colocalisation between the two markers followed a very similar trend to
that of ChAT staining with a peak at Braak III but there was no statistically significant change.
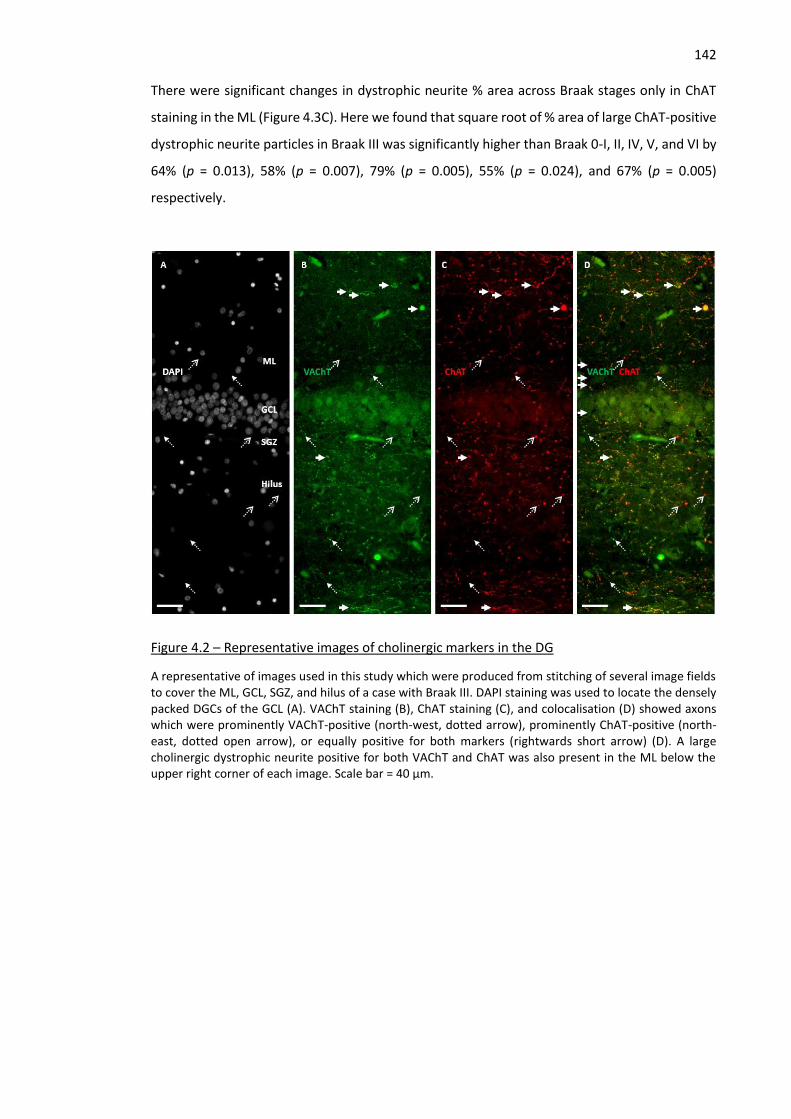
142 There were significant changes in dystrophic neurite % area across Braak stages only in ChAT
staining in the ML (Figure 4.3C). Here we found that square root of % area of large ChAT-positive
dystrophic neurite particles in Braak III was significantly higher than Braak 0-I, II, IV, V, and VI by
64% (p = 0.013), 58% (p = 0.007), 79% (p = 0.005), 55% (p = 0.024), and 67% (p = 0.005)
respectively.
Figure 4.2 – Representative images of cholinergic markers in the DG
A representative of images used in this study which were produced from stitching of several image fields to cover the ML, GCL, SGZ, and hilus of a case with Braak III. DAPI staining was used to locate the densely packed DGCs of the GCL (A). VAChT staining (B), ChAT staining (C), and colocalisation (D) showed axons which were prominently VAChT-positive (north-west, dotted arrow), prominently ChAT-positive (north-east, dotted open arrow), or equally positive for both markers (rightwards short arrow) (D). A large cholinergic dystrophic neurite positive for both VAChT and ChAT was also present in the ML below the upper right corner of each image. Scale bar = 40 µm.
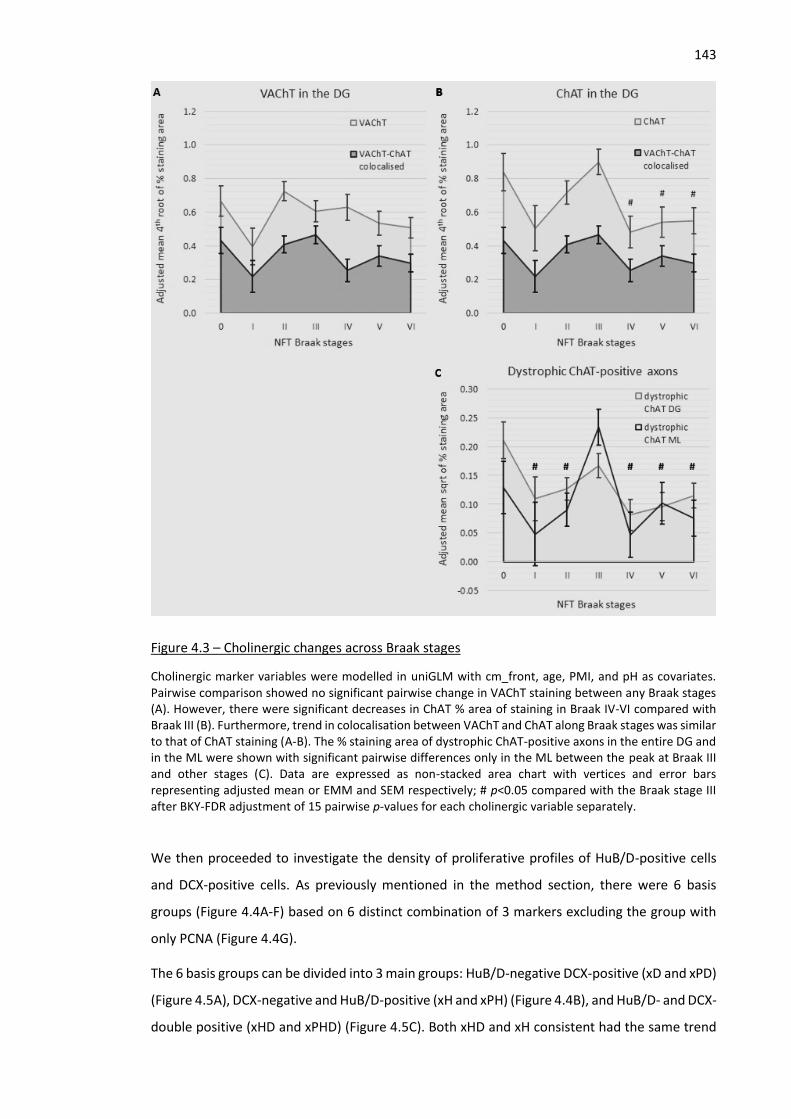
143
Figure 4.3 – Cholinergic changes across Braak stages
Cholinergic marker variables were modelled in uniGLM with cm_front, age, PMI, and pH as covariates. Pairwise comparison showed no significant pairwise change in VAChT staining between any Braak stages (A). However, there were significant decreases in ChAT % area of staining in Braak IV-VI compared with Braak III (B). Furthermore, trend in colocalisation between VAChT and ChAT along Braak stages was similar to that of ChAT staining (A-B). The % staining area of dystrophic ChAT-positive axons in the entire DG and in the ML were shown with significant pairwise differences only in the ML between the peak at Braak III and other stages (C). Data are expressed as non-stacked area chart with vertices and error bars representing adjusted mean or EMM and SEM respectively; # p<0.05 compared with the Braak stage III after BKY-FDR adjustment of 15 pairwise p-values for each cholinergic variable separately.
We then proceeded to investigate the density of proliferative profiles of HuB/D-positive cells
and DCX-positive cells. As previously mentioned in the method section, there were 6 basis
groups (Figure 4.4A-F) based on 6 distinct combination of 3 markers excluding the group with
only PCNA (Figure 4.4G).
The 6 basis groups can be divided into 3 main groups: HuB/D-negative DCX-positive (xD and xPD)
(Figure 4.5A), DCX-negative and HuB/D-positive (xH and xPH) (Figure 4.4B), and HuB/D- and DCX-
double positive (xHD and xPHD) (Figure 4.5C). Both xHD and xH consistent had the same trend
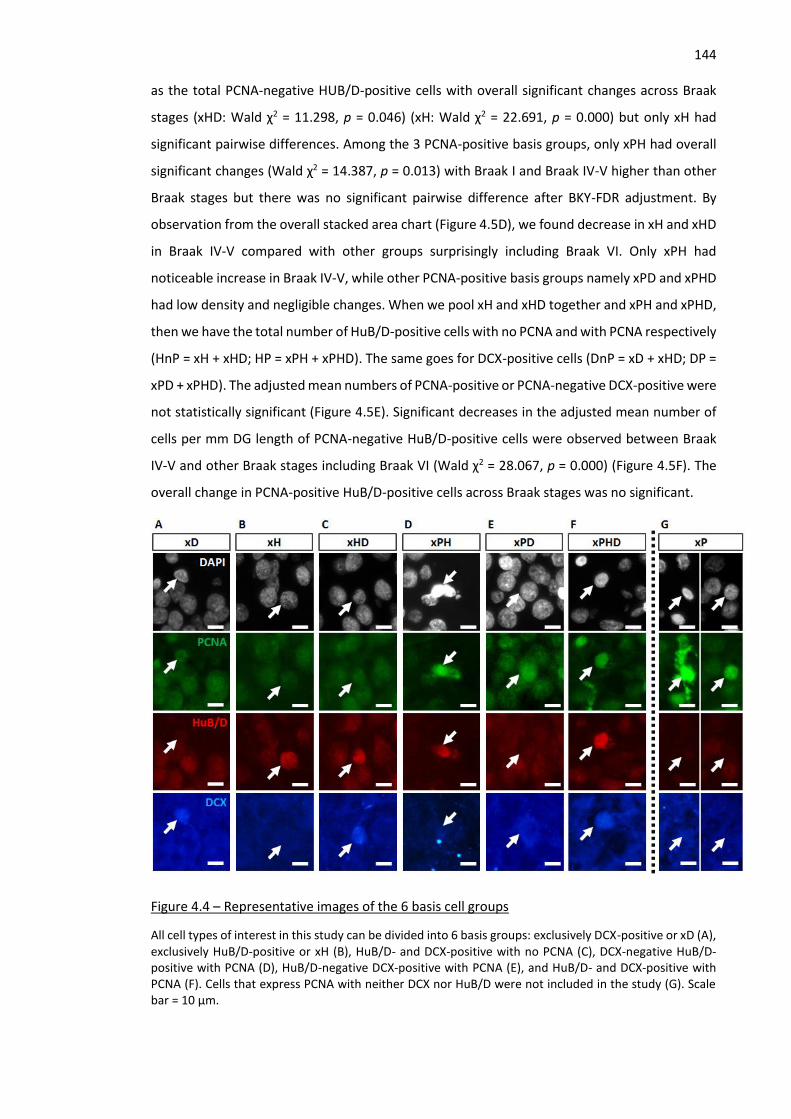
144 as the total PCNA-negative HUB/D-positive cells with overall significant changes across Braak
stages (xHD: Wald χ2 = 11.298, p = 0.046) (xH: Wald χ2 = 22.691, p = 0.000) but only xH had
significant pairwise differences. Among the 3 PCNA-positive basis groups, only xPH had overall
significant changes (Wald χ2 = 14.387, p = 0.013) with Braak I and Braak IV-V higher than other
Braak stages but there was no significant pairwise difference after BKY-FDR adjustment. By
observation from the overall stacked area chart (Figure 4.5D), we found decrease in xH and xHD
in Braak IV-V compared with other groups surprisingly including Braak VI. Only xPH had
noticeable increase in Braak IV-V, while other PCNA-positive basis groups namely xPD and xPHD
had low density and negligible changes. When we pool xH and xHD together and xPH and xPHD,
then we have the total number of HuB/D-positive cells with no PCNA and with PCNA respectively
(HnP = xH + xHD; HP = xPH + xPHD). The same goes for DCX-positive cells (DnP = xD + xHD; DP =
xPD + xPHD). The adjusted mean numbers of PCNA-positive or PCNA-negative DCX-positive were
not statistically significant (Figure 4.5E). Significant decreases in the adjusted mean number of
cells per mm DG length of PCNA-negative HuB/D-positive cells were observed between Braak
IV-V and other Braak stages including Braak VI (Wald χ2 = 28.067, p = 0.000) (Figure 4.5F). The
overall change in PCNA-positive HuB/D-positive cells across Braak stages was no significant.
Figure 4.4 – Representative images of the 6 basis cell groups
All cell types of interest in this study can be divided into 6 basis groups: exclusively DCX-positive or xD (A), exclusively HuB/D-positive or xH (B), HuB/D- and DCX-positive with no PCNA (C), DCX-negative HuB/D-positive with PCNA (D), HuB/D-negative DCX-positive with PCNA (E), and HuB/D- and DCX-positive with PCNA (F). Cells that express PCNA with neither DCX nor HuB/D were not included in the study (G). Scale bar = 10 µm.
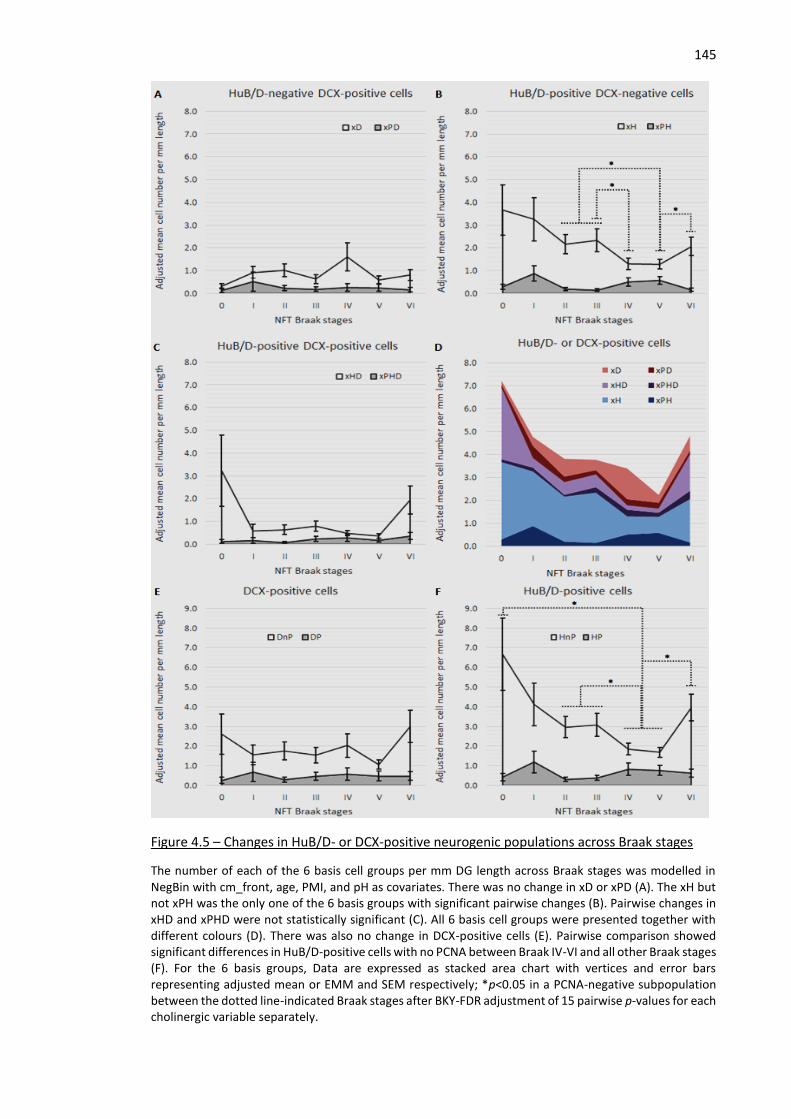
145
Figure 4.5 – Changes in HuB/D- or DCX-positive neurogenic populations across Braak stages
The number of each of the 6 basis cell groups per mm DG length across Braak stages was modelled in NegBin with cm_front, age, PMI, and pH as covariates. There was no change in xD or xPD (A). The xH but not xPH was the only one of the 6 basis groups with significant pairwise changes (B). Pairwise changes in xHD and xPHD were not statistically significant (C). All 6 basis cell groups were presented together with different colours (D). There was also no change in DCX-positive cells (E). Pairwise comparison showed significant differences in HuB/D-positive cells with no PCNA between Braak IV-VI and all other Braak stages (F). For the 6 basis groups, Data are expressed as stacked area chart with vertices and error bars representing adjusted mean or EMM and SEM respectively; *p<0.05 in a PCNA-negative subpopulation between the dotted line-indicated Braak stages after BKY-FDR adjustment of 15 pairwise p-values for each cholinergic variable separately.
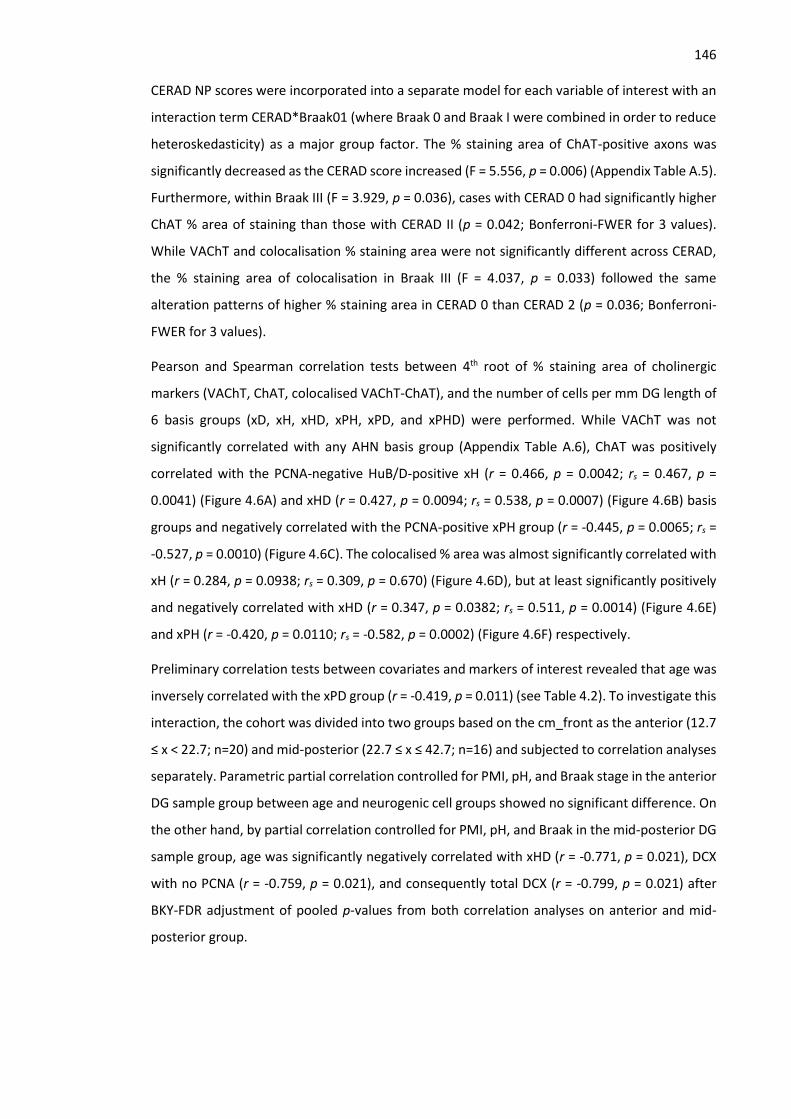
146 CERAD NP scores were incorporated into a separate model for each variable of interest with an
interaction term CERAD*Braak01 (where Braak 0 and Braak I were combined in order to reduce
heteroskedasticity) as a major group factor. The % staining area of ChAT-positive axons was
significantly decreased as the CERAD score increased (F = 5.556, p = 0.006) (Appendix Table A.5).
Furthermore, within Braak III (F = 3.929, p = 0.036), cases with CERAD 0 had significantly higher
ChAT % area of staining than those with CERAD II (p = 0.042; Bonferroni-FWER for 3 values).
While VAChT and colocalisation % staining area were not significantly different across CERAD,
the % staining area of colocalisation in Braak III (F = 4.037, p = 0.033) followed the same
alteration patterns of higher % staining area in CERAD 0 than CERAD 2 (p = 0.036; Bonferroni-
FWER for 3 values).
Pearson and Spearman correlation tests between 4th root of % staining area of cholinergic
markers (VAChT, ChAT, colocalised VAChT-ChAT), and the number of cells per mm DG length of
6 basis groups (xD, xH, xHD, xPH, xPD, and xPHD) were performed. While VAChT was not
significantly correlated with any AHN basis group (Appendix Table A.6), ChAT was positively
correlated with the PCNA-negative HuB/D-positive xH (r = 0.466, p = 0.0042; rs = 0.467, p =
0.0041) (Figure 4.6A) and xHD (r = 0.427, p = 0.0094; rs = 0.538, p = 0.0007) (Figure 4.6B) basis
groups and negatively correlated with the PCNA-positive xPH group (r = -0.445, p = 0.0065; rs =
-0.527, p = 0.0010) (Figure 4.6C). The colocalised % area was almost significantly correlated with
xH (r = 0.284, p = 0.0938; rs = 0.309, p = 0.670) (Figure 4.6D), but at least significantly positively
and negatively correlated with xHD (r = 0.347, p = 0.0382; rs = 0.511, p = 0.0014) (Figure 4.6E)
and xPH (r = -0.420, p = 0.0110; rs = -0.582, p = 0.0002) (Figure 4.6F) respectively.
Preliminary correlation tests between covariates and markers of interest revealed that age was
inversely correlated with the xPD group (r = -0.419, p = 0.011) (see Table 4.2). To investigate this
interaction, the cohort was divided into two groups based on the cm_front as the anterior (12.7
≤ x < 22.7; n=20) and mid-posterior (22.7 ≤ x ≤ 42.7; n=16) and subjected to correlation analyses
separately. Parametric partial correlation controlled for PMI, pH, and Braak stage in the anterior
DG sample group between age and neurogenic cell groups showed no significant difference. On
the other hand, by partial correlation controlled for PMI, pH, and Braak in the mid-posterior DG
sample group, age was significantly negatively correlated with xHD (r = -0.771, p = 0.021), DCX
with no PCNA (r = -0.759, p = 0.021), and consequently total DCX (r = -0.799, p = 0.021) after
BKY-FDR adjustment of pooled p-values from both correlation analyses on anterior and mid-
posterior group.
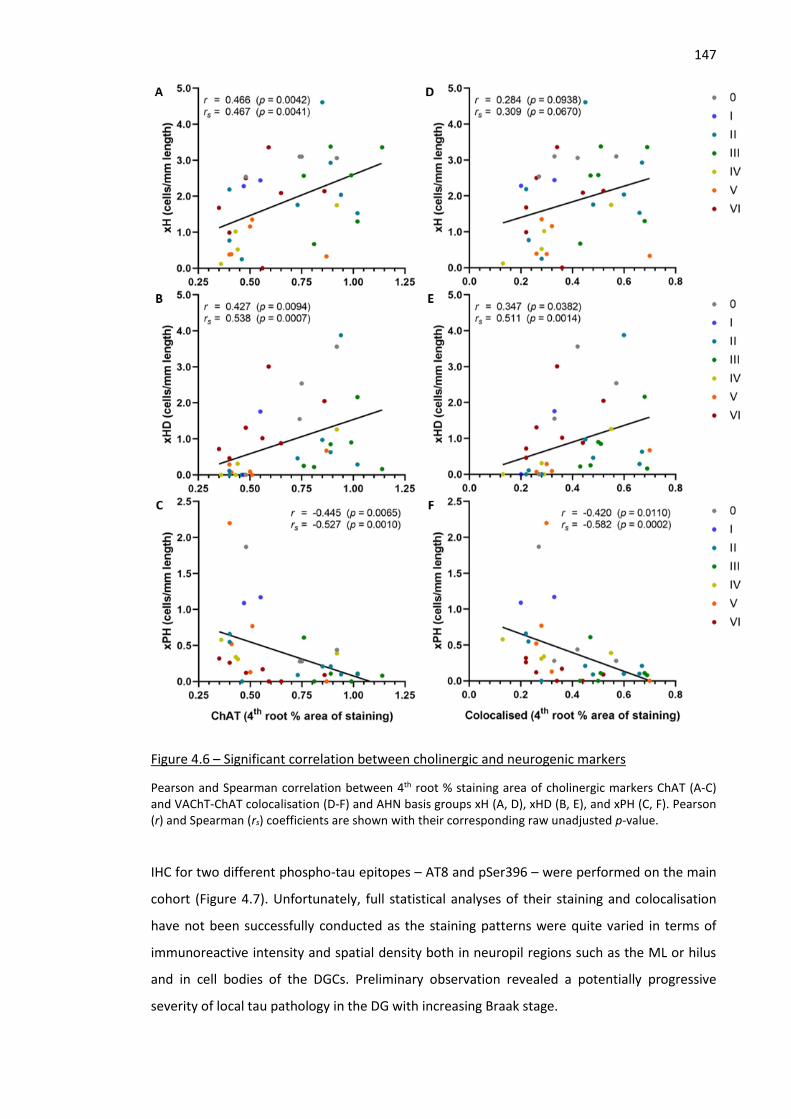
147
Figure 4.6 – Significant correlation between cholinergic and neurogenic markers
Pearson and Spearman correlation between 4th root % staining area of cholinergic markers ChAT (A-C) and VAChT-ChAT colocalisation (D-F) and AHN basis groups xH (A, D), xHD (B, E), and xPH (C, F). Pearson (r) and Spearman (rs) coefficients are shown with their corresponding raw unadjusted p-value.
IHC for two different phospho-tau epitopes – AT8 and pSer396 – were performed on the main
cohort (Figure 4.7). Unfortunately, full statistical analyses of their staining and colocalisation
have not been successfully conducted as the staining patterns were quite varied in terms of
immunoreactive intensity and spatial density both in neuropil regions such as the ML or hilus
and in cell bodies of the DGCs. Preliminary observation revealed a potentially progressive
severity of local tau pathology in the DG with increasing Braak stage.
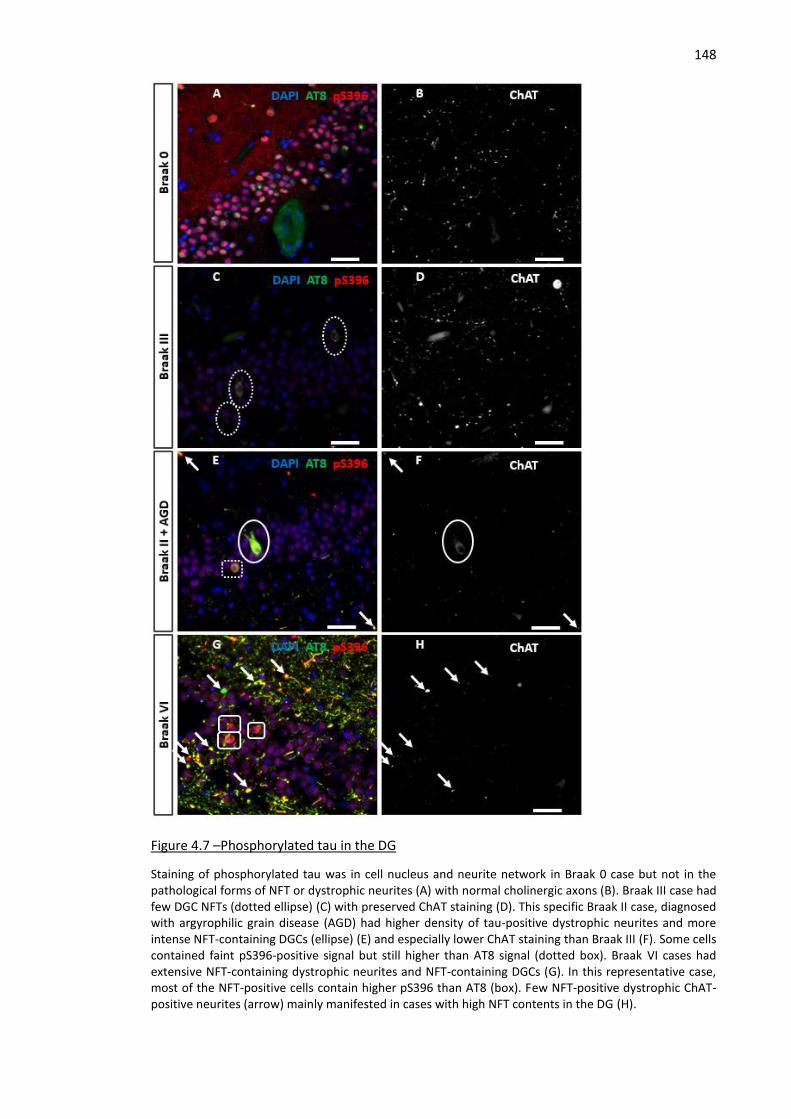
148
Figure 4.7 –Phosphorylated tau in the DG
Staining of phosphorylated tau was in cell nucleus and neurite network in Braak 0 case but not in the pathological forms of NFT or dystrophic neurites (A) with normal cholinergic axons (B). Braak III case had few DGC NFTs (dotted ellipse) (C) with preserved ChAT staining (D). This specific Braak II case, diagnosed with argyrophilic grain disease (AGD) had higher density of tau-positive dystrophic neurites and more intense NFT-containing DGCs (ellipse) (E) and especially lower ChAT staining than Braak III (F). Some cells contained faint pS396-positive signal but still higher than AT8 signal (dotted box). Braak VI cases had extensive NFT-containing dystrophic neurites and NFT-containing DGCs (G). In this representative case, most of the NFT-positive cells contain higher pS396 than AT8 (box). Few NFT-positive dystrophic ChAT-positive neurites (arrow) mainly manifested in cases with high NFT contents in the DG (H).
149
4.4 Discussion
The major findings of this chapter were as follows;
- Percentage staining area of ChAT-positive axons was significantly upregulated in Braak
III compared with Braak IV-VI. There was no change in staining of VAChT-positive axons
across Braak stages. Axonal swelling or dystrophy also reached its peak in Braak III.
- Immature DGCs were divided into 6 basis groups based on exclusive staining of PCNA,
HuB/D, and DCX: xD, xH, xHD, xPH, xPD, and xPHD.
- Only xH had significant pairwise difference with the lowest number in Braak IV-V. The
xPH had a general opposite trend with significant overall difference but not pairwise.
- CERAD NP score had significant deleterious effect on ChAT staining with a focus on cases
with Braak III. However, the sample size was too small for conclusion.
- Staining of ChAT-positive axons was positively correlated with xH and xHD, but inversely
correlated with xPH.
The main findings of this study were that unlike the pilot study, VAChT %area of staining was not
significantly negatively correlated with Braak stages despite its generally decreasing trend. On
the other hand, ChAT-positive axon %area of staining was upregulated in Braak III and
significantly decreased in Braak IV-VI compared with the Braak III but not statistically significant
compared with Braak 0-I and II. For analyses on population of neuroblasts or immature neurons
marked by expression of DCX or HuB/D, we found that PCNA-negative HuB/D-positive cells (xH
+ xHD) and especially the exclusively HuB/D-positive group xH were significantly decreased in
Braak IV-VI compared with other Braak stages. ChAT %area also had significant positive
correlations with PCNA-negative HuB/D-positive cell groups but negative correlation with PCNA-
positive HuB/D-positive cells.
This finding of higher % area of ChAT-positive axons in Braak III was consistent with the previous
finding on hippocampal ChAT activity upregulation in MCI patients (DeKosky et al., 2002) and
that this upregulation of hippocampal ChAT activity was limited to those MCI cases with Braak
III-IV (Ikonomovic et al., 2003). Higher incidence of cholinergic fibre swelling in the nbM was also
reported in cases with Braak I-III compared with Braak 0 and Braak IV-VI cases (Stokin et al.,
2005). While most of the small swellings were included in the analysis of axon % area, we
separately quantified % area of large ChAT-positive dystrophic neurites and found the highest %
area of these swellings mainly in the ML of Braak III cases. Conspicuously high ChAT
immunopositivity of these particles possibly suggested the accumulation of ChAT enzymes that
may contribute to higher ChAT activity reported in previous articles. However, our findings were
different from a previous study by our group (Perry et al., 2012) that ChAT-immunopositivity in
150 the DG steadily decreased along the increasing Braak stages and another study by our group
(Kooi et al., 2011) with corroboration that ChAT %area of staining in the hilus (CA4) in cases with
Braak 0-I (control) was significantly higher than that in cases with Braak V-VI (AD).
The differential cholinergic staining results especially in Braak III-IV groups in different studies
were likely influenced by high neuropathological variability and dynamic transitioning of disease
progression. For example, the two excluded Braak III cases due to their lack of pH data had lower
ChAT % staining area than the rest (Appendix Table A.3). While this reduction might involve pH,
it could also be caused by collective effects of CERAD 2, presence of CAA and α-synuclein
pathology, and unknown APOE genotypes. Both CERAD and Thal stages were quite varied within
this Braak group, so it was possible that Braak III cases with less ChAT staining might have more
severe Aβ or other neuropathological features within the DG or other brain regions associated
with MS/VDB. Furthermore, while all Braak IV subjects in this study and a previous study (Perry
et al., 2012) had dementia status, the pilot study of this thesis included one Braak IV with high
ChAT staining with no dementia and several studies (Ikonomovic et al., 2003; Ekonomou et al.,
2015) also grouped Braak III and IV together without mentioning any caveats on potential
differences between the two Braak stages.
The original study that established investigation of PCNA and HuC/D, or HuB/D in this study,
found significant decrease in PCNA-negative HuB/D-positive cells in Braak V-VI group
(Ekonomou et al., 2015). This study however found significant increase in PCNA-negative HuB/D-
positive cells (xH + xHD) in Braak VI compared with Braak IV-V. This increase was contributed
more by a statistically significant increase in xH group than by that of xHD group. This result was
different from the pilot finding where the number of HuC/D-positive cells was the lowest at
Braak V-VI. Staining with calretinin after the first round of IHC with PCNA, HuB/D, and DCX in the
pilot study lent support to the notion that xH was more mature than xHD and xD in the course
of adult-born DGC development. A previous study reported the highest βIII-tubulin
immunoreactivity in Braak stage VI and noticeably but not statistically significantly lower
immunoreactivity in Braak stage IV (Perry et al., 2012). Since βIII-tubulin was one of the first
markers to be expressed when immature neurons or neuroblasts reached their postmitotic
stages, total immunoreactivity in the GCL may be associated with the number of immature
neurons such as the xH and xHD groups. The same study (Perry et al., 2012) also found significant
correlation between ChAT immunoreactivity and only Msi-1 staining.
Reasons behind the differences in DCX staining results reported by various articles may include
different processing and immunohistochemical technique and different criteria of
quantification. The recent study demonstrated that DCX staining was sensitive to tissue
processing and antigen retrieval procedures (Moreno-Jiménez et al., 2019). In addition, several
151 studies quantified DCX based on immunoreactivity (Boekhoorn et al., 2006; Perry et al., 2012)
but the previous article of our group (Ekonomou et al., 2015) and this thesis quantified by cell
counting. Different quantification criteria may affect the result especially under different
staining sensitivity and specificity. The number of DCX-positive cells in this study especially in
control groups was larger than the previous study (Ekonomou et al., 2015) which barely find any
DCX-positive cells in Braak 0-II group. It was possible that the criteria in this study were more
compromising as some cells with relatively weak DCX immunoreactivity such as those in Figure
4.4E or 4.4F might not meet the criteria in the previous study.
Hippocampal atrophy is an early feature of AD and could have affected the result of
quantification. One advantage of quantification by % area of staining was that it automatically
considered the possible changes in the total area of quantification fields. Nonetheless,
hippocampal atrophy could have a potential influence if it differentially affected the thickness
of different DG sublayers considering that cholinergic axon density in each subregion is possibly
different from that of one another. However, despite multiple articles that reported atrophy in
the DG (reviewed in de Flores et al., 2015), there has been no in vivo study that described
differential effects on the DG subregions. Furthermore, several articles showed that the DG was
relatively preserved in AD compared with the CA1 (Adler et al., 2018; Zhao et al., 2019). In terms
of AHN, if hippocampal atrophy is associated with loss of adult-born DGCs or pools of stem cells
or progenitors, quantification by cells/mm DG length would reflect such hippocampal atrophy-
associated changes. However, cells/mm length would not be as affected if hippocampal atrophy
reduces the cross-sectional DG length. This is possible considering that a change in DG volume
but not DG thickness was significant in one study (Adler et al., 2018).
Immunohistochemistry of AT8 and pSer396 in the DG showed a general trend of increasing
density of NFT-positive fibres in the neuropil regions namely the ML and the hilus and increasing
number of immunoreactive neurons or ghost tangles in the GCLs as Braak stage increased. This
finding was similar to what were reported by Braak and colleagues that NFT pathology
continuous progressed in the hippocampus with higher Braak stages (Braak and Braak, 1991).
Nonetheless, there were also variations in distribution of NFT-positive neuropil and cell body
particles in the DG of different cases with the same Braak stages. Braak stages were identified
by progression of NFT to the higher orders of neocortical areas but they did not monitor the
changes in hippocampal NFT distribution. This observation of higher NFT pathology in the DG in
higher Braak stages indicated the continuous aggravation of NFT-induced damage to the local
system. Future study would include a formal image analysis of the local NFT pathology and
address the association between the local NFT pathology and cholinergic innervation or AHN.
152
5 Cholinergic degeneration and adult hippocampal neurogenesis
in a mouse model for Lewy body dementia
5.1 Background
This project was collaboration with Dr Emily Clarke to characterise a mouse model with
heterozygous D427V (D427V/WT) GBA1 mutation. This D427V/WT GBA1 mouse model was first
demonstrated by Sardi et al. (2011) to have lower brain GCase activity and develop α-synuclein
aggregates in the hippocampus, albeit without evidence of abnormal cognition or
glucosylsphingosine (GlcSph) accumulation at 6 months old. Dr Clarke first found this mouse
exhibited cognitive deficits starting at 12 months in Morris water maze (MWM) performance
and spontaneous alternation in Y-maze (SAYM) (Dr Emily Clarke, personal communication,
Clarke, 2018; Appendix Figure A.1). Both hippocampal function and ACh signalling contribute to
performance in MWM (reviewed in McNamara and Skelton, 1993) and SAYM (reviewed in
Lalonde, 2002) . Lesion of the MS/VDB with 192 IgG-saporin injection impaired spatial working
memory performance as measured by SAYM in rats (Chang and Gold, 2004). Furthermore,
extensive lesion of the MS/VDB and nbM/SI also induced deficits in MWM performance (Leanza
et al., 1995). Nonetheless, 192-IgG has a low affinity to mouse p75NTR and there are differences
in the hippocampal cholinergic innervation patterns between the two rodents where rat CA1
cholinergic axon density is lower than that of mice (Aznavour et al., 2002). Lesion of the MS/VDB
in mice with anti-murine-p75NTR-saporin decreased hippocampal ChAT activity and impaired
cognitive performance aspects of the MWM (Berger-Sweeney et al., 2001). These lines of
evidence incentivised this project to include characterisation of hippocampal cholinergic
innervation in the D427V/WTGBA1 heterozygous mouse. There is strong evidence from selective
ablation of p75-positive BFCNs with 192IgG-saporin experiments indicating that cholinergic
outputs from BFCNs play an important role in adult hippocampal neurogenesis (Cooper-Kuhn et
al., 2004) and spatial memory performance (Mohapel et al., 2005). It should be noted
nonetheless that alterations in adult neurogenesis alone may have complex effects on spatial
memory such as strategy patterns (reviewed in Garthe and Kempermann, 2013) that cannot be
demonstrated in terms of traditional parameters alone such as latency, retention, and speed
(Saxe et al., 2006; Zhu et al., 2017). However, it is still within our interest to investigate adult
neurogenesis in the DG as a potential link between cholinergic signalling and spatial memory.
Furthermore, GCase is also highly expressed in both BFCNS and DGCs in macaques (Dopeso-
Reyes et al., 2018).
153 5.1.1 D427V GBA1 mutation and the heterozygous mouse model
This D427V/WTGBA1 heterozygous mouse model was first characterised together with its
homozygous counterpart, a model for Gaucher’s disease (GD) (Sardi et al., 2011) . While D427V
heterozygous and homozygous mice have lower GCase activity and higher α-synuclein
aggregates than the WT/WT at 6 mo, the D427V/D427V GBA1 was more severely affected with
approximately 68% reduction in GCase activity and 53.3% increase in α-synuclein aggregates
compared with the D427V/WT mice. Furthermore, only the homozygous D427V/D427V mice
have GlcSph accumulation and defects in hippocampal memory. Unlike GD patients, neither of
them has GlcCer accumulation (Nilsson and Svennerholm, 1982). Brain GlcSph level was
significantly higher in GD patients with neuronopathic symptoms than type 1 GD patients,
implicating neurotoxic effects of GlcSph (Orvisky et al., 2002). GlcSph has also been
demonstrated to induce and even shift α-synuclein aggregation equilibrium toward a β-sheet
containing oligomeric species (Taguchi et al., 2017). Nonetheless, a recent article reported that
GlcSph, unlike GlcCer, could not convert physiological HMW α-synuclein oligomer species into a
more compact and toxic proteinase K-resistant species (Zunke et al., 2017). The D427 SNPs in
the GBA1 gene in this mouse model correspond to the D409 SNPs in human, which include GD-
causing and DLB/PDD-associated mutations D409H. Homozygous D409V have been found in GD
patients but only in recombination with L444P (Theophilus et al., 1989; Latham et al., 1991).
D409V, nevertheless, has not been found in PD patients. D409V/D409V mice have lower GCase
activity than D409H/D409H and also have GD-like characteristics of GlcCer accumulation in the
liver, lung, and spleen at 6.5 mo albeit to lesser extents compared with D409V/null mice (Xu et
al., 2003). This number notation in mouse starts from the first residue of the 19-amino acid ER
signal sequence whereas the common notation in human starts from the functional form of
GCase after signal peptide cleavage. Because of the different start position together with an
additional H273 residue in human that is missing in mouse, the number describing the position
of D427 is hence larger than the position number of its equivalent human mutation D409 by 18.
Given the novelty of this mouse line and the potential as a model of Lewy body dementia and
our own studies demonstrating cognitive deficits, we hypothesized that this mice model may
have significant reduction in VAChT and ChAT in the DG and cortex, both IHC and WB wise
compared with the WT/WT. One marker could be more severely affected than the other. Deficits
in cholinergic axons could be accompanied by loss of BFCNs in the VDB/HDB. Lastly, as a
potential DLB model, it would have higher number of DCX-positive cells but lower number of
HuB/D-positive cells.
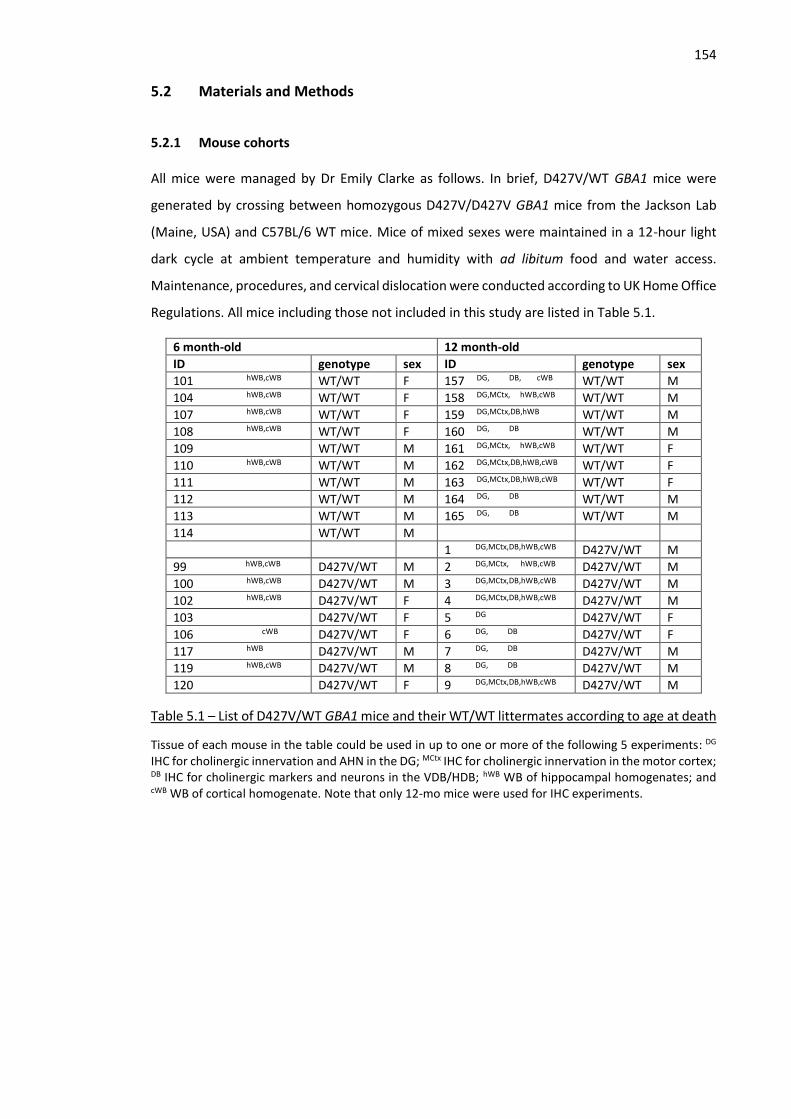
154
5.2 Materials and Methods
5.2.1 Mouse cohorts
All mice were managed by Dr Emily Clarke as follows. In brief, D427V/WT GBA1 mice were
generated by crossing between homozygous D427V/D427V GBA1 mice from the Jackson Lab
(Maine, USA) and C57BL/6 WT mice. Mice of mixed sexes were maintained in a 12-hour light
dark cycle at ambient temperature and humidity with ad libitum food and water access.
Maintenance, procedures, and cervical dislocation were conducted according to UK Home Office
Regulations. All mice including those not included in this study are listed in Table 5.1.
6 month-old 12 month-old
ID genotype sex ID genotype sex
101 hWB,cWB WT/WT F 157 DG, DB, cWB WT/WT M
104 hWB,cWB WT/WT F 158 DG,MCtx, hWB,cWB WT/WT M
107 hWB,cWB WT/WT F 159 DG,MCtx,DB,hWB WT/WT M
108 hWB,cWB WT/WT F 160 DG, DB WT/WT M
109 WT/WT M 161 DG,MCtx, hWB,cWB WT/WT F
110 hWB,cWB WT/WT M 162 DG,MCtx,DB,hWB,cWB WT/WT F
111 WT/WT M 163 DG,MCtx,DB,hWB,cWB WT/WT F
112 WT/WT M 164 DG, DB WT/WT M
113 WT/WT M 165 DG, DB WT/WT M
114 WT/WT M
1 DG,MCtx,DB,hWB,cWB D427V/WT M
99 hWB,cWB D427V/WT M 2 DG,MCtx, hWB,cWB D427V/WT M
100 hWB,cWB D427V/WT M 3 DG,MCtx,DB,hWB,cWB D427V/WT M
102 hWB,cWB D427V/WT F 4 DG,MCtx,DB,hWB,cWB D427V/WT M
103 D427V/WT F 5 DG D427V/WT F
106 cWB D427V/WT F 6 DG, DB D427V/WT F
117 hWB D427V/WT M 7 DG, DB D427V/WT M
119 hWB,cWB D427V/WT M 8 DG, DB D427V/WT M
120 D427V/WT F 9 DG,MCtx,DB,hWB,cWB D427V/WT M
Table 5.1 – List of D427V/WT GBA1 mice and their WT/WT littermates according to age at death
Tissue of each mouse in the table could be used in up to one or more of the following 5 experiments: DG IHC for cholinergic innervation and AHN in the DG; MCtx IHC for cholinergic innervation in the motor cortex; DB IHC for cholinergic markers and neurons in the VDB/HDB; hWB WB of hippocampal homogenates; and cWB WB of cortical homogenate. Note that only 12-mo mice were used for IHC experiments.
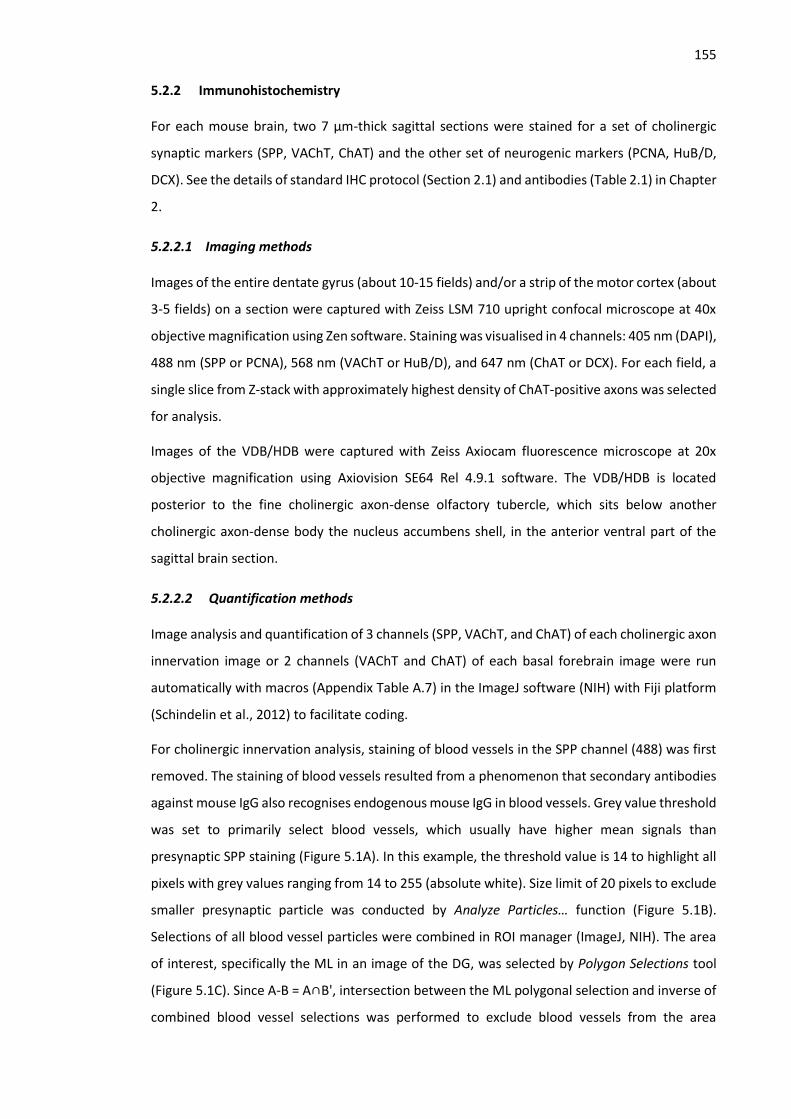
155 5.2.2 Immunohistochemistry
For each mouse brain, two 7 µm-thick sagittal sections were stained for a set of cholinergic
synaptic markers (SPP, VAChT, ChAT) and the other set of neurogenic markers (PCNA, HuB/D,
DCX). See the details of standard IHC protocol (Section 2.1) and antibodies (Table 2.1) in Chapter
2.
5.2.2.1 Imaging methods
Images of the entire dentate gyrus (about 10-15 fields) and/or a strip of the motor cortex (about
3-5 fields) on a section were captured with Zeiss LSM 710 upright confocal microscope at 40x
objective magnification using Zen software. Staining was visualised in 4 channels: 405 nm (DAPI),
488 nm (SPP or PCNA), 568 nm (VAChT or HuB/D), and 647 nm (ChAT or DCX). For each field, a
single slice from Z-stack with approximately highest density of ChAT-positive axons was selected
for analysis.
Images of the VDB/HDB were captured with Zeiss Axiocam fluorescence microscope at 20x
objective magnification using Axiovision SE64 Rel 4.9.1 software. The VDB/HDB is located
posterior to the fine cholinergic axon-dense olfactory tubercle, which sits below another
cholinergic axon-dense body the nucleus accumbens shell, in the anterior ventral part of the
sagittal brain section.
5.2.2.2 Quantification methods
Image analysis and quantification of 3 channels (SPP, VAChT, and ChAT) of each cholinergic axon
innervation image or 2 channels (VAChT and ChAT) of each basal forebrain image were run
automatically with macros (Appendix Table A.7) in the ImageJ software (NIH) with Fiji platform
(Schindelin et al., 2012) to facilitate coding.
For cholinergic innervation analysis, staining of blood vessels in the SPP channel (488) was first
removed. The staining of blood vessels resulted from a phenomenon that secondary antibodies
against mouse IgG also recognises endogenous mouse IgG in blood vessels. Grey value threshold
was set to primarily select blood vessels, which usually have higher mean signals than
presynaptic SPP staining (Figure 5.1A). In this example, the threshold value is 14 to highlight all
pixels with grey values ranging from 14 to 255 (absolute white). Size limit of 20 pixels to exclude
smaller presynaptic particle was conducted by Analyze Particles… function (Figure 5.1B).
Selections of all blood vessel particles were combined in ROI manager (ImageJ, NIH). The area
of interest, specifically the ML in an image of the DG, was selected by Polygon Selections tool
(Figure 5.1C). Since A-B = A∩B', intersection between the ML polygonal selection and inverse of
combined blood vessel selections was performed to exclude blood vessels from the area
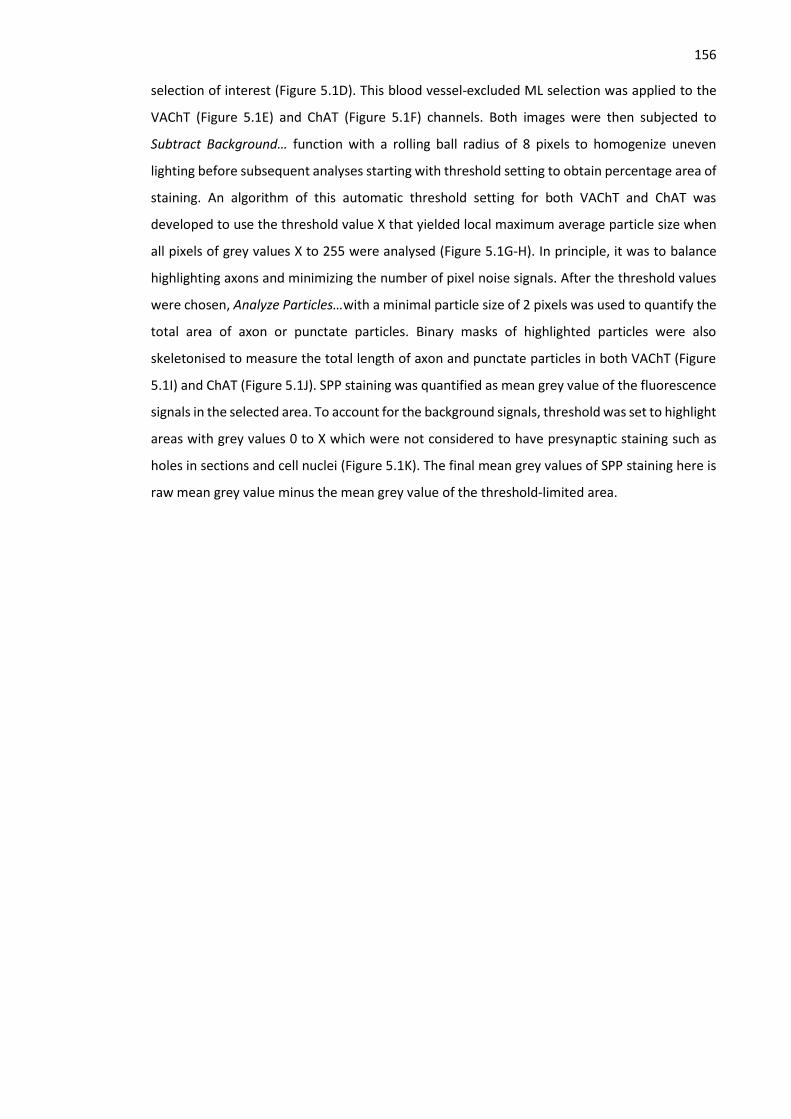
156 selection of interest (Figure 5.1D). This blood vessel-excluded ML selection was applied to the
VAChT (Figure 5.1E) and ChAT (Figure 5.1F) channels. Both images were then subjected to
Subtract Background… function with a rolling ball radius of 8 pixels to homogenize uneven
lighting before subsequent analyses starting with threshold setting to obtain percentage area of
staining. An algorithm of this automatic threshold setting for both VAChT and ChAT was
developed to use the threshold value X that yielded local maximum average particle size when
all pixels of grey values X to 255 were analysed (Figure 5.1G-H). In principle, it was to balance
highlighting axons and minimizing the number of pixel noise signals. After the threshold values
were chosen, Analyze Particles…with a minimal particle size of 2 pixels was used to quantify the
total area of axon or punctate particles. Binary masks of highlighted particles were also
skeletonised to measure the total length of axon and punctate particles in both VAChT (Figure
5.1I) and ChAT (Figure 5.1J). SPP staining was quantified as mean grey value of the fluorescence
signals in the selected area. To account for the background signals, threshold was set to highlight
areas with grey values 0 to X which were not considered to have presynaptic staining such as
holes in sections and cell nuclei (Figure 5.1K). The final mean grey values of SPP staining here is
raw mean grey value minus the mean grey value of the threshold-limited area.
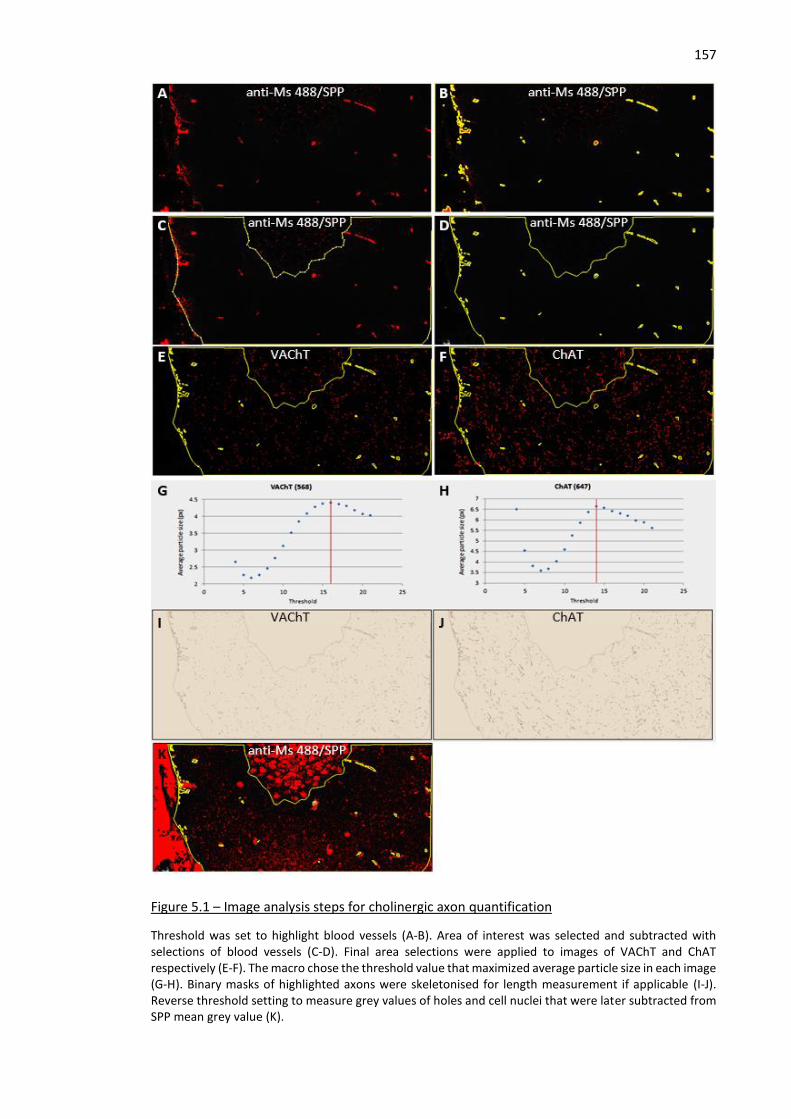
157
Figure 5.1 – Image analysis steps for cholinergic axon quantification
Threshold was set to highlight blood vessels (A-B). Area of interest was selected and subtracted with selections of blood vessels (C-D). Final area selections were applied to images of VAChT and ChAT respectively (E-F). The macro chose the threshold value that maximized average particle size in each image (G-H). Binary masks of highlighted axons were skeletonised for length measurement if applicable (I-J). Reverse threshold setting to measure grey values of holes and cell nuclei that were later subtracted from SPP mean grey value (K).
158 Images of VDB/HDB were first subjected to Subtract Background… with a rolling ball radius of
30 µm to eliminate uneven background lighting. In ChAT staining images, the threshold was set
to highlight ChAT-positive cell bodies and neurites. Cell bodies were selected by Analyze
Particle… with a minimal size of 500 pixels or 52.6 µm2. Staining signal intensity as mean grey
values of both VAChT and ChAT were measured within these selections of ChAT-positive cell
body particles (Figure 5.10C-D). ChAT-positive neurite density was measured as area of staining
at the same threshold was measured minus the total area of cell body particle selections. For
VAChT-positive neurite density, the threshold value, not necessarily the same as that for ChAT,
was set to measure percentage area of staining. However, the total area of particle with
minimum size of 200 pixels instead of 500 pixels was subtracted from the area of VAChT staining
to exclude non-specific staining in nuclei of other cells. The percentage area of staining was
divided by cell particle density (specifically the number of cell particles per 0.1 mm2 area). From
this point onward, neurite or puncta density, unless specified as punctate particle density, was
defined as percentage area of staining but cell or particle density is defined as the number of
cells or particles per area unit.
5.2.3 Western blotting
Full details of Western blotting protocol (Section 2.2) and antibodies (Table 2.2) are provided
elsewhere (chapter 2). All antibodies showed bands of the corresponding size previously
reported or described in manufacturer’s datasheets. WB bands of SPP had the size of 38 kDa
and do not overlap with the bands of mouse endogenous 52 kDa-IgG heavy chain (HC) and 25
kDa-IgG light chain (LC), which were expectedly visualised in a negative control condition with
only secondary antibody anti-mouse and no primary antibody.
5.2.4 Statistical analysis
Differences in variables between D427V/WT GBA1 and WT/WT mice were analysed by Student’s
t-test with Welch’s correction if the variable data is normally distributed or by Mann-Whitney
U-test if the data is not normally distributed. Normality of distribution of the data was examined
by Shapiro-Wilk test. Statistical analyses above were conducted in GraphPad Prism 8.0.0 except
as described below.
For Western blotting data, two-way ANOVA was used to assess the effects of age, group, or the
interaction of both on levels of proteins of interest. For each protein, four pairs of comparison
with Student’s t-test with Welch’s correction were conducted: WT/WT vs D427V/WT in both age
groups and 6 mo vs 12 mo in both genotypic groups. Four p-values were adjusted with two-stage
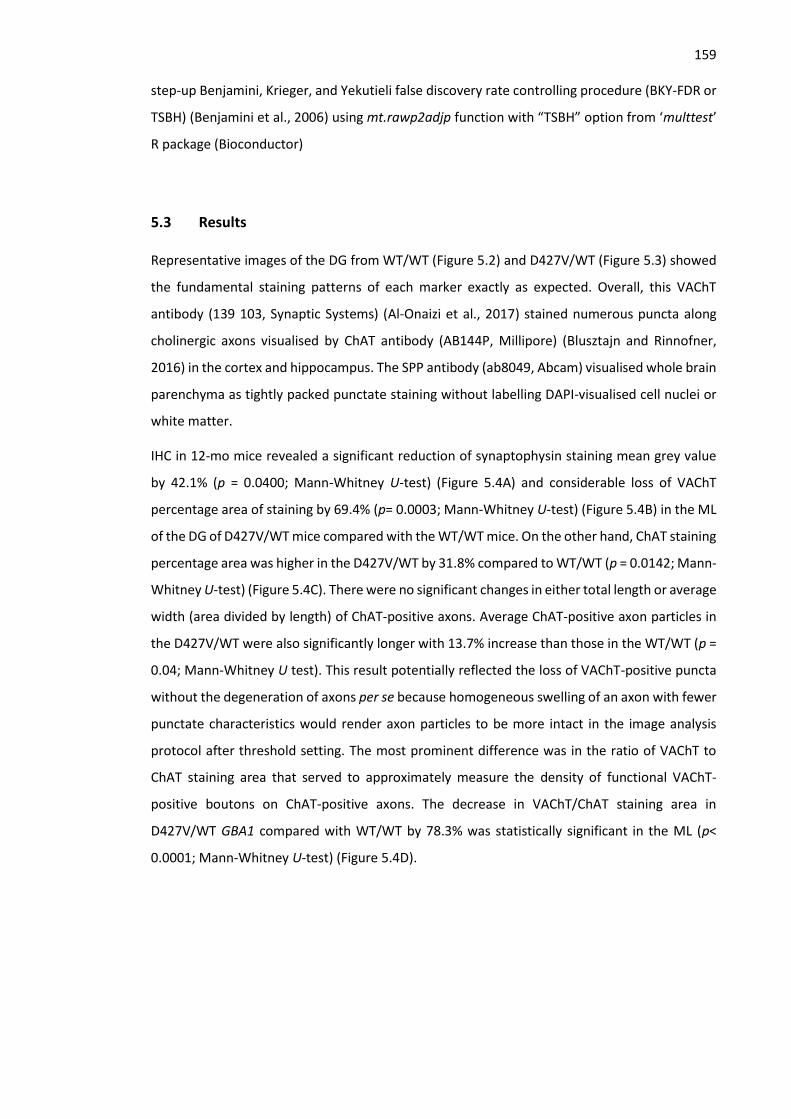
159 step-up Benjamini, Krieger, and Yekutieli false discovery rate controlling procedure (BKY-FDR or
TSBH) (Benjamini et al., 2006) using mt.rawp2adjp function with “TSBH” option from ‘multtest’
R package (Bioconductor)
5.3 Results
Representative images of the DG from WT/WT (Figure 5.2) and D427V/WT (Figure 5.3) showed
the fundamental staining patterns of each marker exactly as expected. Overall, this VAChT
antibody (139 103, Synaptic Systems) (Al-Onaizi et al., 2017) stained numerous puncta along
cholinergic axons visualised by ChAT antibody (AB144P, Millipore) (Blusztajn and Rinnofner,
2016) in the cortex and hippocampus. The SPP antibody (ab8049, Abcam) visualised whole brain
parenchyma as tightly packed punctate staining without labelling DAPI-visualised cell nuclei or
white matter.
IHC in 12-mo mice revealed a significant reduction of synaptophysin staining mean grey value
by 42.1% (p = 0.0400; Mann-Whitney U-test) (Figure 5.4A) and considerable loss of VAChT
percentage area of staining by 69.4% (p= 0.0003; Mann-Whitney U-test) (Figure 5.4B) in the ML
of the DG of D427V/WT mice compared with the WT/WT mice. On the other hand, ChAT staining
percentage area was higher in the D427V/WT by 31.8% compared to WT/WT (p = 0.0142; Mann-
Whitney U-test) (Figure 5.4C). There were no significant changes in either total length or average
width (area divided by length) of ChAT-positive axons. Average ChAT-positive axon particles in
the D427V/WT were also significantly longer with 13.7% increase than those in the WT/WT (p =
0.04; Mann-Whitney U test). This result potentially reflected the loss of VAChT-positive puncta
without the degeneration of axons per se because homogeneous swelling of an axon with fewer
punctate characteristics would render axon particles to be more intact in the image analysis
protocol after threshold setting. The most prominent difference was in the ratio of VAChT to
ChAT staining area that served to approximately measure the density of functional VAChT-
positive boutons on ChAT-positive axons. The decrease in VAChT/ChAT staining area in
D427V/WT GBA1 compared with WT/WT by 78.3% was statistically significant in the ML (p<
0.0001; Mann-Whitney U-test) (Figure 5.4D).
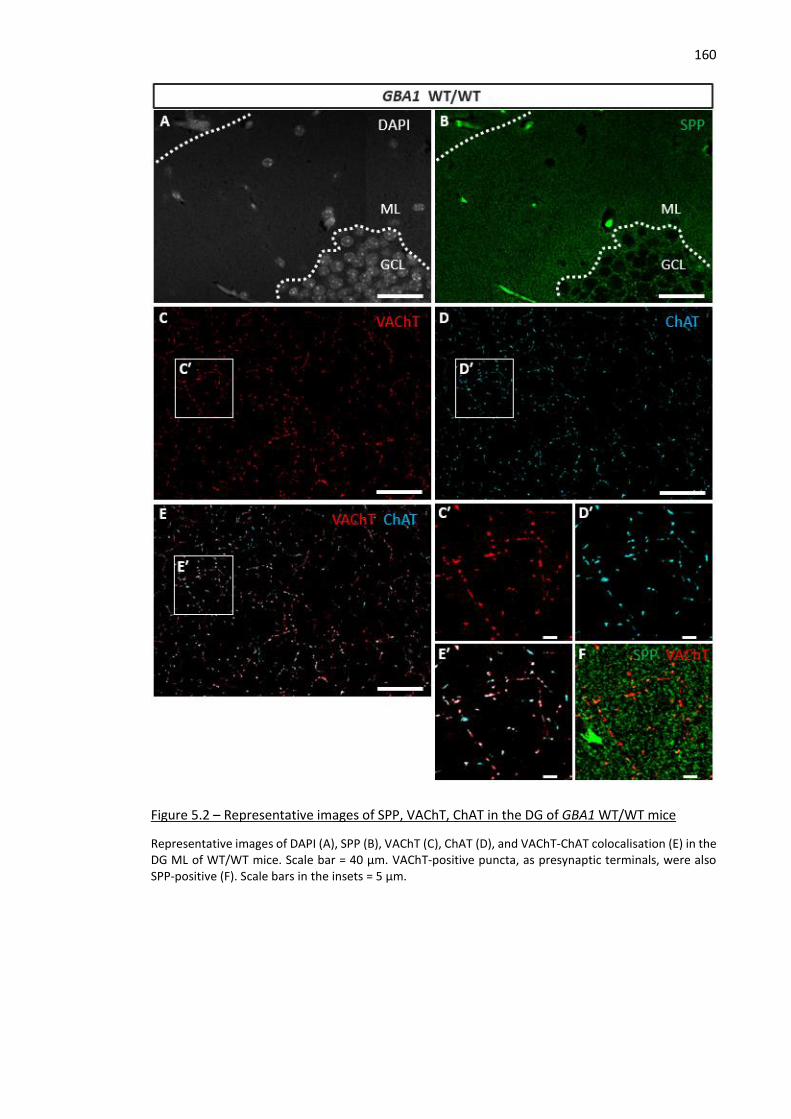
160
Figure 5.2 – Representative images of SPP, VAChT, ChAT in the DG of GBA1 WT/WT mice
Representative images of DAPI (A), SPP (B), VAChT (C), ChAT (D), and VAChT-ChAT colocalisation (E) in the DG ML of WT/WT mice. Scale bar = 40 µm. VAChT-positive puncta, as presynaptic terminals, were also SPP-positive (F). Scale bars in the insets = 5 µm.
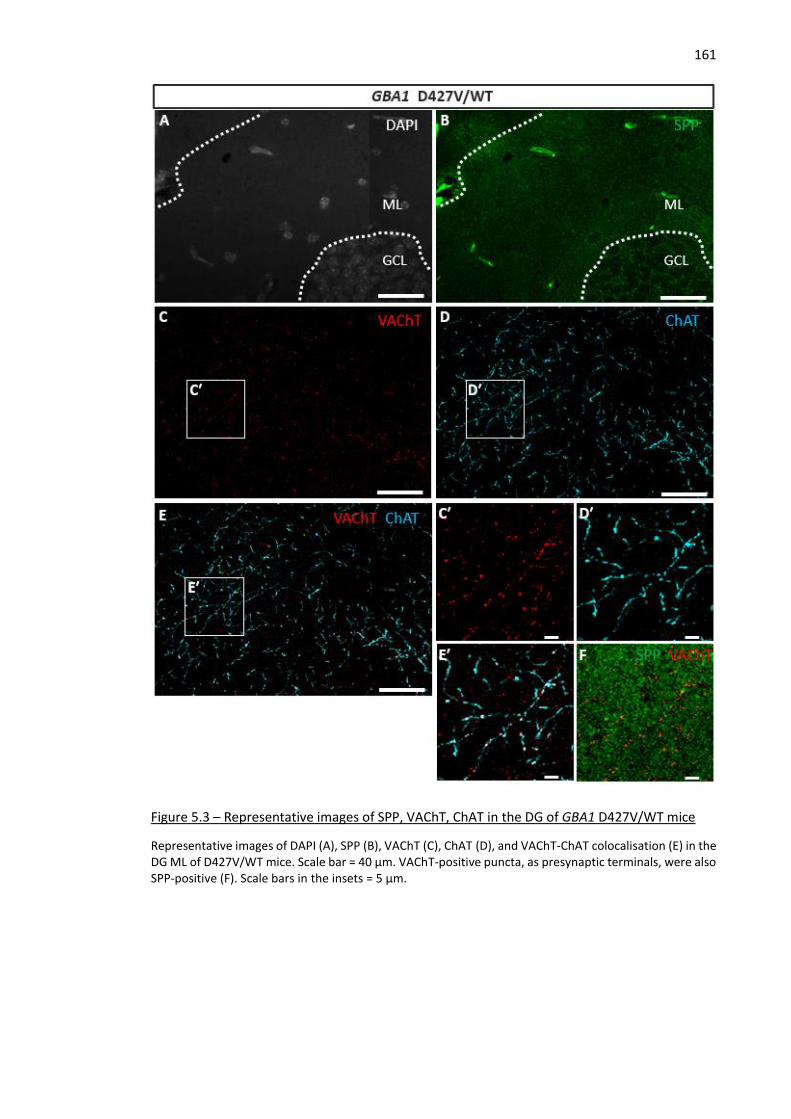
161
Figure 5.3 – Representative images of SPP, VAChT, ChAT in the DG of GBA1 D427V/WT mice
Representative images of DAPI (A), SPP (B), VAChT (C), ChAT (D), and VAChT-ChAT colocalisation (E) in the DG ML of D427V/WT mice. Scale bar = 40 µm. VAChT-positive puncta, as presynaptic terminals, were also SPP-positive (F). Scale bars in the insets = 5 µm.
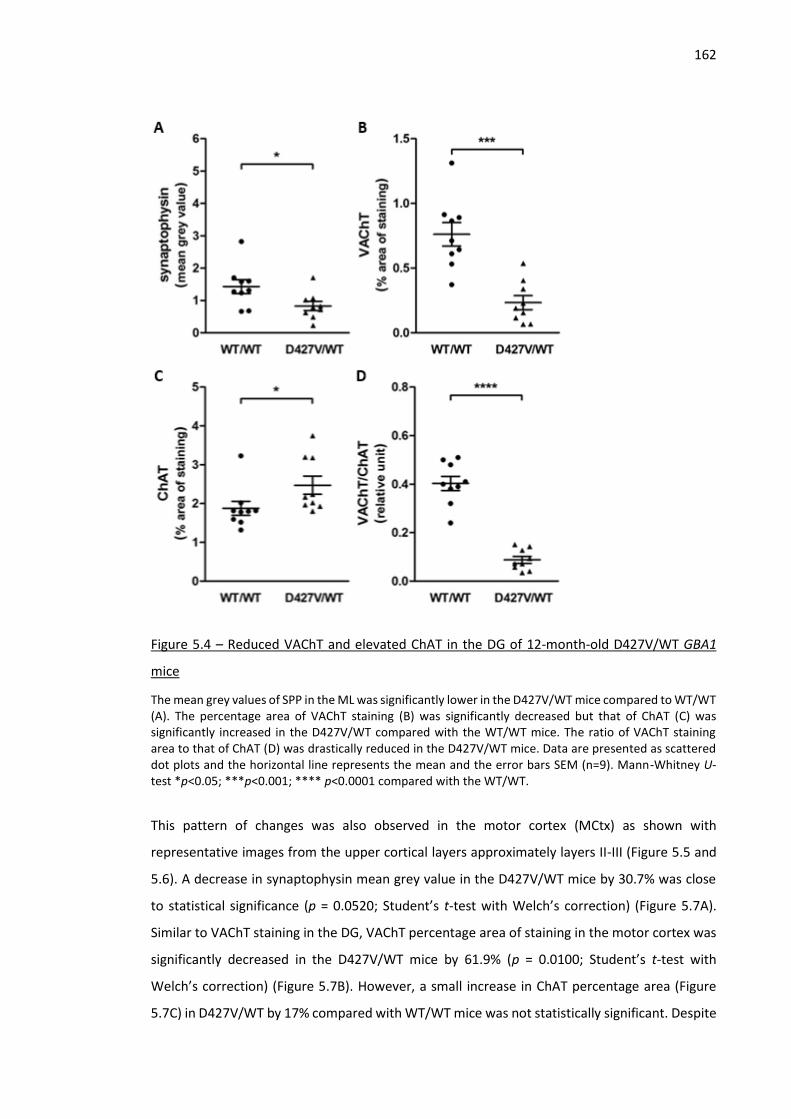
162
Figure 5.4 – Reduced VAChT and elevated ChAT in the DG of 12-month-old D427V/WT GBA1
mice
The mean grey values of SPP in the ML was significantly lower in the D427V/WT mice compared to WT/WT (A). The percentage area of VAChT staining (B) was significantly decreased but that of ChAT (C) was significantly increased in the D427V/WT compared with the WT/WT mice. The ratio of VAChT staining area to that of ChAT (D) was drastically reduced in the D427V/WT mice. Data are presented as scattered dot plots and the horizontal line represents the mean and the error bars SEM (n=9). Mann-Whitney U-test *p<0.05; ***p<0.001; **** p<0.0001 compared with the WT/WT.
This pattern of changes was also observed in the motor cortex (MCtx) as shown with
representative images from the upper cortical layers approximately layers II-III (Figure 5.5 and
5.6). A decrease in synaptophysin mean grey value in the D427V/WT mice by 30.7% was close
to statistical significance (p = 0.0520; Student’s t-test with Welch’s correction) (Figure 5.7A).
Similar to VAChT staining in the DG, VAChT percentage area of staining in the motor cortex was
significantly decreased in the D427V/WT mice by 61.9% (p = 0.0100; Student’s t-test with
Welch’s correction) (Figure 5.7B). However, a small increase in ChAT percentage area (Figure
5.7C) in D427V/WT by 17% compared with WT/WT mice was not statistically significant. Despite
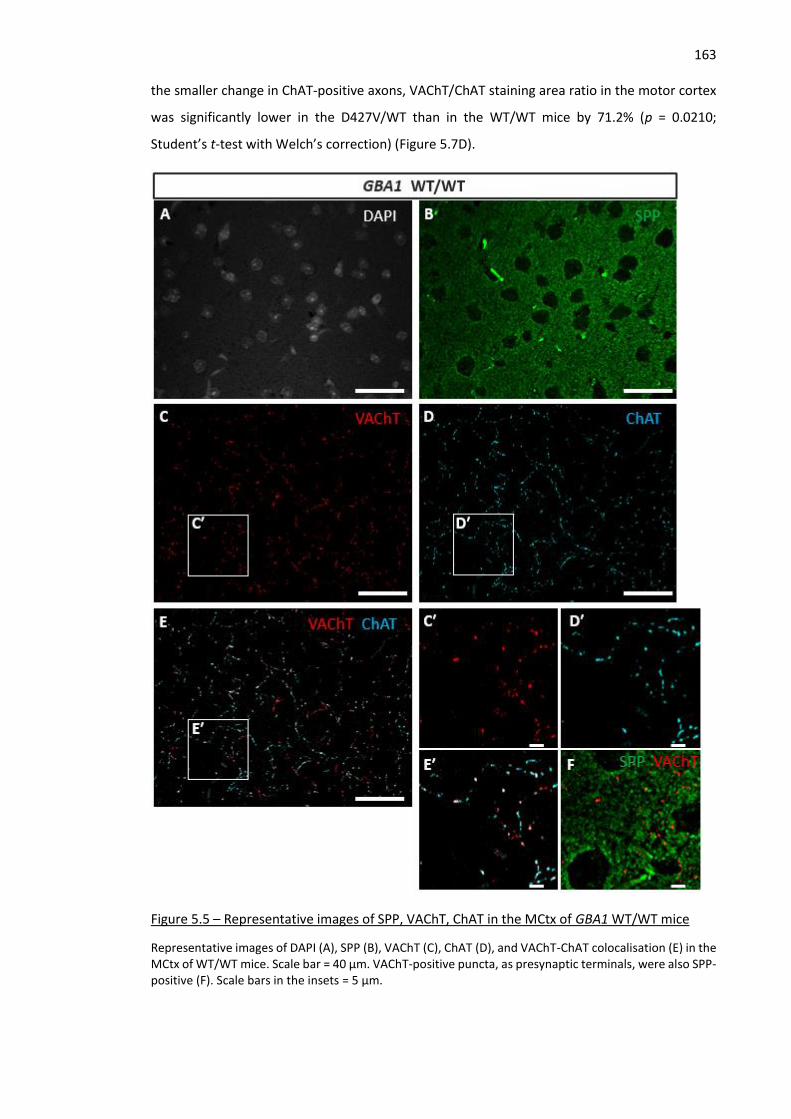
163 the smaller change in ChAT-positive axons, VAChT/ChAT staining area ratio in the motor cortex
was significantly lower in the D427V/WT than in the WT/WT mice by 71.2% (p = 0.0210;
Student’s t-test with Welch’s correction) (Figure 5.7D).
Figure 5.5 – Representative images of SPP, VAChT, ChAT in the MCtx of GBA1 WT/WT mice
Representative images of DAPI (A), SPP (B), VAChT (C), ChAT (D), and VAChT-ChAT colocalisation (E) in the MCtx of WT/WT mice. Scale bar = 40 µm. VAChT-positive puncta, as presynaptic terminals, were also SPP-positive (F). Scale bars in the insets = 5 µm.
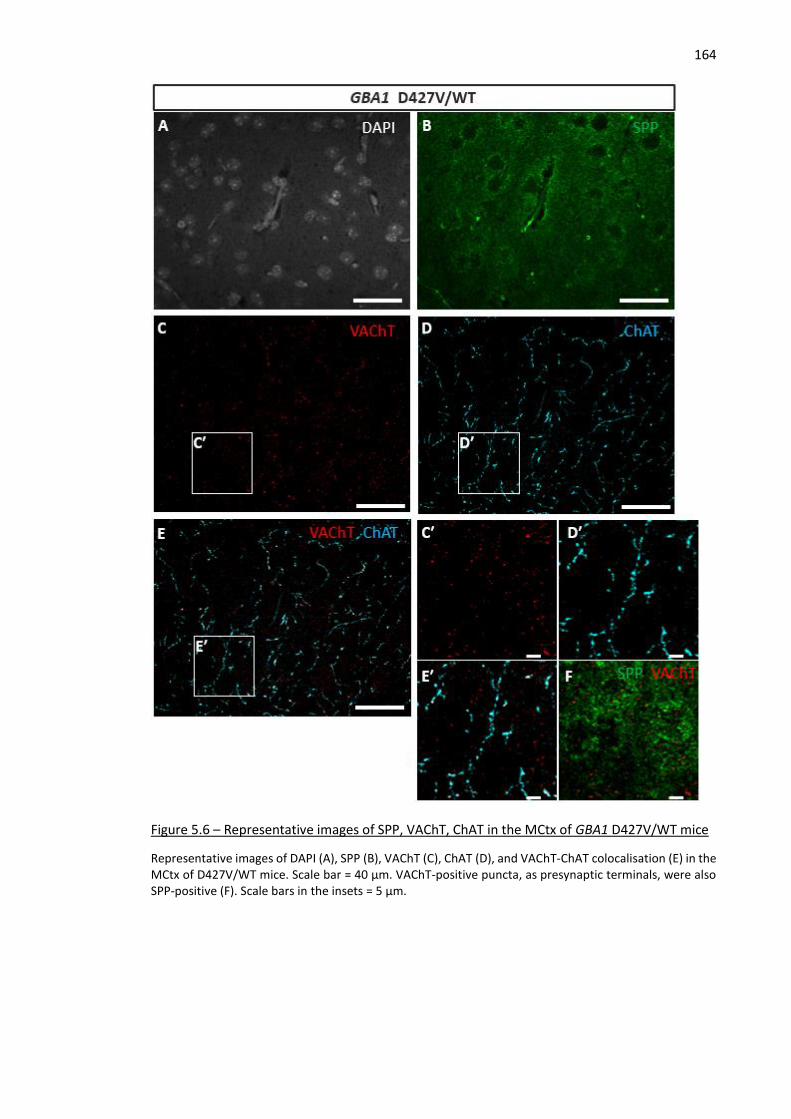
164
Figure 5.6 – Representative images of SPP, VAChT, ChAT in the MCtx of GBA1 D427V/WT mice
Representative images of DAPI (A), SPP (B), VAChT (C), ChAT (D), and VAChT-ChAT colocalisation (E) in the MCtx of D427V/WT mice. Scale bar = 40 µm. VAChT-positive puncta, as presynaptic terminals, were also SPP-positive (F). Scale bars in the insets = 5 µm.
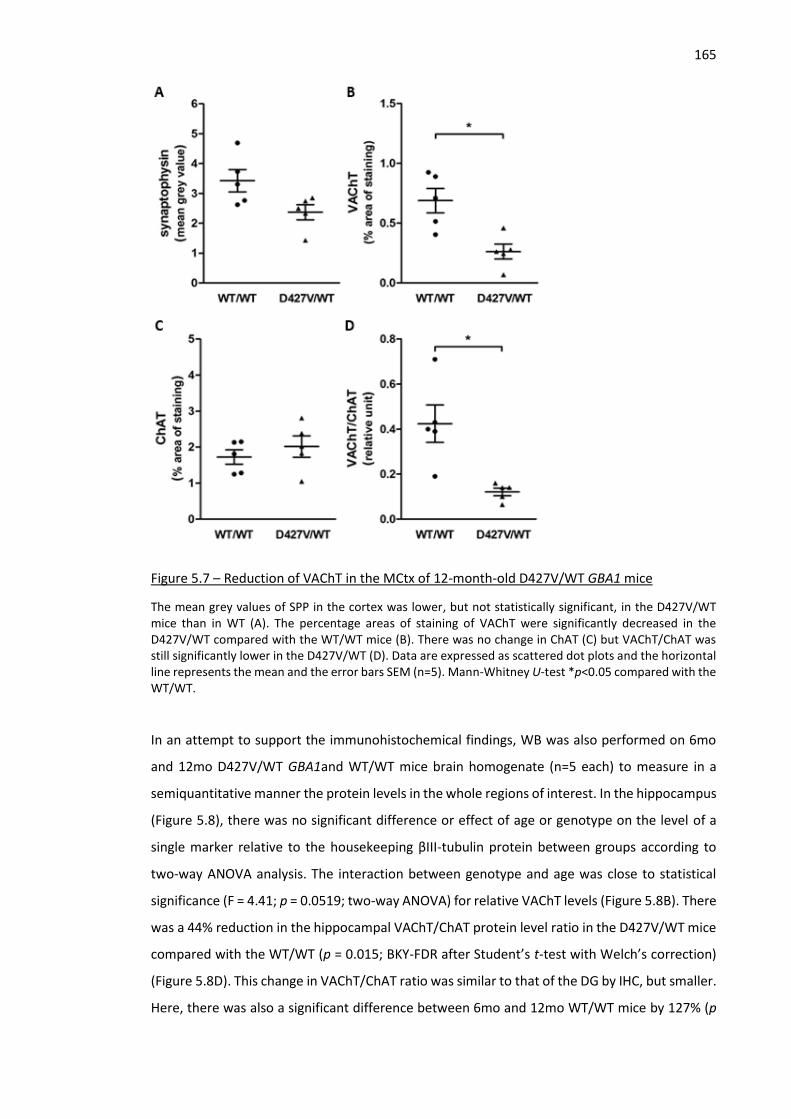
165
Figure 5.7 – Reduction of VAChT in the MCtx of 12-month-old D427V/WT GBA1 mice
The mean grey values of SPP in the cortex was lower, but not statistically significant, in the D427V/WT mice than in WT (A). The percentage areas of staining of VAChT were significantly decreased in the D427V/WT compared with the WT/WT mice (B). There was no change in ChAT (C) but VAChT/ChAT was still significantly lower in the D427V/WT (D). Data are expressed as scattered dot plots and the horizontal line represents the mean and the error bars SEM (n=5). Mann-Whitney U-test *p<0.05 compared with the WT/WT.
In an attempt to support the immunohistochemical findings, WB was also performed on 6mo
and 12mo D427V/WT GBA1and WT/WT mice brain homogenate (n=5 each) to measure in a
semiquantitative manner the protein levels in the whole regions of interest. In the hippocampus
(Figure 5.8), there was no significant difference or effect of age or genotype on the level of a
single marker relative to the housekeeping βIII-tubulin protein between groups according to
two-way ANOVA analysis. The interaction between genotype and age was close to statistical
significance (F = 4.41; p = 0.0519; two-way ANOVA) for relative VAChT levels (Figure 5.8B). There
was a 44% reduction in the hippocampal VAChT/ChAT protein level ratio in the D427V/WT mice
compared with the WT/WT (p = 0.015; BKY-FDR after Student’s t-test with Welch’s correction)
(Figure 5.8D). This change in VAChT/ChAT ratio was similar to that of the DG by IHC, but smaller.
Here, there was also a significant difference between 6mo and 12mo WT/WT mice by 127% (p

166 = 0.002; BKY-FDR after Student’s t-test with Welch’s correction) (Figure 5.8D). Two-way ANOVA
also confirmed the significant effects of each variable: interaction (p = 0.0107), genotype (p =
0.0355), and age (p = 0.0022). There was no significant change or effect in any proteins of
interest in the cortex (Figure 5.9). However, there was a significant effect of age on βIII-tubulin
(p = 0.0002) with significant pairwise difference between 6mo and 12mo WT/WT (p = 0.015;
BKY-FDR after Student’s t-test with Welch’s correction) (Figure 5.9F).
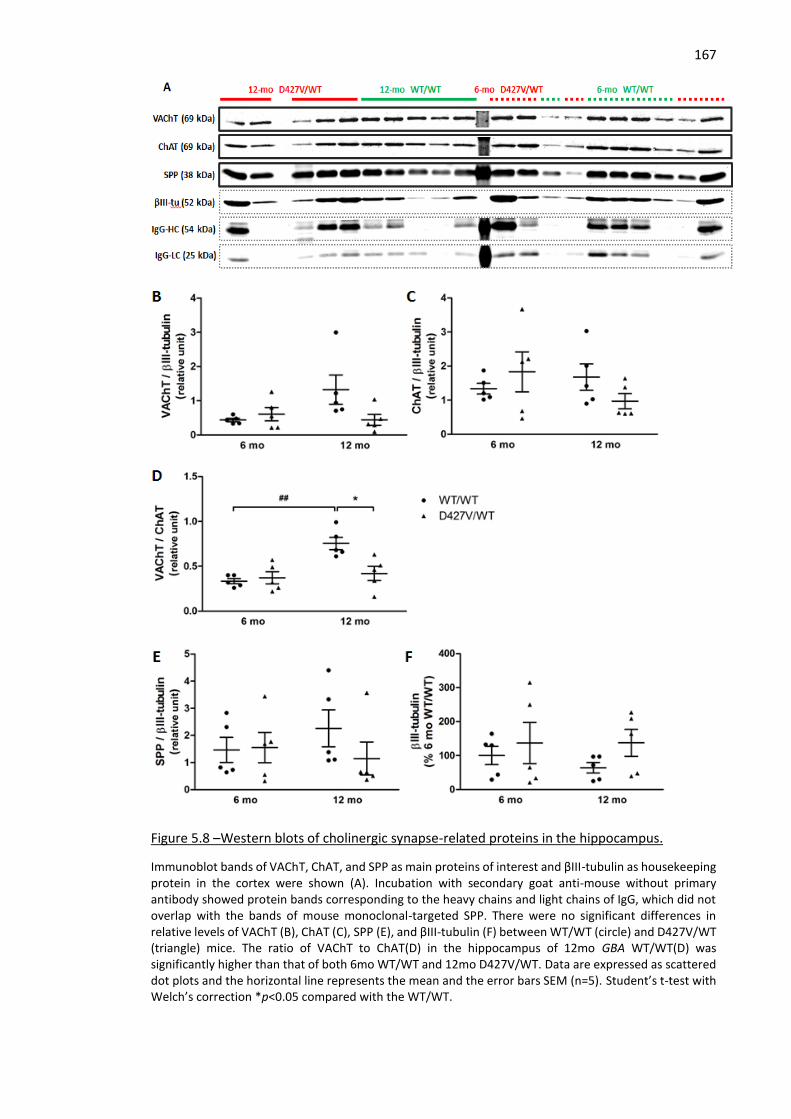
167
Figure 5.8 –Western blots of cholinergic synapse-related proteins in the hippocampus.
Immunoblot bands of VAChT, ChAT, and SPP as main proteins of interest and βIII-tubulin as housekeeping protein in the cortex were shown (A). Incubation with secondary goat anti-mouse without primary antibody showed protein bands corresponding to the heavy chains and light chains of IgG, which did not overlap with the bands of mouse monoclonal-targeted SPP. There were no significant differences in relative levels of VAChT (B), ChAT (C), SPP (E), and βIII-tubulin (F) between WT/WT (circle) and D427V/WT (triangle) mice. The ratio of VAChT to ChAT(D) in the hippocampus of 12mo GBA WT/WT(D) was significantly higher than that of both 6mo WT/WT and 12mo D427V/WT. Data are expressed as scattered dot plots and the horizontal line represents the mean and the error bars SEM (n=5). Student’s t-test with Welch’s correction *p<0.05 compared with the WT/WT.
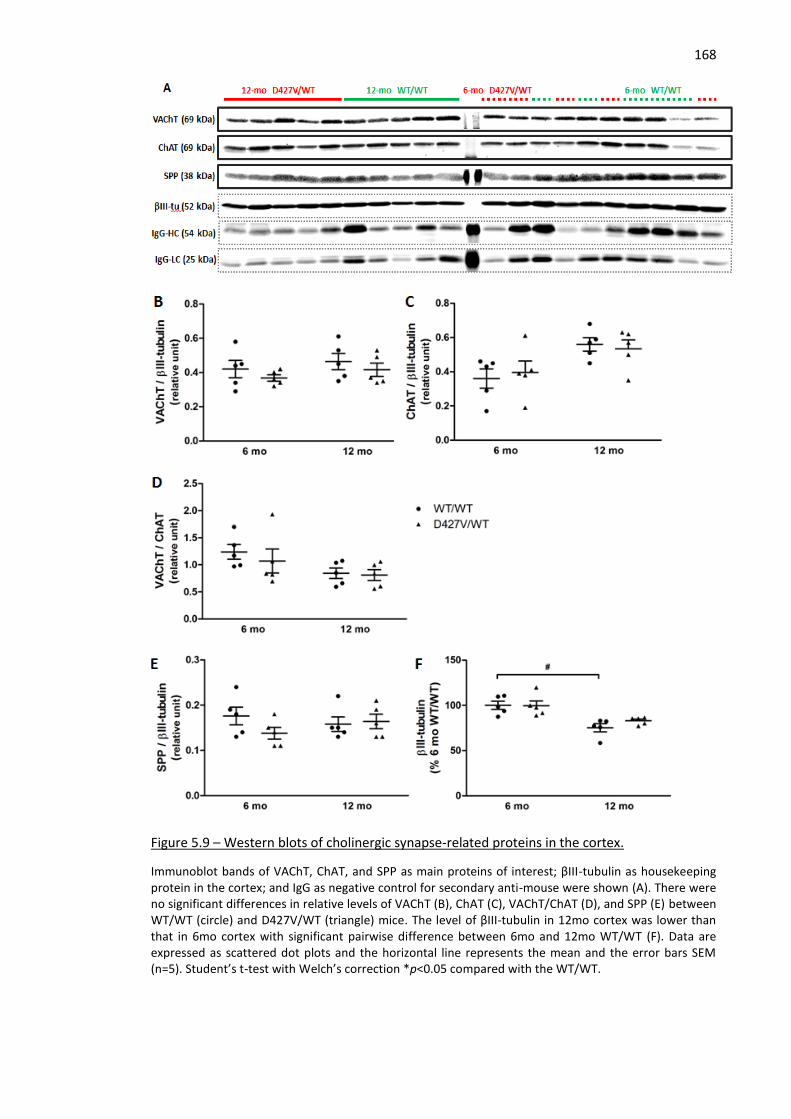
168
Figure 5.9 – Western blots of cholinergic synapse-related proteins in the cortex.
Immunoblot bands of VAChT, ChAT, and SPP as main proteins of interest; βIII-tubulin as housekeeping protein in the cortex; and IgG as negative control for secondary anti-mouse were shown (A). There were no significant differences in relative levels of VAChT (B), ChAT (C), VAChT/ChAT (D), and SPP (E) between WT/WT (circle) and D427V/WT (triangle) mice. The level of βIII-tubulin in 12mo cortex was lower than that in 6mo cortex with significant pairwise difference between 6mo and 12mo WT/WT (F). Data are expressed as scattered dot plots and the horizontal line represents the mean and the error bars SEM (n=5). Student’s t-test with Welch’s correction *p<0.05 compared with the WT/WT.
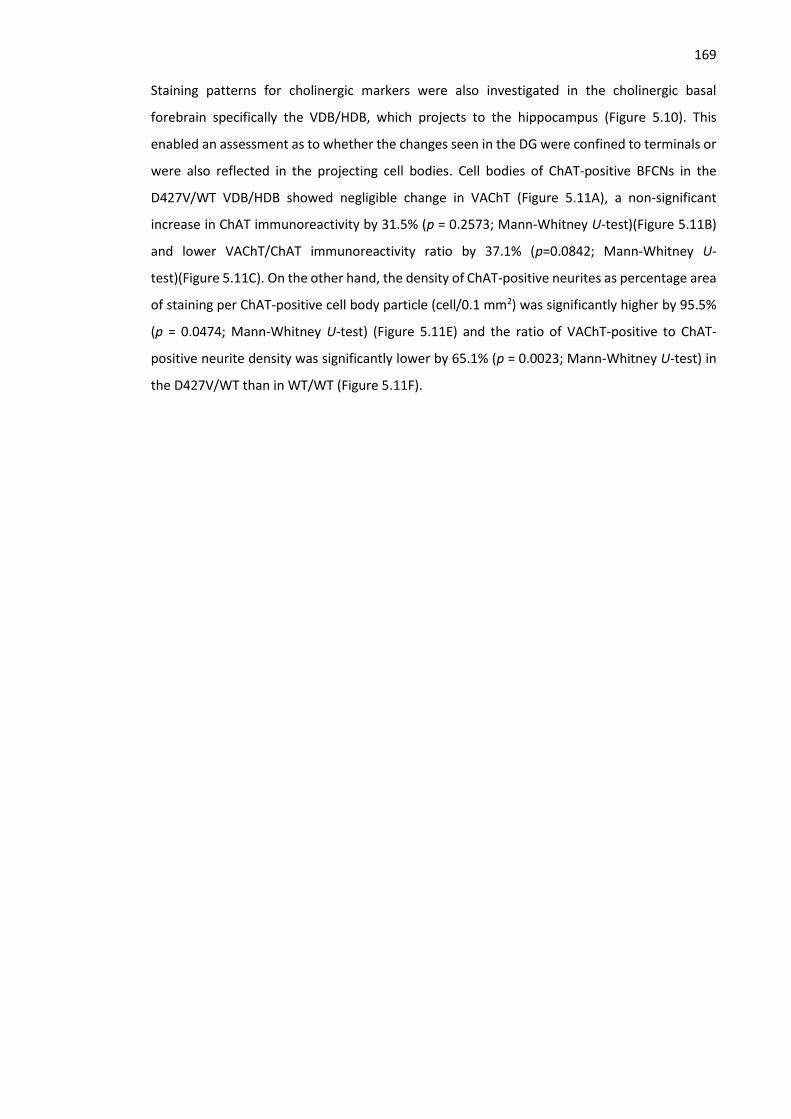
169 Staining patterns for cholinergic markers were also investigated in the cholinergic basal
forebrain specifically the VDB/HDB, which projects to the hippocampus (Figure 5.10). This
enabled an assessment as to whether the changes seen in the DG were confined to terminals or
were also reflected in the projecting cell bodies. Cell bodies of ChAT-positive BFCNs in the
D427V/WT VDB/HDB showed negligible change in VAChT (Figure 5.11A), a non-significant
increase in ChAT immunoreactivity by 31.5% (p = 0.2573; Mann-Whitney U-test)(Figure 5.11B)
and lower VAChT/ChAT immunoreactivity ratio by 37.1% (p=0.0842; Mann-Whitney U-
test)(Figure 5.11C). On the other hand, the density of ChAT-positive neurites as percentage area
of staining per ChAT-positive cell body particle (cell/0.1 mm2) was significantly higher by 95.5%
(p = 0.0474; Mann-Whitney U-test) (Figure 5.11E) and the ratio of VAChT-positive to ChAT-
positive neurite density was significantly lower by 65.1% (p = 0.0023; Mann-Whitney U-test) in
the D427V/WT than in WT/WT (Figure 5.11F).
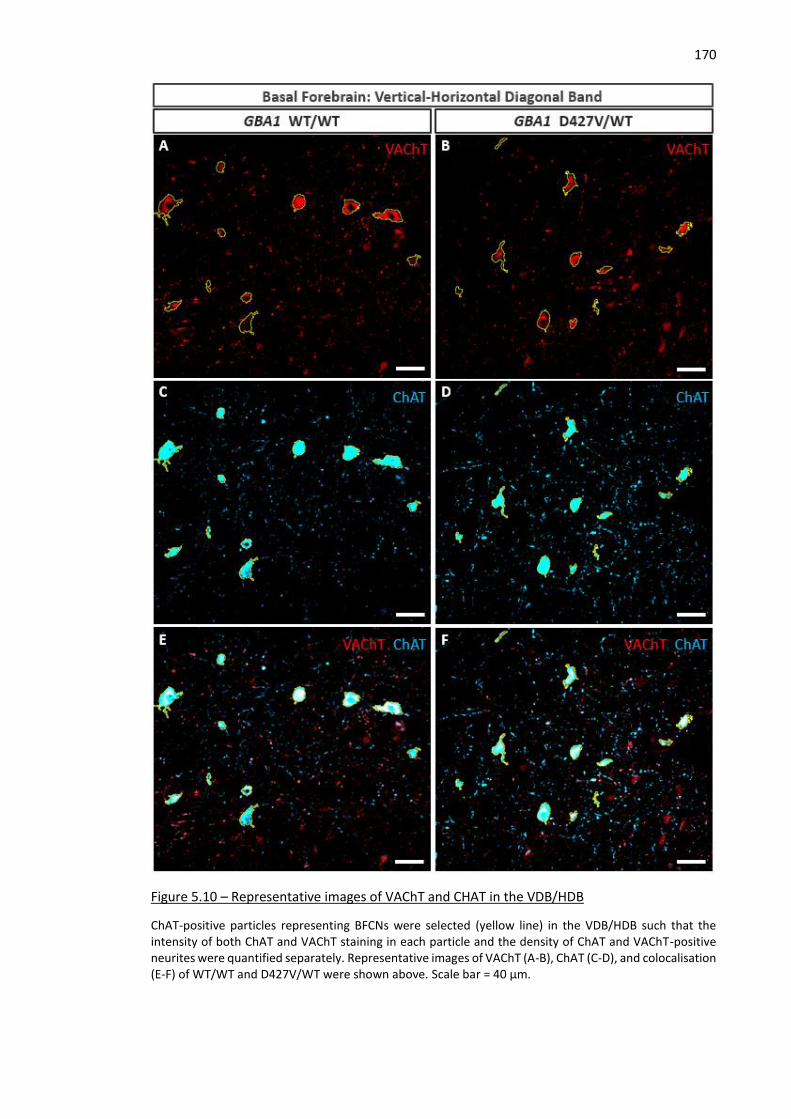
170
Figure 5.10 – Representative images of VAChT and CHAT in the VDB/HDB
ChAT-positive particles representing BFCNs were selected (yellow line) in the VDB/HDB such that the intensity of both ChAT and VAChT staining in each particle and the density of ChAT and VAChT-positive neurites were quantified separately. Representative images of VAChT (A-B), ChAT (C-D), and colocalisation (E-F) of WT/WT and D427V/WT were shown above. Scale bar = 40 µm.
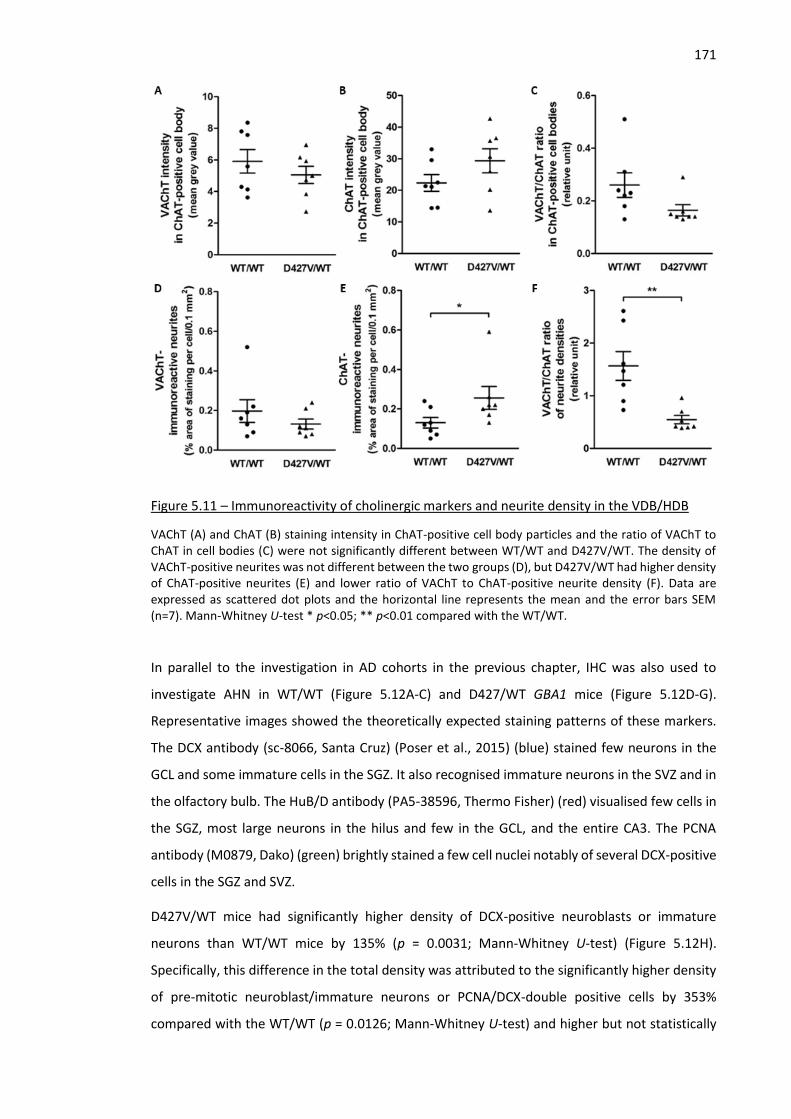
171
Figure 5.11 – Immunoreactivity of cholinergic markers and neurite density in the VDB/HDB
VAChT (A) and ChAT (B) staining intensity in ChAT-positive cell body particles and the ratio of VAChT to ChAT in cell bodies (C) were not significantly different between WT/WT and D427V/WT. The density of VAChT-positive neurites was not different between the two groups (D), but D427V/WT had higher density of ChAT-positive neurites (E) and lower ratio of VAChT to ChAT-positive neurite density (F). Data are expressed as scattered dot plots and the horizontal line represents the mean and the error bars SEM (n=7). Mann-Whitney U-test * p<0.05; ** p<0.01 compared with the WT/WT.
In parallel to the investigation in AD cohorts in the previous chapter, IHC was also used to
investigate AHN in WT/WT (Figure 5.12A-C) and D427/WT GBA1 mice (Figure 5.12D-G).
Representative images showed the theoretically expected staining patterns of these markers.
The DCX antibody (sc-8066, Santa Cruz) (Poser et al., 2015) (blue) stained few neurons in the
GCL and some immature cells in the SGZ. It also recognised immature neurons in the SVZ and in
the olfactory bulb. The HuB/D antibody (PA5-38596, Thermo Fisher) (red) visualised few cells in
the SGZ, most large neurons in the hilus and few in the GCL, and the entire CA3. The PCNA
antibody (M0879, Dako) (green) brightly stained a few cell nuclei notably of several DCX-positive
cells in the SGZ and SVZ.
D427V/WT mice had significantly higher density of DCX-positive neuroblasts or immature
neurons than WT/WT mice by 135% (p = 0.0031; Mann-Whitney U-test) (Figure 5.12H).
Specifically, this difference in the total density was attributed to the significantly higher density
of pre-mitotic neuroblast/immature neurons or PCNA/DCX-double positive cells by 353%
compared with the WT/WT (p = 0.0126; Mann-Whitney U-test) and higher but not statistically

172 significant density of post-mitotic population or PCNA-negative DCX-positive cells by 84.2% (p =
0.1325; Mann-Whitney U-test). The number of total HuB/D positive cells was higher than the
total number of DCX-positive cells in both groups but there was no significant difference in
PCNA-negative or PCNA/ HuB/D-double positive cells between groups (Figure 5.12I). In relation
to cholinergic innervation, only the density of PCNA-positive DCX-positive cells (rs = -0.662, p =
0.003; Spearman correlation) and total DCX-positive cells (rs = -0.629, p = 0.005; Spearman
correlation) were inversely correlated with VAChT staining percentage area.
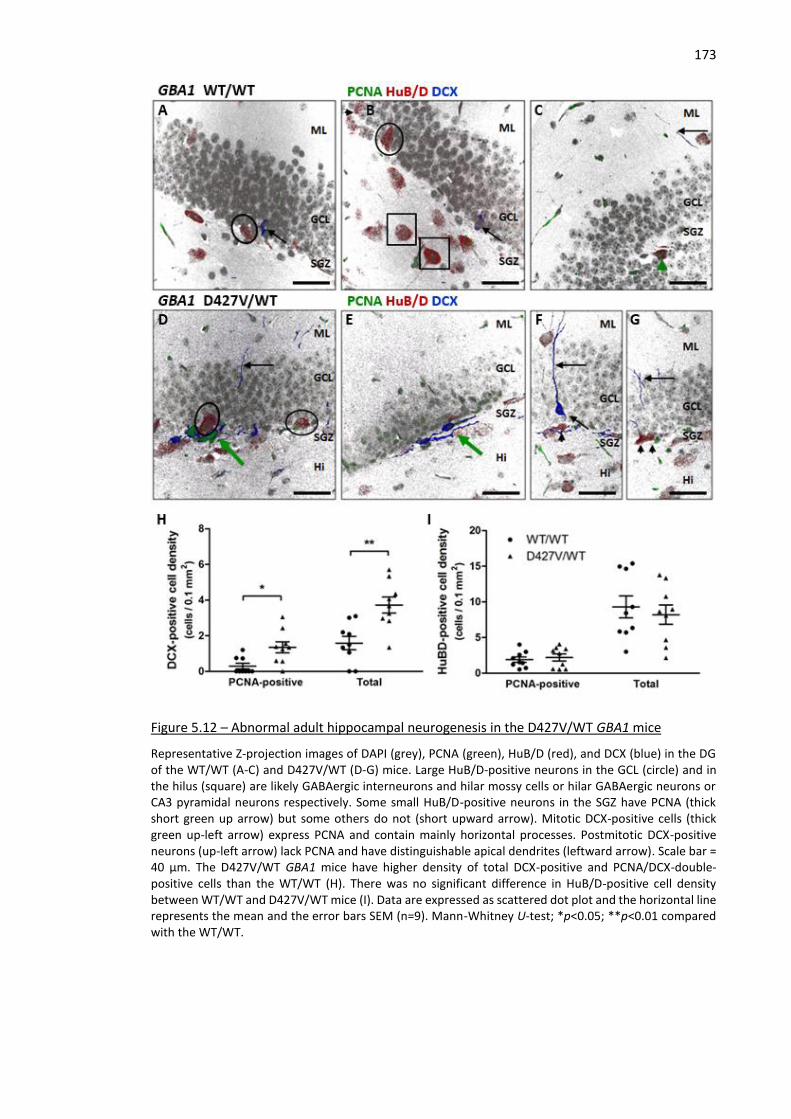
173
Figure 5.12 – Abnormal adult hippocampal neurogenesis in the D427V/WT GBA1 mice
Representative Z-projection images of DAPI (grey), PCNA (green), HuB/D (red), and DCX (blue) in the DG of the WT/WT (A-C) and D427V/WT (D-G) mice. Large HuB/D-positive neurons in the GCL (circle) and in the hilus (square) are likely GABAergic interneurons and hilar mossy cells or hilar GABAergic neurons or CA3 pyramidal neurons respectively. Some small HuB/D-positive neurons in the SGZ have PCNA (thick short green up arrow) but some others do not (short upward arrow). Mitotic DCX-positive cells (thick green up-left arrow) express PCNA and contain mainly horizontal processes. Postmitotic DCX-positive neurons (up-left arrow) lack PCNA and have distinguishable apical dendrites (leftward arrow). Scale bar = 40 µm. The D427V/WT GBA1 mice have higher density of total DCX-positive and PCNA/DCX-double-positive cells than the WT/WT (H). There was no significant difference in HuB/D-positive cell density between WT/WT and D427V/WT mice (I). Data are expressed as scattered dot plot and the horizontal line represents the mean and the error bars SEM (n=9). Mann-Whitney U-test; *p<0.05; **p<0.01 compared with the WT/WT.
174
5.4 Discussion
5.4.1 Result discussion
The findings of this chapter were as follows;
- Drastic reduction in VAChT % staining area but with a moderate increase in ChAT %
staining area in the DG of D427V/WT GBA1 mice compared with WT/WT. The staining
intensity of SPP was also significantly decreased.
- Significant decrease in VAChT staining area, but to a milder extent than the decrease in
the DG, was also found in the motor cortex with no significant increase in ChAT. SPP
staining intensity was decreased but not statistically significant.
- WB showed a similar trend of VAChT reduction in the hippocampus with a significant
decrease in VAChT/ChAT ratio in D427V/WT compared with WT/WT. There was no trend
of disparity in any markers in the cortex.
- Significantly higher % staining area of ChAT-positive neurites in the VDB/HDB. There was
no change in % staining area of VAChT but the ratio of VAChT/ChAT neurite staining was
significantly lower in D427V/WT than in WT/WT. Cell density and size were not different.
- Significantly higher density of DCX-positive cells especially those with PCNA in
D427V/WT mice than in WT/WT. No difference in HuB/D-positive cells between the
groups.
The main findings of this study were that D427V/WT GBA1 mice at 12 mo have significantly less
VAChT % area but relatively higher % staining area of ChAT than the WT/WT mice in the DG. The
reduction in VAChT staining was accompanied by a decrease in SPP immunoreactivity. The same
patterns of alterations were observed in the motor cortex but were less pronounced. A separate
analysis of the cholinergic hippocampal proteins by Western blotting showed similar trends of
change but only VAChT/ChAT ratio between 12 mo D427V/WT and WT/WT was significantly
reduced. In the VDB/HDB, the ratio of VAChT/ChAT staining intensity was also decreased but
there was no change in VAChT % area of staining. The numbers of DCX-positive cells especially
those with PCNA were significantly higher in the D427V/WT mice.
The differential staining intensity of VAChT and ChAT contrasts with their coupled transcription
by the same R promoter in the cholinergic locus. ChAT exclusive M promoter was hypothetically
one of the possible differential cholinergic gene regulators (de Castro et al., 2009). For the WB
results in the hippocampus of 12-mo D427V/WT compared with the WT/WT, we at least observe
a decrease in the VAChT level of 66.6% that was not statistically significant because of high
variability. The reduction in cortical VAChT level in the D427V/WT at 12 mo, however, was
negligible at 10.4%. Nonspecific binding of this VAChT antibody to neuronal nuclei was higher in
175 the cortex (Figure 5.4A) than in the hippocampus (Figure 5.3A) and certainly more noticeable in
D427V/WT GBA1 mice. This nonspecific binding might have confounded the difference in
punctate VAChT level. On the other hand, we have not proved that this nonspecific binding in
IHC also occurred in WB and that this supposedly nonspecific band had been included in the 69
kDa band of VAChT protein.
One of the first studies of a VAChT-globally-knockdown model showed intracellular
accumulation of ACh without any alterations in activity and expression of ChAT and in the rate
of choline uptake (Prado et al., 2006). A later study by the same group on VAChT knockout found
that both homozygous and even hemizygous VAChT knockout mice have significantly higher ACh
level and higher ChAT mRNA expression in the brain at E18.5 (de Castro et al., 2009). The authors
speculated that this upregulation of ChAT expression was directly driven by shorter distance
between R-promoter and M-promoter after the removal of VAChT gene segment, but enhanced
ACh synthesis as a compensatory mechanism of cholinergic system was also possible considering
that CHT1 expression was significantly increased in the VAChT knockout mice as well.
Nonetheless, RT-PCR results in 12 mo mice by Dr Emily Clarke demonstrated a significant
decrease in both ChAT and VAChT mRNA in the hippocampus hence confirming the transcription
coregulation of the cholinergic locus (Dr Emily Clarke, personal communication; Appendix Figure
A.2).
Our study showed significant elevation in hippocampal ChAT axon density and also an increase,
but not significant, in the cortical ChAT axon density in D427V/WT GBA1 mice compared with
WT/WT. VAChT knockout only in cholinergic neurons of the Six3 forebrain lineage (VAChTSix3-Cre-
flox/flox) including mainly the BFCNs and striatal large cholinergic interneurons induced no change
in the levels of cortical ChAT but slight decrease in the hippocampal ChAT levels by Western
blotting (Martyn et al., 2012). While our concerning ChAT axon density in the cortex or
hippocampus does not agree with the study on forebrain VAChT knockout, our ChAT Western
blot results at 12 months showed similar patterns of negligible change in the cortex and slight
decrease in the hippocampus in the D427V/WT compared with the WT/WT. Nonetheless, it
should be noted that VAChT knockout hemizygous and homozygous mice were investigated at
embryonic stage and forebrain VAChT knockout mice at young age of 21-40 days old.
Another possible explanation to account for higher ChAT percentage area of staining but lower
or same ChAT protein levels is enlargement or higher branching incidence of axons without
changes in total protein level. This study found that ChAT-positive axons in the D427V/WT have
less en passant punctate characteristics or varicosities (Figure 5.3A) and this was congruent with
the lower density of VAChT-positive puncta. Cholinergic axon swelling was also reported in AD
patients and mouse models except that the swellings were less homogeneous and more
176 extreme in size as conspicuous beading/blebbing due to protein accumulation rather than loss
of punctate characteristics (Stokin et al., 2005). AD-like swellings in cholinergic axons was also
accompanied by loss of ChAT-positive fibre density in the basal forebrain specifically nbM, but
our study instead found that D427V/WT GBA1 mice had higher density of ChAT-positive fibre
especially with respect to VAChT in the VDB/HDB.
There was no change in the density or number of BFCNs in the VDB/HDB. This result
recapitulated the lack of cell loss in the MS/VDB in PDD patients (Hall et al., 2014). The authors
did not report a result on cholinergic fibre density but the representative image of the MS/DB
in PDD patients seems to have slightly denser cholinergic fibres than controls and to higher
extent than idiopathic PD patients. This could be similar to our results on higher % area of ChAT-
positive neurites from the VDB/HDB BFCNs.
Furthermore, we found lower immunoreactivity of SPP in both the DG and the motor cortex,
statistically significant in the former but just below criterion in the latter. This raises the
possibility that GBA mutation-induced synaptic degeneration, either by terminal loss or
dysfunction of vesicular systems, may upregulate ChAT protein level especially in BFCNs of the
MS/DB in compensation. Similar to VAChT, hippocampal SPP level by WB was lower in the
D427V/WT mice but not statistically significant due to variability of data and cortical SPP level,
in the same fashion as that of VAChT, was not changed at all between the two groups at 12 mo.
Overall, these data suggest that replication of the study with a larger sample size is required to
explore this further.
BFCNs and dopaminergic neurons in non-human primates also have high expression of GCase
(Dopeso-Reyes et al., 2018) and hence are likely sensitive to GBA1 mutations. One study showed
that GlcSph decreased neurite outgrowth, lowered GCase activity, and importantly decreased
ACh production in cholinergic neuron-like neuroblastoma LA-N-2 (Schueler et al., 2003).
Homozygous D427V/D427V GBA1 mice at 6 mo have GlcSph accumulation (Sardi et al., 2011)
and it is possible that D427V/WT mice at 12 mo may have developed this feature as well.
Since VAChT was not significantly decreased in the VDB/HDB, loss of VAChT could result from
defects in local production or degradation of VAChT protein in the axons, loss of presynaptic
terminals, or abnormality in vesicular protein trafficking. Considering that hippocampus-
projecting BFCNs also corelease GABA from the same active zone (Takács et al., 2018), it would
be interesting to check whether vesicular GABA transporter (VGAT)-positive GABA vesicles or
terminals were affected as well. To check for the direct loss of presynaptic terminals, co-staining
of CHT1 and VAChT would be helpful that predominant colocalisation and significant loss of both
proteins in D427V/WT would serve as good preliminary evidence that synaptic terminals are
degraded. Furthermore, VAChT-positive terminals are usually paired with postsynaptic cluster
177 of gephyrin (Takács et al., 2018), so staining for gephyrin would help identify any changes in
synaptic structures. Mechanisms of VAChT axonal transport and production has not been fully
elucidated but direct interaction with some proteins such as clathrin and synaptobrevin has
been identified (reviewed in Prado et al., 2013). A recent article has shown that active zone and
presynaptic vesicle proteins such as Bassoon and VGluT1 in mouse hippocampal neurons were
anterogradely transported from the cell body along the axon via Arl8-dependent mechanisms
to the presynaptic terminals via LAMP1-positive presynaptic lysosome-like vesicles (PLV) that
did not have digestive cathepsin enzymes or acidic pH (Vukoja et al., 2018). Arl8 is a small GTPase
lysosomal kinesin adaptor. Although loss of Arl8 function also result in accumulation of Bassoon-
and VGluT1-positive PLVs in the soma of Drosophila neurons, this thesis did not show an increase
in VAChT within the soma of BFCNs. The possibility of simultaneous defects in multiple pathways
could not be ruled out. Nonetheless, since Dr Emily Clarke has shown that mRNAs of both VAChT
and ChAT were decreased, there were likely specific post-transcriptional mechanisms that
enhanced or at least preserved ChAT levels. For example, RNA splicing factor B52 was required
for ChAT splicing specifically at intron 2 and intron 4-7 and therefore had no effect on VAChT
splicing (Liu and Bossing, 2016). An endoplasmic reticulum-associated co-chaperone
p97/valosin-containing protein was also found to play an important role in ubiquitin-dependent
ChAT degradation (Morey et al., 2017). It was possible that upregulation of B52 mouse analogue
and/or downregulation of p97 could have contributed to the ChAT upregulation/preservation
observed in D427V/WT mice.
An earlier recent study has reported that approximately 49% of LAMP1 in the cell body was
colocalised with GCase but 79% of GCase was colocalised with LAMP1 (Cheng et al., 2018). While
it has not been confirmed, PLV likely contain low GCase level or at least non-optimally active
GCase because of its non-acidic pH (Lieberman et al., 2009). It is possible that D427V GCase
could be mis localised to the LAMP1-positive PLVs and disrupted their role in transporting
presynaptic proteins including VAChT and SPP.
The higher number of DCX-positive cells in the DG of the D427V/WT compared with the WT/WT
mice recapitulated the higher number of DCX-positive cells in DLB patients compared with
controls (Johnson et al., 2011; Gatt et al., 2018). Although the same study (Johnson et al., 2011)
found a significant increase and decrease in staining percentage area of PCNA and ChAT
respectively, correlations between factors were not reported. Direct cholinergic synapses on
immature adult-born DGCs have been shown to regulate their survival into NeuN-positive
postmitotic mature neurons through m1-AChR-related pathways (Zhu et al., 2017). ACh was
shown to regulate maturation of adult-born DGCs through α7-nAChR-associated pathways, one
of which was NKCC1 reduction as a late stage of functional maturation (Campbell et al., 2010).
178 Since cholinergic axons in the hippocampus corelease ACh and GABA in the same terminals
(Takács et al., 2018), stimulation of BFCNs may dynamically monitor maturation of adult-born
DGCs via both ACh and GABA signalling pathways. Reduction in ACh signalling from loss of VAChT
may delay α7-nAChR-associated maturation and simultaneously reduce survival of late-term
adult-born DGCs, leading to an accumulation of immature population. There is a possibility that
general proliferation was also upregulated but slight increases in the number and ratio of PCNA-
positive HuB/D-positive cells were not significant in the present study.
5.4.2 Limitations and Future directions
This study so far had investigated only one 7-µm thick brain section for each set of staining or a
combination of antibodies used on a single section. While lack of use of a gold standard
stereological technique may not critically affect considerably significant and homogeneous
feature such as VAChT deficits in the cholinergic axons in the DG, it possibly resulted in
insufficient data sampling for cell counting in both the DG and the VDB/HDB and morphological
changes of ChAT-positive neurites. Improved methods for future experiments should include
stereology for at least the dorsal hippocampus and possibly duplicate set of staining in
consecutive sections. Distribution of SPP-positive puncta in the Z-axis of thin paraffin-embedded
section was more polarised toward the glass slide than that of cholinergic axons. In this
experiment, we focused on a Z-slice that has maximum cholinergic axon density, but it may be
better to choose the slice based on SPP staining or to code a macro that can process information
from multiple slightly heterogeneous Z-slices together in a proper statistical procedure. A thicker
section is also an alternative.
We chose to investigate the motor cortex because despite its relatively high resistance to
synuclein pathology as it is usually not affected until PD Braak stage 6 (Braak et al., 2003), its
cholinergic activity-mediated short latency afferent inhibition (SAI) was significantly impaired
(Di Lazzaro et al., 2007) and inversely correlated with hallucinations in DLB patients (Marra et
al., 2012). SAI was also significantly decreased in PDD patients (Celebi et al., 2012) and
potentially earlier in PD-MCI (Yarnall et al., 2013) compared with cognitively normal PD
(reviewed in Cromarty et al., 2016). In the aspect of profiling, the motor cortex is more
independent from the DG than the frontal cortex that has both input and output connections to
the VDB/HDB (Do et al., 2016). In that regard, we had planned to investigate the nbM/SI as well
but the variations across mouse brains from difference in levels of sagittal sections in terms of
the BFCN and neurite density prevented this approach in the current group of animals.
179 In a single sagittal section, a single-field thin strip of the motor cortex is more heterogeneous in
terms of cholinergic axon and synaptic punctate distribution than the ML. In the future, it is
advisable to capture images of a wider strip of a specific cortex with a 20X objective lens that
allows us to measure the cholinergic axon distribution in multiple separated bins of equal size.
Each sub-sectors of the hippocampus such as ML and GCL of the DG, and CA1-3 can also be
subdivided into bins for future study.
The set of neurogenic markers in this study was selected to parallel my human study in the
previous chapter. Likewise, with similar problems, while large HuB/D-positive cells could be
easily excluded from the counting as large GABAergic interneurons, hilar mossy cells, or CA3
pyramidal neurons, small- to medium-sized interneurons could have been incorrectly counted
as DGCs. Another set of co-staining with the DGC lineage marker Prox1 could help identify
HuB/D-positive immature DGCs in the future. Since Hu proteins were mainly expressed in early
stage of DGC development up to DCX-positive phase (Liu et al., 2010), those HuB/D-positive cells
that have not been fate-determined by Prox1 expression must still be pre-mitotic stage with
PCNA expression. Hence, three groups of HuB/D-positive cells can be categorised: PCNA-
positive/Prox1-negative early neurogenic cells, Prox1-positive DGC-determined neuroblast or
immature neurons, and lastly Prox1-negative non-DGC neurons. On that note, antibody
stripping method optimised enough to completely remove nuclear marker staining would be
tremendously helpful for the profiling study on adult hippocampal neurogenesis.
The current WB data were also derived from a single set of samples. There was not enough
homogenate from some brains to perform a duplicate or a triplicate set of experiments. Some
hippocampal samples showed high level of proteins relative to the βIII-tubulin because their βIII-
tubulin bands were abnormally small. This might result from global protein degradation during
loading dye incubation at 4°C as these samples also contained minimal levels of endogenous
IgG-HC and LC An exploratory analysis where these cases were excluded modified the decreases
in D427V/WT hippocampal VAChT and SPP at 12 mo to be statistically significant. However,
there was not enough evidence to justify the case selection and a new experiment would need
to be undertaken.
Overall, these studies have demonstrated a novel and unexpected disruption of the cholinergic
system in D427/WT GBA1 mice. From other work in the laboratory and other studies, these
changes could be the basis of the cognitive changes seen in this model although this clearly
needs further and more detailed confirmation. The heterozygous mice also had significantly
upregulated AHN which replicated the findings in postmortem human tissue.
180
6 Cholinergic system and adult hippocampal neurogenesis in a
mouse model of Alzheimer’s disease, 5XFAD
6.1 Introduction
None of AD mouse models have faithfully replicated all major symptoms in human AD, but
several models have been developed and demonstrated to share common features with human
patients. 5XFAD is one of the well-investigated models with evidence of cholinergic
degeneration Yan et al., 2018 and AHN deficits (Moon et al., 2014; Choi et al., 2018). In the
5XFAD transgenic mice, human APP 695 with 3 FAD mutations (K670N/M671L, I716V, and V717I)
and PSEN1 with 2 FAD mutations (M146L and L286V) co-overexpression are driven by neuron-
specific Thy1-promoter (Oakley et al., 2006). Intracellular Aβ42 accumulation and plaque
deposition started very early at the ages of 1.5 and 2 months respectively. Furthermore, unlike
other AD models such as Tg2576 but more similar to human, the Aβ42/Aβ40 elevated rapidly
and early since 1-2 mo of age. There was no difference in AT8 phosphorylated-tau epitope
staining between 5XFAD and WT. Therefore, most anomalies observed in the 5XFAD could be
attributed to Aβ42-associated mechanisms and this could prove useful in distinguishing Aβ-
driven changes from those predominantly driven by phosphorylated tau toxicity.
The number of BFCNs in the HDB was significantly decreased and the % staining area of the
hippocampal cholinergic dystrophic axons hence was notably higher in the 5XFAD compared
with those of WT (Yan et al., 2018). Regardless, the % area staining of non-dystrophic axons and
% area of VAChT staining have not been investigated in the 5XFAD model. A recent study on
5XFAD showed that reduction in survival of adult-born DGCs was directly related to partial loss
of cholinergic terminals on dendrites of adult-born DGCs (Zhu et al., 2017). The above finding
was supported by a significant decrease in the number of DCX-positive cells and calretinin-
positive immature neurons in 5XFAD (Moon et al., 2014).
The main aim of this study was to examine the impact of Aβ and possible cholinergic changes in
the 5XFAD mouse model and to qualitatively compare these with the observations from the
D427V/WT GBA1 mouse model described in chapter 5. From these previous findings mentioned
above, the hypothesis of this chapter is that 5XFAD at 11-mo would have loss of BFCNs in the
VDB/HDB and also a reduction in both VAChT and ChAT % staining area in the DG and cortex.
Although a previous study suggested that the proclivity of AHN deficits compared with the WT
subsided after 7-mo, it should still be possible to detect reduction in DCX- and HuB/D-positive
cells in 5XFAD compared with the WT.
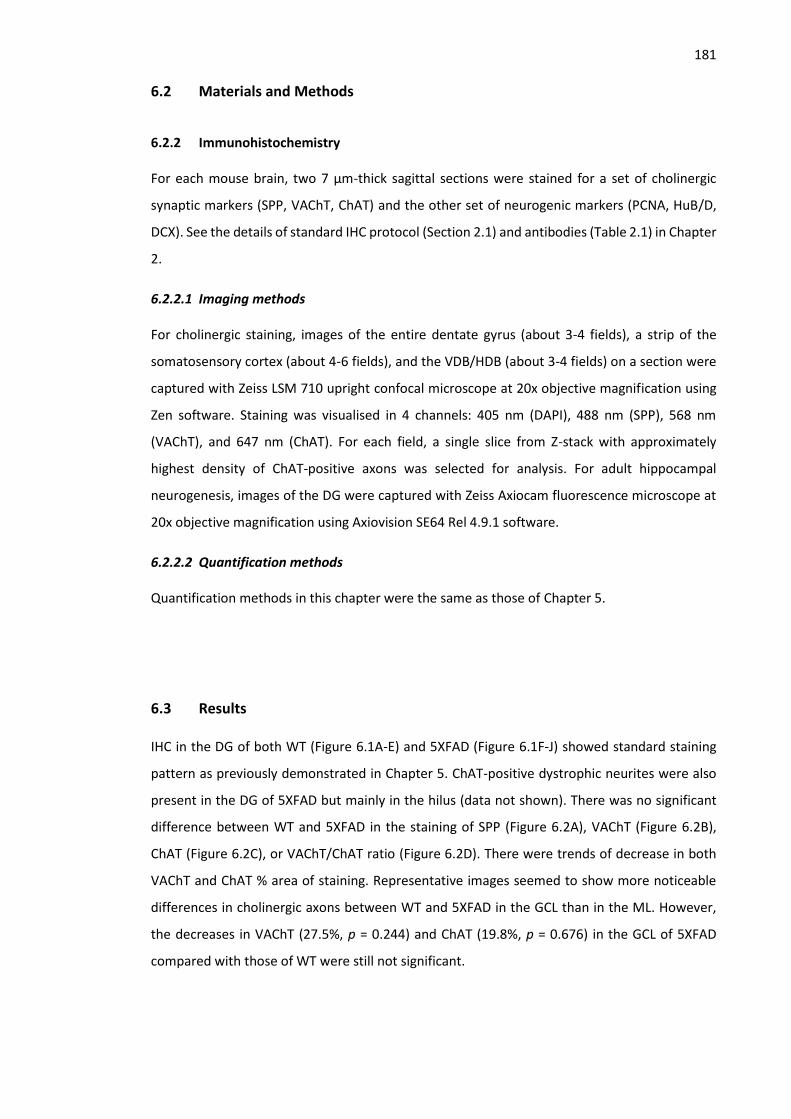
181
6.2 Materials and Methods
6.2.2 Immunohistochemistry
For each mouse brain, two 7 µm-thick sagittal sections were stained for a set of cholinergic
synaptic markers (SPP, VAChT, ChAT) and the other set of neurogenic markers (PCNA, HuB/D,
DCX). See the details of standard IHC protocol (Section 2.1) and antibodies (Table 2.1) in Chapter
2.
6.2.2.1 Imaging methods
For cholinergic staining, images of the entire dentate gyrus (about 3-4 fields), a strip of the
somatosensory cortex (about 4-6 fields), and the VDB/HDB (about 3-4 fields) on a section were
captured with Zeiss LSM 710 upright confocal microscope at 20x objective magnification using
Zen software. Staining was visualised in 4 channels: 405 nm (DAPI), 488 nm (SPP), 568 nm
(VAChT), and 647 nm (ChAT). For each field, a single slice from Z-stack with approximately
highest density of ChAT-positive axons was selected for analysis. For adult hippocampal
neurogenesis, images of the DG were captured with Zeiss Axiocam fluorescence microscope at
20x objective magnification using Axiovision SE64 Rel 4.9.1 software.
6.2.2.2 Quantification methods
Quantification methods in this chapter were the same as those of Chapter 5.
6.3 Results
IHC in the DG of both WT (Figure 6.1A-E) and 5XFAD (Figure 6.1F-J) showed standard staining
pattern as previously demonstrated in Chapter 5. ChAT-positive dystrophic neurites were also
present in the DG of 5XFAD but mainly in the hilus (data not shown). There was no significant
difference between WT and 5XFAD in the staining of SPP (Figure 6.2A), VAChT (Figure 6.2B),
ChAT (Figure 6.2C), or VAChT/ChAT ratio (Figure 6.2D). There were trends of decrease in both
VAChT and ChAT % area of staining. Representative images seemed to show more noticeable
differences in cholinergic axons between WT and 5XFAD in the GCL than in the ML. However,
the decreases in VAChT (27.5%, p = 0.244) and ChAT (19.8%, p = 0.676) in the GCL of 5XFAD
compared with those of WT were still not significant.
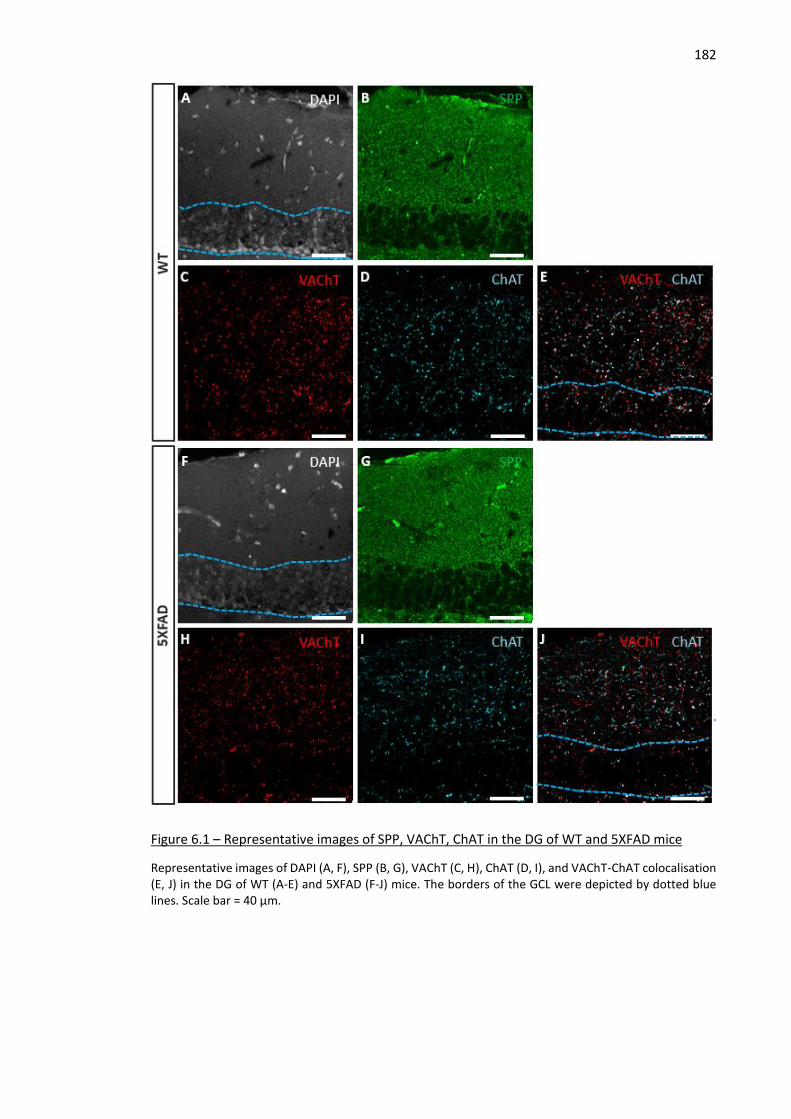
182
Figure 6.1 – Representative images of SPP, VAChT, ChAT in the DG of WT and 5XFAD mice
Representative images of DAPI (A, F), SPP (B, G), VAChT (C, H), ChAT (D, I), and VAChT-ChAT colocalisation (E, J) in the DG of WT (A-E) and 5XFAD (F-J) mice. The borders of the GCL were depicted by dotted blue lines. Scale bar = 40 µm.
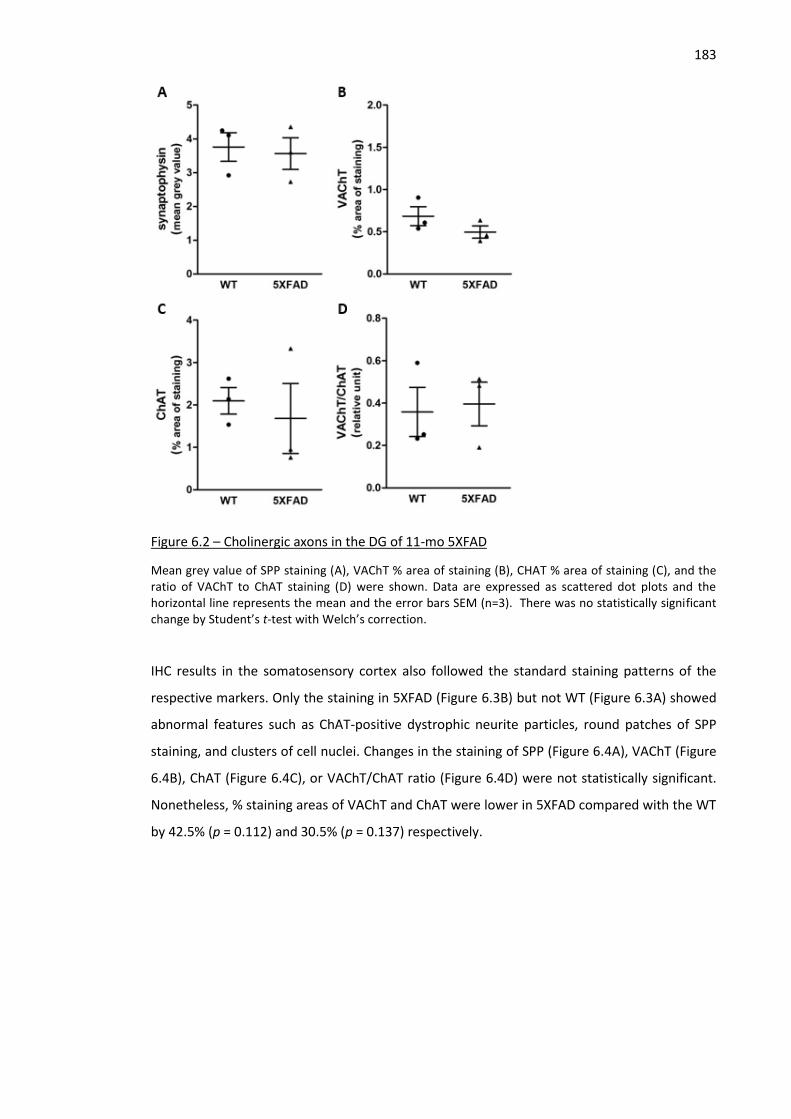
183
Figure 6.2 – Cholinergic axons in the DG of 11-mo 5XFAD
Mean grey value of SPP staining (A), VAChT % area of staining (B), CHAT % area of staining (C), and the ratio of VAChT to ChAT staining (D) were shown. Data are expressed as scattered dot plots and the horizontal line represents the mean and the error bars SEM (n=3). There was no statistically significant change by Student’s t-test with Welch’s correction.
IHC results in the somatosensory cortex also followed the standard staining patterns of the
respective markers. Only the staining in 5XFAD (Figure 6.3B) but not WT (Figure 6.3A) showed
abnormal features such as ChAT-positive dystrophic neurite particles, round patches of SPP
staining, and clusters of cell nuclei. Changes in the staining of SPP (Figure 6.4A), VAChT (Figure
6.4B), ChAT (Figure 6.4C), or VAChT/ChAT ratio (Figure 6.4D) were not statistically significant.
Nonetheless, % staining areas of VAChT and ChAT were lower in 5XFAD compared with the WT
by 42.5% (p = 0.112) and 30.5% (p = 0.137) respectively.
184
Figure 6.3 – Representative images of SPP, VAChT, ChAT in the somatosensory cortex of WT
and 5XFAD mice
Representative images of DAPI (A, F), SPP (B, G), VAChT (C, H), ChAT (D, I), and VAChT-ChAT colocalisation (E, J) in the somatosensory cortex of WT (A-E) and 5XFAD (F-J) mice. Dystrophic cholinergic neurites (arrow), round agglomeration of SPP-positive particles (dotted open arrow), and large cluster of cell nuclei (dotted box) were only observed in 5XFAD. Scale bar = 40 µm.
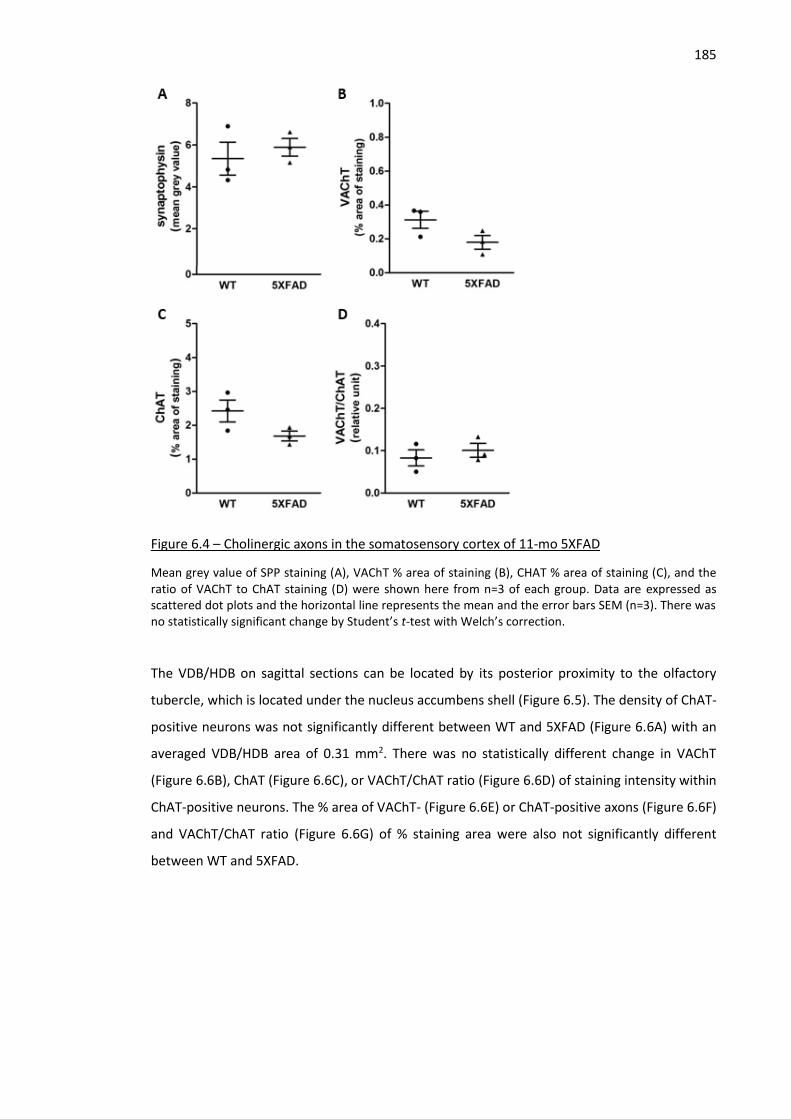
185
Figure 6.4 – Cholinergic axons in the somatosensory cortex of 11-mo 5XFAD
Mean grey value of SPP staining (A), VAChT % area of staining (B), CHAT % area of staining (C), and the ratio of VAChT to ChAT staining (D) were shown here from n=3 of each group. Data are expressed as scattered dot plots and the horizontal line represents the mean and the error bars SEM (n=3). There was no statistically significant change by Student’s t-test with Welch’s correction.
The VDB/HDB on sagittal sections can be located by its posterior proximity to the olfactory
tubercle, which is located under the nucleus accumbens shell (Figure 6.5). The density of ChAT-
positive neurons was not significantly different between WT and 5XFAD (Figure 6.6A) with an
averaged VDB/HDB area of 0.31 mm2. There was no statistically different change in VAChT
(Figure 6.6B), ChAT (Figure 6.6C), or VAChT/ChAT ratio (Figure 6.6D) of staining intensity within
ChAT-positive neurons. The % area of VAChT- (Figure 6.6E) or ChAT-positive axons (Figure 6.6F)
and VAChT/ChAT ratio (Figure 6.6G) of % staining area were also not significantly different
between WT and 5XFAD.
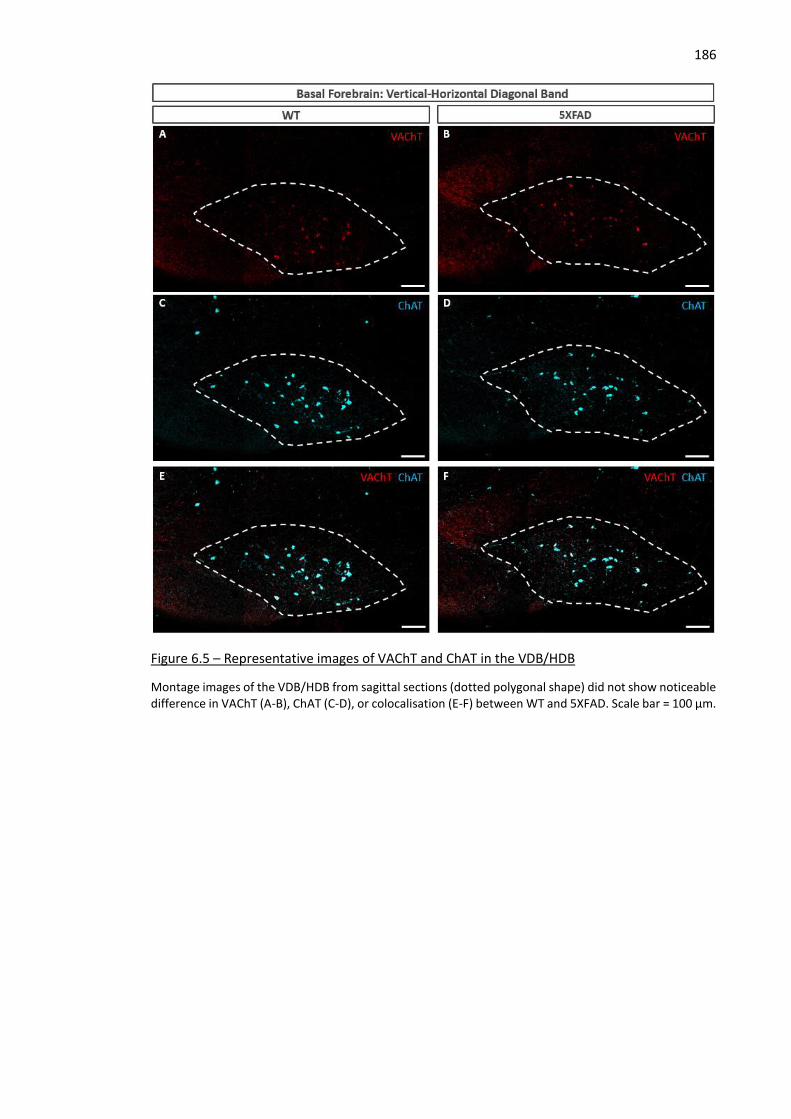
186
Figure 6.5 – Representative images of VAChT and ChAT in the VDB/HDB
Montage images of the VDB/HDB from sagittal sections (dotted polygonal shape) did not show noticeable difference in VAChT (A-B), ChAT (C-D), or colocalisation (E-F) between WT and 5XFAD. Scale bar = 100 µm.
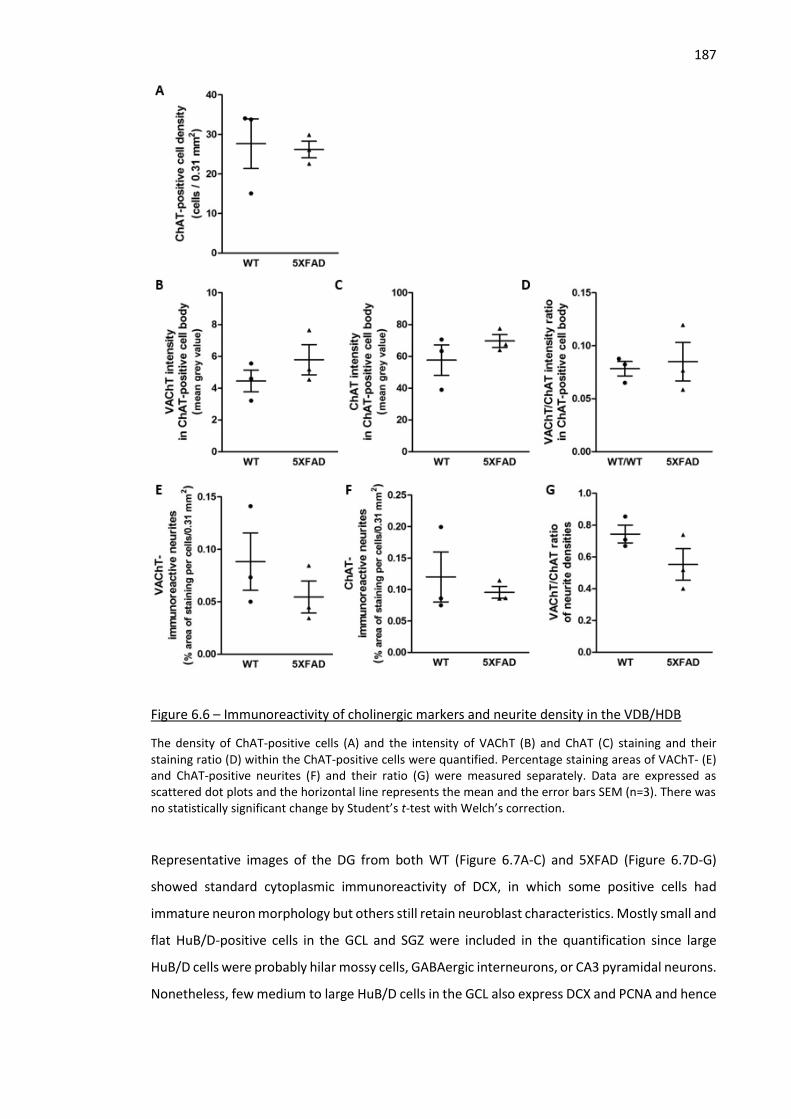
187
Figure 6.6 – Immunoreactivity of cholinergic markers and neurite density in the VDB/HDB
The density of ChAT-positive cells (A) and the intensity of VAChT (B) and ChAT (C) staining and their staining ratio (D) within the ChAT-positive cells were quantified. Percentage staining areas of VAChT- (E) and ChAT-positive neurites (F) and their ratio (G) were measured separately. Data are expressed as scattered dot plots and the horizontal line represents the mean and the error bars SEM (n=3). There was no statistically significant change by Student’s t-test with Welch’s correction.
Representative images of the DG from both WT (Figure 6.7A-C) and 5XFAD (Figure 6.7D-G)
showed standard cytoplasmic immunoreactivity of DCX, in which some positive cells had
immature neuron morphology but others still retain neuroblast characteristics. Mostly small and
flat HuB/D-positive cells in the GCL and SGZ were included in the quantification since large
HuB/D cells were probably hilar mossy cells, GABAergic interneurons, or CA3 pyramidal neurons.
Nonetheless, few medium to large HuB/D cells in the GCL also express DCX and PCNA and hence
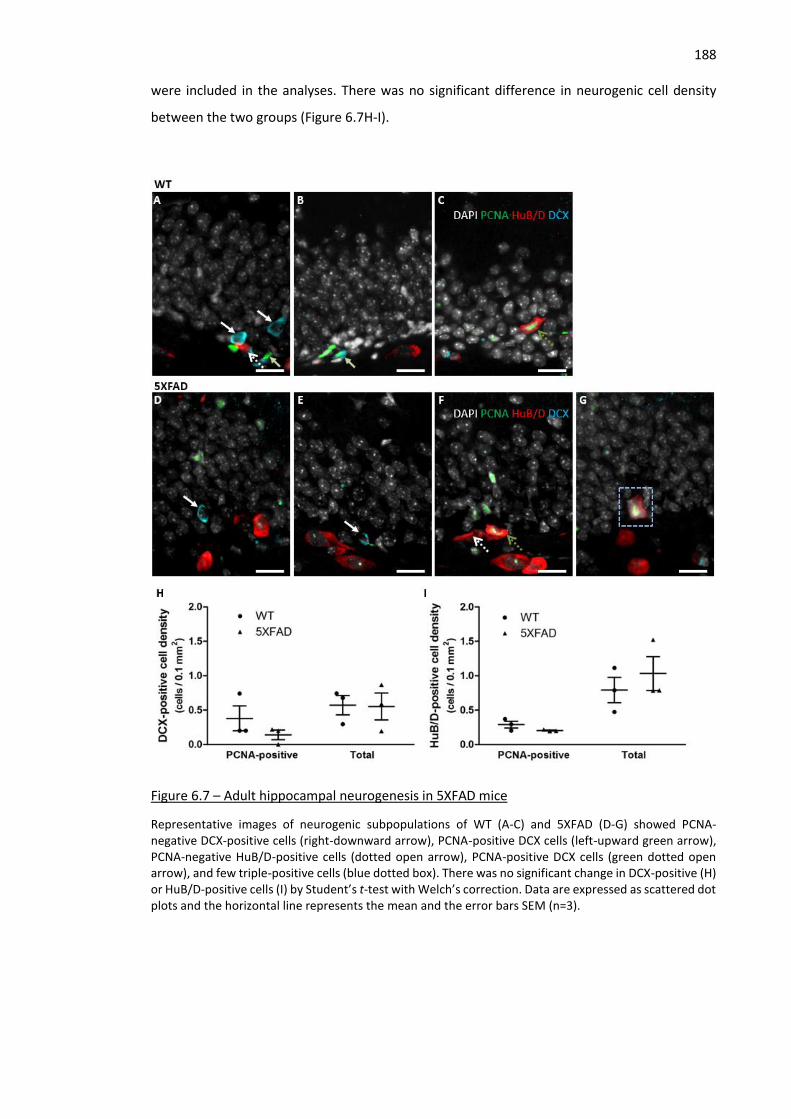
188 were included in the analyses. There was no significant difference in neurogenic cell density
between the two groups (Figure 6.7H-I).
Figure 6.7 – Adult hippocampal neurogenesis in 5XFAD mice
Representative images of neurogenic subpopulations of WT (A-C) and 5XFAD (D-G) showed PCNA-negative DCX-positive cells (right-downward arrow), PCNA-positive DCX cells (left-upward green arrow), PCNA-negative HuB/D-positive cells (dotted open arrow), PCNA-positive DCX cells (green dotted open arrow), and few triple-positive cells (blue dotted box). There was no significant change in DCX-positive (H) or HuB/D-positive cells (I) by Student’s t-test with Welch’s correction. Data are expressed as scattered dot plots and the horizontal line represents the mean and the error bars SEM (n=3).
189
6.4 Discussions
The findings of this chapter were as follows;
- No significant difference in % staining area of VAChT or ChAT in the DG. There were few
dystrophic neurites in the hilus but not in the ML of 5XFAD.
- No significant difference in % staining area of VAChT or ChAT in the somatosensory
cortex. In 5XFAD, dystrophic neurites were more prevalent in the cortex compared with
the DG by observation.
- No significant change in cell number, size, or marker staining in the VDB/HDB.
- No significant change in the number of DCX- or HuB/D-positive cells.
The main findings of this study were that the cholinergic system was relatively well preserved as
judged by staining of cholinergic nerve terminals and ChAT-positive nbM neurons. Furthermore,
there were no obvious changes in neurogenic markers. Small number of animals likely
contributed to the low observed statistical power. If the number of animals was increased some
of the changes might reach statistical significance.
Decrease in the density of DCX-positive cells in young adult 5XFAD mice has been reported
(Moon et al., 2014). Interestingly, the difference in DCX-positive cells between WT and 5XFAD
increased with age during 2-4 mo but suddenly dropped to the statistically non-significant level
at 7 mo. Another study that found defects in survival of adult-born DGCs was also conducted on
5-mo 5XFAD (Zhu et al., 2017). Mice used in this study were 11-mo and there was a possibility
that the AD transgene-induced prohibitive effects on adult neurogenesis in 5XFAD were
outweighed by age-induced reduction in neurogenesis. On the other hand, APP23 mice with the
Swedish K670N/M671L mutation had lower number of DCX-positive cells at 5-mo but later had
higher number of DCX-positive cells at 25-mo compared with the WT (Ermini et al., 2008). It can
be speculated that the rate of AHN decrease in the WT was faster than that of 5XFAD at older
ages. The Swedish mutation was also one of three APP mutations in 5XFAD mice. Therefore, the
lack of difference in adult hippocampal neurogenesis at old ages in 5XFAD was possibly a
transition where AD-associated mutations started to upregulate AHN and delay age-induced
reduction.
In summary, the present study did not demonstrate any changes in either the cholinergic system
or neurogenesis in this mouse model, however because of the small numbers and limited time
points available it is possible that any changes may have been missed.
190
7 General Discussion
7.1 Summary of findings
The Chapter 3 pilot study on a cohort of 9 cases verified the potency of ChAT and VAChT as
markers of cholinergic innervation and of DCX and HuB/D as markers of fate-determined
neuroblasts or immature neurons in the AHN process. Estimated cm from the front of the
section, sex, age, PMI, and pH were identified as potential covariates. Percentage area of
staining was chosen as a method of quantification for cholinergic axon markers and this was
modelled with a univariate GLM. Cell count per mm DG length was used to quantify AHN and
this was modelled with a negative binomial regression. Antibody stripping was effective enough
to reveal that DCX- or HuB/D-positive cells may also express post-mitotic marker calretinin,
confirming their identities as AHN markers.
The Chapter 4 study on a main cohort of 36 cases revealed no change in VAChT % area of staining
or colocalisation between VAChT and ChAT across Braak stages. Interestingly, ChAT % area of
staining was upregulated in Braak III and significantly decreased compared with that of Braak III
in Braak IV-VI. This study also showed that among the 6 basis groups of DCX or HuB/D-
immunoreactive cells, the numbers of xH, xHD, and xPH per mm DG length were significantly
different across Braak stages but significant pairwise differences were found only in xH between
Braak V and Braak II-III, VI and between Braak III and Braak IV. A combined group of HnP from
xH and xHD had significant pairwise differences between Braak III-IV and Braak 0, II-III, VI.
Correlation analyses also confirmed that colocalisation was more correlated to ChAT than to
VAChT staining. In terms of interaction between cholinergic and neurogenic markers, only ChAT
% area of staining was positively correlated with xH and xHD and negatively correlated with xPH.
The Chapter 5 study on 12 mo D427V/WT GBA1 mice found significant reduction in VAChT %
area of staining in the DG and the motor cortex compared with that of controls. On the other
hand, ChAT % area of staining was elevated in the DG but not in the motor cortex. These findings
by IHC were not completely corroborated by Western blotting as VAChT and CHAT levels
individually were not decreased in the hippocampus or cortex of 12 mo D427V/WT compared
with the 12 mo control. VAChT/ChAT ratio, however, was significantly reduced in the 12 mo
D427V/WT hippocampus but still to a smaller extent than the reduction found by IHC. The
VDB/HDB of 12 mo D427V/WT mice had higher % area of ChAT-positive neurites than that of
WT but there was no change in the number of BFCNs or their immunoreactivity of ChAT or
VAChT. In terms of AHN, the numbers of total DCX-positive cells and especially those double-
191 positive with both DCX and PCNA were significantly higher in 12 mo D427V/WT than in controls.
There was no change in the number of HuB/D-positive cells.
The Chapter 6 study on 11 mo 5XFAD mice with the same IHC protocols performed in the
Chapter 5, however, did not reveal any significant difference in ChAT or VAChT in the DG,
somatosensory cortex, or VDB/HDB. There was no significant change in the number of BFCNs in
the VDB/HDB or the number of DCX- or HuB/D-positive cells in the DG.
7.2 Abnormal cholinergic innervation in AD cases and mouse models
Hippocampal ChAT activity was reported to be upregulated in MCI patients compared with
control and AD dementia patients (DeKosky et al., 2002) and a later study further specified that
this upregulation in hippocampal ChAT activity occurred mainly in MCI patients with Braak III-IV
(Ikonomovic et al., 2003). This study found a significant increase in % staining area of ChAT-
positive axons in cases with Braak III than cases with Braak IV-VI. However, it was impossible to
prove whether MCI had any effects on ChAT % area of staining because the record of cognitive
scores either MMSE or CDR in this cohort was incomplete. Upregulation in ChAT
immunoreactivity was also observed in the hippocampus of D427V/WT GBA1 mice. However,
unlike human Braak III where % area ChAT-positive dystrophic in the ML was prevalent, there
was no large ChAT-positive particle that resembled an AD-associated dystrophic neurite in the
D427V/WT mice. On the other hand, 5XFAD mice showed ChAT-positive dystrophic neurites in
the DG. With the notion that swollen dystrophic cholinergic axons have not been associated with
DLB/PDD unlike dystrophic dopaminergic axons (Johnson et al., 2011; reviewed in Duda, 2004),
D427/WT and 5XFAD/AD likely do not share common ChAT upregulation mechanisms.
Nonetheless, ChAT staining was significantly decreased in the DG of DLB/PDD cases (Johnson et
al., 2011) unlike those of D427V/WT mice. This moderate increase in ChAT % area of staining in
D427V/WT GBA1 mice was associated with severe loss of VAChT % staining area or VAChT-
positive presynaptic terminals. ChAT upregulation could be D427V/WT GBA1 mutation-specific
effect. On the other hand, D427V/WT mice older than 12 mo may later have lower ChAT
expression similar to a significant decrease in ChAT staining in Braak IV-VI.
VAChT staining in the main cohort study decreased in Braak I, reached its peak in Braak II and
subsequently gradually decreased along Braak stage progression. Unlike in both D427V/WT
GBA1 and 5XFAD mice of which VAChT staining was mostly colocalised with ChAT staining, a few
human cases had conspicuous VAChT staining with relatively much lower ChAT staining. Despite
non-significant difference in % staining area of VAChT-positive axons or VAChT-ChAT
colocalisation across Braak stages or CERAD NP scores, % area of colocalisation between VAChT
192 and ChAT was significantly higher in cases with Braak III and CERAD 0 than those with Braak III
and CERAD score of 2. This pattern of changes in Braak III cases with and without moderate
CERAD NP score was also observed in the % staining area of ChAT-positive axons. This suggested
that despite the highest density of ChAT accumulation in dystrophic neurites, preservation of
cholinergic axons in Braak III was accompanied by a sparing of VAChT level and potentially
contributed to cholinergic function compensation. VAChT was more negatively correlated, albeit
not significant after multiple p-value adjustment, with CERAD NP score than NFT Braak stage.
Aβ42 oligomer treatment has been demonstrated to dose-dependently decreased VAChT-
positive bouton density in primary rat basal forebrain neuron culture (Kasa et al., 2004).
However, a slight reduction in the % staining area of VAChT-positive axons in the DG and the
somatosensory cortex of 5XFAD compared with the WT was not statistically significant in this
study.
Changes in the human basal forebrain were not investigated in this study. Previous studies have
shown severe reduction in the number of BFCNs in the nbM/SI but less pronounced change in
the VDB of AD patients. In this study, however, changes in the number of BFCNs and in ChAT or
VAChT % area of staining were not significant between 5XFAD and WT. While this might result
from low sample size, injection of Aβ42 oligomers into the rat nbM/SI was reported to induce
non-significant decrease in the size of BFCNs, ChAT-positive axon density in the PFC, and cortical
VAChT levels by WB (Parikh et al., 2014). The above study also showed that aging significantly
decreased ChAT-positive axon innervation and cortical VAChT level. However, this thesis found
that both hippocampal and cortical VAChT levels in 12 mo WT/WT GBA1 mice were higher than
those in 6 mo mice. This discrepancy was possibly caused by differences in cholinergic regulation
by aging between mice and rats, which unfortunately have not been investigated (Van der Zee
and Keijser, 2011).
7.3 Comparisons of adult hippocampal neurogenesis between human and mouse
models
Investigation on colocalisation of DCX and HuB/D in this thesis revealed that human HuB/D was
expressed in the late neuroblast/immature neuron phase while mouse HuB/D was preferentially
expressed in the early neuroblast/immature neuron phase. Unlike human HuB/D which was
expressed in DCX- or calretinin-positive cells with immature DGC-like morphology, mouse HuB/D
was mostly expressed in cells with flat neuroblast-like morphology in the SGZ. Few cells in the
mouse GCL with immature DGC-like morphology also expressed faint DCX and HuB/D. In human,
the percentages of cells immunoreactive for both DCX and HuB/D within the population of DCX-
193 and HuB/D-positive cells were 51.7% and 31.4% respectively. In mouse, the percentages of DCX-
and HuB/D-double positive cells within the DCX- and HuB/D-positive populations were only
22.6% and 9.0% respectively. This study found that HuB/D and HuC/D were colocalised in the
nuclei of DGCs and therefore confirmed the results of the article that first studied the
colocalisation between HuC/D and PCNA (Ekonomou et al., 2015). On the other hand, the first
study on AHN in AD patients (Jin et al., 2004a) demonstrated that Hu proteins were colocalised
with TUC-4 in the cytoplasm. Similarly, studies on mice in this thesis demonstrated that mouse
HuB/D was primarily in the cytoplasm of neuroblasts. This study and several previous articles
(Knoth et al., 2010; Sorrells et al., 2018) reported moderate to intense DCX immunoreactivity in
nuclei of some DGCs. On the contrary, the studies on both D427V/WT GBA1 and 5XFAD
confirmed that mouse DCX was predominantly present in the cytoplasm. While this nuclear DCX
immunoreactivity potentially resulted from human-specific subcellular compartmentalisation, it
could also be an artefact considering that the major study on a larger cohort with thorough
investigation along the entire hippocampus did not report such phenomenon (Boldrini et al.,
2018).
7.4 Potential effects of tau on AHN
Injection with soluble non-aggregate tau is capable of impairing dendritic spine, Mossy
terminals, morphology, and associated behaviours (Bolos et al., 2017). Interestingly, soluble tau-
treated mouse DGCs have several primary apical dendrites similar to DGCs found in AD patients
(Llorens-Martin et al., 2013). Similar to previous studies (Perry et al., 2012; Boldrini et al., 2018;
Tartt et al., 2018), DCX staining in this study also could not effectively visualise dendrites of the
immature neurons to confirm any pathological morphology. One study showed that most DGCs
immunoreactive for pS396 or pT205 (also recognised by AT8) were immunoreactive for DCX and
they also demonstrated that GSK3-induced tau hyperphosphorylation promoted proliferation
and increased the number of NeuroD- and DCX-positive cells (Hong et al., 2010). Staining of both
pS396 and AT8 were performed in the main human cohort study of this thesis and higher
number of cells positive for these phospho-tau markers also approximately increased with Braak
stages with slight variations in terms of cell number and intracellular immunoreactivity. Future
studies are required to confirm their colocalisation with neurogenic markers in each Braak stage.
194
7.5 Possible contributions of cholinergic innervation to adult hippocampal
neurogenesis
A study demonstrated that 192 IgG-saporin-induced MS/DB lesions in 8-10 wk mice had no
significant effect on AHN in the baseline condition but increased proliferation and impaired
survival of new-born DGCs in the group with running exercise (Ho et al., 2009). Another study,
however, showed that 192 IgG-saporin-induced BFCN lesion significantly decreased baseline
survival of new-born DGCs (Cooper-Kuhn et al., 2004). The 192-IgG-saporin has been shown to
significantly decrease hippocampal ChAT activity and specifically induce higher BFCN loss in the
MS/DB than in the nbM/SI (Berger-Sweeney et al., 2001). These previous studies seemed to
suggest that baseline mouse AHN is relatively resistant to loss of BFCNs in the MS/DB.
Nonetheless, this study seemed to suggest that D427V/WT GBA1 mutation-induced
hippocampal cholinergic signalling impairment from loss of VAChT was sufficient to significantly
increase proliferation of DCX-positive cells. A significant increase in the total number of DCX-
positive cells indicated that there could be a relative defect in postmitotic maturation step.
However, it is impossible to conclude any information regarding survival of these adult-born
neurons without using BrDU to mark a population born within a limited time range. In addition,
while loss of VAChT was prominent in the DG, this increase in the number of DCX-positive cells
could be partially attributed to the endogenous effects of D427V/WT GBA1 mutation within the
DGCs or the other local cell types. A recent study found that DLB/PDD patients even without
antidepressant treatment had higher number of DCX-positive cells than age-matched controls,
albeit not significantly (Gatt et al., 2018). The above previous study and this study on D427V/WT
GBA1 mice together supported the notion of association between DLB/PDD phenotypes and
trends of upregulated AHN.
In comparison to the previous study that showed significant impairment in new-born DGC
survival by 192-IgG saporin in a runner mice group (Ho et al., 2009), another recent study on 4-
mo 5XFAD also showed that reduction in cholinergic terminals on new-born DGCs was
associated with survival impairment and that theta burst stimulation of BFCNs in the VDB/HDB
successfully rescued the survival of new-born DGCs (Zhu et al., 2017). This thesis, however, did
not find any significant difference between 11-mo 5XFAD and WT mice likely due to the minimal
sample size of 3. Nevertheless, the previous study on 5XFAD suggested that amyloid pathology
contributed to the reduction in cholinergic synapses in the DG and supported the finding in this
thesis on the main human cohort that ChAT-positive axon density was significantly decreased
by the increasing CERAD NP scores.
195
7.6 Strengths and Weaknesses
The major overall weakness of this thesis was lack of postmortem tissues from DLB/PDD subjects
in a human cohort despite a chapter on a GBA1 heterozygous mouse model. While % staining
areas of ChAT, DCX, and PCNA of DLB cases have been investigated in a previous study (Johnson
et al., 2011), co-staining of ChAT and VAChT in cholinergic axons or immunohistochemical
marker profiles of DCX-positive cells have not been studied before in DLB/PDD subjects. This
valuable opportunity was missed as the project originally focused on an AD cohort and the study
on GBA1 mouse model only started in the late half of the 3rd year of this thesis project.
Therefore, since the relatively short remaining time was not deemed enough for tissue request
and subsequent imaging and analyses, a study on DLB/PDD cohort was not pursued.
Importantly, this thesis only investigated immunoreactive patterns of certain markers or
association between pairs of markers of interests without any mechanistic approaches.
Therefore, it was impossible to conclude that higher ChAT activity directly promoted maturation
and survival of HuB/D-positive cells or that drastic decrease in hippocampal VAChT or potentially
loss of ACh signals induced higher number of DCX-positive cells in D427V/WT GBA1 mice.
One major weakness of this study on AHN was the lack of stereological technique, a gold
standard for cell density quantification especially for cell types which may be sparsely present
in a given region such as DCX-positive cells in the human DG (Boldrini et al., 2018). While the
estimated distance of a coronal section from the front (cm_front) was included in the model to
account for the potential difference in AHN of different part of the DG, investigation on 3 parts
of the DG as anterior, intermediate, and posterior separately would have been better.
Nevertheless, acquiring different specified parts of the hippocampus from each case could be
difficult as sections from some cases could have been requested by other studies and it would
be impossible to obtain approximate cm_front-matched sections of all cases.
This study requested all human cases only from London Neurodegenerative Disease Brain Bank
and all of them therefore have BDR number and BBN-ID to look up for further information from
the database. However, not all cases have information on cognitive scores such as MMSE for
further analyses. Fortunately, unlike the pilot cases, all of the main cohort cases had CERAD NP
score which was also included in separate analysis models. However, the number of cases was
not large enough to conclusively determine the effects of different NP score within each Braak
stage. Acquisition of brain tissues from the same brain bank minimised the differences in tissue
processing. Only 3 cases were originally from Kent, but there was no apparent anomaly in terms
of staining in these cases. Despite the lack of complete cognitive score record, all Braak IV-VI
cases had dementia diagnosis so it was not necessary to include dementia status as a covariate
196 in a similar way performed by a previous study (Ekonomou et al., 2015). The same previous study
only included the cases without any vascular or synuclein pathology. Acquisition of cases from a
single brain bank limited an option of choosing only cases that were devoid of non-AD pathology.
Despite the lack of conspicuous discrepancy from cases with high white matter degeneration,
Lewy Braak stages, amygdala Lewy body, Hachinski ischemia score, small vessel disease, or TDP-
43 pathology (data not shown) because of a small sample size in each category, it would be
recommended for the future study to exclude them or use proper statistical analyses to account
for these factors.
This study was the first to investigate the colocalisation of VAChT and ChAT in the hippocampus
of AD cases. While the staining pattern was generally homogeneous across the entire DG within
each section, staining repeat on consecutive sections from different longitudinal parts of the
hippocampus would be advisable. Regarding the quantification of VAChT and ChAT, it was
probable that quantification methods of both human cohort study and D427V/WT GBA1 mice
study could have underestimated the % area of VAChT staining. For human study, the threshold
limit of particle size of at least 5px to avoid noises also exclude some portion of verified small
cholinergic terminals as determined by colocalisation between ChAT and VAChT or their
positions along the axon-like chains of staining particles. It would be advisable for the future
study to apply a smaller size threshold with colocalisation verification. For the mice study that
used automatic threshold setting based on average particle size, VAChT-positive puncta were
generally smaller than ChAT staining such that the maximum particle size-yielding threshold of
VAChT staining was frequently higher than that of ChAT staining.
The lack of stereology was also the weakness of this study on the number of DG neurogenic
populations and the BFCNs in mice. Especially for the quantification and characterisation of
BFCNs, the use of a single section exposed the potential variability from the relatively small size
of the BF sub regions. The boundary of the nbM/SI was more difficult to define than that of the
VDB/HDB in sagittal sections and the resulting high variability in the number of BFCNs in the
supposed region was the main incentive to exclude the investigation on the nbM/SI from this
thesis.
Strong PCNA nuclear staining was occasionally observed in DCX- or HuB/D-positive cells in mice.
However, intense PCNA nuclear staining was mainly in radial glia-like cells and rare in DCX- or
HuB/D-positive cells. Most PCNA staining in the cells considered as positive for PCNA was
moderately bright relative to the background and interestingly associated with the intensity of
DAPI staining in those respective cells. A previous study has shown that PCNA could be localised
with caspase-3 in DCX-positive cells (Knoth et al., 2010). In this case, intense DAPI staining could
indicate an abnormally high amount of DNA caused by ectopic cell cycle re-entry, which has
197 been implicated in AD-associated neuronal cell death (Counts and Mufson, 2017; Kodis et al.,
2018). Staining for apoptotic markers could help identify the nature of PCNA staining in each
cell.
D427V/WT GBA1 and 5XFAD mice used in the study were at different ages of 12-mo and 11-mo
respectively. This was a missed opportunity considering that both mouse lines have C57BL6
background. In addition, these 5XFAD paraffin-embedded brains were originally parts of a
separate project managed by Dr David Whitfield at least a year before the start of the GBA1
project. Hence, there could be significant variability from different experimental conditions
between the two mouse lines. Had these two mouse lines used in this thesis were managed and
maintained together and sacrificed at the same age, it would be possible and interesting to
compare cholinergic deficits and changes in AHN of both mouse line and both of their WT
littermate together in the same analyses.
7.7 Future studies
A future human cohort will also include DLB/PDD subjects and cognitively healthy PD subjects
with different extents of Lewy body pathologies and/or potentially GBA1 mutation genotypes.
Local Lewy body pathologies including pS129 will be investigated in relation to the cholinergic
and neurogenic changes. Subjects with comparable NFT Braak stages or other non-Lewy body
pathological features from this Lewy body disease cohort and those from the AD cohort may be
analysed together to study an exclusive effect of Lewy body pathology in different groups of
subjects or different stages of the diseases. A recent study on Lewy pathology in CA2 also found
overwhelming direct overlap between ChAT and α-synuclein but almost between ChAT and
pS396 tau (Liu et al., 2019). Local neuropathological profiles of ChAT, α-synuclein, and phospho-
tau in AD and DLB/PDD cohort together in the DG could provide an insight on the dynamic of
cholinergic changes in different types of dementia and reveal a specific neuropathological
pattern that is highly associated with AHN.
For human cohort, a larger sample size with a minimal number of 3 for each combination of each
Braak stage and CERAD NP score or Thal amyloid stage would reveal the interaction and
individual effects of these major AD-associated pathological hallmarks. Investigation on local
NFT and Aβ staining within the DG would help to verify the association between the DG local
pathology severity and the mandatory classical pathology staging. Furthermore, certain aspects
of the local pathology are potentially more reflective of alterations in cholinergic and neurogenic
markers in the DG. For each case, staining on consecutive sections and stereology would also be
198 applied for each of the 3 sets of sections from the anterior, intermediate, and posterior part of
the DG.
IHC antibody stripping techniques would be optimised in order to allow probing of multiple sets
of different antibodies on the same section. In the pilot study, only the period of incubation and
frequency of shaking were adjusted. In future studies, multiple rounds of shorter incubation and
higher concentration may prove more efficient since the previous studies that established this
protocol mainly tested this technique on a 3±1 µm thick section (Bolognesi et al., 2017) while
the standard thickness of sections from the BDR was 8 µm. If the optimisation is successful,
caspase-3, Sox2, NeuroD, Prox1, calretinin, calbindin, and/or NeuN would be included in the set
of antibodies of AHN for a more complete profiling of DGC developmental stages. For cholinergic
markers, CHT1, m1-mAChR, and α7-nAChR antibodies would be included.
Future studies on D427V/WT GBA1 mice would include the same antibodies listed above for
further characterisation of AHN and cholinergic changes. Furthermore, the staining would be
performed over multiple sections in order to cover the 3-dimensional shape of the VDB/HDB
and the nbM/SI. While it is not possible to distinguish the D427V GCase from the WT GCase,
profiles of subcellular localisation of GCase within different types of cells in the brain especially
the BFCNs may provide an evidence of functional abnormality that contributes to the loss of
VAChT. The current GCase antibody used in our research group was generated in mouse cells.
The background staining from the anti-mouse secondary on endogenous IgG within blood
vessels or cells proximal to an accidental tissue injury can be digitally eliminated by prestaining
with anti-mouse secondary antibodies tagged with different fluorescence channel. The physical
exclusion can be achieved by pre-treatment of sections with the stripping method which
destabilises endogenous IgGs by reducing their disulphide bonds as demonstrated in the pilot
study Chapter 3. Interestingly, preliminary staining (data not shown) has shown that CA2
pyramidal neurons were highly immunoreactive for anti-mouse secondary antibodies. AMIGO2
or Adhesion molecule with Ig-like domain 2 is an established marker of CA2 pyramidal neurons
(Hitti and Siegelbaum, 2014) and its immunoglobulin-like domain is probably a target of an anti-
mouse secondary antibody. Optimisation of either digital or physical exclusion of anti-mouse
secondary antibody background signal would improve the staining clarity in any mouse models
including the D427V/WT or AD-associated models such as 5XFAD. Lastly, future studies on the
D427V/WT mice and AD-associated mice models should include other age points as well in order
to observe the progression of these abnormalities.
199 Multiple experiments could be conducted to unravel the mechanisms behind the difference in
VAChT and ChAT protein regulation. Since ChAT is a cytoplasmic protein but VAChT is an integral
protein on vesicular membrane, defects in trafficking pathway could have caused the observed
disparity in their levels. For example, loss of arl8 gene abolished anterograde transport of
synaptic vesicular proteins VGluT1 and synaptotagmin (Vukoja et al., 2018). Considering that
there was no significant change in VAChT immunoreactivity in the BFCNs, it would be of interest
to screen for any changes in axonal transport-associated proteins or vesicular protein turnover
regulator. If any of them turn up to be reduced in the mouse model, checking whether
overexpression of that protein in the BFCNs (i.e. by injecting with AAV viral vector or generating
bacterial artificial chromosome (BAC) transgenic mice that overexpress the target gene under a
specific promoter e.g. ChAT promoter) can rescue the phenotype would be a possible next step.
On the other hand, VAChT can also be overexpressed in D427V/WT GBA1 mouse by crossing this
heterozygous mouse with a ChAT-ChR2-EYFP transgenic line. Each cell of this mouse line has up
to 50 copies of ChAT-containing BAC (Kolisnyk et al., 2013). A ChR2-EYFP insert is targeted to the
ATG codon in the 4th exon of ChAT gene to drive channelrhodopsin-2 (ChR2) synthesis and
simultaneously prevent translation of ChAT (Zhao et al., 2011). As a result, VAChT gene, which
lies within an intron between exon I and exon II of ChAT, remains intact such that this mouse
overexpresses functional VAChT together with ChR2. In a more general view, it would be
important to check whether overexpression with WT GBA1 or ablation of SNCA gene can rescue
the VAChT loss phenotype. Conversely, investigating AHN in a mouse model of specific VAChT
loss in BFCNs of the MS/VDB by injecting AAV8-Cre into the MS/VDN of VAChTflox/flox mouse in a
previous study (Kolisnyk et al., 2016) would help confirm whether loss of VAChT alone could
increase DCX-positive cells in the same manner.
AHN specifically the number of DCX-positive cells was found to be highly sensitive to
neuropathology (Moreno-Jiménez et al., 2019). Subjects with Braak 0 and Braak I had similar
degree of local NFT pathology in the DG, but Braak I cases had significantly less DCX-positive
cells than Braak 0 cases. In this thesis, albeit not statistically significant, mean xHD and HnP cells,
which were also significantly correlated with ChAT, also decreased sharply in Braak I (n=2) and
Braak II (n=8) compared with Braak 0. Since AHN is a sensitive and dynamic system with close
association to the cholinergic system, in vivo or CSF/blood based AHN markers may prove helpful
for monitoring the changes in patients with preclinical or prodromal AD during clinical trials of
therapeutic cholinergic interventions. Interestingly, a recent pre peer-reviewed published study
demonstrated that suppression of AHN decreased hippocampal ACh release, induced
septohippocampal projection rewiring, and eventually working memory deficits (Kirshenbaum
et al., 2018). Potential mechanisms may include NGF/TrkA pathway, other retrograde signalling,
200 or possible interaction between MS-projecting hilar interneurons and adult-born DGC. Direct
AHN-targeting approaches such as SSRI coupled with cardiovascular exercises may prove more
beneficial to the whole septohippocampal circuitry than they had been expected.
In conclusion, this thesis has demonstrated evidence to support a relationship between
cholinergic innervation and neurogenesis in human hippocampus. The relationship is complex
and is influenced by tau pathology. The examination of two animal models provided some
potential mechanistic leads which could be followed up. The observed relationship between
cholinergic innervation and neurogenesis may provide some explanations for symptomatic
benefit of cholinomimetic therapy and it would be interesting to follow this in patients if and
when suitable ligands for neurogenic markers become available to complement those for the
cholinergic system.
201
8 Bibliography
Aarsland D, Zaccai J, Brayne C (2005) A systematic review of prevalence studies of dementia in Parkinson's disease. Mov Disord 20:1255-1263.
Aarsland D, Andersen K, Larsen JP, Lolk A, Kragh-Sorensen P (2003) Prevalence and characteristics of dementia in Parkinson disease: an 8-year prospective study. Archives of neurology 60:387-392.
Aarsland D, Rongve A, Nore SP, Skogseth R, Skulstad S, Ehrt U, Hoprekstad D, Ballard C (2008) Frequency and case identification of dementia with Lewy bodies using the revised consensus criteria. Dement Geriatr Cogn Disord 26:445-452.
Acsady L, Kamondi A, Sik A, Freund T, Buzsaki G (1998) GABAergic cells are the major postsynaptic targets of mossy fibers in the rat hippocampus. The Journal of neuroscience : the official journal of the Society for Neuroscience 18:3386-3403.
Adamowicz DH, Roy S, Salmon DP, Galasko DR, Hansen LA, Masliah E, Gage FH (2017) Hippocampal alpha-Synuclein in Dementia with Lewy Bodies Contributes to Memory Impairment and Is Consistent with Spread of Pathology. Journal of Neuroscience 37:1675-1684.
Adlaf EW, Vaden RJ, Niver AJ, Manuel AF, Onyilo VC, Araujo MT, Dieni CV, Vo HT, King GD, Wadiche JI, Overstreet-Wadiche L (2017) Adult-born neurons modify excitatory synaptic transmission to existing neurons. eLife 6.
Adlard PA et al. (2008) Rapid restoration of cognition in Alzheimer's transgenic mice with 8-hydroxy quinoline analogs is associated with decreased interstitial Abeta. Neuron 59:43-55.
Adler DH et al. (2018) Characterizing the human hippocampus in aging and Alzheimer's disease using a computational atlas derived from ex vivo MRI and histology. Proceedings of the National Academy of Sciences of the United States of America 115:4252-4257.
Aghourian M, Legault-Denis C, Soucy JP, Rosa-Neto P, Gauthier S, Kostikov A, Gravel P, Bedard MA (2017) Quantification of brain cholinergic denervation in Alzheimer's disease using PET imaging with [(18)F]-FEOBV. Molecular psychiatry 22:1531-1538.
Aharon-Peretz J, Rosenbaum H, Gershoni-Baruch R (2004) Mutations in the glucocerebrosidase gene and Parkinson's disease in Ashkenazi Jews. N Engl J Med 351:1972-1977.
Ahmad MH, Fatima M, Mondal AC (2019) Influence of microglia and astrocyte activation in the neuroinflammatory pathogenesis of Alzheimer's disease: Rational insights for the therapeutic approaches. Journal of clinical neuroscience : official journal of the Neurosurgical Society of Australasia 59:6-11.
Aid T, Kazantseva A, Piirsoo M, Palm K, Timmusk T (2007) Mouse and rat BDNF gene structure and expression revisited. Journal of neuroscience research 85:525-535.
Aimone JB (2016) Computational Modeling of Adult Neurogenesis. Cold Spring Harbor perspectives in biology 8:a018960.
Akers KG, Martinez-Canabal A, Restivo L, Yiu AP, De Cristofaro A, Hsiang HL, Wheeler AL, Guskjolen A, Niibori Y, Shoji H, Ohira K, Richards BA, Miyakawa T, Josselyn SA, Frankland PW (2014) Hippocampal neurogenesis regulates forgetting during adulthood and infancy. Science 344:598-602.
Al-Onaizi MA, Parfitt GM, Kolisnyk B, Law CS, Guzman MS, Barros DM, Leung LS, Prado MA, Prado VF (2017) Regulation of Cognitive Processing by Hippocampal Cholinergic Tone. Cerebral cortex (New York, NY : 1991) 27:1615-1628.
Alafuzoff I et al. (2008) Staging of neurofibrillary pathology in Alzheimer's disease: a study of the BrainNet Europe Consortium. Brain pathology 18:484-496.
Albert MS, DeKosky ST, Dickson D, Dubois B, Feldman HH, Fox NC, Gamst A, Holtzman DM, Jagust WJ, Petersen RC, Snyder PJ, Carrillo MC, Thies B, Phelps CH (2011) The diagnosis of mild cognitive impairment due to Alzheimer's disease: recommendations from the National
202
Institute on Aging-Alzheimer's Association workgroups on diagnostic guidelines for Alzheimer's disease. Alzheimer's & dementia : the journal of the Alzheimer's Association 7:270-279.
Alenina N, Klempin F (2015) The role of serotonin in adult hippocampal neurogenesis. Behav Brain Res 277:49-57.
Allen M, Bird C, Feng W, Liu GL, Li WQ, Perrone-Bizzozero NI, Feng Y (2013) HuD Promotes BDNF Expression in Brain Neurons via Selective Stabilization of the BDNF Long 3 ' UTR mRNA. PloS one 8.
Altman J (1969) Autoradiographic and histological studies of postnatal neurogenesis. IV. Cell proliferation and migration in the anterior forebrain, with special reference to persisting neurogenesis in the olfactory bulb. The Journal of comparative neurology 137:433-457.
Altman J, Das GD (1965) Autoradiographic and histological evidence of postnatal hippocampal neurogenesis in rats. The Journal of comparative neurology 124:319-335.
Alzforum (2018a) Databases; Mutations. In: https://www.alzforum.org/mutations. Alzforum (2018b) Research Models; Alzheimer's disease. In:
https://www.alzforum.org/research-models/alzheimers-disease. Amaral DG, Witter MP (1989) The three-dimensional organization of the hippocampal
formation: a review of anatomical data. Neuroscience 31:571-591. Amaral DG, Insausti R, Cowan WM (1984) The commissural connections of the monkey
hippocampal formation. The Journal of comparative neurology 224:307-336. Anaclet C, Pedersen NP, Ferrari LL, Venner A, Bass CE, Arrigoni E, Fuller PM (2015) Basal forebrain
control of wakefulness and cortical rhythms. Nature communications 6:8744. Anderson JP, Walker DE, Goldstein JM, de Laat R, Banducci K, Caccavello RJ, Barbour R, Huang
JP, Kling K, Lee M, Diep L, Keim PS, Shen XF, Chataway T, Schlossmacher MG, Seubert P, Schenk D, Sinha S, Gai WP, Chilcote TJ (2006) Phosphorylation of Ser-129 is the dominant pathological modification of alpha-synuclein in familial and sporadic Lewy body disease. Journal of Biological Chemistry 281:29739-29752.
Araque Caballero MA et al. (2018) White matter diffusion alterations precede symptom onset in autosomal dominant Alzheimer's disease. Brain : a journal of neurology 141:3065-3080.
Arndt JW, Qian F, Smith BA, Quan C, Kilambi KP, Bush MW, Walz T, Pepinsky RB, Bussiere T, Hamann S, Cameron TO, Weinreb PH (2018) Structural and kinetic basis for the selectivity of aducanumab for aggregated forms of amyloid-beta. Scientific reports 8:6412.
Asselta R, Rimoldi V, Siri C, Cilia R, Guella I, Tesei S, Solda G, Pezzoli G, Duga S, Goldwurm S (2014) Glucocerebrosidase mutations in primary parkinsonism. Parkinsonism Relat Disord 20:1215-1220.
Association AP (2013) Diagnostic and Statistical Manual of Mental Disorders. In, fifth edition Edition. Arlington, VA: American Psychiatric Publishing.
Attardo A, Fabel K, Krebs J, Haubensak W, Huttner WB, Kempermann G (2010) Tis21 expression marks not only populations of neurogenic precursor cells but also new postmitotic neurons in adult hippocampal neurogenesis. Cerebral cortex (New York, NY : 1991) 20:304-314.
Ayton S, Lei P, Bush AI (2013) Metallostasis in Alzheimer's disease. Free radical biology & medicine 62:76-89.
Aznavour N, Mechawar N, Descarries L (2002) Comparative analysis of cholinergic innervation in the dorsal hippocampus of adult mouse and rat: a quantitative immunocytochemical study. Hippocampus 12:206-217.
Bakker A, Krauss GL, Albert MS, Speck CL, Jones LR, Stark CE, Yassa MA, Bassett SS, Shelton AL, Gallagher M (2012) Reduction of hippocampal hyperactivity improves cognition in amnestic mild cognitive impairment. Neuron 74:467-474.
Ballard C, Youakim JM, Coate B, Stankovic S (2019) Pimavanserin in Alzheimer's Disease Psychosis: Efficacy in Patients with More Pronounced Psychotic Symptoms. The journal of prevention of Alzheimer's disease 6:27-33.
203 Ballard C, Banister C, Khan Z, Cummings J, Demos G, Coate B, Youakim JM, Owen R, Stankovic S
(2018) Evaluation of the safety, tolerability, and efficacy of pimavanserin versus placebo in patients with Alzheimer's disease psychosis: a phase 2, randomised, placebo-controlled, double-blind study. The Lancet Neurology 17:213-222.
Ballard C, Piggott M, Johnson M, Cairns N, Perry R, McKeith I, Jaros E, O'Brien J, Holmes C, Perry E (2000) Delusions associated with elevated muscarinic binding in dementia with Lewy bodies. Annals of neurology 48:868-876.
Ballard CG (2002) Advances in the treatment of Alzheimer's disease: benefits of dual cholinesterase inhibition. European neurology 47:64-70.
Ballard CG, Gauthier S, Cummings JL, Brodaty H, Grossberg GT, Robert P, Lyketsos CG (2009) Management of agitation and aggression associated with Alzheimer disease. Nature reviews Neurology 5:245-255.
Ballinger EC, Ananth M, Talmage DA, Role LW (2016) Basal Forebrain Cholinergic Circuits and Signaling in Cognition and Cognitive Decline. Neuron 91:1199-1218.
Bandopadhyay R, Liu JY, Sisodiya SM, Thom M (2014) A comparative study of the dentate gyrus in hippocampal sclerosis in epilepsy and dementia. Neuropathology and applied neurobiology 40:177-190.
Banerjee S et al. (2011) Sertraline or mirtazapine for depression in dementia (HTA-SADD): a randomised, multicentre, double-blind, placebo-controlled trial. Lancet 378:403-411.
Bao H, Asrican B, Li W, Gu B, Wen Z, Lim SA, Haniff I, Ramakrishnan C, Deisseroth K, Philpot B, Song J (2017) Long-Range GABAergic Inputs Regulate Neural Stem Cell Quiescence and Control Adult Hippocampal Neurogenesis. Cell stem cell 21:604-617 e605.
Baratchi S, Evans J, Tate WP, Abraham WC, Connor B (2012) Secreted amyloid precursor proteins promote proliferation and glial differentiation of adult hippocampal neural progenitor cells. Hippocampus 22:1517-1527.
Barnes CA, Meltzer J, Houston F, Orr G, McGann K, Wenk GL (2000) Chronic treatment of old rats with donepezil or galantamine: effects on memory, hippocampal plasticity and nicotinic receptors. Neuroscience 99:17-23.
Beckervordersandforth R, Zhang CL, Lie DC (2015) Transcription-Factor-Dependent Control of Adult Hippocampal Neurogenesis. Cold Spring Harbor perspectives in biology 7.
Bejanin S, Cervini R, Mallet J, Berrard S (1994) A unique gene organization for two cholinergic markers, choline acetyltransferase and a putative vesicular transporter of acetylcholine. The Journal of biological chemistry 269:21944-21947.
Bekinschtein P, Kent BA, Oomen CA, Clemenson GD, Gage FH, Saksida LM, Bussey TJ (2013) BDNF in the dentate gyrus is required for consolidation of "pattern-separated" memories. Cell Rep 5:759-768.
Bekinschtein P, Kent BA, Oomen CA, Clemenson GD, Gage FH, Saksida LM, Bussey TJ (2014) Brain-derived neurotrophic factor interacts with adult-born immature cells in the dentate gyrus during consolidation of overlapping memories. Hippocampus 24:905-911.
Ben-Ari Y (2002) Excitatory actions of gaba during development: the nature of the nurture. Nature reviews Neuroscience 3:728-739.
Benjamini Y, Krieger AM, Yekutieli D (2006) Adaptive linear step-up procedures that control the false discovery rate. Biometrika 93:491-507.
Benoy A, Dasgupta A, Sajikumar S (2018) Hippocampal area CA2: an emerging modulatory gateway in the hippocampal circuit. Exp Brain Res.
Berger-Sweeney J, Stearns NA, Murg SL, Floerke-Nashner LR, Lappi DA, Baxter MG (2001) Selective immunolesions of cholinergic neurons in mice: effects on neuroanatomy, neurochemistry, and behavior. The Journal of neuroscience : the official journal of the Society for Neuroscience 21:8164-8173.
Bergmann O, Spalding KL, Frisen J (2015) Adult Neurogenesis in Humans. Cold Spring Harbor perspectives in biology 7:a018994.
204 Bernabeu RO, Longo FM (2010) The p75 neurotrophin receptor is expressed by adult mouse
dentate progenitor cells and regulates neuronal and non-neuronal cell genesis. BMC neuroscience 11:136.
Berse B, Lopez-Coviella I, Blusztajn JK (1999) Activation of TrkA by nerve growth factor upregulates expression of the cholinergic gene locus but attenuates the response to ciliary neurotrophic growth factor. Biochem J 342 ( Pt 2):301-308.
Berse B, Szczecinska W, Lopez-Coviella I, Madziar B, Zemelko V, Kaminski R, Kozar K, Lips KS, Pfeil U, Blusztajn JK (2005) Expression of high affinity choline transporter during mouse development in vivo and its upregulation by NGF and BMP-4 in vitro. Brain Res Dev Brain Res 157:132-140.
Birch AM, Kelly AM (2013) Chronic intracerebroventricular infusion of nerve growth factor improves recognition memory in the rat. Neuropharmacology 75:255-261.
Bissette G, Seidler FJ, Nemeroff CB, Slotkin TA (1996) High affinity choline transporter status in Alzheimer's disease tissue from rapid autopsy. Annals of the New York Academy of Sciences 777:197-204.
Blanco-Silvente L, Capella D, Garre-Olmo J, Vilalta-Franch J, Castells X (2018) Predictors of discontinuation, efficacy, and safety of memantine treatment for Alzheimer's disease: meta-analysis and meta-regression of 18 randomized clinical trials involving 5004 patients. BMC geriatrics 18:168.
Blennow K (2017) A Review of Fluid Biomarkers for Alzheimer's Disease: Moving from CSF to Blood. Neurology and therapy 6:15-24.
Blennow K, Wallin A, Gottfries CG, Lekman A, Karlsson I, Skoog I, Svennerholm L (1992) Significance of decreased lumbar CSF levels of HVA and 5-HIAA in Alzheimer's disease. Neurobiology of aging 13:107-113.
Blesa R, Toriyama K, Ueda K, Knox S, Grossberg G (2018) Strategies for Continued Successful Treatment in Patients with Alzheimer's Disease: An Overview of Switching Between Pharmacological Agents. Current Alzheimer research 15:964-974.
Bloch J, Kaeser M, Sadeghi Y, Rouiller EM, Redmond DE, Jr., Brunet JF (2011) Doublecortin-positive cells in the adult primate cerebral cortex and possible role in brain plasticity and development. The Journal of comparative neurology 519:775-789.
Bloem B, Schoppink L, Rotaru DC, Faiz A, Hendriks P, Mansvelder HD, van de Berg WD, Wouterlood FG (2014) Topographic mapping between basal forebrain cholinergic neurons and the medial prefrontal cortex in mice. The Journal of neuroscience : the official journal of the Society for Neuroscience 34:16234-16246.
Blurton-Jones M, Kitazawa M, Martinez-Coria H, Castello NA, Muller FJ, Loring JF, Yamasaki TR, Poon WW, Green KN, LaFerla FM (2009) Neural stem cells improve cognition via BDNF in a transgenic model of Alzheimer disease. Proceedings of the National Academy of Sciences of the United States of America 106:13594-13599.
Blusztajn JK, Rinnofner J (2016) Intrinsic Cholinergic Neurons in the Hippocampus: Fact or Artifact? Frontiers in synaptic neuroscience 8:6.
Blusztajn JK, Slack BE, Mellott TJ (2017) Neuroprotective Actions of Dietary Choline. Nutrients 9. Boekhoorn K, Joels M, Lucassen PJ (2006) Increased proliferation reflects glial and vascular-
associated changes, but not neurogenesis in the presenile Alzheimer hippocampus. Neurobiology of disease 24:1-14.
Boldrini M, Fulmore CA, Tartt AN, Simeon LR, Pavlova I, Poposka V, Rosoklija GB, Stankov A, Arango V, Dwork AJ, Hen R, Mann JJ (2018) Human Hippocampal Neurogenesis Persists throughout Aging. Cell stem cell 22:589-599.e585.
Bolognani F, Tanner DC, Nixon S, Okano HJ, Okano H, Perrone-Bizzozero NI (2007) Coordinated expression of HuD and GAP-43 in hippocampal dentate granule cells during developmental and adult plasticity. Neurochem Res 32:2142-2151.
Bolognesi MM, Manzoni M, Scalia CR, Zannella S, Bosisio FM, Faretta M, Cattoretti G (2017) Multiplex Staining by Sequential Immunostaining and Antibody Removal on Routine Tissue Sections. J Histochem Cytochem 65:431-444.
205 Bolos M, Pallas-Bazarra N, Terreros-Roncal J, Perea JR, Jurado-Arjona J, Avila J, Llorens-Martin
M (2017) Soluble Tau has devastating effects on the structural plasticity of hippocampal granule neurons. Transl Psychiatry 7:1267.
Bookheimer SY, Strojwas MH, Cohen MS, Saunders AM, Pericak-Vance MA, Mazziotta JC, Small GW (2000) Patterns of brain activation in people at risk for Alzheimer's disease. N Engl J Med 343:450-456.
Bortz DM, Grace AA (2018) Medial septum differentially regulates dopamine neuron activity in the rat ventral tegmental area and substantia nigra via distinct pathways. Neuropsychopharmacology : official publication of the American College of Neuropsychopharmacology 43:2093-2100.
Bowen DM, Smith CB, White P, Davison AN (1976) Neurotransmitter-related enzymes and indices of hypoxia in senile dementia and other abiotrophies. Brain : a journal of neurology 99:459-496.
Braak H, Braak E (1991) Neuropathological stageing of Alzheimer-related changes. Acta neuropathologica 82:239-259.
Braak H, Del Tredici K (2011) The pathological process underlying Alzheimer's disease in individuals under thirty. Acta neuropathologica 121:171-181.
Braak H, Thal DR, Ghebremedhin E, Del Tredici K (2011) Stages of the pathologic process in Alzheimer disease: age categories from 1 to 100 years. Journal of neuropathology and experimental neurology 70:960-969.
Braak H, Alafuzoff I, Arzberger T, Kretzschmar H, Del Tredici K (2006) Staging of Alzheimer disease-associated neurofibrillary pathology using paraffin sections and immunocytochemistry. Acta neuropathologica 112:389-404.
Braak H, Del Tredici K, Rub U, de Vos RA, Jansen Steur EN, Braak E (2003) Staging of brain pathology related to sporadic Parkinson's disease. Neurobiology of aging 24:197-211.
Brandt MD, Jessberger S, Steiner B, Kronenberg G, Reuter K, Bick-Sander A, von der Behrens W, Kempermann G (2003) Transient calretinin expression defines early postmitotic step of neuronal differentiation in adult hippocampal neurogenesis of mice. Molecular and cellular neurosciences 24:603-613.
Brännström K, Lindhagen-Persson M, Gharibyan AL, Iakovleva I, Vestling M, Sellin ME, Brannstrom T, Morozova-Roche L, Forsgren L, Olofsson A (2014) A generic method for design of oligomer-specific antibodies. PloS one 9:e90857.
Brendel M, Sauerbeck J, Greven S, Kotz S, Scheiwein F, Blautzik J, Delker A, Pogarell O, Ishii K, Bartenstein P, Rominger A (2018) Serotonin Selective Reuptake Inhibitor Treatment Improves Cognition and Grey Matter Atrophy but not Amyloid Burden During Two-Year Follow-Up in Mild Cognitive Impairment and Alzheimer's Disease Patients with Depressive Symptoms. Journal of Alzheimer's disease : JAD 65:793-806.
Brezun JM, Daszuta A (2000) Serotonergic reinnervation reverses lesion-induced decreases in PSA-NCAM labeling and proliferation of hippocampal cells in adult rats. Hippocampus 10:37-46.
Briley D, Ghirardi V, Woltjer R, Renck A, Zolochevska O, Taglialatela G, Micci MA (2016) Preserved neurogenesis in non-demented individuals with AD neuropathology. Scientific reports 6.
Brock M, Nickel AC, Madziar B, Blusztajn JK, Berse B (2007) Differential regulation of the high affinity choline transporter and the cholinergic locus by cAMP signaling pathways. Brain research 1145:1-10.
Brunner J, Neubrandt M, Van-Weert S, Andrasi T, Kleine Borgmann FB, Jessberger S, Szabadics J (2014) Adult-born granule cells mature through two functionally distinct states. eLife 3:e03104.
Buell AK, Galvagnion C, Gaspar R, Sparr E, Vendruscolo M, Knowles TPJ, Linse S, Dobson CM (2014) Solution conditions determine the relative importance of nucleation and growth processes in alpha-synuclein aggregation. Proceedings of the National Academy of Sciences of the United States of America 111:7671-7676.
206 Buhusi M, Etheredge C, Granholm AC, Buhusi CV (2017) Increased Hippocampal ProBDNF
Contributes to Memory Impairments in Aged Mice. Frontiers in aging neuroscience 9:284.
Bullwinkel J, Baron-Luhr B, Ludemann A, Wohlenberg C, Gerdes J, Scholzen T (2006) Ki-67 protein is associated with ribosomal RNA transcription in quiescent and proliferating cells. J Cell Physiol 206:624-635.
Burack MA, Hartlein J, Flores HP, Taylor-Reinwald L, Perlmutter JS, Cairns NJ (2010) In vivo amyloid imaging in autopsy-confirmed Parkinson disease with dementia. Neurology 74:77-84.
Burre J, Sharma M, Sudhof TC (2018) Cell Biology and Pathophysiology of alpha-Synuclein. Cold Spring Harb Perspect Med 8.
Burton EJ, Mukaetova-Ladinska EB, Perry RH, Jaros E, Barber R, O'Brien JT (2012) Neuropathological correlates of volumetric MRI in autopsy-confirmed Lewy body dementia. Neurobiology of aging 33:1228-1236.
Burton EJ, Barber R, Mukaetova-Ladinska EB, Robson J, Perry RH, Jaros E, Kalaria RN, O'Brien JT (2009) Medial temporal lobe atrophy on MRI differentiates Alzheimer's disease from dementia with Lewy bodies and vascular cognitive impairment: a prospective study with pathological verification of diagnosis. Brain : a journal of neurology 132:195-203.
Bush D, Philippides A, Husbands P, O'Shea M (2010) Dual coding with STDP in a spiking recurrent neural network model of the hippocampus. PLoS computational biology 6:e1000839.
Cai K, Xu H, Guan H, Zhu W, Jiang J, Cui Y, Zhang J, Liu T, Wen W (2017) Identification of Early-Stage Alzheimer's Disease Using Sulcal Morphology and Other Common Neuroimaging Indices. PloS one 12:e0170875.
Caminiti SP, Ballarini T, Sala A, Cerami C, Presotto L, Santangelo R, Fallanca F, Vanoli EG, Gianolli L, Iannaccone S, Magnani G, Perani D, Project B (2018) FDG-PET and CSF biomarker accuracy in prediction of conversion to different dementias in a large multicentre MCI cohort. Neuroimage Clin 18:167-177.
Campbell NR, Fernandes CC, Halff AW, Berg DK (2010) Endogenous signaling through alpha7-containing nicotinic receptors promotes maturation and integration of adult-born neurons in the hippocampus. The Journal of neuroscience : the official journal of the Society for Neuroscience 30:8734-8744.
Campion D, Dumanchin C, Hannequin D, Dubois B, Belliard S, Puel M, Thomas-Anterion C, Michon A, Martin C, Charbonnier F, Raux G, Camuzat A, Penet C, Mesnage V, Martinez M, Clerget-Darpoux F, Brice A, Frebourg T (1999) Early-onset autosomal dominant Alzheimer disease: prevalence, genetic heterogeneity, and mutation spectrum. American journal of human genetics 65:664-670.
Case DT, Burton SD, Gedeon JY, Williams SG, Urban NN, Seal RP (2017) Layer- and cell type-selective co-transmission by a basal forebrain cholinergic projection to the olfactory bulb. Nature communications 8:652.
Castillo-Carranza DL, Guerrero-Munoz MJ, Sengupta U, Gerson JE, Kayed R (2018) alpha-Synuclein Oligomers Induce a Unique Toxic Tau Strain. Biological psychiatry 84:499-508.
Celebi O, Temucin CM, Elibol B, Saka E (2012) Short latency afferent inhibition in Parkinson's disease patients with dementia. Mov Disord 27:1052-1055.
Cerf E, Sarroukh R, Tamamizu-Kato S, Breydo L, Derclaye S, Dufrene YF, Narayanaswami V, Goormaghtigh E, Ruysschaert JM, Raussens V (2009) Antiparallel beta-sheet: a signature structure of the oligomeric amyloid beta-peptide. Biochem J 421:415-423.
Chancey JH, Poulsen DJ, Wadiche JI, Overstreet-Wadiche L (2014) Hilar Mossy Cells Provide the First Glutamatergic Synapses to Adult-Born Dentate Granule Cells. Journal of Neuroscience 34:2349-2354.
Chang Q, Gold PE (2004) Impaired and spared cholinergic functions in the hippocampus after lesions of the medial septum/vertical limb of the diagonal band with 192 IgG-saporin. Hippocampus 14:170-179.
207 Chavez-Gutierrez L, Bammens L, Benilova I, Vandersteen A, Benurwar M, Borgers M, Lismont S,
Zhou L, Van Cleynenbreugel S, Esselmann H, Wiltfang J, Serneels L, Karran E, Gijsen H, Schymkowitz J, Rousseau F, Broersen K, De Strooper B (2012) The mechanism of gamma-Secretase dysfunction in familial Alzheimer disease. The EMBO journal 31:2261-2274.
Chen CPL-H, Eastwood SL, Hope T, McDonald B, Francis PT, Esiri MM (2000) Immunocytochemical study of the dorsal and median raphe nuclei in patients with Alzheimer’s disease prospectively assessed for behavioural changes. Neuropathology and applied neurobiology 26:347-355.
Chen N, Sugihara H, Sur M (2015a) An acetylcholine-activated microcircuit drives temporal dynamics of cortical activity. Nature neuroscience 18:892-902.
Chen SW, Drakulic S, Deas E, Ouberai M, Aprile FA, Rivas G, Abramov AY, Valpuesta JM, Dobson CM, Cremades N (2015b) Structural characterization of toxic oligomers that are kinetically trapped during alpha-synuclein fibril formation. Protein Sci 24:136-136.
Cheng X-T, Xie Y-X, Zhou B, Huang N, Farfel-Becker T, Sheng Z-H (2018) Characterization of LAMP1-labeled nondegradative lysosomal and endocytic compartments in neurons. The Journal of cell biology 217:3127-3139.
Chohan MO, Khatoon S, Iqbal IG, Iqbal K (2006) Involvement of I2PP2A in the abnormal hyperphosphorylation of tau and its reversal by Memantine. FEBS letters 580:3973-3979.
Choi JM, Kim WC, Lyoo CH, Kang SY, Lee PH, Baik JS, Koh SB, Ma HI, Sohn YH, Lee MS, Kim YJ (2012) Association of mutations in the glucocerebrosidase gene with Parkinson disease in a Korean population. Neuroscience letters 514:12-15.
Choi SH, Bylykbashi E, Chatila ZK, Lee SW, Pulli B, Clemenson GD, Kim E, Rompala A, Oram MK, Asselin C, Aronson J, Zhang C, Miller SJ, Lesinski A, Chen JW, Kim DY, van Praag H, Spiegelman BM, Gage FH, Tanzi RE (2018) Combined adult neurogenesis and BDNF mimic exercise effects on cognition in an Alzheimer's mouse model. Science 361.
Chow N, Hwang KS, Hurtz S, Green AE, Somme JH, Thompson PM, Elashoff DA, Jack CR, Weiner M, Apostolova LG (2015) Comparing 3T and 1.5T MRI for mapping hippocampal atrophy in the Alzheimer's Disease Neuroimaging Initiative. AJNR American journal of neuroradiology 36:653-660.
Chukwu JE, Pedersen JT, Pedersen LO, Volbracht C, Sigurdsson EM, Kong XP (2018) Tau Antibody Structure Reveals a Molecular Switch Defining a Pathological Conformation of the Tau Protein. Scientific reports 8:6209.
Chun H, An H, Lim J, Woo J, Lee J, Ryu H, Lee CJ (2018) Astrocytic proBDNF and Tonic GABA Distinguish Active versus Reactive Astrocytes in Hippocampus. Experimental neurobiology 27:155-170.
Cilia R et al. (2016) Survival and dementia in GBA-associated Parkinson's disease: The mutation matters. Annals of neurology 80:662-673.
Clark CM, Pontecorvo MJ, Beach TG, Bedell BJ, Coleman RE, Doraiswamy PM, Fleisher AS, Reiman EM, Sabbagh MN, Sadowsky CH, Schneider JA, Arora A, Carpenter AP, Flitter ML, Joshi AD, Krautkramer MJ, Lu M, Mintun MA, Skovronsky DM (2012) Cerebral PET with florbetapir compared with neuropathology at autopsy for detection of neuritic amyloid-β plaques: a prospective cohort study. The Lancet Neurology 11:669-678.
Clarke EJ (2018) The Unfolded Protein Responses – a potential link between heterozygous mutations in GBA1 and Lewy body dementia? In: Wolfson Centre for Age-Related Diseases, IoPPN, pp 200-208: King's College London.
Clayton DF, George JM (1998) The synucleins: a family of proteins involved in synaptic function, plasticity, neurodegeneration and disease. Trends in neurosciences 21:249-254.
Clelland CD, Choi M, Romberg C, Clemenson GD, Jr., Fragniere A, Tyers P, Jessberger S, Saksida LM, Barker RA, Gage FH, Bussey TJ (2009) A functional role for adult hippocampal neurogenesis in spatial pattern separation. Science 325:210-213.
Cline EN, Bicca MA, Viola KL, Klein WL (2018) The Amyloid-beta Oligomer Hypothesis: Beginning of the Third Decade. Journal of Alzheimer's disease : JAD 64:S567-s610.
208 ClinicalTrials.gov (2015) A 6 Month, Open-Label, Pilot Futility Clinical Trial of Oral Salsalate for
Progressive Supranuclear Palsy. In: US National Library of Medicine. Cohen SI, Linse S, Luheshi LM, Hellstrand E, White DA, Rajah L, Otzen DE, Vendruscolo M, Dobson
CM, Knowles TP (2013) Proliferation of amyloid-beta42 aggregates occurs through a secondary nucleation mechanism. Proceedings of the National Academy of Sciences of the United States of America 110:9758-9763.
Cohen SIA, Cukalevski R, Michaels TCT, Saric A, Tornquist M, Vendruscolo M, Dobson CM, Buell AK, Knowles TPJ, Linse S (2018) Distinct thermodynamic signatures of oligomer generation in the aggregation of the amyloid-beta peptide. Nat Chem.
Congdon EE, Sigurdsson EM (2018) Tau-targeting therapies for Alzheimer disease. Nature reviews Neurology 14:399-415.
Cooper-Kuhn CM, Winkler J, Kuhn HG (2004) Decreased neurogenesis after cholinergic forebrain lesion in the adult rat. Journal of neuroscience research 77:155-165.
Coppola JJ, Ward NJ, Jadi MP, Disney AA (2016) Modulatory compartments in cortex and local regulation of cholinergic tone. J Physiol Paris 110:3-9.
Costantini C, Scrable H, Puglielli L (2006) An aging pathway controls the TrkA to p75NTR receptor switch and amyloid beta-peptide generation. The EMBO journal 25:1997-2006.
Counts SE, Mufson EJ (2010) Noradrenaline activation of neurotrophic pathways protects against neuronal amyloid toxicity. Journal of neurochemistry 113:649-660.
Counts SE, Mufson EJ (2017) Regulator of Cell Cycle (RGCC) Expression During the Progression of Alzheimer's Disease. Cell Transplant 26:693-702.
Creese B, Bell E, Johar I, Francis P, Ballard C, Aarsland D (2017) Glucocerebrosidase mutations and neuropsychiatric phenotypes in Parkinson's disease and Lewy body dementias: Review and meta-analyses. Am J Med Genet B Neuropsychiatr Genet.
Crews L, Adame A, Patrick C, Delaney A, Pham E, Rockenstein E, Hansen L, Masliah E (2010) Increased BMP6 levels in the brains of Alzheimer's disease patients and APP transgenic mice are accompanied by impaired neurogenesis. The Journal of neuroscience : the official journal of the Society for Neuroscience 30:12252-12262.
Cromarty RA, Elder GJ, Graziadio S, Baker M, Bonanni L, Onofrj M, O'Brien JT, Taylor JP (2016) Neurophysiological biomarkers for Lewy body dementias. Clin Neurophysiol 127:349-359.
Cruz MP (2017) Pimavanserin (Nuplazid): A Treatment for Hallucinations and Delusions Associated With Parkinson's Disease. P & T : a peer-reviewed journal for formulary management 42:368-371.
Cuello AC (2006) Cholinergic synaptic terminations in the cerebral cortex, trophic factor dependency, and vulnerability to aging and Alzheimer's pathology. In: The brain cholinergic system in health and disease (Giacobini E, Pepeu G, eds), pp 33-46. Abingdon: Informa Healthcare.
Cummings J, Fox N (2017) Defining Disease Modifying Therapy for Alzheimer's Disease. The journal of prevention of Alzheimer's disease 4:109-115.
Cummings JL (1997) The Neuropsychiatric Inventory: assessing psychopathology in dementia patients. Neurology 48:S10-16.
Cuylen S, Blaukopf C, Politi AZ, Muller-Reichert T, Neumann B, Poser I, Ellenberg J, Hyman AA, Gerlich DW (2016) Ki-67 acts as a biological surfactant to disperse mitotic chromosomes. Nature 535:308-+.
Dani JA, Bertrand D (2007) Nicotinic acetylcholine receptors and nicotinic cholinergic mechanisms of the central nervous system. Annual review of pharmacology and toxicology 47:699-729.
Danielson NB, Kaifosh P, Zaremba JD, Lovett-Barron M, Tsai J, Denny CA, Balough EM, Goldberg AR, Drew LJ, Hen R, Losonczy A, Kheirbek MA (2016) Distinct Contribution of Adult-Born Hippocampal Granule Cells to Context Encoding. Neuron 90:101-112.
Dasgupta A, Baby N, Krishna K, Hakim M, Wong YP, Behnisch T, Soong TW, Sajikumar S (2017) Substance P induces plasticity and synaptic tagging/capture in rat hippocampal area
209
CA2. Proceedings of the National Academy of Sciences of the United States of America 114:E8741-E8749.
Davies P, Maloney AJ (1976) Selective loss of central cholinergic neurons in Alzheimer's disease. Lancet 2:1403.
de Castro BM et al. (2009) The vesicular acetylcholine transporter is required for neuromuscular development and function. Molecular and cellular biology 29:5238-5250.
de Flores R, La Joie R, Chetelat G (2015) Structural imaging of hippocampal subfields in healthy aging and Alzheimer's disease. Neuroscience 309:29-50.
De Gois S, Houhou L, Oda Y, Corbex M, Pajak F, Thevenot E, Vodjdani G, Mallet J, Berrard S (2000) Is RE1/NRSE a common cis-regulatory sequence for ChAT and VAChT genes? The Journal of biological chemistry 275:36683-36690.
de Medeiros K, Robert P, Gauthier S, Stella F, Politis A, Leoutsakos J, Taragano F, Kremer J, Brugnolo A, Porsteinsson AP, Geda YE, Brodaty H, Gazdag G, Cummings J, Lyketsos C (2010) The Neuropsychiatric Inventory-Clinician rating scale (NPI-C): reliability and validity of a revised assessment of neuropsychiatric symptoms in dementia. Int Psychogeriatr 22:984-994.
De Santi S, de Leon MJ, Rusinek H, Convit A, Tarshish CY, Roche A, Tsui WH, Kandil E, Boppana M, Daisley K, Wang GJ, Schlyer D, Fowler J (2001) Hippocampal formation glucose metabolism and volume losses in MCI and AD. Neurobiology of aging 22:529-539.
De Strooper B, Iwatsubo T, Wolfe MS (2012) Presenilins and gamma-secretase: structure, function, and role in Alzheimer Disease. Cold Spring Harb Perspect Med 2:a006304.
DeKosky ST, Ikonomovic MD, Styren SD, Beckett L, Wisniewski S, Bennett DA, Cochran EJ, Kordower JH, Mufson EJ (2002) Upregulation of choline acetyltransferase activity in hippocampus and frontal cortex of elderly subjects with mild cognitive impairment. Annals of neurology 51:145-155.
del Ser T, Steinwachs KC, Gertz HJ, Andres MV, Gomez-Carrillo B, Medina M, Vericat JA, Redondo P, Fleet D, Leon T (2013) Treatment of Alzheimer's disease with the GSK-3 inhibitor tideglusib: a pilot study. Journal of Alzheimer's disease : JAD 33:205-215.
DeMattos RB, Cirrito JR, Parsadanian M, May PC, O'Dell MA, Taylor JW, Harmony JA, Aronow BJ, Bales KR, Paul SM, Holtzman DM (2004) ApoE and clusterin cooperatively suppress Abeta levels and deposition: evidence that ApoE regulates extracellular Abeta metabolism in vivo. Neuron 41:193-202.
Deng W, Aimone JB, Gage FH (2010) New neurons and new memories: how does adult hippocampal neurogenesis affect learning and memory? Nature reviews Neuroscience 11:339-350.
Descarries L, Audet MA, Doucet G, Garcia S, Oleskevich S, Seguela P, Soghomonian JJ, Watkins KC (1990) Morphology of central serotonin neurons. Brief review of quantified aspects of their distribution and ultrastructural relationships. Annals of the New York Academy of Sciences 600:81-92.
Devoto P, Flore G (2006) On the origin of cortical dopamine: is it a co-transmitter in noradrenergic neurons? Current neuropharmacology 4:115-125.
Di Lazzaro V, Pilato F, Dileone M, Saturno E, Profice P, Marra C, Daniele A, Ranieri F, Quaranta D, Gainotti G, Tonali PA (2007) Functional evaluation of cerebral cortex in dementia with Lewy bodies. Neuroimage 37:422-429.
Diaz SL, Narboux-Neme N, Trowbridge S, Scotto-Lomassese S, Kleine Borgmann FB, Jessberger S, Giros B, Maroteaux L, Deneris E, Gaspar P (2013) Paradoxical increase in survival of newborn neurons in the dentate gyrus of mice with constitutive depletion of serotonin. The European journal of neuroscience 38:2650-2658.
Dickerson BC, Salat DH, Greve DN, Chua EF, Rand-Giovannetti E, Rentz DM, Bertram L, Mullin K, Tanzi RE, Blacker D, Albert MS, Sperling RA (2005) Increased hippocampal activation in mild cognitive impairment compared to normal aging and AD. Neurology 65:404-411.
Dickson DW, Heckman MG, Murray ME, Soto AI, Walton RL, Diehl NN, van Gerpen JA, Uitti RJ, Wszolek ZK, Ertekin-Taner N, Knopman DS, Petersen RC, Graff-Radford NR, Boeve BF, Bu
210
G, Ferman TJ, Ross OA (2018) APOE epsilon4 is associated with severity of Lewy body pathology independent of Alzheimer pathology. Neurology 91:e1182-e1195.
Do JP, Xu M, Lee SH, Chang WC, Zhang S, Chung S, Yung TJ, Fan JL, Miyamichi K, Luo L, Dan Y (2016) Cell type-specific long-range connections of basal forebrain circuit. eLife 5.
Donovan MH, Yazdani U, Norris RD, Games D, German DC, Eisch AJ (2006) Decreased adult hippocampal neurogenesis in the PDAPP mouse model of Alzheimer's disease. The Journal of comparative neurology 495:70-83.
Dopeso-Reyes IG, Sucunza D, Rico AJ, Pignataro D, Marin-Ramos D, Roda E, Rodriguez-Perez AI, Labandeira-Garcia JL, Lanciego JL (2018) Glucocerebrosidase expression patterns in the non-human primate brain. Brain Struct Funct 223:343-355.
Drewes G, Trinczek B, Illenberger S, Biernat J, Schmitt-Ulms G, Meyer HE, Mandelkow EM, Mandelkow E (1995) Microtubule-associated protein/microtubule affinity-regulating kinase (p110mark). A novel protein kinase that regulates tau-microtubule interactions and dynamic instability by phosphorylation at the Alzheimer-specific site serine 262. The Journal of biological chemistry 270:7679-7688.
Duda JE (2004) Pathology and neurotransmitter abnormalities of dementia with Lewy bodies. Dement Geriatr Cogn Disord 17 Suppl 1:3-14.
Dudek SM, Alexander GM, Farris S (2016) Rediscovering area CA2: unique properties and functions. Nature reviews Neuroscience 17:89-102.
Dumalska I, Wu M, Morozova E, Liu R, van den Pol A, Alreja M (2008) Excitatory effects of the puberty-initiating peptide kisspeptin and group I metabotropic glutamate receptor agonists differentiate two distinct subpopulations of gonadotropin-releasing hormone neurons. The Journal of neuroscience : the official journal of the Society for Neuroscience 28:8003-8013.
Edison P, Archer HA, Hinz R, Hammers A, Pavese N, Tai YF, Hotton G, Cutler D, Fox N, Kennedy A, Rossor M, Brooks DJ (2007) Amyloid, hypometabolism, and cognition in Alzheimer disease: an [11C]PIB and [18F]FDG PET study. Neurology 68:501-508.
Eichenbaum H, Amaral DG, Buffalo EA, Buzsaki G, Cohen N, Davachi L, Frank L, Heckers S, Morris RG, Moser EI, Nadel L, O'Keefe J, Preston A, Ranganath C, Silva A, Witter M (2016) Hippocampus at 25. Hippocampus 26:1238-1249.
Eiden LE (1998) The cholinergic gene locus. Journal of neurochemistry 70:2227-2240. Ekonomou A, Savva GM, Brayne C, Forster G, Francis PT, Johnson M, Perry EK, Attems J, Somani
A, Minger SL, Ballard CG, Medical Research Council Cognitive Function and Ageing Neuropathology Study (2015) Stage-specific changes in neurogenic and glial markers in Alzheimer's disease. Biological psychiatry 77:711-719.
Encinas JM, Michurina TV, Peunova N, Park JH, Tordo J, Peterson DA, Fishell G, Koulakov A, Enikolopov G (2011) Division-Coupled Astrocytic Differentiation and Age-Related Depletion of Neural Stem Cells in the Adult Hippocampus. Cell stem cell 8:566-579.
Epp JR, Silva Mera R, Kohler S, Josselyn SA, Frankland PW (2016) Neurogenesis-mediated forgetting minimizes proactive interference. Nature communications 7:10838.
Eriksson PS, Perfilieva E, Bjork-Eriksson T, Alborn AM, Nordborg C, Peterson DA, Gage FH (1998) Neurogenesis in the adult human hippocampus. Nature medicine 4:1313-1317.
Erkkinen MG, Kim MO, Geschwind MD (2018) Clinical Neurology and Epidemiology of the Major Neurodegenerative Diseases. Cold Spring Harbor perspectives in biology 10.
Ermine CM, Wright JL, Parish CL, Stanic D, Thompson LH (2016) Combined immunohistochemical and retrograde tracing reveals little evidence of innervation of the rat dentate gyrus by midbrain dopamine neurons. Frontiers in Biology 11:246-255.
Ermine CM, Wright JL, Frausin S, Kauhausen JA, Parish CL, Stanic D, Thompson LH (2018) Modelling the dopamine and noradrenergic cell loss that occurs in Parkinson's disease and the impact on hippocampal neurogenesis. Hippocampus 28:327-337.
Ermini FV, Grathwohl S, Radde R, Yamaguchi M, Staufenbiel M, Palmer TD, Jucker M (2008) Neurogenesis and alterations of neural stem cells in mouse models of cerebral amyloidosis. The American journal of pathology 172:1520-1528.
211 Ernst A, Alkass K, Bernard S, Salehpour M, Perl S, Tisdale J, Possnert G, Druid H, Frisen J (2014)
Neurogenesis in the striatum of the adult human brain. Cell 156:1072-1083. Evans LD, Wassmer T, Fraser G, Smith J, Perkinton M, Billinton A, Livesey FJ (2018) Extracellular
Monomeric and Aggregated Tau Efficiently Enter Human Neurons through Overlapping but Distinct Pathways. Cell Rep 22:3612-3624.
Evans MD, Dumitrescu AS, Kruijssen DLH, Taylor SE, Grubb MS (2015) Rapid Modulation of Axon Initial Segment Length Influences Repetitive Spike Firing. Cell Rep 13:1233-1245.
Fan Z, Okello AA, Brooks DJ, Edison P (2015) Longitudinal influence of microglial activation and amyloid on neuronal function in Alzheimer's disease. Brain : a journal of neurology 138:3685-3698.
Farrer LA, Cupples LA, Haines JL, Hyman B, Kukull WA, Mayeux R, Myers RH, Pericak-Vance MA, Risch N, van Duijn CM (1997) Effects of age, sex, and ethnicity on the association between apolipoprotein E genotype and Alzheimer disease. A meta-analysis. APOE and Alzheimer Disease Meta Analysis Consortium. Jama 278:1349-1356.
Felix-Ortiz AC, Tye KM (2014) Amygdala inputs to the ventral hippocampus bidirectionally modulate social behavior. The Journal of neuroscience : the official journal of the Society for Neuroscience 34:586-595.
Felix-Ortiz AC, Beyeler A, Seo C, Leppla CA, Wildes CP, Tye KM (2013) BLA to vHPC inputs modulate anxiety-related behaviors. Neuron 79:658-664.
Ferguson SM, Savchenko V, Apparsundaram S, Zwick M, Wright J, Heilman CJ, Yi H, Levey AI, Blakely RD (2003) Vesicular localization and activity-dependent trafficking of presynaptic choline transporters. The Journal of neuroscience : the official journal of the Society for Neuroscience 23:9697-9709.
Filippini N, MacIntosh BJ, Hough MG, Goodwin GM, Frisoni GB, Smith SM, Matthews PM, Beckmann CF, Mackay CE (2009) Distinct patterns of brain activity in young carriers of the APOE-epsilon4 allele. Proceedings of the National Academy of Sciences of the United States of America 106:7209-7214.
Fiol-deRoque MA, Gutierrez-Lanza R, Teres S, Torres M, Barcelo P, Rial RV, Verkhratsky A, Escriba PV, Busquets X, Rodriguez JJ (2013) Cognitive recovery and restoration of cell proliferation in the dentate gyrus in the 5XFAD transgenic mice model of Alzheimer's disease following 2-hydroxy-DHA treatment. Biogerontology 14:763-775.
Firbank MJ, Lloyd J, Williams D, Barber R, Colloby SJ, Barnett N, Olsen K, Davison C, Donaldson C, Herholz K, O'Brien JT (2016) An evidence-based algorithm for the utility of FDG-PET for diagnosing Alzheimer's disease according to presence of medial temporal lobe atrophy. The British journal of psychiatry : the journal of mental science 208:491-496.
Folstein MF, Folstein SE, McHugh PR (1975) "Mini-mental state". A practical method for grading the cognitive state of patients for the clinician. Journal of psychiatric research 12:189-198.
Foote SL, Morrison JH (1987) Extrathalamic modulation of cortical function. Annual review of neuroscience 10:67-95.
Forlenza OV, Diniz BS, Radanovic M, Santos FS, Talib LL, Gattaz WF (2011) Disease-modifying properties of long-term lithium treatment for amnestic mild cognitive impairment: randomised controlled trial. The British journal of psychiatry : the journal of mental science 198:351-356.
Förstl H, Levy R, Burns A, Luthert P, Cairns N (1994) Disproportionate loss of noradrenergic and cholinergic neurons as cause of depression in Alzheimer's disease--a hypothesis. Pharmacopsychiatry 27:11-15.
Fox NC, Crum WR, Scahill RI, Stevens JM, Janssen JC, Rossor MN (2001) Imaging of onset and progression of Alzheimer's disease with voxel-compression mapping of serial magnetic resonance images. Lancet 358:201-205.
Francis PT (2005) The interplay of neurotransmitters in Alzheimer's disease. CNS spectrums 10:6-9.
212 Francis PT (2009) Altered glutamate neurotransmission and behaviour in dementia: evidence
from studies of memantine. Current molecular pharmacology 2:77-82. Francis PT, Perry EK (2006) Neurochemical pathology of cholinergic systems in
neurodegenerative and neurodevelopmental disorders In: The brain cholinergic system in health and disease (Giacobini E, Pepeu G, eds), pp 33-46. Abingdon: Informa Healthcare.
Francis PT, Palmer AM, Snape M, Wilcock GK (1999) The cholinergic hypothesis of Alzheimer's disease: a review of progress. Journal of neurology, neurosurgery, and psychiatry 66:137-147.
Francis PT, Palmer AM, Sims NR, Bowen DM, Davison AN, Esiri MM, Neary D, Snowden JS, Wilcock GK (1985) Neurochemical studies of early-onset Alzheimer's disease. Possible influence on treatment. N Engl J Med 313:7-11.
Friocourt G, Koulakoff A, Chafey P, Boucher D, Fauchereau F, Chelly J, Francis F (2003) Doublecortin functions at the extremities of growing neuronal processes. Cerebral Cortex 13:620-626.
Frozza RL, Lourenco MV, De Felice FG (2018) Challenges for Alzheimer's Disease Therapy: Insights from Novel Mechanisms Beyond Memory Defects. Frontiers in neuroscience 12:37.
Fuhrmann F, Justus D, Sosulina L, Kaneko H, Beutel T, Friedrichs D, Schoch S, Schwarz MK, Fuhrmann M, Remy S (2015) Locomotion, Theta Oscillations, and the Speed-Correlated Firing of Hippocampal Neurons Are Controlled by a Medial Septal Glutamatergic Circuit. Neuron 86:1253-1264.
Fujishiro H, Umegaki H, Isojima D, Akatsu H, Iguchi A, Kosaka K (2006) Depletion of cholinergic neurons in the nucleus of the medial septum and the vertical limb of the diagonal band in dementia with Lewy bodies. Acta neuropathologica 111:109-114.
Futerman AH, Low MG, Michaelson DM, Silman I (1985) Solubilization of membrane-bound acetylcholinesterase by a phosphatidylinositol-specific phospholipase C. Journal of neurochemistry 45:1487-1494.
Gage FH, Kempermann G, Palmer TD, Peterson DA, Ray J (1998) Multipotent progenitor cells in the adult dentate gyrus. Journal of neurobiology 36:249-266.
Galvez B, Gross N, Sumikawa K (2016) Activation of alpha7 nicotinic acetylcholine receptors protects potentiated synapses from depotentiation during theta pattern stimulation in the hippocampal CA1 region of rats. Neuropharmacology 105:378-387.
Gámez-Valero A, Prada-Dacasa P, Santos C, Adame-Castillo C, Campdelacreu J, Rene R, Gascon-Bayarri J, Ispierto L, Alvarez R, Ariza A, Beyer K (2016) GBA Mutations Are Associated With Earlier Onset and Male Sex in Dementia With Lewy Bodies. Mov Disord 31:1066-1070.
Gao ZL, Ure K, Ables JL, Lagace DC, Nave KA, Goebbels S, Eisch AJ, Hsieh J (2009) Neurod1 is essential for the survival and maturation of adult-born neurons. Nature neuroscience 12:1090-1092.
Garcia-Alloza M, Gil-Bea FJ, Diez-Ariza M, Chen CP, Francis PT, Lasheras B, Ramirez MJ (2005) Cholinergic-serotonergic imbalance contributes to cognitive and behavioral symptoms in Alzheimer's disease. Neuropsychologia 43:442-449.
Garthe A, Kempermann G (2013) An old test for new neurons: refining the Morris water maze to study the functional relevance of adult hippocampal neurogenesis. Frontiers in neuroscience 7:63.
Gatt A, Ekonomou A, Somani A, Thuret S, Howlett D, Corbett A, Johnson M, Perry E, Attems J, Francis P, Aarsland D, Ballard C (2018) Importance of Proactive Treatment of Depression in Lewy Body Dementias: The Impact on Hippocampal Neurogenesis and Cognition in a Post-Mortem Study. Dement Geriatr Cogn Disord 44:283-293.
Gatz M, Reynolds CA, Fratiglioni L, Johansson B, Mortimer JA, Berg S, Fiske A, Pedersen NL (2006) Role of genes and environments for explaining Alzheimer disease. Archives of general psychiatry 63:168-174.
213 Ge S, Goh EL, Sailor KA, Kitabatake Y, Ming GL, Song H (2006) GABA regulates synaptic
integration of newly generated neurons in the adult brain. Nature 439:589-593. Geddes JW, Monaghan DT, Cotman CW, Lott IT, Kim RC, Chui HC (1985) Plasticity of hippocampal
circuitry in Alzheimer's disease. Science 230:1179-1181. Geula C, Mesulam MM (1996) Systematic regional variations in the loss of cortical cholinergic
fibers in Alzheimer's disease. Cerebral cortex (New York, NY : 1991) 6:165-177. Ghosal K, Stathopoulos A, Pimplikar SW (2010) APP intracellular domain impairs adult
neurogenesis in transgenic mice by inducing neuroinflammation. PloS one 5:e11866. Ghosal K, Fan Q, Dawson HN, Pimplikar SW (2016) Tau Protein Mediates APP Intracellular
Domain (AICD)-Induced Alzheimer's-Like Pathological Features in Mice. PloS one 11:e0159435.
Giacobini E (2006) Cholinesterases in human brain: the effect of cholinesterase inhibitors on Alzheimer's disease and related disorders. In: The brain cholinergic system in health and disease (Giacobini E, Pepeu G, eds), pp 235-264. Abingdon: Informa Healthcare.
Gill SK, Ishak M, Dobransky T, Haroutunian V, Davis KL, Rylett RJ (2007) 82-kDa choline acetyltransferase is in nuclei of cholinergic neurons in human CNS and altered in aging and Alzheimer disease. Neurobiology of aging 28:1028-1040.
Ginsberg SD, Mufson EJ, Alldred MJ, Counts SE, Wuu J, Nixon RA, Che S (2011) Upregulation of select rab GTPases in cholinergic basal forebrain neurons in mild cognitive impairment and Alzheimer's disease. Journal of chemical neuroanatomy 42:102-110.
Ginsberg SD, Alldred MJ, Counts SE, Cataldo AM, Neve RL, Jiang Y, Wuu J, Chao MV, Mufson EJ, Nixon RA, Che S (2010) Microarray analysis of hippocampal CA1 neurons implicates early endosomal dysfunction during Alzheimer's disease progression. Biological psychiatry 68:885-893.
Giuffrida ML, Tomasello F, Caraci F, Chiechio S, Nicoletti F, Copani A (2012) Beta-amyloid monomer and insulin/IGF-1 signaling in Alzheimer's disease. Molecular neurobiology 46:605-613.
Glabe CG (2008) Structural classification of toxic amyloid oligomers. The Journal of biological chemistry 283:29639-29643.
Gleeson JG, Lin PT, Flanagan LA, Walsh CA (1999) Doublecortin is a microtubule-associated protein and is expressed widely by migrating neurons. Neuron 23:257-271.
Gleeson JG, Allen KM, Fox JW, Lamperti ED, Berkovic S, Scheffer I, Cooper EC, Dobyns WB, Minnerath SR, Ross ME, Walsh CA (1998) doublecortin, a brain-specific gene mutated in human X-linked lissencephaly and double cortex syndrome, encodes a putative signaling protein. Cell 92:63-72.
Glenner GG, Wong CW (1984) Alzheimer's disease and Down's syndrome: sharing of a unique cerebrovascular amyloid fibril protein. Biochemical and biophysical research communications 122:1131-1135.
Goate A, Chartier-Harlin MC, Mullan M, Brown J, Crawford F, Fidani L, Giuffra L, Haynes A, Irving N, James L, et al. (1991) Segregation of a missense mutation in the amyloid precursor protein gene with familial Alzheimer's disease. Nature 349:704-706.
Goldman JE, Yen SH, Chiu FC, Peress NS (1983) Lewy bodies of Parkinson's disease contain neurofilament antigens. Science 221:1082-1084.
Goldman SA, Chen Z (2011) Perivascular instruction of cell genesis and fate in the adult brain. Nature neuroscience 14:1382-1389.
Gomez-Nicola D, Suzzi S, Vargas-Caballero M, Fransen NL, Al-Malki H, Cebrian-Silla A, Garcia-Verdugo JM, Riecken K, Fehse B, Perry VH (2014) Temporal dynamics of hippocampal neurogenesis in chronic neurodegeneration. Brain : a journal of neurology 137:2312-2328.
Gouras GK, Rance NE, Young WS, 3rd, Koliatsos VE (1992) Tyrosine-hydroxylase-containing neurons in the primate basal forebrain magnocellular complex. Brain research 584:287-293.
214 Gremer L, Scholzel D, Schenk C, Reinartz E, Labahn J, Ravelli RBG, Tusche M, Lopez-Iglesias C,
Hoyer W, Heise H, Willbold D, Schroder GF (2017) Fibril structure of amyloid-beta(1-42) by cryo-electron microscopy. Science 358:116-119.
Gritton HJ, Howe WM, Mallory CS, Hetrick VL, Berke JD, Sarter M (2016) Cortical cholinergic signaling controls the detection of cues. Proceedings of the National Academy of Sciences of the United States of America 113:E1089-1097.
Grudzien A, Shaw P, Weintraub S, Bigio E, Mash DC, Mesulam MM (2007) Locus coeruleus neurofibrillary degeneration in aging, mild cognitive impairment and early Alzheimer's disease. Neurobiology of aging 28:327-335.
Gu L, Liu C, Stroud JC, Ngo S, Jiang L, Guo Z (2014) Antiparallel triple-strand architecture for prefibrillar Abeta42 oligomers. The Journal of biological chemistry 289:27300-27313.
Gu Z, Lamb PW, Yakel JL (2012) Cholinergic coordination of presynaptic and postsynaptic activity induces timing-dependent hippocampal synaptic plasticity. The Journal of neuroscience : the official journal of the Society for Neuroscience 32:12337-12348.
Guerreiro R et al. (2013) TREM2 variants in Alzheimer's disease. N Engl J Med 368:117-127. Guo J, Ji Y, Ding Y, Jiang W, Sun Y, Lu B, Nagappan G (2016) BDNF pro-peptide regulates dendritic
spines via caspase-3. Cell Death Dis 7. Guo J, Wang J, Zhang Z, Yan J, Chen M, Pang T, Zhang L, Liao H (2013) proNGF inhibits
neurogenesis and induces glial activation in adult mouse dentate gyrus. Neurochem Res 38:1695-1703.
Guzman SJ, Schlogl A, Frotscher M, Jonas P (2016) Synaptic mechanisms of pattern completion in the hippocampal CA3 network. Science 353:1117-1123.
Hahm SH, Chen L, Patel C, Erickson J, Bonner TI, Weihe E, Schafer MK, Eiden LE (1997) Upstream sequencing and functional characterization of the human cholinergic gene locus. Journal of molecular neuroscience : MN 9:223-236.
Halassa MM, Florian C, Fellin T, Munoz JR, Lee SY, Abel T, Haydon PG, Frank MG (2009) Astrocytic modulation of sleep homeostasis and cognitive consequences of sleep loss. Neuron 61:213-219.
Hall H, Reyes S, Landeck N, Bye C, Leanza G, Double K, Thompson L, Halliday G, Kirik D (2014) Hippocampal Lewy pathology and cholinergic dysfunction are associated with dementia in Parkinson's disease. Brain : a journal of neurology 137:2493-2508.
Hamilton LK, Aumont A, Julien C, Vadnais A, Calon F, Fernandes KJ (2010) Widespread deficits in adult neurogenesis precede plaque and tangle formation in the 3xTg mouse model of Alzheimer's disease. The European journal of neuroscience 32:905-920.
Han MH, Lee EH, Koh SH (2016) Current Opinion on the Role of Neurogenesis in the Therapeutic Strategies for Alzheimer Disease, Parkinson Disease, and Ischemic Stroke; Considering Neuronal Voiding Function. International neurourology journal 20:276-287.
Hardy J, Singleton A (2009) Genomewide association studies and human disease. N Engl J Med 360:1759-1768.
Harold D et al. (2009) Genome-wide association study identifies variants at CLU and PICALM associated with Alzheimer's disease. Nat Genet 41:1088-1093.
Harris FM, Tesseur I, Brecht WJ, Xu Q, Mullendorff K, Chang S, Wyss-Coray T, Mahley RW, Huang Y (2004) Astroglial regulation of apolipoprotein E expression in neuronal cells. Implications for Alzheimer's disease. The Journal of biological chemistry 279:3862-3868.
Hascup KN, Hascup ER (2016) Soluble Amyloid-beta42 Stimulates Glutamate Release through Activation of the alpha7 Nicotinic Acetylcholine Receptor. Journal of Alzheimer's disease : JAD 53:337-347.
Hassani OK, Lee MG, Henny P, Jones BE (2009) Discharge profiles of identified GABAergic in comparison to cholinergic and putative glutamatergic basal forebrain neurons across the sleep-wake cycle. The Journal of neuroscience : the official journal of the Society for Neuroscience 29:11828-11840.
215 Hasselmo ME (2014) Neuronal rebound spiking, resonance frequency and theta cycle skipping
may contribute to grid cell firing in medial entorhinal cortex. Philos Trans R Soc Lond B Biol Sci 369:20120523.
Hasselmo ME, Stern CE (2014) Theta rhythm and the encoding and retrieval of space and time. Neuroimage 85 Pt 2:656-666.
Hawkins DM (2004) The problem of overfitting. Journal of chemical information and computer sciences 44:1-12.
He N, Jin WL, Lok KH, Wang Y, Yin M, Wang ZJ (2013) Amyloid-beta(1-42) oligomer accelerates senescence in adult hippocampal neural stem/progenitor cells via formylpeptide receptor 2. Cell Death Dis 4:e924.
Hely MA, Reid WG, Adena MA, Halliday GM, Morris JG (2008) The Sydney multicenter study of Parkinson's disease: the inevitability of dementia at 20 years. Mov Disord 23:837-844.
Hendricks TJ, Fyodorov DV, Wegman LJ, Lelutiu NB, Pehek EA, Yamamoto B, Silver J, Weeber EJ, Sweatt JD, Deneris ES (2003) Pet-1 ETS gene plays a critical role in 5-HT neuron development and is required for normal anxiety-like and aggressive behavior. Neuron 37:233-247.
Henriksen K, O'Bryant SE, Hampel H, Trojanowski JQ, Montine TJ, Jeromin A, Blennow K, Lonneborg A, Wyss-Coray T, Soares H, Bazenet C, Sjogren M, Hu W, Lovestone S, Karsdal MA, Weiner MW (2014) The future of blood-based biomarkers for Alzheimer's disease. Alzheimer's & dementia : the journal of the Alzheimer's Association 10:115-131.
Hitti FL, Siegelbaum SA (2014) The hippocampal CA2 region is essential for social memory. Nature 508:88-92.
Ho NF, Han SP, Dawe GS (2009) Effect of voluntary running on adult hippocampal neurogenesis in cholinergic lesioned mice. BMC neuroscience 10:57.
Hodge RD, Kowalczyk TD, Wolf SA, Encinas JM, Rippey C, Enikolopov G, Kempermann G, Hevner RF (2008) Intermediate progenitors in adult hippocampal neurogenesis: Tbr2 expression and coordinate regulation of neuronal output. Journal of Neuroscience 28:3707-3717.
Höglinger GU, Rizk P, Muriel MP, Duyckaerts C, Oertel WH, Caille I, Hirsch EC (2004) Dopamine depletion impairs precursor cell proliferation in Parkinson disease. Nature neuroscience 7:726-735.
Höller Y, Bathke AC, Uhl A, Strobl N, Lang A, Bergmann J, Nardone R, Rossini F, Zauner H, Kirschner M, Jahanbekam A, Trinka E, Staffen W (2017) Combining SPECT and Quantitative EEG Analysis for the Automated Differential Diagnosis of Disorders with Amnestic Symptoms. Frontiers in aging neuroscience 9:290.
Hollingworth P et al. (2011) Common variants at ABCA7, MS4A6A/MS4A4E, EPHA1, CD33 and CD2AP are associated with Alzheimer's disease. Nat Genet 43:429-435.
Holmes BB, Furman JL, Mahan TE, Yamasaki TR, Mirbaha H, Eades WC, Belaygorod L, Cairns NJ, Holtzman DM, Diamond MI (2014) Proteopathic tau seeding predicts tauopathy in vivo. Proceedings of the National Academy of Sciences of the United States of America 111:E4376-4385.
Hong XP, Peng CX, Wei W, Tian Q, Liu YH, Yao XQ, Zhang Y, Cao FY, Wang Q, Wang JZ (2010) Essential role of tau phosphorylation in adult hippocampal neurogenesis. Hippocampus 20:1339-1349.
Hosp JA, Pekanovic A, Rioult-Pedotti MS, Luft AR (2011) Dopaminergic projections from midbrain to primary motor cortex mediate motor skill learning. The Journal of neuroscience : the official journal of the Society for Neuroscience 31:2481-2487.
Hou Y, Lautrup S, Cordonnier S, Wang Y, Croteau DL, Zavala E, Zhang Y, Moritoh K, O'Connell JF, Baptiste BA, Stevnsner TV, Mattson MP, Bohr VA (2018) NAD(+) supplementation normalizes key Alzheimer's features and DNA damage responses in a new AD mouse model with introduced DNA repair deficiency. Proceedings of the National Academy of Sciences of the United States of America 115:E1876-e1885.
Howe WM, Berry AS, Francois J, Gilmour G, Carp JM, Tricklebank M, Lustig C, Sarter M (2013) Prefrontal cholinergic mechanisms instigating shifts from monitoring for cues to cue-
216
guided performance: converging electrochemical and fMRI evidence from rats and humans. The Journal of neuroscience : the official journal of the Society for Neuroscience 33:8742-8752.
Howlett DR, Whitfield D, Johnson M, Attems J, O'Brien JT, Aarsland D, Lai MK, Lee JH, Chen C, Ballard C, Hortobagyi T, Francis PT (2014) Regional Multiple Pathology Scores Are Associated with Cognitive Decline in Lewy Body Dementias. Brain pathology.
Hruska KS, LaMarca ME, Scott CR, Sidransky E (2008) Gaucher disease: mutation and polymorphism spectrum in the glucocerebrosidase gene (GBA). Hum Mutat 29:567-583.
Hu S, Maiti P, Ma Q, Zuo X, Jones MR, Cole GM, Frautschy SA (2015) Clinical development of curcumin in neurodegenerative disease. Expert review of neurotherapeutics 15:629-637.
Huynh TV, Liao F, Francis CM, Robinson GO, Serrano JR, Jiang H, Roh J, Finn MB, Sullivan PM, Esparza TJ, Stewart FR, Mahan TE, Ulrich JD, Cole T, Holtzman DM (2017) Age-Dependent Effects of apoE Reduction Using Antisense Oligonucleotides in a Model of beta-amyloidosis. Neuron 96:1013-1023 e1014.
Hyman BT, Kromer LJ, Van Hoesen GW (1987) Reinnervation of the hippocampal perforant pathway zone in Alzheimer's disease. Annals of neurology 21:259-267.
Hyman BT, Phelps CH, Beach TG, Bigio EH, Cairns NJ, Carrillo MC, Dickson DW, Duyckaerts C, Frosch MP, Masliah E, Mirra SS, Nelson PT, Schneider JA, Thal DR, Thies B, Trojanowski JQ, Vinters HV, Montine TJ (2012) National Institute on Aging-Alzheimer's Association guidelines for the neuropathologic assessment of Alzheimer's disease. Alzheimer's & dementia : the journal of the Alzheimer's Association 8:1-13.
Ikonomovic MD, Mufson EJ, Wuu J, Cochran EJ, Bennett DA, DeKosky ST (2003) Cholinergic plasticity in hippocampus of individuals with mild cognitive impairment: correlation with Alzheimer's neuropathology. Journal of Alzheimer's disease : JAD 5:39-48.
Ikonomovic MD, Klunk WE, Abrahamson EE, Mathis CA, Price JC, Tsopelas ND, Lopresti BJ, Ziolko S, Bi W, Paljug WR, Debnath ML, Hope CE, Isanski BA, Hamilton RL, DeKosky ST (2008) Post-mortem correlates of in vivo PiB-PET amyloid imaging in a typical case of Alzheimer's disease. Brain : a journal of neurology 131:1630-1645.
Imoto Y, Segi-Nishida E, Suzuki H, Kobayashi K (2017) Rapid and stable changes in maturation-related phenotypes of the adult hippocampal neurons by electroconvulsive treatment. Mol Brain 10:8.
Jack CR, Jr. et al. (2018) NIA-AA Research Framework: Toward a biological definition of Alzheimer's disease. Alzheimer's & dementia : the journal of the Alzheimer's Association 14:535-562.
Jacobs HI, Wiese S, van de Ven V, Gronenschild EH, Verhey FR, Matthews PM (2015) Relevance of parahippocampal-locus coeruleus connectivity to memory in early dementia. Neurobiology of aging 36:618-626.
Janelidze S, Zetterberg H, Mattsson N, Palmqvist S, Vanderstichele H, Lindberg O, van Westen D, Stomrud E, Minthon L, Blennow K, Hansson O (2016) CSF Abeta42/Abeta40 and Abeta42/Abeta38 ratios: better diagnostic markers of Alzheimer disease. Annals of clinical and translational neurology 3:154-165.
Janus C, Pearson J, McLaurin J, Mathews PM, Jiang Y, Schmidt SD, Chishti MA, Horne P, Heslin D, French J, Mount HT, Nixon RA, Mercken M, Bergeron C, Fraser PE, St George-Hyslop P, Westaway D (2000) A beta peptide immunization reduces behavioural impairment and plaques in a model of Alzheimer's disease. Nature 408:979-982.
Jellinger KA (2008) A critical reappraisal of current staging of Lewy-related pathology in human brain. Acta neuropathologica 116:1-16.
Jellinger KA, Korczyn AD (2018) Are dementia with Lewy bodies and Parkinson's disease dementia the same disease? BMC Med 16:34.
Jha S, Rajendran R, Davda J, Vaidya VA (2006) Selective serotonin depletion does not regulate hippocampal neurogenesis in the adult rat brain: differential effects of p-chlorophenylalanine and 5,7-dihydroxytryptamine. Brain research 1075:48-59.
217 Jia Q, Deng Y, Qing H (2014) Potential therapeutic strategies for Alzheimer's disease targeting or
beyond beta-amyloid: insights from clinical trials. BioMed research international 2014:837157.
Jin K, Zhu Y, Sun Y, Mao XO, Xie L, Greenberg DA (2002) Vascular endothelial growth factor (VEGF) stimulates neurogenesis in vitro and in vivo. Proceedings of the National Academy of Sciences of the United States of America 99:11946-11950.
Jin KL, Peel AL, Mao XO, Xie L, Cottrell BA, Henshall DC, Greenberg DA (2004a) Increased hippocampal neurogenesis in Alzheimer's disease. Proceedings of the National Academy of Sciences of the United States of America 101:343-347.
Jin KL, Galvan V, Xie L, Mao XO, Gorostiza OF, Bredesen DE, Greenberg DA (2004b) Enhanced neurogenesis in Alzheimer's disease transgenic (PDGF-APP(sw,lnd))mice. Proceedings of the National Academy of Sciences of the United States of America 101:13363-13367.
Jinde S, Zsiros V, Jiang Z, Nakao K, Pickel J, Kohno K, Belforte JE, Nakazawa K (2012) Hilar mossy cell degeneration causes transient dentate granule cell hyperexcitability and impaired pattern separation. Neuron 76:1189-1200.
Jo S et al. (2014) GABA from reactive astrocytes impairs memory in mouse models of Alzheimer's disease. Nature medicine 20:886-896.
Johnson M, Ekonomou A, Hobbs C, Ballard CG, Perry RH, Perry EK (2011) Neurogenic marker abnormalities in the hippocampus in dementia with Lewy bodies. Hippocampus 21:1126-1136.
Jones CK, Byun N, Bubser M (2012) Muscarinic and nicotinic acetylcholine receptor agonists and allosteric modulators for the treatment of schizophrenia. Neuropsychopharmacology : official publication of the American College of Neuropsychopharmacology 37:16-42.
Jones HE, Joshi A, Shenkin S, Mead GE (2016) The effect of treatment with selective serotonin reuptake inhibitors in comparison to placebo in the progression of dementia: a systematic review and meta-analysis. Age and ageing 45:448-456.
Josephs KA, Dickson DW, Tosakulwong N, Weigand SD, Murray ME, Petrucelli L, Liesinger AM, Senjem ML, Spychalla AJ, Knopman DS, Parisi JE, Petersen RC, Jack CR, Jr., Whitwell JL (2017) Rates of hippocampal atrophy and presence of post-mortem TDP-43 in patients with Alzheimer's disease: a longitudinal retrospective study. The Lancet Neurology 16:917-924.
Joshi A, Salib M, Viney TJ, Dupret D, Somogyi P (2017) Behavior-Dependent Activity and Synaptic Organization of Septo-hippocampal GABAergic Neurons Selectively Targeting the Hippocampal CA3 Area. Neuron 96:1342-1357 e1345.
Justus D, Dalugge D, Bothe S, Fuhrmann F, Hannes C, Kaneko H, Friedrichs D, Sosulina L, Schwarz I, Elliott DA, Schoch S, Bradke F, Schwarz MK, Remy S (2017) Glutamatergic synaptic integration of locomotion speed via septoentorhinal projections. Nature neuroscience 20:16-19.
Kalinchuk AV, McCarley RW, Stenberg D, Porkka-Heiskanen T, Basheer R (2008) The role of cholinergic basal forebrain neurons in adenosine-mediated homeostatic control of sleep: lessons from 192 IgG-saporin lesions. Neuroscience 157:238-253.
Kanekiyo T, Xu H, Bu G (2014) ApoE and Abeta in Alzheimer's disease: accidental encounters or partners? Neuron 81:740-754.
Kantarci K, Lowe VJ, Boeve BF, Weigand SD, Senjem ML, Przybelski SA, Dickson DW, Parisi JE, Knopman DS, Smith GE, Ferman TJ, Petersen RC, Jack CR, Jr. (2012) Multimodality imaging characteristics of dementia with Lewy bodies. Neurobiology of aging 33:2091-2105.
Kaplan MS, Hinds JW (1977) Neurogenesis in Adult Rat - Electron-Microscopic Analysis of Light Autoradiographs. Science 197:1092-1094.
Karalay Ö, Doberauer K, Vadodaria KC, Knobloch M, Berti L, Miquelajauregui A, Schwark M, Jagasia R, Taketo MM, Tarabykin V, Lie DC, Jessberger S (2011) Prospero-related homeobox 1 gene (Prox1) is regulated by canonical Wnt signaling and has a stage-
218
specific role in adult hippocampal neurogenesis. Proceedings of the National Academy of Sciences 108:5807-5812.
Karampetsou M, Ardah MT, Semitekolou M, Polissidis A, Samiotaki M, Kalomoiri M, Majbour N, Xanthou G, El-Agnaf OMA, Vekrellis K (2017) Phosphorylated exogenous alpha-synuclein fibrils exacerbate pathology and induce neuronal dysfunction in mice. Scientific reports 7.
Karnovsky MJ, Roots L (1964) A "DIRECT-COLORING" THIOCHOLINE METHOD FOR CHOLINESTERASES. J Histochem Cytochem 12:219-221.
Karpel R, Sternfeld M, Ginzberg D, Guhl E, Graessmann A, Soreq H (1996) Overexpression of alternative human acetylcholinesterase forms modulates process extensions in cultured glioma cells. Journal of neurochemistry 66:114-123.
Kasa P, Sr., Papp H, Kasa P, Jr., Pakaski M, Balaspiri L (2004) Effects of amyloid-beta on cholinergic and acetylcholinesterase-positive cells in cultured basal forebrain neurons of embryonic rat brain. Brain research 998:73-82.
Katsuki F, Constantinidis C (2014) Bottom-up and top-down attention: different processes and overlapping neural systems. Neuroscientist 20:509-521.
Kaufman SK, Del Tredici K, Thomas TL, Braak H, Diamond MI (2018) Tau seeding activity begins in the transentorhinal/entorhinal regions and anticipates phospho-tau pathology in Alzheimer's disease and PART. Acta neuropathologica.
Kawakami F, Suzuki M, Shimada N, Kagiya G, Ohta E, Tamura K, Maruyama H, Ichikawa T (2011) Stimulatory effect of alpha-synuclein on the tau-phosphorylation by GSK-3beta. FEBS J 278:4895-4904.
Kempadoo KA, Mosharov EV, Choi SJ, Sulzer D, Kandel ER (2016) Dopamine release from the locus coeruleus to the dorsal hippocampus promotes spatial learning and memory. Proceedings of the National Academy of Sciences of the United States of America 113:14835-14840.
Kempermann G, Gage FH, Aigner L, Song H, Curtis MA, Thuret S, Kuhn HG, Jessberger S, Frankland PW, Cameron HA, Gould E, Hen R, Abrous DN, Toni N, Schinder AF, Zhao X, Lucassen PJ, Frisen J (2018) Human Adult Neurogenesis: Evidence and Remaining Questions. Cell stem cell 23:25-30.
Kengaku M, Misawa H, Deguchi T (1993) Multiple mRNA species of choline acetyltransferase from rat spinal cord. Brain research Molecular brain research 18:71-76.
Kepe V, Barrio JR, Huang SC, Ercoli L, Siddarth P, Shoghi-Jadid K, Cole GM, Satyamurthy N, Cummings JL, Small GW, Phelps ME (2006) Serotonin 1A receptors in the living brain of Alzheimer's disease patients. Proceedings of the National Academy of Sciences of the United States of America 103:702-707.
Kerchner GA, Hess CP, Hammond-Rosenbluth KE, Xu D, Rabinovici GD, Kelley DA, Vigneron DB, Nelson SJ, Miller BL (2010) Hippocampal CA1 apical neuropil atrophy in mild Alzheimer disease visualized with 7-T MRI. Neurology 75:1381-1387.
Khan SS, LaCroix M, Boyle G, Sherman MA, Brown JL, Amar F, Aldaco J, Lee MK, Bloom GS, Lesne SE (2018) Bidirectional modulation of Alzheimer phenotype by alpha-synuclein in mice and primary neurons. Acta neuropathologica 136:589-605.
Khoshyomn S, Maier H, Morimura T, Kitz K, Budka H (1993) Immunostaining for proliferating cell nuclear antigen: its role in determination of proliferation in routinely processed human brain tumor specimens. Acta neuropathologica 86:582-589.
Kim M, Suh J, Romano D, Truong MH, Mullin K, Hooli B, Norton D, Tesco G, Elliott K, Wagner SL, Moir RD, Becker KD, Tanzi RE (2009) Potential late-onset Alzheimer's disease-associated mutations in the ADAM10 gene attenuate {alpha}-secretase activity. Human molecular genetics 18:3987-3996.
Kim WS, Kagedal K, Halliday GM (2014) Alpha-synuclein biology in Lewy body diseases. Alzheimers Research & Therapy 6.
Kirschen GW, Shen J, Tian M, Schroeder B, Wang J, Man G, Wu S, Ge S (2017) Active Dentate Granule Cells Encode Experience to Promote the Addition of Adult-Born Hippocampal
219
Neurons. The Journal of neuroscience : the official journal of the Society for Neuroscience 37:4661-4678.
Kirshenbaum GS, Robson VK, Shansky RM, Savage LM, Leonardo ED, Dranovsky A (2018) Adult-born neurons maintain hippocampal cholinergic inputs and support working memory during aging. bioRxiv:311423.
Kishi T, Matsunaga S, Oya K, Nomura I, Ikuta T, Iwata N (2017) Memantine for Alzheimer's Disease: An Updated Systematic Review and Meta-analysis. Journal of Alzheimer's disease : JAD 60:401-425.
Kitazawa M, Medeiros R, Laferla FM (2012) Transgenic mouse models of Alzheimer disease: developing a better model as a tool for therapeutic interventions. Current pharmaceutical design 18:1131-1147.
Klempin F, Babu H, De Pietri Tonelli D, Alarcon E, Fabel K, Kempermann G (2010) Oppositional effects of serotonin receptors 5-HT1a, 2, and 2c in the regulation of adult hippocampal neurogenesis. Front Mol Neurosci 3.
Klempin F, Beis D, Mosienko V, Kempermann G, Bader M, Alenina N (2013) Serotonin is required for exercise-induced adult hippocampal neurogenesis. The Journal of neuroscience : the official journal of the Society for Neuroscience 33:8270-8275.
Klunk WE et al. (2004) Imaging brain amyloid in Alzheimer's disease with Pittsburgh Compound-B. Annals of neurology 55:306-319.
Knapp MJ, Knopman DS, Solomon PR, Pendlebury WW, Davis CS, Gracon SI (1994) A 30-week randomized controlled trial of high-dose tacrine in patients with Alzheimer's disease. The Tacrine Study Group. Jama 271:985-991.
Knoth R, Singec I, Ditter M, Pantazis G, Capetian P, Meyer RP, Horvat V, Volk B, Kempermann G (2010) Murine features of neurogenesis in the human hippocampus across the lifespan from 0 to 100 years. PloS one 5:e8809.
Knowles TP, Vendruscolo M, Dobson CM (2014) The amyloid state and its association with protein misfolding diseases. Nat Rev Mol Cell Biol 15:384-396.
Kobayashi K, Haneda E, Higuchi M, Suhara T, Suzuki H (2012) Chronic fluoxetine selectively upregulates dopamine D(1)-like receptors in the hippocampus. Neuropsychopharmacology : official publication of the American College of Neuropsychopharmacology 37:1500-1508.
Kobayashi K, Ikeda Y, Sakai A, Yamasaki N, Haneda E, Miyakawa T, Suzuki H (2010) Reversal of hippocampal neuronal maturation by serotonergic antidepressants. Proceedings of the National Academy of Sciences of the United States of America 107:8434-8439.
Kodis EJ, Choi S, Swanson E, Ferreira G, Bloom GS (2018) N-methyl-D-aspartate receptor–mediated calcium influx connects amyloid-β oligomers to ectopic neuronal cell cycle reentry in Alzheimer's disease. Alzheimer's & Dementia.
Koffie RM, Meyer-Luehmann M, Hashimoto T, Adams KW, Mielke ML, Garcia-Alloza M, Micheva KD, Smith SJ, Kim ML, Lee VM, Hyman BT, Spires-Jones TL (2009) Oligomeric amyloid beta associates with postsynaptic densities and correlates with excitatory synapse loss near senile plaques. Proceedings of the National Academy of Sciences of the United States of America 106:4012-4017.
Kohara K, Pignatelli M, Rivest AJ, Jung HY, Kitamura T, Suh J, Frank D, Kajikawa K, Mise N, Obata Y, Wickersham IR, Tonegawa S (2014) Cell type-specific genetic and optogenetic tools reveal hippocampal CA2 circuits. Nature neuroscience 17:269-279.
Koizumi H, Gleeson J, Emoto K (2011) Doublecortin-like kinases function with Doublecortin to regulate neuronal migration and neural circuit formation. Neuroscience research 71:E95-E95.
Kolisnyk B, Guzman MS, Raulic S, Fan J, Magalhaes AC, Feng G, Gros R, Prado VF, Prado MA (2013) ChAT-ChR2-EYFP mice have enhanced motor endurance but show deficits in attention and several additional cognitive domains. The Journal of neuroscience : the official journal of the Society for Neuroscience 33:10427-10438.
220 Kolisnyk B, Al-Onaizi MA, Xu J, Parfitt GM, Ostapchenko VG, Hanin G, Soreq H, Prado MA, Prado
VF (2016) Cholinergic Regulation of hnRNPA2/B1 Translation by M1 Muscarinic Receptors. The Journal of neuroscience : the official journal of the Society for Neuroscience 36:6287-6296.
Kooi EJ, Prins M, Bajic N, Belien JA, Gerritsen WH, van Horssen J, Aronica E, van Dam AM, Hoozemans JJ, Francis PT, van der Valk P, Geurts JJ (2011) Cholinergic imbalance in the multiple sclerosis hippocampus. Acta neuropathologica 122:313-322.
Krantz DE, Waites C, Oorschot V, Liu Y, Wilson RI, Tan PK, Klumperman J, Edwards RH (2000) A Phosphorylation Site Regulates Sorting of the Vesicular Acetylcholine Transporter to Dense Core Vesicles. The Journal of cell biology 149:379-396.
Kratz T (2017) The Diagnosis and Treatment of Behavioral Disorders in Dementia. Dtsch Arztebl Int 114:447-454.
Krezymon A, Richetin K, Halley H, Roybon L, Lassalle JM, Frances B, Verret L, Rampon C (2013) Modifications of hippocampal circuits and early disruption of adult neurogenesis in the tg2576 mouse model of Alzheimer's disease. PloS one 8:e76497.
Kuhar MJ, Murrin LC (1978) Sodium-dependent, high affinity choline uptake. Journal of neurochemistry 30:15-21.
Kuhn HG, Dickinson-Anson H, Gage FH (1996) Neurogenesis in the dentate gyrus of the adult rat: age-related decrease of neuronal progenitor proliferation. The Journal of neuroscience : the official journal of the Society for Neuroscience 16:2027-2033.
Kuipers SD, Trentani A, Tiron A, Mao X, Kuhl D, Bramham CR (2016) BDNF-induced LTP is associated with rapid Arc/Arg3.1-dependent enhancement in adult hippocampal neurogenesis. Scientific reports 6:21222.
Kumar GS, Gokhan E, De Munter S, Bonen M, Vagnarelli P, Peti W, Page R (2016) The Ki-67 and RepoMan mitotic phosphatases assemble via an identical, yet novel mechanism. eLife 5.
Kunze A, Achilles A, Keiner S, Witte OW, Redecker C (2015) Two distinct populations of doublecortin-positive cells in the perilesional zone of cortical infarcts. BMC neuroscience 16.
Kuzuhara S, Mori H, Izumiyama N, Yoshimura M, Ihara Y (1988) Lewy bodies are ubiquitinated. A light and electron microscopic immunocytochemical study. Acta neuropathologica 75:345-353.
Lacefield CO, Itskov V, Reardon T, Hen R, Gordon JA (2012) Effects of adult-generated granule cells on coordinated network activity in the dentate gyrus. Hippocampus 22:106-116.
Lai MK, Tsang SW, Garcia-Alloza M, Minger SL, Nicoll JA, Esiri MM, Wong PT, Chen CP, Ramirez MJ, Francis PT (2006) Selective effects of the APOE epsilon4 allele on presynaptic cholinergic markers in the neocortex of Alzheimer's disease. Neurobiology of disease 22:555-561.
Lalonde R (2002) The neurobiological basis of spontaneous alternation. Neurosci Biobehav Rev 26:91-104.
Lambert JC et al. (2009) Genome-wide association study identifies variants at CLU and CR1 associated with Alzheimer's disease. Nat Genet 41:1094-1099.
Lambert JC et al. (2013) Meta-analysis of 74,046 individuals identifies 11 new susceptibility loci for Alzheimer's disease. Nat Genet 45:1452-1458.
Lannfelt L, Blennow K, Zetterberg H, Batsman S, Ames D, Harrison J, Masters CL, Targum S, Bush AI, Murdoch R, Wilson J, Ritchie CW (2008) Safety, efficacy, and biomarker findings of PBT2 in targeting Abeta as a modifying therapy for Alzheimer's disease: a phase IIa, double-blind, randomised, placebo-controlled trial. The Lancet Neurology 7:779-786.
Lanoiselee HM et al. (2017) APP, PSEN1, and PSEN2 mutations in early-onset Alzheimer disease: A genetic screening study of familial and sporadic cases. PLoS medicine 14:e1002270.
Latham TE, Theophilus BD, Grabowski GA, Smith FI (1991) Heterogeneity of mutations in the acid beta-glucosidase gene of Gaucher disease patients. DNA and cell biology 10:15-21.
221 Lau AG, Irier HA, Gu J, Tian D, Ku L, Liu G, Xia M, Fritsch B, Zheng JQ, Dingledine R, Xu B, Lu B,
Feng Y (2010) Distinct 3'UTRs differentially regulate activity-dependent translation of brain-derived neurotrophic factor (BDNF). Proceedings of the National Academy of Sciences of the United States of America 107:15945-15950.
Lavado A, Lagutin OV, Chow LM, Baker SJ, Oliver G (2010) Prox1 is required for granule cell maturation and intermediate progenitor maintenance during brain neurogenesis. PLoS biology 8.
Leanza G, Nilsson OG, Wiley RG, Bjorklund A (1995) Selective lesioning of the basal forebrain cholinergic system by intraventricular 192 IgG-saporin: behavioural, biochemical and stereological studies in the rat. The European journal of neuroscience 7:329-343.
Lee R, Kermani P, Teng KK, Hempstead BL (2001) Regulation of cell survival by secreted proneurotrophins. Science 294:1945-1948.
Leuzy A, Chiotis K, Lemoine L, Gillberg PG, Almkvist O, Rodriguez-Vieitez E, Nordberg A (2019) Tau PET imaging in neurodegenerative tauopathies-still a challenge. Molecular psychiatry.
Leuzy A et al. (2016) Pittsburgh compound B imaging and cerebrospinal fluid amyloid-beta in a multicentre European memory clinic study. Brain : a journal of neurology 139:2540-2553.
Li B, Yamamori H, Tatebayashi Y, Shafit-Zagardo B, Tanimukai H, Chen S, Iqbal K, Grundke-Iqbal I (2008) Failure of neuronal maturation in Alzheimer disease dentate gyrus. Journal of neuropathology and experimental neurology 67:78-84.
Li G, Bien-Ly N, Andrews-Zwilling Y, Xu Q, Bernardo A, Ring K, Halabisky B, Deng C, Mahley RW, Huang Y (2009a) GABAergic interneuron dysfunction impairs hippocampal neurogenesis in adult apolipoprotein E4 knockin mice. Cell stem cell 5:634-645.
Li JQ, Tan L, Yu JT (2014) The role of the LRRK2 gene in Parkinsonism. Molecular neurodegeneration 9:47.
Li S, Hong S, Shepardson NE, Walsh DM, Shankar GM, Selkoe D (2009b) Soluble oligomers of amyloid Beta protein facilitate hippocampal long-term depression by disrupting neuronal glutamate uptake. Neuron 62:788-801.
Li W, Lee VM (2006) Characterization of two VQIXXK motifs for tau fibrillization in vitro. Biochemistry-Us 45:15692-15701.
Licht T, Rothe G, Kreisel T, Wolf B, Benny O, Rooney AG, Ffrench-Constant C, Enikolopov G, Keshet E (2016) VEGF preconditioning leads to stem cell remodeling and attenuates age-related decay of adult hippocampal neurogenesis. Proceedings of the National Academy of Sciences of the United States of America 113:E7828-E7836.
Lieberman RL, D'Aquino J A, Ringe D, Petsko GA (2009) Effects of pH and iminosugar pharmacological chaperones on lysosomal glycosidase structure and stability. Biochemistry-Us 48:4816-4827.
Lilienfeld S, Kurz A (2002) Broad therapeutic benefits in patients with probable vascular dementia or Alzheimer's disease with cerebrovascular disease treated with galantamine. Annals of the New York Academy of Sciences 977:487-492.
Lim DA, Alvarez-Buylla A (2016) The Adult Ventricular-Subventricular Zone (V-SVZ) and Olfactory Bulb (OB) Neurogenesis. Cold Spring Harbor perspectives in biology 8.
Lim YY, Villemagne VL, Laws SM, Pietrzak RH, Snyder PJ, Ames D, Ellis KA, Harrington K, Rembach A, Martins RN, Rowe CC, Masters CL, Maruff P (2015) APOE and BDNF polymorphisms moderate amyloid beta-related cognitive decline in preclinical Alzheimer's disease. Molecular psychiatry 20:1322-1328.
Lippa CF, Smith TW, Perry E (1999) Dementia with Lewy bodies: choline acetyltransferase parallels nucleus basalis pathology. J Neural Transm (Vienna) 106:525-535.
Lisman JE (1999) Relating hippocampal circuitry to function: recall of memory sequences by reciprocal dentate-CA3 interactions. Neuron 22:233-242.
222 Liu AK, Chang RC, Pearce RK, Gentleman SM (2015) Nucleus basalis of Meynert revisited:
anatomy, history and differential involvement in Alzheimer's and Parkinson's disease. Acta neuropathologica 129:527-540.
Liu AKL, Chau TW, Lim EJ, Ahmed I, Chang RC, Kalaitzakis ME, Graeber MB, Gentleman SM, Pearce RKB (2019) Hippocampal CA2 Lewy pathology is associated with cholinergic degeneration in Parkinson's disease with cognitive decline. Acta neuropathologica communications 7:61.
Liu B, Bossing T (2016) Single neuron transcriptomics identify SRSF/SR protein B52 as a regulator of axon growth and Choline acetyltransferase splicing. Scientific reports 6:34952.
Liu CC, Zhao N, Fu Y, Wang N, Linares C, Tsai CW, Bu G (2017) ApoE4 Accelerates Early Seeding of Amyloid Pathology. Neuron 96:1024-1032 e1023.
Liu Q, Huang Y, Shen J, Steffensen S, Wu J (2012a) Functional alpha7beta2 nicotinic acetylcholine receptors expressed in hippocampal interneurons exhibit high sensitivity to pathological level of amyloid beta peptides. BMC neuroscience 13:155.
Liu Q, Huang Y, Xue F, Simard A, DeChon J, Li G, Zhang J, Lucero L, Wang M, Sierks M, Hu G, Chang Y, Lukas RJ, Wu J (2009) A novel nicotinic acetylcholine receptor subtype in basal forebrain cholinergic neurons with high sensitivity to amyloid peptides. The Journal of neuroscience : the official journal of the Society for Neuroscience 29:918-929.
Liu T, Lipnicki DM, Zhu W, Tao D, Zhang C, Cui Y, Jin JS, Sachdev PS, Wen W (2012b) Cortical gyrification and sulcal spans in early stage Alzheimer's disease. PloS one 7:e31083.
Liu Y, Namba T, Liu J, Suzuki R, Shioda S, Seki T (2010) Glial Fibrillary Acidic Protein-Expressing Neural Progenitors Give Rise to Immature Neurons Via Early Intermediate Progenitors Expressing Both Glial Fibrillary Acidic Protein and Neuronal Markers in the Adult Hippocampus. Neuroscience 166:241-251.
Llorens-Martin M, Fuster-Matanzo A, Teixeira CM, Jurado-Arjona J, Ulloa F, Defelipe J, Rabano A, Hernandez F, Soriano E, Avila J (2013) GSK-3beta overexpression causes reversible alterations on postsynaptic densities and dendritic morphology of hippocampal granule neurons in vivo. Molecular psychiatry 18:451-460.
Louissaint A, Jr., Rao S, Leventhal C, Goldman SA (2002) Coordinated interaction of neurogenesis and angiogenesis in the adult songbird brain. Neuron 34:945-960.
Lovestone S, Boada M, Dubois B, Hull M, Rinne JO, Huppertz HJ, Calero M, Andres MV, Gomez-Carrillo B, Leon T, del Ser T (2015) A phase II trial of tideglusib in Alzheimer's disease. Journal of Alzheimer's disease : JAD 45:75-88.
Lowe J, Blanchard A, Morrell K, Lennox G, Reynolds L, Billett M, Landon M, Mayer RJ (1988a) Ubiquitin is a common factor in intermediate filament inclusion bodies of diverse type in man, including those of Parkinson's disease, Pick's disease, and Alzheimer's disease, as well as Rosenthal fibres in cerebellar astrocytomas, cytoplasmic bodies in muscle, and mallory bodies in alcoholic liver disease. J Pathol 155:9-15.
Lowe SL, Francis PT, Procter AW, Palmer AM, Davison AN, Bowen DM (1988b) Gamma-aminobutyric acid concentration in brain tissue at two stages of Alzheimer's disease. Brain : a journal of neurology 111 ( Pt 4):785-799.
Loy CT, Schofield PR, Turner AM, Kwok JB (2014) Genetics of dementia. Lancet 383:828-840. Lu CB, Henderson Z (2010) Nicotine induction of theta frequency oscillations in rodent
hippocampus in vitro. Neuroscience 166:84-93. Luna-Munoz J, Chavez-Macias L, Garcia-Sierra F, Mena R (2007) Earliest stages of tau
conformational changes are related to the appearance of a sequence of specific phospho-dependent tau epitopes in Alzheimer's disease. Journal of Alzheimer's disease : JAD 12:365-375.
Lwin A, Orvisky E, Goker-Alpan O, LaMarca ME, Sidransky E (2004) Glucocerebrosidase mutations in subjects with parkinsonism. Mol Genet Metab 81:70-73.
Lydersen S (2015) Statistical review: frequently given comments. Annals of the Rheumatic Diseases 74:323-325.
223 Lyness SA, Zarow C, Chui HC (2003) Neuron loss in key cholinergic and aminergic nuclei in
Alzheimer disease: a meta-analysis. Neurobiology of aging 24:1-23. Ma QH, Futagawa T, Yang WL, Jiang XD, Zeng L, Takeda Y, Xu RX, Bagnard D, Schachner M, Furley
AJ, Karagogeos D, Watanabe K, Dawe GS, Xiao ZC (2008) A TAG1-APP signalling pathway through Fe65 negatively modulates neurogenesis. Nat Cell Biol 10:283-294.
Mallett V, Ross JP, Alcalay RN, Ambalavanan A, Sidransky E, Dion PA, Rouleau GA, Gan-Or Z (2016) GBA p.T369M substitution in Parkinson disease: Polymorphism or association? A meta-analysis. Neurol Genet 2:e104.
Mamad O, McNamara HM, Reilly RB, Tsanov M (2015) Medial septum regulates the hippocampal spatial representation. Front Behav Neurosci 9:166.
Mandyam CD, Harburg GC, Eisch AJ (2007) Determination of key aspects of precursor cell proliferation, cell cycle length and kinetics in the adult mouse subgranular zone. Neuroscience 146:108-122.
Manns ID, Mainville L, Jones BE (2001) Evidence for glutamate, in addition to acetylcholine and GABA, neurotransmitter synthesis in basal forebrain neurons projecting to the entorhinal cortex. Neuroscience 107:249-263.
Marra C, Quaranta D, Profice P, Pilato F, Capone F, Iodice F, Di Lazzaro V, Gainotti G (2012) Central cholinergic dysfunction measured "in vivo" correlates with different behavioral disorders in Alzheimer's disease and dementia with Lewy body. Brain Stimul 5:533-538.
Martens CR, Denman BA, Mazzo MR, Armstrong ML, Reisdorph N, McQueen MB, Chonchol M, Seals DR (2018) Chronic nicotinamide riboside supplementation is well-tolerated and elevates NAD(+) in healthy middle-aged and older adults. Nature communications 9:1286.
Martinello K, Huang Z, Lujan R, Tran B, Watanabe M, Cooper EC, Brown DA, Shah MM (2015) Cholinergic afferent stimulation induces axonal function plasticity in adult hippocampal granule cells. Neuron 85:346-363.
Martinez-Canabal A (2014) Reconsidering hippocampal neurogenesis in Alzheimer's disease. Frontiers in neuroscience 8:147.
Martyn AC, De Jaeger X, Magalhaes AC, Kesarwani R, Goncalves DF, Raulic S, Guzman MS, Jackson MF, Izquierdo I, Macdonald JF, Prado MA, Prado VF (2012) Elimination of the vesicular acetylcholine transporter in the forebrain causes hyperactivity and deficits in spatial memory and long-term potentiation. Proceedings of the National Academy of Sciences of the United States of America 109:17651-17656.
Matlack KE, Tardiff DF, Narayan P, Hamamichi S, Caldwell KA, Caldwell GA, Lindquist S (2014) Clioquinol promotes the degradation of metal-dependent amyloid-beta (Abeta) oligomers to restore endocytosis and ameliorate Abeta toxicity. Proceedings of the National Academy of Sciences of the United States of America 111:4013-4018.
Matsunaga S, Kishi T, Iwata N (2015) Memantine monotherapy for Alzheimer's disease: a systematic review and meta-analysis. PloS one 10:e0123289.
Mazere J, Lamare F, Allard M, Fernandez P, Mayo W (2017) 123I-Iodobenzovesamicol SPECT Imaging of Cholinergic Systems in Dementia with Lewy Bodies. J Nucl Med 58:123-128.
Mazère J, Lamare F, Allard M, Fernandez P, Mayo W (2017) 123I-Iodobenzovesamicol SPECT Imaging of Cholinergic Systems in Dementia with Lewy Bodies. J Nucl Med 58:123-128.
Mazzulli JR, Xu YH, Sun Y, Knight AL, McLean PJ, Caldwell GA, Sidransky E, Grabowski GA, Krainc D (2011) Gaucher disease glucocerebrosidase and alpha-synuclein form a bidirectional pathogenic loop in synucleinopathies. Cell 146:37-52.
McKeith IG et al. (2005) Diagnosis and management of dementia with Lewy bodies: third report of the DLB Consortium. Neurology 65:1863-1872.
McKeith IG et al. (2017) Diagnosis and management of dementia with Lewy bodies: Fourth consensus report of the DLB Consortium. Neurology 89:88-100.
McKenna JT, Yang C, Franciosi S, Winston S, Abarr KK, Rigby MS, Yanagawa Y, McCarley RW, Brown RE (2013) Distribution and intrinsic membrane properties of basal forebrain
224
GABAergic and parvalbumin neurons in the mouse. The Journal of comparative neurology 521:1225-1250.
McKhann GM, Knopman DS, Chertkow H, Hyman BT, Jack CR, Jr., Kawas CH, Klunk WE, Koroshetz WJ, Manly JJ, Mayeux R, Mohs RC, Morris JC, Rossor MN, Scheltens P, Carrillo MC, Thies B, Weintraub S, Phelps CH (2011) The diagnosis of dementia due to Alzheimer's disease: recommendations from the National Institute on Aging-Alzheimer's Association workgroups on diagnostic guidelines for Alzheimer's disease. Alzheimer's & dementia : the journal of the Alzheimer's Association 7:263-269.
McKiernan EF, O'Brien JT (2017) 7T MRI for neurodegenerative dementias in vivo: a systematic review of the literature. Journal of neurology, neurosurgery, and psychiatry 88:564-574.
McNamara RK, Skelton RW (1993) The neuropharmacological and neurochemical basis of place learning in the Morris water maze. Brain Res Brain Res Rev 18:33-49.
Meisl G, Yang X, Hellstrand E, Frohm B, Kirkegaard JB, Cohen SI, Dobson CM, Linse S, Knowles TP (2014) Differences in nucleation behavior underlie the contrasting aggregation kinetics of the Abeta40 and Abeta42 peptides. Proceedings of the National Academy of Sciences of the United States of America 111:9384-9389.
Merkle FT, Mirzadeh Z, Alvarez-Buylla A (2007) Mosaic organization of neural stem cells in the adult brain. Science 317:381-384.
Merluzzi AP, Carlsson CM, Johnson SC, Schindler SE, Asthana S, Blennow K, Zetterberg H, Bendlin BB (2018) Neurodegeneration, synaptic dysfunction, and gliosis are phenotypic of Alzheimer dementia. Neurology.
Mesulam MM, Mufson EJ, Levey AI, Wainer BH (1983a) Cholinergic innervation of cortex by the basal forebrain: cytochemistry and cortical connections of the septal area, diagonal band nuclei, nucleus basalis (substantia innominata), and hypothalamus in the rhesus monkey. The Journal of comparative neurology 214:170-197.
Mesulam MM, Mufson EJ, Wainer BH, Levey AI (1983b) Central cholinergic pathways in the rat: an overview based on an alternative nomenclature (Ch1-Ch6). Neuroscience 10:1185-1201.
Miller MW, Nowakowski RS (1988) Use of bromodeoxyuridine-immunohistochemistry to examine the proliferation, migration and time of origin of cells in the central nervous system. Brain research 457:44-52.
Min SW et al. (2015) Critical role of acetylation in tau-mediated neurodegeneration and cognitive deficits. Nature medicine 21:1154-1162.
Mingote S, Chuhma N, Kusnoor SV, Field B, Deutch AY, Rayport S (2015) Functional Connectome Analysis of Dopamine Neuron Glutamatergic Connections in Forebrain Regions. The Journal of neuroscience : the official journal of the Society for Neuroscience 35:16259-16271.
Mione MC, Cavanagh JFR, Harris B, Parnavelas JG (1997) Cell fate specification and symmetrical/asymmetrical divisions in the developing cerebral cortex. Journal of Neuroscience 17:2018-2029.
Mirra SS, Heyman A, McKeel D, Sumi SM, Crain BJ, Brownlee LM, Vogel FS, Hughes JP, van Belle G, Berg L (1991) The Consortium to Establish a Registry for Alzheimer's Disease (CERAD). Part II. Standardization of the neuropathologic assessment of Alzheimer's disease. Neurology 41:479-486.
Misawa H, Matsuura J, Oda Y, Takahashi R, Deguchi T (1997) Human choline acetyltransferase mRNAs with different 5'-region produce a 69-kDa major translation product. Brain research Molecular brain research 44:323-333.
Mitchell JF, Sundberg KA, Reynolds JH (2009) Spatial attention decorrelates intrinsic activity fluctuations in macaque area V4. Neuron 63:879-888.
Mitsushima D, Sano A, Takahashi T (2013) A cholinergic trigger drives learning-induced plasticity at hippocampal synapses. Nature communications 4:2760.
Mohapel P, Leanza G, Kokaia M, Lindvall O (2005) Forebrain acetylcholine regulates adult hippocampal neurogenesis and learning. Neurobiology of aging 26:939-946.
225 Moldovan GL, Pfander B, Jentsch S (2007) PCNA, the maestro of the replication fork. Cell
129:665-679. Mondragón-Rodríguez S, Perry G, Luna-Munoz J, Acevedo-Aquino MC, Williams S (2014)
Phosphorylation of tau protein at sites Ser(396-404) is one of the earliest events in Alzheimer's disease and Down syndrome. Neuropathology and applied neurobiology 40:121-135.
Montine TJ, Phelps CH, Beach TG, Bigio EH, Cairns NJ, Dickson DW, Duyckaerts C, Frosch MP, Masliah E, Mirra SS, Nelson PT, Schneider JA, Thal DR, Trojanowski JQ, Vinters HV, Hyman BT (2012) National Institute on Aging-Alzheimer's Association guidelines for the neuropathologic assessment of Alzheimer's disease: a practical approach. Acta neuropathologica 123:1-11.
Moon M, Cha MY, Mook-Jung I (2014) Impaired hippocampal neurogenesis and its enhancement with ghrelin in 5XFAD mice. Journal of Alzheimer's disease : JAD 41:233-241.
Moraes W, Poyares D, Sukys-Claudino L, Guilleminault C, Tufik S (2008) Donepezil improves obstructive sleep apnea in Alzheimer disease: a double-blind, placebo-controlled study. Chest 133:677-683.
Moreno-Jiménez EP, Flor-Garcia M, Terreros-Roncal J, Rabano A, Cafini F, Pallas-Bazarra N, Avila J, Llorens-Martin M (2019) Adult hippocampal neurogenesis is abundant in neurologically healthy subjects and drops sharply in patients with Alzheimer's disease. Nature medicine 25:554-560.
Morey TM, Winick-Ng W, Seah C, Rylett RJ (2017) Chaperone-Mediated Regulation of Choline Acetyltransferase Protein Stability and Activity by HSC/HSP70, HSP90, and p97/VCP. Front Mol Neurosci 10:415.
Morgan D, Diamond DM, Gottschall PE, Ugen KE, Dickey C, Hardy J, Duff K, Jantzen P, DiCarlo G, Wilcock D, Connor K, Hatcher J, Hope C, Gordon M, Arendash GW (2000) A beta peptide vaccination prevents memory loss in an animal model of Alzheimer's disease. Nature 408:982-985.
Morris JC (1993) The Clinical Dementia Rating (CDR): current version and scoring rules. Neurology 43:2412-2414.
Moss J, Gebara E, Bushong EA, Sanchez-Pascual I, O'Laoi R, El M'Ghari I, Kocher-Braissant J, Ellisman MH, Toni N (2016) Fine processes of Nestin-GFP-positive radial glia-like stem cells in the adult dentate gyrus ensheathe local synapses and vasculature. Proceedings of the National Academy of Sciences of the United States of America 113:E2536-2545.
Mrzljak L, Pappy M, Leranth C, Goldman-Rakic PS (1995) Cholinergic synaptic circuitry in the macaque prefrontal cortex. The Journal of comparative neurology 357:603-617.
Mu Y, Zhao C, Gage FH (2011) Dopaminergic modulation of cortical inputs during maturation of adult-born dentate granule cells. The Journal of neuroscience : the official journal of the Society for Neuroscience 31:4113-4123.
Mufson EJ, Bothwell M, Kordower JH (1989) Loss of nerve growth factor receptor-containing neurons in Alzheimer's disease: a quantitative analysis across subregions of the basal forebrain. Experimental neurology 105:221-232.
Muller F, Dumez Y, Massoulie J (1985) Molecular forms and solubility of acetylcholinesterase during the embryonic development of rat and human brain. Brain research 331:295-302.
Naj AC et al. (2011) Common variants at MS4A4/MS4A6E, CD2AP, CD33 and EPHA1 are associated with late-onset Alzheimer's disease. Nat Genet 43:436-441.
Nalls MA et al. (2013) A multicenter study of glucocerebrosidase mutations in dementia with Lewy bodies. JAMA Neurol 70:727-735.
Nava-Mesa MO, Jimenez-Diaz L, Yajeya J, Navarro-Lopez JD (2014) GABAergic neurotransmission and new strategies of neuromodulation to compensate synaptic dysfunction in early stages of Alzheimer's disease. Frontiers in cellular neuroscience 8:167.
Navarrete M, Perea G, Fernandez de Sevilla D, Gomez-Gonzalo M, Nunez A, Martin ED, Araque A (2012) Astrocytes mediate in vivo cholinergic-induced synaptic plasticity. PLoS biology 10:e1001259.
226 Nazarali AJ, Reynolds GP (1992) Monoamine neurotransmitters and their metabolites in brain
regions in Alzheimer's disease: a postmortem study. Cell Mol Neurobiol 12:581-587. Nejad-Davarani S, Koeppe RA, Albin RL, Frey KA, Muller M, Bohnen NI (2018) Quantification of
brain cholinergic denervation in dementia with Lewy bodies using PET imaging with [(18)F]-FEOBV. Molecular psychiatry.
Nelson AB, Bussert TG, Kreitzer AC, Seal RP (2014) Striatal cholinergic neurotransmission requires VGLUT3. The Journal of neuroscience : the official journal of the Society for Neuroscience 34:8772-8777.
Newman EL, Climer JR, Hasselmo ME (2014) Grid cell spatial tuning reduced following systemic muscarinic receptor blockade. Hippocampus 24:643-655.
Nickerson Poulin A, Guerci A, El Mestikawy S, Semba K (2006) Vesicular glutamate transporter 3 immunoreactivity is present in cholinergic basal forebrain neurons projecting to the basolateral amygdala in rat. The Journal of comparative neurology 498:690-711.
Nicoll JA, Wilkinson D, Holmes C, Steart P, Markham H, Weller RO (2003) Neuropathology of human Alzheimer disease after immunization with amyloid-beta peptide: a case report. Nature medicine 9:448-452.
Nicoll JA, Barton E, Boche D, Neal JW, Ferrer I, Thompson P, Vlachouli C, Wilkinson D, Bayer A, Games D, Seubert P, Schenk D, Holmes C (2006) Abeta species removal after abeta42 immunization. Journal of neuropathology and experimental neurology 65:1040-1048.
Nilsson O, Svennerholm L (1982) Accumulation of glucosylceramide and glucosylsphingosine (psychosine) in cerebrum and cerebellum in infantile and juvenile Gaucher disease. Journal of neurochemistry 39:709-718.
Noshita T, Murayama N, Nakamura S (2015) Effect of nicotine on neuronal dysfunction induced by intracerebroventricular infusion of amyloid-beta peptide in rats. European review for medical and pharmacological sciences 19:334-343.
Noureddine H, Carvalho S, Schmitt C, Massoulie J, Bon S (2008) Acetylcholinesterase associates differently with its anchoring proteins ColQ and PRiMA. The Journal of biological chemistry 283:20722-20732.
Nowrangi MA, Rosenberg PB (2015) The fornix in mild cognitive impairment and Alzheimer's disease. Frontiers in aging neuroscience 7:1.
Ntamati NR, Luscher C (2016) VTA Projection Neurons Releasing GABA and Glutamate in the Dentate Gyrus. eNeuro 3.
O'Brien JT, Holmes C, Jones M, Jones R, Livingston G, McKeith I, Mittler P, Passmore P, Ritchie C, Robinson L, Sampson EL, Taylor JP, Thomas A, Burns A (2017) Clinical practice with anti-dementia drugs: A revised (third) consensus statement from the British Association for Psychopharmacology. J Psychopharmacol 31:147-168.
O'Bryant SE, Waring SC, Cullum CM, Hall J, Lacritz L, Massman PJ, Lupo PJ, Reisch JS, Doody R (2008) Staging dementia using Clinical Dementia Rating Scale Sum of Boxes scores: a Texas Alzheimer's research consortium study. Archives of neurology 65:1091-1095.
O'Bryant SE et al. (2015) Guidelines for the standardization of preanalytic variables for blood-based biomarker studies in Alzheimer's disease research. Alzheimer's & dementia : the journal of the Alzheimer's Association 11:549-560.
Oakley H, Cole SL, Logan S, Maus E, Shao P, Craft J, Guillozet-Bongaarts A, Ohno M, Disterhoft J, Van Eldik L, Berry R, Vassar R (2006) Intraneuronal beta-amyloid aggregates, neurodegeneration, and neuron loss in transgenic mice with five familial Alzheimer's disease mutations: potential factors in amyloid plaque formation. The Journal of neuroscience : the official journal of the Society for Neuroscience 26:10129-10140.
Obernier K, Cebrian-Silla A, Thomson M, Parraguez JI, Anderson R, Guinto C, Rodas Rodriguez J, Garcia-Verdugo JM, Alvarez-Buylla A (2018) Adult Neurogenesis Is Sustained by Symmetric Self-Renewal and Differentiation. Cell stem cell 22:221-234 e228.
Ohara S, Sato S, Tsutsui K, Witter MP, Iijima T (2013) Organization of multisynaptic inputs to the dorsal and ventral dentate gyrus: retrograde trans-synaptic tracing with rabies virus vector in the rat. PloS one 8:e78928.
227 Okano HJ, Darnell RB (1997) A hierarchy of Hu RNA binding proteins in developing and adult
neurons. Journal of Neuroscience 17:3024-3037. Okochi M, Walter J, Koyama A, Nakajo S, Baba M, Iwatsubo T, Meijer L, Kahle PJ, Haass C (2000)
Constitutive phosphorylation of the Parkinson's disease associated alpha-synuclein. Journal of Biological Chemistry 275:390-397.
Orgogozo JM, Gilman S, Dartigues JF, Laurent B, Puel M, Kirby LC, Jouanny P, Dubois B, Eisner L, Flitman S, Michel BF, Boada M, Frank A, Hock C (2003) Subacute meningoencephalitis in a subset of patients with AD after Abeta42 immunization. Neurology 61:46-54.
Orvisky E, Park JK, LaMarca ME, Ginns EI, Martin BM, Tayebi N, Sidransky E (2002) Glucosylsphingosine accumulation in tissues from patients with Gaucher disease: correlation with phenotype and genotype. Mol Genet Metab 76:262-270.
Pabst M, Braganza O, Dannenberg H, Hu W, Pothmann L, Rosen J, Mody I, van Loo K, Deisseroth K, Becker AJ, Schoch S, Beck H (2016) Astrocyte Intermediaries of Septal Cholinergic Modulation in the Hippocampus. Neuron 90:853-865.
Pagani JH, Zhao M, Cui Z, Avram SK, Caruana DA, Dudek SM, Young WS (2015) Role of the vasopressin 1b receptor in rodent aggressive behavior and synaptic plasticity in hippocampal area CA2. Molecular psychiatry 20:490-499.
Palmer AM, Wilcock GK, Esiri MM, Francis PT, Bowen DM (1987) Monoaminergic innervation of the frontal and temporal lobes in Alzheimer's disease. Brain research 401:231-238.
Palmer TD, Willhoite AR, Gage FH (2000) Vascular niche for adult hippocampal neurogenesis. The Journal of comparative neurology 425:479-494.
Palop JJ, Mucke L (2010) Amyloid-beta-induced neuronal dysfunction in Alzheimer's disease: from synapses toward neural networks. Nature neuroscience 13:812-818.
Palop JJ, Jones B, Kekonius L, Chin J, Yu GQ, Raber J, Masliah E, Mucke L (2003) Neuronal depletion of calcium-dependent proteins in the dentate gyrus is tightly linked to Alzheimer's disease-related cognitive deficits. Proceedings of the National Academy of Sciences of the United States of America 100:9572-9577.
Pang PT, Teng HK, Zaitsev E, Woo NT, Sakata K, Zhen SH, Teng KK, Yung WH, Hempstead BL, Lu B (2004) Cleavage of proBDNF by tPA/plasmin is essential for long-term hippocampal plasticity. Science 306:487-491.
Parent MJ, Bedard MA, Aliaga A, Minuzzi L, Mechawar N, Soucy JP, Schirrmacher E, Kostikov A, Gauthier SG, Rosa-Neto P (2013) Cholinergic Depletion in Alzheimer's Disease Shown by [ (18) F]FEOBV Autoradiography. Int J Mol Imaging 2013:205045.
Parikh V, Bernard CS, Naughton SX, Yegla B (2014) Interactions between Abeta oligomers and presynaptic cholinergic signaling: age-dependent effects on attentional capacities. Behav Brain Res 274:30-42.
Parker TD, Slattery CF, Zhang J, Nicholas JM, Paterson RW, Foulkes AJM, Malone IB, Thomas DL, Modat M, Cash DM, Crutch SJ, Alexander DC, Ourselin S, Fox NC, Zhang H, Schott JM (2018) Cortical microstructure in young onset Alzheimer's disease using neurite orientation dispersion and density imaging. Hum Brain Mapp 39:3005-3017.
Parrini M, Ghezzi D, Deidda G, Medrihan L, Castroflorio E, Alberti M, Baldelli P, Cancedda L, Contestabile A (2017) Aerobic exercise and a BDNF-mimetic therapy rescue learning and memory in a mouse model of Down syndrome. Scientific reports 7:16825.
Pedersen NP, Ferrari L, Venner A, Wang JL, Abbott SBG, Vujovic N, Arrigoni E, Saper CB, Fuller PM (2017) Supramammillary glutamate neurons are a key node of the arousal system. Nature communications 8:1405.
Peelaerts W, Bousset L, Van der Perren A, Moskalyuk A, Pulizzi R, Giugliano M, Van den Haute C, Melki R, Baekelandt V (2015) alpha-Synuclein strains cause distinct synucleinopathies after local and systemic administration. Nature 522:340-+.
Pereira AC, Huddleston DE, Brickman AM, Sosunov AA, Hen R, McKhann GM, Sloan R, Gage FH, Brown TR, Small SA (2007) An in vivo correlate of exercise-induced neurogenesis in the adult dentate gyrus. Proceedings of the National Academy of Sciences of the United States of America 104:5638-5643.

228 Pereira JB, Strandberg TO, Palmqvist S, Volpe G, van Westen D, Westman E, Hansson O,
Alzheimer's Disease Neuroimaging I (2018) Amyloid Network Topology Characterizes the Progression of Alzheimer's Disease During the Predementia Stages. Cerebral cortex (New York, NY : 1991) 28:340-349.
Pericak-Vance MA, Grubber J, Bailey LR, Hedges D, West S, Santoro L, Kemmerer B, Hall JL, Saunders AM, Roses AD, Small GW, Scott WK, Conneally PM, Vance JM, Haines JL (2000) Identification of novel genes in late-onset Alzheimer's disease. Experimental gerontology 35:1343-1352.
Perrier AL, Massoulie J, Krejci E (2002) PRiMA: the membrane anchor of acetylcholinesterase in the brain. Neuron 33:275-285.
Perrone-Bizzozero NI, Tanner DC, Mounce J, Bolognani F (2011) Increased expression of axogenesisrelated genes and mossy fibre length in dentate granule cells from adult HuD overexpressor mice. Asn Neuro 3.
Perry C, Sklan EH, Soreq H (2004) CREB regulates AChE-R-induced proliferation of human glioblastoma cells. Neoplasia (New York, NY) 6:279-286.
Perry EK, Johnson M, Ekonomou A, Perry RH, Ballard C, Attems J (2012) Neurogenic abnormalities in Alzheimer's disease differ between stages of neurogenesis and are partly related to cholinergic pathology. Neurobiology of disease 47:155-162.
Perry EK, Irving D, Kerwin JM, McKeith IG, Thompson P, Collerton D, Fairbairn AF, Ince PG, Morris CM, Cheng AV, et al. (1993) Cholinergic transmitter and neurotrophic activities in Lewy body dementia: similarity to Parkinson's and distinction from Alzheimer disease. Alzheimer disease and associated disorders 7:69-79.
Petersen RC, Thomas RG, Grundman M, Bennett D, Doody R, Ferris S, Galasko D, Jin S, Kaye J, Levey A, Pfeiffer E, Sano M, van Dyck CH, Thal LJ (2005) Vitamin E and donepezil for the treatment of mild cognitive impairment. N Engl J Med 352:2379-2388.
Petrantonakis PC, Poirazi P (2015) Dentate Gyrus circuitry features improve performance of sparse approximation algorithms. PloS one 10:e0117023.
Phani S, Gonye G, Iacovitti L (2010) VTA neurons show a potentially protective transcriptional response to MPTP. Brain research 1343:1-13.
Picciotto MR, Higley MJ, Mineur YS (2012) Acetylcholine as a neuromodulator: cholinergic signaling shapes nervous system function and behavior. Neuron 76:116-129.
Piggott MA, Marshall EF, Thomas N, Lloyd S, Court JA, Jaros E, Burn D, Johnson M, Perry RH, McKeith IG, Ballard C, Perry EK (1999) Striatal dopaminergic markers in dementia with Lewy bodies, Alzheimer's and Parkinson's diseases: rostrocaudal distribution. Brain : a journal of neurology 122 ( Pt 8):1449-1468.
Pilotto A, Premi E, Paola Caminiti S, Presotto L, Turrone R, Alberici A, Paghera B, Borroni B, Padovani A, Perani D (2018) Single-subject SPM FDG-PET patterns predict risk of dementia progression in Parkinson disease. Neurology 90:e1029-e1037.
Popescu AT, Zhou MR, Poo MM (2016) Phasic dopamine release in the medial prefrontal cortex enhances stimulus discrimination. Proceedings of the National Academy of Sciences of the United States of America 113:E3169-3176.
Poser R, Dokter M, von Bohlen Und Halbach V, Berger SM, Busch R, Baldus M, Unsicker K, von Bohlen Und Halbach O (2015) Impact of a deletion of the full-length and short isoform of p75NTR on cholinergic innervation and the population of postmitotic doublecortin positive cells in the dentate gyrus. Frontiers in neuroanatomy 9:63.
Postuma RB, Berg D, Stern M, Poewe W, Olanow CW, Oertel W, Obeso J, Marek K, Litvan I, Lang AE, Halliday G, Goetz CG, Gasser T, Dubois B, Chan P, Bloem BR, Adler CH, Deuschl G (2015) MDS clinical diagnostic criteria for Parkinson's disease. Mov Disord 30:1591-1601.
Prado VF, Roy A, Kolisnyk B, Gros R, Prado MA (2013) Regulation of cholinergic activity by the vesicular acetylcholine transporter. Biochem J 450:265-274.
Prado VF et al. (2006) Mice deficient for the vesicular acetylcholine transporter are myasthenic and have deficits in object and social recognition. Neuron 51:601-612.
229 Prince LY, Bacon TJ, Tigaret CM, Mellor JR (2016) Neuromodulation of the Feedforward Dentate
Gyrus-CA3 Microcircuit. Frontiers in synaptic neuroscience 8:32. Pruunsild P, Kazantseva A, Aid T, Palm K, Timmusk T (2007) Dissecting the human BDNF locus:
bidirectional transcription, complex splicing, and multiple promoters. Genomics 90:397-406.
Qin Z, Hu D, Han S, Hong DP, Fink AL (2007) Role of different regions of alpha-synuclein in the assembly of fibrils. Biochemistry-Us 46:13322-13330.
Quaranta D, Gainotti G, Di Giuda D, Vita MG, Cocciolillo F, Lacidogna G, Guglielmi V, Masullo C, Giordano A, Marra C (2018) Predicting progression of amnesic MCI: The integration of episodic memory impairment with perfusion SPECT. Psychiatry Res 271:43-49.
Rahimi J, Kovacs GG (2014) Prevalence of mixed pathologies in the aging brain. Alzheimer’s Research & Therapy 6:82.
Reisberg B, Doody R, Stoffler A, Schmitt F, Ferris S, Mobius HJ (2003) Memantine in moderate-to-severe Alzheimer's disease. N Engl J Med 348:1333-1341.
Ribeiro FM, Black SA, Cregan SP, Prado VF, Prado MA, Rylett RJ, Ferguson SS (2005) Constitutive high-affinity choline transporter endocytosis is determined by a carboxyl-terminal tail dileucine motif. Journal of neurochemistry 94:86-96.
Ribeiro Xavier AL, Kress BT, Goldman SA, Lacerda de Menezes JR, Nedergaard M (2015) A Distinct Population of Microglia Supports Adult Neurogenesis in the Subventricular Zone. The Journal of neuroscience : the official journal of the Society for Neuroscience 35:11848-11861.
Rice ME, Cragg SJ (2008) Dopamine spillover after quantal release: rethinking dopamine transmission in the nigrostriatal pathway. Brain research reviews 58:303-313.
Rich B, Scadeng M, Yamaguchi M, Wagner PD, Breen EC (2017) Skeletal myofiber vascular endothelial growth factor is required for the exercise training-induced increase in dentate gyrus neuronal precursor cells. J Physiol 595:5931-5943.
Roalf DR, Moberg PJ, Xie SX, Wolk DA, Moelter ST, Arnold SE (2013) Comparative accuracies of two common screening instruments for classification of Alzheimer's disease, mild cognitive impairment, and healthy aging. Alzheimer's & dementia : the journal of the Alzheimer's Association 9:529-537.
Rodríguez JJ, Jones VC, Tabuchi M, Allan SM, Knight EM, LaFerla FM, Oddo S, Verkhratsky A (2008) Impaired adult neurogenesis in the dentate gyrus of a triple transgenic mouse model of Alzheimer's disease. PloS one 3:e2935.
Rogaev EI, Sherrington R, Rogaeva EA, Levesque G, Ikeda M, Liang Y, Chi H, Lin C, Holman K, Tsuda T, et al. (1995) Familial Alzheimer's disease in kindreds with missense mutations in a gene on chromosome 1 related to the Alzheimer's disease type 3 gene. Nature 376:775-778.
Rogers GA, Parsons SM, Anderson DC, Nilsson LM, Bahr BA, Kornreich WD, Kaufman R, Jacobs RS, Kirtman B (1989) Synthesis, in vitro acetylcholine-storage-blocking activities, and biological properties of derivatives and analogues of trans-2-(4-phenylpiperidino)cyclohexanol (vesamicol). Journal of medicinal chemistry 32:1217-1230.
Rogers SL, Doody RS, Mohs RC, Friedhoff LT (1998) Donepezil improves cognition and global function in Alzheimer disease: a 15-week, double-blind, placebo-controlled study. Donepezil Study Group. Archives of internal medicine 158:1021-1031.
Rolls ET (2018) The storage and recall of memories in the hippocampo-cortical system. Cell and tissue research 373:577-604.
Rolls ET, Wirth S (2018) Spatial representations in the primate hippocampus, and their functions in memory and navigation. Prog Neurobiol.
Rosen WG, Mohs RC, Davis KL (1984) A new rating scale for Alzheimer's disease. The American journal of psychiatry 141:1356-1364.
Rosenberg PB, Drye LT, Martin BK, Frangakis C, Mintzer JE, Weintraub D, Porsteinsson AP, Schneider LS, Rabins PV, Munro CA, Meinert CL, Lyketsos CG (2010) Sertraline for the
230
treatment of depression in Alzheimer disease. The American journal of geriatric psychiatry : official journal of the American Association for Geriatric Psychiatry 18:136-145.
Sah N, Peterson BD, Lubejko ST, Vivar C, van Praag H (2017) Running reorganizes the circuitry of one-week-old adult-born hippocampal neurons. Scientific reports 7:10903.
Sahay A, Scobie KN, Hill AS, O'Carroll CM, Kheirbek MA, Burghardt NS, Fenton AA, Dranovsky A, Hen R (2011) Increasing adult hippocampal neurogenesis is sufficient to improve pattern separation. Nature 472:466-470.
Sanai N, Tramontin AD, Quinones-Hinojosa A, Barbaro NM, Gupta N, Kunwar S, Lawton MT, McDermott MW, Parsa AT, Manuel-Garcia Verdugo J, Berger MS, Alvarez-Buylla A (2004) Unique astrocyte ribbon in adult human brain contains neural stem cells but lacks chain migration. Nature 427:740-744.
Sardi SP, Clarke J, Kinnecom C, Tamsett TJ, Li L, Stanek LM, Passini MA, Grabowski GA, Schlossmacher MG, Sidman RL, Cheng SH, Shihabuddin LS (2011) CNS expression of glucocerebrosidase corrects alpha-synuclein pathology and memory in a mouse model of Gaucher-related synucleinopathy. Proceedings of the National Academy of Sciences of the United States of America 108:12101-12106.
Sassi C, Guerreiro R, Gibbs R, Ding J, Lupton MK, Troakes C, Al-Sarraj S, Niblock M, Gallo JM, Adnan J, Killick R, Brown KS, Medway C, Lord J, Turton J, Bras J, Morgan K, Powell JF, Singleton A, Hardy J (2014) Investigating the role of rare coding variability in Mendelian dementia genes (APP, PSEN1, PSEN2, GRN, MAPT, and PRNP) in late-onset Alzheimer's disease. Neurobiology of aging 35:2881.e2881-2881.e2886.
Sato Y, Uchida Y, Hu J, Young-Pearse TL, Niikura T, Mukouyama YS (2017) Soluble APP functions as a vascular niche signal that controls adult neural stem cell number. Development 144:2730-2736.
Saxe MD, Battaglia F, Wang JW, Malleret G, David DJ, Monckton JE, Garcia AD, Sofroniew MV, Kandel ER, Santarelli L, Hen R, Drew MR (2006) Ablation of hippocampal neurogenesis impairs contextual fear conditioning and synaptic plasticity in the dentate gyrus. Proceedings of the National Academy of Sciences of the United States of America 103:17501-17506.
Schafer MK, Weihe E, Erickson JD, Eiden LE (1995) Human and monkey cholinergic neurons visualized in paraffin-embedded tissues by immunoreactivity for VAChT, the vesicular acetylcholine transporter. Journal of molecular neuroscience : MN 6:225-235.
Scharfman HE (2016) The enigmatic mossy cell of the dentate gyrus. Nature reviews Neuroscience 17:562-575.
Scharfman HE (2017) Advances in understanding hilar mossy cells of the dentate gyrus. Cell and tissue research.
Scheff SW, Sparks L, Price DA (1993) Quantitative assessment of synaptic density in the entorhinal cortex in Alzheimer's disease. Annals of neurology 34:356-361.
Scheff SW, Price DA, Schmitt FA, Scheff MA, Mufson EJ (2011) Synaptic loss in the inferior temporal gyrus in mild cognitive impairment and Alzheimer's disease. Journal of Alzheimer's disease : JAD 24:547-557.
Schenk D et al. (1999) Immunization with amyloid-beta attenuates Alzheimer-disease-like pathology in the PDAPP mouse. Nature 400:173-177.
Schindelin J, Arganda-Carreras I, Frise E, Kaynig V, Longair M, Pietzsch T, Preibisch S, Rueden C, Saalfeld S, Schmid B, Tinevez JY, White DJ, Hartenstein V, Eliceiri K, Tomancak P, Cardona A (2012) Fiji: an open-source platform for biological-image analysis. Nat Methods 9:676-682.
Schlachetzki JC, Grimm T, Schlachetzki Z, Ben Abdallah NM, Ettle B, Vohringer P, Ferger B, Winner B, Nuber S, Winkler J (2016) Dopaminergic lesioning impairs adult hippocampal neurogenesis by distinct modification of alpha-synuclein. Journal of neuroscience research 94:62-73.
231 Schueler UH, Kolter T, Kaneski CR, Blusztajn JK, Herkenham M, Sandhoff K, Brady RO (2003)
Toxicity of glucosylsphingosine (glucopsychosine) to cultured neuronal cells: a model system for assessing neuronal damage in Gaucher disease type 2 and 3. Neurobiology of disease 14:595-601.
Scimemi A, Meabon JS, Woltjer RL, Sullivan JM, Diamond JS, Cook DG (2013) Amyloid-beta1-42 slows clearance of synaptically released glutamate by mislocalizing astrocytic GLT-1. The Journal of neuroscience : the official journal of the Society for Neuroscience 33:5312-5318.
Seidel K, Bouzrou M, Heidemann N, Kruger R, Schols L, den Dunnen WFA, Korf HW, Rub U (2017) Involvement of the Cerebellum in Parkinson Disease and Dementia with Lewy Bodies. Annals of neurology 81:898-903.
Seidel K, Mahlke J, Siswanto S, Kruger R, Heinsen H, Auburger G, Bouzrou M, Grinberg LT, Wicht H, Korf HW, den Dunnen W, Rub U (2015) The Brainstem Pathologies of Parkinson's Disease and Dementia with Lewy Bodies. Brain pathology 25:121-135.
Sen A, Nelson TJ, Alkon DL (2015) ApoE4 and Abeta Oligomers Reduce BDNF Expression via HDAC Nuclear Translocation. The Journal of neuroscience : the official journal of the Society for Neuroscience 35:7538-7551.
Sen A, Nelson TJ, Alkon DL (2017) ApoE isoforms differentially regulates cleavage and secretion of BDNF. Mol Brain 10.
Seress L, Abraham H, Czeh B, Fuchs E, Leranth C (2008) Calretinin expression in hilar mossy cells of the hippocampal dentate gyrus of nonhuman primates and humans. Hippocampus 18:425-434.
Serrano-Pozo A, Qian J, Muzikansky A, Monsell SE, Montine TJ, Frosch MP, Betensky RA, Hyman BT (2016) Thal Amyloid Stages Do Not Significantly Impact the Correlation Between Neuropathological Change and Cognition in the Alzheimer Disease Continuum. Journal of neuropathology and experimental neurology 75:516-526.
Seshadri S et al. (2010) Genome-wide analysis of genetic loci associated with Alzheimer disease. Jama 303:1832-1840.
Seubert P, Mawal-Dewan M, Barbour R, Jakes R, Goedert M, Johnson GV, Litersky JM, Schenk D, Lieberburg I, Trojanowski JQ, et al. (1995) Detection of phosphorylated Ser262 in fetal tau, adult tau, and paired helical filament tau. The Journal of biological chemistry 270:18917-18922.
Shah S, Lubeck E, Zhou W, Cai L (2016) In Situ Transcription Profiling of Single Cells Reveals Spatial Organization of Cells in the Mouse Hippocampus. Neuron 92:342-357.
Shah S, Lubeck E, Zhou W, Cai L (2017) seqFISH Accurately Detects Transcripts in Single Cells and Reveals Robust Spatial Organization in the Hippocampus. Neuron 94:752-758 e751.
Sheline YI, West T, Yarasheski K, Swarm R, Jasielec MS, Fisher JR, Ficker WD, Yan P, Xiong C, Frederiksen C, Grzelak MV, Chott R, Bateman RJ, Morris JC, Mintun MA, Lee JM, Cirrito JR (2014) An antidepressant decreases CSF Abeta production in healthy individuals and in transgenic AD mice. Sci Transl Med 6:236re234.
Shen Q, Zhong WM, Jan YN, Temple S (2002) Asymmetric Numb distribution is critical for asymmetric cell division of mouse cerebral cortical stem cells and neuroblasts. Development 129:4843-4853.
Shin SJ, Jeong Y, Jeon SG, Kim S, Lee SK, Choi HS, Im CS, Kim SH, Kim SH, Park JH, Kim JI, Kim JJ, Moon M (2018) Uncaria rhynchophylla ameliorates amyloid beta deposition and amyloid beta-mediated pathology in 5XFAD mice. Neurochemistry international 121:114-124.
Sigurdsson EM (2018) Tau Immunotherapies for Alzheimer's Disease and Related Tauopathies: Progress and Potential Pitfalls. Journal of Alzheimer's disease : JAD 64:S555-s565.
Šimić G, Babic Leko M, Wray S, Harrington CR, Delalle I, Jovanov-Milosevic N, Bazadona D, Buee L, de Silva R, Di Giovanni G, Wischik CM, Hof PR (2017) Monoaminergic neuropathology in Alzheimer's disease. Prog Neurobiol 151:101-138.
232 Simonsen AH et al. (2017) Recommendations for CSF AD biomarkers in the diagnostic evaluation
of dementia. Alzheimer's & dementia : the journal of the Alzheimer's Association 13:274-284.
Skinner J, Carvalho JO, Potter GG, Thames A, Zelinski E, Crane PK, Gibbons LE (2012) The Alzheimer's Disease Assessment Scale-Cognitive-Plus (ADAS-Cog-Plus): an expansion of the ADAS-Cog to improve responsiveness in MCI. Brain imaging and behavior 6:489-501.
Smiley JF, Morrell F, Mesulam MM (1997) Cholinergic synapses in human cerebral cortex: an ultrastructural study in serial sections. Experimental neurology 144:361-368.
Smith CC, Greene RW (2012) CNS dopamine transmission mediated by noradrenergic innervation. The Journal of neuroscience : the official journal of the Society for Neuroscience 32:6072-6080.
Snyder JS, Soumier A, Brewer M, Pickel J, Cameron HA (2011) Adult hippocampal neurogenesis buffers stress responses and depressive behaviour. Nature 476:458-461.
Sojkova J, Driscoll I, Iacono D, Zhou Y, Codispoti KE, Kraut MA, Ferrucci L, Pletnikova O, Mathis CA, Klunk WE, O'Brien RJ, Wong DF, Troncoso JC, Resnick SM (2011) In vivo fibrillar beta-amyloid detected using [11C]PiB positron emission tomography and neuropathologic assessment in older adults. Archives of neurology 68:232-240.
Soltesz I, Losonczy A (2018) CA1 pyramidal cell diversity enabling parallel information processing in the hippocampus. Nature neuroscience 21:484-493.
Song J, Sun J, Moss J, Wen Z, Sun GJ, Hsu D, Zhong C, Davoudi H, Christian KM, Toni N, Ming GL, Song H (2013) Parvalbumin interneurons mediate neuronal circuitry-neurogenesis coupling in the adult hippocampus. Nature neuroscience 16:1728-1730.
Song NN, Jia YF, Zhang L, Zhang Q, Huang Y, Liu XZ, Hu L, Lan W, Chen L, Lesch KP, Chen X, Xu L, Ding YQ (2016) Reducing central serotonin in adulthood promotes hippocampal neurogenesis. Scientific reports 6:20338.
Sorrells SF, Paredes MF, Cebrian-Silla A, Sandoval K, Qi D, Kelley KW, James D, Mayer S, Chang J, Auguste KI, Chang EF, Gutierrez AJ, Kriegstein AR, Mathern GW, Oldham MC, Huang EJ, Garcia-Verdugo JM, Yang Z, Alvarez-Buylla A (2018) Human hippocampal neurogenesis drops sharply in children to undetectable levels in adults. Nature.
Sorrentino V, Romani M, Mouchiroud L, Beck JS, Zhang H, D'Amico D, Moullan N, Potenza F, Schmid AW, Rietsch S, Counts SE, Auwerx J (2017) Enhancing mitochondrial proteostasis reduces amyloid-beta proteotoxicity. Nature 552:187-193.
Soto C, Pritzkow S (2018) Protein misfolding, aggregation, and conformational strains in neurodegenerative diseases. Nature neuroscience 21:1332-1340.
Spalding KL, Bergmann O, Alkass K, Bernard S, Salehpour M, Huttner HB, Bostrom E, Westerlund I, Vial C, Buchholz BA, Possnert G, Mash DC, Druid H, Frisen J (2013) Dynamics of hippocampal neurogenesis in adult humans. Cell 153:1219-1227.
Spencer B, Desplats PA, Overk CR, Valera-Martin E, Rissman RA, Wu C, Mante M, Adame A, Florio J, Rockenstein E, Masliah E (2016) Reducing Endogenous alpha-Synuclein Mitigates the Degeneration of Selective Neuronal Populations in an Alzheimer's Disease Transgenic Mouse Model. The Journal of neuroscience : the official journal of the Society for Neuroscience 36:7971-7984.
Spillantini MG, Crowther RA, Jakes R, Hasegawa M, Goedert M (1998) alpha-Synuclein in filamentous inclusions of Lewy bodies from Parkinson's disease and dementia with lewy bodies. Proceedings of the National Academy of Sciences of the United States of America 95:6469-6473.
Spires-Jones TL, Attems J, Thal DR (2017) Interactions of pathological proteins in neurodegenerative diseases. Acta neuropathologica 134:187-205.
Stefanits H, Wesseling C, Kovacs GG (2014) Loss of Calbindin immunoreactivity in the dentate gyrus distinguishes Alzheimer's disease from other neurodegenerative dementias. Neuroscience letters 566:137-141.
233 Steiner B, Kronenberg G, Jessberger S, Brandt MD, Reuter K, Kempermann G (2004) Differential
regulation of gliogenesis in the context of adult hippocampal neurogenesis in mice. Glia 46:41-52.
Steiner B, Klempin F, Wang L, Kott M, Kettenmann H, Kempermann G (2006) Type-2 cells as link between glial and neuronal lineage in adult hippocampal neurogenesis. Glia 54:805-814.
Stilwell BL, Dow RM, Lamers C, Woods RT (2016) Language changes in bilingual individuals with Alzheimer's disease. International journal of language & communication disorders 51:113-127.
Stoiljkovic M, Kelley C, Nagy D, Hurst R, Hajos M (2016) Activation of alpha7 nicotinic acetylcholine receptors facilitates long-term potentiation at the hippocampal-prefrontal cortex synapses in vivo. Eur Neuropsychopharmacol 26:2018-2023.
Stokin GB, Lillo C, Falzone TL, Brusch RG, Rockenstein E, Mount SL, Raman R, Davies P, Masliah E, Williams DS, Goldstein LS (2005) Axonopathy and transport deficits early in the pathogenesis of Alzheimer's disease. Science 307:1282-1288.
Strange BA, Witter MP, Lein ES, Moser EI (2014) Functional organization of the hippocampal longitudinal axis. Nature reviews Neuroscience 15:655-669.
Stroud JC, Liu C, Teng PK, Eisenberg D (2012) Toxic fibrillar oligomers of amyloid-beta have cross-beta structure. Proceedings of the National Academy of Sciences of the United States of America 109:7717-7722.
Suemoto CK, Ferretti-Rebustini REL, Rodriguez RD, Leite REP, Soterio L, Brucki SMD, Spera RR, Cippiciani TM, Farfel JM, Chiavegatto Filho A, Naslavsky MS, Zatz M, Pasqualucci CA, Jacob-Filho W, Nitrini R, Grinberg LT (2017) Neuropathological diagnoses and clinical correlates in older adults in Brazil: A cross-sectional study. PLoS medicine 14:e1002267.
Suh J, Choi SH, Romano DM, Gannon MA, Lesinski AN, Kim DY, Tanzi RE (2013) ADAM10 missense mutations potentiate beta-amyloid accumulation by impairing prodomain chaperone function. Neuron 80:385-401.
Sun B, Halabisky B, Zhou Y, Palop JJ, Yu G, Mucke L, Gan L (2009) Imbalance between GABAergic and Glutamatergic Transmission Impairs Adult Neurogenesis in an Animal Model of Alzheimer's Disease. Cell stem cell 5:624-633.
Sun GJ, Zhou Y, Stadel RP, Moss J, Yong JHA, Ito S, Kawasaki NK, Phan AT, Oh JH, Modak N, Reed RR, Toni N, Song HJ, Ming GL (2015) Tangential migration of neuronal precursors of glutamatergic neurons in the adult mammalian brain. Proceedings of the National Academy of Sciences of the United States of America 112:9484-9489.
Swirski M, Miners JS, de Silva R, Lashley T, Ling H, Holton J, Revesz T, Love S (2014) Evaluating the relationship between amyloid-β and α-synuclein phosphorylated at Ser129 in dementia with Lewy bodies and Parkinson’s disease. Alzheimer's research & therapy 6:77.
Taguchi YV, Liu J, Ruan J, Pacheco J, Zhang X, Abbasi J, Keutzer J, Mistry PK, Chandra SS (2017) Glucosylsphingosine Promotes alpha-Synuclein Pathology in Mutant GBA-Associated Parkinson's Disease. The Journal of neuroscience : the official journal of the Society for Neuroscience 37:9617-9631.
Takács VT, Cserep C, Schlingloff D, Posfai B, Szonyi A, Sos KE, Kornyei Z, Denes A, Gulyas AI, Freund TF, Nyiri G (2018) Co-transmission of acetylcholine and GABA regulates hippocampal states. Nature communications 9:2848.
Takeda S, Wegmann S, Cho H, DeVos SL, Commins C, Roe AD, Nicholls SB, Carlson GA, Pitstick R, Nobuhara CK, Costantino I, Frosch MP, Muller DJ, Irimia D, Hyman BT (2015) Neuronal uptake and propagation of a rare phosphorylated high-molecular-weight tau derived from Alzheimer's disease brain. Nature communications 6:8490.
Takeda S, Commins C, DeVos SL, Nobuhara CK, Wegmann S, Roe AD, Costantino I, Fan Z, Nicholls SB, Sherman AE, Trisini Lipsanopoulos AT, Scherzer CR, Carlson GA, Pitstick R, Peskind ER, Raskind MA, Li G, Montine TJ, Frosch MP, Hyman BT (2016) Seed-competent high-molecular-weight tau species accumulates in the cerebrospinal fluid of Alzheimer's disease mouse model and human patients. Annals of neurology 80:355-367.
234 Takeuchi T, Duszkiewicz AJ, Sonneborn A, Spooner PA, Yamasaki M, Watanabe M, Smith CC,
Fernandez G, Deisseroth K, Greene RW, Morris RG (2016) Locus coeruleus and dopaminergic consolidation of everyday memory. Nature 537:357-362.
Talantova M et al. (2013) Abeta induces astrocytic glutamate release, extrasynaptic NMDA receptor activation, and synaptic loss. Proceedings of the National Academy of Sciences of the United States of America 110:E2518-2527.
Tanaka KF, Samuels BA, Hen R (2012) Serotonin receptor expression along the dorsal-ventral axis of mouse hippocampus. Philos Trans R Soc Lond B Biol Sci 367:2395-2401.
Tanzi RE (2012) The genetics of Alzheimer disease. Cold Spring Harb Perspect Med 2. Tanzi RE, Gusella JF, Watkins PC, Bruns GA, St George-Hyslop P, Van Keuren ML, Patterson D,
Pagan S, Kurnit DM, Neve RL (1987) Amyloid beta protein gene: cDNA, mRNA distribution, and genetic linkage near the Alzheimer locus. Science 235:880-884.
Tapia-Rojas C, Aranguiz F, Varela-Nallar L, Inestrosa NC (2016) Voluntary Running Attenuates Memory Loss, Decreases Neuropathological Changes and Induces Neurogenesis in a Mouse Model of Alzheimer's Disease. Brain pathology 26:62-74.
Tartt AN, Fulmore CA, Liu Y, Rosoklija GB, Dwork AJ, Arango V, Hen R, Mann JJ, Boldrini M (2018) Considerations for Assessing the Extent of Hippocampal Neurogenesis in the Adult and Aging Human Brain. Cell stem cell 23:782-783.
Taylor SR, Badurek S, Dileone RJ, Nashmi R, Minichiello L, Picciotto MR (2014) GABAergic and glutamatergic efferents of the mouse ventral tegmental area. The Journal of comparative neurology 522:3308-3334.
Teaktong T, Graham A, Court J, Perry R, Jaros E, Johnson M, Hall R, Perry E (2003) Alzheimer's disease is associated with a selective increase in alpha7 nicotinic acetylcholine receptor immunoreactivity in astrocytes. Glia 41:207-211.
Teaktong T, Graham AJ, Court JA, Perry RH, Jaros E, Johnson M, Hall R, Perry EK (2004) Nicotinic acetylcholine receptor immunohistochemistry in Alzheimer's disease and dementia with Lewy bodies: differential neuronal and astroglial pathology. Journal of the neurological sciences 225:39-49.
Teixeira CM, Rosen ZB, Suri D, Sun Q, Hersh M, Sargin D, Dincheva I, Morgan AA, Spivack S, Krok AC, Hirschfeld-Stoler T, Lambe EK, Siegelbaum SA, Ansorge MS (2018) Hippocampal 5-HT Input Regulates Memory Formation and Schaffer Collateral Excitation. Neuron.
Teles-Grilo Ruivo LM, Baker KL, Conway MW, Kinsley PJ, Gilmour G, Phillips KG, Isaac JTR, Lowry JP, Mellor JR (2017) Coordinated Acetylcholine Release in Prefrontal Cortex and Hippocampus Is Associated with Arousal and Reward on Distinct Timescales. Cell Rep 18:905-917.
Tensaouti Y, Stephanz EP, Yu TS, Kernie SG (2018) ApoE Regulates the Development of Adult Newborn Hippocampal Neurons. eNeuro 5.
Thal DR, Rub U, Orantes M, Braak H (2002) Phases of A beta-deposition in the human brain and its relevance for the development of AD. Neurology 58:1791-1800.
TheHumanBrain.info (2018a) Hi-Resolution Sections· Cells (Nissl Staining)· Virtual Microscopy. In: TheHumanBrain.info (Mai JK, ed) http://www.thehumanbrain.info/brain/sections/microslices/. Düsseldorf, Germany.
TheHumanBrain.info (2018b) 3D Reconstruction. In: TheHumanBrain.info (Mai JK, ed) http://www.thehumanbrain.info/brain/3d_reconstruction.php. Düsseldorf, Germany.
Theophilus BD, Latham T, Grabowski GA, Smith FI (1989) Comparison of RNase A, a chemical cleavage and GC-clamped denaturing gradient gel electrophoresis for the detection of mutations in exon 9 of the human acid beta-glucosidase gene. Nucleic acids research 17:7707-7722.
Tong LM, Djukic B, Arnold C, Gillespie AK, Yoon SY, Wang MM, Zhang O, Knoferle J, Rubenstein JL, Alvarez-Buylla A, Huang Y (2014) Inhibitory interneuron progenitor transplantation restores normal learning and memory in ApoE4 knock-in mice without or with Abeta accumulation. The Journal of neuroscience : the official journal of the Society for Neuroscience 34:9506-9515.
235 Trillo L, Das D, Hsieh W, Medina B, Moghadam S, Lin B, Dang V, Sanchez MM, De Miguel Z,
Ashford JW, Salehi A (2013) Ascending monoaminergic systems alterations in Alzheimer's disease. translating basic science into clinical care. Neurosci Biobehav Rev 37:1363-1379.
Trollor JN, Sachdev PS, Haindl W, Brodaty H, Wen W, Walker BM (2005) Regional cerebral blood flow deficits in mild Alzheimer's disease using high resolution single photon emission computerized tomography. Psychiatry Clin Neurosci 59:280-290.
Tsuang D et al. (2013) APOE epsilon4 increases risk for dementia in pure synucleinopathies. JAMA Neurol 70:223-228.
Tucek S (1985) Regulation of acetylcholine synthesis in the brain. Journal of neurochemistry 44:11-24.
Turrini P, Casu MA, Wong TP, De Koninck Y, Ribeiro-da-Silva A, Cuello AC (2001) Cholinergic nerve terminals establish classical synapses in the rat cerebral cortex: synaptic pattern and age-related atrophy. Neuroscience 105:277-285.
Uchikado H, Lin WL, DeLucia MW, Dickson DW (2006) Alzheimer disease with amygdala Lewy bodies: a distinct form of alpha-synucleinopathy. Journal of neuropathology and experimental neurology 65:685-697.
Ulland TK, Colonna M (2018) TREM2 - a key player in microglial biology and Alzheimer disease. Nature reviews Neurology.
Ulland TK, Song WM, Huang SC, Ulrich JD, Sergushichev A, Beatty WL, Loboda AA, Zhou Y, Cairns NJ, Kambal A, Loginicheva E, Gilfillan S, Cella M, Virgin HW, Unanue ER, Wang Y, Artyomov MN, Holtzman DM, Colonna M (2017) TREM2 Maintains Microglial Metabolic Fitness in Alzheimer's Disease. Cell 170:649-663.e613.
Umbriaco D, Garcia S, Beaulieu C, Descarries L (1995) Relational features of acetylcholine, noradrenaline, serotonin and GABA axon terminals in the stratum radiatum of adult rat hippocampus (CA1). Hippocampus 5:605-620.
Umbriaco D, Watkins KC, Descarries L, Cozzari C, Hartman BK (1994) Ultrastructural and morphometric features of the acetylcholine innervation in adult rat parietal cortex: an electron microscopic study in serial sections. The Journal of comparative neurology 348:351-373.
van der Cammen TJ, Tiemeier H, Engelhart MJ, Fekkes D (2006) Abnormal neurotransmitter metabolite levels in Alzheimer patients with a delirium. International journal of geriatric psychiatry 21:838-843.
Van der Zee EA, Keijser JN (2011) Localization of pre- and postsynaptic cholinergic markers in rodent forebrain: a brief history and comparison of rat and mouse. Behav Brain Res 221:356-366.
van Eersel J, Ke YD, Liu X, Delerue F, Kril JJ, Gotz J, Ittner LM (2010) Sodium selenate mitigates tau pathology, neurodegeneration, and functional deficits in Alzheimer's disease models. Proceedings of the National Academy of Sciences of the United States of America 107:13888-13893.
van Praag H, Kempermann G, Gage FH (1999a) Running increases cell proliferation and neurogenesis in the adult mouse dentate gyrus. Nature neuroscience 2:266-270.
van Praag H, Christie BR, Sejnowski TJ, Gage FH (1999b) Running enhances neurogenesis, learning, and long-term potentiation in mice. Proceedings of the National Academy of Sciences of the United States of America 96:13427-13431.
van Praag H, Shubert T, Zhao C, Gage FH (2005) Exercise enhances learning and hippocampal neurogenesis in aged mice. The Journal of neuroscience : the official journal of the Society for Neuroscience 25:8680-8685.
Vandecasteele M, Varga V, Berenyi A, Papp E, Bartho P, Venance L, Freund TF, Buzsaki G (2014) Optogenetic activation of septal cholinergic neurons suppresses sharp wave ripples and enhances theta oscillations in the hippocampus. Proceedings of the National Academy of Sciences of the United States of America 111:13535-13540.
236 Vandenberghe R, Riviere ME, Caputo A, Sovago J, Maguire RP, Farlow M, Marotta G, Sanchez-
Valle R, Scheltens P, Ryan JM, Graf A (2017) Active Abeta immunotherapy CAD106 in Alzheimer's disease: A phase 2b study. Alzheimer's & dementia (New York, N Y) 3:10-22.
Vanevski F, Xu B (2015) HuD interacts with Bdnf mRNA and is essential for activity-induced BDNF synthesis in dendrites. PloS one 10:e0117264.
Verdaguer E, Brox S, Petrov D, Olloquequi J, Romero R, de Lemos ML, Camins A, Auladell C (2015) Vulnerability of calbindin, calretinin and parvalbumin in a transgenic/knock-in APPswe/PS1dE9 mouse model of Alzheimer disease together with disruption of hippocampal neurogenesis. Experimental gerontology 69:176-188.
Vermeiren Y, Van Dam D, Aerts T, Engelborghs S, De Deyn PP (2014) Monoaminergic neurotransmitter alterations in postmortem brain regions of depressed and aggressive patients with Alzheimer's disease. Neurobiology of aging 35:2691-2700.
Verret L, Jankowsky JL, Xu GM, Borchelt DR, Rampon C (2007) Alzheimer's-type amyloidosis in transgenic mice impairs survival of newborn neurons derived from adult hippocampal neurogenesis. The Journal of neuroscience : the official journal of the Society for Neuroscience 27:6771-6780.
Vertes RP, Fortin WJ, Crane AM (1999) Projections of the median raphe nucleus in the rat. The Journal of comparative neurology 407:555-582.
Verwer RWH, Sluiter AA, Balesar RA, Baayen JC, Noske DP, Dirven CMF, Wouda J, Van Dam AM, Lucassen PJ, Swaab DF (2007) Mature astrocytes in the adult human neocortex express the early neuronal marker doublecortin. Brain : a journal of neurology 130:3321-3335.
Villar-Pique A, da Fonseca TL, Sant'Anna R, Szego EM, Fonseca-Ornelas L, Pinho R, Carija A, Gerhardt E, Masaracchia C, Gonzalez EA, Rossetti G, Carloni P, Fernandez CO, Foguel D, Milosevic I, Zweckstetter M, Ventura S, Outeiro TF (2016) Environmental and genetic factors support the dissociation between alpha-synuclein aggregation and toxicity. Proceedings of the National Academy of Sciences of the United States of America 113:E6506-E6515.
Villemagne VL, Okamura N, Pejoska S, Drago J, Mulligan RS, Chetelat G, O'Keefe G, Jones G, Kung HF, Pontecorvo M, Masters CL, Skovronsky DM, Rowe CC (2012) Differential diagnosis in Alzheimer's disease and dementia with Lewy bodies via VMAT2 and amyloid imaging. Neurodegener Dis 10:161-165.
Villemagne VL, Ong K, Mulligan RS, Holl G, Pejoska S, Jones G, O'Keefe G, Ackerman U, Tochon-Danguy H, Chan JG, Reininger CB, Fels L, Putz B, Rohde B, Masters CL, Rowe CC (2011a) Amyloid imaging with (18)F-florbetaben in Alzheimer disease and other dementias. J Nucl Med 52:1210-1217.
Villemagne VL, Pike KE, Chetelat G, Ellis KA, Mulligan RS, Bourgeat P, Ackermann U, Jones G, Szoeke C, Salvado O, Martins R, O'Keefe G, Mathis CA, Klunk WE, Ames D, Masters CL, Rowe CC (2011b) Longitudinal assessment of Abeta and cognition in aging and Alzheimer disease. Annals of neurology 69:181-192.
Vincent SR (1988) Distributions of tyrosine hydroxylase-, dopamine-beta-hydroxylase-, and phenylethanolamine-N-methyltransferase-immunoreactive neurons in the brain of the hamster (Mesocricetus auratus). The Journal of comparative neurology 268:584-599.
Viney TJ, Lasztoczi B, Katona L, Crump MG, Tukker JJ, Klausberger T, Somogyi P (2013) Network state-dependent inhibition of identified hippocampal CA3 axo-axonic cells in vivo. Nature neuroscience 16:1802-1811.
Vivar C, Potter MC, Choi J, Lee JY, Stringer TP, Callaway EM, Gage FH, Suh H, van Praag H (2012) Monosynaptic inputs to new neurons in the dentate gyrus. Nature communications 3:1107.
Vukoja A, Rey U, Petzoldt AG, Ott C, Vollweiter D, Quentin C, Puchkov D, Reynolds E, Lehmann M, Hohensee S, Rosa S, Lipowsky R, Sigrist SJ, Haucke V (2018) Presynaptic Biogenesis Requires Axonal Transport of Lysosome-Related Vesicles. Neuron 99:1216-1232.e1217.
237 Walker RW, Walker Z (2009) Dopamine transporter single photon emission computerized
tomography in the diagnosis of dementia with Lewy bodies. Mov Disord 24 Suppl 2:S754-759.
Walker Z, Jaros E, Walker RW, Lee L, Costa DC, Livingston G, Ince PG, Perry R, McKeith I, Katona CL (2007) Dementia with Lewy bodies: a comparison of clinical diagnosis, FP-CIT single photon emission computed tomography imaging and autopsy. Journal of neurology, neurosurgery, and psychiatry 78:1176-1181.
Wang B, Yang L, Wang Z, Zheng H (2007) Amyolid precursor protein mediates presynaptic localization and activity of the high-affinity choline transporter. Proceedings of the National Academy of Sciences of the United States of America 104:14140-14145.
Wang B, Wang Z, Sun L, Yang L, Li H, Cole AL, Rodriguez-Rivera J, Lu HC, Zheng H (2014a) The amyloid precursor protein controls adult hippocampal neurogenesis through GABAergic interneurons. The Journal of neuroscience : the official journal of the Society for Neuroscience 34:13314-13325.
Wang C, Najm R, Xu Q, Jeong DE, Walker D, Balestra ME, Yoon SY, Yuan H, Li G, Miller ZA, Miller BL, Malloy MJ, Huang Y (2018) Gain of toxic apolipoprotein E4 effects in human iPSC-derived neurons is ameliorated by a small-molecule structure corrector. Nature medicine.
Wang CM, You Y, Qi DS, Zhou X, Wang L, Wei S, Zhang ZZ, Huang WX, Liu ZD, Liu F, Ma L, Yang ZG (2014b) Human and Monkey Striatal Interneurons Are Derived from the Medial Ganglionic Eminence But Not from the Adult Subventricular Zone. Journal of Neuroscience 34:10906-10923.
Wang S, Bolos M, Clark R, Cullen CL, Southam KA, Foa L, Dickson TC, Young KM (2016) Amyloid beta precursor protein regulates neuron survival and maturation in the adult mouse brain. Molecular and cellular neurosciences 77:21-33.
Wang T, Huang Q, Reiman EM, Chen K, Li X, Li G, Lin Z, Li C, Xiao S (2013) Effects of memantine on clinical ratings, fluorodeoxyglucose positron emission tomography measurements, and cerebrospinal fluid assays in patients with moderate to severe Alzheimer dementia: a 24-week, randomized, clinical trial. Journal of clinical psychopharmacology 33:636-642.
Watkins PB, Zimmerman HJ, Knapp MJ, Gracon SI, Lewis KW (1994) Hepatotoxic effects of tacrine administration in patients with Alzheimer's disease. Jama 271:992-998.
Wegmann S, Eftekharzadeh B, Tepper K, Zoltowska KM, Bennett RE, Dujardin S, Laskowski PR, MacKenzie D, Kamath T, Commins C, Vanderburg C, Roe AD, Fan Z, Molliex AM, Hernandez-Vega A, Muller D, Hyman AA, Mandelkow E, Taylor JP, Hyman BT (2018) Tau protein liquid-liquid phase separation can initiate tau aggregation. The EMBO journal 37.
Weinstock M, Razin M, Chorev M, Enz A (1994) Pharmacological evaluation of phenyl-carbamates as CNS-selective acetylcholinesterase inhibitors. Journal of neural transmission Supplementum 43:219-225.
Weisz VI, Argibay PF (2012) Neurogenesis interferes with the retrieval of remote memories: forgetting in neurocomputational terms. Cognition 125:13-25.
Wennberg AM, Whitwell JL, Tosakulwong N, Weigand SD, Murray ME, Machulda MM, Petrucelli L, Mielke MM, Jack CR, Jr., Knopman DS, Parisi JE, Petersen RC, Dickson DW, Josephs KA (2019) The influence of tau, amyloid, alpha-synuclein, TDP-43, and vascular pathology in clinically normal elderly individuals. Neurobiology of aging 77:26-36.
WHO (2018) ICD-11 for Mortality and Morbidity Statistics. Dementia criteria. In: https://icd.who.int/browse11/l-m/en#/http%3a%2f%2fid.who.int%2ficd%2fentity%2f546689346.
Wilson CL, Isokawa M, Babb TL, Crandall PH (1990) Functional connections in the human temporal lobe. I. Analysis of limbic system pathways using neuronal responses evoked by electrical stimulation. Exp Brain Res 82:279-292.
238 Wirths O (2017) Altered neurogenesis in mouse models of Alzheimer disease. Neurogenesis
(Austin, Tex) 4:e1327002. Wisniewski T, Drummond E (2016) Developing therapeutic vaccines against Alzheimer's disease.
Expert review of vaccines 15:401-415. Wisniowski L, Ridley RM, Baker HF, Fine A (1992) Tyrosine hydroxylase-immunoreactive neurons
in the nucleus basalis of the common marmoset (Callithrix jacchus). The Journal of comparative neurology 325:379-387.
Wittner L, Henze DA, Zaborszky L, Buzsaki G (2007) Three-dimensional reconstruction of the axon arbor of a CA3 pyramidal cell recorded and filled in vivo. Brain Struct Funct 212:75-83.
Wortmann M (2012) Dementia: a global health priority - highlights from an ADI and World Health Organization report. Alzheimer's research & therapy 4:40.
Wu CC, Lien CC, Hou WH, Chiang PM, Tsai KJ (2016) Gain of BDNF Function in Engrafted Neural Stem Cells Promotes the Therapeutic Potential for Alzheimer's Disease. Scientific reports 6:27358.
Wu H, Williams J, Nathans J (2014a) Complete morphologies of basal forebrain cholinergic neurons in the mouse. eLife 3:e02444.
Wu M, Dumalska I, Morozova E, van den Pol AN, Alreja M (2009) Gonadotropin inhibitory hormone inhibits basal forebrain vGluT2-gonadotropin-releasing hormone neurons via a direct postsynaptic mechanism. J Physiol 587:1401-1411.
Wu Z, Guo Z, Gearing M, Chen G (2014b) Tonic inhibition in dentate gyrus impairs long-term potentiation and memory in an Alzhiemer's disease model. Nature communications 5:4159.
Xiao Y, Ma B, McElheny D, Parthasarathy S, Long F, Hoshi M, Nussinov R, Ishii Y (2015) Abeta(1-42) fibril structure illuminates self-recognition and replication of amyloid in Alzheimer's disease. Nature structural & molecular biology 22:499-505.
Xu M, Chung S, Zhang S, Zhong P, Ma C, Chang WC, Weissbourd B, Sakai N, Luo L, Nishino S, Dan Y (2015) Basal forebrain circuit for sleep-wake control. Nature neuroscience 18:1641-1647.
Xu YH, Quinn B, Witte D, Grabowski GA (2003) Viable mouse models of acid beta-glucosidase deficiency: the defect in Gaucher disease. The American journal of pathology 163:2093-2101.
Yamasaki N et al. (2008) Alpha-CaMKII deficiency causes immature dentate gyrus, a novel candidate endophenotype of psychiatric disorders. Mol Brain 1:6.
Yan H, Pang P, Chen W, Zhu H, Henok KA, Li H, Wu Z, Ke X, Wu J, Zhang T, Pan K, Pei L, Han Y, Lu Y (2018) The Lesion Analysis of Cholinergic Neurons in 5XFAD Mouse Model in the Three-Dimensional Level of Whole Brain. Molecular neurobiology 55:4115-4125.
Yang C, Thankachan S, McCarley RW, Brown RE (2017) The menagerie of the basal forebrain: how many (neural) species are there, what do they look like, how do they behave and who talks to whom? Curr Opin Neurobiol 44:159-166.
Yang H-S, Yu L, White CC, Chibnik LB, Chhatwal JP, Sperling RA, Bennett DA, Schneider JA, De Jager PL (2018) Evaluation of TDP-43 proteinopathy and hippocampal sclerosis in relation to APOE ε4 haplotype status: a community-based cohort study. The Lancet Neurology 17:773-781.
Yarnall AJ, Rochester L, Baker MR, David R, Khoo TK, Duncan GW, Galna B, Burn DJ (2013) Short latency afferent inhibition: a biomarker for mild cognitive impairment in Parkinson's disease? Mov Disord 28:1285-1288.
Yassa MA, Stark SM, Bakker A, Albert MS, Gallagher M, Stark CE (2010) High-resolution structural and functional MRI of hippocampal CA3 and dentate gyrus in patients with amnestic Mild Cognitive Impairment. Neuroimage 51:1242-1252.
Yeo JM, Waddell B, Khan Z, Pal S (2015) A systematic review and meta-analysis of (18)F-labeled amyloid imaging in Alzheimer's disease. Alzheimers Dement (Amst) 1:5-13.
239 Yetman MJ, Jankowsky JL (2013) Wild-type neural progenitors divide and differentiate normally
in an amyloid-rich environment. The Journal of neuroscience : the official journal of the Society for Neuroscience 33:17335-17341.
Yin L, Xie YY, Yin SY, Lv XL, Zhang J, Gu ZZ, Sun HD, Liu SQ (2015) The S-Nitrosylation Status of PCNA Localized in Cytosol Impacts the Apoptotic Pathway in a Parkinson's Disease Paradigm. PloS one 10.
Yu Y, He J, Zhang Y, Luo H, Zhu S, Yang Y, Zhao T, Wu J, Huang Y, Kong J, Tan Q, Li XM (2009) Increased hippocampal neurogenesis in the progressive stage of Alzheimer's disease phenotype in an APP/PS1 double transgenic mouse model. Hippocampus 19:1247-1253.
Yuan M, Meyer T, Benkowitz C, Savanthrapadian S, Ansel-Bollepalli L, Foggetti A, Wulff P, Alcami P, Elgueta C, Bartos M (2017) Somatostatin-positive interneurons in the dentate gyrus of mice provide local- and long-range septal synaptic inhibition. eLife 6.
Yun S, Reynolds RP, Masiulis I, Eisch AJ (2016) Re-evaluating the link between neuropsychiatric disorders and dysregulated adult neurogenesis. Nature medicine 22:1239-1247.
Zaborszky L, van den Pol A, Gyengesi E (2012) The Basal Forebrain Cholinergic Projection System in Mice. In: The Mouse Nervous System, pp 684-718.
Zaborszky L, Hoemke L, Mohlberg H, Schleicher A, Amunts K, Zilles K (2008) Stereotaxic probabilistic maps of the magnocellular cell groups in human basal forebrain. Neuroimage 42:1127-1141.
Zaletel I, Schwirtlich M, Perovic M, Jovanovic M, Stevanovic M, Kanazir S, Puskas N (2018) Early Impairments of Hippocampal Neurogenesis in 5xFAD Mouse Model of Alzheimer's Disease Are Associated with Altered Expression of SOXB Transcription Factors. Journal of Alzheimer's disease : JAD 65:963-976.
Zant JC, Kim T, Prokai L, Szarka S, McNally J, McKenna JT, Shukla C, Yang C, Kalinchuk AV, McCarley RW, Brown RE, Basheer R (2016) Cholinergic Neurons in the Basal Forebrain Promote Wakefulness by Actions on Neighboring Non-Cholinergic Neurons: An Opto-Dialysis Study. The Journal of neuroscience : the official journal of the Society for Neuroscience 36:2057-2067.
Zarow C, Lyness SA, Mortimer JA, Chui HC (2003) Neuronal loss is greater in the locus coeruleus than nucleus basalis and substantia nigra in Alzheimer and Parkinson diseases. Archives of neurology 60:337-341.
Zhang K, Chen C, Yang Z, He W, Liao X, Ma Q, Deng P, Lu J, Li J, Wang M, Li M, Zheng L, Zhou Z, Sun W, Wang L, Jia H, Yu Z, Zhou Z, Chen X (2016) Sensory Response of Transplanted Astrocytes in Adult Mammalian Cortex In Vivo. Cerebral cortex (New York, NY : 1991) 26:3690-3704.
Zhao S, Ting JT, Atallah HE, Qiu L, Tan J, Gloss B, Augustine GJ, Deisseroth K, Luo M, Graybiel AM, Feng G (2011) Cell type-specific channelrhodopsin-2 transgenic mice for optogenetic dissection of neural circuitry function. Nat Methods 8:745-752.
Zhao W, Wang X, Yin C, He M, Li S, Han Y (2019) Trajectories of the Hippocampal Subfields Atrophy in the Alzheimer's Disease: A Structural Imaging Study. Front Neuroinform 13:13.
Zhen J, Qian Y, Fu J, Su R, An H, Wang W, Zheng Y, Wang X (2017) Deep Brain Magnetic Stimulation Promotes Neurogenesis and Restores Cholinergic Activity in a Transgenic Mouse Model of Alzheimer's Disease. Frontiers in neural circuits 11:48.
Zheng M, Liu J, Ruan Z, Tian S, Ma Y, Zhu J, Li G (2013) Intrahippocampal injection of Abeta1-42 inhibits neurogenesis and down-regulates IFN-gamma and NF-kappaB expression in hippocampus of adult mouse brain. Amyloid 20:13-20.
Zhou QG, Lee D, Ro EJ, Suh H (2016) Regional-specific effect of fluoxetine on rapidly dividing progenitors along the dorsoventral axis of the hippocampus. Scientific reports 6:35572.
Zhou R, Yang G, Shi Y (2017) Dominant negative effect of the loss-of-function gamma-secretase mutants on the wild-type enzyme through heterooligomerization. Proceedings of the National Academy of Sciences of the United States of America 114:12731-12736.
240 Zhu B, Zhao L, Luo D, Xu D, Tan T, Dong Z, Tang Y, Min Z, Deng X, Sun F, Yan Z, Chen G (2018a)
Furin promotes dendritic morphogenesis and learning and memory in transgenic mice. Cellular and molecular life sciences : CMLS.
Zhu H, Yan H, Tang N, Li X, Pang P, Li H, Chen W, Guo Y, Shu S, Cai Y, Pei L, Liu D, Luo MH, Man H, Tian Q, Mu Y, Zhu LQ, Lu Y (2017) Impairments of spatial memory in an Alzheimer's disease model via degeneration of hippocampal cholinergic synapses. Nature communications 8:1676.
Zhu K, Peters F, Filser S, Herms J (2018b) Consequences of Pharmacological BACE Inhibition on Synaptic Structure and Function. Biological psychiatry 84:478-487.
Ziabreva I, Ballard C, Johnson M, Larsen JP, McKeith I, Perry R, Aarsland D, Perry E (2007) Loss of Musashi1 in Lewy body dementia associated with cholinergic deficit. Neuropathology and applied neurobiology 33:586-590.
Zimmer ER, Parent MJ, Souza DG, Leuzy A, Lecrux C, Kim HI, Gauthier S, Pellerin L, Hamel E, Rosa-Neto P (2017) [(18)F]FDG PET signal is driven by astroglial glutamate transport. Nature neuroscience 20:393-395.
Zuccaro E, Bergami M, Vignoli B, Bony G, Pierchala BA, Santi S, Cancedda L, Canossa M (2014) Polarized expression of p75(NTR) specifies axons during development and adult neurogenesis. Cell Rep 7:138-152.
Zunke F, Moise AC, Belur NR, Gelyana E, Stojkovska I, Dzaferbegovic H, Toker NJ, Jeon S, Fredriksen K, Mazzulli JR (2017) Reversible Conformational Conversion of alpha-Synuclein into Toxic Assemblies by Glucosylceramide. Neuron.
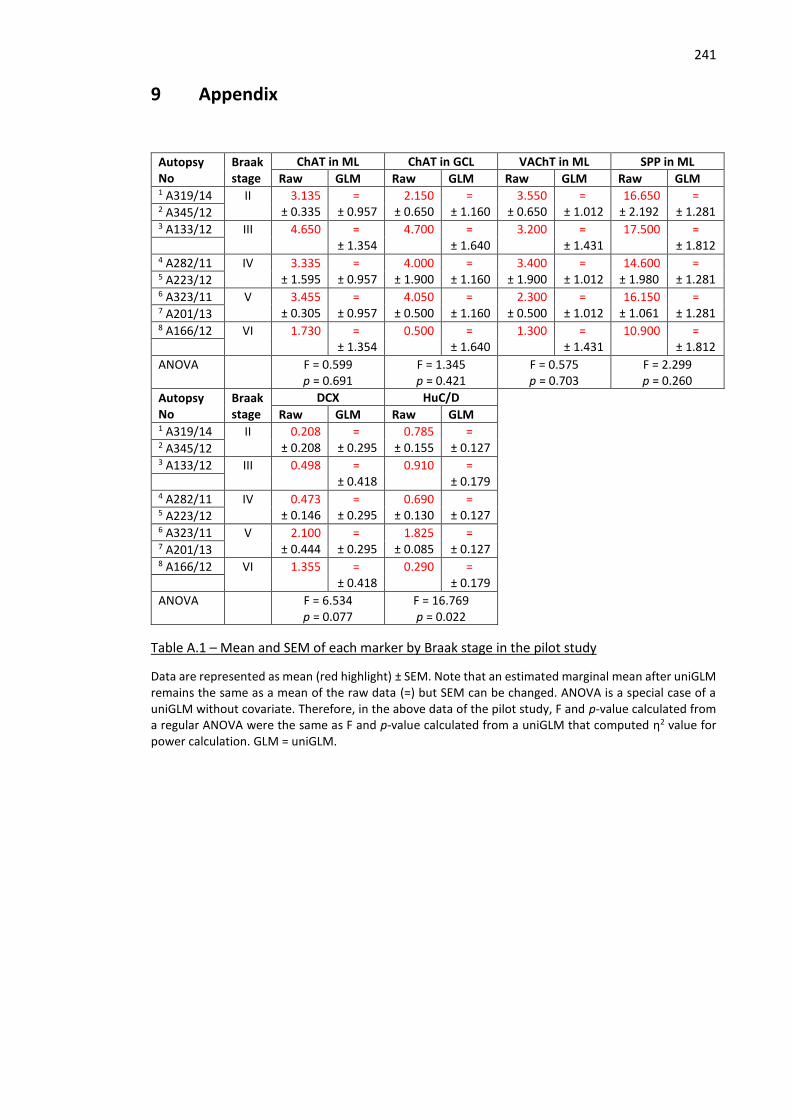
241
9 Appendix
Autopsy No
Braak stage
ChAT in ML ChAT in GCL VAChT in ML SPP in ML
Raw GLM Raw GLM Raw GLM Raw GLM 1 A319/14 II 3.135
± 0.335 =
± 0.957 2.150
± 0.650 =
± 1.160 3.550
± 0.650 =
± 1.012 16.650
± 2.192 =
± 1.281 2 A345/12 3 A133/12 III 4.650
=
± 1.354 4.700
=
± 1.640 3.200
=
± 1.431 17.500
=
± 1.812
4 A282/11 IV 3.335 ± 1.595
= ± 0.957
4.000 ± 1.900
= ± 1.160
3.400 ± 1.900
= ± 1.012
14.600 ± 1.980
= ± 1.281 5 A223/12
6 A323/11 V 3.455 ± 0.305
= ± 0.957
4.050 ± 0.500
= ± 1.160
2.300 ± 0.500
= ± 1.012
16.150 ± 1.061
= ± 1.281 7 A201/13
8 A166/12 VI 1.730
= ± 1.354
0.500
= ± 1.640
1.300
= ± 1.431
10.900
= ± 1.812
ANOVA F = 0.599 p = 0.691
F = 1.345 p = 0.421
F = 0.575 p = 0.703
F = 2.299 p = 0.260
Autopsy No
Braak stage
DCX HuC/D
Raw GLM Raw GLM 1 A319/14 II 0.208
± 0.208 =
± 0.295 0.785
± 0.155 =
± 0.127 2 A345/12 3 A133/12 III 0.498
=
± 0.418 0.910
=
± 0.179
4 A282/11 IV 0.473 ± 0.146
= ± 0.295
0.690 ± 0.130
= ± 0.127 5 A223/12
6 A323/11 V 2.100 ± 0.444
= ± 0.295
1.825 ± 0.085
= ± 0.127 7 A201/13
8 A166/12 VI 1.355
= ± 0.418
0.290
= ± 0.179
ANOVA F = 6.534 p = 0.077
F = 16.769 p = 0.022
Table A.1 – Mean and SEM of each marker by Braak stage in the pilot study
Data are represented as mean (red highlight) ± SEM. Note that an estimated marginal mean after uniGLM remains the same as a mean of the raw data (=) but SEM can be changed. ANOVA is a special case of a uniGLM without covariate. Therefore, in the above data of the pilot study, F and p-value calculated from a regular ANOVA were the same as F and p-value calculated from a uniGLM that computed η2 value for power calculation. GLM = uniGLM.
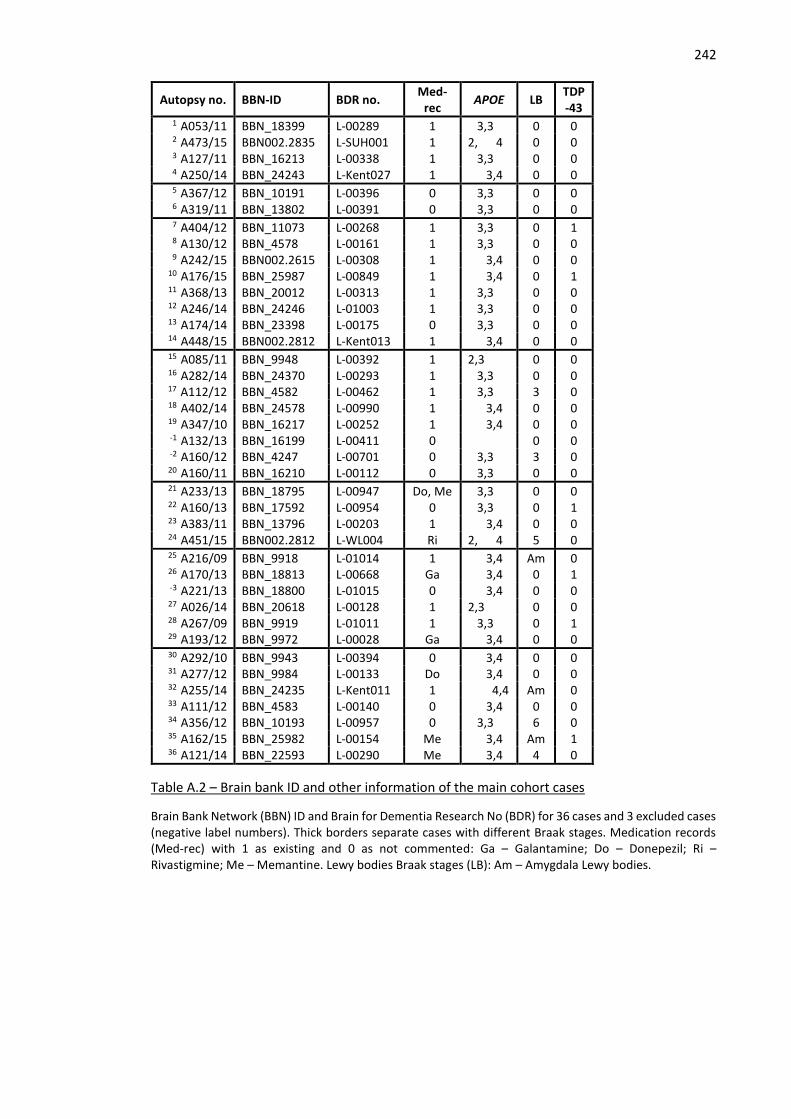
242
Autopsy no. BBN-ID BDR no. Med-
rec APOE LB
TDP-43
1 A053/11 BBN_18399 L-00289 1 3,3 0 0 2 A473/15 BBN002.2835 L-SUH001 1 2, 4 0 0 3 A127/11 BBN_16213 L-00338 1 3,3 0 0 4 A250/14 BBN_24243 L-Kent027 1 3,4 0 0 5 A367/12 BBN_10191 L-00396 0 3,3 0 0 6 A319/11 BBN_13802 L-00391 0 3,3 0 0 7 A404/12 BBN_11073 L-00268 1 3,3 0 1 8 A130/12 BBN_4578 L-00161 1 3,3 0 0 9 A242/15 BBN002.2615 L-00308 1 3,4 0 0
10 A176/15 BBN_25987 L-00849 1 3,4 0 1 11 A368/13 BBN_20012 L-00313 1 3,3 0 0 12 A246/14 BBN_24246 L-01003 1 3,3 0 0 13 A174/14 BBN_23398 L-00175 0 3,3 0 0 14 A448/15 BBN002.2812 L-Kent013 1 3,4 0 0 15 A085/11 BBN_9948 L-00392 1 2,3 0 0 16 A282/14 BBN_24370 L-00293 1 3,3 0 0
17 A112/12 BBN_4582 L-00462 1 3,3 3 0 18 A402/14 BBN_24578 L-00990 1 3,4 0 0 19 A347/10 BBN_16217 L-00252 1 3,4 0 0 -1 A132/13 BBN_16199 L-00411 0 0 0 -2 A160/12 BBN_4247 L-00701 0 3,3 3 0 20 A160/11 BBN_16210 L-00112 0 3,3 0 0 21 A233/13 BBN_18795 L-00947 Do, Me 3,3 0 0 22 A160/13 BBN_17592 L-00954 0 3,3 0 1 23 A383/11 BBN_13796 L-00203 1 3,4 0 0 24 A451/15 BBN002.2812 L-WL004 Ri 2, 4 5 0 25 A216/09 BBN_9918 L-01014 1 3,4 Am 0 26 A170/13 BBN_18813 L-00668 Ga 3,4 0 1 -3 A221/13 BBN_18800 L-01015 0 3,4 0 0 27 A026/14 BBN_20618 L-00128 1 2,3 0 0 28 A267/09 BBN_9919 L-01011 1 3,3 0 1 29 A193/12 BBN_9972 L-00028 Ga 3,4 0 0 30 A292/10 BBN_9943 L-00394 0 3,4 0 0 31 A277/12 BBN_9984 L-00133 Do 3,4 0 0 32 A255/14 BBN_24235 L-Kent011 1 4,4 Am 0 33 A111/12 BBN_4583 L-00140 0 3,4 0 0 34 A356/12 BBN_10193 L-00957 0 3,3 6 0 35 A162/15 BBN_25982 L-00154 Me 3,4 Am 1 36 A121/14 BBN_22593 L-00290 Me 3,4 4 0
Table A.2 – Brain bank ID and other information of the main cohort cases
Brain Bank Network (BBN) ID and Brain for Dementia Research No (BDR) for 36 cases and 3 excluded cases (negative label numbers). Thick borders separate cases with different Braak stages. Medication records (Med-rec) with 1 as existing and 0 as not commented: Ga – Galantamine; Do – Donepezil; Ri – Rivastigmine; Me – Memantine. Lewy bodies Braak stages (LB): Am – Amygdala Lewy bodies.
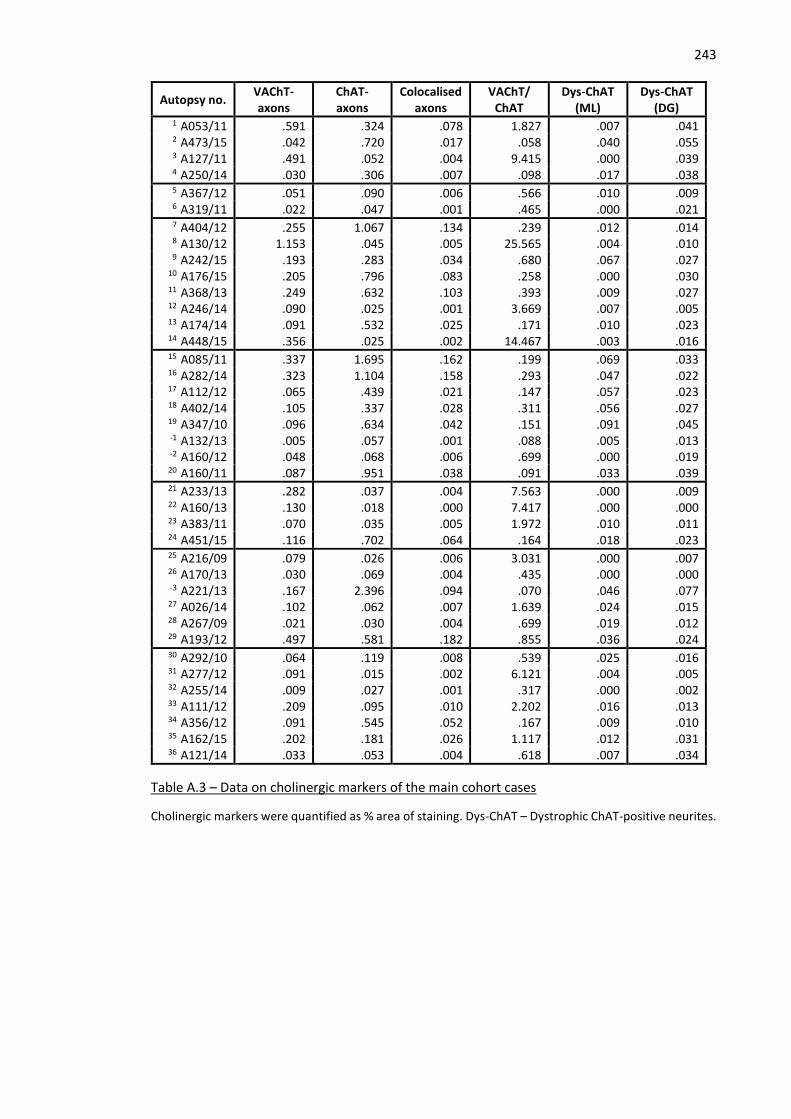
243
Autopsy no. VAChT-axons
ChAT- axons
Colocalised axons
VAChT/ ChAT
Dys-ChAT (ML)
Dys-ChAT (DG)
1 A053/11 .591 .324 .078 1.827 .007 .041 2 A473/15 .042 .720 .017 .058 .040 .055 3 A127/11 .491 .052 .004 9.415 .000 .039 4 A250/14 .030 .306 .007 .098 .017 .038 5 A367/12 .051 .090 .006 .566 .010 .009 6 A319/11 .022 .047 .001 .465 .000 .021 7 A404/12 .255 1.067 .134 .239 .012 .014 8 A130/12 1.153 .045 .005 25.565 .004 .010 9 A242/15 .193 .283 .034 .680 .067 .027
10 A176/15 .205 .796 .083 .258 .000 .030 11 A368/13 .249 .632 .103 .393 .009 .027 12 A246/14 .090 .025 .001 3.669 .007 .005 13 A174/14 .091 .532 .025 .171 .010 .023 14 A448/15 .356 .025 .002 14.467 .003 .016 15 A085/11 .337 1.695 .162 .199 .069 .033 16 A282/14 .323 1.104 .158 .293 .047 .022
17 A112/12 .065 .439 .021 .147 .057 .023 18 A402/14 .105 .337 .028 .311 .056 .027 19 A347/10 .096 .634 .042 .151 .091 .045 -1 A132/13 .005 .057 .001 .088 .005 .013 -2 A160/12 .048 .068 .006 .699 .000 .019 20 A160/11 .087 .951 .038 .091 .033 .039 21 A233/13 .282 .037 .004 7.563 .000 .009 22 A160/13 .130 .018 .000 7.417 .000 .000 23 A383/11 .070 .035 .005 1.972 .010 .011 24 A451/15 .116 .702 .064 .164 .018 .023 25 A216/09 .079 .026 .006 3.031 .000 .007 26 A170/13 .030 .069 .004 .435 .000 .000 -3 A221/13 .167 2.396 .094 .070 .046 .077 27 A026/14 .102 .062 .007 1.639 .024 .015 28 A267/09 .021 .030 .004 .699 .019 .012 29 A193/12 .497 .581 .182 .855 .036 .024 30 A292/10 .064 .119 .008 .539 .025 .016 31 A277/12 .091 .015 .002 6.121 .004 .005 32 A255/14 .009 .027 .001 .317 .000 .002 33 A111/12 .209 .095 .010 2.202 .016 .013 34 A356/12 .091 .545 .052 .167 .009 .010 35 A162/15 .202 .181 .026 1.117 .012 .031 36 A121/14 .033 .053 .004 .618 .007 .034
Table A.3 – Data on cholinergic markers of the main cohort cases
Cholinergic markers were quantified as % area of staining. Dys-ChAT – Dystrophic ChAT-positive neurites.
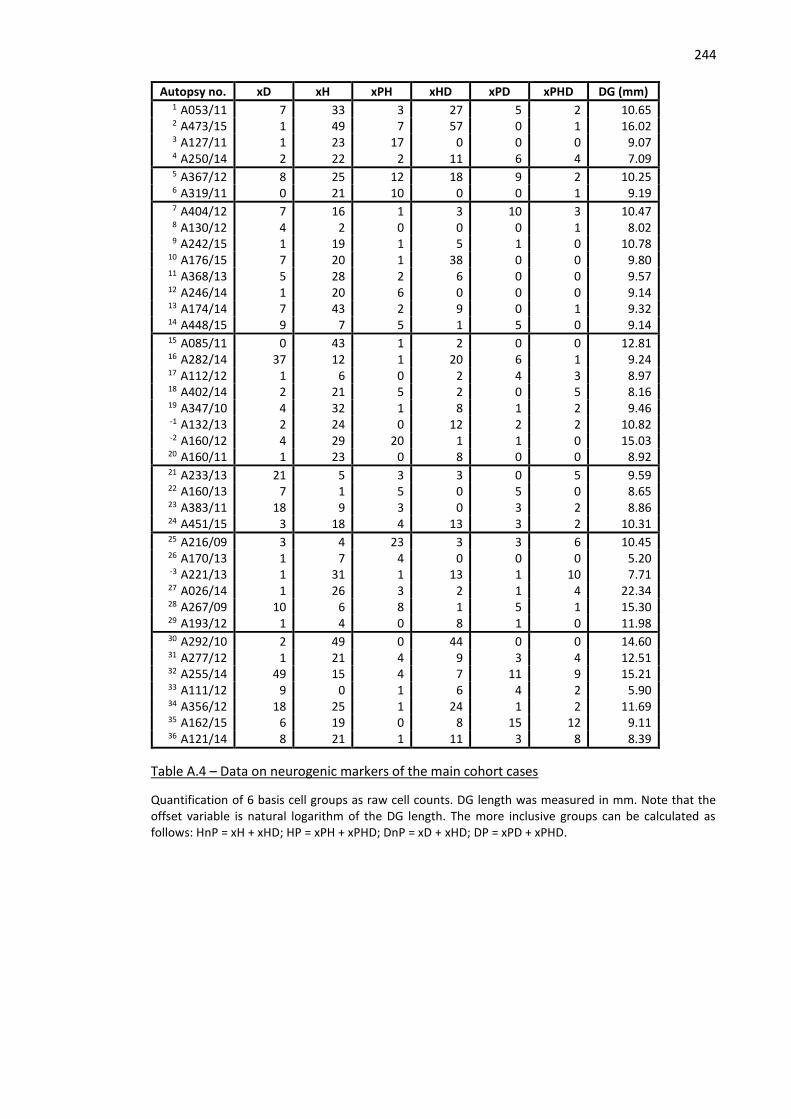
244
Autopsy no. xD xH xPH xHD xPD xPHD DG (mm) 1 A053/11 7 33 3 27 5 2 10.65 2 A473/15 1 49 7 57 0 1 16.02 3 A127/11 1 23 17 0 0 0 9.07 4 A250/14 2 22 2 11 6 4 7.09 5 A367/12 8 25 12 18 9 2 10.25 6 A319/11 0 21 10 0 0 1 9.19 7 A404/12 7 16 1 3 10 3 10.47 8 A130/12 4 2 0 0 0 1 8.02 9 A242/15 1 19 1 5 1 0 10.78
10 A176/15 7 20 1 38 0 0 9.80 11 A368/13 5 28 2 6 0 0 9.57 12 A246/14 1 20 6 0 0 0 9.14 13 A174/14 7 43 2 9 0 1 9.32 14 A448/15 9 7 5 1 5 0 9.14 15 A085/11 0 43 1 2 0 0 12.81 16 A282/14 37 12 1 20 6 1 9.24
17 A112/12 1 6 0 2 4 3 8.97 18 A402/14 2 21 5 2 0 5 8.16 19 A347/10 4 32 1 8 1 2 9.46 -1 A132/13 2 24 0 12 2 2 10.82 -2 A160/12 4 29 20 1 1 0 15.03 20 A160/11 1 23 0 8 0 0 8.92 21 A233/13 21 5 3 3 0 5 9.59 22 A160/13 7 1 5 0 5 0 8.65 23 A383/11 18 9 3 0 3 2 8.86 24 A451/15 3 18 4 13 3 2 10.31 25 A216/09 3 4 23 3 3 6 10.45 26 A170/13 1 7 4 0 0 0 5.20 -3 A221/13 1 31 1 13 1 10 7.71 27 A026/14 1 26 3 2 1 4 22.34 28 A267/09 10 6 8 1 5 1 15.30 29 A193/12 1 4 0 8 1 0 11.98 30 A292/10 2 49 0 44 0 0 14.60 31 A277/12 1 21 4 9 3 4 12.51 32 A255/14 49 15 4 7 11 9 15.21 33 A111/12 9 0 1 6 4 2 5.90 34 A356/12 18 25 1 24 1 2 11.69 35 A162/15 6 19 0 8 15 12 9.11 36 A121/14 8 21 1 11 3 8 8.39
Table A.4 – Data on neurogenic markers of the main cohort cases
Quantification of 6 basis cell groups as raw cell counts. DG length was measured in mm. Note that the offset variable is natural logarithm of the DG length. The more inclusive groups can be calculated as follows: HnP = xH + xHD; HP = xPH + xPHD; DnP = xD + xHD; DP = xPD + xPHD.
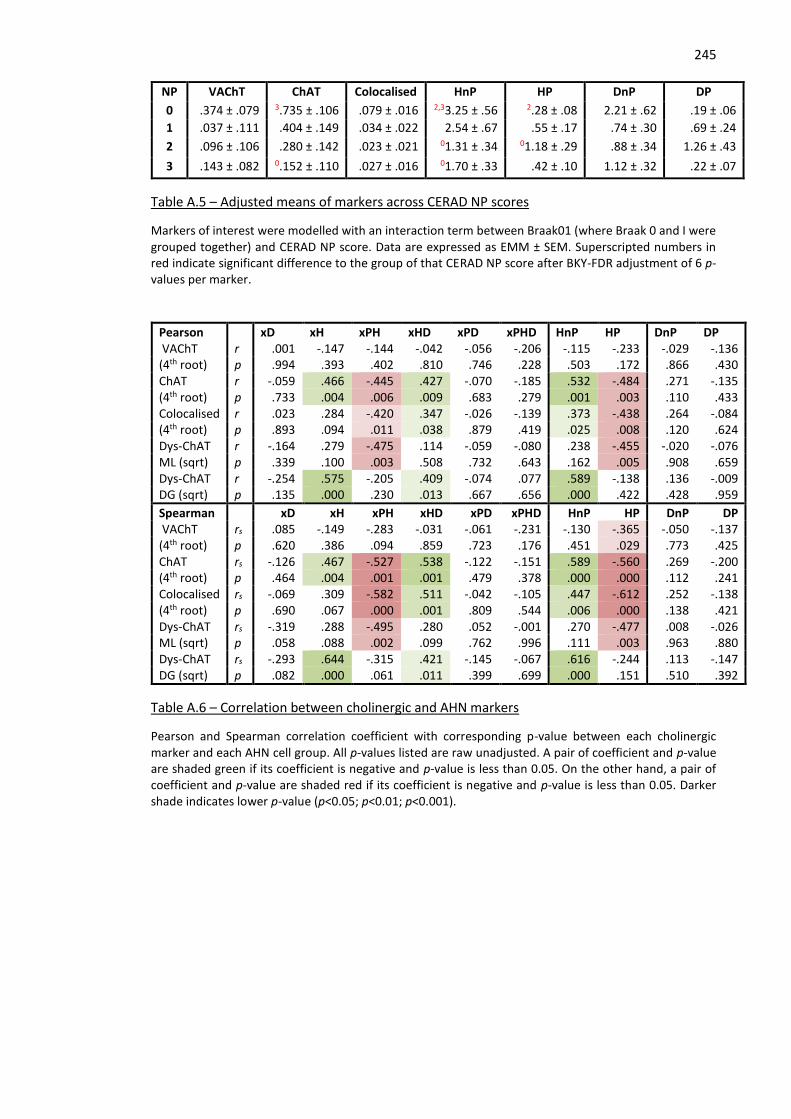
245
NP VAChT ChAT Colocalised HnP HP DnP DP
0 .374 ± .079 3.735 ± .106 .079 ± .016 2,33.25 ± .56 2.28 ± .08 2.21 ± .62 .19 ± .06
1 .037 ± .111 .404 ± .149 .034 ± .022 2.54 ± .67 .55 ± .17 .74 ± .30 .69 ± .24
2 .096 ± .106 .280 ± .142 .023 ± .021 01.31 ± .34 01.18 ± .29 .88 ± .34 1.26 ± .43
3 .143 ± .082 0.152 ± .110 .027 ± .016 01.70 ± .33 .42 ± .10 1.12 ± .32 .22 ± .07
Table A.5 – Adjusted means of markers across CERAD NP scores
Markers of interest were modelled with an interaction term between Braak01 (where Braak 0 and I were grouped together) and CERAD NP score. Data are expressed as EMM ± SEM. Superscripted numbers in red indicate significant difference to the group of that CERAD NP score after BKY-FDR adjustment of 6 p-values per marker.
Pearson xD xH xPH xHD xPD xPHD HnP HP DnP DP VAChT (4th root)
r .001 -.147 -.144 -.042 -.056 -.206 -.115 -.233 -.029 -.136 p .994 .393 .402 .810 .746 .228 .503 .172 .866 .430
ChAT (4th root)
r -.059 .466 -.445 .427 -.070 -.185 .532 -.484 .271 -.135 p .733 .004 .006 .009 .683 .279 .001 .003 .110 .433
Colocalised (4th root)
r .023 .284 -.420 .347 -.026 -.139 .373 -.438 .264 -.084 p .893 .094 .011 .038 .879 .419 .025 .008 .120 .624
Dys-ChAT ML (sqrt)
r -.164 .279 -.475 .114 -.059 -.080 .238 -.455 -.020 -.076 p .339 .100 .003 .508 .732 .643 .162 .005 .908 .659
Dys-ChAT DG (sqrt)
r -.254 .575 -.205 .409 -.074 .077 .589 -.138 .136 -.009 p .135 .000 .230 .013 .667 .656 .000 .422 .428 .959
Spearman xD xH xPH xHD xPD xPHD HnP HP DnP DP VAChT (4th root)
rs .085 -.149 -.283 -.031 -.061 -.231 -.130 -.365 -.050 -.137 p .620 .386 .094 .859 .723 .176 .451 .029 .773 .425
ChAT (4th root)
rs -.126 .467 -.527 .538 -.122 -.151 .589 -.560 .269 -.200 p .464 .004 .001 .001 .479 .378 .000 .000 .112 .241
Colocalised (4th root)
rs -.069 .309 -.582 .511 -.042 -.105 .447 -.612 .252 -.138 p .690 .067 .000 .001 .809 .544 .006 .000 .138 .421
Dys-ChAT ML (sqrt)
rs -.319 .288 -.495 .280 .052 -.001 .270 -.477 .008 -.026 p .058 .088 .002 .099 .762 .996 .111 .003 .963 .880
Dys-ChAT DG (sqrt)
rs -.293 .644 -.315 .421 -.145 -.067 .616 -.244 .113 -.147 p .082 .000 .061 .011 .399 .699 .000 .151 .510 .392
Table A.6 – Correlation between cholinergic and AHN markers
Pearson and Spearman correlation coefficient with corresponding p-value between each cholinergic marker and each AHN cell group. All p-values listed are raw unadjusted. A pair of coefficient and p-value are shaded green if its coefficient is negative and p-value is less than 0.05. On the other hand, a pair of coefficient and p-value are shaded red if its coefficient is negative and p-value is less than 0.05. Darker shade indicates lower p-value (p<0.05; p<0.01; p<0.001).
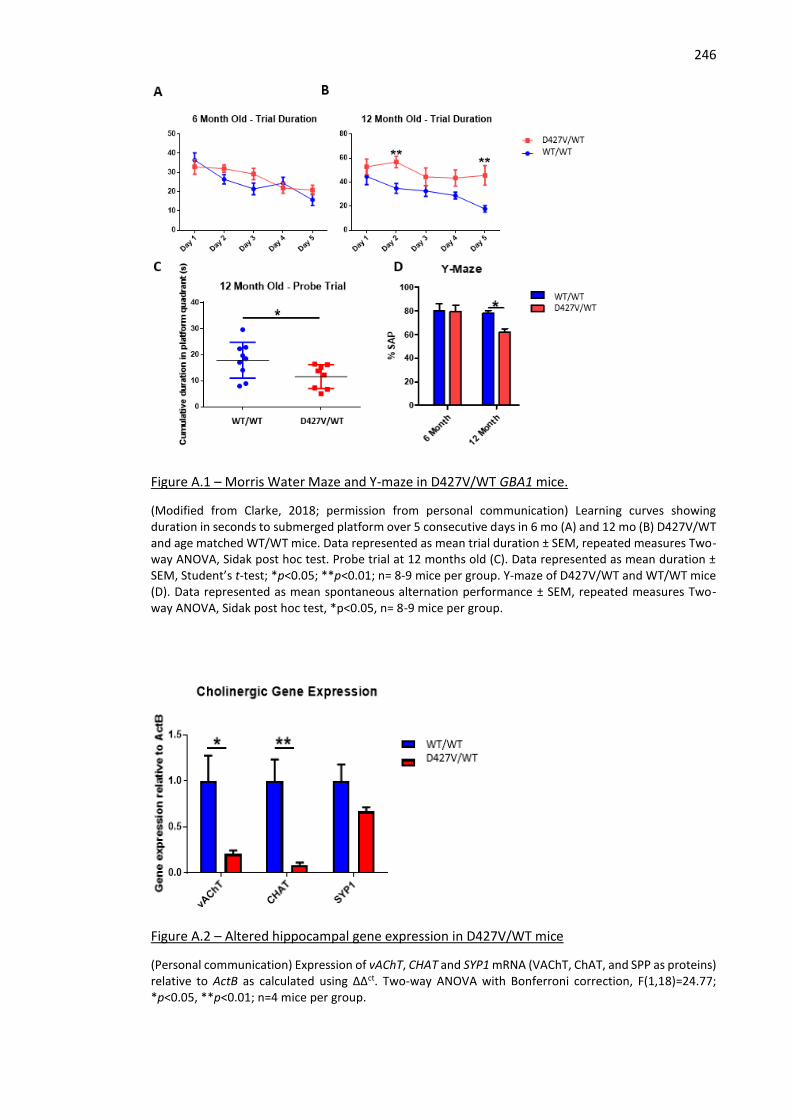
246
Figure A.1 – Morris Water Maze and Y-maze in D427V/WT GBA1 mice.
(Modified from Clarke, 2018; permission from personal communication) Learning curves showing duration in seconds to submerged platform over 5 consecutive days in 6 mo (A) and 12 mo (B) D427V/WT and age matched WT/WT mice. Data represented as mean trial duration ± SEM, repeated measures Two-way ANOVA, Sidak post hoc test. Probe trial at 12 months old (C). Data represented as mean duration ± SEM, Student’s t-test; *p<0.05; **p<0.01; n= 8-9 mice per group. Y-maze of D427V/WT and WT/WT mice (D). Data represented as mean spontaneous alternation performance ± SEM, repeated measures Two-way ANOVA, Sidak post hoc test, *p<0.05, n= 8-9 mice per group.
Figure A.2 – Altered hippocampal gene expression in D427V/WT mice
(Personal communication) Expression of vAChT, CHAT and SYP1 mRNA (VAChT, ChAT, and SPP as proteins) relative to ActB as calculated using ΔΔct. Two-way ANOVA with Bonferroni correction, F(1,18)=24.77; *p<0.05, **p<0.01; n=4 mice per group.
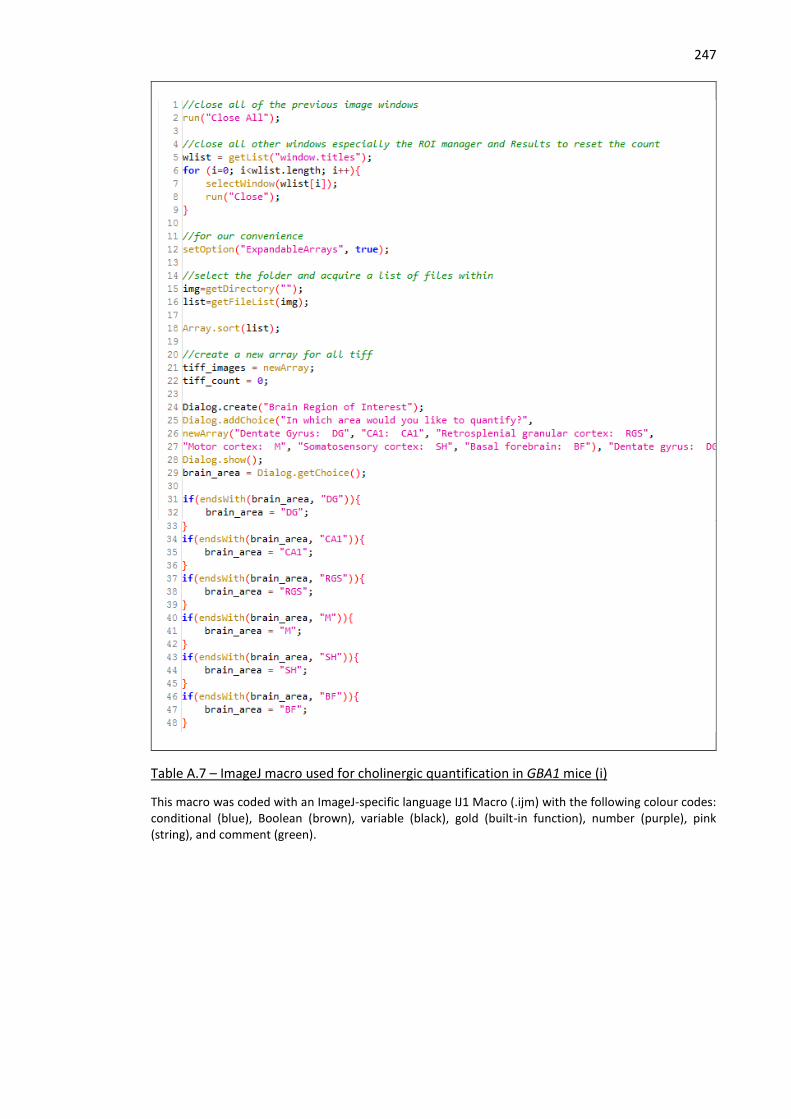
247
Table A.7 – ImageJ macro used for cholinergic quantification in GBA1 mice (i)
This macro was coded with an ImageJ-specific language IJ1 Macro (.ijm) with the following colour codes: conditional (blue), Boolean (brown), variable (black), gold (built-in function), number (purple), pink (string), and comment (green).

248
Table A.7 – ImageJ macro used for cholinergic quantification in GBA1 mice (ii)
~ Continued ~
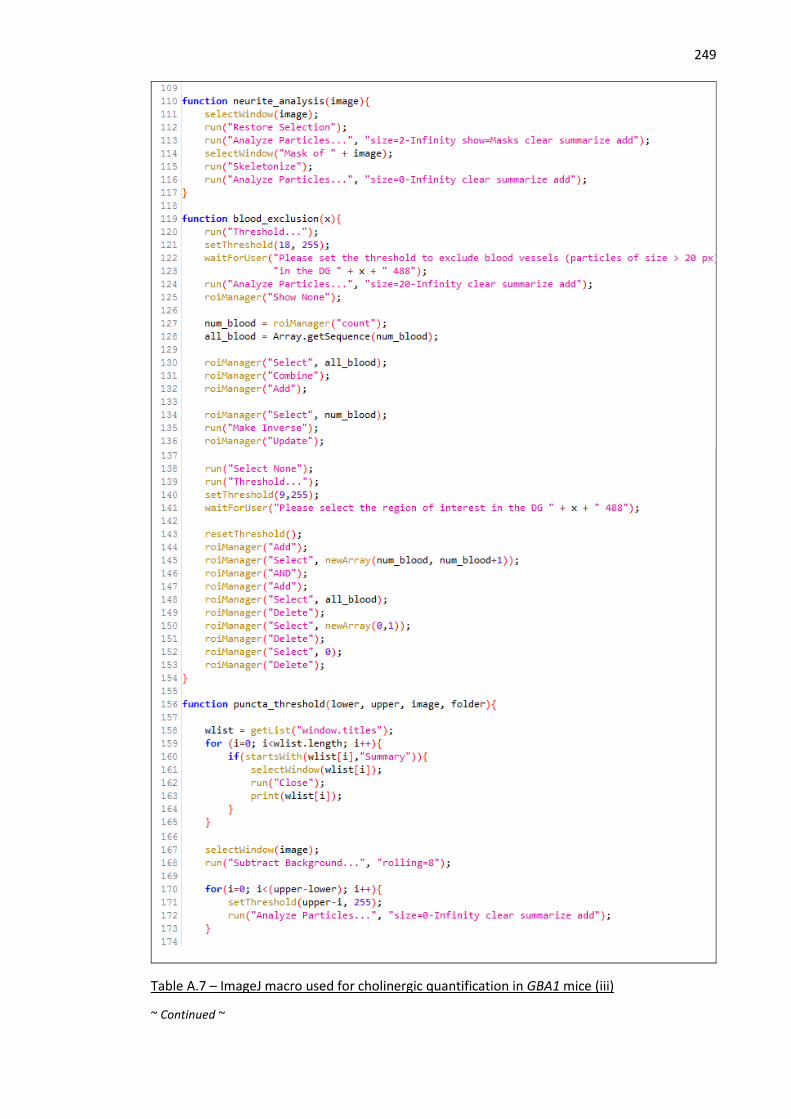
249
Table A.7 – ImageJ macro used for cholinergic quantification in GBA1 mice (iii)
~ Continued ~
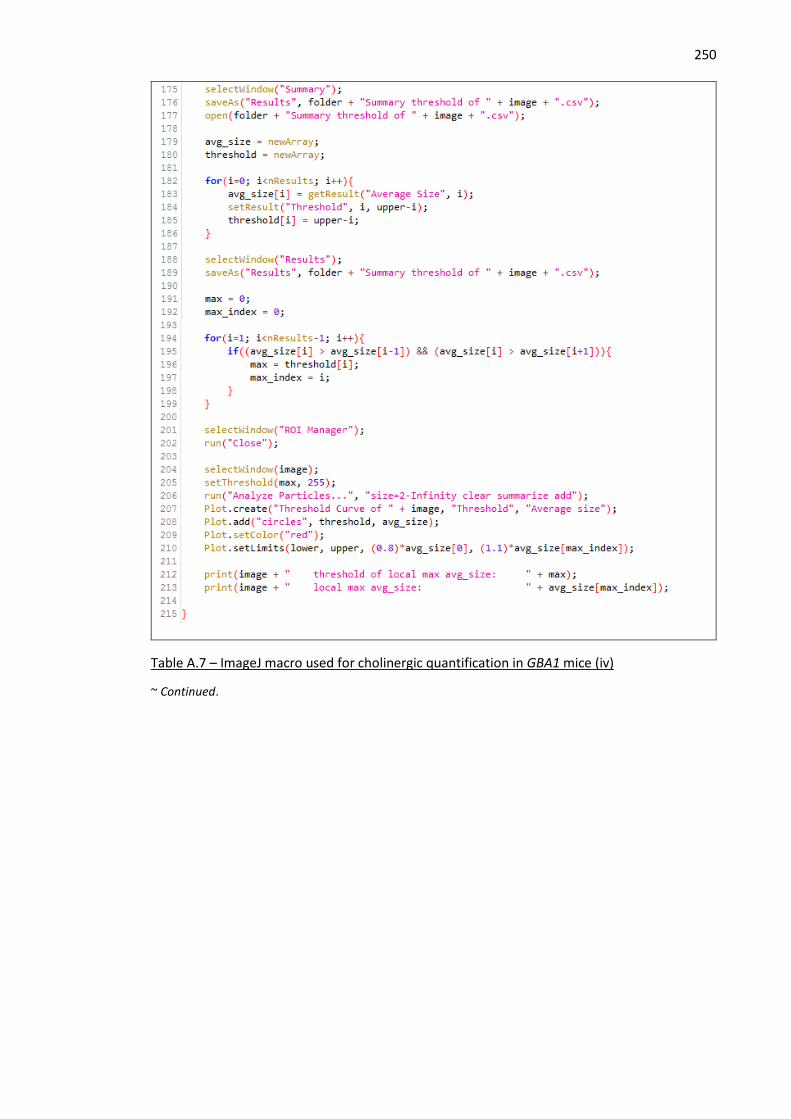
250
Table A.7 – ImageJ macro used for cholinergic quantification in GBA1 mice (iv)
~ Continued.
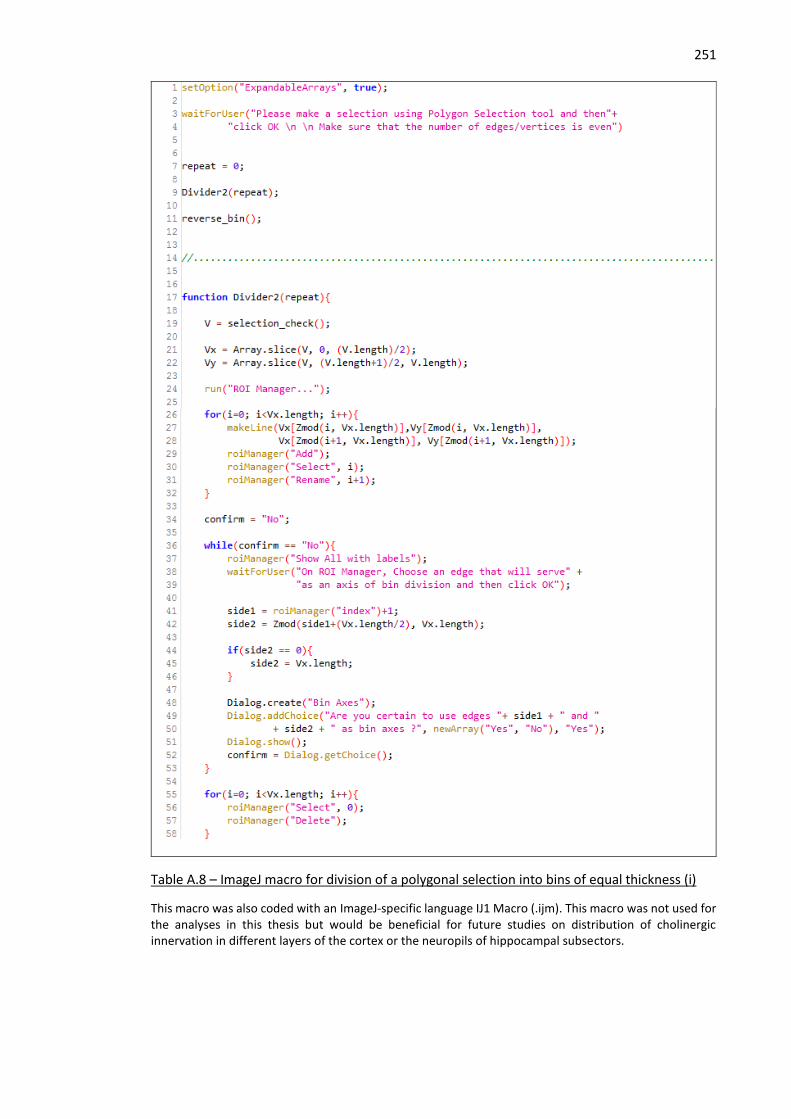
251
Table A.8 – ImageJ macro for division of a polygonal selection into bins of equal thickness (i)
This macro was also coded with an ImageJ-specific language IJ1 Macro (.ijm). This macro was not used for the analyses in this thesis but would be beneficial for future studies on distribution of cholinergic innervation in different layers of the cortex or the neuropils of hippocampal subsectors.
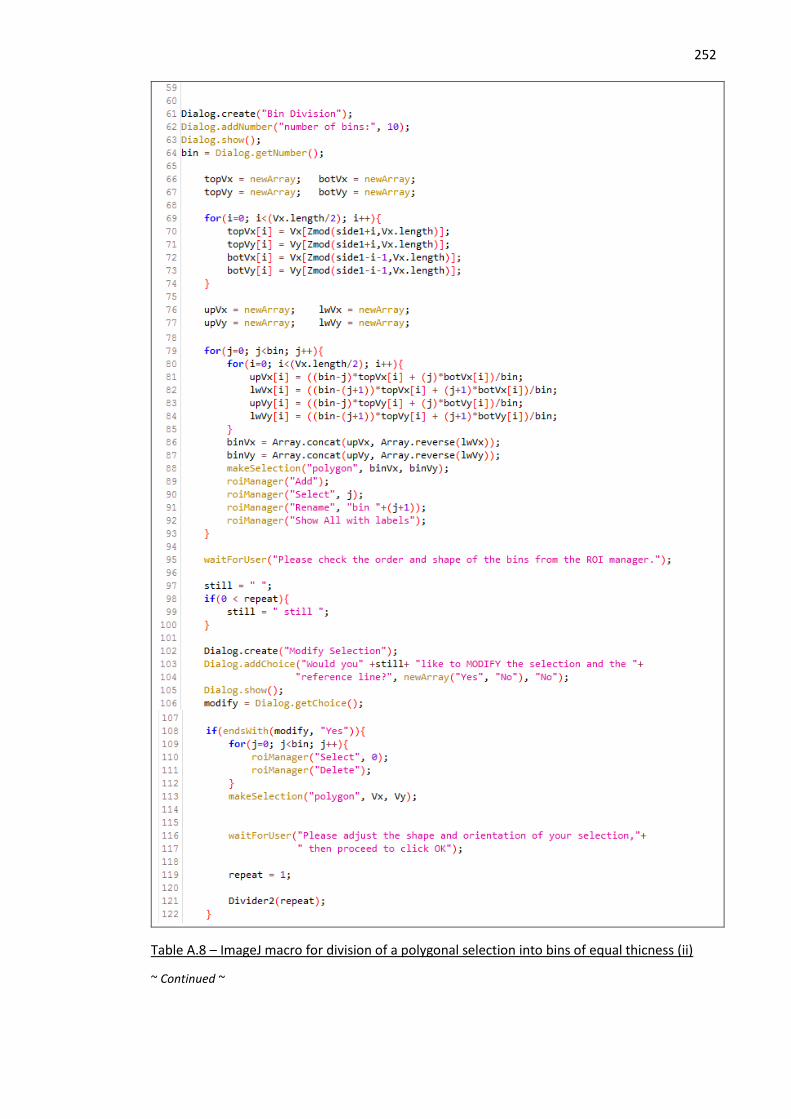
252
Table A.8 – ImageJ macro for division of a polygonal selection into bins of equal thicness (ii)
~ Continued ~
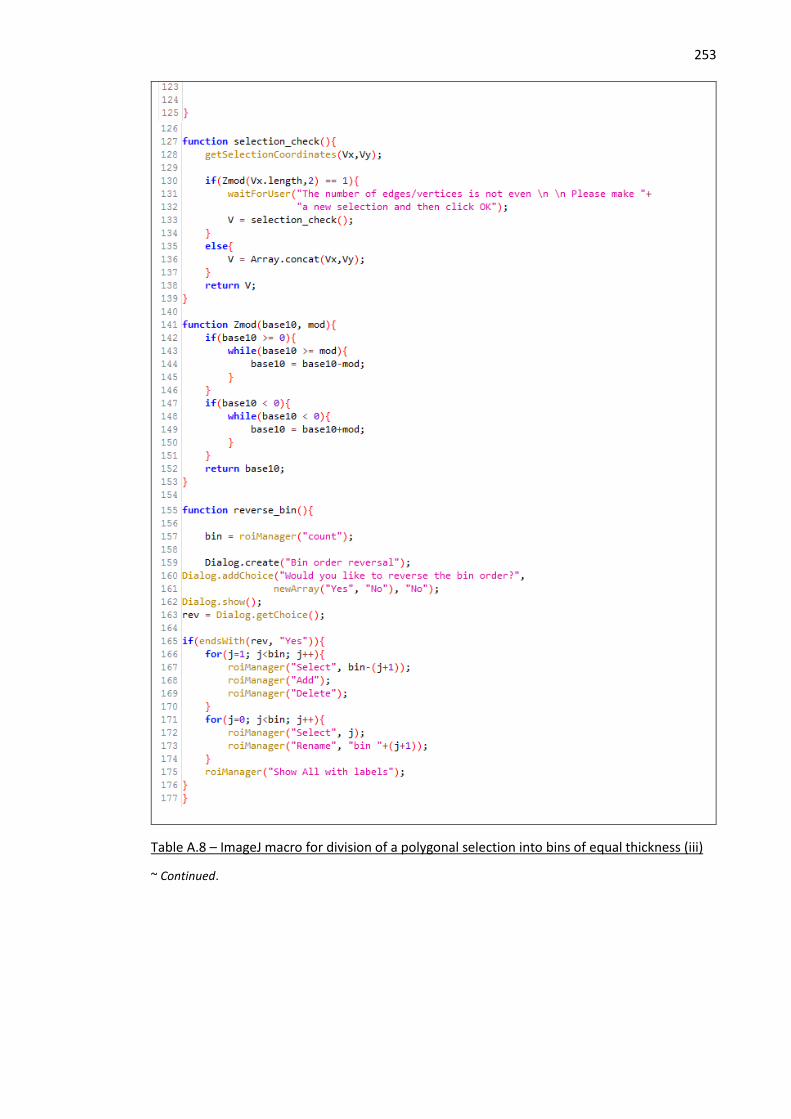
253
Table A.8 – ImageJ macro for division of a polygonal selection into bins of equal thickness (iii)
~ Continued.
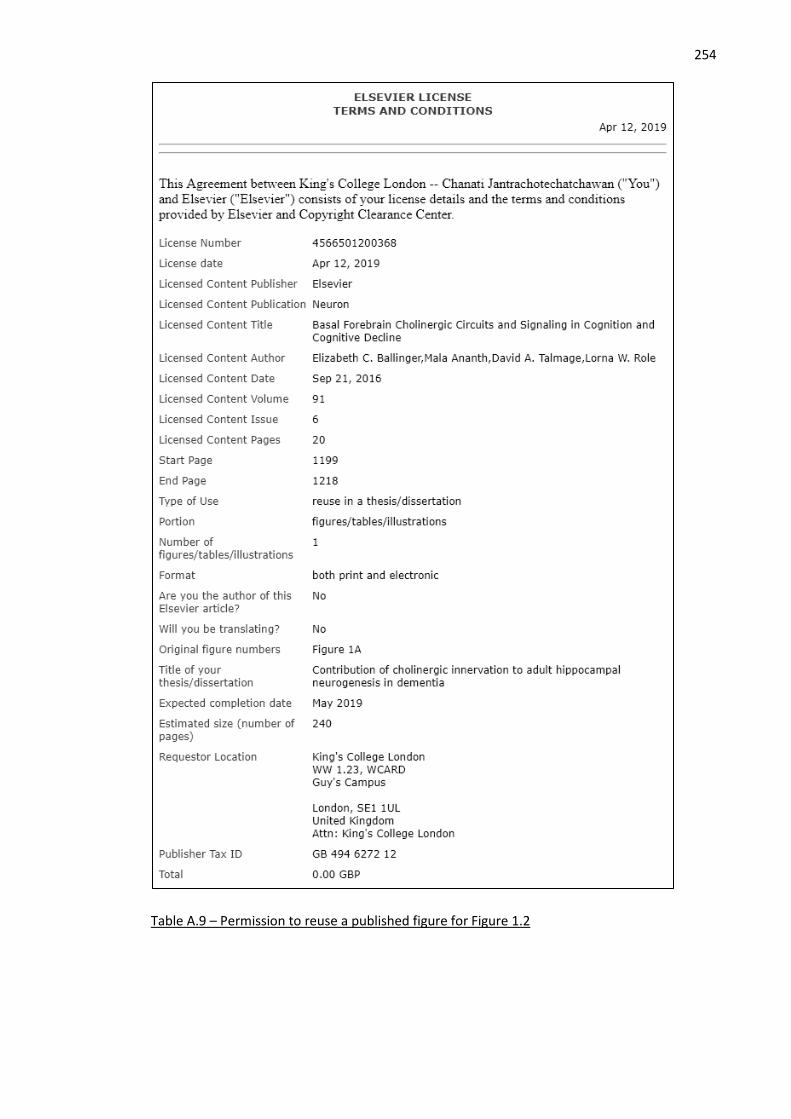
254
Table A.9 – Permission to reuse a published figure for Figure 1.2
255
Table A.10 – Permission to reuse a published figure for Figure 1.3
256
Table A.11 – Permission to reuse a published figure for Figure 1.5
257
Table A.12 – Permission to reuse a published figure for Figure 1.6
258
Table A.13 – Permission to reuse a published figure for Figure 1.10
259
Table A.14 – Approval letter for the main cohort tissue request (TRID 213)