Embed Size (px)
Citation preview

75 Year Anniversary
NC State University Department of Statistics
—Biostatistics—
Geert Molenberghs
[email protected] & [email protected]
Interuniversity Institute for Biostatistics and statistical Bioinformatics (I-BioStat)
UHasselt & KU Leuven, Belgium
www.ibiostat.beInteruniversity Institute for Biostatistics and statistical Bioinformatics

Theme I
Some Historical Reflections
75 Year Anniversary NC State University Department of Statistics 1
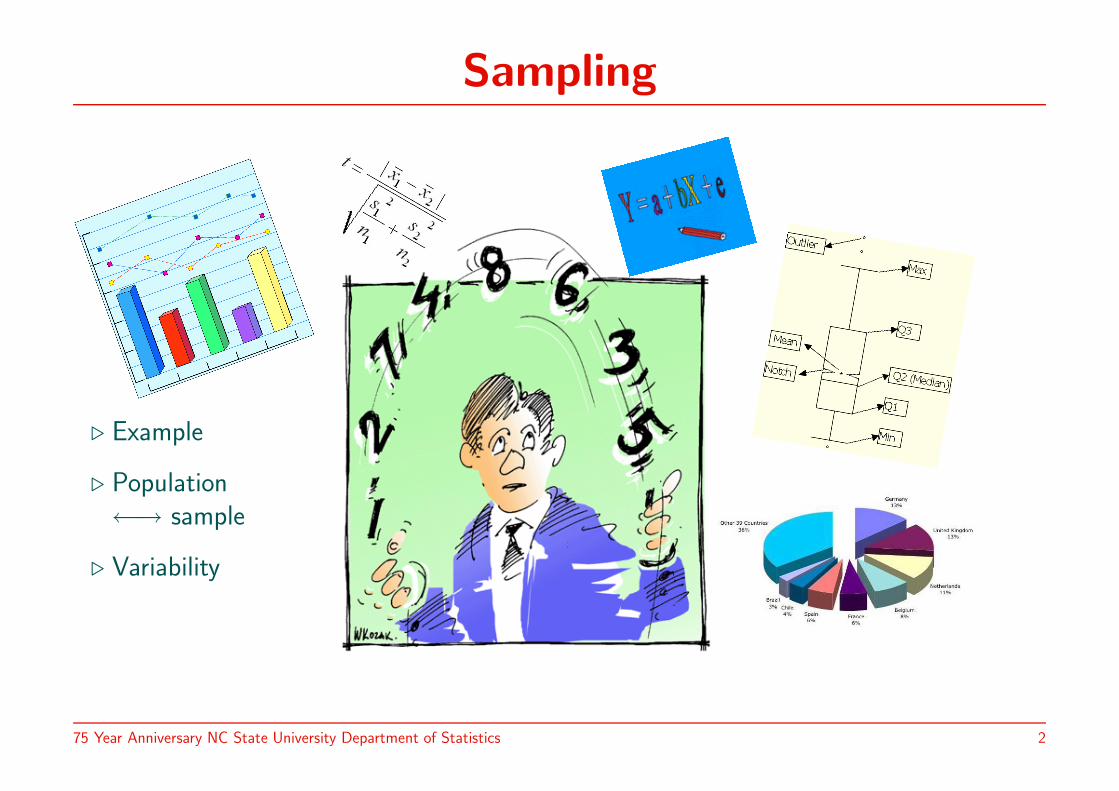
Sampling
. Example
. Population←→ sample
. Variability
75 Year Anniversary NC State University Department of Statistics 2

POPULATION
••••••••••••••••••••••••••••••••••••••••••••••••••••••••••••••••••••••••••••••••••••••••••••••••••••••••••••••••••••••••••••••••••••••••••••••••••••••••••••••••••••••••••••••••••••••••••••••••••••••••••••••••••••••••••••••••••••••••••••••••
•••••••••••••••••••••••••••••••••••••••••••••••••••••••••••••••••••••••••••••••••••••••••••••••••••••••••••••••••••••••••••••••••••••••••••••••••••••••••••••••••••••••••••••••••••••••••••••••••••••••••••••••••••••••••••••••••••••••••••••••••••••••••••••••••••••••••••••••••••••••••••••••••••••••••••••••••••••••••••••••••••••••••••••••••••••••••••••••••••••••••••••••••••••••••••••••••••••••••••••••••••••••••••••••••••••••••••••••••••••••••••••••••••••••••••••••••••••••••••••••••••••••••••••••••••••••••••••••••••••••••••••••••••••••••••••••••••••••••••••••••••••••••••••••••••••••••••••••••••••••••••••••••••••••••••••••••••••••••••••••••••••••••••••••••••••••••••••••••••••••••••••••••••••••••••••••••••••••••••••••••••••••••••••••••••••••••••••••••••••••••••••••••••••••••••••••••••••••••••••••••••••••••••••••••••••••••••••••••••••••••••••••••••••••••••••••••••••••••••••••••••••••••••••••••••••••••••••••••••••••••••••••••••••••••••••••••••••••••••••••••••••••••••••••••••••••••••••••••••••••••••••••••••••••••••••••••••••••••••••••••••••••••••••••••••••••••••••••••••••••••••••••••••••••••••••••
S
A
M
P
L
E
•••••••••••••••••••••••••••••••••••••••••••••••••••••••••••••••••••••••••••••••••••••••••••••••••••••••••••••••••••••••••••••••••••••••••••••••••••••••••••••••••••••••••••••••••••••••••••••••••••••••••••••••••••••••••••••••••••••••••••••••••••••••••••••••••••••••••••••••••••••••••••••••••••••••••••••••••••••••••••••••••••••••••••••••••••••••••••••••••••••••••••••••••••••••••••••••••••••••••••••••••••••••••••••••••••••••••••••••••••••••••••••••••••••••••••••••••••••••••••••••••••••••••••••••••••••••••••••••••••••••••••••••••••••••••••••••••••••••••••••••••••••••••••••••••••••••••••••••••••••••••••••••••••••••••••••••••••••••••••••••••••••••••••••••••••••••••••••••••••••••••••••••••••••••••••••••••••••••••••••••••••••••••••••••••••••••••••••••••••••••••••••••••••••••••••••••••••••••••••••••••••••••••••••••••••••••••••••••••••••••••••••••••••••••••••••••••••••••••••••••••••••••••••••••••••••••••••••••••••••••••••••••••••••••••••••••••••••••••••••••••••••••••••••••••••••••••••••••••••••••••••••••••••••••••••••••••••••••••••••••••••••••••••••••••••••••••••••••••••••••••••••••••••
•••••••••••••••••••••••••••••••••••••••••••••••••••••••••••••••••••••••••••••••••••••••••••••••••••••••••••••••••••••••••••••••••••••••••••••••••••••••••••••••••••••••••••••••••••••••••••••••••••••••••••••••••••••••••••••••••••••••••••••••••••••••••••••••••••••••••
••••••••••••••••••••••••••••••••••••••••••••••••••••••••••••••••••••••••••••••••
•••••••••••••••••••••••••••••••••••••••••••••••••••••••••••••••••••••••••••••••••••••••••••••••••••••••••••••••••••••••••••••••••••••••••••••••••••••••••••••••••••••••••••••••••••••••••••••••••••••••••••••••••••••••••••••••••••••••••••••••••••••••••••••••••••••••••
••••••••••••••••••••••••••••••••••••••••••••••••••••••••••••••••••••••••••••••••RANDOM STATISTICS
Average age in a population
Average age in 21 units
75 Year Anniversary NC State University Department of Statistics 3
Yi ∼ N (µ, σ2)
75 Year Anniversary NC State University Department of Statistics 4
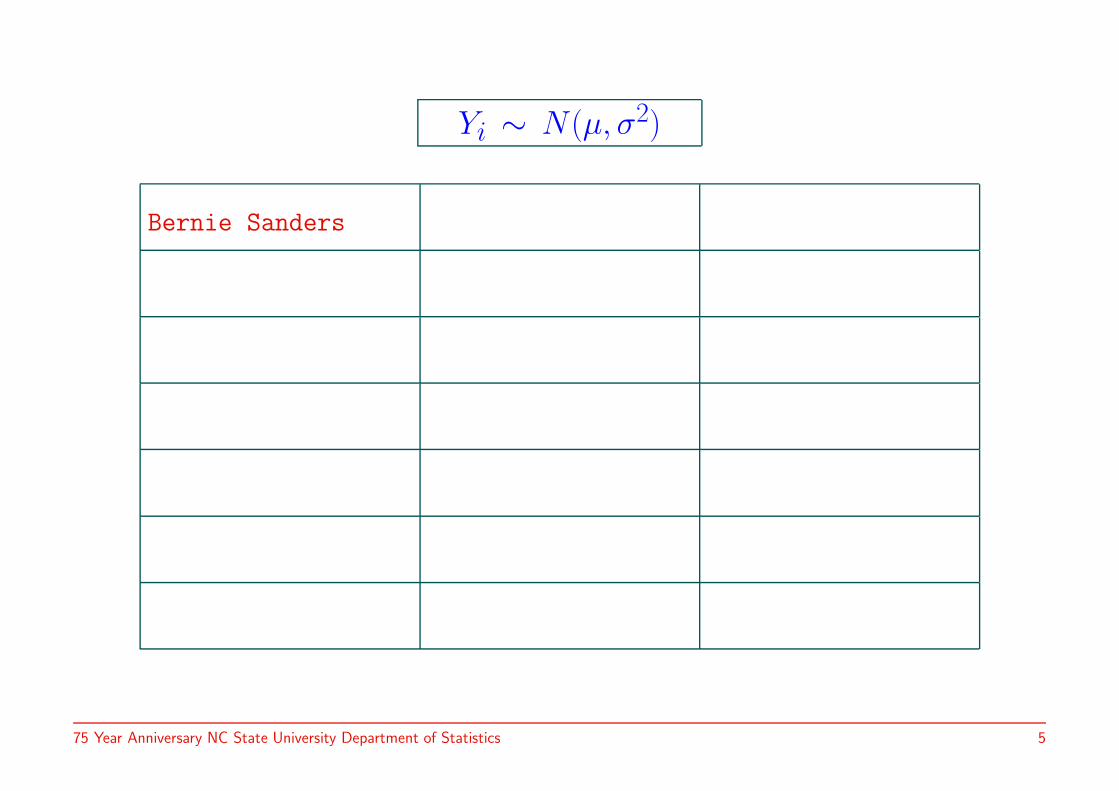
Yi ∼ N (µ, σ2)
Bernie Sanders
75 Year Anniversary NC State University Department of Statistics 5
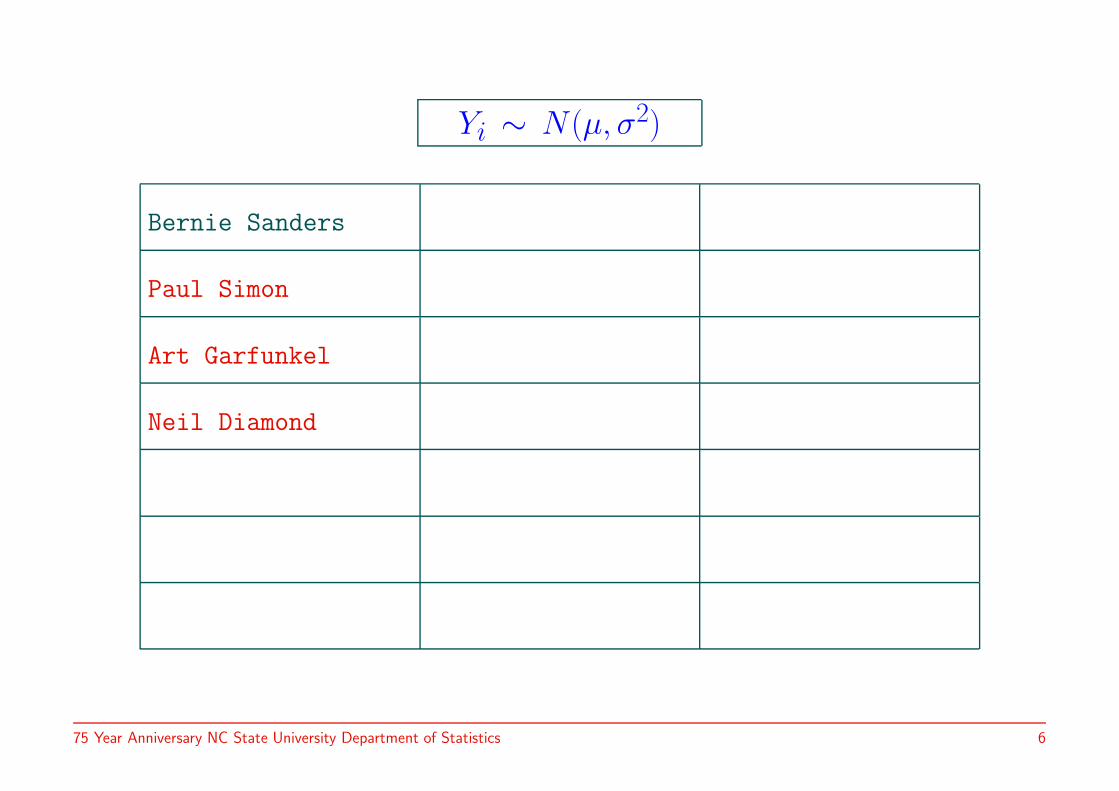
Yi ∼ N (µ, σ2)
Bernie Sanders
Paul Simon
Art Garfunkel
Neil Diamond
75 Year Anniversary NC State University Department of Statistics 6
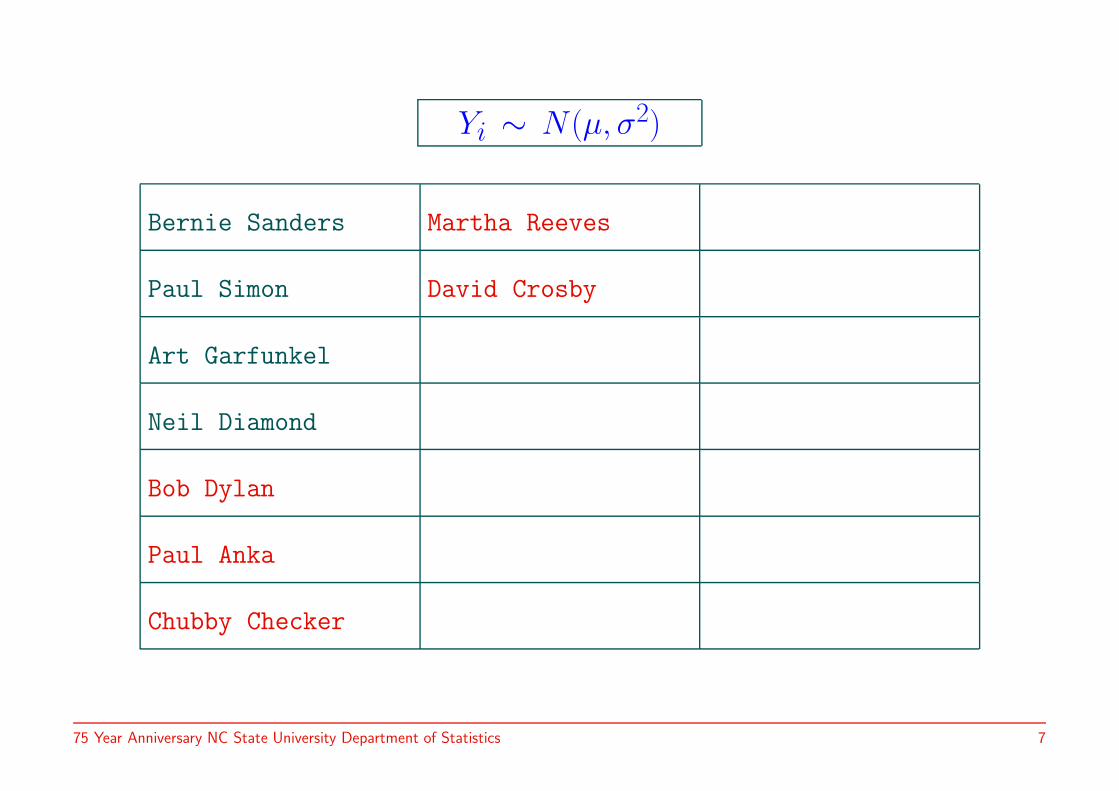
Yi ∼ N (µ, σ2)
Bernie Sanders Martha Reeves
Paul Simon David Crosby
Art Garfunkel
Neil Diamond
Bob Dylan
Paul Anka
Chubby Checker
75 Year Anniversary NC State University Department of Statistics 7
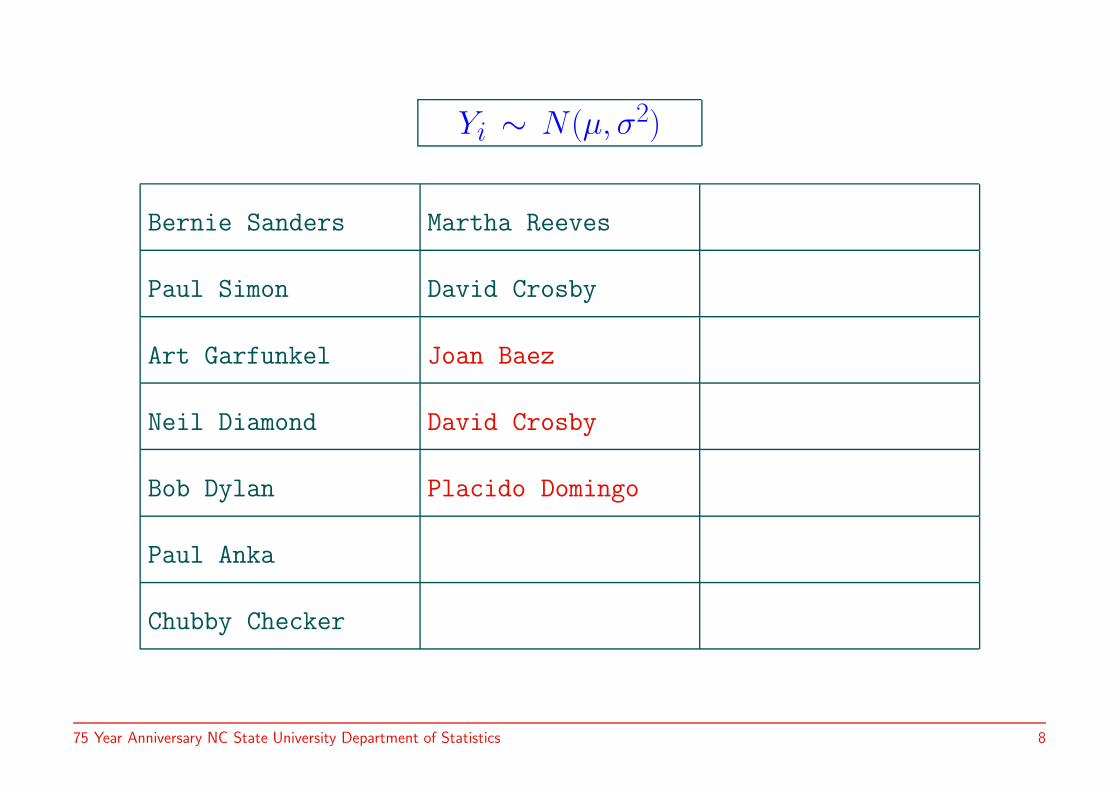
Yi ∼ N (µ, σ2)
Bernie Sanders Martha Reeves
Paul Simon David Crosby
Art Garfunkel Joan Baez
Neil Diamond David Crosby
Bob Dylan Placido Domingo
Paul Anka
Chubby Checker
75 Year Anniversary NC State University Department of Statistics 8

Yi ∼ N (µ, σ2)
Bernie Sanders Martha Reeves Fred West
Paul Simon David Crosby Charles Whitman
Art Garfunkel Joan Baez Jesse Jackson
Neil Diamond David Crosby George Clinton
Bob Dylan Placido Domingo Desmond Dekker
Paul Anka Kim Jong Il Vivienne Westwood
Chubby Checker Dick Cheney
75 Year Anniversary NC State University Department of Statistics 9
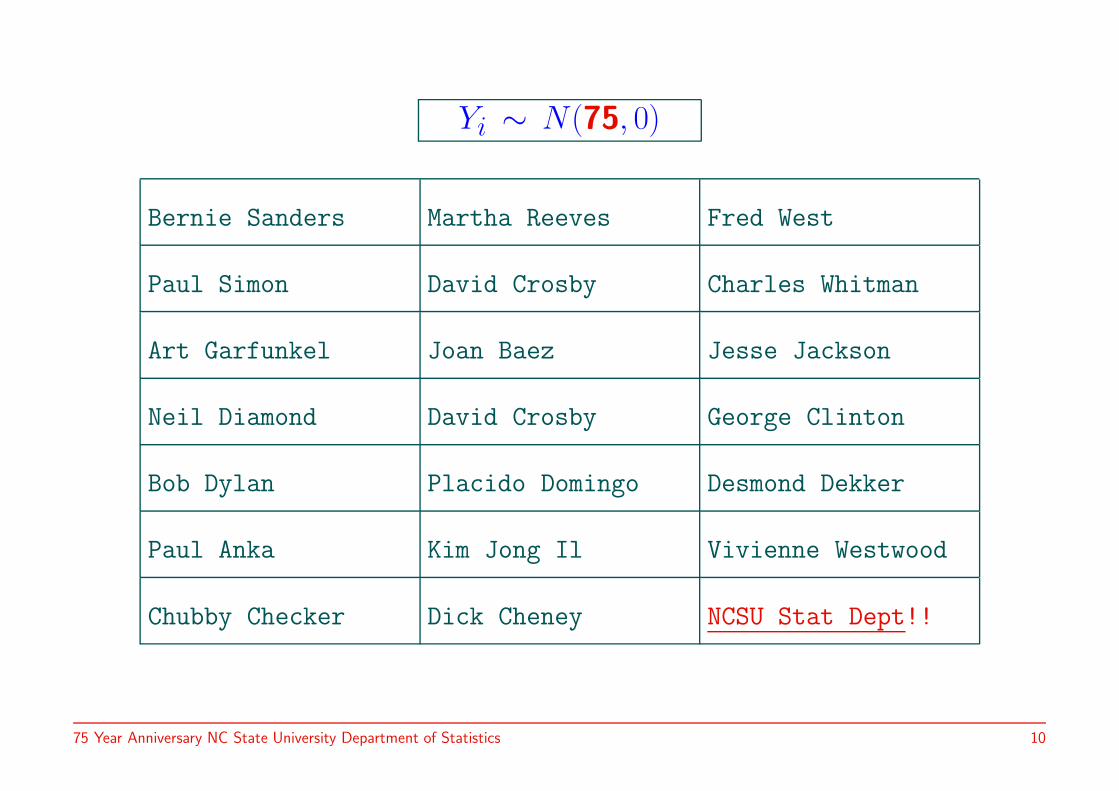
Yi ∼ N (75, 0)
Bernie Sanders Martha Reeves Fred West
Paul Simon David Crosby Charles Whitman
Art Garfunkel Joan Baez Jesse Jackson
Neil Diamond David Crosby George Clinton
Bob Dylan Placido Domingo Desmond Dekker
Paul Anka Kim Jong Il Vivienne Westwood
Chubby Checker Dick Cheney NCSU Stat Dept!!
75 Year Anniversary NC State University Department of Statistics 10
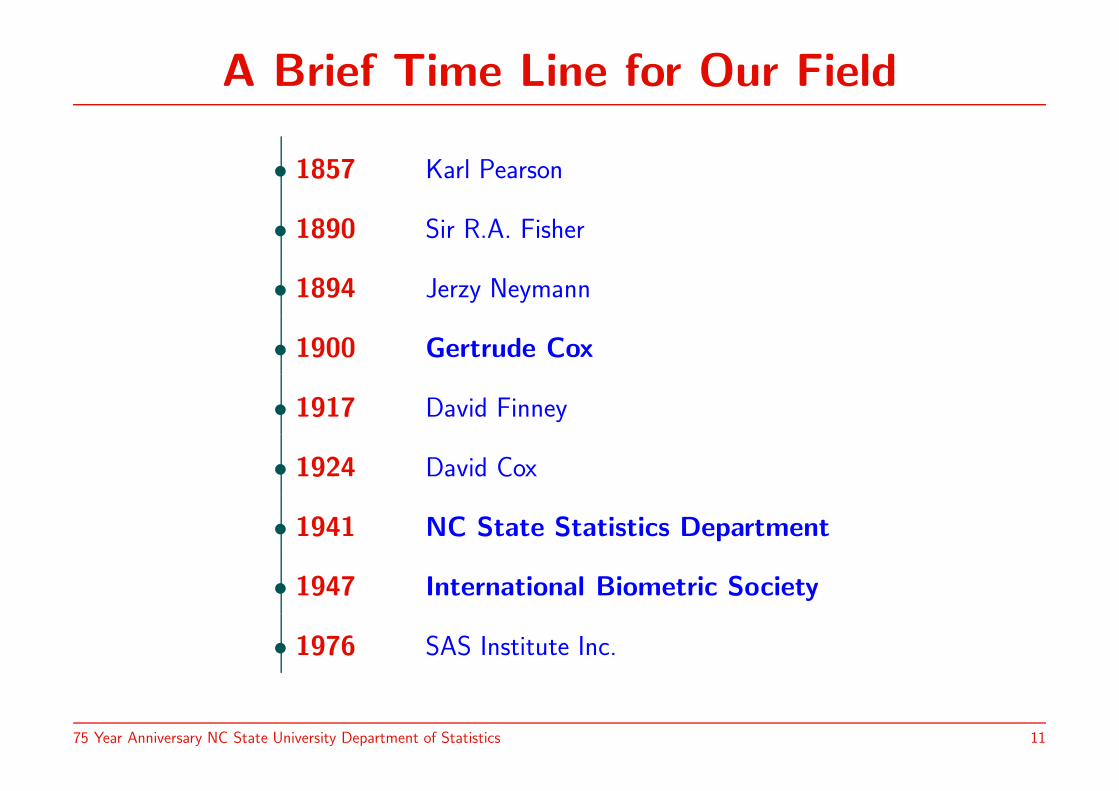
A Brief Time Line for Our Field
• 1857 Karl Pearson
• 1890 Sir R.A. Fisher
• 1894 Jerzy Neymann
• 1900 Gertrude Cox
• 1917 David Finney
• 1924 David Cox
• 1941 NC State Statistics Department
• 1947 International Biometric Society
• 1976 SAS Institute Inc.
75 Year Anniversary NC State University Department of Statistics 11
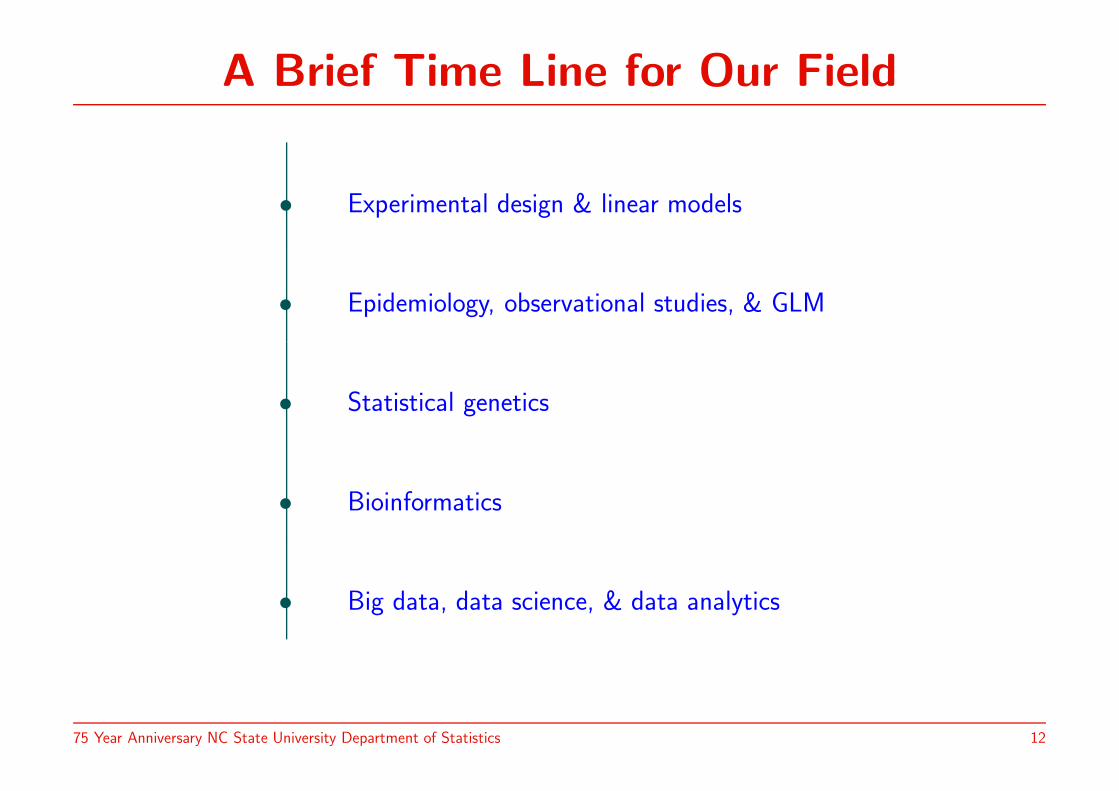
A Brief Time Line for Our Field
• Experimental design & linear models
• Epidemiology, observational studies, & GLM
• Statistical genetics
• Bioinformatics
• Big data, data science, & data analytics
75 Year Anniversary NC State University Department of Statistics 12

A Virtuous Triangle
Research
Research & Education ↗↙ ↘↖ Research & Consulting
←−Education Consulting
−→
Education & Consulting
Research & Education & Consulting
75 Year Anniversary NC State University Department of Statistics 13
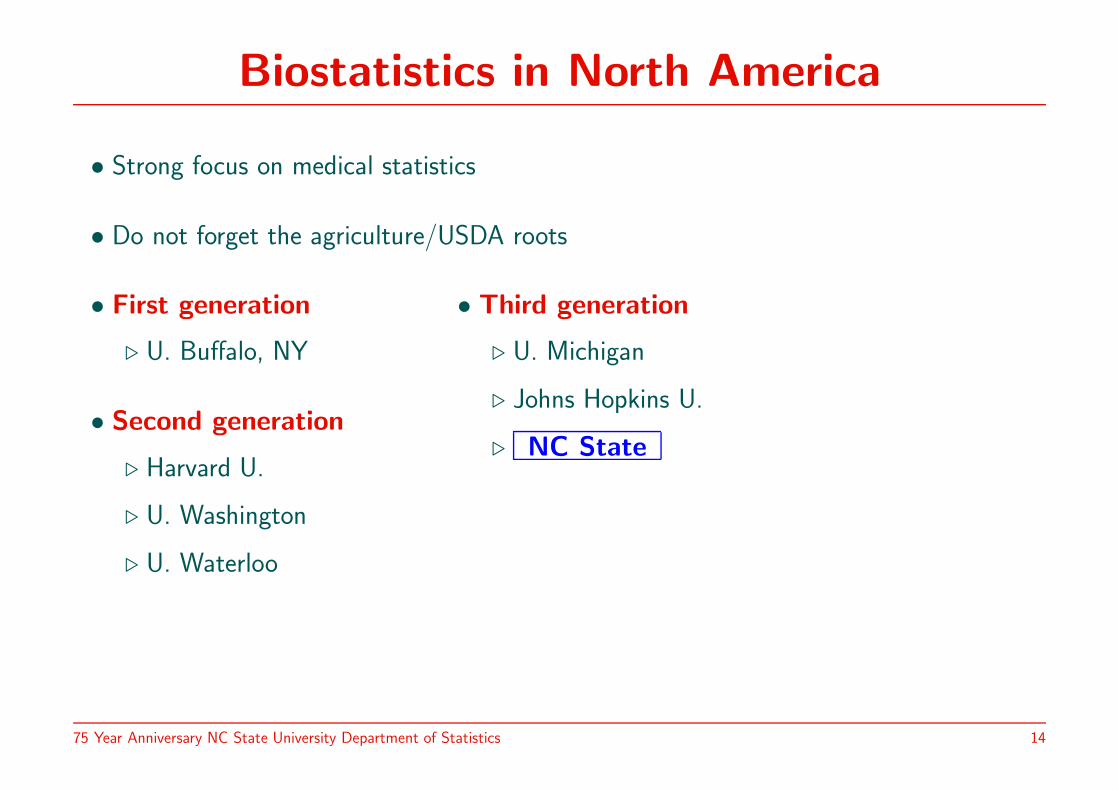
Biostatistics in North America
• Strong focus on medical statistics
• Do not forget the agriculture/USDA roots
• First generation
. U. Buffalo, NY
• Second generation
. Harvard U.
. U. Washington
. U. Waterloo
• Third generation
. U. Michigan
. Johns Hopkins U.
. NC State
75 Year Anniversary NC State University Department of Statistics 14
Education
• Here is to the very popular and successful statistics programs andbiostatistics concentration at NC State!
• Formal programs:
. Undergraduate level
. Master level
. PhD level
• On site & distance
• Summer schools and short courses
• For statisticians and our partner fields
75 Year Anniversary NC State University Department of Statistics 15
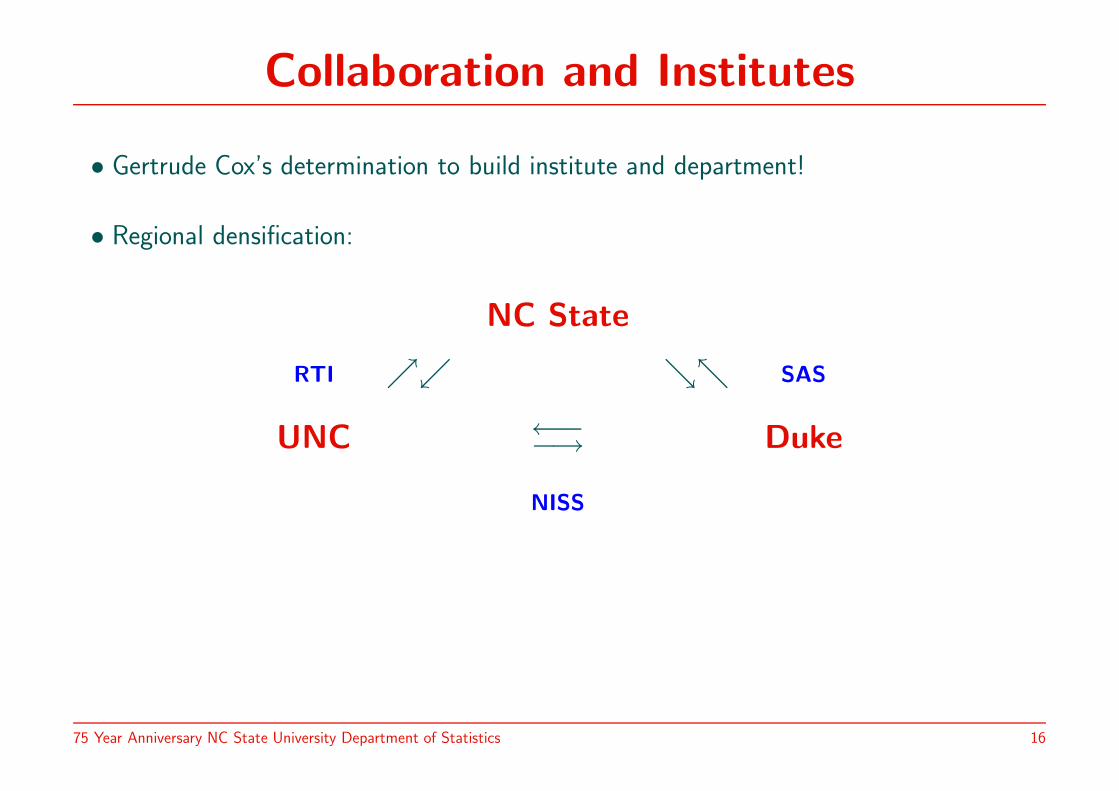
Collaboration and Institutes
• Gertrude Cox’s determination to build institute and department!
• Regional densification:
NC State
RTI ↗↙ ↘↖ SAS
←−UNC Duke−→
NISS
75 Year Anniversary NC State University Department of Statistics 16
The International Biometric Society
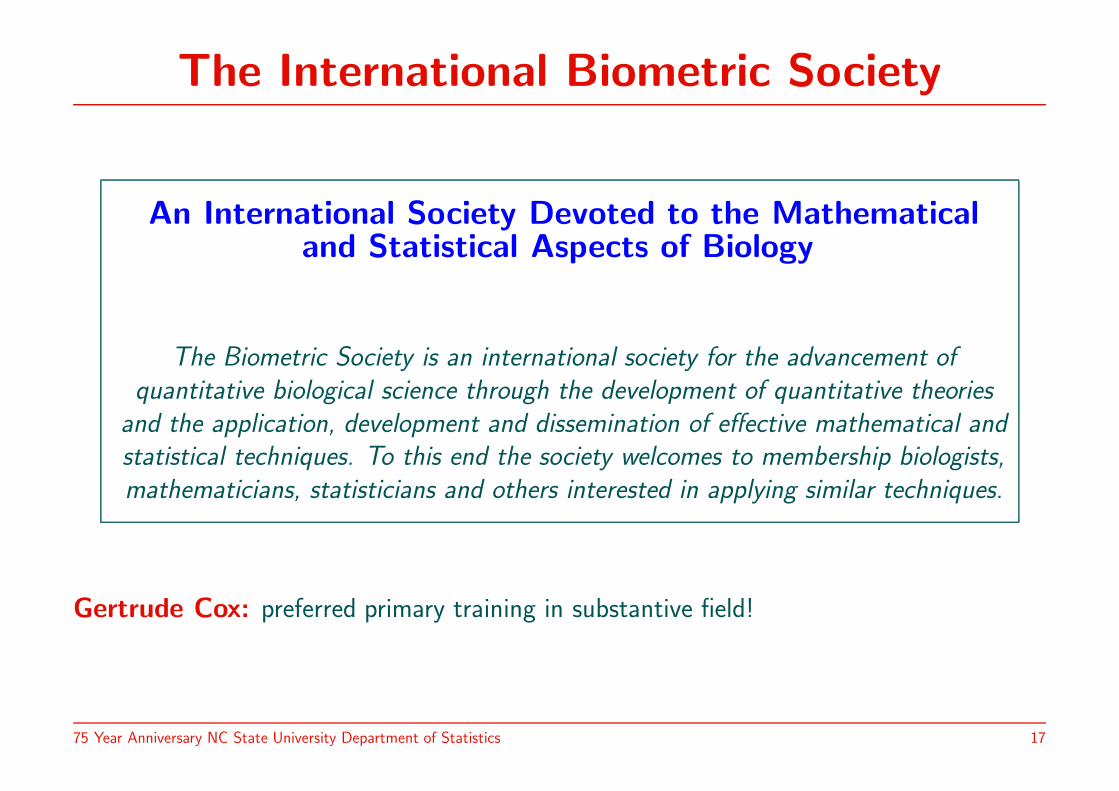
An International Society Devoted to the Mathematicaland Statistical Aspects of Biology
The Biometric Society is an international society for the advancement of
quantitative biological science through the development of quantitative theories
and the application, development and dissemination of effective mathematical and
statistical techniques. To this end the society welcomes to membership biologists,
mathematicians, statisticians and others interested in applying similar techniques.
Gertrude Cox: preferred primary training in substantive field!
75 Year Anniversary NC State University Department of Statistics 17
The International Biometric Society
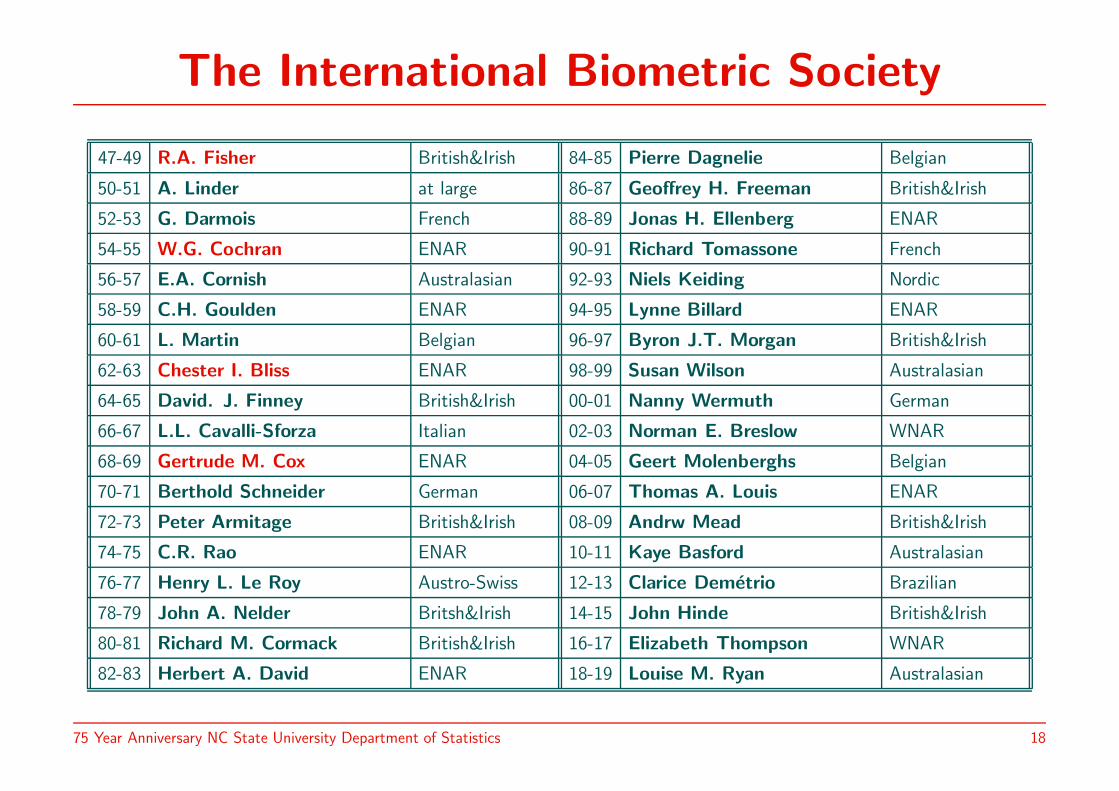
47-49 R.A. Fisher British&Irish 84-85 Pierre Dagnelie Belgian
50-51 A. Linder at large 86-87 Geoffrey H. Freeman British&Irish
52-53 G. Darmois French 88-89 Jonas H. Ellenberg ENAR
54-55 W.G. Cochran ENAR 90-91 Richard Tomassone French
56-57 E.A. Cornish Australasian 92-93 Niels Keiding Nordic
58-59 C.H. Goulden ENAR 94-95 Lynne Billard ENAR
60-61 L. Martin Belgian 96-97 Byron J.T. Morgan British&Irish
62-63 Chester I. Bliss ENAR 98-99 Susan Wilson Australasian
64-65 David. J. Finney British&Irish 00-01 Nanny Wermuth German
66-67 L.L. Cavalli-Sforza Italian 02-03 Norman E. Breslow WNAR
68-69 Gertrude M. Cox ENAR 04-05 Geert Molenberghs Belgian
70-71 Berthold Schneider German 06-07 Thomas A. Louis ENAR
72-73 Peter Armitage British&Irish 08-09 Andrw Mead British&Irish
74-75 C.R. Rao ENAR 10-11 Kaye Basford Australasian
76-77 Henry L. Le Roy Austro-Swiss 12-13 Clarice Demetrio Brazilian
78-79 John A. Nelder Britsh&Irish 14-15 John Hinde British&Irish
80-81 Richard M. Cormack British&Irish 16-17 Elizabeth Thompson WNAR
82-83 Herbert A. David ENAR 18-19 Louise M. Ryan Australasian
75 Year Anniversary NC State University Department of Statistics 18

75 Year Anniversary NC State University Department of Statistics 19

75 Year Anniversary NC State University Department of Statistics 20
75 Year Anniversary NC State University Department of Statistics 21
75 Year Anniversary NC State University Department of Statistics 22
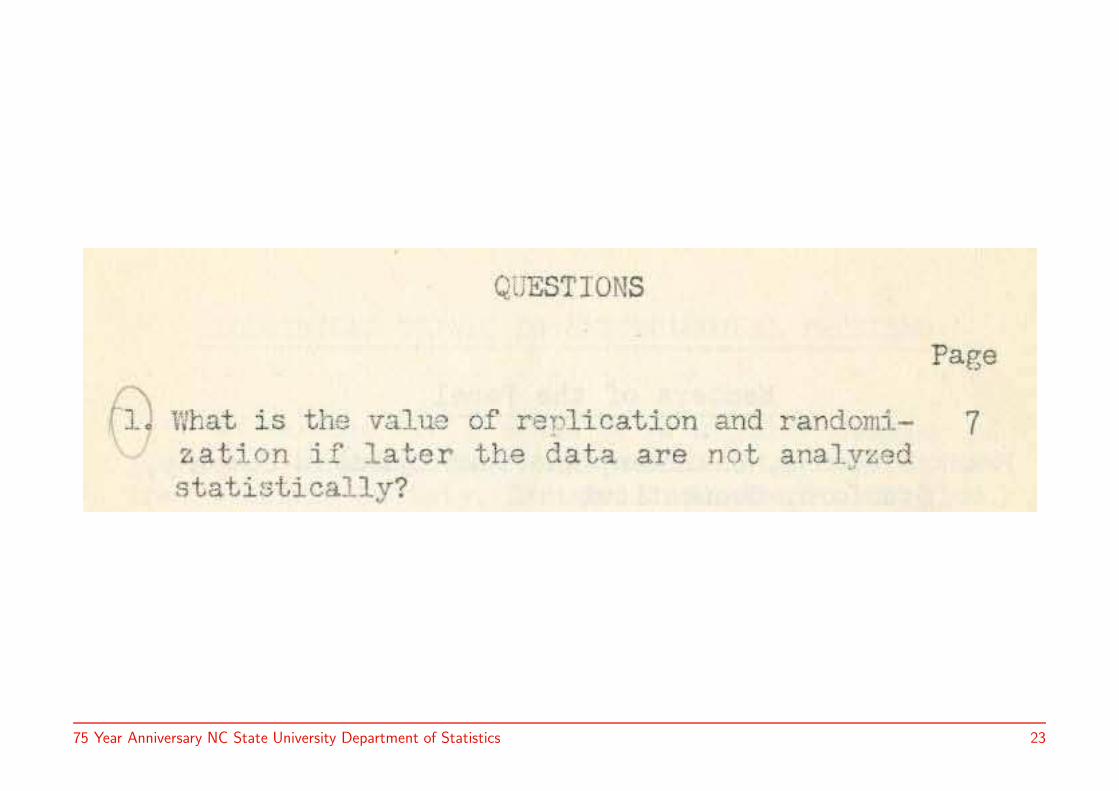
75 Year Anniversary NC State University Department of Statistics 23
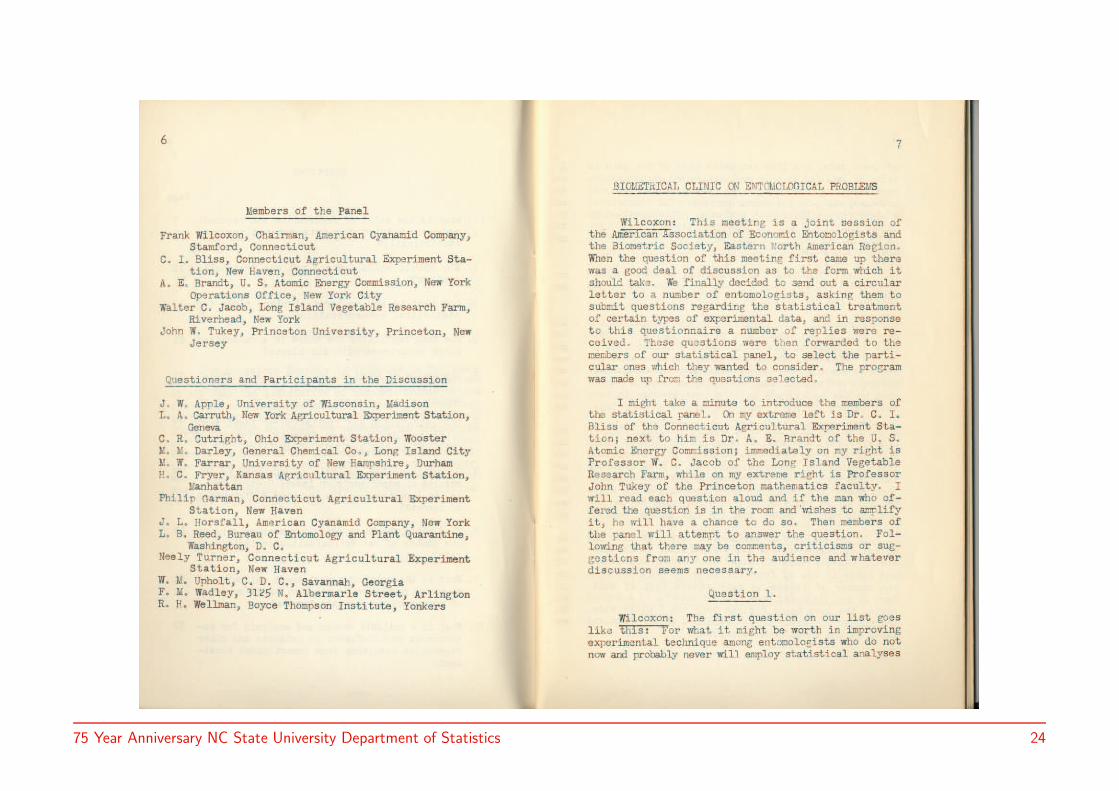
75 Year Anniversary NC State University Department of Statistics 24
Theme II
Incomplete Data: A Case in Point
75 Year Anniversary NC State University Department of Statistics 25
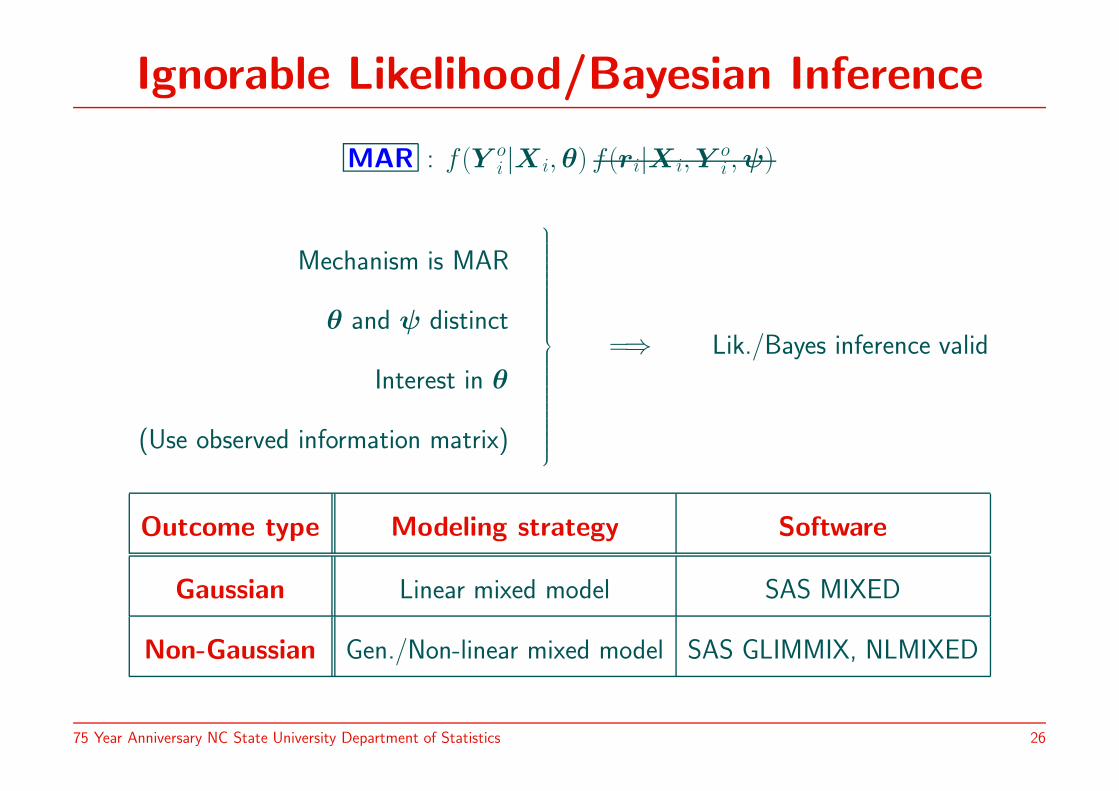
Ignorable Likelihood/Bayesian Inference
MAR : f (Y oi |X i, θ) f (ri|X i,Y
oi ,ψ)
Mechanism is MAR
θ and ψ distinct
Interest in θ
(Use observed information matrix)
=⇒ Lik./Bayes inference valid
Outcome type Modeling strategy Software
Gaussian Linear mixed model SAS MIXED
Non-Gaussian Gen./Non-linear mixed model SAS GLIMMIX, NLMIXED
75 Year Anniversary NC State University Department of Statistics 26

Rubin, 1976
• Ignorability: Rubin (Biometrika, 1976): 35 years ago!
• Little and Rubin (1976, 2002)
• Why did it take so long?
75 Year Anniversary NC State University Department of Statistics 27
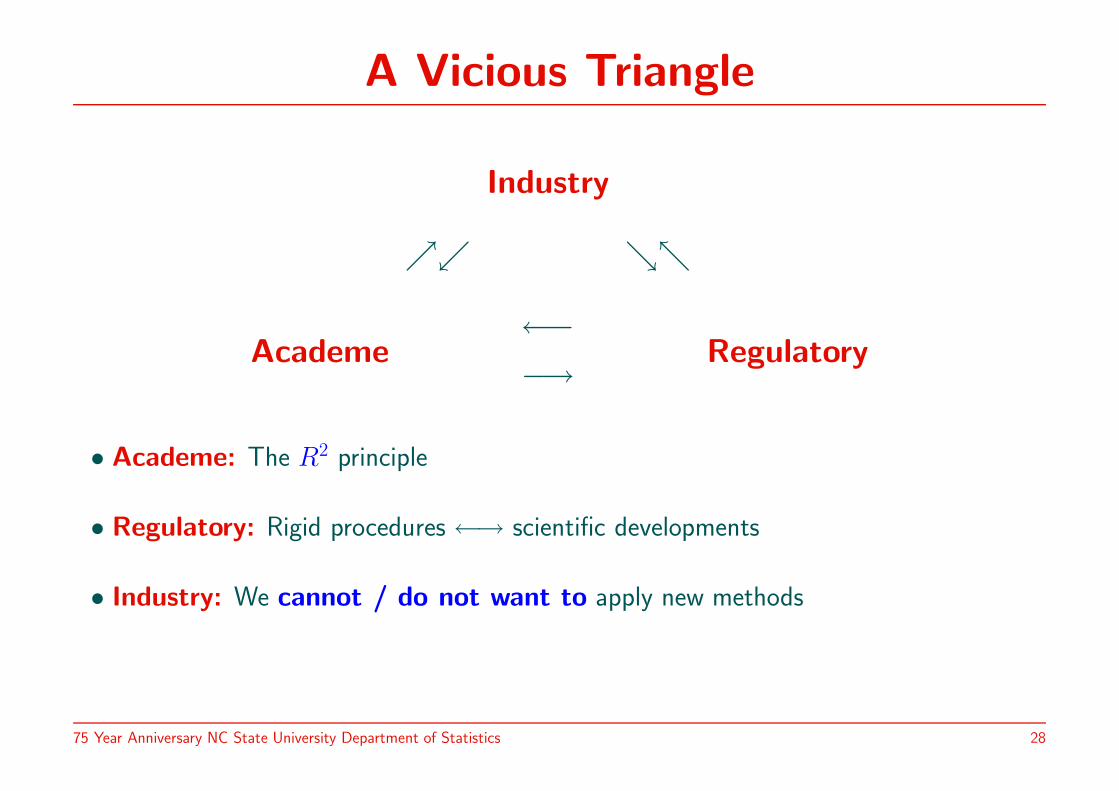
A Vicious Triangle
Industry
↗↙ ↘↖
←−Academe Regulatory
−→
• Academe: The R2 principle
• Regulatory: Rigid procedures ←→ scientific developments
• Industry: We cannot / do not want to apply new methods
75 Year Anniversary NC State University Department of Statistics 28

Terminology & Confusion
• The Ministry of Disinformation:
←− All directions
Other directions −→
•MCAR, MAR, MNAR: “What do the terms mean?”
•MAR, random dropout, informative missingness, ignorable, censoring,. . .
• Dropout from the study, dropout from treatment, lost to follow up,. . .
• “Under MAR patients dropping out and patients not dropping out aresimilar.”
75 Year Anniversary NC State University Department of Statistics 29
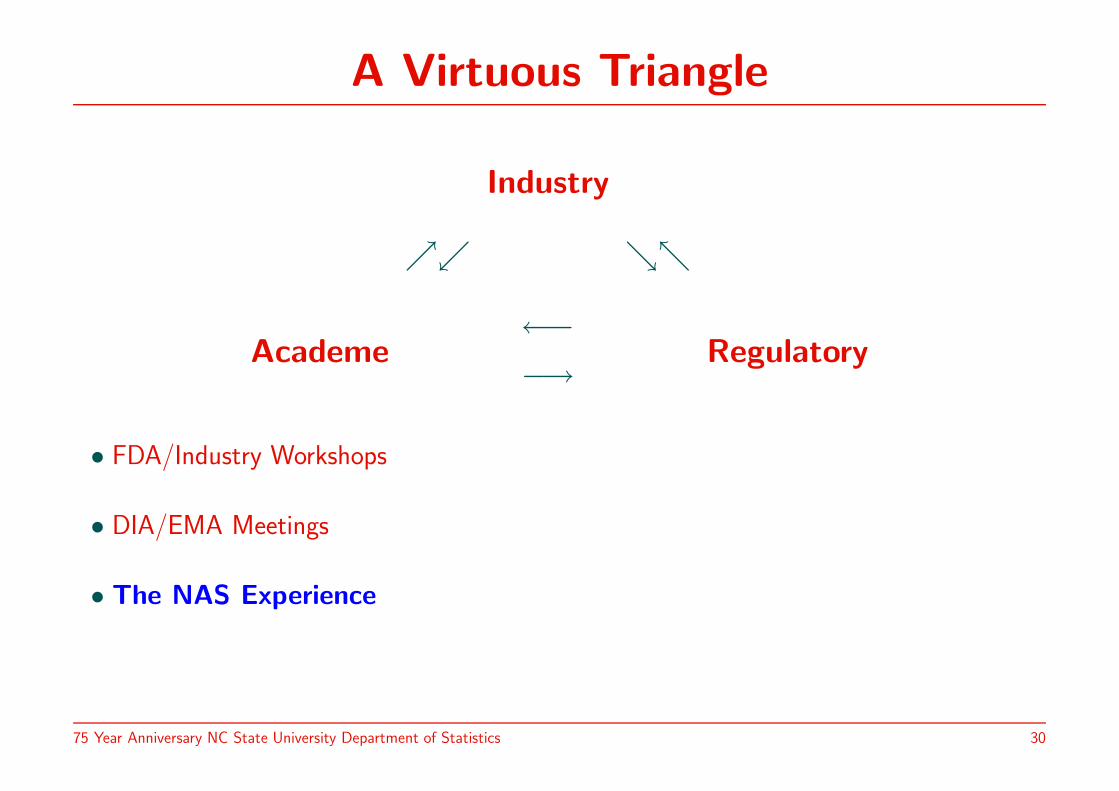
A Virtuous Triangle
Industry
↗↙ ↘↖
←−Academe Regulatory
−→
• FDA/Industry Workshops
• DIA/EMA Meetings
• The NAS Experience
75 Year Anniversary NC State University Department of Statistics 30

The NAS Experience: A WholesomeProduct
• FDA −→ NAS −→ the working group
• Composition
• Encompassing:
. terminology/taxonomy/concepts
. prevention
. treatment
75 Year Anniversary NC State University Department of Statistics 31

Taxonomy
•Missingness pattern: complete — monotone — non-monotone
• Dropout pattern: complete — dropout — intermittent
•Model framework: SEM — PMM — SPM
•Missingness mechanism: MCAR — MAR — MNAR
• Ignorability: ignorable — non-ignorable
• Inference paradigm: frequentist — likelihood — Bayes
75 Year Anniversary NC State University Department of Statistics 32
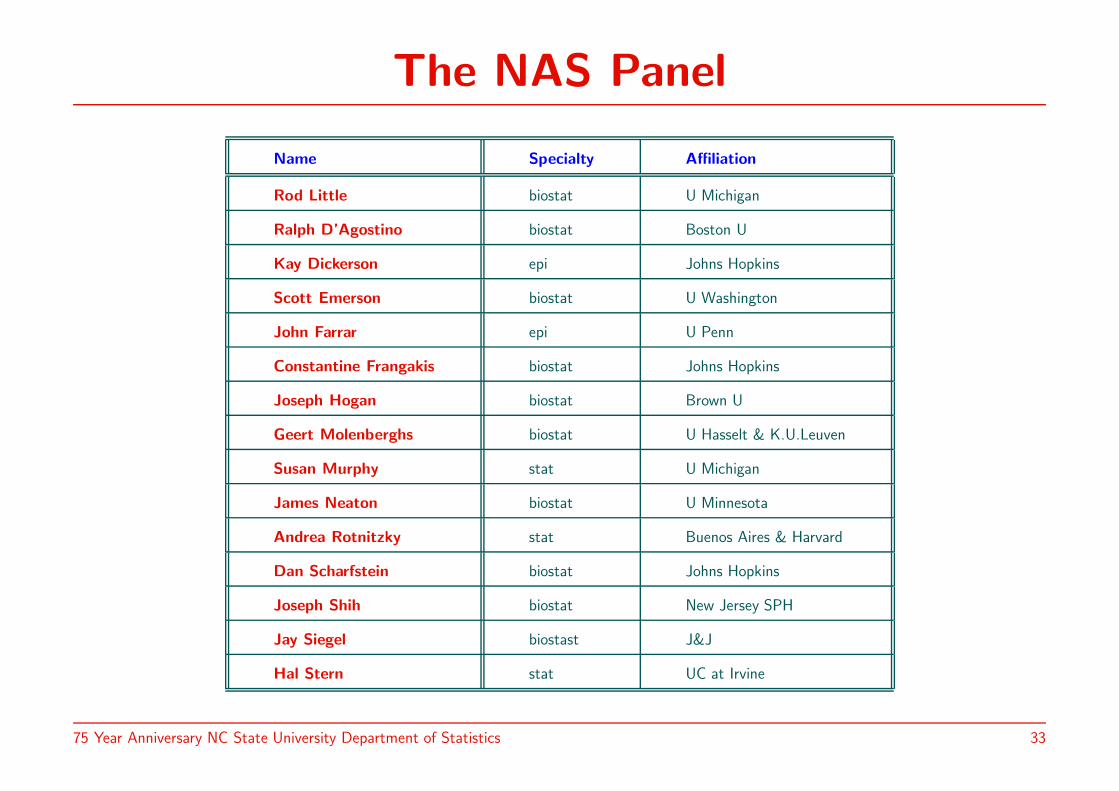
The NAS Panel
Name Specialty Affiliation
Rod Little biostat U Michigan
Ralph D’Agostino biostat Boston U
Kay Dickerson epi Johns Hopkins
Scott Emerson biostat U Washington
John Farrar epi U Penn
Constantine Frangakis biostat Johns Hopkins
Joseph Hogan biostat Brown U
Geert Molenberghs biostat U Hasselt & K.U.Leuven
Susan Murphy stat U Michigan
James Neaton biostat U Minnesota
Andrea Rotnitzky stat Buenos Aires & Harvard
Dan Scharfstein biostat Johns Hopkins
Joseph Shih biostat New Jersey SPH
Jay Siegel biostast J&J
Hal Stern stat UC at Irvine
75 Year Anniversary NC State University Department of Statistics 33
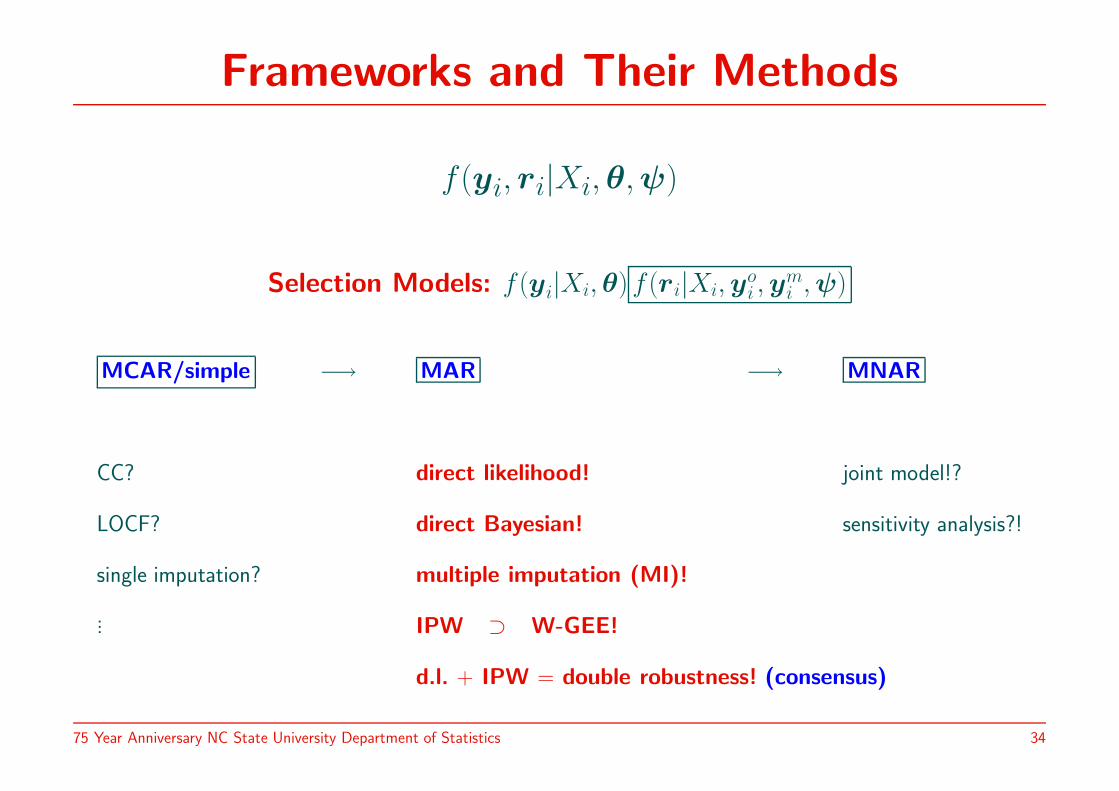
Frameworks and Their Methods
f (yi, ri|Xi,θ,ψ)
Selection Models: f (yi|Xi, θ) f (ri|Xi,yoi ,y
mi ,ψ)
MCAR/simple −→ MAR −→ MNAR
CC? direct likelihood! joint model!?
LOCF? direct Bayesian! sensitivity analysis?!
single imputation? multiple imputation (MI)!
... IPW ⊃ W-GEE!
d.l. + IPW = double robustness! (consensus)
75 Year Anniversary NC State University Department of Statistics 34
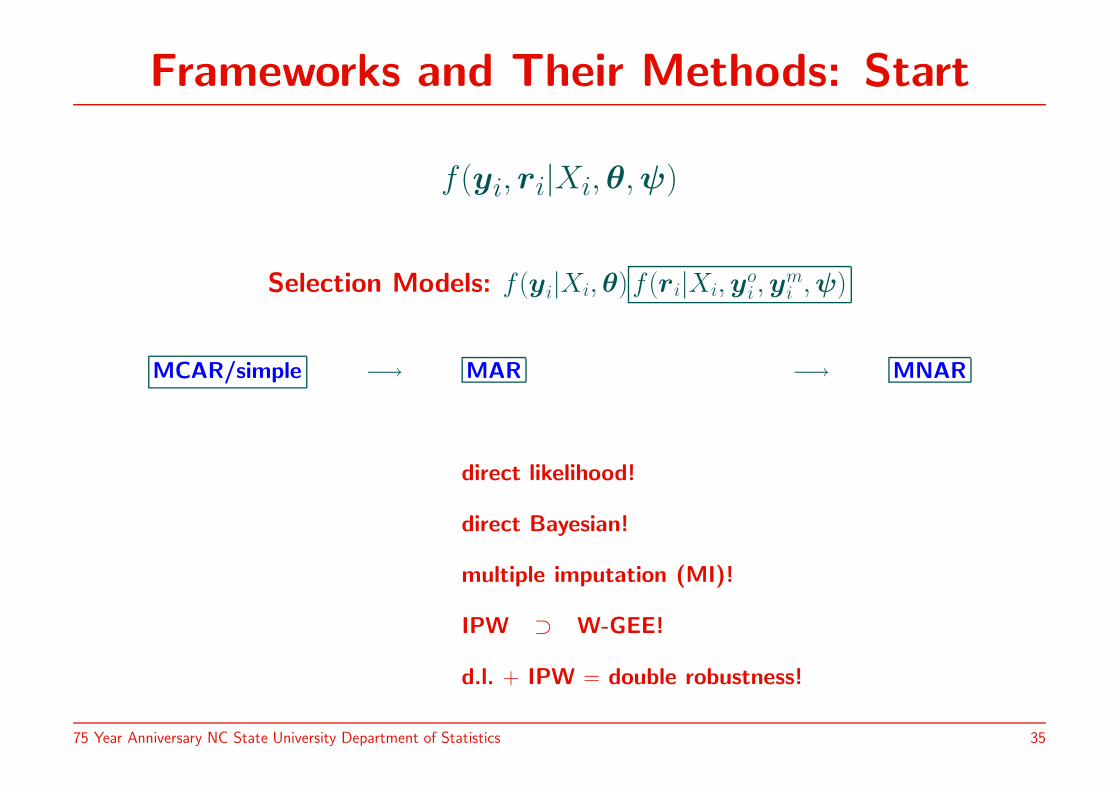
Frameworks and Their Methods: Start
f (yi, ri|Xi,θ,ψ)
Selection Models: f (yi|Xi, θ) f (ri|Xi,yoi ,y
mi ,ψ)
MCAR/simple −→ MAR −→ MNAR
direct likelihood!
direct Bayesian!
multiple imputation (MI)!
IPW ⊃ W-GEE!
d.l. + IPW = double robustness!
75 Year Anniversary NC State University Department of Statistics 35
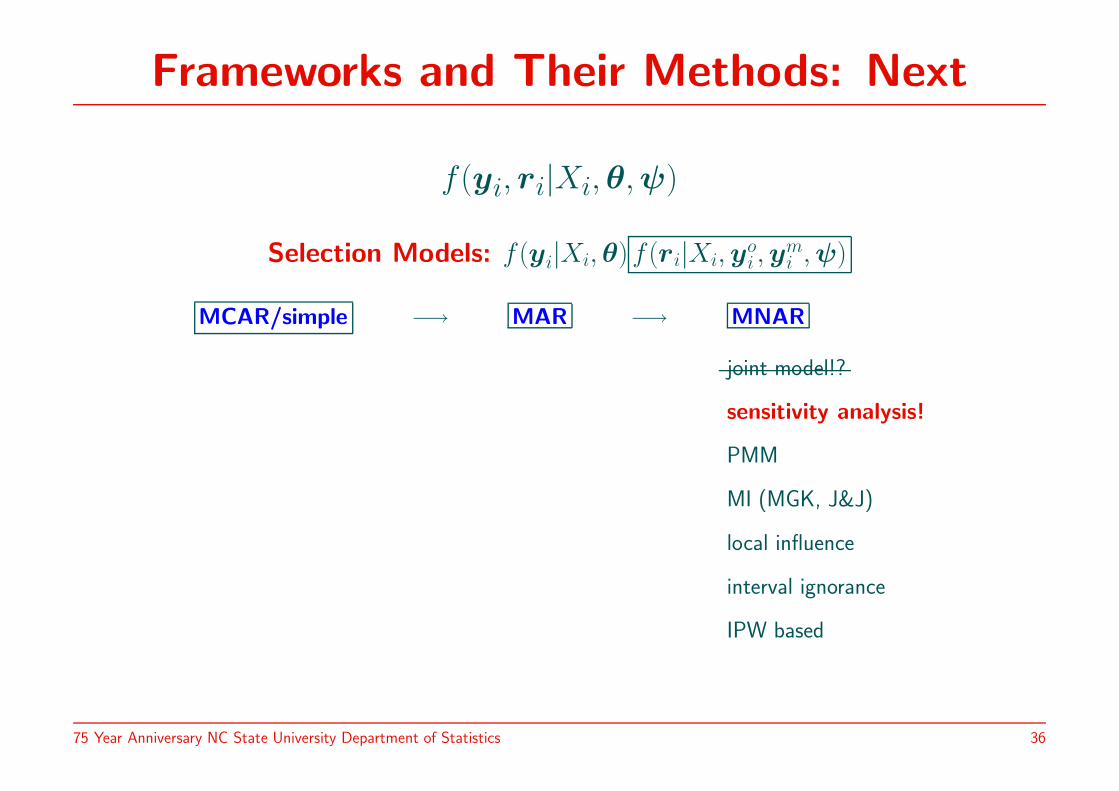
Frameworks and Their Methods: Next
f (yi, ri|Xi,θ,ψ)
Selection Models: f (yi|Xi, θ) f (ri|Xi,yoi ,y
mi ,ψ)
MCAR/simple −→ MAR −→ MNAR
joint model!?
sensitivity analysis!
PMM
MI (MGK, J&J)
local influence
interval ignorance
IPW based
75 Year Anniversary NC State University Department of Statistics 36

Theme III
Research Integrity
75 Year Anniversary NC State University Department of Statistics 37
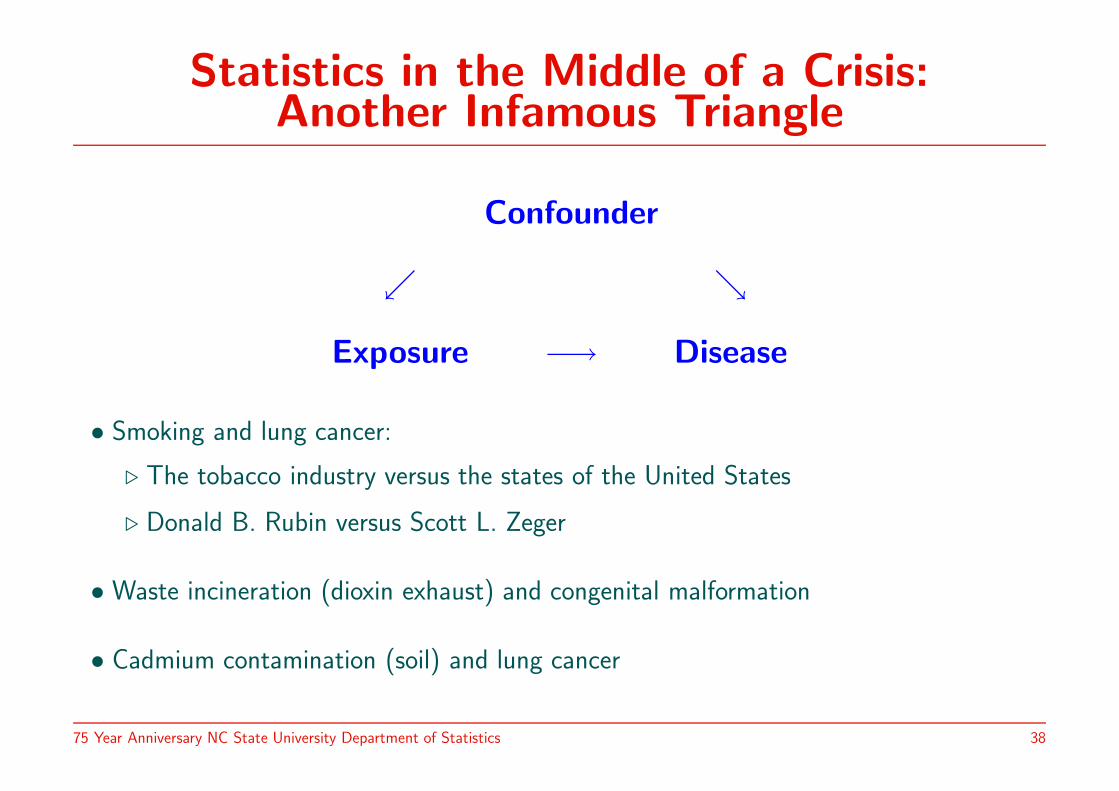
Statistics in the Middle of a Crisis:Another Infamous Triangle
Confounder
↙ ↘
Exposure −→ Disease
• Smoking and lung cancer:
. The tobacco industry versus the states of the United States
. Donald B. Rubin versus Scott L. Zeger
• Waste incineration (dioxin exhaust) and congenital malformation
• Cadmium contamination (soil) and lung cancer
75 Year Anniversary NC State University Department of Statistics 38
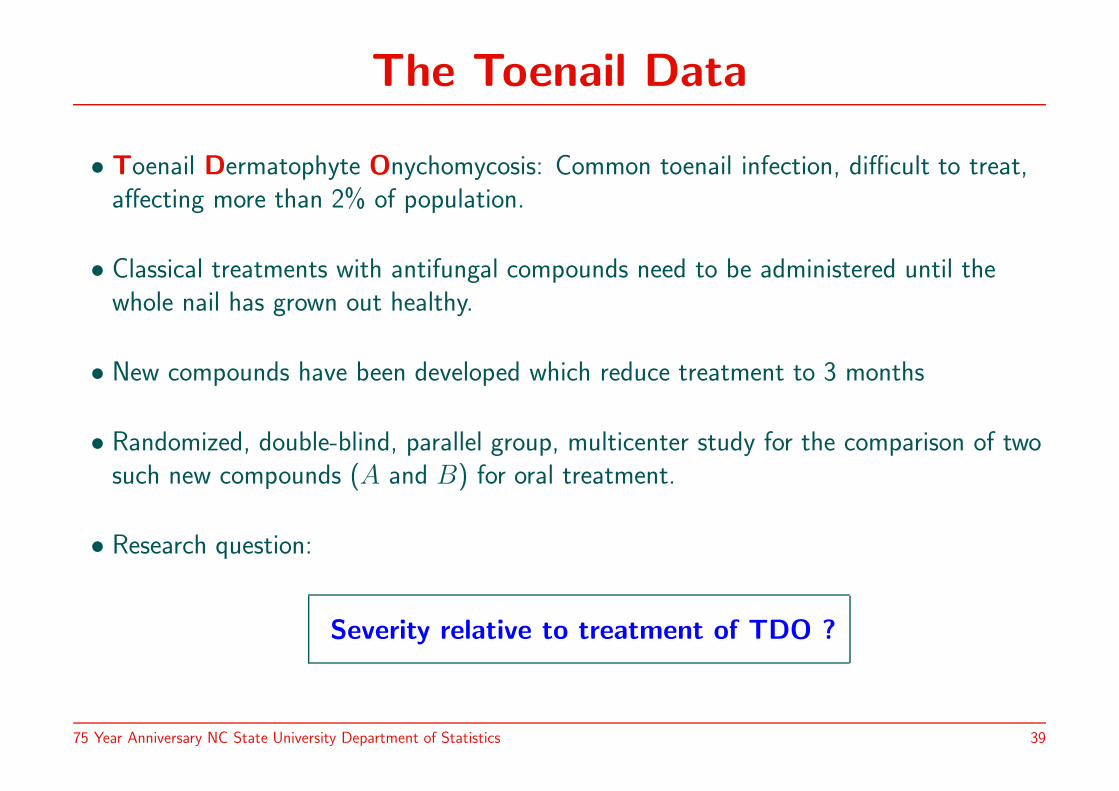
The Toenail Data
• Toenail Dermatophyte Onychomycosis: Common toenail infection, difficult to treat,affecting more than 2% of population.
• Classical treatments with antifungal compounds need to be administered until thewhole nail has grown out healthy.
• New compounds have been developed which reduce treatment to 3 months
• Randomized, double-blind, parallel group, multicenter study for the comparison of twosuch new compounds (A and B) for oral treatment.
• Research question:
Severity relative to treatment of TDO ?
75 Year Anniversary NC State University Department of Statistics 39
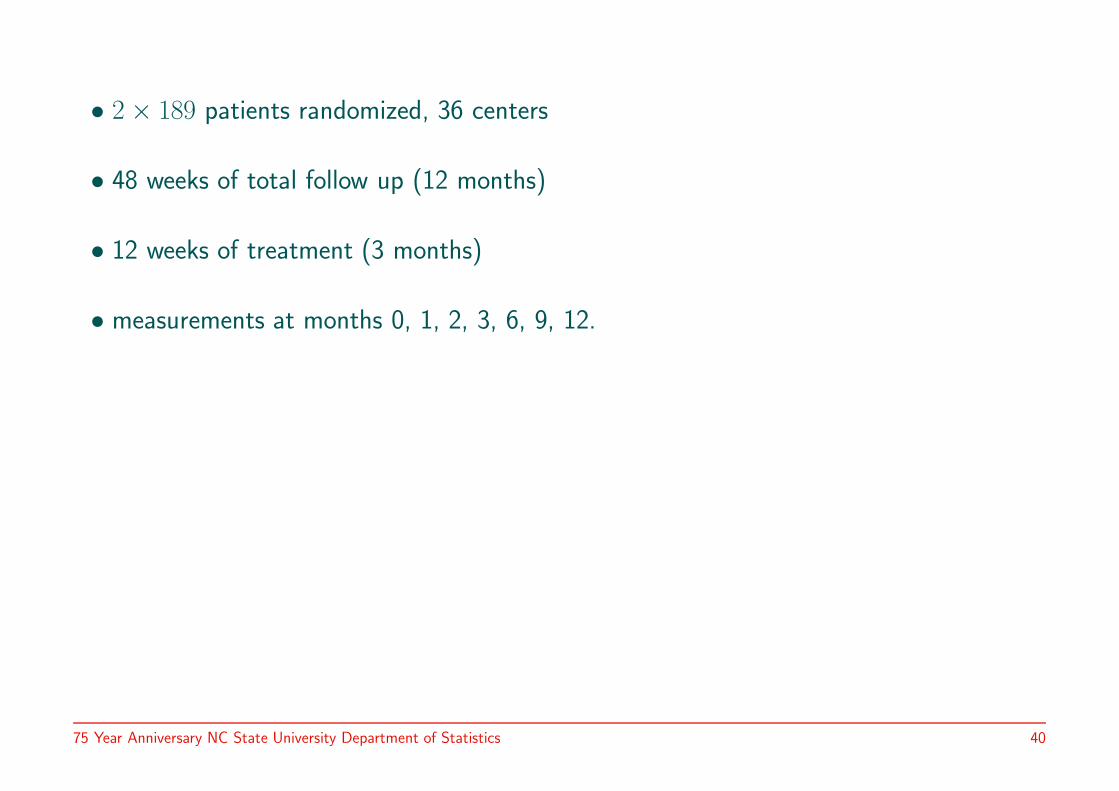
• 2× 189 patients randomized, 36 centers
• 48 weeks of total follow up (12 months)
• 12 weeks of treatment (3 months)
• measurements at months 0, 1, 2, 3, 6, 9, 12.
75 Year Anniversary NC State University Department of Statistics 40
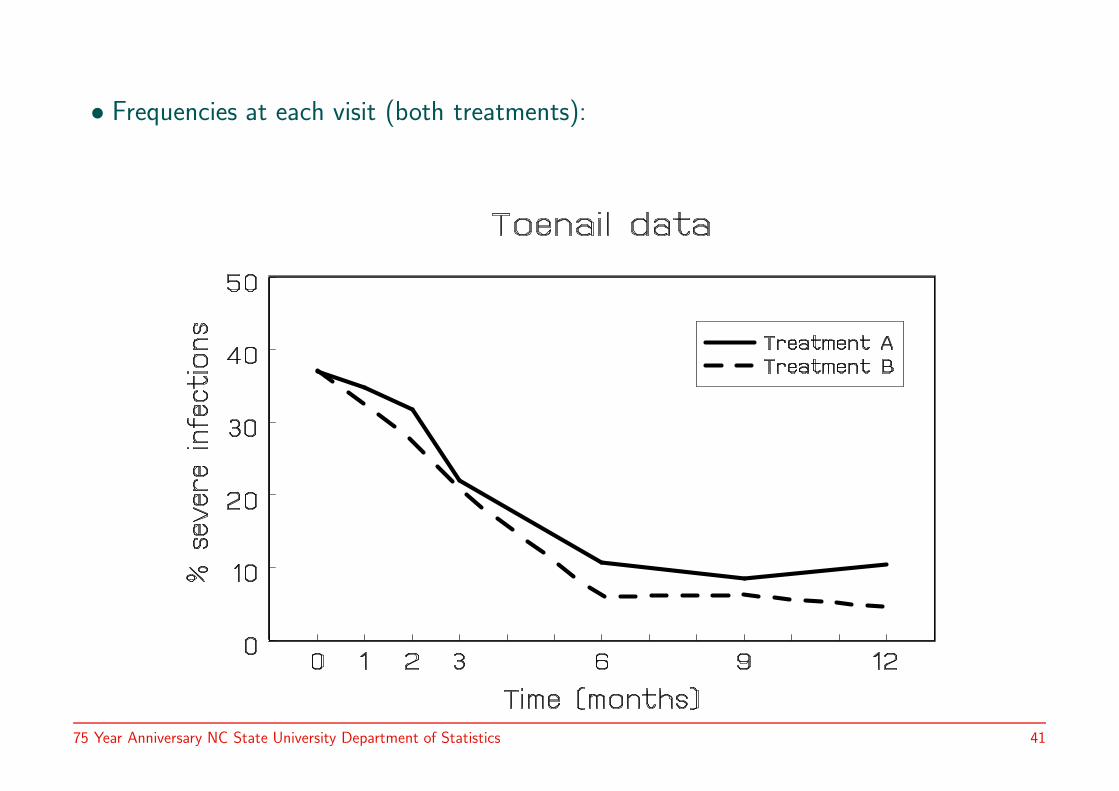
• Frequencies at each visit (both treatments):
75 Year Anniversary NC State University Department of Statistics 41
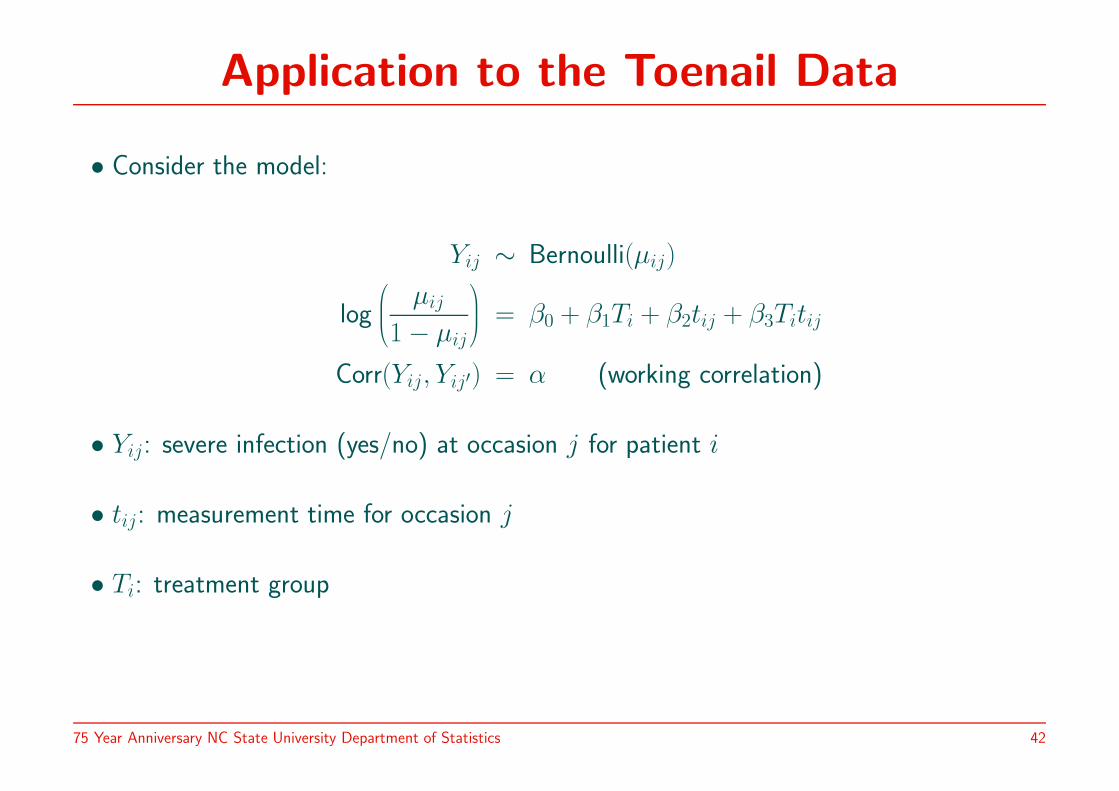
Application to the Toenail Data
• Consider the model:
Yij ∼ Bernoulli(µij)
log
µij
1− µij
= β0 + β1Ti + β2tij + β3Titij
Corr(Yij, Yij′) = α (working correlation)
• Yij: severe infection (yes/no) at occasion j for patient i
• tij: measurement time for occasion j
• Ti: treatment group
75 Year Anniversary NC State University Department of Statistics 42

Standard GEE
• SAS Code:
proc genmod/gee data=test descending;
class idnum timeclss;
model onyresp = treatn time treatn*time
/ dist=binomial;
repeated subject=idnum / withinsubject=timeclss
type=exch covb corrw modelse;
run;
• Selected output:
. Regression parameters:
Analysis Of Initial Parameter Estimates
Standard Wald 95% Chi-
Parameter DF Estimate Error Confidence Limits Square
Intercept 1 -0.5571 0.1090 -0.7708 -0.3433 26.10
treatn 1 0.0240 0.1565 -0.2827 0.3307 0.02
time 1 -0.1769 0.0246 -0.2251 -0.1288 51.91
treatn*time 1 -0.0783 0.0394 -0.1556 -0.0010 3.95
Scale 0 1.0000 0.0000 1.0000 1.0000
75 Year Anniversary NC State University Department of Statistics 43
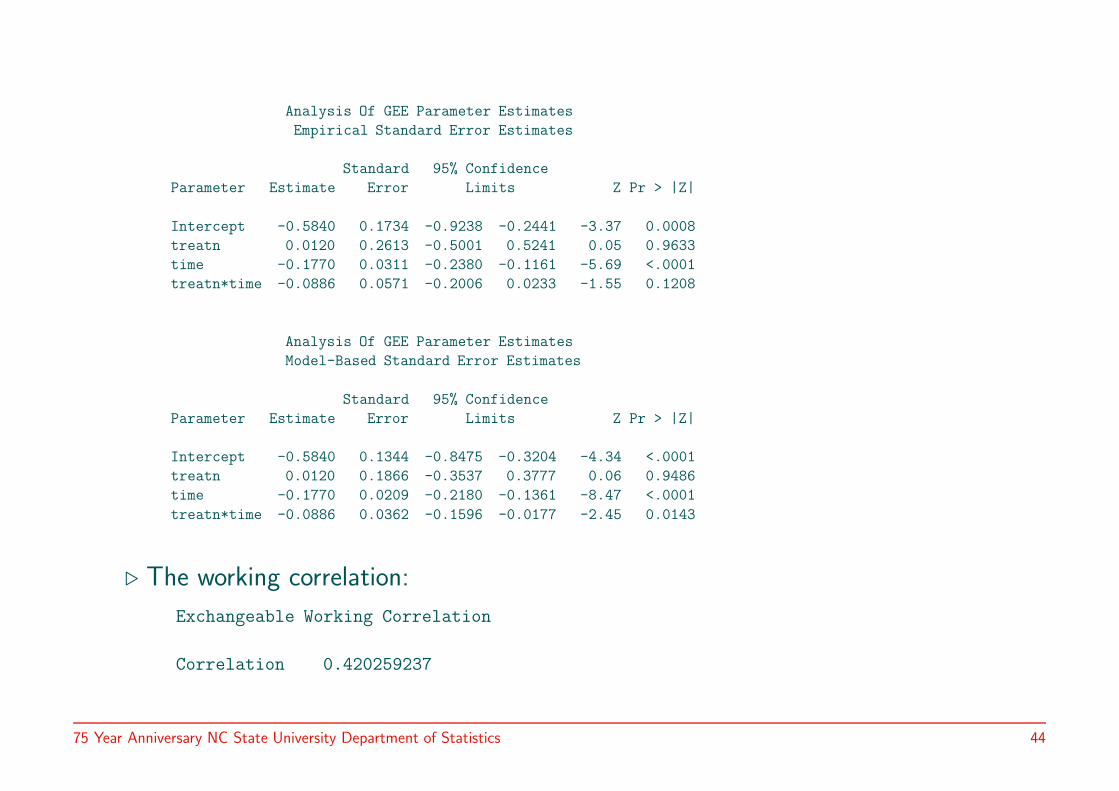
Analysis Of GEE Parameter Estimates
Empirical Standard Error Estimates
Standard 95% Confidence
Parameter Estimate Error Limits Z Pr > |Z|
Intercept -0.5840 0.1734 -0.9238 -0.2441 -3.37 0.0008
treatn 0.0120 0.2613 -0.5001 0.5241 0.05 0.9633
time -0.1770 0.0311 -0.2380 -0.1161 -5.69 <.0001
treatn*time -0.0886 0.0571 -0.2006 0.0233 -1.55 0.1208
Analysis Of GEE Parameter Estimates
Model-Based Standard Error Estimates
Standard 95% Confidence
Parameter Estimate Error Limits Z Pr > |Z|
Intercept -0.5840 0.1344 -0.8475 -0.3204 -4.34 <.0001
treatn 0.0120 0.1866 -0.3537 0.3777 0.06 0.9486
time -0.1770 0.0209 -0.2180 -0.1361 -8.47 <.0001
treatn*time -0.0886 0.0362 -0.1596 -0.0177 -2.45 0.0143
. The working correlation:
Exchangeable Working Correlation
Correlation 0.420259237
75 Year Anniversary NC State University Department of Statistics 44
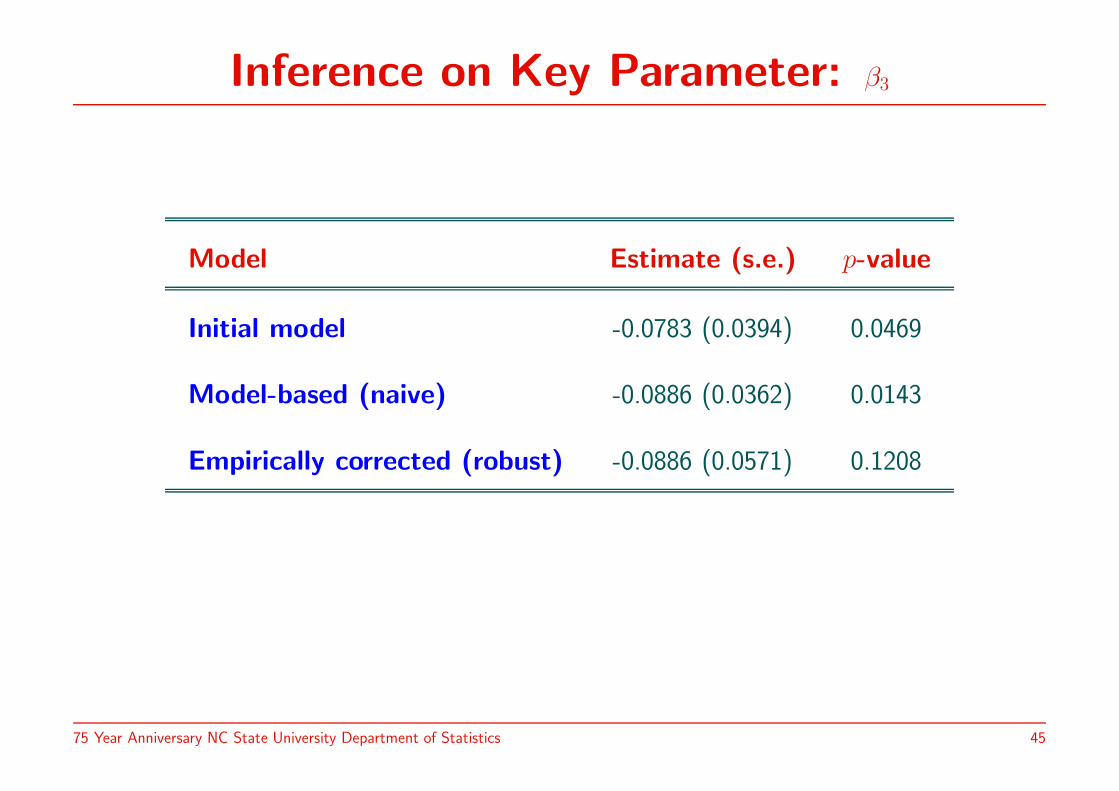
Inference on Key Parameter: β3
Model Estimate (s.e.) p-value
Initial model -0.0783 (0.0394) 0.0469
Model-based (naive) -0.0886 (0.0362) 0.0143
Empirically corrected (robust) -0.0886 (0.0571) 0.1208
75 Year Anniversary NC State University Department of Statistics 45
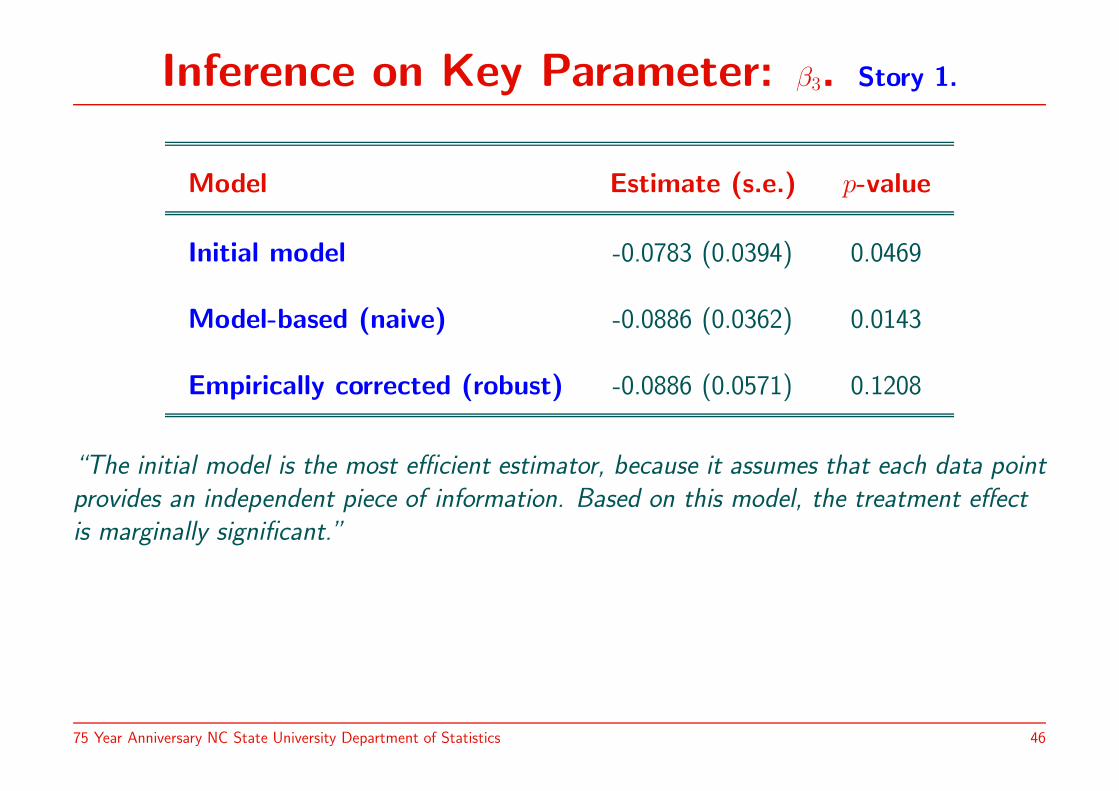
Inference on Key Parameter: β3. Story 1.
Model Estimate (s.e.) p-value
Initial model -0.0783 (0.0394) 0.0469
Model-based (naive) -0.0886 (0.0362) 0.0143
Empirically corrected (robust) -0.0886 (0.0571) 0.1208
“The initial model is the most efficient estimator, because it assumes that each data point
provides an independent piece of information. Based on this model, the treatment effect
is marginally significant.”
75 Year Anniversary NC State University Department of Statistics 46
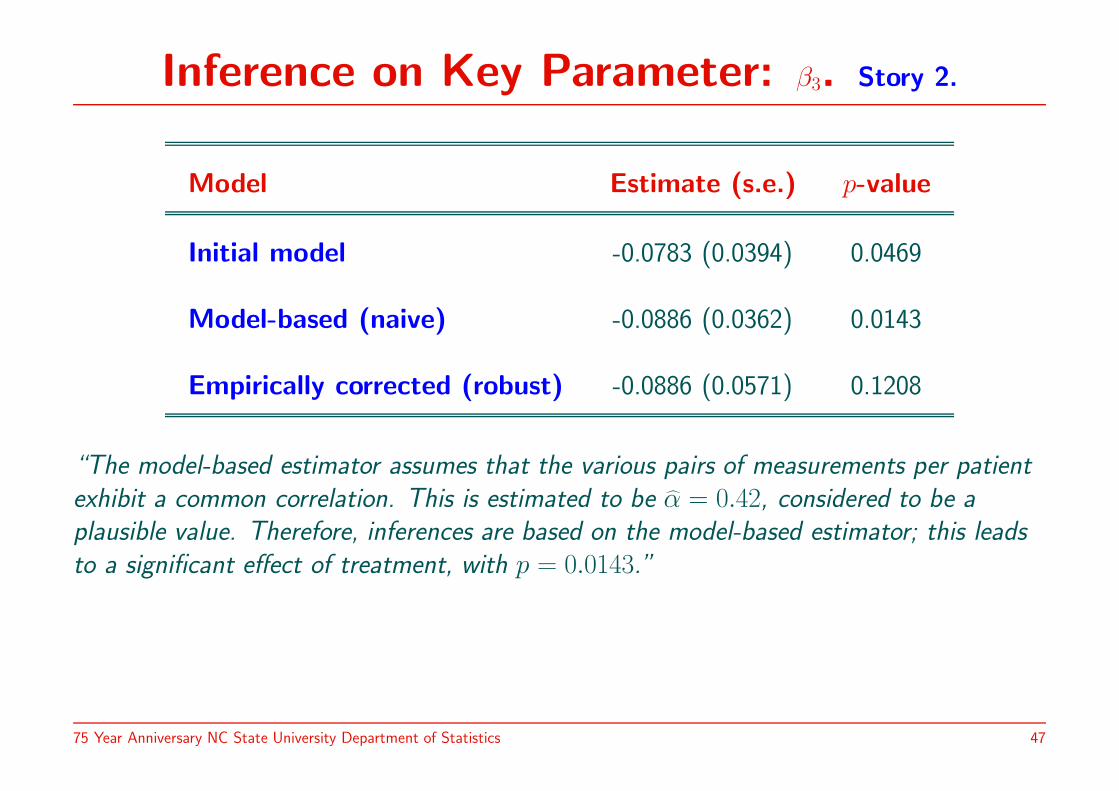
Inference on Key Parameter: β3. Story 2.
Model Estimate (s.e.) p-value
Initial model -0.0783 (0.0394) 0.0469
Model-based (naive) -0.0886 (0.0362) 0.0143
Empirically corrected (robust) -0.0886 (0.0571) 0.1208
“The model-based estimator assumes that the various pairs of measurements per patient
exhibit a common correlation. This is estimated to be α = 0.42, considered to be a
plausible value. Therefore, inferences are based on the model-based estimator; this leads
to a significant effect of treatment, with p = 0.0143.”
75 Year Anniversary NC State University Department of Statistics 47
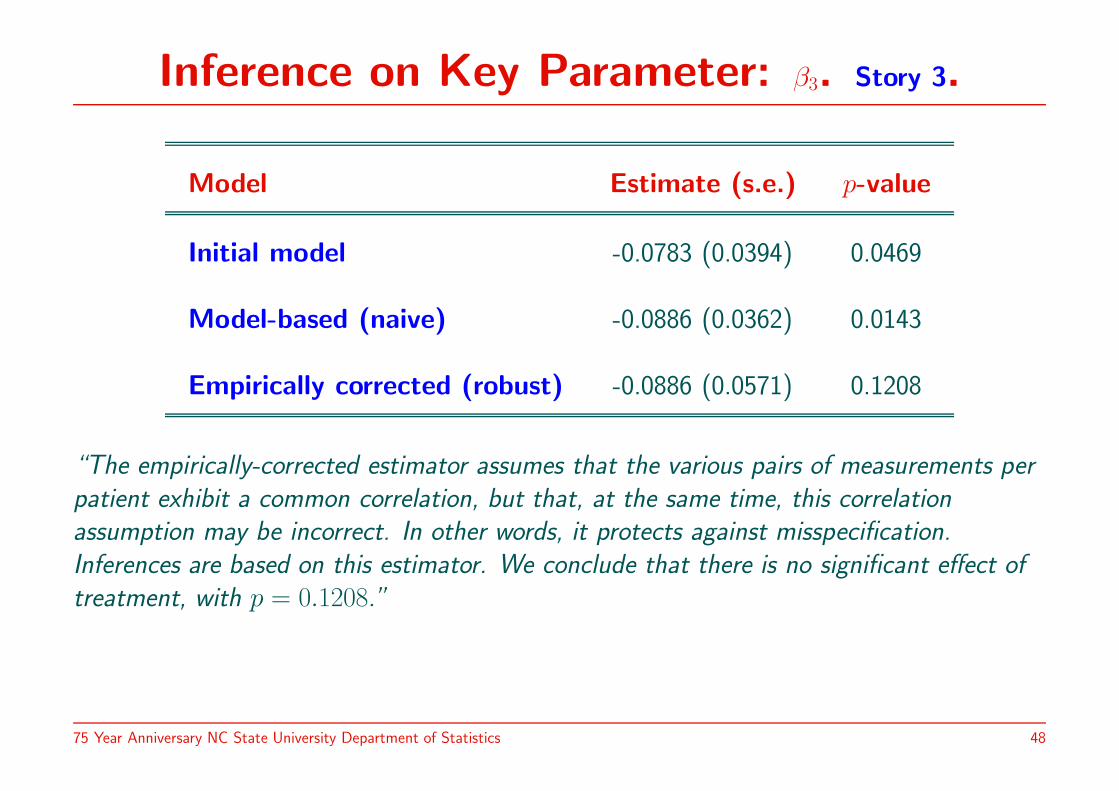
Inference on Key Parameter: β3. Story 3.
Model Estimate (s.e.) p-value
Initial model -0.0783 (0.0394) 0.0469
Model-based (naive) -0.0886 (0.0362) 0.0143
Empirically corrected (robust) -0.0886 (0.0571) 0.1208
“The empirically-corrected estimator assumes that the various pairs of measurements per
patient exhibit a common correlation, but that, at the same time, this correlation
assumption may be incorrect. In other words, it protects against misspecification.
Inferences are based on this estimator. We conclude that there is no significant effect of
treatment, with p = 0.1208.”
75 Year Anniversary NC State University Department of Statistics 48
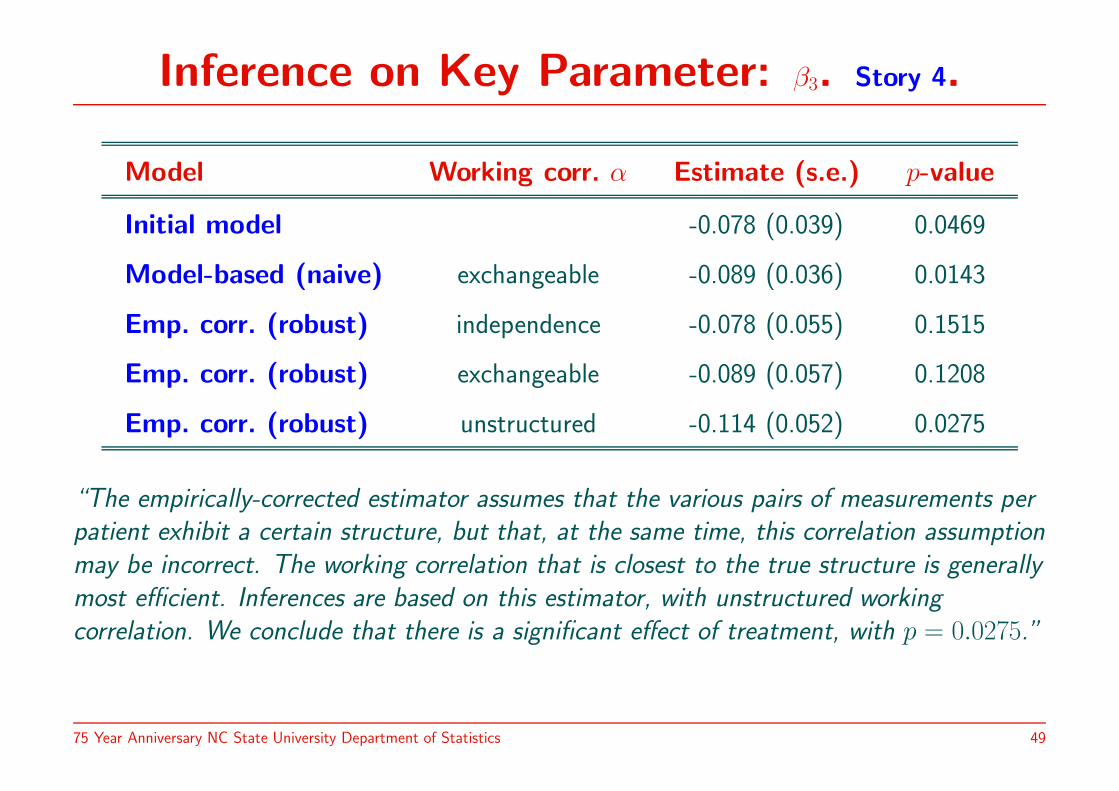
Inference on Key Parameter: β3. Story 4.
Model Working corr. α Estimate (s.e.) p-value
Initial model -0.078 (0.039) 0.0469
Model-based (naive) exchangeable -0.089 (0.036) 0.0143
Emp. corr. (robust) independence -0.078 (0.055) 0.1515
Emp. corr. (robust) exchangeable -0.089 (0.057) 0.1208
Emp. corr. (robust) unstructured -0.114 (0.052) 0.0275
“The empirically-corrected estimator assumes that the various pairs of measurements per
patient exhibit a certain structure, but that, at the same time, this correlation assumption
may be incorrect. The working correlation that is closest to the true structure is generally
most efficient. Inferences are based on this estimator, with unstructured working
correlation. We conclude that there is a significant effect of treatment, with p = 0.0275.”
75 Year Anniversary NC State University Department of Statistics 49

Here is to the NC State Statistics Department!
75 Year Anniversary NC State University Department of Statistics 50


![Anka Jyotish [hindi]](https://img.pdfslide.us/doc/110x75/568c52b01a28ab4916b7b3b9/anka-jyotish-hindi.jpg)