Embed Size (px)
Citation preview
7.0 HURREVAC/Decision Tools
Massachusetts Hurricane Evacuation Study Technical Data Report 7-1
7.1 Decision Tools
7.1.1 Purpose
This chapter describes the HURREVAC computer program. HURREVAC is a hurricane evacuation
decision making tool that uses clearance times in conjunction with National Hurricane Center
(NHC) advisories to help state and local emergency managers determine when and if
evacuations should begin. More information on this program may be found at the HURREVAC
website at www.hurrevac.com.
7.1.2 Background
Hurricanes do not always approach land from a direction perpendicular to the coastline and, in
fact, more frequently cross the coastline on an angular track. In that case, with a hurricane 24
hours from the coast, an error of 10 degrees in the predicted hurricane track can easily mean a
100-mile error in the point of eye landfall.
In the same way, forecast errors can affect the time of landfall. When a hurricane approaches a
coastline at an acute angle, an error in forecast landfall position will cause an error in the
forecast distance it must travel to reach the coast. This could possibly result in a significant
error in forecast time of eye landfall. The forward motion of hurricanes can also accelerate and
decelerate, causing the exact time of landfall to be even more problematic. Prior to mid-1980,
hurricane evacuation decision-making and mobilization was dependent upon forecast time and
location of eye landfall. Because of the potential forecast errors (see Chapter 2, Forecasting
Inaccuracies), a decision aid was needed that would help compensate for those errors by
relating evacuation operations to the overall hurricane threat, rather than focusing on the
location of the eye. The Decision Arc Method was created for that purpose. Originally, a manual
decision making tool, it is now incorporated into hurricane evacuation decision aid software.
Emergency management officials should review all available hurricane evacuation related
software offered today. Some of these programs incorporate hurricane evacuation study data,
including some form of the Decision Arc Method. Computer assistance is nearly indispensable
for performing needed calculations and displaying important information and relationships.
However, emergency management officials should be familiar with the concepts of sound
evacuation decision making and timing and should not rely solely on the outputs of any
hurricane tracking software.
7.0 HURREVAC/Decision Tools
Massachusetts Hurricane Evacuation Study Technical Data Report 7-2
Figure 7-1: HURREVAC
7.2 HURREVAC
7.2.1 History
HURREVAC stands for “HURRicane EVACuation” and is a restricted-use computer program
funded by FEMA and USACE for government emergency managers to track hurricanes and
assist in evacuation decision-making for their communities. This real-time data analysis tool
allows state and local emergency management officials to make prudent and informed
decisions based on information developed during the FEMA Hurricane Evacuation Studies (HES)
process and real-time forecast data distributed by the National Weather Service (NWS) and the
Tropical Prediction Center/National Hurricane Center (NHC).
HURREVAC was originally developed for the State of South Carolina in late 1988 and was first
used in South Carolina and Georgia during the 1989 season for Hurricane Hugo. Through 1996 a
separate program was prepared for each individual HES study area as the storm tide
inundation, sheltering and clearance time data became available. Through the HES process,
stand-alone versions of HURREVAC were developed and used for some study regions
throughout the coastal United States.
7.0 HURREVAC/Decision Tools
Massachusetts Hurricane Evacuation Study Technical Data Report 7-3
Between 1995 and 1997, a companion program, the HURREVAC Inland Winds, was developed
for use by coastal and inland counties alike to address the high wind conditions that can be
generated by a tropical cyclone event. Many of the data and functions in the Inland Winds
program were based in large part on the Wind Decay Model developed by Mark DeMaria and
John Kaplan. The Inland Winds program also served as the prototype for many of the graphics
conventions used in the follow on version of HURREVAC.
The next major platform for HURREVAC was released in 1998 and targeted Windows 95/98/NT.
This consolidated program (called HurWin95) was adaptable for each state through the use of
plug-ins for evacuation times and inundation graphics. It also combined coastal HURREVAC and
the HURREVAC Inland Winds program into one new program.
The scope and capabilities the program continued to grow and several years later it took on a
new name of Hurrevac2000. Hurrevac2000's launch marked the beginning of East and Central
Pacific storm tracking capability as well as the incorporation of rainfall forecasts--the first of a
number of inland flooding tools that have been added over the years.
In 2007 FEMA and USACE, together with Sea Island Software, began to explore HURREVAC
modernization. Users of the program were surveyed and a 5-year strategic plan developed.
Reprogramming of HURREVAC for Microsoft's .NET platform began in 2008 and the
Hurrevac2010 platform fully replaced the old program beginning in 2012.
7.2.2 Overview for Using HURREVAC
HURREVAC is a display program only; it is not a model and therefore does not generate any
information that is not derived from the NHC advisory package. Without the advisory package
from the NHC, HURREVAC lacks the basic information with which to produce any of the tropical
cyclone plots or most of the other decision making data inherent to the program. Marine
advisories on tropical storms are normally issued by the NHC every six hours at the same time
every day, namely at 5 AM, 11 AM, 5 PM and 11 PM during daylight savings time, or 4 AM, 10
AM, 4 PM and 10 PM standard time. As the storm gets within radar range, intermediate
advisories that update the initial positions of the eye are also issued.
HURREVAC tracks hurricanes using the NHC's Forecast Advisories. The software translates
forecast track and wind extent information from the NHC's text-based products into interactive
maps and reports that are used to chart the progress of an advancing storm. The program also
assembles rainfall, flood, tide, and river forecast information from various sources to assist
users in evaluating inland flooding threats.
7.0 HURREVAC/Decision Tools
Massachusetts Hurricane Evacuation Study Technical Data Report 7-4
The most key feature of HURREVAC, however, is its ability to keep to the local emergency
manager apprised of how many hours (or days) a community has for preparation and planning
in advance of a threatening storm. As new forecast information becomes available, HURREVAC
continually updates and reports on the community's evacuation start time, or last possible time
by which an evacuation could be initiated if it is to be completed before the arrival of the storm
hazards.
The decision to evacuate a community is not always an easy or obvious one and the advantage
of fine-tuning the Evacuation Start Time in HURREVAC is that protective action decisions are
based on the closest (and therefore most accurate) projections for the storm track, intensity,
and size. HURREVAC does not make the decision to evacuate, it is merely one tool that state
and local emergency managers and other response officials can use to help in the hurricane
decision-making process. Evacuation decisions are very complex and should only be made after
consultation with all officials involved in the process, from NHC and the Weather Service, to
state and local officials.
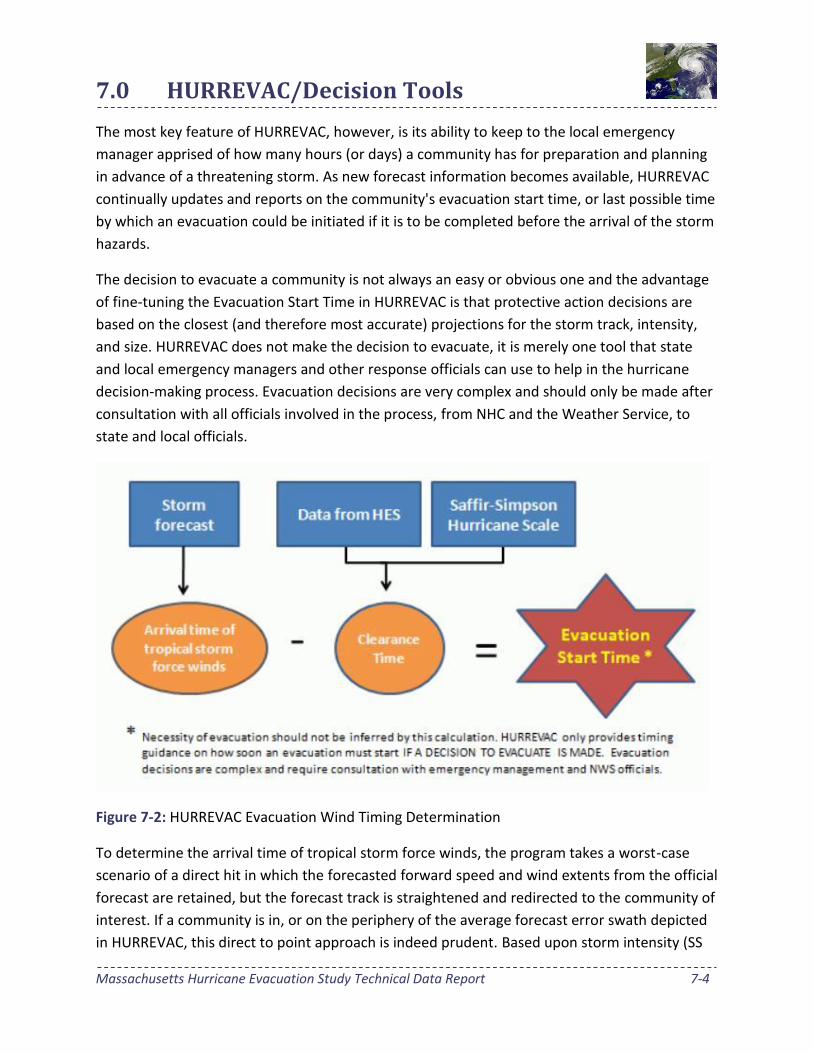
Figure 7-2: HURREVAC Evacuation Wind Timing Determination
To determine the arrival time of tropical storm force winds, the program takes a worst-case
scenario of a direct hit in which the forecasted forward speed and wind extents from the official
forecast are retained, but the forecast track is straightened and redirected to the community of
interest. If a community is in, or on the periphery of the average forecast error swath depicted
in HURREVAC, this direct to point approach is indeed prudent. Based upon storm intensity (SS
7.0 HURREVAC/Decision Tools
Massachusetts Hurricane Evacuation Study Technical Data Report 7-5
Category) and various local factors, a clearance time (or number of hours to evacuate, see
Chapter 6) is selected from a matrix of times extracted from this HES. Subtracting the number
of clearance time hours from the forecast arrival of the first hazards (usually considered the
forecast arrival of tropical storm winds) generates the evacuation start time.
This HURREVAC evacuation start time represents the latest hour an evacuation decision should
be initiated. This time does not take into account the impacts of the storm’s forward movement
speeding up; traffic accidents; major construction on an important evacuation route;
conducting an evacuation during nighttime hours; or any other potential occurrences that may
serve to decrease the amount of operational time or increase clearance times, or both.
7.3 Using HURREVAC: The Basics
7.3.1 Workspace Layout
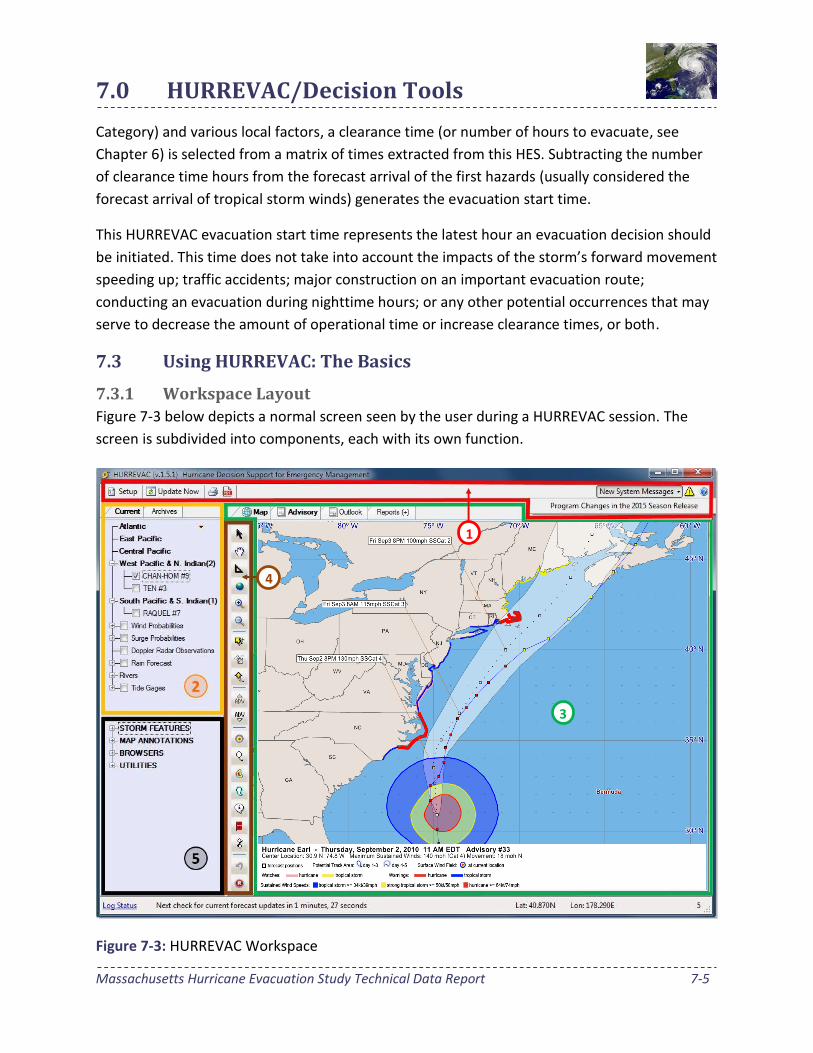
Figure 7-3 below depicts a normal screen seen by the user during a HURREVAC session. The
screen is subdivided into components, each with its own function.
Figure 7-3: HURREVAC Workspace
4
1
3

7.0 HURREVAC/Decision Tools
Massachusetts Hurricane Evacuation Study Technical Data Report 7-6
Program Header (1‐ Red) Includes tools that allow the user to manage program setup, update forecast data, print, and
create a Storm Summary PDF Document. Also includes system messaging capabilities that are
used to broadcast information from HURREVAC’s technical support staff or the National
Hurricane Program when special situations arise having to do with operation of the software.
Current/Archive Data Tabs (2 ‐ Orange) “Current” tab allows user to access current forecast information, including: selecting and
loading a current storm, rainfall forecast data, river gage data, flood outlook data, tide gage
data, Doppler radar observations, probabilistic storm surge data, and wind probability data.
“Archives” tab allows user to access similar data for historic storms and forecasts, along with
saved data files.
Map Display/Data Display Window (3 ‐ Green) Displays map and map legend, forecast text for advisory, tropical weather outlook text, reports
menu, and reports. User can change what is shown using tabs above the window.
Map Tools (4 ‐ Brown) Allows user to control what is shown in the “Map Display Window”. Options include zoom
in/zoom out, pan, zoom to user pre‐defined map views, measure distances, move storm along
forecast track, change advisories, turn on/off wind and potential track graphics, turn on/off
advisory labels and watch/warning graphics, turn on /off 120‐hr wind speed probabilities, move
back and forward through previous map views, and reset map graphics. This area is covered in
more detail in section 7.3.2 below.
Toolbox (5 ‐ Black) Allows user to access additional map display options, add annotation to the map display, access
evacuation clearance time and storm surge map browsers, change evacuation options settings,
access the clearance time arc, and export/import applicable data, among other
options/functions.
7.3.2 Map Tools
Moving the mouse over a button in HURREVAC will cause a pop‐up annotation to appear with a
description of the specific map tool function. Many of the important functions and capabilities,
including map navigation, are found along the side of the main map display. Table 7-1 below
details the various buttons and their accompanying features.

7.0 HURREVAC/Decision Tools
Massachusetts Hurricane Evacuation Study Technical Data Report 7-7
Table 7-1: Map Tools and Function Descriptions
7.3.3 Context menu and Shortcut Keys
Right mouse button clicking inside the main menu accesses a context menu that gives the user more functions and display options. Keyboard shortcuts are also available for certain functions noted below as (CTRL). Table 7-2 below lists the functions and capabilities that can be accessed.
Zoom (Black Arrow): Draw a box on map with left mouse button to zoom in
Pan (White Hand): Move the map by holding down left mouse button and moving mouse
Measure (Triangle): To measure distance, click left mouse button on map at start/end point
Map Extent (Globe): Toggle between user defined full (left click) and local (right click) map view
Zoom In/Out (Magnifying Glass with + or – symbol): Left click to zoom in/out 20% of current view, right click to zoom in/out 40% of current view
Move storm graphics and legend data forward or back within the forecast period for the current loaded storm and advisory (Yellow Arrows): Left click to move forward/back 1 hour, right click to move forward/back 6 hours. Bottom button moves storm forward automatically.
Change Advisory (ADV with up/down arrows): These buttons cycle through previous or historic advisories for the storm you have loaded. Left click to move forward or back 1 advisory. Right click to move forward or back 3 advisories.
Hourly Forecast: Turn on/off the hourly wind field (Colored Circle) or potential location showing forecast uncertainty (White Circle). See legend in map display window for more details.
Entire Forecast: Turn on/off 72 hour wind forecast (Colored Swath) or potential track (White Cone) here there is a 66% chance that the center of the storm will pass through during the next 3 (white) or 5 (hollow) days.
Advisory Labels (Text Bubble): Left click for advisory labels on map. Right click for label settings.
Watches/Warnings (Warning Flag): Left Click to add watch/warning graphics to map
Wind Probability Locations (Percent Sign): Show location based probability labels on map
Forward and Back (Blue Arrow): Left click to cycle back through previous map views and right click to cycle forward through previous map views.
Reset (Red Circle): Left click to restore map display to default graphics. Right click to configure your own defaults.
7.0 HURREVAC/Decision Tools
Massachusetts Hurricane Evacuation Study Technical Data Report 7-8
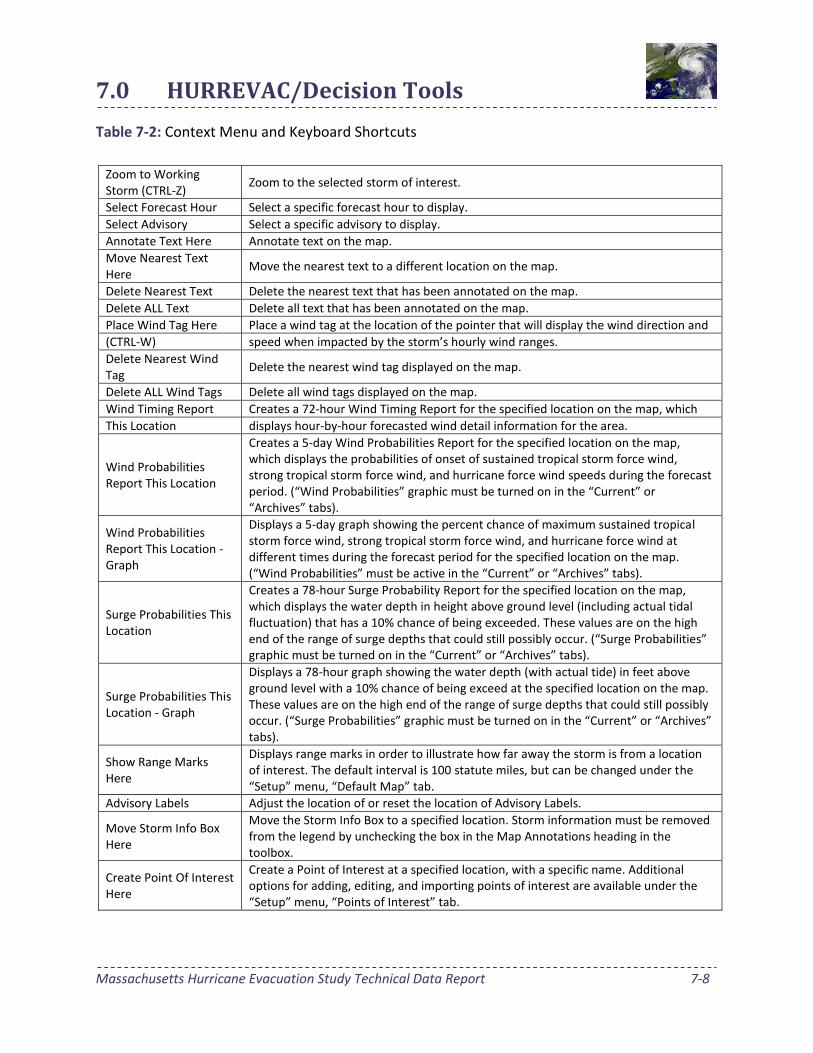
Table 7-2: Context Menu and Keyboard Shortcuts
Zoom to Working Storm (CTRL‐Z)
Zoom to the selected storm of interest.
Select Forecast Hour Select a specific forecast hour to display.
Select Advisory Select a specific advisory to display.
Annotate Text Here Annotate text on the map.
Move Nearest Text Here
Move the nearest text to a different location on the map.
Delete Nearest Text Delete the nearest text that has been annotated on the map.
Delete ALL Text Delete all text that has been annotated on the map.
Place Wind Tag Here Place a wind tag at the location of the pointer that will display the wind direction and
(CTRL‐W) speed when impacted by the storm’s hourly wind ranges.
Delete Nearest Wind Tag
Delete the nearest wind tag displayed on the map.
Delete ALL Wind Tags Delete all wind tags displayed on the map.
Wind Timing Report Creates a 72‐hour Wind Timing Report for the specified location on the map, which
This Location displays hour‐by‐hour forecasted wind detail information for the area.
Wind Probabilities Report This Location
Creates a 5‐day Wind Probabilities Report for the specified location on the map, which displays the probabilities of onset of sustained tropical storm force wind, strong tropical storm force wind, and hurricane force wind speeds during the forecast period. (“Wind Probabilities” graphic must be turned on in the “Current” or “Archives” tabs).
Wind Probabilities Report This Location ‐Graph
Displays a 5‐day graph showing the percent chance of maximum sustained tropical storm force wind, strong tropical storm force wind, and hurricane force wind at different times during the forecast period for the specified location on the map. (“Wind Probabilities” must be active in the “Current” or “Archives” tabs).
Surge Probabilities This Location
Creates a 78‐hour Surge Probability Report for the specified location on the map, which displays the water depth in height above ground level (including actual tidal fluctuation) that has a 10% chance of being exceeded. These values are on the high end of the range of surge depths that could still possibly occur. (“Surge Probabilities” graphic must be turned on in the “Current” or “Archives” tabs).
Surge Probabilities This Location ‐ Graph
Displays a 78‐hour graph showing the water depth (with actual tide) in feet above ground level with a 10% chance of being exceed at the specified location on the map. These values are on the high end of the range of surge depths that could still possibly occur. (“Surge Probabilities” graphic must be turned on in the “Current” or “Archives” tabs).
Show Range Marks Here
Displays range marks in order to illustrate how far away the storm is from a location of interest. The default interval is 100 statute miles, but can be changed under the “Setup” menu, “Default Map” tab.
Advisory Labels Adjust the location of or reset the location of Advisory Labels.
Move Storm Info Box Here
Move the Storm Info Box to a specified location. Storm information must be removed from the legend by unchecking the box in the Map Annotations heading in the toolbox.
Create Point Of Interest Here
Create a Point of Interest at a specified location, with a specific name. Additional options for adding, editing, and importing points of interest are available under the “Setup” menu, “Points of Interest” tab.

7.0 HURREVAC/Decision Tools
Massachusetts Hurricane Evacuation Study Technical Data Report 7-9
7.4 HURREVAC Program Setup The “Setup” function can be accessed from a button
in the upper left hand corner of the program.
Selecting that button will open a window with 7 tabs
each addressing different aspects of the program.
Figure 7-4: HURREVAC Setup Opening Window
7.4.1 Download Schedule Tab
Figure 7-4 displays the default Setup window that appears, which opens with the “Download
Schedule” tab on top. The selections shown above for this tab are the default choices;
therefore, for the New England communities, there is probably not a need to change them.
Clicking on the subsequent tabs across the top of this window will access new choices from the
setup menu. For the purposes of this chapter we will bypass discussing the “Connection” tab
since it is very unlikely that its use will be necessary for most users.
7.0 HURREVAC/Decision Tools
Massachusetts Hurricane Evacuation Study Technical Data Report 7-10
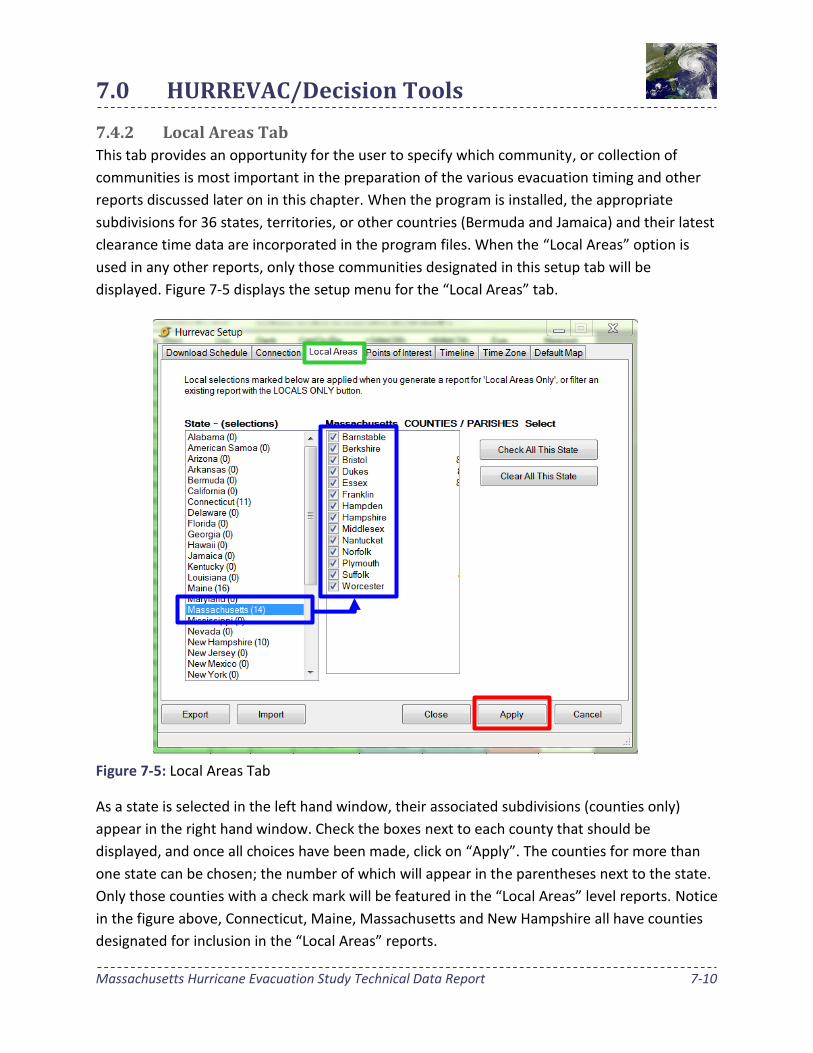
7.4.2 Local Areas Tab
This tab provides an opportunity for the user to specify which community, or collection of
communities is most important in the preparation of the various evacuation timing and other
reports discussed later on in this chapter. When the program is installed, the appropriate
subdivisions for 36 states, territories, or other countries (Bermuda and Jamaica) and their latest
clearance time data are incorporated in the program files. When the “Local Areas” option is
used in any other reports, only those communities designated in this setup tab will be
displayed. Figure 7-5 displays the setup menu for the “Local Areas” tab.
Figure 7-5: Local Areas Tab
As a state is selected in the left hand window, their associated subdivisions (counties only)
appear in the right hand window. Check the boxes next to each county that should be
displayed, and once all choices have been made, click on “Apply”. The counties for more than
one state can be chosen; the number of which will appear in the parentheses next to the state.
Only those counties with a check mark will be featured in the “Local Areas” level reports. Notice
in the figure above, Connecticut, Maine, Massachusetts and New Hampshire all have counties
designated for inclusion in the “Local Areas” reports.
7.0 HURREVAC/Decision Tools
Massachusetts Hurricane Evacuation Study Technical Data Report 7-11
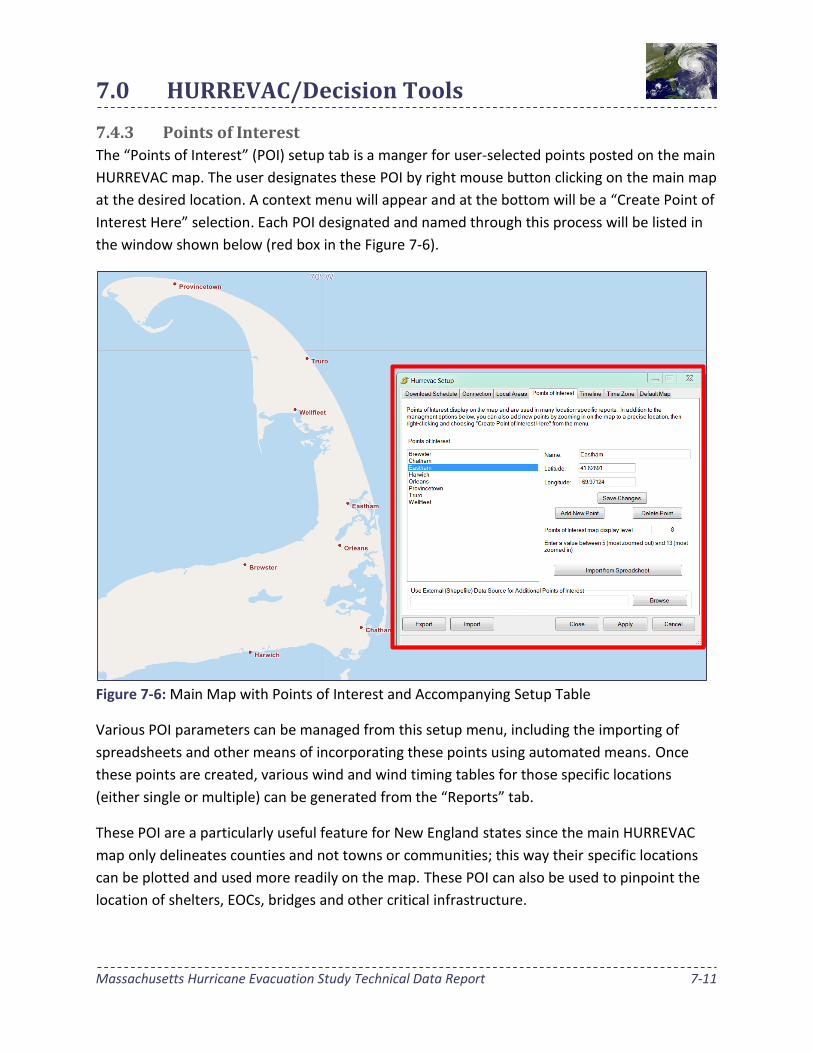
7.4.3 Points of Interest
The “Points of Interest” (POI) setup tab is a manger for user-selected points posted on the main
HURREVAC map. The user designates these POI by right mouse button clicking on the main map
at the desired location. A context menu will appear and at the bottom will be a “Create Point of
Interest Here” selection. Each POI designated and named through this process will be listed in
the window shown below (red box in the Figure 7-6).
Figure 7-6: Main Map with Points of Interest and Accompanying Setup Table
Various POI parameters can be managed from this setup menu, including the importing of
spreadsheets and other means of incorporating these points using automated means. Once
these points are created, various wind and wind timing tables for those specific locations
(either single or multiple) can be generated from the “Reports” tab.
These POI are a particularly useful feature for New England states since the main HURREVAC
map only delineates counties and not towns or communities; this way their specific locations
can be plotted and used more readily on the map. These POI can also be used to pinpoint the
location of shelters, EOCs, bridges and other critical infrastructure.
7.0 HURREVAC/Decision Tools
Massachusetts Hurricane Evacuation Study Technical Data Report 7-12
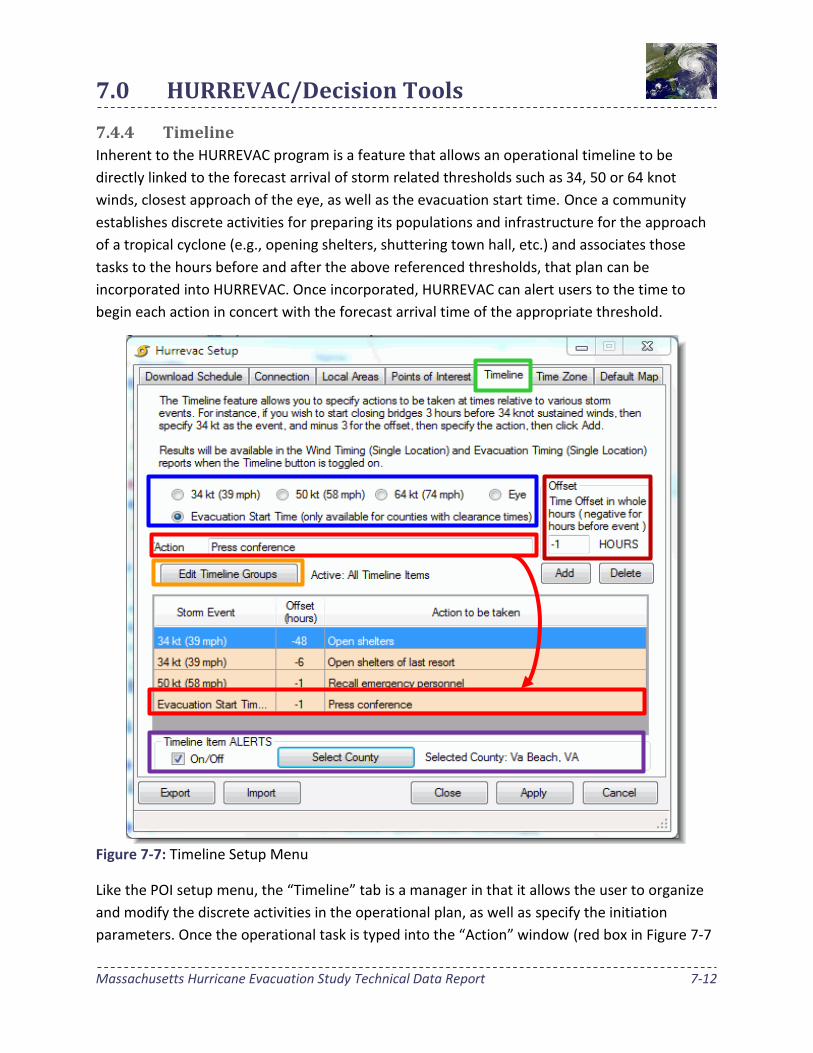
7.4.4 Timeline
Inherent to the HURREVAC program is a feature that allows an operational timeline to be
directly linked to the forecast arrival of storm related thresholds such as 34, 50 or 64 knot
winds, closest approach of the eye, as well as the evacuation start time. Once a community
establishes discrete activities for preparing its populations and infrastructure for the approach
of a tropical cyclone (e.g., opening shelters, shuttering town hall, etc.) and associates those
tasks to the hours before and after the above referenced thresholds, that plan can be
incorporated into HURREVAC. Once incorporated, HURREVAC can alert users to the time to
begin each action in concert with the forecast arrival time of the appropriate threshold.
Figure 7-7: Timeline Setup Menu
Like the POI setup menu, the “Timeline” tab is a manager in that it allows the user to organize
and modify the discrete activities in the operational plan, as well as specify the initiation
parameters. Once the operational task is typed into the “Action” window (red box in Figure 7-7
7.0 HURREVAC/Decision Tools
Massachusetts Hurricane Evacuation Study Technical Data Report 7-13
above), the threshold chosen (blue box), the time offset value entered (brown box) and “Apply”
is selected, it is listed in the large window below (blue box) with the other activities. The
threshold associated with that task, as well as its time offset is entered in the brown box in the
Figure above.
Among the other associated functions with this setup menu selection is “Edit Timeline Groups”
the button (in orange box in Figure above) for which is just below the “Action” entry window in
Figure 7-7 above. The purpose of timeline groups is to maintain collections of timeline action
items that can be activated as needed. Only one timeline group will be in active use at any one
time, but individual items can be assigned to any number of groups. This can be applied so that
certain specific activities in the timeline can be directly associated to responsible agencies, or
ESFs.
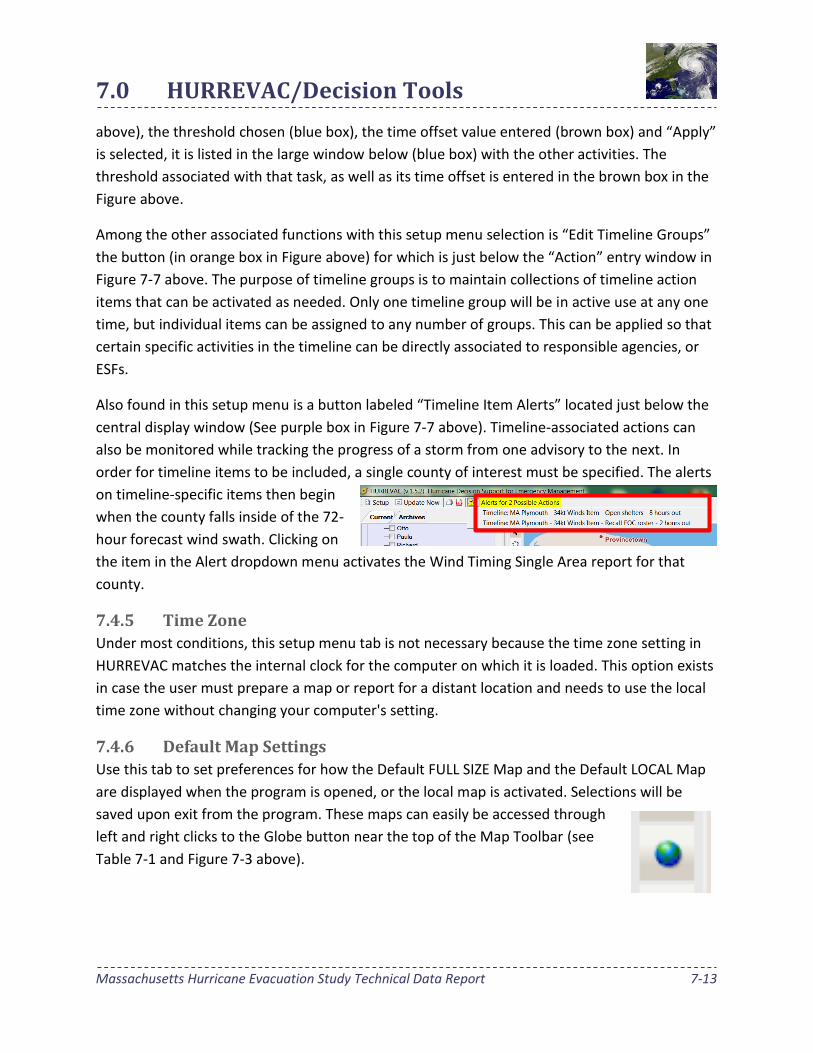
Also found in this setup menu is a button labeled “Timeline Item Alerts” located just below the
central display window (See purple box in Figure 7-7 above). Timeline-associated actions can
also be monitored while tracking the progress of a storm from one advisory to the next. In
order for timeline items to be included, a single county of interest must be specified. The alerts
on timeline-specific items then begin
when the county falls inside of the 72-
hour forecast wind swath. Clicking on
the item in the Alert dropdown menu activates the Wind Timing Single Area report for that
county.
7.4.5 Time Zone
Under most conditions, this setup menu tab is not necessary because the time zone setting in
HURREVAC matches the internal clock for the computer on which it is loaded. This option exists
in case the user must prepare a map or report for a distant location and needs to use the local
time zone without changing your computer's setting.
7.4.6 Default Map Settings
Use this tab to set preferences for how the Default FULL SIZE Map and the Default LOCAL Map
are displayed when the program is opened, or the local map is activated. Selections will be
saved upon exit from the program. These maps can easily be accessed through
left and right clicks to the Globe button near the top of the Map Toolbar (see
Table 7-1 and Figure 7-3 above).
7.0 HURREVAC/Decision Tools
Massachusetts Hurricane Evacuation Study Technical Data Report 7-14
7.5 Wind Forecast ‐ Timing and Probability Reports
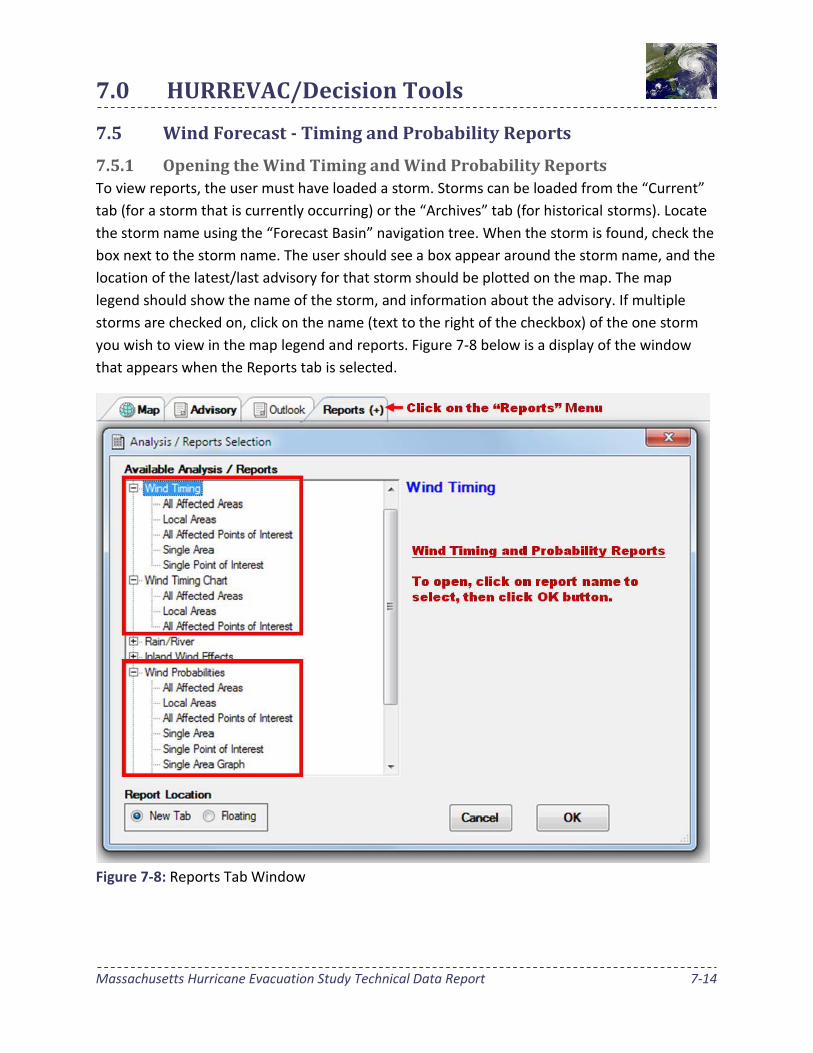
7.5.1 Opening the Wind Timing and Wind Probability Reports
To view reports, the user must have loaded a storm. Storms can be loaded from the “Current”
tab (for a storm that is currently occurring) or the “Archives” tab (for historical storms). Locate
the storm name using the “Forecast Basin” navigation tree. When the storm is found, check the
box next to the storm name. The user should see a box appear around the storm name, and the
location of the latest/last advisory for that storm should be plotted on the map. The map
legend should show the name of the storm, and information about the advisory. If multiple
storms are checked on, click on the name (text to the right of the checkbox) of the one storm
you wish to view in the map legend and reports. Figure 7-8 below is a display of the window
that appears when the Reports tab is selected.
Figure 7-8: Reports Tab Window
7.0 HURREVAC/Decision Tools
Massachusetts Hurricane Evacuation Study Technical Data Report 7-15
7.5.2 Wind Timing for Single Area/Point of Interest Report
User selects a single community or single point of interest to produce an hour by hour report,
going out 72 hours from the time of the selected advisory. The report shows the potential wind
speeds at that location for each hour in the forecast period. Wind reports are color coded by
wind intensity: Blue indicates sustained tropical storm force wind, Yellow indicates sustained
strong tropical storm force wind, and Red indicates sustained hurricane force wind.
7.5.3 Wind Timing All Affected Areas/Local Areas/All Affected Points of
Interest Report
This report populates with wind forecast information for all areas (communities) or points of
interest that are forecasted to experience at least tropical storm force winds based on the
forecast from the selected advisory. Projected start and end times for tropical storm, strong
tropical storm, and hurricane force winds are listed along with the projected speed and time of
the peak wind. By selecting "Local Areas Only", this report can be narrowed down to just the
local communities of interest selected by the user in the "Setup" menu.
A wind timing chart is also available under the reports menu. The chart‐based layout allows the
user to visualize possible wind conditions over time for multiple locations. All wind timing
reports and charts are based on the deterministic forecast and do not account for forecast
uncertainty; therefore they are not recommended for use to support decision making until the
storm is close to landfall. When the storm is further out, timing reports/charts should only be
used for general information and situational awareness. Wind probability reports/data
(discussed below) account for forecast uncertainty and should be used when the storm is
further out.
7.5.4 Wind Probabilities Single Area Report
When wind probability graphics have been turned on under the “Current” or ”Archives” tab,
this report populates with wind probability information for a location selected by the user. The
report lists the percent chance of Tropical Storm, Strong Tropical Storm, and Hurricane force
wind speeds being experienced at the selected location. The probability data goes out 120
hours, starting at the time the wind probability product was issued. Results are displayed in 6
hour time periods. The number outside of the parentheses is the percent chance of that wind
speed beginning during that particular 6 hour time period. The number in parentheses is the
percent chance of that wind speed beginning within the cumulative time from the start of the
forecast period up to that particular time in the forecast period. The last two columns explain
the exact individual and cumulative time periods that apply for each row in the report.
7.0 HURREVAC/Decision Tools
Massachusetts Hurricane Evacuation Study Technical Data Report 7-16
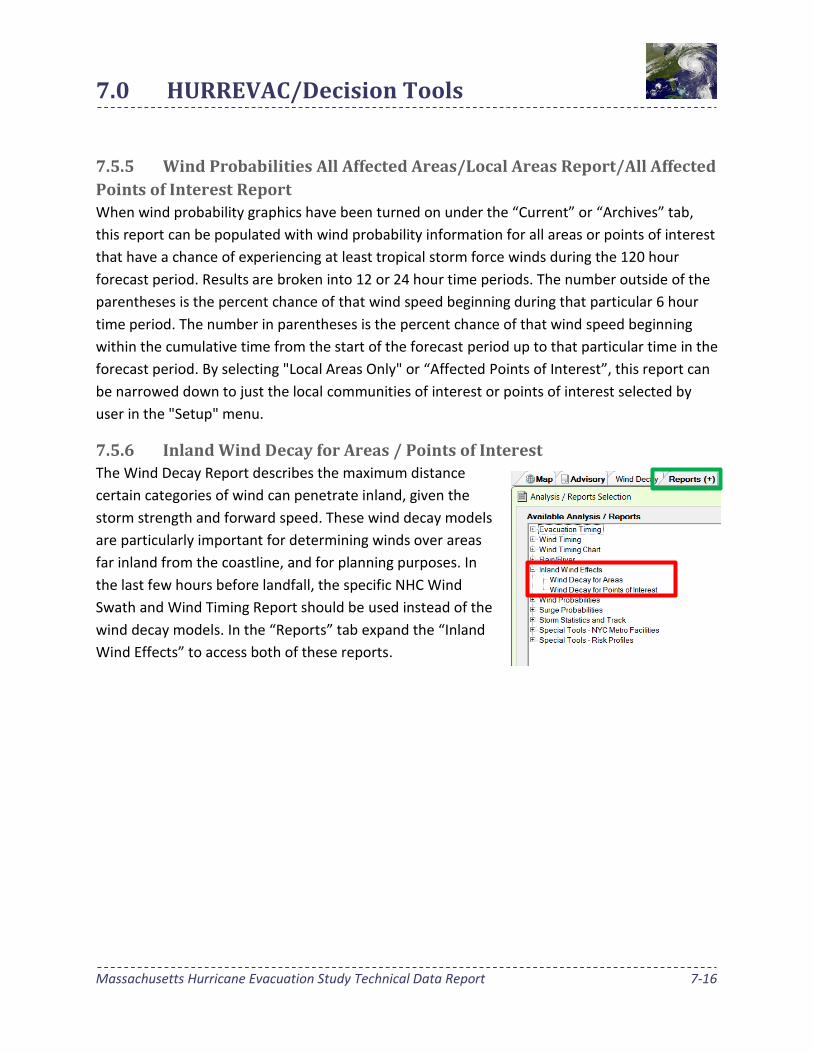
7.5.5 Wind Probabilities All Affected Areas/Local Areas Report/All Affected
Points of Interest Report
When wind probability graphics have been turned on under the “Current” or “Archives” tab,
this report can be populated with wind probability information for all areas or points of interest
that have a chance of experiencing at least tropical storm force winds during the 120 hour
forecast period. Results are broken into 12 or 24 hour time periods. The number outside of the
parentheses is the percent chance of that wind speed beginning during that particular 6 hour
time period. The number in parentheses is the percent chance of that wind speed beginning
within the cumulative time from the start of the forecast period up to that particular time in the
forecast period. By selecting "Local Areas Only" or “Affected Points of Interest”, this report can
be narrowed down to just the local communities of interest or points of interest selected by
user in the "Setup" menu.
7.5.6 Inland Wind Decay for Areas / Points of Interest
The Wind Decay Report describes the maximum distance
certain categories of wind can penetrate inland, given the
storm strength and forward speed. These wind decay models
are particularly important for determining winds over areas
far inland from the coastline, and for planning purposes. In
the last few hours before landfall, the specific NHC Wind
Swath and Wind Timing Report should be used instead of the
wind decay models. In the “Reports” tab expand the “Inland
Wind Effects” to access both of these reports.
7.0 HURREVAC/Decision Tools
Massachusetts Hurricane Evacuation Study Technical Data Report 7-17
7.6 Evacuation Timing Features
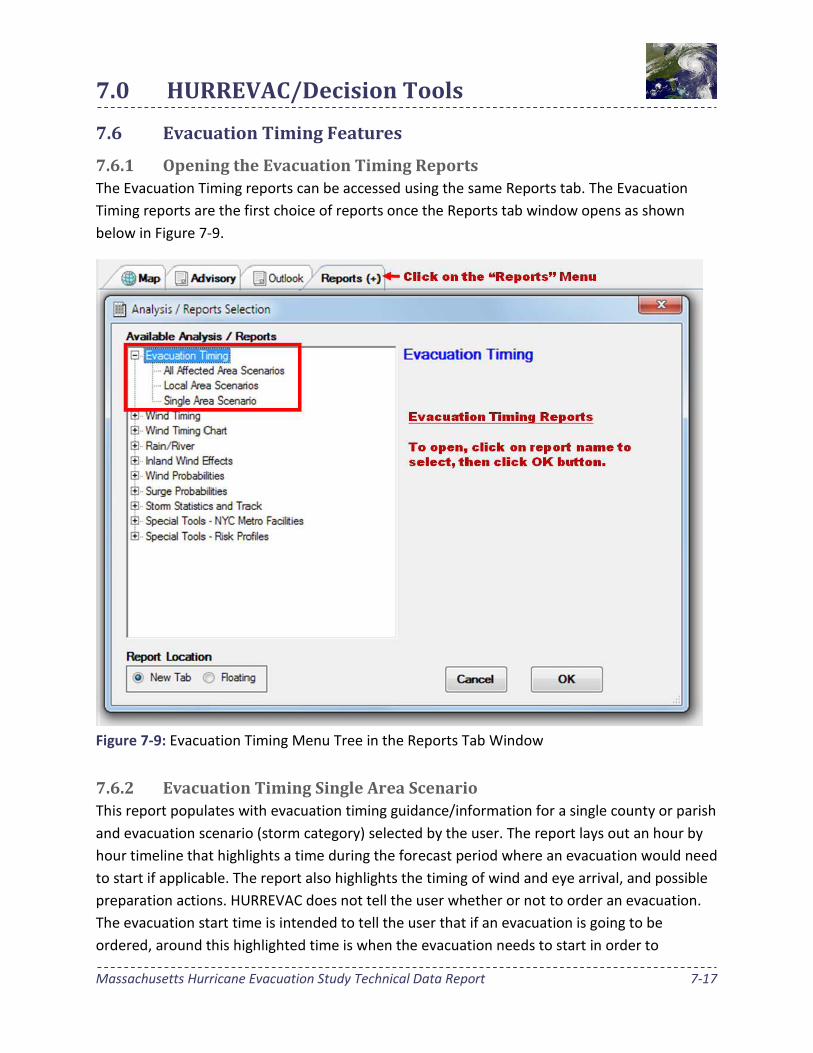
7.6.1 Opening the Evacuation Timing Reports
The Evacuation Timing reports can be accessed using the same Reports tab. The Evacuation
Timing reports are the first choice of reports once the Reports tab window opens as shown
below in Figure 7-9.
Figure 7-9: Evacuation Timing Menu Tree in the Reports Tab Window
7.6.2 Evacuation Timing Single Area Scenario
This report populates with evacuation timing guidance/information for a single county or parish
and evacuation scenario (storm category) selected by the user. The report lays out an hour by
hour timeline that highlights a time during the forecast period where an evacuation would need
to start if applicable. The report also highlights the timing of wind and eye arrival, and possible
preparation actions. HURREVAC does not tell the user whether or not to order an evacuation.
The evacuation start time is intended to tell the user that if an evacuation is going to be
ordered, around this highlighted time is when the evacuation needs to start in order to
7.0 HURREVAC/Decision Tools
Massachusetts Hurricane Evacuation Study Technical Data Report 7-18
complete it prior to the arrival of hazardous conditions. The evacuation start time is calculated
by identifying the arrival time of tropical storm force winds and subtracting back the evacuation
clearance time for the selected location. The arrival time of tropical storm force winds is based
on a direct hit scenario on the selected county, as opposed to being based on the actual
forecast track. This results in a conservative representation of the tropical storm force wind
arrival time, but does not account for uncertainty in the forward speed, size, and intensity
forecast. Evacuation clearance times used by HURREVAC are taken from the Hurricane
Evacuation Study for that location.
7.6.3 Evacuation Timing All Affected Areas/Local Areas
This report populates with evacuation timing information for all counties/parishes that fall
within the “potential track” area plus “fringe winds”. The “fringe winds” area represents the
possible extent of tropical storm force wind impacts if the center of the storm was to move
along the left or right side of the “potential track” (also known as the “error cone”). The report
lists the evacuation start time (if applicable) for all counties/parishes and all evacuation
scenarios, along with the length of the evacuation clearance time for each scenario.
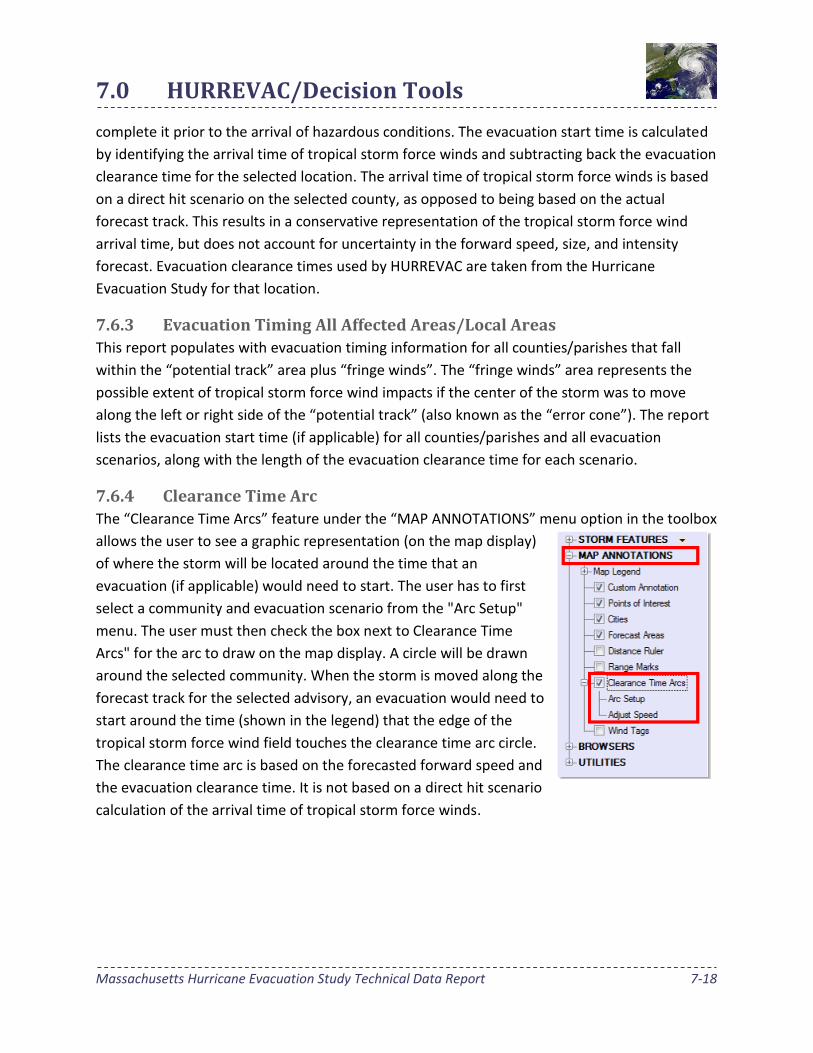
7.6.4 Clearance Time Arc
The “Clearance Time Arcs” feature under the “MAP ANNOTATIONS” menu option in the toolbox
allows the user to see a graphic representation (on the map display)
of where the storm will be located around the time that an
evacuation (if applicable) would need to start. The user has to first
select a community and evacuation scenario from the "Arc Setup"
menu. The user must then check the box next to Clearance Time
Arcs" for the arc to draw on the map display. A circle will be drawn
around the selected community. When the storm is moved along the
forecast track for the selected advisory, an evacuation would need to
start around the time (shown in the legend) that the edge of the
tropical storm force wind field touches the clearance time arc circle.
The clearance time arc is based on the forecasted forward speed and
the evacuation clearance time. It is not based on a direct hit scenario
calculation of the arrival time of tropical storm force winds.
7.0 HURREVAC/Decision Tools
Massachusetts Hurricane Evacuation Study Technical Data Report 7-19
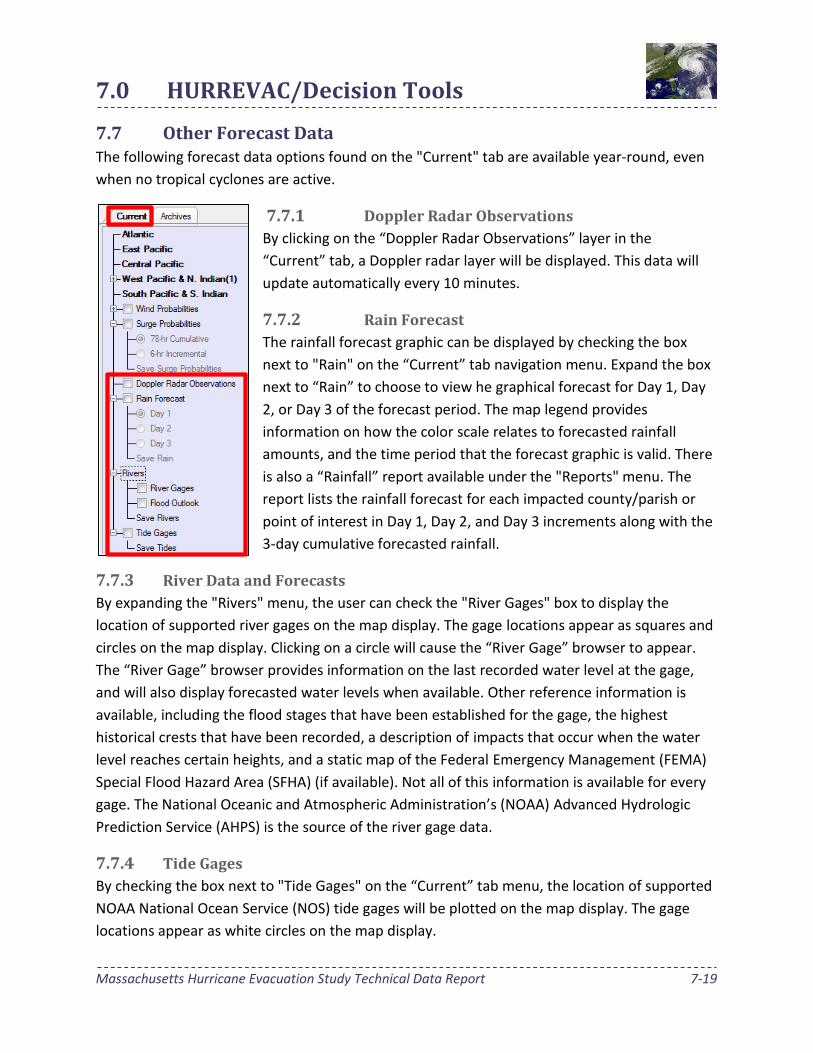
7.7 Other Forecast Data The following forecast data options found on the "Current" tab are available year‐round, even
when no tropical cyclones are active.
7.7.1 Doppler Radar Observations
By clicking on the “Doppler Radar Observations” layer in the
“Current” tab, a Doppler radar layer will be displayed. This data will
update automatically every 10 minutes.
7.7.2 Rain Forecast
The rainfall forecast graphic can be displayed by checking the box
next to "Rain" on the “Current” tab navigation menu. Expand the box
next to “Rain” to choose to view he graphical forecast for Day 1, Day
2, or Day 3 of the forecast period. The map legend provides
information on how the color scale relates to forecasted rainfall
amounts, and the time period that the forecast graphic is valid. There
is also a “Rainfall” report available under the "Reports" menu. The
report lists the rainfall forecast for each impacted county/parish or
point of interest in Day 1, Day 2, and Day 3 increments along with the
3‐day cumulative forecasted rainfall.
7.7.3 River Data and Forecasts
By expanding the "Rivers" menu, the user can check the "River Gages" box to display the
location of supported river gages on the map display. The gage locations appear as squares and
circles on the map display. Clicking on a circle will cause the “River Gage” browser to appear.
The “River Gage” browser provides information on the last recorded water level at the gage,
and will also display forecasted water levels when available. Other reference information is
available, including the flood stages that have been established for the gage, the highest
historical crests that have been recorded, a description of impacts that occur when the water
level reaches certain heights, and a static map of the Federal Emergency Management (FEMA)
Special Flood Hazard Area (SFHA) (if available). Not all of this information is available for every
gage. The National Oceanic and Atmospheric Administration’s (NOAA) Advanced Hydrologic
Prediction Service (AHPS) is the source of the river gage data.
7.7.4 Tide Gages
By checking the box next to "Tide Gages" on the “Current” tab menu, the location of supported
NOAA National Ocean Service (NOS) tide gages will be plotted on the map display. The gage
locations appear as white circles on the map display.
7.0 HURREVAC/Decision Tools
Massachusetts Hurricane Evacuation Study Technical Data Report 7-20
Clicking a circle will cause the “Tide Gage” browser to appear. The “Tide Gage” browser
provides information on the last recorded water level at the gage, and will also display
predicted water levels. The “Tide Gage” browser also includes output data from the SLOSH
model, which is the model used by the National Hurricane Center to predict storm surge
impacts from tropical systems. When a storm is approaching, the "Operational" option in the
“Tide Gage” browser will list the probabilistic storm surge elevation that has only a 10% chance
of being exceeded. That elevation will be plotted on top of predicted tides to show how the
storm tide level will be impacted by the timing of the storm. When the "Planning" option is
selected, the user can browse through the results of planning level storm simulations
conducted to determine the highest calculated surge heights that are possible at that location.
The results are broken into storms with certain forward speed and angle of approach
characteristics (Maximum Envelope of Water or MEOW), and the highest calculated surge
heights for a given Category regardless of forward speed and angle of approach (Maximum of
MEOWs or MOM).
7.7.5 Probabilistic Storm Surge Data
“Surge Probabilities” is a forecast information layer included in HURREVAC for coastal areas
from Texas to Maine that could experience storm surge‐associated flooding from an
approaching tropical system within the next 78 hours. The source of this data is the National
Hurricane Center’s Probabilistic Surge product, known as “P‐Surge”. P‐Surge is created using
SLOSH, the storm surge model that the National Hurricane Center
uses to forecast storm surge from hurricanes. P‐Surge takes the
official hurricane forecast from the National Hurricane Center for the
approaching storm and uses error statistics from past hurricane
forecasts to simulate potential storm surge from many statistically
possible track, size, forward speed, and intensity scenarios that
could still occur. The resulting information is provided in HURREVAC
in both graphical and report format. The timeframe for the data is 78
hours, although the SLOSH model runs are not typically begun until a
storm is within 48 hours of landfall and watches/warnings are
issued. Therefore the P‐Surge data is not available until a watch or
warning is in place, 48 hours from the potential impact of the storm.
Inundation risk is reported as water depths above ground level with a 1 in 10 chance of being
exceeded, which provides a conservative view of the surge impact from the approaching storm
that could be possible for a given location. The data already accounts for the impacts of tide on
the reported water level above ground.
7.0 HURREVAC/Decision Tools
Massachusetts Hurricane Evacuation Study Technical Data Report 7-21
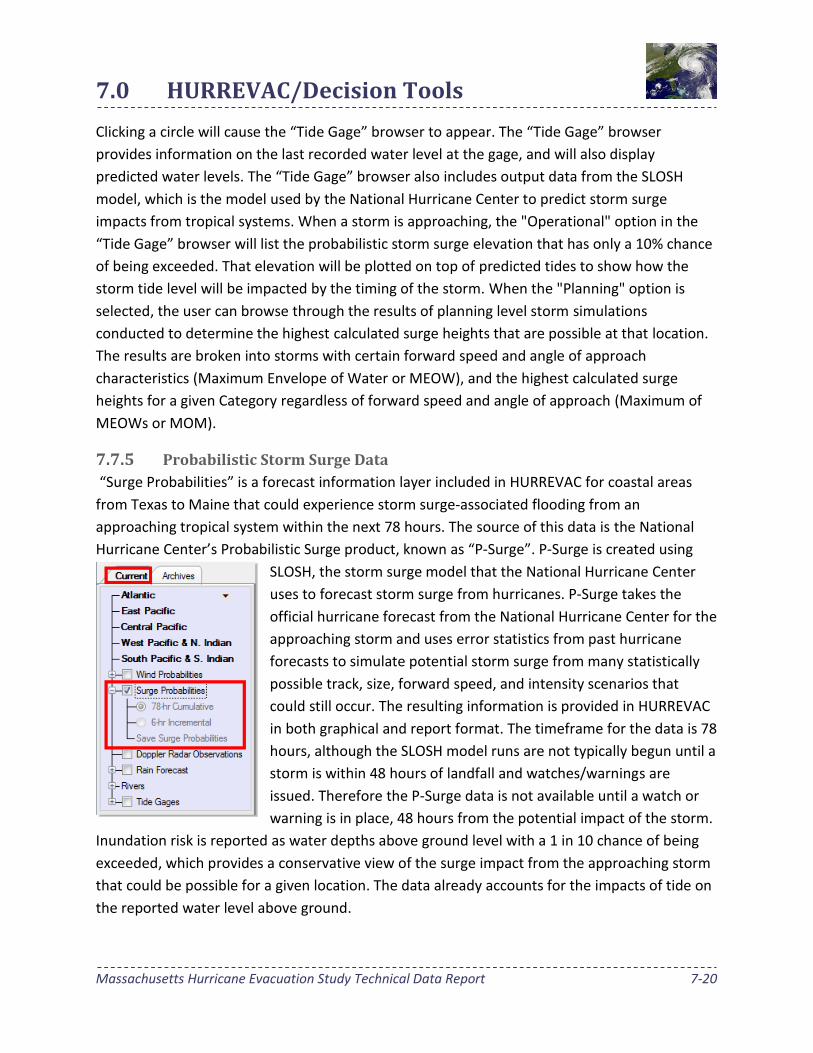
To turn on the graphic, check the box next to "Surge Probabilities" on the “Current” tab. Then
choose to view either the “78‐hr Cumulative” graphic or the "6‐hr Incremental" graphic. The
“78‐hr Cumulative” graphic will report the highest water depth above ground that has a 1 in 10
chance of being exceeded over the next 78 hours. The “6‐hr Incremental” graphic reports the
highest depth above ground that has a 1 in 10 chance of being exceeded during each 6 hour
increment of the 78‐hour forecast period. To cycle through the 6 hour increments, use the
"Storm Surge Tools" that can be found on the program header. The legend at the bottom of the
map display window will provide information on the how the color scale relates to water depth,
and also provides the time period that the data being viewed is valid.
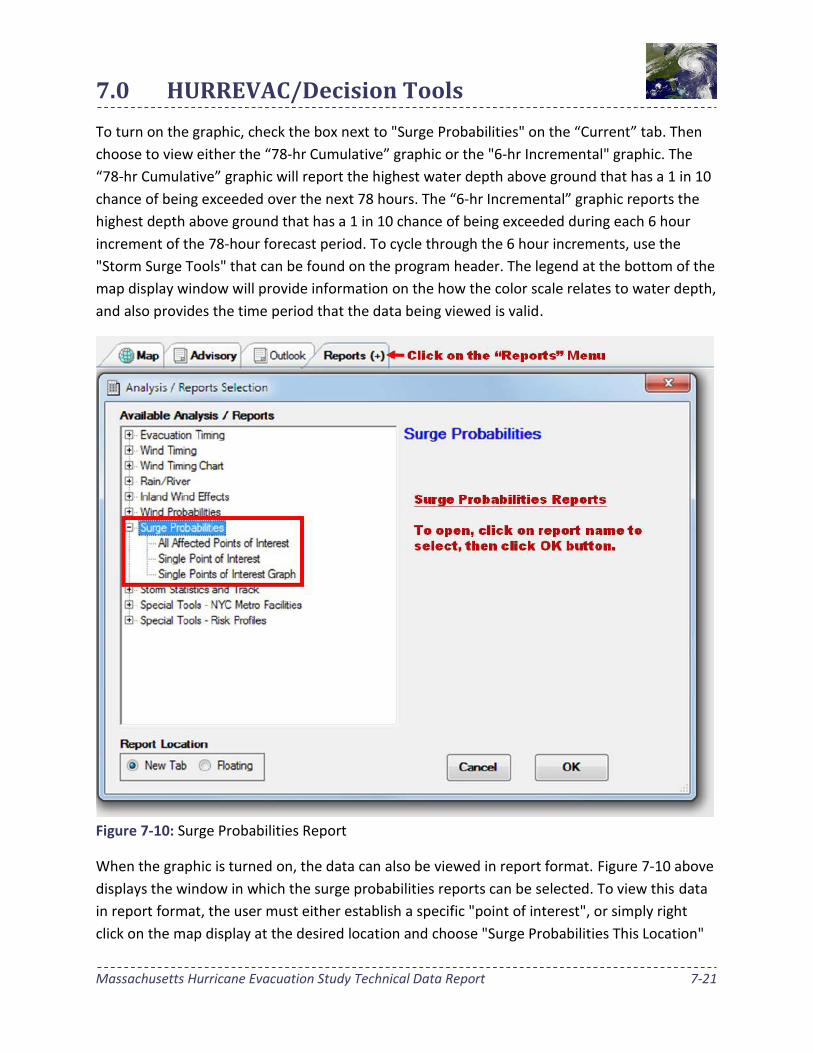
Figure 7-10: Surge Probabilities Report
When the graphic is turned on, the data can also be viewed in report format. Figure 7-10 above
displays the window in which the surge probabilities reports can be selected. To view this data
in report format, the user must either establish a specific "point of interest", or simply right
click on the map display at the desired location and choose "Surge Probabilities This Location"
7.0 HURREVAC/Decision Tools
Massachusetts Hurricane Evacuation Study Technical Data Report 7-22
from the menu. Once a point of interest has been established, the surge probability report can
be accessed from the reports menu. Expand "Surge Probabilities" and then choose "Single Point
of Interest". For each 6 hour portion of the 78 hour forecast period, the report will provide the
water depth above ground that has a 1 in 10 chance of being exceeded for both that specific 6
hour time block, as well as water depth above ground that has a 1 in 10 chance of being
exceeded for the cumulative time from the beginning of the forecast period to the end of that
specific 6 hour increment.
7.8 Browsers/Utilities
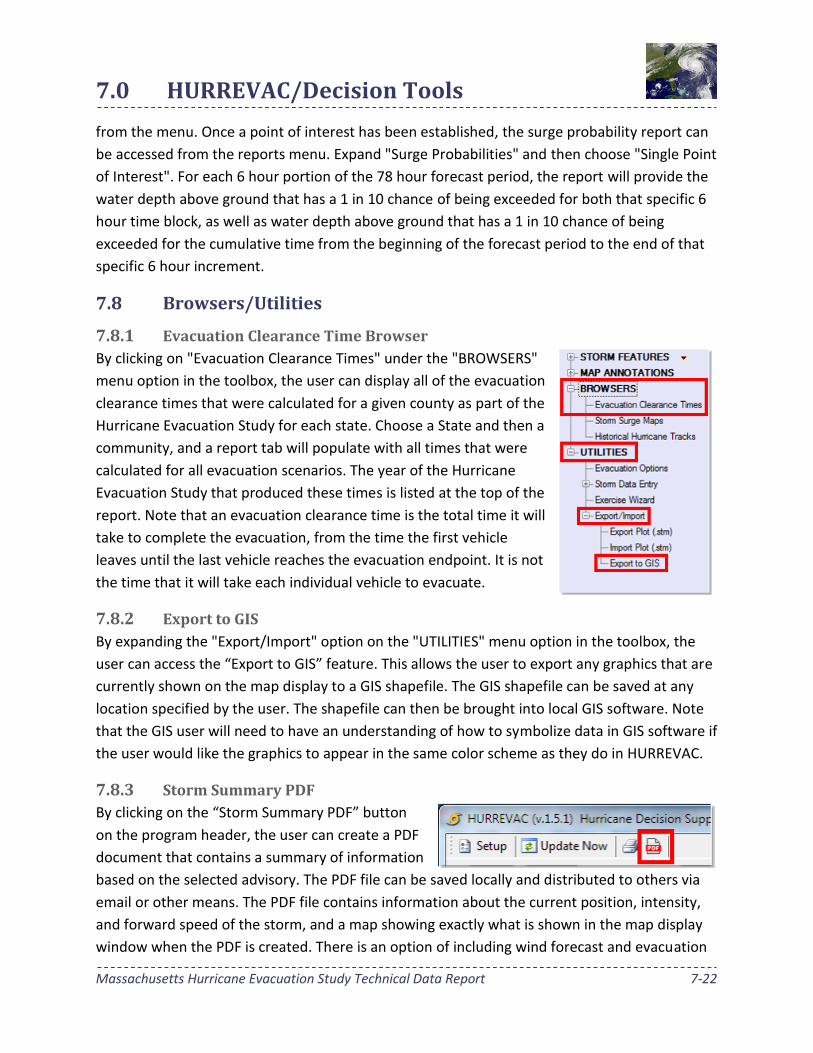
7.8.1 Evacuation Clearance Time Browser
By clicking on "Evacuation Clearance Times" under the "BROWSERS"
menu option in the toolbox, the user can display all of the evacuation
clearance times that were calculated for a given county as part of the
Hurricane Evacuation Study for each state. Choose a State and then a
community, and a report tab will populate with all times that were
calculated for all evacuation scenarios. The year of the Hurricane
Evacuation Study that produced these times is listed at the top of the
report. Note that an evacuation clearance time is the total time it will
take to complete the evacuation, from the time the first vehicle
leaves until the last vehicle reaches the evacuation endpoint. It is not
the time that it will take each individual vehicle to evacuate.
7.8.2 Export to GIS
By expanding the "Export/Import" option on the "UTILITIES" menu option in the toolbox, the
user can access the “Export to GIS” feature. This allows the user to export any graphics that are
currently shown on the map display to a GIS shapefile. The GIS shapefile can be saved at any
location specified by the user. The shapefile can then be brought into local GIS software. Note
that the GIS user will need to have an understanding of how to symbolize data in GIS software if
the user would like the graphics to appear in the same color scheme as they do in HURREVAC.
7.8.3 Storm Summary PDF
By clicking on the “Storm Summary PDF” button
on the program header, the user can create a PDF
document that contains a summary of information
based on the selected advisory. The PDF file can be saved locally and distributed to others via
email or other means. The PDF file contains information about the current position, intensity,
and forward speed of the storm, and a map showing exactly what is shown in the map display
window when the PDF is created. There is an option of including wind forecast and evacuation
7.0 HURREVAC/Decision Tools
Massachusetts Hurricane Evacuation Study Technical Data Report 7-23
timing data for a selected location, and/or the actual advisory text issued by the National
Hurricane Center. Because the map shown on the PDF comes from what is shown in the map
display window, the user should set their preferred view and graphics on their map display
window prior to creating the “Storm Summary PDF”.
7.9 Accessing and Interpreting Important Decision Making
Functions
Examples of important functions and features in HURREVAC are provided below as a guide for
users and concentrate on hazard identification and evacuation decision-making during real
hurricane events. The operations described below are based on Hurricane Earl 2010, Advisory
34 (Thursday, September 2nd at 5 PM). Please note that times shown are in Eastern Daylight
Time (EDT).
7.9.1 Determining the Relative Risk of Experiencing Landfall in a Community
over the 120 Hour Forecast Period
One of the most important features in HURREVAC is the representation of the Average Forecast
Error over the 120-hour forecast period for each advisory. HURREVAC graphically displays this
uncertainty in the forecast track as a slightly transparent white cone superimposed on the
forecast track for any given advisory.
The average forecast error cone displays the likely across-track error of where the eye could
potentially be located along the 120 hour forecast track. However, there is also an along-track
error that also may result in the tropical storm force winds (when an evacuation should
theoretically be halted) arriving earlier or later than the timeframes in the forecast. HURREVAC
displays both components of the forecast uncertainty on the map and factors both types of
error in a report.
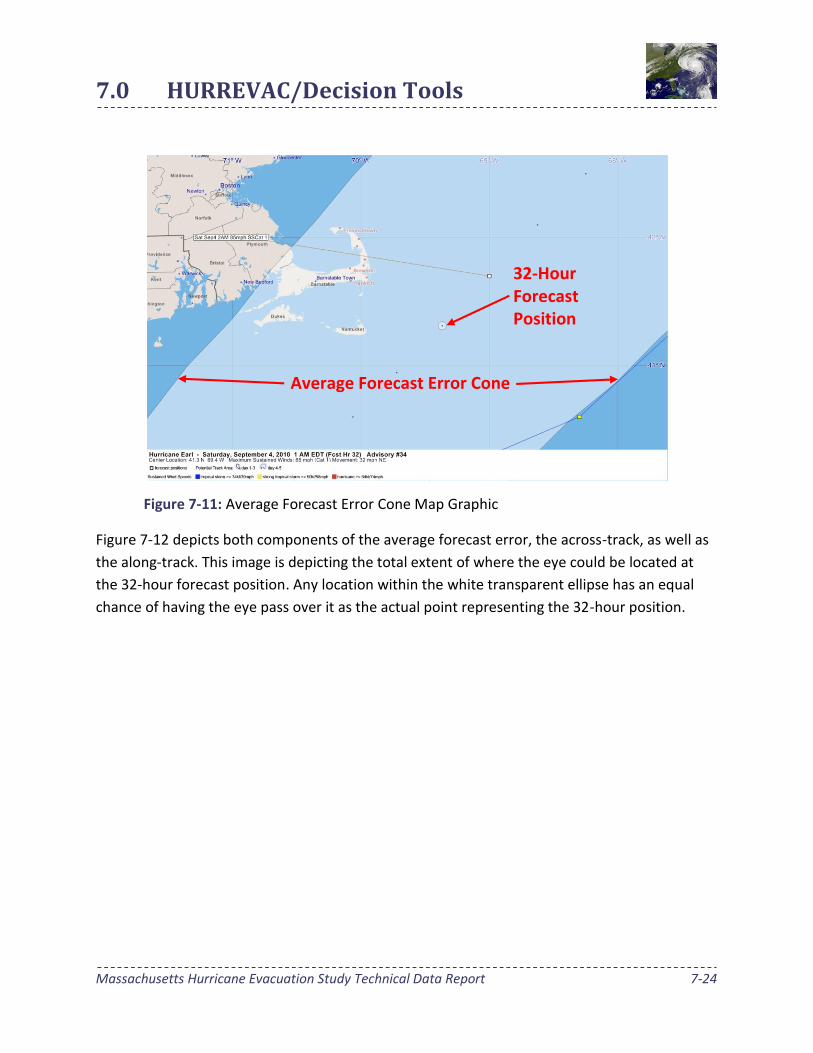
In Figure 7-11 below the average forecast error cone is depicted on the map as the light swath
bisecting the image from lower left to upper right. The forecast track is shown as dots, each
representing a forecast hourly position in the center of the average forecast error swath. In this
image, the closest point of approach for the Earl’s eye is forecast to be approximately 40 miles
southeast of Harwich at 1 AM of September 4th, 32 hours into the advisory (#34). Nonetheless,
based on the western edge of the average forecast error cone, the eye during that timeframe
could be located anywhere between Mattapoisett and Manomet. The radius of maximum
winds (the hurricane force wind field) could extend 40 miles further westward from there.
7.0 HURREVAC/Decision Tools
Massachusetts Hurricane Evacuation Study Technical Data Report 7-24
Figure 7-11: Average Forecast Error Cone Map Graphic
Figure 7-12 depicts both components of the average forecast error, the across-track, as well as
the along-track. This image is depicting the total extent of where the eye could be located at
the 32-hour forecast position. Any location within the white transparent ellipse has an equal
chance of having the eye pass over it as the actual point representing the 32-hour position.
32-Hour Forecast Position
Average Forecast Error Cone

7.0 HURREVAC/Decision Tools
Massachusetts Hurricane Evacuation Study Technical Data Report 7-25
Figure 7-12: Average Forecast Error Ellipse Map Graphic
Finally, as stated previously HURREVAC
will prepare a report that lists all of
those communities situated in the
average forecast error cone. The report
also factors in along-track uncertainty
by detailing the earliest and latest times
that peak winds could affect the
jurisdiction, which is shown in the red
box here to the right.
32-Hour Forecast Position Forecast
Error Ellipse
7.0 HURREVAC/Decision Tools
Massachusetts Hurricane Evacuation Study Technical Data Report 7-26
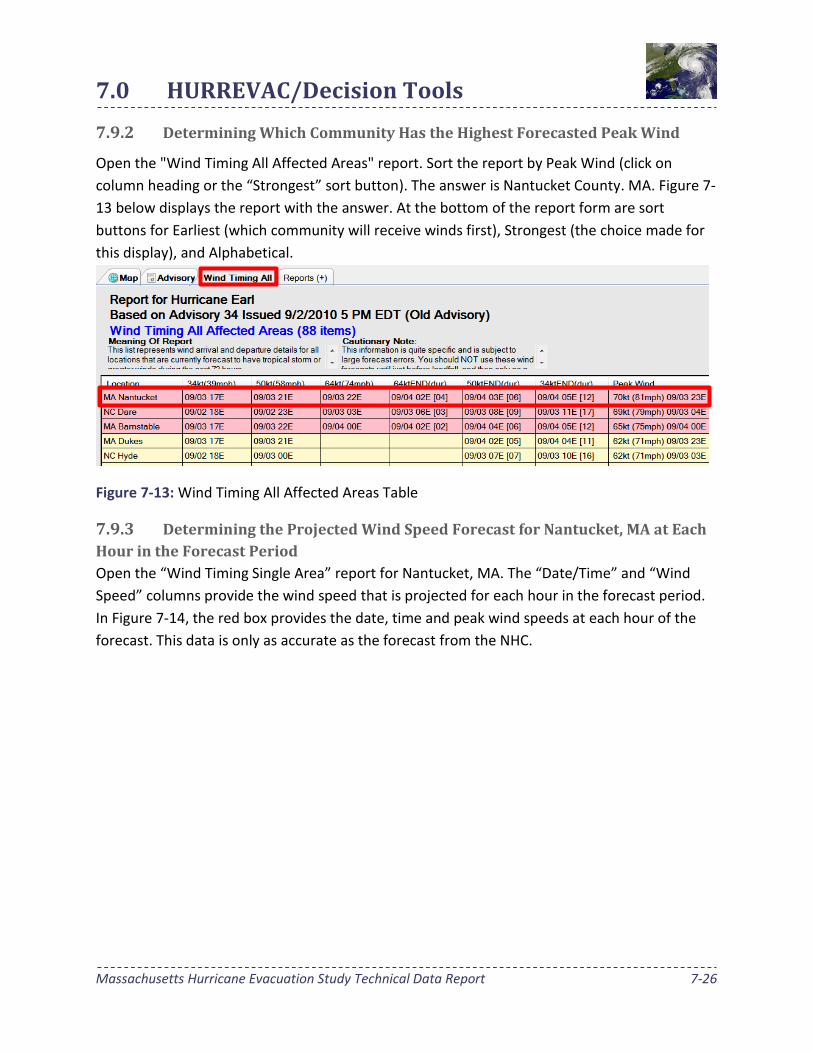
7.9.2 Determining Which Community Has the Highest Forecasted Peak Wind
Open the "Wind Timing All Affected Areas" report. Sort the report by Peak Wind (click on
column heading or the “Strongest” sort button). The answer is Nantucket County. MA. Figure 7-
13 below displays the report with the answer. At the bottom of the report form are sort
buttons for Earliest (which community will receive winds first), Strongest (the choice made for
this display), and Alphabetical.
Figure 7-13: Wind Timing All Affected Areas Table
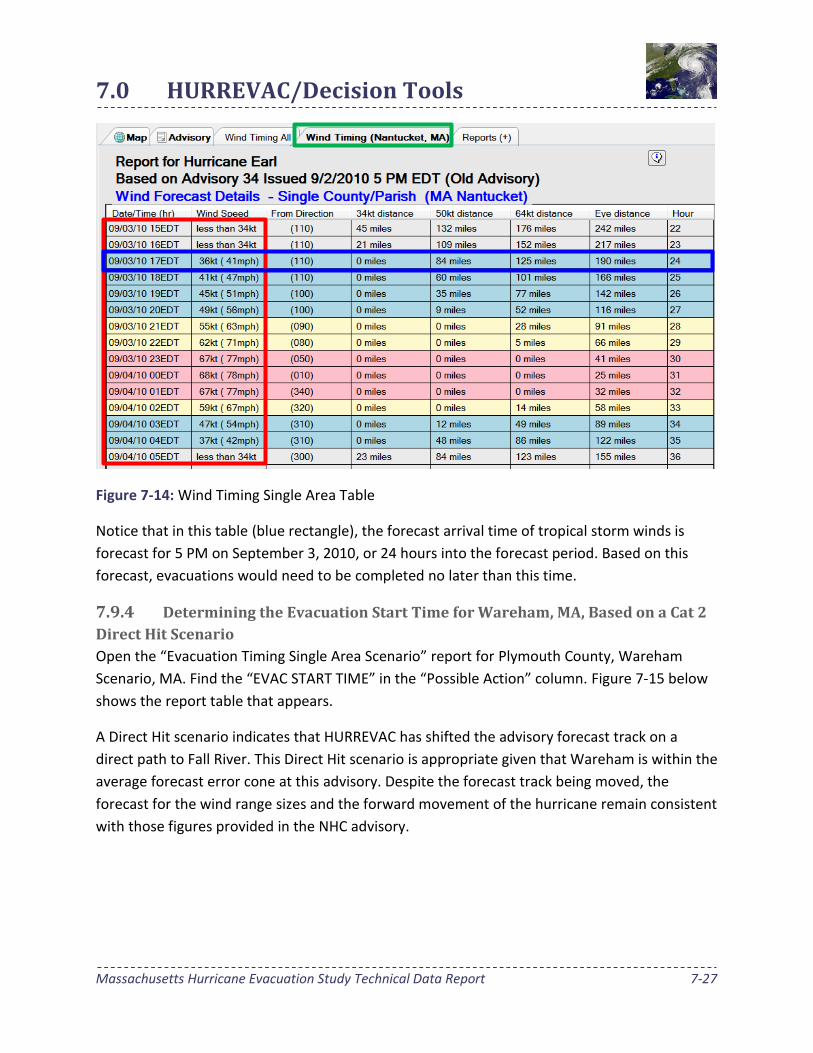
7.9.3 Determining the Projected Wind Speed Forecast for Nantucket, MA at Each
Hour in the Forecast Period
Open the “Wind Timing Single Area” report for Nantucket, MA. The “Date/Time” and “Wind
Speed” columns provide the wind speed that is projected for each hour in the forecast period.
In Figure 7-14, the red box provides the date, time and peak wind speeds at each hour of the
forecast. This data is only as accurate as the forecast from the NHC.
7.0 HURREVAC/Decision Tools
Massachusetts Hurricane Evacuation Study Technical Data Report 7-27
Figure 7-14: Wind Timing Single Area Table
Notice that in this table (blue rectangle), the forecast arrival time of tropical storm winds is
forecast for 5 PM on September 3, 2010, or 24 hours into the forecast period. Based on this
forecast, evacuations would need to be completed no later than this time.
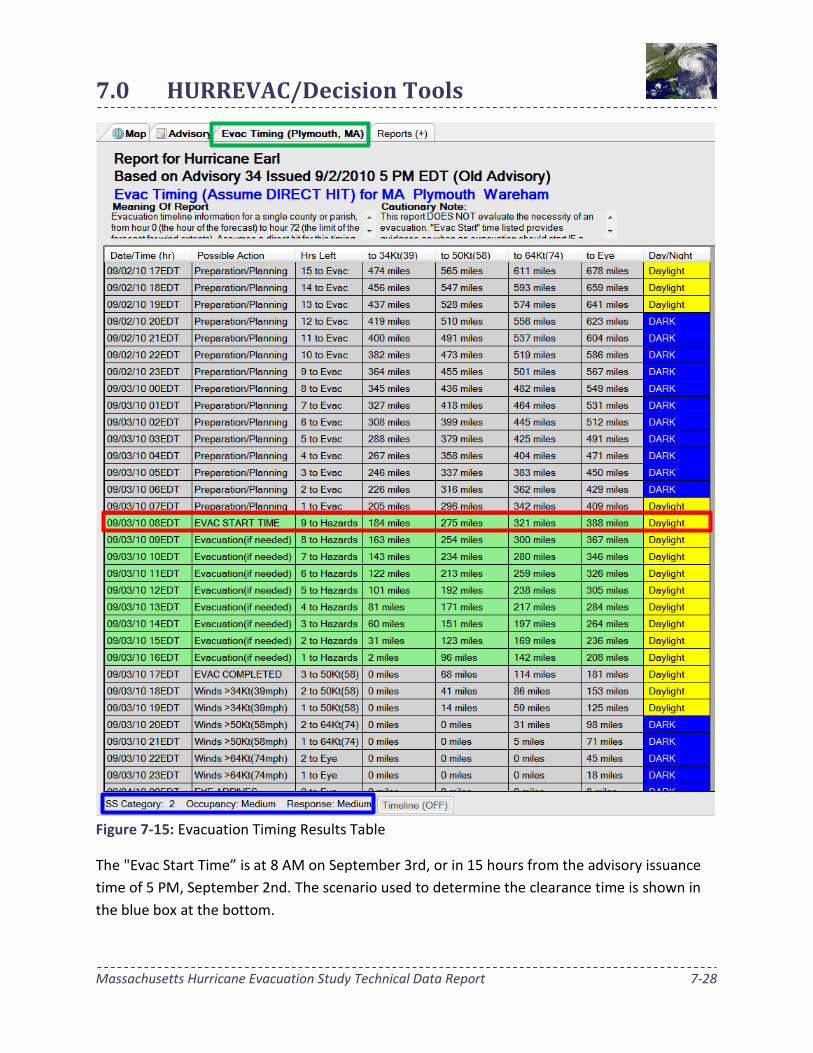
7.9.4 Determining the Evacuation Start Time for Wareham, MA, Based on a Cat 2
Direct Hit Scenario
Open the “Evacuation Timing Single Area Scenario” report for Plymouth County, Wareham
Scenario, MA. Find the “EVAC START TIME” in the “Possible Action” column. Figure 7-15 below
shows the report table that appears.
A Direct Hit scenario indicates that HURREVAC has shifted the advisory forecast track on a
direct path to Fall River. This Direct Hit scenario is appropriate given that Wareham is within the
average forecast error cone at this advisory. Despite the forecast track being moved, the
forecast for the wind range sizes and the forward movement of the hurricane remain consistent
with those figures provided in the NHC advisory.
7.0 HURREVAC/Decision Tools
Massachusetts Hurricane Evacuation Study Technical Data Report 7-28
Figure 7-15: Evacuation Timing Results Table
The "Evac Start Time” is at 8 AM on September 3rd, or in 15 hours from the advisory issuance
time of 5 PM, September 2nd. The scenario used to determine the clearance time is shown in
the blue box at the bottom.
7.0 HURREVAC/Decision Tools
Massachusetts Hurricane Evacuation Study Technical Data Report 7-29
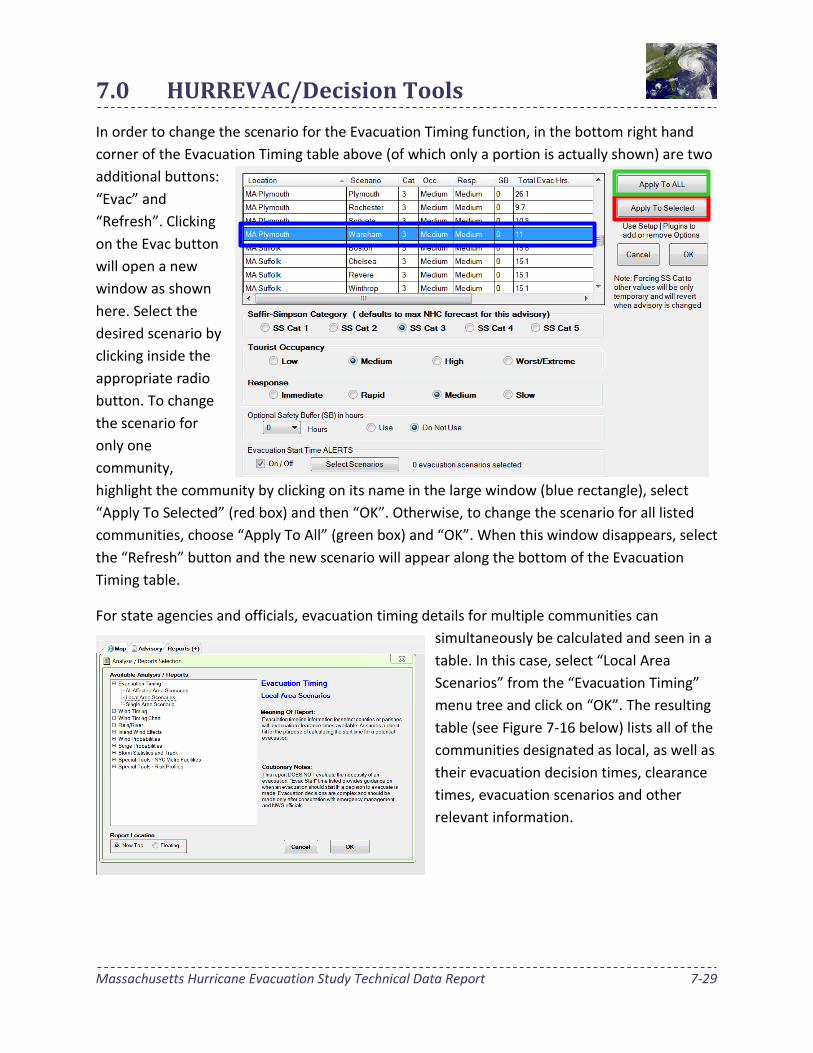
In order to change the scenario for the Evacuation Timing function, in the bottom right hand
corner of the Evacuation Timing table above (of which only a portion is actually shown) are two
additional buttons:
“Evac” and
“Refresh”. Clicking
on the Evac button
will open a new
window as shown
here. Select the
desired scenario by
clicking inside the
appropriate radio
button. To change
the scenario for
only one
community,
highlight the community by clicking on its name in the large window (blue rectangle), select
“Apply To Selected” (red box) and then “OK”. Otherwise, to change the scenario for all listed
communities, choose “Apply To All” (green box) and “OK”. When this window disappears, select
the “Refresh” button and the new scenario will appear along the bottom of the Evacuation
Timing table.
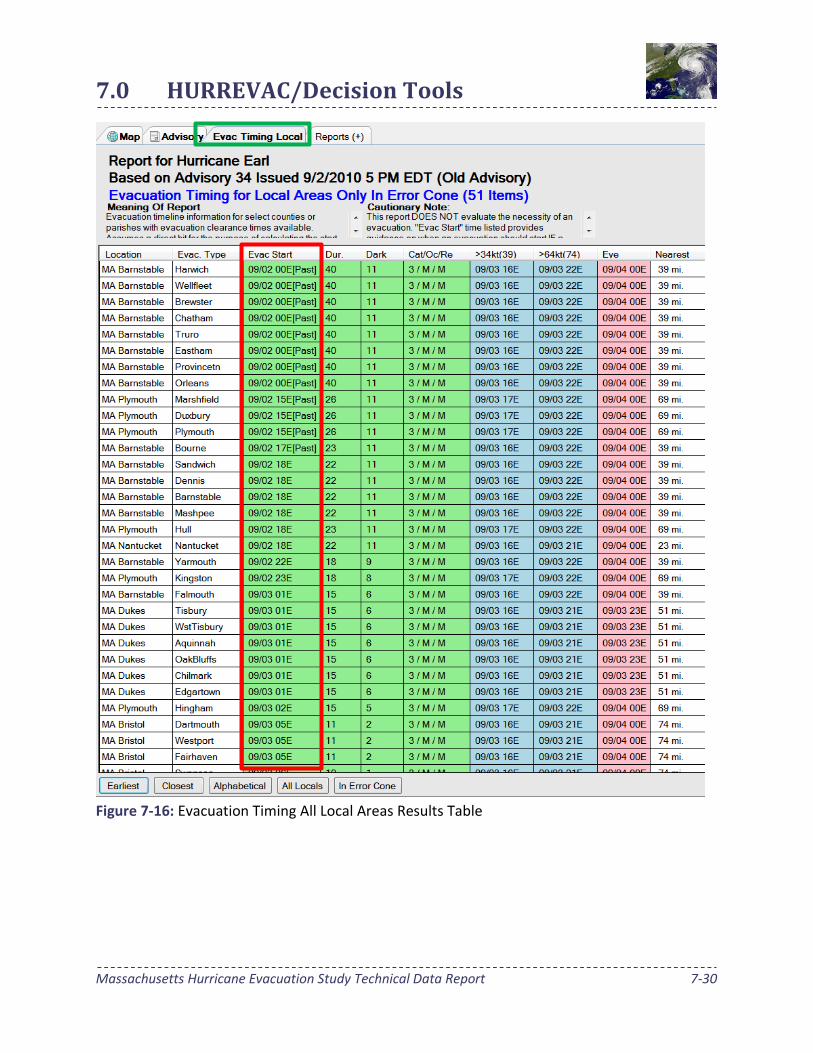
For state agencies and officials, evacuation timing details for multiple communities can
simultaneously be calculated and seen in a
table. In this case, select “Local Area
Scenarios” from the “Evacuation Timing”
menu tree and click on “OK”. The resulting
table (see Figure 7-16 below) lists all of the
communities designated as local, as well as
their evacuation decision times, clearance
times, evacuation scenarios and other
relevant information.
7.0 HURREVAC/Decision Tools
Massachusetts Hurricane Evacuation Study Technical Data Report 7-30
Figure 7-16: Evacuation Timing All Local Areas Results Table
7.0 HURREVAC/Decision Tools
Massachusetts Hurricane Evacuation Study Technical Data Report 7-31
7.9.5 Determining the Evacuation Start Time for Newport, RI, Based on a Cat 1
Using the Clearance Time Arc Method
Another method for determining the start time for an evacuation based on clearance times is to
use the Clearance Time Arc, which is a slightly different approach from the one discussed above
(Direct Hit Scenario). The Clearance Time Arc operates from the assumption that, rather than
the storm moving in a direct line to the community or point of interest, the hourly location of
the tropical cyclone’s eye remains consistent with the forecast track provided in the latest
advisory. The hourly wind ranges also remain true to the NHC forecast, but the forward
movement of the storm can also be varied.
The size of the Clearance Time Arc is determined by multiplying the clearance time by the
forward speed of the storm which then provides the radius from the point of interest. The
concept is that as the tropical cyclone is moved forward along the forecast track and the hour
at which the tropical storm wind ellipse touches the decision arc is the latest start time for an
evacuation. For example, a tropical cyclone moving at 10 miles an hour forward speed, and a
community with a 10 hour clearance time would generate a clearance time arc with a radius of
100 miles. The outside edge of the tropical storm wind ellipse touching the 100 mile clearance
time arc would determine the hour at which the evacuation should begin.
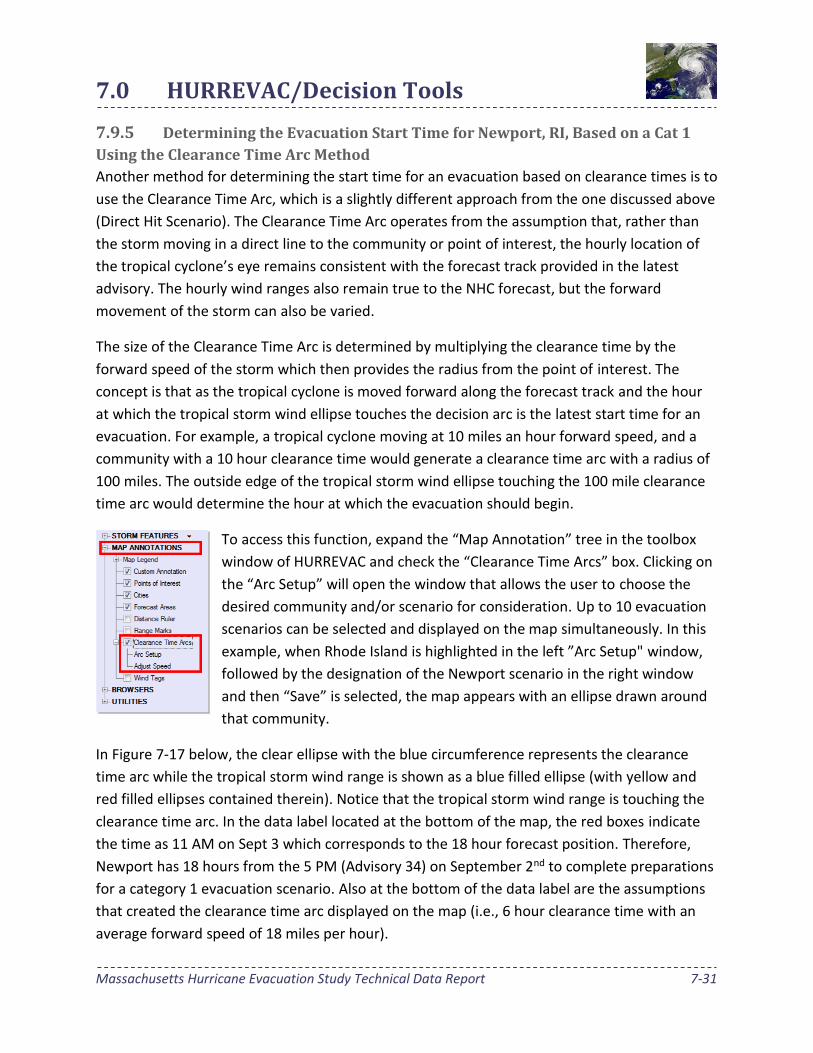
To access this function, expand the “Map Annotation” tree in the toolbox
window of HURREVAC and check the “Clearance Time Arcs” box. Clicking on
the “Arc Setup” will open the window that allows the user to choose the
desired community and/or scenario for consideration. Up to 10 evacuation
scenarios can be selected and displayed on the map simultaneously. In this
example, when Rhode Island is highlighted in the left ”Arc Setup" window,
followed by the designation of the Newport scenario in the right window
and then “Save” is selected, the map appears with an ellipse drawn around
that community.
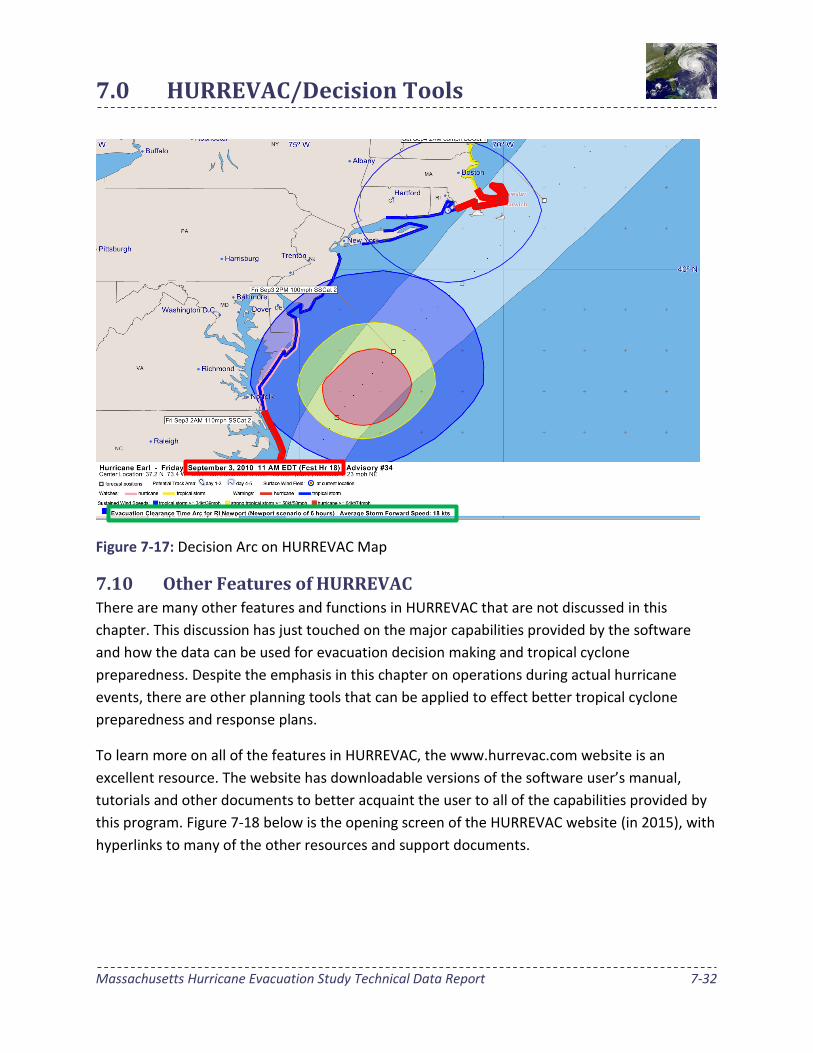
In Figure 7-17 below, the clear ellipse with the blue circumference represents the clearance
time arc while the tropical storm wind range is shown as a blue filled ellipse (with yellow and
red filled ellipses contained therein). Notice that the tropical storm wind range is touching the
clearance time arc. In the data label located at the bottom of the map, the red boxes indicate
the time as 11 AM on Sept 3 which corresponds to the 18 hour forecast position. Therefore,
Newport has 18 hours from the 5 PM (Advisory 34) on September 2nd to complete preparations
for a category 1 evacuation scenario. Also at the bottom of the data label are the assumptions
that created the clearance time arc displayed on the map (i.e., 6 hour clearance time with an
average forward speed of 18 miles per hour).
7.0 HURREVAC/Decision Tools
Massachusetts Hurricane Evacuation Study Technical Data Report 7-32
Figure 7-17: Decision Arc on HURREVAC Map
7.10 Other Features of HURREVAC There are many other features and functions in HURREVAC that are not discussed in this
chapter. This discussion has just touched on the major capabilities provided by the software
and how the data can be used for evacuation decision making and tropical cyclone
preparedness. Despite the emphasis in this chapter on operations during actual hurricane
events, there are other planning tools that can be applied to effect better tropical cyclone
preparedness and response plans.
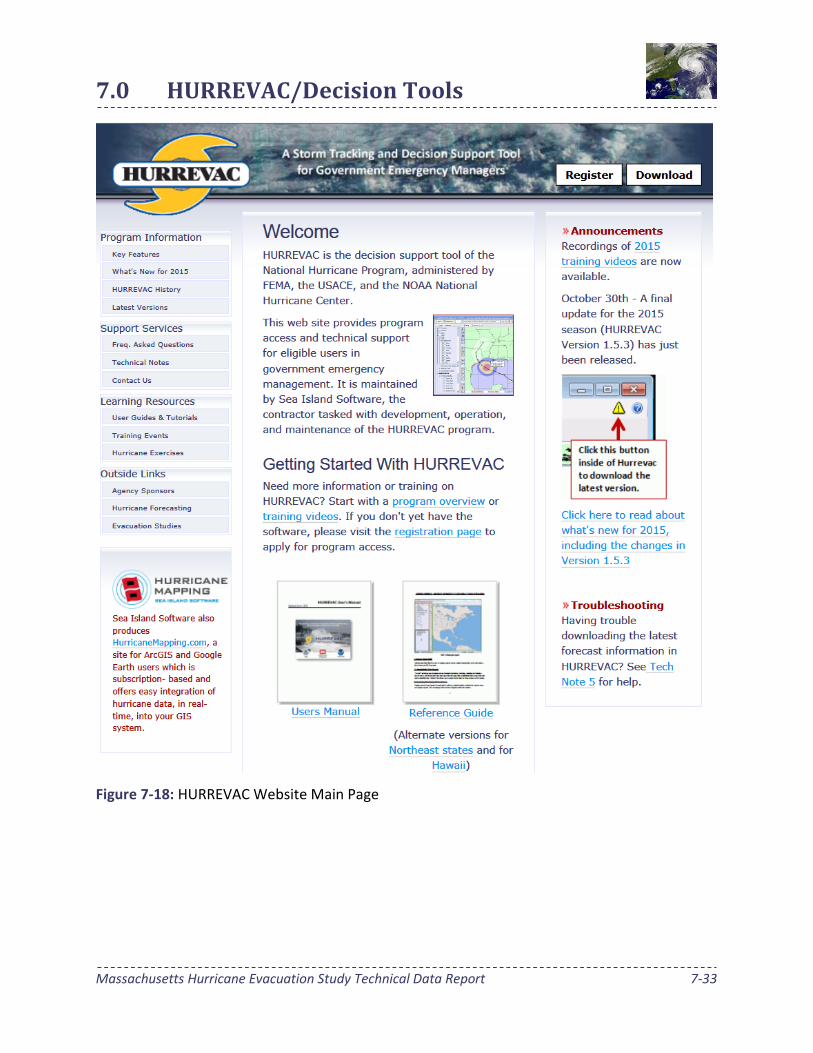
To learn more on all of the features in HURREVAC, the www.hurrevac.com website is an
excellent resource. The website has downloadable versions of the software user’s manual,
tutorials and other documents to better acquaint the user to all of the capabilities provided by
this program. Figure 7-18 below is the opening screen of the HURREVAC website (in 2015), with
hyperlinks to many of the other resources and support documents.
7.0 HURREVAC/Decision Tools
Massachusetts Hurricane Evacuation Study Technical Data Report 7-33
Figure 7-18: HURREVAC Website Main Page
7.0 HURREVAC/Decision Tools
Massachusetts Hurricane Evacuation Study Technical Data Report 7-34
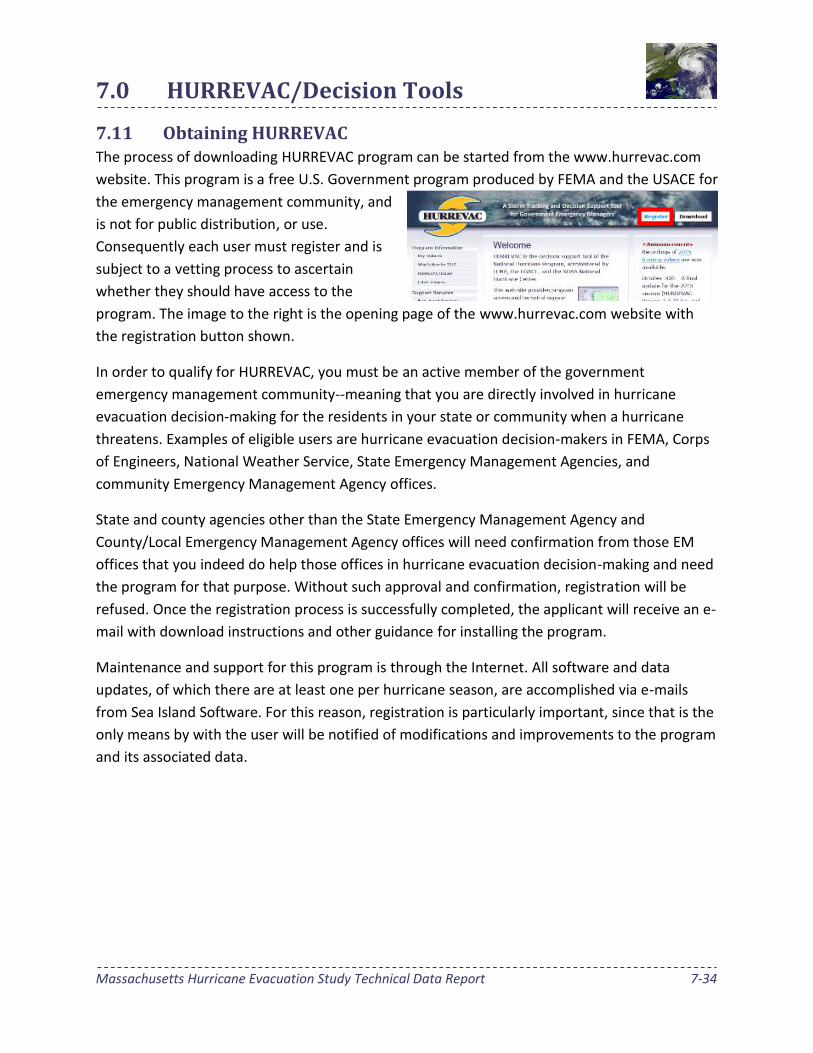
7.11 Obtaining HURREVAC The process of downloading HURREVAC program can be started from the www.hurrevac.com
website. This program is a free U.S. Government program produced by FEMA and the USACE for
the emergency management community, and
is not for public distribution, or use.
Consequently each user must register and is
subject to a vetting process to ascertain
whether they should have access to the
program. The image to the right is the opening page of the www.hurrevac.com website with
the registration button shown.
In order to qualify for HURREVAC, you must be an active member of the government
emergency management community--meaning that you are directly involved in hurricane
evacuation decision-making for the residents in your state or community when a hurricane
threatens. Examples of eligible users are hurricane evacuation decision-makers in FEMA, Corps
of Engineers, National Weather Service, State Emergency Management Agencies, and
community Emergency Management Agency offices.
State and county agencies other than the State Emergency Management Agency and
County/Local Emergency Management Agency offices will need confirmation from those EM
offices that you indeed do help those offices in hurricane evacuation decision-making and need
the program for that purpose. Without such approval and confirmation, registration will be
refused. Once the registration process is successfully completed, the applicant will receive an e-
mail with download instructions and other guidance for installing the program.
Maintenance and support for this program is through the Internet. All software and data
updates, of which there are at least one per hurricane season, are accomplished via e-mails
from Sea Island Software. For this reason, registration is particularly important, since that is the
only means by with the user will be notified of modifications and improvements to the program
and its associated data.