Embed Size (px)
Citation preview
28
A E S T I T I OM A
RESEARCH ARTICLE aestimatio, the ieb international journal of finance, 2013. 7: 28-47
© 2013 aestimatio, the ieb international journal of finance
Profits and extraordinary profits in theSpanish economy during the 2000’s López Martínez, Félix Dávila Cano, LorenzoLópez Bernardo, Javier
� RECEIVED : 4 OCTOBER 2012
� ACCEPTED : 6 APRIL 2013
Abstract
This paper intends to explain the sources of profits in the Spanish economy during thelast decade, a period of time that comprises several years of sustained growth (2000 -2007) and the years since the global financial crisis, which started at the end of 2007.First, we will examine briefly the theory of profits in the history of economic thought,seeing that despite the importance of profits for a capitalist system, economists havetended to ignore them, not offering any explanation about their determination andgeneration. Then, we will look at the evolution of profits in the Spanish economy inthe period 2000-2011. Doing this, we will take advantage of the method first devisedby Jerome Levy and Michal Kalecki in the 1910’s and 1930’s, respectively. We will seethat, contrary to the general belief among economists and businessmen, profits LKhave soared since the beginning of the crisis in 2007, due mainly to the huge govern-ment deficits and the improvement in the foreign sector. Finally, we will compare ourmeasure of profits against other common measures, such as the Madrid Stock Ex-change volume of profits or the Bank of Spain’s Central Balance Sheet Data Office, fo-cusing on the impact of capital gains on the business sector and concluding that theprospects for profits in the following years are quite gloomy.
Keywords:
National accounts, Business profits, Sources of profits, Levy-Kalecki’s profit equation,capital gains.
JEL classification:
E00, E12, E20, O50.
López Martínez, F. Escuela de Organización Industrial (EOI), Madrid. (0034) 629 70 43 47. E-mail: [email protected]
Dávila Cano, L. Instituto de Estudios Bursátiles (IEB), Madrid. (0034) 679 19 27 19. E-mail: [email protected]
López Bernardo, J. Kingston University, London. (0034) 629 27 72 63. E-mail: [email protected]
29
A E S T I T I OM A
29
aestimatio, the ieb international journal of finance, 2013. 7: 28-47© 2013 aestimatio, the ieb international journal of finance
beneficios y beneficios extraordinarios en la economía española durante la década del 2000
López Martínez, Félix Dávila Cano, LorenzoLópez Bernardo, Javier
Resumen
El presente artículo intenta explicar los determinantes de los beneficios en la economíaespañola durante la última década, período de tiempo que comprende varios años decrecimiento continuo (2000-2007) y los años desde el comienzo de la crisis financieraglobal, que comenzó a finales de 2007. En primer lugar, examinaremos brevemente la te-oría de los beneficios en la historia del pensamiento económico, subrayando que, a pesarde la importancia de los beneficios para un sistema capitalista, los economistas han ten-dido a ignorarlos, ofreciendo pocas explicaciones sobre su determinación y generación.En segundo lugar, mostraremos la evolución de los beneficios en la economía españolaen el período 2000-2011. Para tal fin, usaremos el método desarrollado por primera vezpor Jerome Levy y Michal Kalecki en la década de 1910 y 1930, respectivamente. Veremosque, en contra de la creencia generalizada entre economistas y empresarios, los beneficiosLK han aumentado desde el inicio de la crisis en 2007, debido principalmente a los enor-mes déficits gubernamentales y a la mejora del sector exterior. Por último, compararemosnuestra medida de los beneficios contra otras medidas habituales, tales como el volumende beneficios de las empresas de la Bolsa de Madrid o los datos de la Central de Balancesdel Banco de España, centrándonos en el impacto de las ganancias de capital sobre elsector empresarial y concluyendo que las perspectivas de los beneficios para los próximosaños son bastante negativas.
Palabras clave:
Contabilidad nacional, beneficios empresariales, determinantes de los beneficios,ecuación de beneficios Levy-Kalecki, ganancias de capital.
n 1. Historical introduction
It is surprising to detect the scarce interest paid by economists to the theoretical
aspects of the determination of profits in a capitalist economy. In principle, it is an
atypical situation, given the importance everybody concedes to profits as the driver
of capitalist economies and their important role in the accumulation of capital and
economic growth. In fact, the entire history of the theory of profits has been advanced
besides the development of capitalism, with very little relevance to the practical affairs
of capitalists and investors.
The first effort to develop a comprehensive theory of profits was made by Classical
economists, especially by Adam Smith, David Ricardo and Karl Marx. According to
them, profits were central for the accumulation of capital and economic growth.
David Ricardo was the first to develop a model where profits could be calculated
once land rent and wages were deducted from income. Profits were a residual,
because land rent (determined by the rent of marginal land) had priority in
distribution over the rest of incomes, and wages were fixed at the subsistence level.
In this way, Ricardo was able to integrate profits into his framework and even offer a
profit theory for the long-run. Several decades later, and along Ricardo’s lines, Marx
put profits front and centre, pointed to them as the main engine of the capitalist
economy and eventually its main contradiction, due to their falling trend provoked
by the fundamental laws of capitalism. It is worthwhile to note that all these theories
were conceived under a very general framework of how an economic systems works,
being the scope more macro than micro.
This tradition was not followed by neoclassical economists, who were more focused
on the theory of prices and markets at the microeconomic level. Profits for the
neoclassicals are always equal to the marginal product of capital, so there is no need
to find any further explanation. This is also true of the macro distribution models
started by Robert Solow in the 1950s.
On the other hand, in the orthodox theory of the firm, built on the concepts of perfect
competition and perfect capital markets, the relationship between realized profits -
or cash-flow, the exogenous variable mostly considered - and investment is not clear.
Investment depends on investment opportunities (expected profits), without any
limits in their financing. Every investment is carried out once the cost of capital is covered.
If one leaves the world of perfect markets and ventures into the field of asymmetric
information (Myers and Majluf, 1984) and managerial discretion (Jensen, 1986), we
find a bunch of models that shed light on the positive relation between cash-flow
and investment; ideas very common among business managers that have received
empirical support in Fazzari et al. (1988). Thus, the importance of cash-flow is greaterProf
its a
nd e
xtra
ordi
nary
pro
fits
in t
he s
pani
sh e
cono
my
duri
ng t
he 2
000’
s. Ló
pez
Mar
tínez
, F.,
Dáv
ila C
ano,
L. a
nd L
ópez
Ber
nard
o, J.
aes
tim
atio
, th
eie
bin
tern
atio
na
ljo
urn
al
of
fin
an
ce,
2013
. 7: 2
8-47
A E S T I T I OM A
30

1 Over the last 30 years there has emerged an industry in which the understanding of profits is central. Somewhat outside the
conventional theory, a powerful financial theory of stock markets has been developed at the service of the financial advisory service
industry, and it is increasingly encroaching on several areas of economic theory. See Montier (2012).
Profits and extraordinary profits in the spanish economy during the 2000’s. López M
artínez, F., Dávila C
ano, L. and López Bernardo, J. a
estimatio
, the
iebin
ternatio
na
ljo
urn
al
of
fina
nc
e, 2013. 7: 28-47
A E S T I T I OM A
31
in smaller businesses than in bigger ones (Carpenter and Guariglia, 2003), investment
(or unproductive overinvestment) is greater in businesses with a larger degree of
managerial discretion (Jensen, 1986) and the influence of cash-flow is greater in
financial systems where capital markets prevail than in systems with predominance
of banking finance - i.e. United Kingdom vs. Germany (Bond et al., 2003). In any case,
this plethora of studies focused on the relationship between cash-flow and investment
has not exerted any influence on economic modeling nor in the theory of the
determination of profits itself.
If the theoretical aspects of the generation of profits have been so overlooked as to
justify the lack of contributions in the field - this is the impression given; for instance,
in most introductory or intermediate economics textbooks (Carlin and Soskice, 2006;
Froyen, 2009; Romer, 2011; Blanchard, 2012), no references to profits are made, it
is more surprising to see that its empirical analysis has suffered the same fate. In the
various books on the structure of the Spanish economy (Banco de España, 2005;
Tamames and Rueda, 2008; Chacón, 2009; García Delgado and Myro, 2011), there
is no chapter or section that gives us an indication or an idea of the business profits
generated in the economy; in fact, in most of them they do not even appear as a topic.
Out of the materials cited above, the situation is something better, but still deficient.
There are a limited number of empirical studies about the volume of profits and the
rate of profit in different countries (Bowles et al., 1986; Duménil and Lévy, 1993,
2011; Kliman, 2012). The main drawback of most of these studies is the difficulty of
data comparisons due to the different methodologies used and usually the lack of a
solid accounting formulation that serves as a base. Moreover, most of them are
constructed from a Marxist approach, which is not attractive for most of the
economists, ensuring thus a limited influence in the profession. Nevertheless, the
current situation is far better than it was 10 years ago, and it might be that we are at
the beginning of a critical takeoff phase in this field.1 The present paper is a
contribution in that direction.
n 2. Kalecki’s profits equation
Before we continue with the analysis of profits in the Spanish economy in the last
decade, we must provide an introduction of the theoretical approach advocated here.
The approach of examining the sources of profits at the macroeconomic level appears
for the first time in the economic literature in the writings of Jerome Levy in the 1910’s

and Michal Kalecki�s in 1930’s, although Kalecki had discovered the equation a few
years earlier (Levy, 1943; Kalecki, 1971). We may be startled to find out that it took
so long to find a convincing method to determine the macroeconomic level of
business profits, even more if we bear in mind that Classical economists, as we stated
before, were always very concerned with income distribution. Probably, the revival of
this approach was helped by the genesis of national accounting in the 1920’s; indeed,
Kalecki was one of the first to use national accounting such as we know it today.2
The difference between Levy and Kalecki’s methods is that the former computes
profits using data by institutional sectors (households, firms, etc.) while the latter
calculates the amount of profits using income social categories (capitalists and
workers). It is clear, however, that Levy’s method has many advantages dealing with
real data, given the actual display of national accounts. Kalecki’s method, on the
other hand, is more straightforward, and for this reason we think it is more suitable
as an introduction.
In order to show the simplicity of the proof, Kalecki starts with an economy that
may be conceptually divided between capitalists (whose income is capital rents)
and workers (whose income is wages), with neither a public sector nor a foreign
sector. Furthermore, he supposes workers do not save, spending all of their income
in consumption. Under these assumptions, that we will remove later, we can obtain
the macroeconomic accounting identity of the Gross Domestic Product (GDP),
from the income and demand side:
C+I≡Cc+Cw+I≡W+P
Where C is total consumption, Cc is capitalist consumption, Cw is workers
consumption, I is gross investment (both in fixed assets and in working capital), Wis the wage bill and P is gross business profits (profits before capital consumption).
Given we have assumed workers’ saving is nil, W is identical to Cw, so we can cancel
them to get:
P=Cc+I (1)
This expression, known as the simple Kalecki’s profits equation, states in our
simplified framework that gross business profits — the sum of the profits from the
non-financial and financial sectors — are equal to capitalist consumption plus gross
A E S T I T I OM A
Prof
its a
nd e
xtra
ordi
nary
pro
fits
in t
he s
pani
sh e
cono
my
duri
ng t
he 2
000’
s. Ló
pez
Mar
tínez
, F.,
Dáv
ila C
ano,
L. a
nd L
ópez
Ber
nard
o, J.
aes
tim
atio
, th
eie
bin
tern
atio
na
ljo
urn
al
of
fin
an
ce,
2013
. 7: 2
8-47
A E S T I T I OM A
32
2 However, unlike Kalecki, Levy did not derived his formula starting from general macroeconomic aggregates, but from a perfect count
of all possible transactions that a firm can do at individual level, and from there adding step by step these operations between firms
until he reached aggregated profits (Levy, 1943, 2001).

investment. Note that the expression is not longer an accounting identity, given that
we have introduced a behavioral assumption: workers do not save.
At first glance, the equation may create some confusions surrounding its
interpretation, since it establishes that profits move in the same direction and
amount that capitalists’ consumption, when common sense tell us just the
opposite. What it is happening here is that, although at microeconomic level it
seems a contradiction (someone who ‘consumes’ more has less ‘wealth’), at
macroeconomic level capitalists’ consumption is a stream of revenue from some
capitalists to others.
Investment or consumption of some capitalists creates profits for
others […] Thus capitalists, as a whole, determine their own profits
by the extent of their investment and personal consumption. In a way
they are ‘masters of their fate’; but how they ‘master’ it is determined
by objective factors, so that fluctuations of profits appear after all
to be unavoidable. (Kalecki, 1971, pp. 12-13).
Thus, Kalecki obtains the total volume of profits in a simple and neat way.
Then, Kalecki removes the previous assumptions to reach a more general equation,
including public and external sectors and allowing workers to save some part of their
income. As before, we can start from the two definitions of GDP, but now taking into
account the public and external sectors’ transactions:
WAT+PAT+T≡Cc+Cw+I+G+NX
Where WAT and PAT are wages and profits after taxes respectively, T is taxes (both
direct and indirect taxes), G is government expenditures and NX is net exports. If we
move taxes to the right-hand side of the identity and we deduct them from
government expenditures, we will have the government sector’s balance. Finally, if we
also move wages to the right-hand side of the identity and we deduct them from
workers’ consumption we will have workers’ saving. So we get:
PAT≡Cc+I–SG+NX–Sw (2)
Where SG is government surplus and Sw is workers’ savings.
The above expression says that macroeconomic business gross profits, now after taxes,
are equal to capitalists’ consumption, plus gross investment, minus (plus) government
surplus (deficit), plus (minus) external surplus (deficit) minus workers’ saving. It is
A E S T I T I OM A
Profits and extraordinary profits in the spanish economy during the 2000’s. López M
artínez, F., Dávila C
ano, L. and López Bernardo, J. a
estimatio
, the
iebin
ternatio
na
ljo
urn
al
of
fina
nc
e, 2013. 7: 28-47
A E S T I T I OM A
33

worthwhile to note that this expression is an accounting identity, since we have not
now advanced any behavioral assumption (the term that stands for workers’ saving
could be positive or nil).
From the previous expression we can see that profits depend negatively on the
government�s surplus and workers’ saving. Against the general opinion of many
economists and even many ‘captains of industry’, a reduction in government or
workers’ spending reduces macroeconomic profits; here, ‘abstinence’ or ‘austerity’
reduces business profits, since a part of the wages paid to workers do no return to
firms as income.
Furthermore, if the government deficit increases when investment
and thus income declines, then profits will not fall as they would in
the absence of the government deficit. In effect, Big Government rigs
the economic game so that profits are sustained; by sustaining
profits, government deficits can prevent the burden of business debt
from increasing during a recession. Furthermore, if the deficit is large
enough the burden of business debt may decrease during recessions.
(Minsky, 1986, pp.165-166)
Finally, a surplus (deficit) in the external sector increases (reduces) profits in the same
amount; here, the balance of payments works as a distribution mechanism of profits
between capitalists of different countries, and, given that the balance of payments is,
so to speak, the truly external part of the private sector of a country, an imbalance in
the balance of payments has direct consequences in the other sectoral balances of
the economy.
Finally, we have been discussing the profits equation with a causality component, in
the sense that profits were determined by the rest of the terms of the equation.
However, the equation as such is an accounting identity, and so it is illicit to suppose
any causality relationship without previous justification.
If we start from the equation without government and external sector, and no
workers’ savings, profits will be determined by capitalists’ consumption and
investment, since:
Now, it is clear that capitalists may decide to consume and to
invest more in a given period than in the preceding one, but they
cannot decide to earn more. It, therefore, their investment and
consumption decisions which determine profits, and not vice versa.
(Kalecki, 1971, pp.78-79)
A E S T I T I OM A
Prof
its a
nd e
xtra
ordi
nary
pro
fits
in t
he s
pani
sh e
cono
my
duri
ng t
he 2
000’
s. Ló
pez
Mar
tínez
, F.,
Dáv
ila C
ano,
L. a
nd L
ópez
Ber
nard
o, J.
aes
tim
atio
, th
eie
bin
tern
atio
na
ljo
urn
al
of
fin
an
ce,
2013
. 7: 2
8-47
A E S T I T I OM A
34
Thus, Kalecki is clear about the causality between profits and investment and capitalist
consumption. However, he did not address the causality analysis for the rest of the
components. Nevertheless, Giovannoni and Parguez (2005) have showed with an
unrestricted VAR model (more precisely, with a vector error-correction model, which
by definition does not suppose any behaviour a priori) and with Granger’s causality tests
that profits are the most endogenous variable of the system, both in the short-run and
in the long-run (Giovannoni and Parguez, 2005, p. 14). Their main results are:
1. Profits cannot be said autonomous, i.e. profits are very much more ‘caused’ (ordetermined) variables than ‘causing’ (or determining) variables.
2. In the short run, profits do always depend upon demand variables, especially upon
consumption, indebtness and government spending;
3. In the longer run, profits are again found to be dependent variables, but the factorsdetermining profits behavior are more income-variables, especially rents.
4. ‘Discipline’ policies are doomed to fail until the desirable goal of balancing thebudget is understood as a means rather than a natural outcome of a demand-driven
growth. (Giovannoni and Parguez, 2005, p. 1, emphasis original).
We can provide a heuristic analysis to shed some light into these results. In the case
of workers’ saving, it is clear that it is a case symmetrical to capitalists’
consumption: workers can decide how much they will save but capitalists cannot
decide how much they will earn. The relationship with exports and imports is also
quite neat: although it could be argued that a higher level of profits might lead
somehow to an increase in imports (it might be due to an increase in the imported
capital goods), it would be only after a certain period of time, while the impact of
exports is instantaneous – as soon as the firm books the transaction in its profit and
loss statement. Finally, the same reasons can be applied to the government’s
balance. While an increase in profits raises corporate income tax (improving then
the government’s balance), it must be taken into account that the government
revenues for this year depend on the profits of the last year, while the impact of
government deficit on profits is, again, instantaneous: as soon as the firm books
the transaction in its profit and loss statement – it must be noted that some of the
government expenditure could go to other sector of the economy, so in that case
that amount would have to be adjusted.3 That is true that in any complex system,
virtually every variable is to a certain extent endogenous, but in this case there are
good reasons to consider profits as the residual of the ‘economic machine’ (a claim
that will sound very natural for an businessman, who finds the profit at the end of
the year after a series of transactions with the rest of the system).
A E S T I T I OM A
3 In the case of going abroad, that government expenditure would not have any direct effect on profits.
Profits and extraordinary profits in the spanish economy during the 2000’s. López M
artínez, F., Dávila C
ano, L. and López Bernardo, J. a
estimatio
, the
iebin
ternatio
na
ljo
urn
al
of
fina
nc
e, 2013. 7: 28-47
A E S T I T I OM A
35
4 The causality about the basic macro accounting identities has been a lively topic in the heterodox schools (especially among post-
Keynesians). For instance, the New Cambridge tradition in the 1970s took the balance of the private sector as given by a stock-flow
norm, the ratio between disposable income and the financial assets hold by the private sector (Zezza, 2009; Shaikh, 2012), with the
result that government and external balances showed the twin-deficit outcome. Recently, a new baking of these models has proved
their superiority in forecasting the last two financial crises (Godley, 1999; Zezza, 2009; Bezemer, 2010). Although these models bear
some resemblance with the Levy-Kalecki’s approach advocated here, we will not follow their analysis in the paper, because these
models usually treat the private sector as a whole, without any distinction between households and corporations. An up-to-date
reference in the field is Papadimitriou and Zezza (2012).
5 In fact, the actual derivation corresponds to Levy et al. (1997), as it has mentioned earlier, Jerome Levy derived the equation in a
different way. See Levy (2001).
Therefore, we can suppose a causality from profits sources to profits, and not vice
versa, and so to obtain an equation that serves to explain the fluctuations of profits
referring to their sources.4
n 3. Levy’s profits equation
We can now move on to the Levy’s profits determination,5 which has the important
advantage to express profits in sectoral terms, rather than in income social categories
(capitalists and workers). If we start from the investment-saving identity, considered
as net investment and net saving (deducted capital consumption):
I = S
Total savings can be expressed as the sum of sectoral savings, i.e.:
I=SH+SE+SG –NX
Where SH is the saving of the household sector, SE is financial and non financial
business saving, SG is the budget balance of Government and NX is net exports (it
has negative sign because is a dissaving for the rest of the world). Taking into account
that SE stands for net profits after taxes and dividends, we get the following expression:
NPATD = I – SH –SG –NX
Where NPATD is net profits after taxes and dividends – that is to say, retained earnings.
If we add dividends, we get the following expression:
NPAT = I – SH –SG –NX+ D (3)
The meaning is identical to the Kalecki’s equation, but now profits are expressed as
the sum of investment, dividends and three sectoral balances, and not as class income
balances. The difference now is that profits are net profits after depreciations, or profits
A E S T I T I OM A
Prof
its a
nd e
xtra
ordi
nary
pro
fits
in t
he s
pani
sh e
cono
my
duri
ng t
he 2
000’
s. Ló
pez
Mar
tínez
, F.,
Dáv
ila C
ano,
L. a
nd L
ópez
Ber
nard
o, J.
aes
tim
atio
, th
eie
bin
tern
atio
na
ljo
urn
al
of
fin
an
ce,
2013
. 7: 2
8-47
A E S T I T I OM A
36
as any accountant would understand them. In any case, depreciations may be added
or removed in (2) or (3) to get an identical result.
Finally, we would like to add an important remainder here. The Levy-Kalecki’s
approach of the generation of profits and national accounts, since they deal only with
the flows of real transactions, neglects a fundamental component of business profits,
the extraordinary results (i.e. capital gains), in the sense of profits derived from the
change in the valuation of assets. That is to say, in order to get the real magnitude of
business profits we had to include in the Levy-Kalecki’s equation these extraordinary
profits. Thus, this definition of macroeconomic profits (Levy-Kalecki’s profits plus
extraordinary ones) is very similar to the definition of corporate profits after taxes as
any business accountant might understand it. The omission of extraordinary profits,
as we will see later, can lead to serious misunderstandings of the profits trend in the
last few years.6
n 4. An analysis of the profits sources in the last decade
We can now use this theoretical framework to understand the performance of Spanish
macroeconomic profits during the last decade.7 We will take the advantage of the
Levy’s formulation, because as it was explained above, it has the advantage to be
framed in sectoral terms, being the magnitudes of the national accounts directly
applicable. Therefore, the following analysis is carried out using equation (3). The
data of the Spanish national accounts are accessible in the Central Bank of Spain
webpage.8
The Spanish national accounts are framed in the European System of National Accounts
1995 (1995 ESA, hereafter) methodology (Banco de España, 2011), which is the
European version of the System of National Accounts 1993 (1993 SNA, hereafter). For
our purposes, it is worthwhile to note that, unlike the United States national accounts
(NIPA), neither the 1995 ESA nor 1993 SNA present series of corporate profits.9 In
A E S T I T I OM A
6 In the rest of the paper, we will stick to the term extraordinary profits rather than capital gains, using thus the terminology applied
by financial accountants at the level of the firm.
7 Because it is not the purpose of this paper, we will treat profits as a whole, and we will not make any distinction between the evolution
of profits in the non-financial sector and the evolution of profits in the financial sector, being this point an area with importance on
its own for further research. Although recently an important interest on the process of financialisation and its ties with the (functional)
income distribution has begun to emerge (Stockhammer, 2004; Onaran et al., 2011), little attention has been paid to the effects of
financialisation on the distribution of profits.
8 The link is: <http://www.bde.es/webbde/es/estadis/ccff/cfcap1.html>.1
9 It does not mean that macroeconomic profit series are unavailable for these countries. The statistical agencies of these countries
report GDP with the income side identity, so profits can be readily obtained. What it means is that profits are not in the set of accounts
of the 1995 ESA framework. The closest proxy reported for profits in the 1995 ESA is the item called gross saving. We had to sum
the gross saving of the non-financial and financial sector to get this proxy for profits. The largest difference between gross savings and
profits is mainly due to the exclusion of fixed capital depreciation.
Profits and extraordinary profits in the spanish economy during the 2000’s. López M
artínez, F., Dávila C
ano, L. and López Bernardo, J. a
estimatio
, the
iebin
ternatio
na
ljo
urn
al
of
fina
nc
e, 2013. 7: 28-47
A E S T I T I OM A
37
fact, this is one of the differences that ‘will most likely continue’ between the NIPA
and the 1995 ESA (Lequiller and Blades 2006, p.353), due mainly to the traditional
public concern on profits in United States.10
As we have said before, all the items in equation (3) have readily counterparts in the
national accounts. Investment, I, (called gross capital formation in the national accounts)
is probably the less straightforward concept, because it is made up not only by gross
fixed capital formation, but also by change in inventories and by acquisitions less
disposals of valuables of the private sector (government investment is included in the
government sector). Because depreciation is an expense in the accounts of the firms,
the investment reported here is net of depreciation – if we would like to carry out the
analysis in terms of cash-flow, depreciation should not be removed. The term NXstands for the external balance and the term D, dividends, is calculated summing thedividends paid to the rest of the sectors by non-financial and financial corporations.
Finally, the household and government savings have direct counterparts in the
national accounts, and for our purpose no additional adjustments are required.
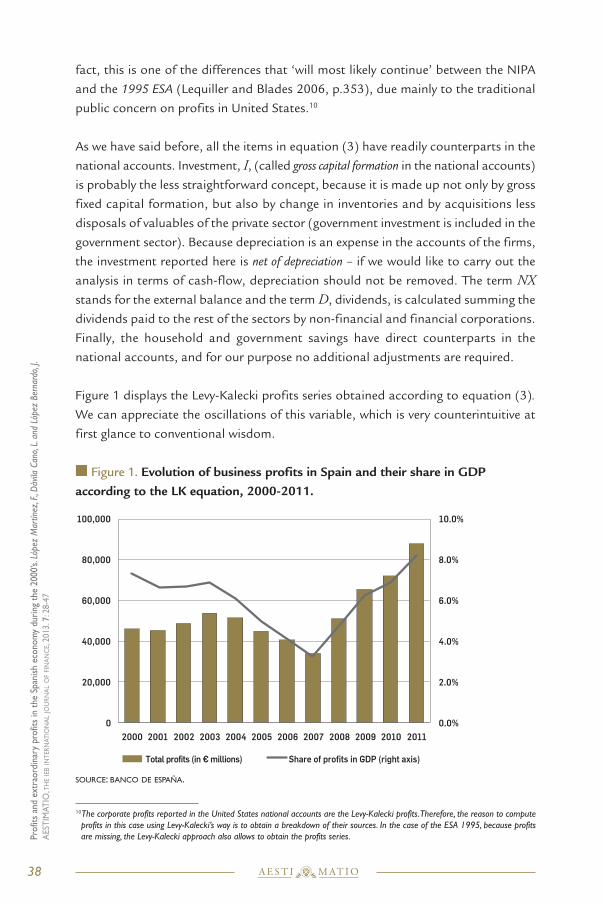
Figure 1 displays the Levy-Kalecki profits series obtained according to equation (3).
We can appreciate the oscillations of this variable, which is very counterintuitive at
first glance to conventional wisdom.
n Figure 1. Evolution of business profits in Spain and their share in GDPaccording to the LK equation, 2000-2011.
source: banco de esPaña.
A E S T I T I OM A
Prof
its a
nd e
xtra
ordi
nary
pro
fits
in t
he s
pani
sh e
cono
my
duri
ng t
he 2
000’
s. Ló
pez
Mar
tínez
, F.,
Dáv
ila C
ano,
L. a
nd L
ópez
Ber
nard
o, J.
aes
tim
atio
, th
eie
bin
tern
atio
na
ljo
urn
al
of
fin
an
ce,
2013
. 7: 2
8-47
A E S T I T I OM A
38
0.0%
2.0%
4.0%
6.0%
8.0%
10.0%
0
20,000
40,000
60,000
80,000
100,000
2000 2001 2002 2003 2004 2005 2006 2007 2008 2009 2010 2011
Total profits (in € millions) Share of profits in GDP (right axis)
10The corporate profits reported in the United States national accounts are the Levy-Kalecki profits. Therefore, the reason to compute
profits in this case using Levy-Kalecki’s way is to obtain a breakdown of their sources. In the case of the ESA 1995, because profits
are missing, the Levy-Kalecki approach also allows to obtain the profits series.

The Levy-Kalecki profits (LK profits from now on) in the Spanish economy reached a
pre crisis peak of €73bn. in 2003, diminishing to €37bn. in 2007, then rebounding
to €82bn. in 2011, the record amount of the series. The “counterintuitive” aspect of
the series so calculated is that an observer of the economic situation in the boom
period would have normally thought that profits would be increasing, surpassing the
figures of the previous years and in correspondence with the evolution of the stock
market. In the year 2011, the same observer would have been surprised looking at
the evolution since 2007, being the level of profits in 2011 two and half times more
than 4 years before.
We can compare this assessment of the Spanish business profits against two other
profits series: the profit series of the Madrid Stock Exchange11 (MSE hereafter) listed
companies and the Central Balance Sheet Data Office12 (CBS hereafter) series;
both of them offer us the data that provides the basis for the conventional feeling
about the evolution of profits in this period, which reached its peak in 2007, then
falling in 2008 and not recovering the pre crisis levels since then. This evolution is
shown in Figure 2.
n Figure 2. Evolution of profits reported by the Central Balance Sheet DataOffice and Madrid Stock Exchange, 2004-2010.
source: madrid stock exchange and central balance sheet data office.
How can we explain the difference between LK profits and the series presented in
Figure 2? Which one allows us to understand better the working of an economic
system?
A E S T I T I OM A
Profits and extraordinary profits in the spanish economy during the 2000’s. López M
artínez, F., Dávila C
ano, L. and López Bernardo, J. a
estimatio
, the
iebin
ternatio
na
ljo
urn
al
of
fina
nc
e, 2013. 7: 28-47
A E S T I T I OM A
39
11 The data is provided by BME. http://www.bolsamadrid.es/ing/portada.htm. 1
12 Documents about Central Balance Sheet Office and the data may be found in http://www.bde.es/webbde/en/areas/cenbal/.1
0
10,000
20,000
30,000
40,000
50,000
60,000
2004 2005 2006 2007 2008 2009 2010
CBS Profits (in € millions) MSE Profits (in € millions)
The traditional way in which businesses present their profits (the way used by the
MSE and the CBS), although it is suitable for the understanding of profits at
enterprise level does not offer many clues about the profits sources at macroeconomic
level. The LK equation has the advantage that it allows us to track the sources where
profits are generated from very concrete macroeconomic aggregates (i.e. investment,
government and external balance), tying thus profits evolution to economic activity.
Figure 3 do this, rendering the evolution of profits and their components according
to Equation (3):
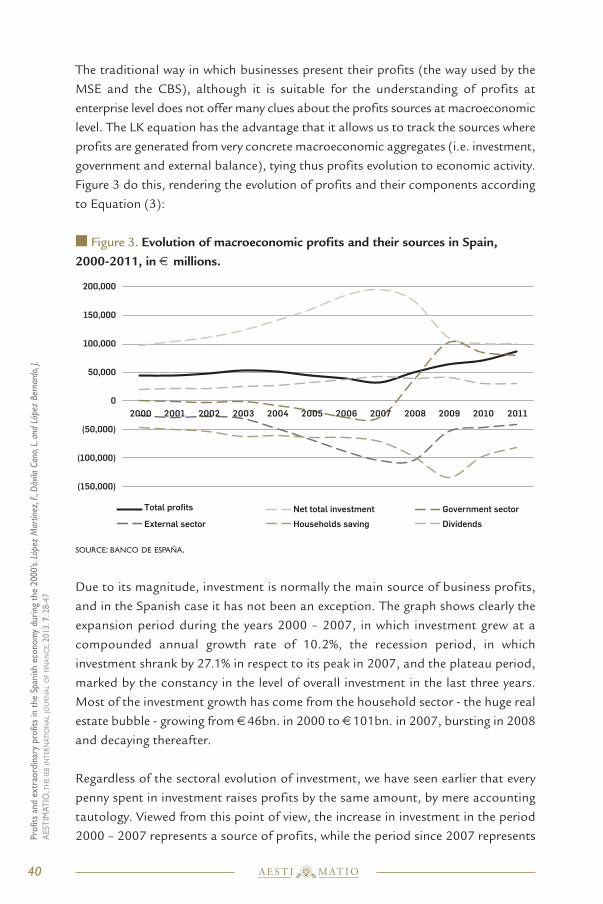
n Figure 3. Evolution of macroeconomic profits and their sources in Spain, 2000-2011, in € millions.
source: banco de esPaña.
Due to its magnitude, investment is normally the main source of business profits,
and in the Spanish case it has not been an exception. The graph shows clearly the
expansion period during the years 2000 – 2007, in which investment grew at a
compounded annual growth rate of 10.2%, the recession period, in which
investment shrank by 27.1% in respect to its peak in 2007, and the plateau period,
marked by the constancy in the level of overall investment in the last three years.
Most of the investment growth has come from the household sector - the huge real
estate bubble - growing from €46bn. in 2000 to €101bn. in 2007, bursting in 2008
and decaying thereafter.
Regardless of the sectoral evolution of investment, we have seen earlier that every
penny spent in investment raises profits by the same amount, by mere accounting
tautology. Viewed from this point of view, the increase in investment in the period
2000 – 2007 represents a source of profits, while the period since 2007 represents
A E S T I T I OM A
Prof
its a
nd e
xtra
ordi
nary
pro
fits
in t
he s
pani
sh e
cono
my
duri
ng t
he 2
000’
s. Ló
pez
Mar
tínez
, F.,
Dáv
ila C
ano,
L. a
nd L
ópez
Ber
nard
o, J.
aes
tim
atio
, th
eie
bin
tern
atio
na
ljo
urn
al
of
fin
an
ce,
2013
. 7: 2
8-47
A E S T I T I OM A
40
(150,000)
(100,000)
(50,000)
0
50,000
100,000
150,000
200,000
2000 2001 2002 2003 2004 2005 2006 2007 2008 2009 2010 2011
Total profits Net total investment Government sector
External sector Households saving Dividends
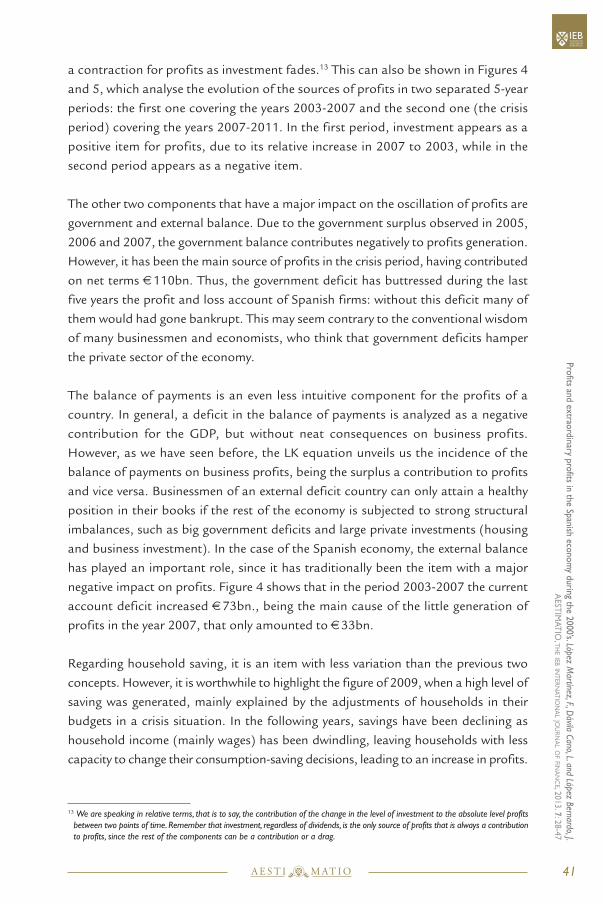
a contraction for profits as investment fades.13 This can also be shown in Figures 4
and 5, which analyse the evolution of the sources of profits in two separated 5-year
periods: the first one covering the years 2003-2007 and the second one (the crisis
period) covering the years 2007-2011. In the first period, investment appears as a
positive item for profits, due to its relative increase in 2007 to 2003, while in the
second period appears as a negative item.
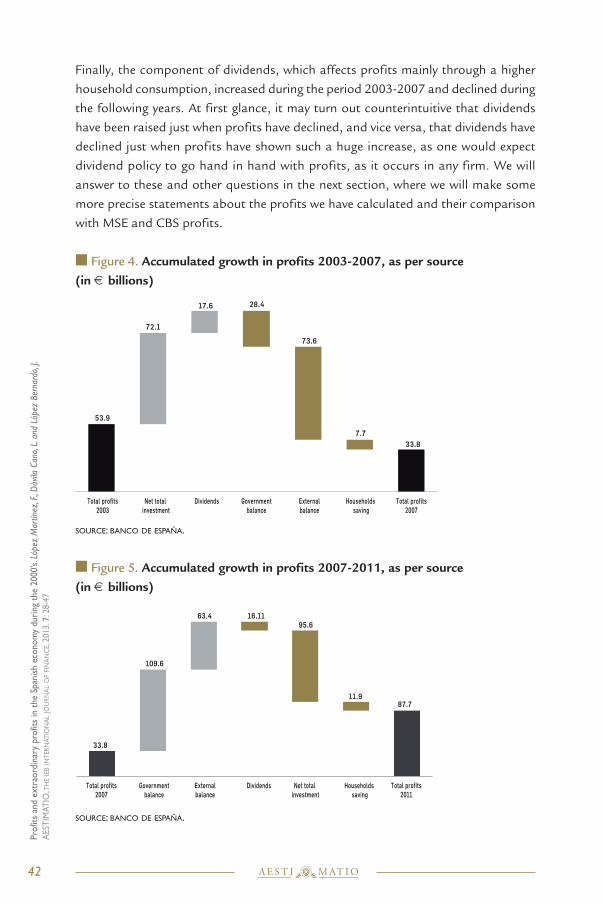
The other two components that have a major impact on the oscillation of profits are
government and external balance. Due to the government surplus observed in 2005,
2006 and 2007, the government balance contributes negatively to profits generation.
However, it has been the main source of profits in the crisis period, having contributed
on net terms €110bn. Thus, the government deficit has buttressed during the last
five years the profit and loss account of Spanish firms: without this deficit many of
them would had gone bankrupt. This may seem contrary to the conventional wisdom
of many businessmen and economists, who think that government deficits hamper
the private sector of the economy.
The balance of payments is an even less intuitive component for the profits of a
country. In general, a deficit in the balance of payments is analyzed as a negative
contribution for the GDP, but without neat consequences on business profits.
However, as we have seen before, the LK equation unveils us the incidence of the
balance of payments on business profits, being the surplus a contribution to profits
and vice versa. Businessmen of an external deficit country can only attain a healthy
position in their books if the rest of the economy is subjected to strong structural
imbalances, such as big government deficits and large private investments (housing
and business investment). In the case of the Spanish economy, the external balance
has played an important role, since it has traditionally been the item with a major
negative impact on profits. Figure 4 shows that in the period 2003-2007 the current
account deficit increased €73bn., being the main cause of the little generation of
profits in the year 2007, that only amounted to €33bn.
Regarding household saving, it is an item with less variation than the previous two
concepts. However, it is worthwhile to highlight the figure of 2009, when a high level of
saving was generated, mainly explained by the adjustments of households in their
budgets in a crisis situation. In the following years, savings have been declining as
household income (mainly wages) has been dwindling, leaving households with less
capacity to change their consumption-saving decisions, leading to an increase in profits.
A E S T I T I OM A
Profits and extraordinary profits in the spanish economy during the 2000’s. López M
artínez, F., Dávila C
ano, L. and López Bernardo, J. a
estimatio
, the
iebin
ternatio
na
ljo
urn
al
of
fina
nc
e, 2013. 7: 28-47
A E S T I T I OM A
41
13 We are speaking in relative terms, that is to say, the contribution of the change in the level of investment to the absolute level profits
between two points of time. Remember that investment, regardless of dividends, is the only source of profits that is always a contribution
to profits, since the rest of the components can be a contribution or a drag.
Finally, the component of dividends, which affects profits mainly through a higher
household consumption, increased during the period 2003-2007 and declined during
the following years. At first glance, it may turn out counterintuitive that dividends
have been raised just when profits have declined, and vice versa, that dividends have
declined just when profits have shown such a huge increase, as one would expect
dividend policy to go hand in hand with profits, as it occurs in any firm. We will
answer to these and other questions in the next section, where we will make some
more precise statements about the profits we have calculated and their comparison
with MSE and CBS profits.
n Figure 4. Accumulated growth in profits 2003-2007, as per source (in € billions)
source: banco de esPaña.
n Figure 5. Accumulated growth in profits 2007-2011, as per source (in € billions)
source: banco de esPaña.
A E S T I T I OM A
Prof
its a
nd e
xtra
ordi
nary
pro
fits
in t
he s
pani
sh e
cono
my
duri
ng t
he 2
000’
s. Ló
pez
Mar
tínez
, F.,
Dáv
ila C
ano,
L. a
nd L
ópez
Ber
nard
o, J.
aes
tim
atio
, th
eie
bin
tern
atio
na
ljo
urn
al
of
fin
an
ce,
2013
. 7: 2
8-47
A E S T I T I OM A
42
53.9
72.1
17.6 28.4
73.6
7.733.8
Total profits2003
Net total investment
Dividends Governmentbalance
Externalbalance
Total profits2007
Households saving
109.6
63.4 16.11
11.9
Total profits2007
Governmentbalance
Externalbalance
Dividends Net total investment
Households saving
Total profits2011
87.7
33.8
95.6

n 5. The importance of extraordinary profits
As we said earlier, the LK framework neglects a fundamental component of business
profits, the extraordinary results. The MSE and CBS series showed the divergence of
the evolution of profits with respect to the LK series. However, these series have less
coverage in terms of number of firms, and so they do not allow us to make a
comparison in absolute terms with the LK series. To this end, we have created a proxy
of business profits, including extraordinary ones, calculating them as a stable relation
to dividends; that is to say, it has been supposed a constant pay-out ratio, equal to
the average pay-out of the considered period. As we have applied the pay-out ratio
to LK profits, we have labelled this new series LK profits plus extraordinary. Figure 6
displays the differences between both series.
n Figure 6. Evolution LK profits vs. LK profits + extraordinary (in € millions),2000-2011
source: banco de esPaña and own elaboration.
This new series looks like the MSE and CBS ones. The oscillations in extraordinary
profits are very important for the behaviour of reported business profits, being their
main component in the boom period 2003-2007 and affecting negatively thereafter.
This behaviour is mainly related to the evolution of asset prices, increasing in periods
of expansion (and with them the size of balance sheets) and declining in recession
periods (producing a shrinkage in balance sheets). This behaviour also displays
positive feedback effects: assets with ever increasing prices generate extraordinary
profits, which in turn generate higher valuations. Therefore, in some periods balance
sheet effects are as important as flow effects traditionally considered by economists.
While economic literature has produced a huge amount of research in the last 60
years about the wealth effects on household consumption (Slacalek 2009; Sousa,
2009), very little has been said about the impact of these effects in the business sector.
A E S T I T I OM A
Profits and extraordinary profits in the spanish economy during the 2000’s. López M
artínez, F., Dávila C
ano, L. and López Bernardo, J. a
estimatio
, the
iebin
ternatio
na
ljo
urn
al
of
fina
nc
e, 2013. 7: 28-47
A E S T I T I OM A
43
0
10,000
20,000
30,000
40,000
50,000
60,000
70,000
80,000
90,000
100,000
2000 2001 2002 2003 2004 2005 2006 2007 2008 2009 2010 2011
LK profits LK profits + extraordinary
S
So, an analysis of extraordinary profits is fundamental to achieve a comprehensive
framework of business profits evolution.
Although it is not the purpose of this paper, because the subject would deserve a
separate paper, we may try an estimate of the evolution of total profits — LK plus
extraordinary — in 2012. At first glance, the only component we expect to improve in
2012 is the external sector, with an improvement of €10bn. in current account taking
into consideration the evolution in the first half of the year, but depending critically on
the price of oil and the decrease in imports on the second half of the year. The rest of
the components will probably contribute negatively, specially fixed capital investment
and government balance, although the latter depending on the success of the austerity
measures put forward by the Government. Regarding to household saving, the trend
signals similar figures (a larger propensity to save matched by a lower level of household
income), with no effect on profits. Finally, dividends are expected to shrink, as provisions
of financial sector will impact heavily on while non-financial firms are announcing
dividend cuts.14 On the whole, we may surmise a level of LK profits on 2012 around
€75 bn. Capital gains will contribute negatively to total profits as write-downs in the
banking industry substantially increase due to regulatory requirements.15
n 6. Conclusion and final remarks
From Classical economists, profits have been considered the fundamental engine of
capitalist economies and their main motivator. However, economists today advance
their theoretical models and formulate their forecasts with no reference to any
estimation of macroeconomic profits, not even knowing what factors at the
macroeconomic level determine them. In this regard, the equation derived
independently by Levy and Kalecki provides a neat and convincing explanation about
the process of profits generation in any economy.
With the help of this equation, we have analyzed the profits generation pattern of the
Spanish economy during the last decade, showing that during the last few years there
have been two different configurations: the boom period, marked by the reduction
of LK profits and by the inordinate contribution of investment to profits, and the
recession period, where LK profits have soared due to the reduction in the external
deficit and the increase in government deficit, being the latter the automatic stabilizer
which has prevented the total collapse of business profits.
A E S T I T I OM A
Prof
its a
nd e
xtra
ordi
nary
pro
fits
in t
he s
pani
sh e
cono
my
duri
ng t
he 2
000’
s. Ló
pez
Mar
tínez
, F.,
Dáv
ila C
ano,
L. a
nd L
ópez
Ber
nard
o, J.
aes
tim
atio
, th
eie
bin
tern
atio
na
ljo
urn
al
of
fin
an
ce,
2013
. 7: 2
8-47
A E S T I T I OM A
44
14 As in the case of Telefónica, announcing a cancel of its dividend for 2012.
15 This forecast was made in June’12, prior to the sending of the first draft of the paper to the IAES. As of 27th November, we can
read in the financial press that business profits have plummeted a 57% (from January to September), the biggest fall in the historical
series. The article can be read in the following link: http://www.expansion.com/2012/11/27/economia/1354020238.html.1
A E S T I T I OM A
It has been seen that although the determination of profits through the LK method is a
powerful tool, since it underlines the operative determinants of profits, it leaves out an
important item for business profits, the extraordinary profits derived from asset price
changes that we have called balance sheet effects. It has been shown that this item dis-
plays at the aggregate level procyclical behaviour, and once it is included in the LK equa-
tion, the profits so calculated fall close to the trend display by the MSE and CBS profits.
Finally, profits expectations for the next years are quite gloomy, as the main driver
that has sustained profits in the last few years, the government deficit, will probably
fade for the austerity measures imposed in the Euro area.16
n Acknowledgements
The authors would like to acknowledge the useful comments provided by the
participants of the 74th International Atlantic Economic Conference, held in Canada
on 5th of October 2012. They would also like to acknowledge the useful suggestions
made by two anonymous referees and the several corrections made by Philip
Pilkington on an earlier draft of the paper. The usual disclaimer applies. This paper
represents the views of the authors and does not represent those of their institutions.
Additionally, one of us (JLB) would like to thank to the Ramon Areces Foundation
the financial aid provided for the continuation of his studies and research.
n References
n Banco de España (2011). Nota metodológica de las cuentas financieras de la economía española.
[online] Available at: <http://www.bde.es/f/webbde/SES/Secciones/Publicaciones/Publicaciones
Seriadas/NotasEstadisticas/07/Fic/nest05.pdf> [Accessed 25 January 2013]. 1
n Bezemer, D.J. (2010). Understanding financial crisis through accounting models, Accounting,
Organizations and Society, 35(7), pp. 676–688.
n Blanchard, O. (2012). Macroeconomics (6th ed.). Pearson Ed., New Jersey.
n Bond, S., Elston, J.A., Mairesse, J. and Mulkay, B. (2003). Financial Factors and Investment
in Belgium, France, Germany, and the United Kingdom: a Comparison Using Company Panel Data,
The Review of Economics and Statistics, 85(1), pp. 153–165.
n Bowles, S., Gordon, D. M. and Weisskopf, T.E. (1986). Power and Profits: the Social Structure of
Accumulation and the Profitability of the Postwar U.S. Economy. Review of Radical Political
Economics, 18(1-2), pp. 132–167.
Profits and extraordinary profits in the spanish economy during the 2000’s. López M
artínez, F., Dávila C
ano, L. and López Bernardo, J. a
estimatio
, the
iebin
ternatio
na
ljo
urn
al
of
fina
nc
e, 2013. 7: 28-47
A E S T I T I OM A
45
16 See previous footnote.
nCarlin, W. and Soskice, D.W. (2006). Macroeconomics: Imperfections, Institutions, and Policies. Oxford
University Press, Oxford, U.K.
n Carpenter, R.E. and Guariglia, A. (2008). Cash Flow, Investment, and Investment Opportunities:
New Tests Using UK Panel Data, Journal of Banking & Finance, 32, pp. 1894–1906.
n Chacón, E. M. (2009). Economía Española (2nd ed.), Ariel Economía y Empresa, Barcelona.
nDuménil, G. and Lévy, D. (1993). The Economics of the Profit Rate, Edward Elgar, Aldershot and Vermont.
nDuménil, G. and Lévy, D. (2011). The Crisis of Neoliberalism, Harvard University Press, Cambridge (USA).
n Fazzari, S.M., Hubbard, G. and Petersen, B.C. (1988). Financing Constraints and Corporate
Investment, Brookings Papers on Economic Activity, 1, pp. 141–206.
n Froyen, R. (2009). Macroeconomics (9th ed.), Prentice Hall, New Jersey.
n Giovannoni, O. and Parguez, A. (2005). What Drives Profits? An Inquiry into the Profit Paradox.
Eastern Economic Association Conference (pp. 1–31), New York.
n Godley, W. (1999). Seven Unsustainable Processes: Medium-Term Prospects and Policies for the
United States and the World, Levy Economics Institute of Bard College Special Report.
n Jensen, M.C. (1986). Agency Costs of Free Cash Flow, Corporate Finance, and Takeovers, The
American Economic Review, 76(2), pp. 323–329.
n Kalecki, M. (1954). Theory of Economic Dynamics, Allen and Unwin, London.
nKalecki, M. (1971). Selected Essays on the Dynamics of the Capitalist Economy, Cambridge University
Press, Cambridge (UK).
n Kliman, A. (2012). The Failure of Capitalist Production, Pluto Press, London.
n Lequiller, F. and Blades, D. (2006). Understanding National Accounts. OECD.
n Levy, D.A., Farnham, M.P. and Rajan, S. (2008). Where Profits Come From. Retrieved from http://
www.levyforecast.com/assets/Profits.pdf 1
n Levy, J. (1943). Economics is an Exact Science, New Economic Library, New York.
n Levy, J. (2001). Profits: the views of Jerome Levy and Michal Kalecki, Journal of Post Keynesian
Economics, 24(1), pp. 17–30.
nMinsky, H. (2008). Stabilizing an Unstable Economy (2nd ed.), McGraw Hill, New York.
nMyers, S.C. and N. Majluf (1984). Corporate Financing and Investment Decisions when Firms Have
Information that Investors do not Have, Journal of Financial Economics, 13, 187-221.
nGarcía Delgado, J.L. and Myro, R. (Eds.). (2011). Lecciones de Economía Española (10th ed.), Thomson-
Civitas, Madrid.
nMontier, J. (2012). What Goes Up, Must Come Down! [online] Available at: <http://www.zerohedge.com/
sites/default/files/images/user5/imageroot/2012/02/Montier - What goes up must come down.pdf>
[Accessed 26 January 2013]. 1
A E S T I T I OM A
Prof
its a
nd e
xtra
ordi
nary
pro
fits
in t
he s
pani
sh e
cono
my
duri
ng t
he 2
000’
s. Ló
pez
Mar
tínez
, F.,
Dáv
ila C
ano,
L. a
nd L
ópez
Ber
nard
o, J.
aes
tim
atio
, th
eie
bin
tern
atio
na
ljo
urn
al
of
fin
an
ce,
2013
. 7: 2
8-47
A E S T I T I OM A
46

47
A E S T I T I OM A
Profits and extraordinary profits in the spanish economy during the 2000’s. López M
artínez, F., Dávila C
ano, L. and López Bernardo, J. a
estimatio
, the
iebin
ternatio
na
ljo
urn
al
of
fina
nc
e, 2013. 7: 28-47
nOnaran, Ö., Stockhammer, E. and Grafl, L. (2011). Financialisation, Income Distribution and Aggregate
Demand in the USA, Cambridge Journal of Economics, 35(4), pp. 637–661.
n Papadimitriou, D. and Zezza, G. (Eds.). (2012). Contributions to Stock-Flow Modelling: Essays in Honor
of Wynne Godley, Palgrave MacMillan, Basingstoke.
n Romer, D. (2011). Advanced Macroeconomics (4th ed.). McGraw-Hill, New York.
n Servicio de Estudios del Banco de España (Ed.) (2005). El Análisis de la Economía Española. Alianza
Editorial, Madrid.
n Shaikh, A. (2012). Three Balances and Twin Deficits: Godley versus Ruggles and Ruggles. In
D. Papadimitriou & G. Zezza (Eds.), Contributions to Stock-Flow Modelling: Essays in Honor of Wynne
Godley (pp. 125–137). Palgrave MacMillan, Basingstoke.
n Slacalek, J. (2009). What Drives Personal Consumption? The Role of Housing and Financial Wealth,
ECB [WP1117], November.
n Stockhammer, E. (2004). Financialisation and the Slowdown of Accumulation, Cambridge Journal
of Economics, 28(5), pp. 719–741.
n Sousa, R.M. (2009). Wealth Effects on Consumption Evidence from the Euro Area, ECB [WP1050],
May.
n Tamames, R. and Rueda, A. (2008). Estructura Económica de España (25th ed.). Alianza Editorial,
Madrid.
n Zezza, G. (2009). Fiscal Policy and the Economics of Financial Balances, European Journal of
Economics and Economic Policies, 2(6), pp. 289–310.
n
A E S T I T I OM A


![prd Aestimatio vol-07 - IRCPS · 128 Aestimatio texts available ... Skutsch, and Ziegler 1968, 2.71]. Dorotheus was editedbyPingree[1976]. 15 Forfullreferencestotheavailableeditionsofthesetexts](https://img.pdfslide.us/doc/110x75/5ae082657f8b9a8f298e492f/prd-aestimatio-vol-07-aestimatio-texts-available-skutsch-and-ziegler-1968.jpg)