Embed Size (px)
Citation preview
The Missing Profits of Nations
Thomas Tørsløv (U. of Copenhagen)Ludvig Wier (U. of Copenhagen)Gabriel Zucman (UC Berkeley)
June 2018
Introduction
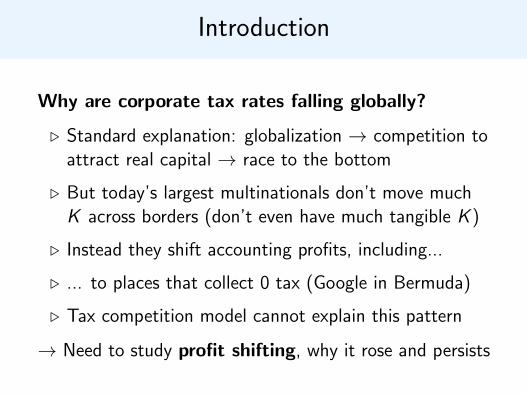
Why are corporate tax rates falling globally?
. Standard explanation: globalization → competition toattract real capital → race to the bottom
. But today’s largest multinationals don’t move muchK across borders (don’t even have much tangible K )
. Instead they shift accounting profits, including...
. ... to places that collect 0 tax (Google in Bermuda)
. Tax competition model cannot explain this pattern
→ Need to study profit shifting, why it rose and persists
This paper:New data and explanations
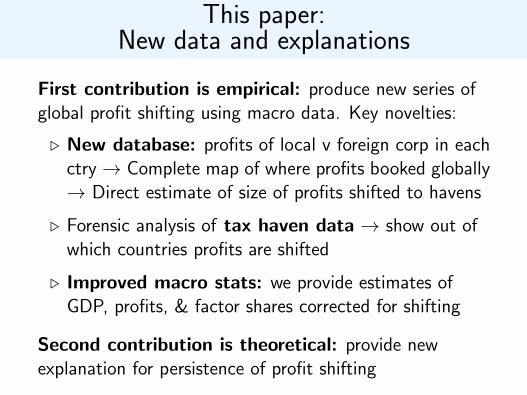
First contribution is empirical: produce new series ofglobal profit shifting using macro data. Key novelties:
. New database: profits of local v foreign corp in eachctry→ Complete map of where profits booked globally→ Direct estimate of size of profits shifted to havens
. Forensic analysis of tax haven data → show out ofwhich countries profits are shifted
. Improved macro stats: we provide estimates ofGDP, profits, & factor shares corrected for shifting
Second contribution is theoretical: provide newexplanation for persistence of profit shifting
Our results
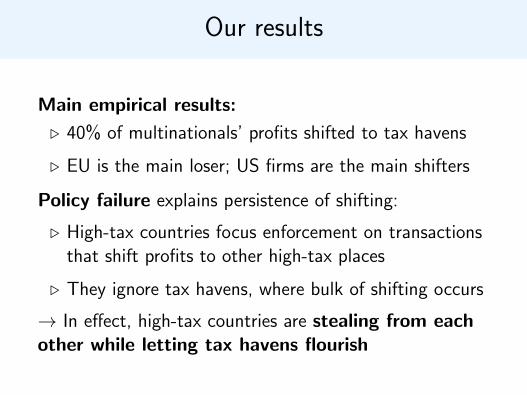
Main empirical results:
. 40% of multinationals’ profits shifted to tax havens
. EU is the main loser; US firms are the main shifters
Policy failure explains persistence of shifting:
. High-tax countries focus enforcement on transactionsthat shift profits to other high-tax places
. They ignore tax havens, where bulk of shifting occurs
→ In effect, high-tax countries are stealing from eachother while letting tax havens flourish
Implications for future of taxes andinequality
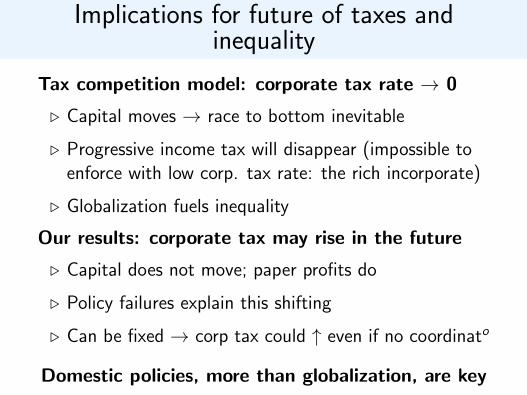
Tax competition model: corporate tax rate → 0
. Capital moves → race to bottom inevitable
. Progressive income tax will disappear (impossible toenforce with low corp. tax rate: the rich incorporate)
. Globalization fuels inequality
Our results: corporate tax may rise in the future
. Capital does not move; paper profits do
. Policy failures explain this shifting
. Can be fixed → corp tax could ↑ even if no coordinato
Domestic policies, more than globalization, are key
The size of
global profit-shifting
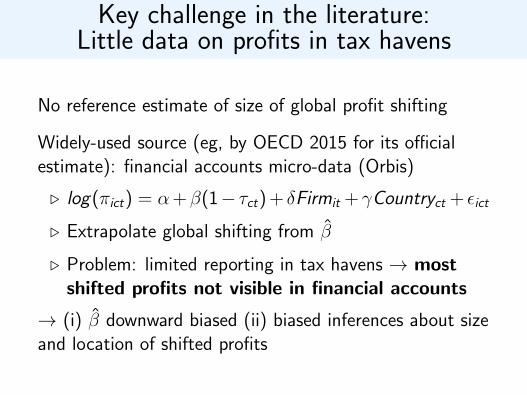
Key challenge in the literature:Little data on profits in tax havens
No reference estimate of size of global profit shifting
Widely-used source (eg, by OECD 2015 for its officialestimate): financial accounts micro-data (Orbis)
. log(πict) = α+β(1− τct) + δFirmit +γCountryct + εict
. Extrapolate global shifting from β̂
. Problem: limited reporting in tax havens → mostshifted profits not visible in financial accounts
→ (i) β̂ downward biased (ii) biased inferences about sizeand location of shifted profits
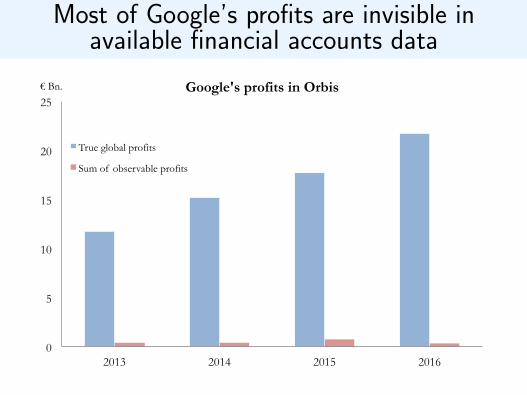
Most of Google’s profits are invisible inavailable financial accounts data
0
5
10
15
20
25
2013 2014 2015 2016
€ Bn. Google's profits in Orbis
True global profits
Sum of observable profits
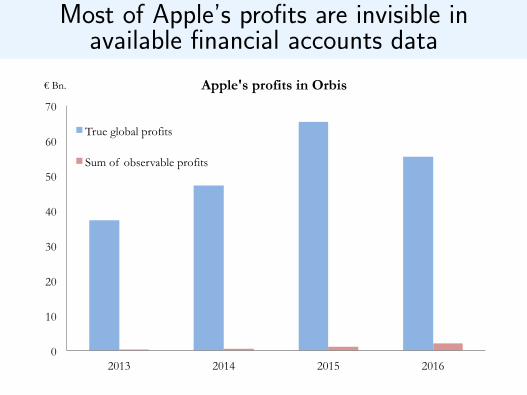
Most of Apple’s profits are invisible inavailable financial accounts data
0
10
20
30
40
50
60
70
2013 2014 2015 2016
€ Bn. Apple's profits in Orbis
True global profits
Sum of observable profits
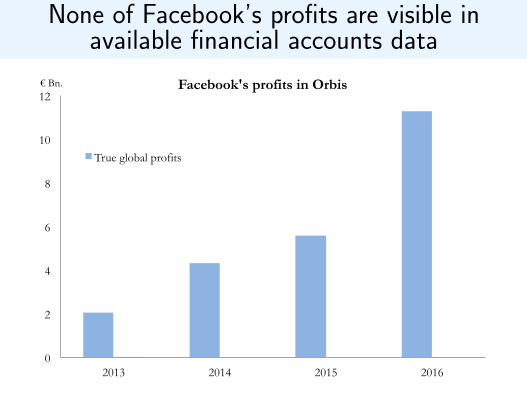
None of Facebook’s profits are visible inavailable financial accounts data
0
2
4
6
8
10
12
2013 2014 2015 2016
€ Bn. Facebook's profits in Orbis
True global profits
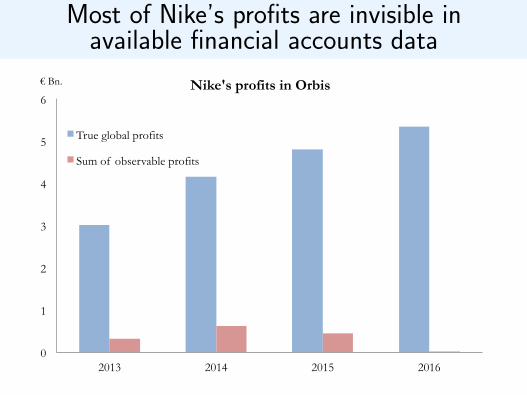
Most of Nike’s profits are invisible inavailable financial accounts data
0
1
2
3
4
5
6
2013 2014 2015 2016
€ Bn. Nike's profits in Orbis
True global profits
Sum of observable profits
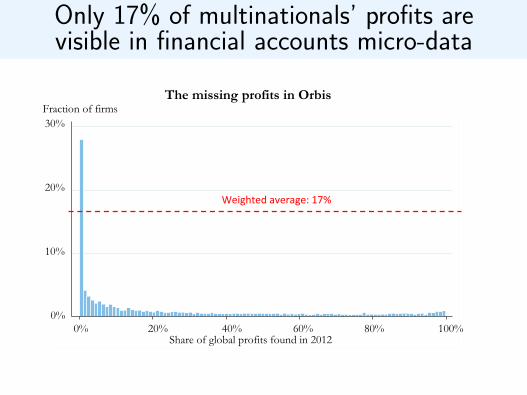
Only 17% of multinationals’ profits arevisible in financial accounts micro-data
Note: This graph shows the imperfect coverage in Orbis. For each multinational firm we take the sum of profits made by all subsidiaries registered in Orbis and divide by the global profits of the same multinal firm. Whenever the share is lower than 1 this means that we only see part of the global profits in Orbis. .
Weighted average = 0.172
0.1
.2.3
0 .2 .4 .6 .8 1Share of profits found in 2012
Fraction of firms
Weighted average: 0.17
Share of global profits found in 2012
The missing profits in Orbis
0% 20% 40% 60% 80% 100%
30%
20%
10%
0%
Weighted average: 17%
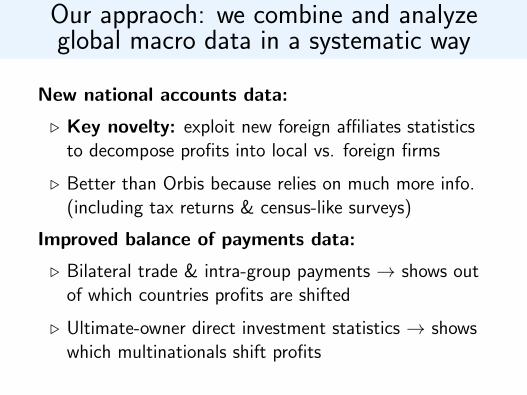
Our appraoch: we combine and analyzeglobal macro data in a systematic way
New national accounts data:
. Key novelty: exploit new foreign affiliates statisticsto decompose profits into local vs. foreign firms
. Better than Orbis because relies on much more info.(including tax returns & census-like surveys)
Improved balance of payments data:
. Bilateral trade & intra-group payments → shows outof which countries profits are shifted
. Ultimate-owner direct investment statistics → showswhich multinationals shift profits
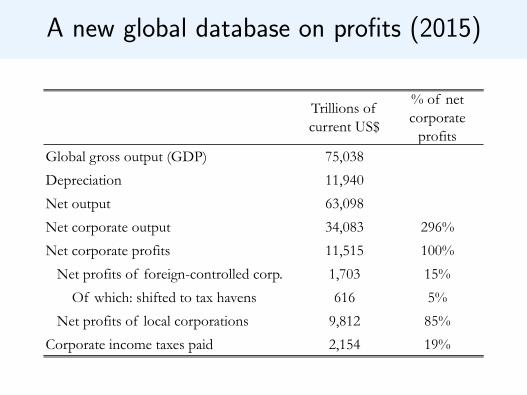
A new global database on profits (2015)
Trillions of current US$
% of net corporate
profitsGlobal gross output (GDP) 75,038
Depreciation 11,940
Net output 63,098
Net corporate output 34,083 296%
Net corporate profits 11,515 100%
Net profits of foreign-controlled corp. 1,703 15%
Of which: shifted to tax havens 616 5%
Net profits of local corporations 9,812 85%
Corporate income taxes paid 2,154 19%
Methodology to estimate amount
of profits shifted to tax havens
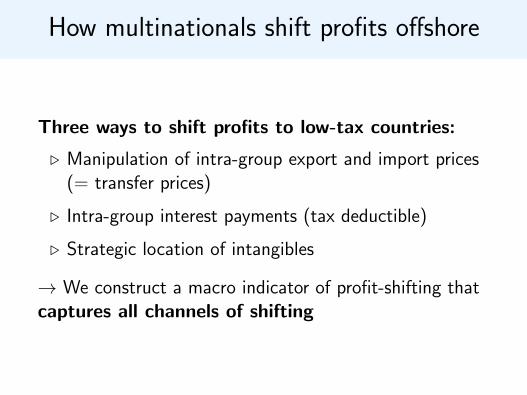
How multinationals shift profits offshore
Three ways to shift profits to low-tax countries:
. Manipulation of intra-group export and import prices(= transfer prices)
. Intra-group interest payments (tax deductible)
. Strategic location of intangibles
→ We construct a macro indicator of profit-shifting thatcaptures all channels of shifting
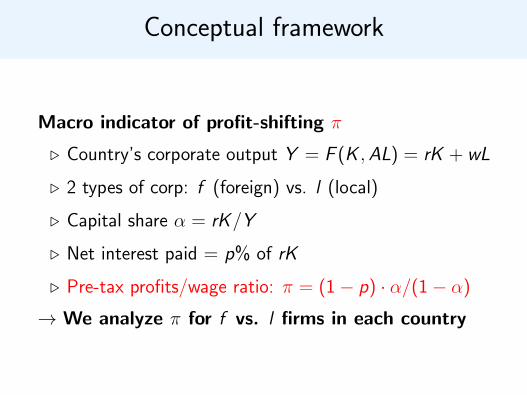
Conceptual framework
Macro indicator of profit-shifting π
. Country’s corporate output Y = F (K ,AL) = rK + wL
. 2 types of corp: f (foreign) vs. l (local)
. Capital share α = rK/Y
. Net interest paid = p% of rK
. Pre-tax profits/wage ratio: π = (1− p) · α/(1− α)
→ We analyze π for f vs. l firms in each country

Global patterns in corporate profitability
Recorded profitability varies systematically acrosscountries:
. Tax havens have abnormally high profits/wage ratios
. In tax havens: foreign firms are much more profitablethan local firms (πf >> πl)
. In non-haven countries: foreign firms are lessprofitable than local firms (πf < πl)
→ Clear evidence in macro statistics of shifting fromhigh- to low-tax places
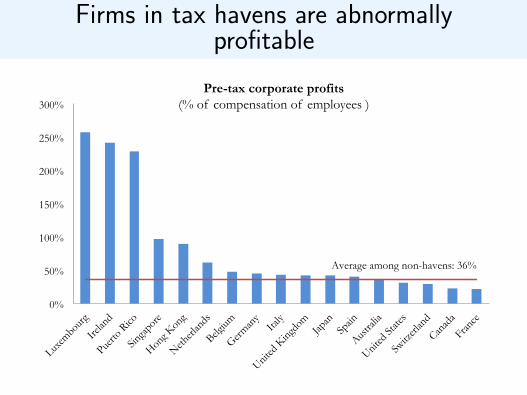
Firms in tax havens are abnormallyprofitable
0%
50%
100%
150%
200%
250%
300%
Luxem
bourg
Irelan
d
Puerto
Rico
Singa
pore
Hong K
ong
Netherl
ands
Belgium
German
y Ita
ly
United
King
dom
Japan
Spain
Austra
lia
United
State
s
Switz
erlan
d
Canad
a
France
Pre-tax corporate profits (% of compensation of employees )
Average among non-havens: 36%
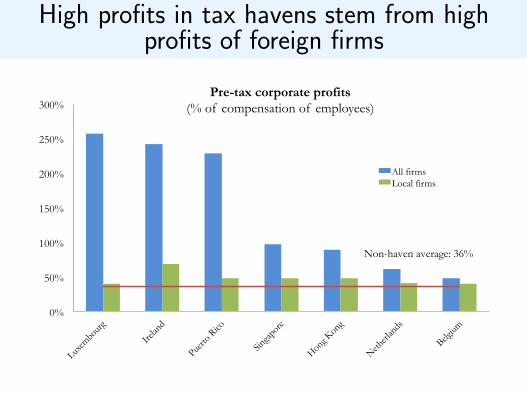
High profits in tax havens stem from highprofits of foreign firms
0%
50%
100%
150%
200%
250%
300%
Luxem
bourg
Irelan
d
Puerto
Rico
Singa
pore
Hong K
ong
Netherl
ands
Belgium
Pre-tax corporate profits (% of compensation of employees)
All firms Local firms
Non-haven average: 36%
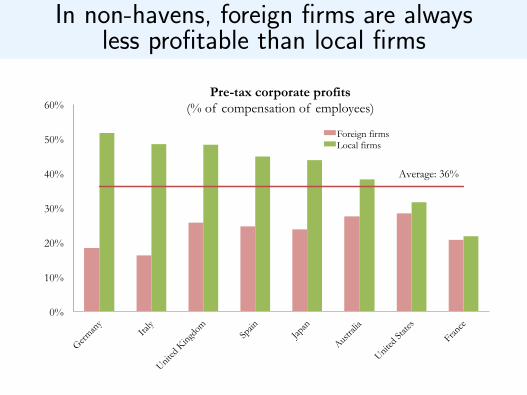
In non-havens, foreign firms are alwaysless profitable than local firms
0%
10%
20%
30%
40%
50%
60%
German
y Ita
ly
United
King
dom
Spain
Japan
Austra
lia
United
State
s
France
Pre-tax corporate profits (% of compensation of employees)
Foreign firms Local firms
Average: 36%
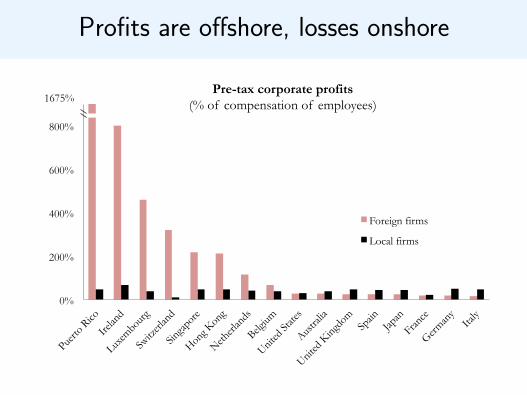
Profits are offshore, losses onshore
1675%
0%
200%
400%
600%
800%
Puerto
Rico
Irelan
d
Luxem
bourg
Switz
erlan
d
Singa
pore
Hong K
ong
Netherl
ands
Belgium
United
State
s
Austra
lia
United
King
dom
Spain
Japan
France
German
y Ita
ly
Pre-tax corporate profits (% of compensation of employees)
Foreign firms
Local firms
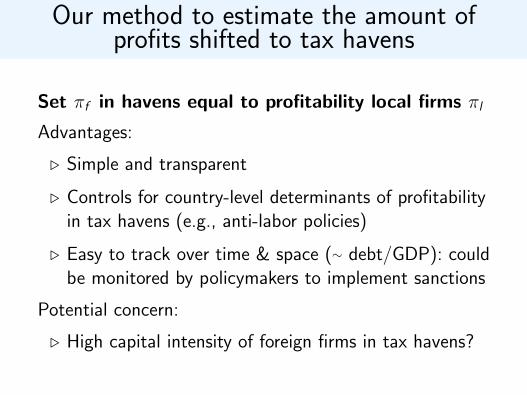
Our method to estimate the amount ofprofits shifted to tax havens
Set πf in havens equal to profitability local firms πl
Advantages:
. Simple and transparent
. Controls for country-level determinants of profitabilityin tax havens (e.g., anti-labor policies)
. Easy to track over time & space (∼ debt/GDP): couldbe monitored by policymakers to implement sanctions
Potential concern:
. High capital intensity of foreign firms in tax havens?

Do machines move to low-taxplaces?
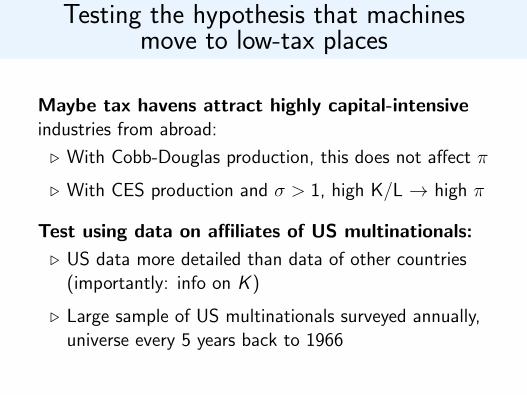
Testing the hypothesis that machinesmove to low-tax places
Maybe tax havens attract highly capital-intensiveindustries from abroad:
. With Cobb-Douglas production, this does not affect π
. With CES production and σ > 1, high K/L → high π
Test using data on affiliates of US multinationals:
. US data more detailed than data of other countries(importantly: info on K )
. Large sample of US multinationals surveyed annually,universe every 5 years back to 1966
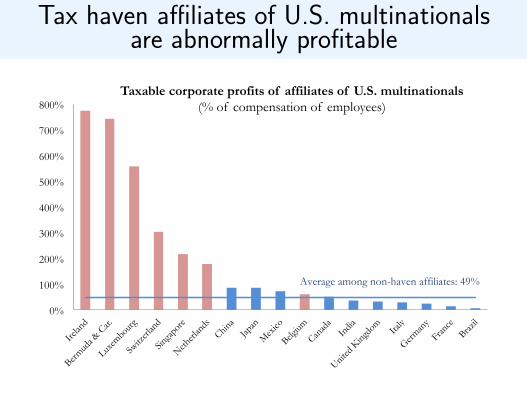
Tax haven affiliates of U.S. multinationalsare abnormally profitable
0%
100%
200%
300%
400%
500%
600%
700%
800%
Irelan
d
Bermud
a & C
ar.
Luxem
bourg
Switz
erlan
d
Singa
pore
Netherl
ands
China
Japan
Mex
ico
Belgium
Canad
a In
dia
United
King
dom
Italy
German
y
France
Brazil
Taxable corporate profits of affiliates of U.S. multinationals (% of compensation of employees)
Average among non-haven affiliates: 49%
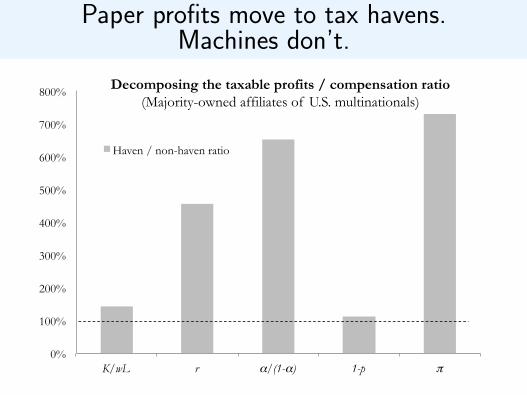
Paper profits move to tax havens.Machines don’t.
0%
100%
200%
300%
400%
500%
600%
700%
800%
K/wL r α/(1-α) 1-p π
Decomposing the taxable profits / compensation ratio (Majority-owned affiliates of U.S. multinationals)
Haven / non-haven ratio
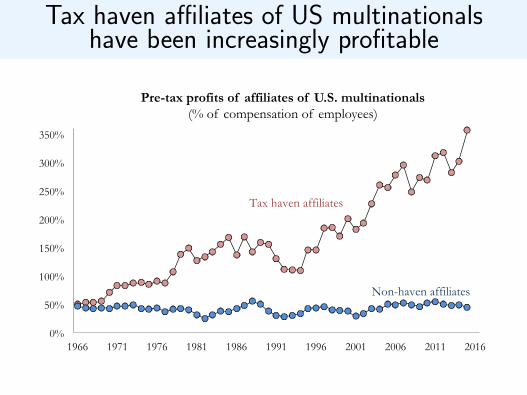
Tax haven affiliates of US multinationalshave been increasingly profitable
0%
50%
100%
150%
200%
250%
300%
350%
1966 1971 1976 1981 1986 1991 1996 2001 2006 2011 2016
Pre-tax profits of affiliates of U.S. multinationals (% of compensation of employees)
Tax haven affiliates
Non-haven affiliates
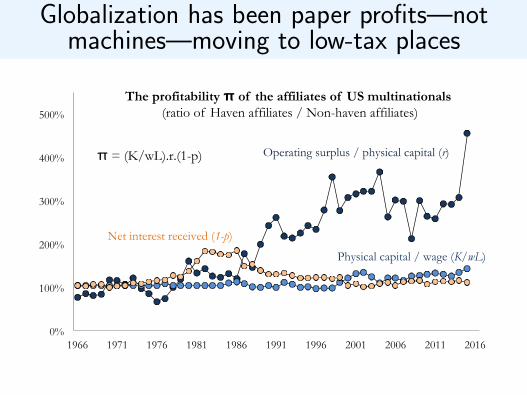
Globalization has been paper profits—notmachines—moving to low-tax places
0%
100%
200%
300%
400%
500%
1966 1971 1976 1981 1986 1991 1996 2001 2006 2011 2016
The profitability π of the affiliates of US multinationals (ratio of Haven affiliates / Non-haven affiliates)
Physical capital / wage (K/wL)
Operating surplus / physical capital (r)
Net interest received (1-p)
π = (K/wL).r.(1-p)

Who Loses?Allocating the Shifted Profits
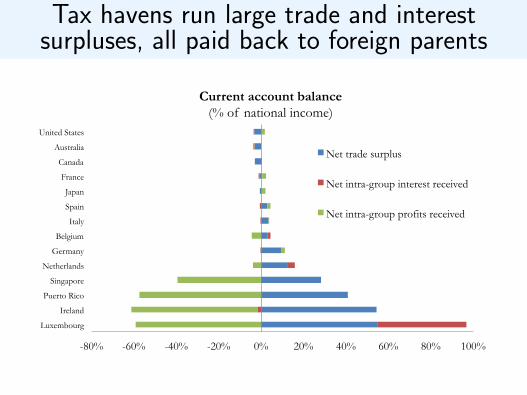
Tax havens run large trade and interestsurpluses, all paid back to foreign parents
-80% -60% -40% -20% 0% 20% 40% 60% 80% 100%
Luxembourg
Ireland
Puerto Rico
Singapore
Netherlands
Germany
Belgium
Italy
Spain
Japan
France
Canada
Australia
United States
Current account balance (% of national income)
Net trade surplus
Net intra-group interest received
Net intra-group profits received
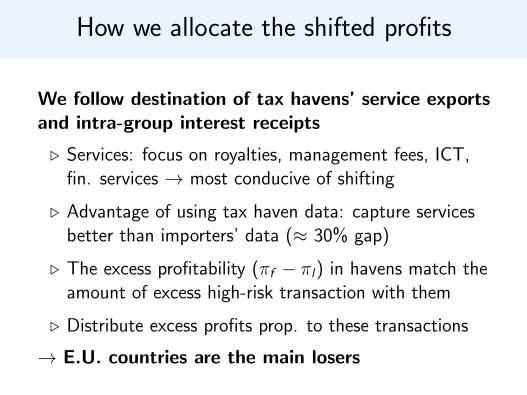
How we allocate the shifted profits
We follow destination of tax havens’ service exportsand intra-group interest receipts
. Services: focus on royalties, management fees, ICT,fin. services → most conducive of shifting
. Advantage of using tax haven data: capture servicesbetter than importers’ data (≈ 30% gap)
. The excess profitability (πf − πl) in havens match theamount of excess high-risk transaction with them
. Distribute excess profits prop. to these transactions
→ E.U. countries are the main losers
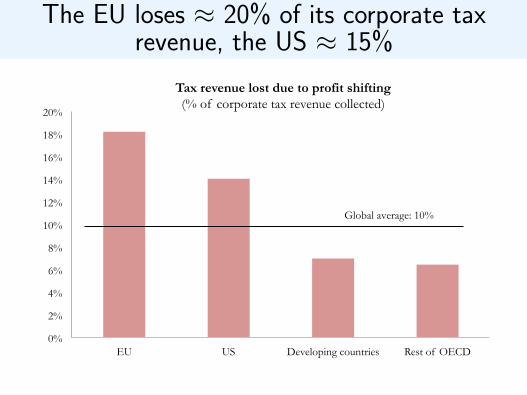
The EU loses ≈ 20% of its corporate taxrevenue, the US ≈ 15%
0%
2%
4%
6%
8%
10%
12%
14%
16%
18%
20%
EU US Developing countries Rest of OECD
Tax revenue lost due to profit shifting (% of corporate tax revenue collected)
Global average: 10%
Which multinationals shift profitsoffshore?
We track to which countries the profits booked intax havens ultimately accrue:
. Allocate shifted profits prop. to direct investmentequity income paid (dividends + retained earnings)
. Using new ultimate beneficial owner direct investmentstatistics
. Shows where the big shifters are headquartered
→ U.S. multinationals are the biggest users of taxhavens
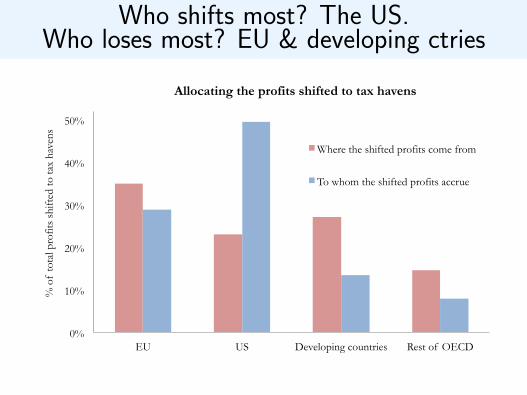
Who shifts most? The US.Who loses most? EU & developing ctries
0%
10%
20%
30%
40%
50%
EU US Developing countries Rest of OECD
% o
f to
tal p
rofit
s sh
ifted
to ta
x ha
vens
Allocating the profits shifted to tax havens
Where the shifted profits come from
To whom the shifted profits accrue
Explaining the rise of
profit-shifting
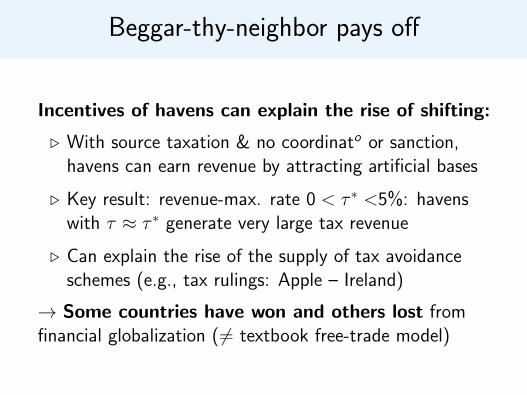
Beggar-thy-neighbor pays off
Incentives of havens can explain the rise of shifting:
. With source taxation & no coordinato or sanction,havens can earn revenue by attracting artificial bases
. Key result: revenue-max. rate 0 < τ ∗ <5%: havenswith τ ≈ τ ∗ generate very large tax revenue
. Can explain the rise of the supply of tax avoidanceschemes (e.g., tax rulings: Apple – Ireland)
→ Some countries have won and others lost fromfinancial globalization (6= textbook free-trade model)
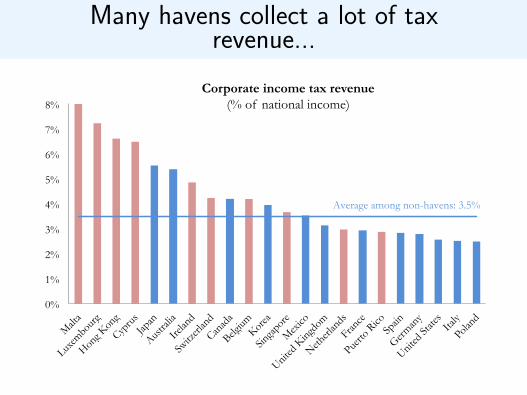
Many havens collect a lot of taxrevenue...
0%
1%
2%
3%
4%
5%
6%
7%
8%
Malt
a
Luxem
bourg
Hong K
ong
Cypru
s
Japan
Austra
lia
Irelan
d
Switz
erlan
d
Canad
a
Belgium
Korea
Singa
pore
Mex
ico
United
King
dom
Netherl
ands
France
Puerto
Rico
Spain
German
y
United
State
s Ita
ly
Polan
d
Corporate income tax revenue (% of national income)
Average among non-havens: 3.5%
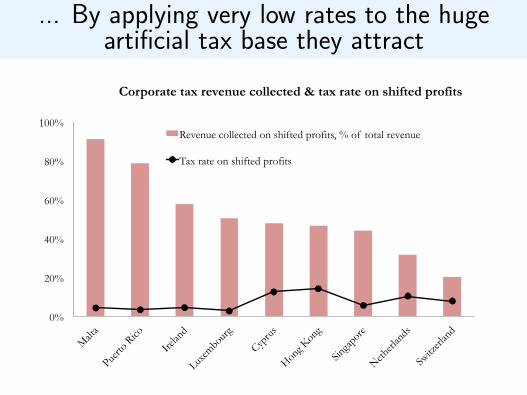
... By applying very low rates to the hugeartificial tax base they attract
0%
20%
40%
60%
80%
100%
Malt
a
Puerto
Rico
Irelan
d
Luxem
bourg
Cypru
s
Hong K
ong
Singa
pore
Netherl
ands
Switz
erlan
d
Corporate tax revenue collected & tax rate on shifted profits
Revenue collected on shifted profits, % of total revenue
Tax rate on shifted profits
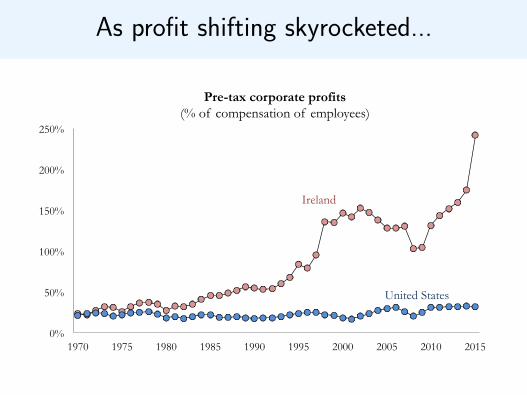
As profit shifting skyrocketed...
0%
50%
100%
150%
200%
250%
1970 1975 1980 1985 1990 1995 2000 2005 2010 2015
Pre-tax corporate profits (% of compensation of employees)
Ireland
United States
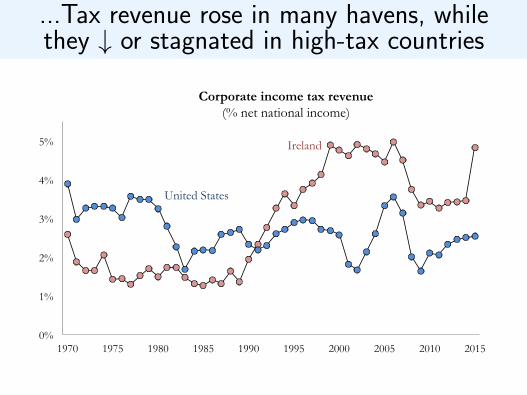
...Tax revenue rose in many havens, whilethey ↓ or stagnated in high-tax countries
0%
1%
2%
3%
4%
5%
1970 1975 1980 1985 1990 1995 2000 2005 2010 2015
Corporate income tax revenue (% net national income)
Ireland
United States
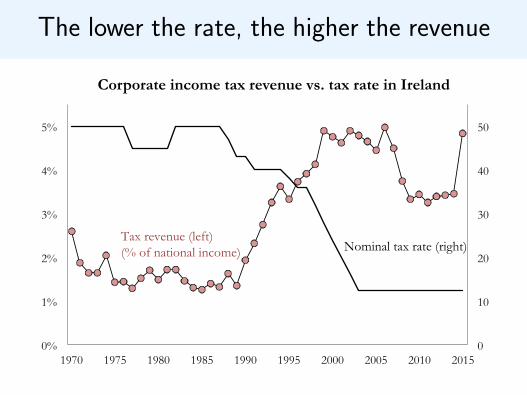
The lower the rate, the higher the revenue
0
10
20
30
40
50
0%
1%
2%
3%
4%
5%
1970 1975 1980 1985 1990 1995 2000 2005 2010 2015
Corporate income tax revenue vs. tax rate in Ireland
Tax revenue (left) (% of national income) Nominal tax rate (right)
Explaining the persistence of
profit-shifting
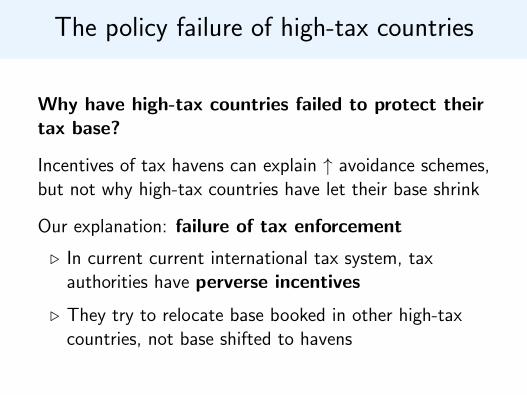
The policy failure of high-tax countries
Why have high-tax countries failed to protect theirtax base?
Incentives of tax havens can explain ↑ avoidance schemes,but not why high-tax countries have let their base shrink
Our explanation: failure of tax enforcement
. In current current international tax system, taxauthorities have perverse incentives
. They try to relocate base booked in other high-taxcountries, not base shifted to havens
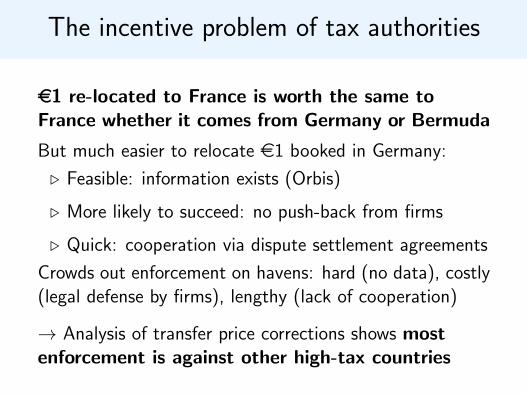
The incentive problem of tax authorities
e1 re-located to France is worth the same toFrance whether it comes from Germany or Bermuda
But much easier to relocate e1 booked in Germany:
. Feasible: information exists (Orbis)
. More likely to succeed: no push-back from firms
. Quick: cooperation via dispute settlement agreements
Crowds out enforcement on havens: hard (no data), costly(legal defense by firms), lengthy (lack of cooperation)
→ Analysis of transfer price corrections shows mostenforcement is against other high-tax countries
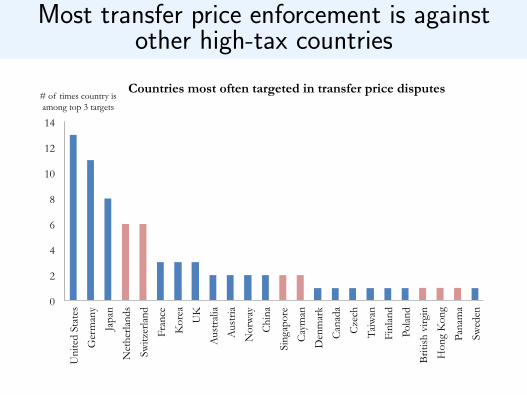
Most transfer price enforcement is againstother high-tax countries
0
2
4
6
8
10
12
14
Uni
ted
Stat
es
Ger
man
y
Japa
n
Net
herla
nds
Switz
erla
nd
Fran
ce
Kor
ea
UK
Aus
tral
ia
Aus
tria
Nor
way
Chi
na
Sing
apor
e
Cay
man
Den
mar
k
Can
ada
Cze
ch
Taiw
an
Finl
and
Pola
nd
Brit
ish
virg
in
Hon
g K
ong
Pana
ma
Swed
en
# of times country is among top 3 targets
Countries most often targeted in transfer price disputes
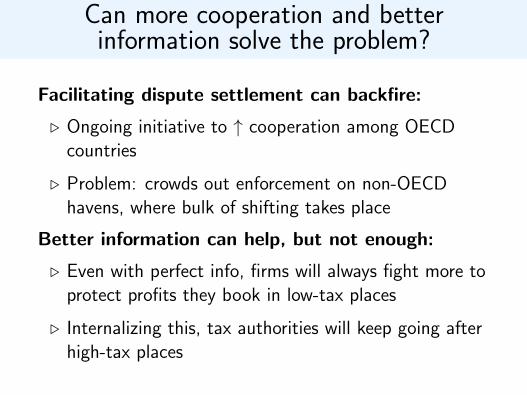
Can more cooperation and betterinformation solve the problem?
Facilitating dispute settlement can backfire:
. Ongoing initiative to ↑ cooperation among OECDcountries
. Problem: crowds out enforcement on non-OECDhavens, where bulk of shifting takes place
Better information can help, but not enough:
. Even with perfect info, firms will always fight more toprotect profits they book in low-tax places
. Internalizing this, tax authorities will keep going afterhigh-tax places
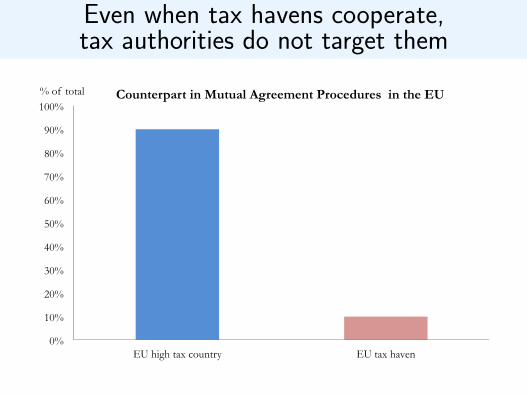
Even when tax havens cooperate,tax authorities do not target them
0%
10%
20%
30%
40%
50%
60%
70%
80%
90%
100%
EU high tax country EU tax haven
% of total Counterpart in Mutual Agreement Procedures in the EU
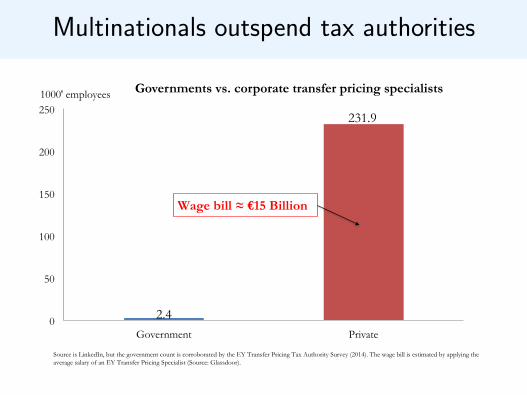
Multinationals outspend tax authorities
2.4
231.9
0
50
100
150
200
250
Government Private
1000' employees Governments vs. corporate transfer pricing specialists
Source is LinkedIn, but the government count is corroborated by the EY Transfer Pricing Tax Authority Survey (2014). The wage bill is estimated by applying the average salary of an EY Transfer Pricing Specialist (Source: Glassdoor).
Wage bill ≈ €15 Billion

Conclusion
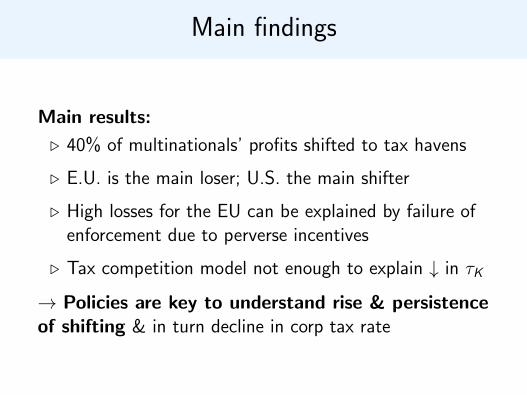
Main findings
Main results:
. 40% of multinationals’ profits shifted to tax havens
. E.U. is the main loser; U.S. the main shifter
. High losses for the EU can be explained by failure ofenforcement due to perverse incentives
. Tax competition model not enough to explain ↓ in τK
→ Policies are key to understand rise & persistenceof shifting & in turn decline in corp tax rate
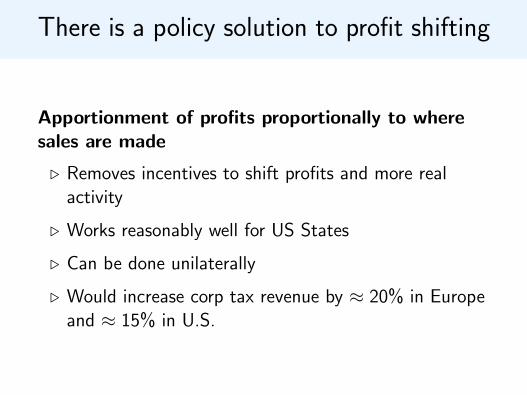
There is a policy solution to profit shifting
Apportionment of profits proportionally to wheresales are made
. Removes incentives to shift profits and more realactivity
. Works reasonably well for US States
. Can be done unilaterally
. Would increase corp tax revenue by ≈ 20% in Europeand ≈ 15% in U.S.
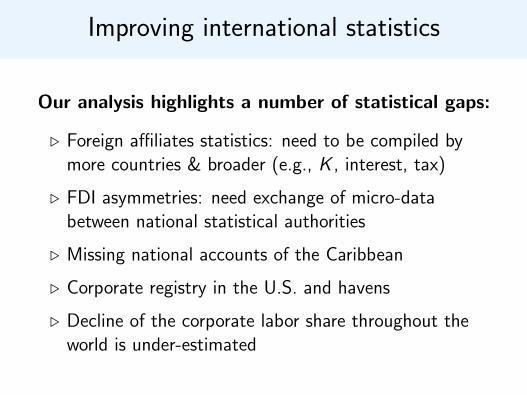
Improving international statistics
Our analysis highlights a number of statistical gaps:
. Foreign affiliates statistics: need to be compiled bymore countries & broader (e.g., K , interest, tax)
. FDI asymmetries: need exchange of micro-databetween national statistical authorities
. Missing national accounts of the Caribbean
. Corporate registry in the U.S. and havens
. Decline of the corporate labor share throughout theworld is under-estimated

Supplementary slides
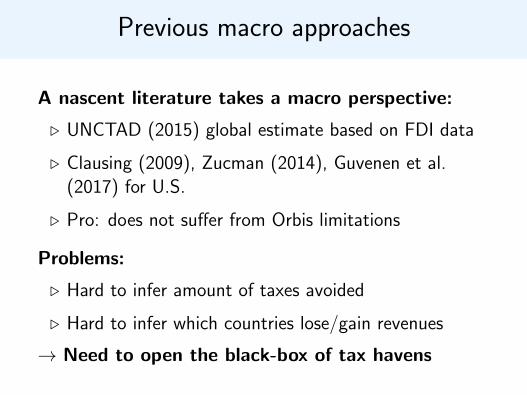
Previous macro approaches
A nascent literature takes a macro perspective:
. UNCTAD (2015) global estimate based on FDI data
. Clausing (2009), Zucman (2014), Guvenen et al.(2017) for U.S.
. Pro: does not suffer from Orbis limitations
Problems:
. Hard to infer amount of taxes avoided
. Hard to infer which countries lose/gain revenues
→ Need to open the black-box of tax havens
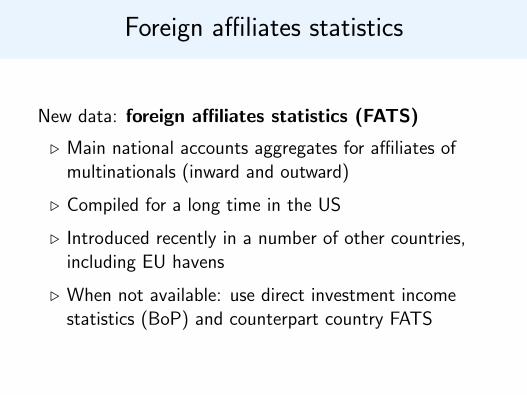
Foreign affiliates statistics
New data: foreign affiliates statistics (FATS)
. Main national accounts aggregates for affiliates ofmultinationals (inward and outward)
. Compiled for a long time in the US
. Introduced recently in a number of other countries,including EU havens
. When not available: use direct investment incomestatistics (BoP) and counterpart country FATS
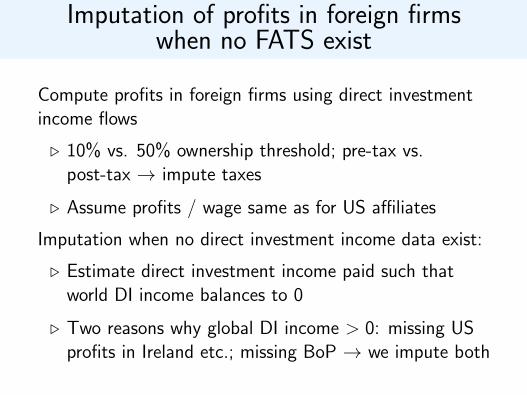
Imputation of profits in foreign firmswhen no FATS exist
Compute profits in foreign firms using direct investmentincome flows
. 10% vs. 50% ownership threshold; pre-tax vs.post-tax → impute taxes
. Assume profits / wage same as for US affiliates
Imputation when no direct investment income data exist:
. Estimate direct investment income paid such thatworld DI income balances to 0
. Two reasons why global DI income > 0: missing USprofits in Ireland etc.; missing BoP → we impute both
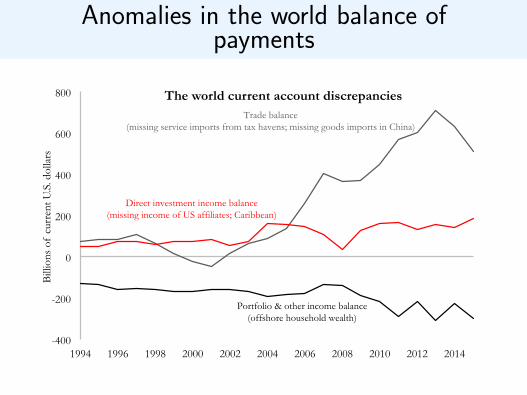
Anomalies in the world balance ofpayments
-400
-200
0
200
400
600
800
1994 1996 1998 2000 2002 2004 2006 2008 2010 2012 2014
Bill
ions
of
curr
ent U
.S. d
olla
rs
The world current account discrepancies
Direct investment income balance (missing income of US affiliates; Caribbean)
Portfolio & other income balance (offshore household wealth)
Trade balance (missing service imports from tax havens; missing goods imports in China)
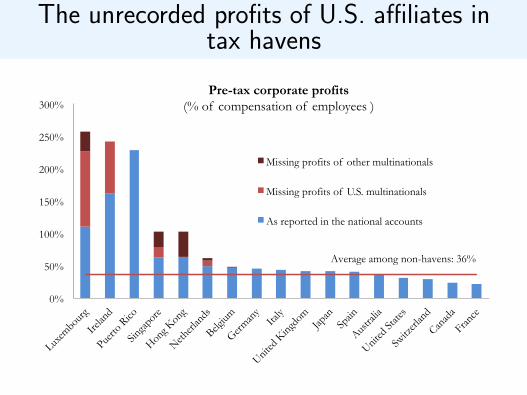
The unrecorded profits of U.S. affiliates intax havens
0%
50%
100%
150%
200%
250%
300%
Luxem
bourg
Irelan
d
Puerto
Rico
Singa
pore
Hong K
ong
Netherl
ands
Belgium
German
y Ita
ly
United
King
dom
Japan
Spain
Austra
lia
United
State
s
Switz
erlan
d
Canad
a
France
Pre-tax corporate profits (% of compensation of employees )
Missing profits of other multinationals
Missing profits of U.S. multinationals
As reported in the national accounts
Average among non-havens: 36%
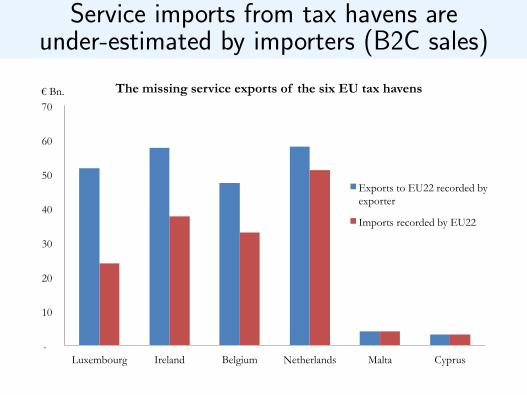
Service imports from tax havens areunder-estimated by importers (B2C sales)
-
10
20
30
40
50
60
70
Luxembourg Ireland Belgium Netherlands Malta Cyprus
€ Bn. The missing service exports of the six EU tax havens
Exports to EU22 recorded by exporter
Imports recorded by EU22
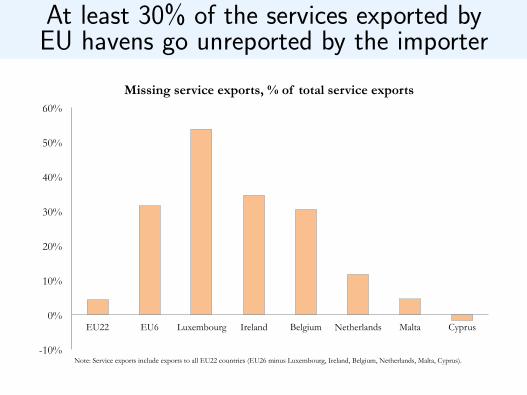
At least 30% of the services exported byEU havens go unreported by the importer
-10%
0%
10%
20%
30%
40%
50%
60%
EU22 EU6 Luxembourg Ireland Belgium Netherlands Malta Cyprus
Missing service exports, % of total service exports
Note: Service exports include exports to all EU22 countries (EU26 minus Luxembourg, Ireland, Belgium, Netherlands, Malta, Cyprus).
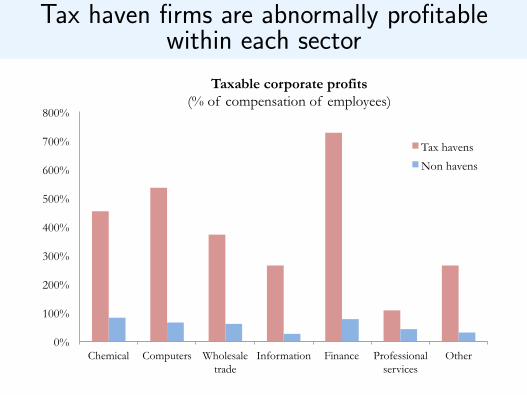
Tax haven firms are abnormally profitablewithin each sector
0%
100%
200%
300%
400%
500%
600%
700%
800%
Chemical Computers Wholesale trade
Information Finance Professional services
Other
Taxable corporate profits (% of compensation of employees)
Tax havens
Non havens
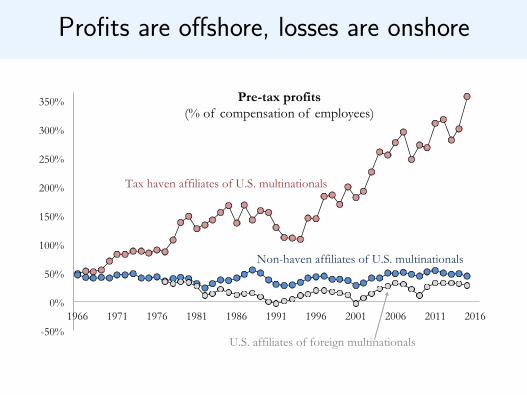
Profits are offshore, losses are onshore
-50%
0%
50%
100%
150%
200%
250%
300%
350%
1966 1971 1976 1981 1986 1991 1996 2001 2006 2011 2016
Pre-tax profits (% of compensation of employees)
Tax haven affiliates of U.S. multinationals
Non-haven affiliates of U.S. multinationals
U.S. affiliates of foreign multinationals
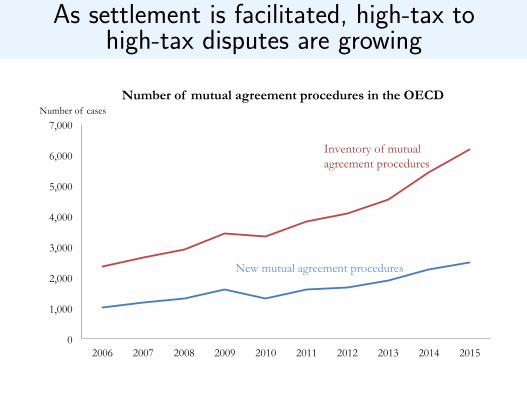
As settlement is facilitated, high-tax tohigh-tax disputes are growing
0
1,000
2,000
3,000
4,000
5,000
6,000
7,000
2006 2007 2008 2009 2010 2011 2012 2013 2014 2015
Number of cases Number of mutual agreement procedures in the OECD
Inventory of mutual agreement procedures
New mutual agreement procedures