Embed Size (px)
Citation preview
7-13 September, Sibenik, Croatia
1
Possible traces of Possible traces of solar activity effect on solar activity effect on
the surface air the surface air temperature of mid-temperature of mid-
latitudeslatitudesA. Kilcika, A. Özgüçb, J. P. Rozelotc
aDepartment of Physics, Faculty of Science, Akdeniz University, 07058 Antalya, TurkeybKandilli Observatory and E.R.I., Bogazici University, Cengelkoy, 34684 Istanbul, Turkey
cUniversité de Nice Sophia Antipolis- Observatoire de la Côte d'Azur CERGA, Av. Copernic, 06130 GRASSE, France
7-13 September, Sibenik, Croatia
2
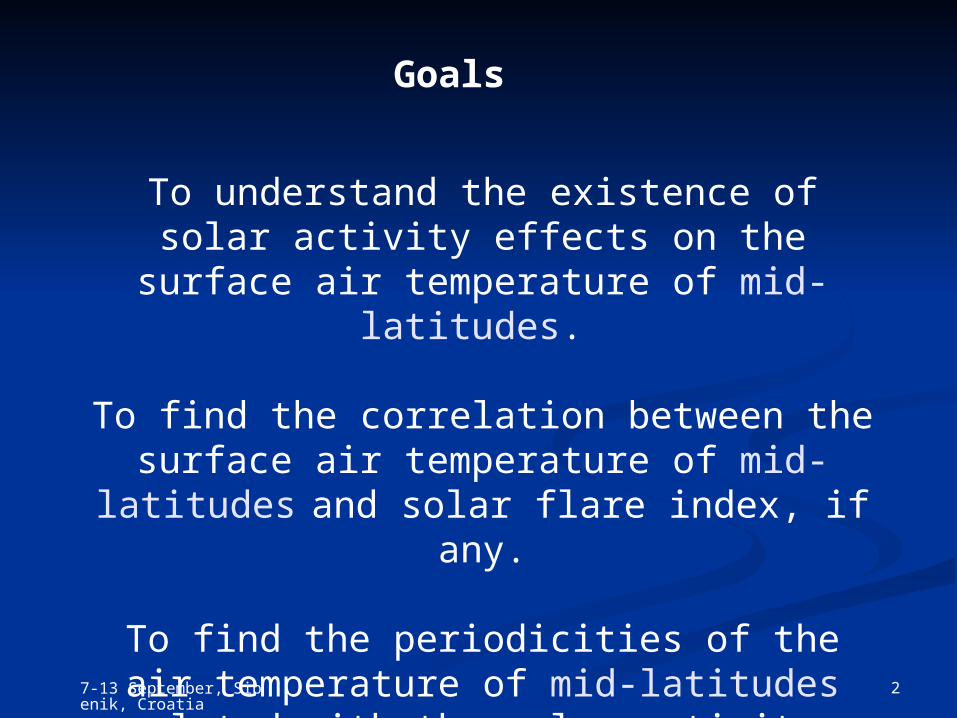
Goals
To understand the existence of solar activity effects on the surface air
temperature of mid-latitudes.
To find the correlation between the surface air temperature of mid-latitudes
and solar flare index, if any.
To find the periodicities of the air temperature of mid-latitudes related with
the solar activity.

7-13 September, Sibenik, Croatia
3
Studied area on Earth
7-13 September, Sibenik, Croatia
4
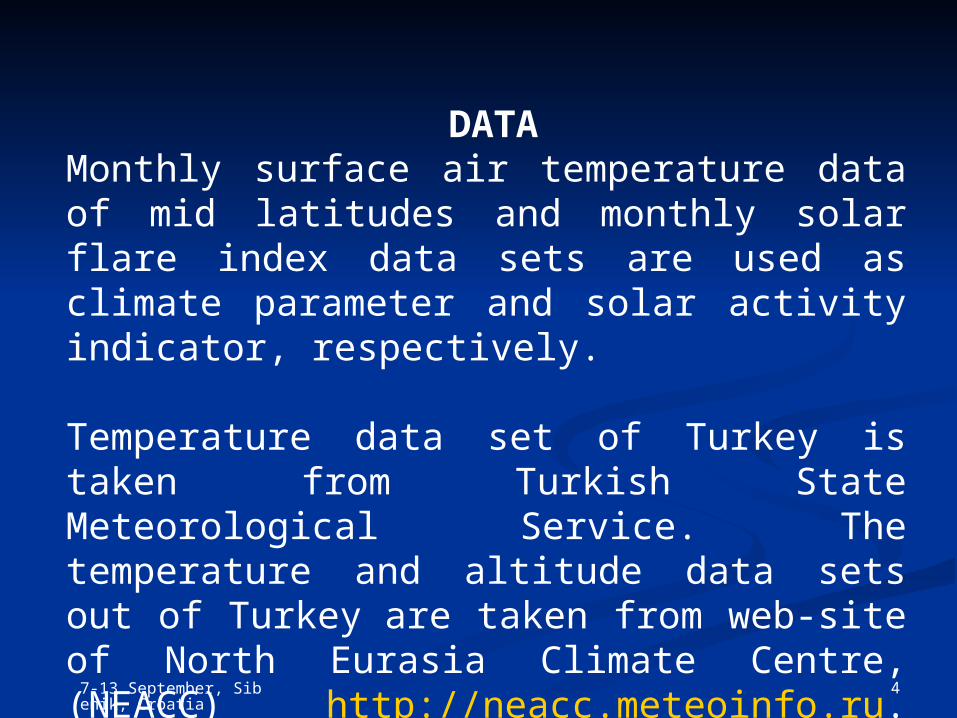
DATAMonthly surface air temperature data of mid latitudes and monthly solar flare index data sets are used as climate parameter and solar activity indicator, respectively.
Temperature data set of Turkey is taken from Turkish State Meteorological Service. The temperature and altitude data sets out of Turkey are taken from web-site of North Eurasia Climate Centre, (NEACC) http://neacc.meteoinfo.ru. Volcanic activity data is taken from Earth System Research Laboratory web page http://www.esrl.noaa.gov/gmd/about/climate.html

7-13 September, Sibenik, Croatia
5
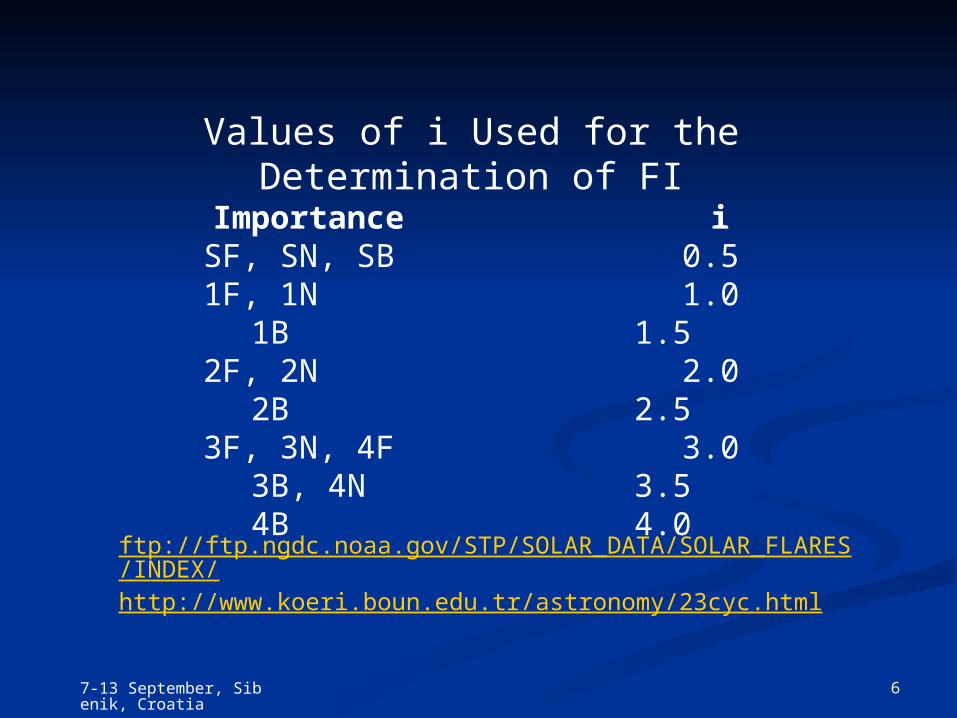
What is Flare Index?
The quantitative flare index is FI = i·t, where i represents the intensity scale of importance of a flare in Hα and t the duration in Hα (in minutes) of the flare. The daily sums of the index for the total surface are divided by the total time of observation of that day. Because the time coverage of flare observations is not always complete during a day, it is corrected by dividing by the total time of observations of that day to place the daily sum of the flare index on a common 24-hour period.
Calculated values are available for general use in anonymous ftp servers of our observatory and NGDC.
7-13 September, Sibenik, Croatia
6
Values of i Used for the Determination of FI
Importance iSF, SN, SB 0.5
1F, 1N 1.01B 1.5
2F, 2N 2.02B 2.53F, 3N, 4F 3.03B, 4N 3.54B 4.0
ftp://ftp.ngdc.noaa.gov/STP/SOLAR_DATA/SOLAR_FLARES/INDEX/http://www.koeri.boun.edu.tr/astronomy/23cyc.html
7-13 September, Sibenik, Croatia
7
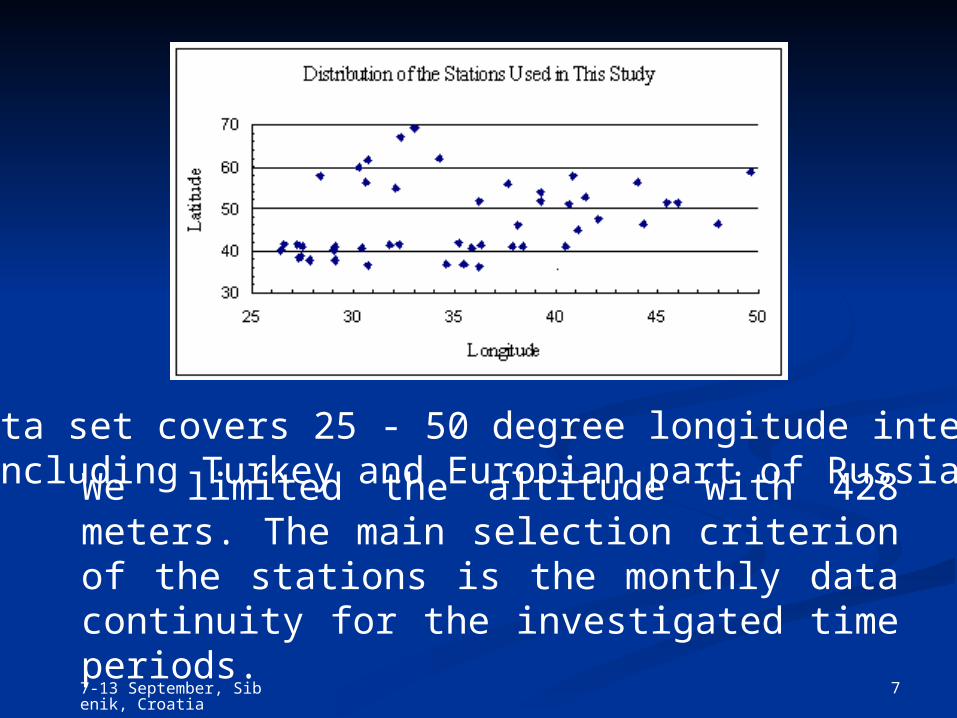
The data set covers 25 - 50 degree longitude interval including Turkey and Europian part of Russia
We limited the altitude with 428 meters. The main selection criterion of the stations is the monthly data continuity for the investigated time periods.
7-13 September, Sibenik, Croatia
8
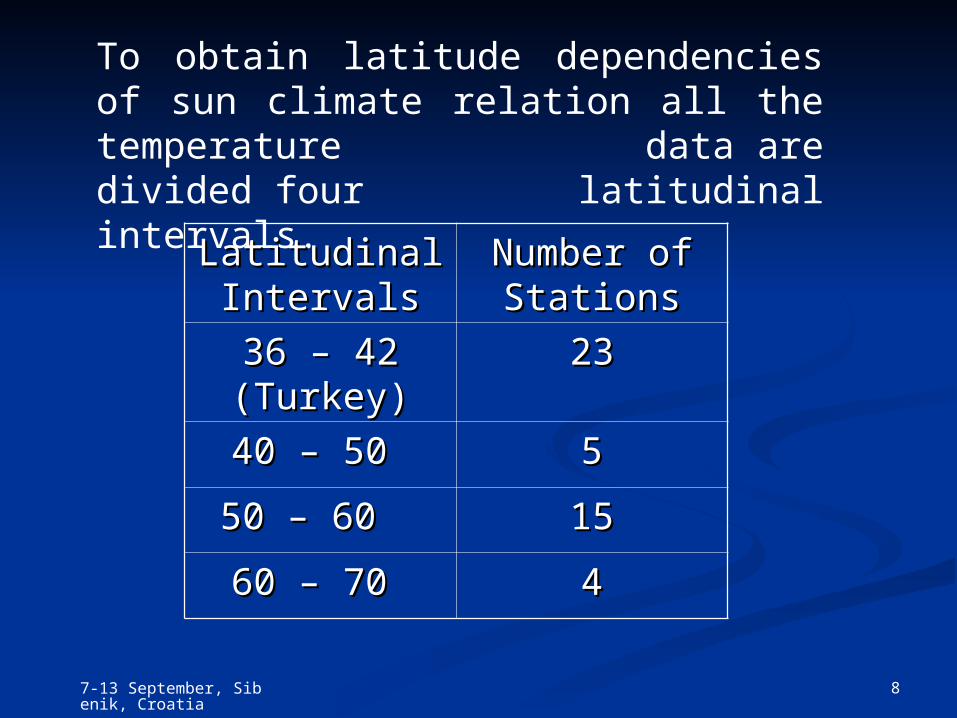
To obtain latitude dependencies of sun climate relation all the temperature data are divided four latitudinal intervals.
Latitudinal Latitudinal IntervalsIntervals
Number of Number of StationsStations
36 – 42 36 – 42 (Turkey)(Turkey)
2323
40 – 50 40 – 50 55
50 – 60 50 – 60 1515
60 – 70 60 – 70 44
7-13 September, Sibenik, Croatia
9
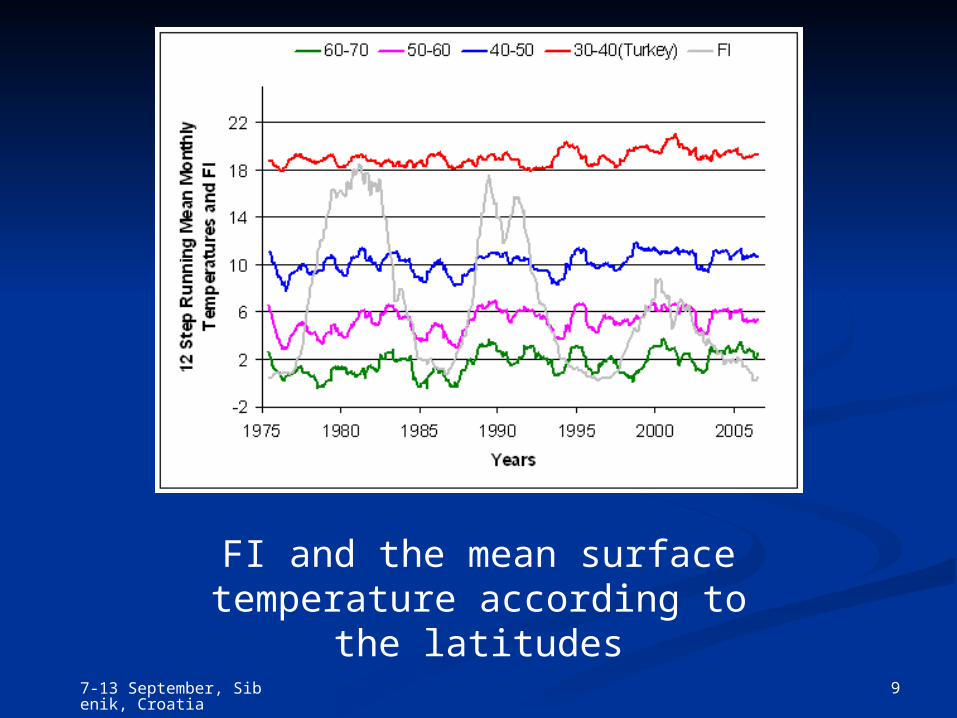
FI and the mean surface temperature according to
the latitudes
7-13 September, Sibenik, Croatia
10
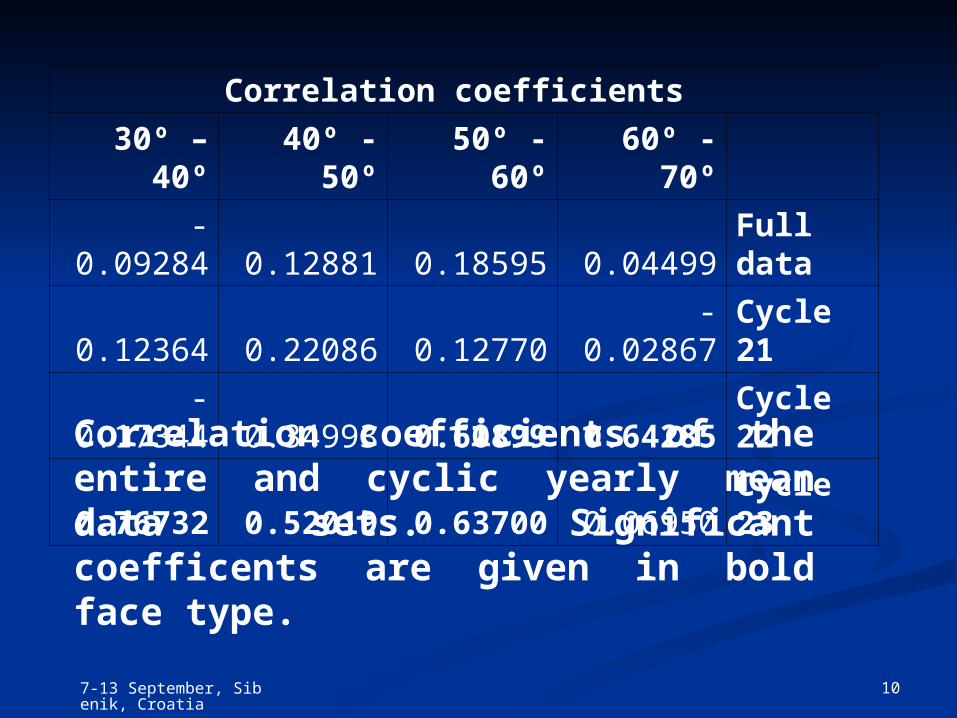
Correlation coefficients
30º – 40º 40º - 50º 50º - 60º 60º - 70º
-0.09284 0.12881 0.18595 0.04499 Full data
0.12364 0.22086 0.12770 -0.02867 Cycle 21
-0.17344 0.34993 0.60899 0.64285 Cycle 22
0.76732 0.52019 0.63700 0.06950 Cycle 23
Correlation coefficients of the entire and cyclic yearly mean data sets. Significant coefficents are given in bold face type.
7-13 September, Sibenik, Croatia
11
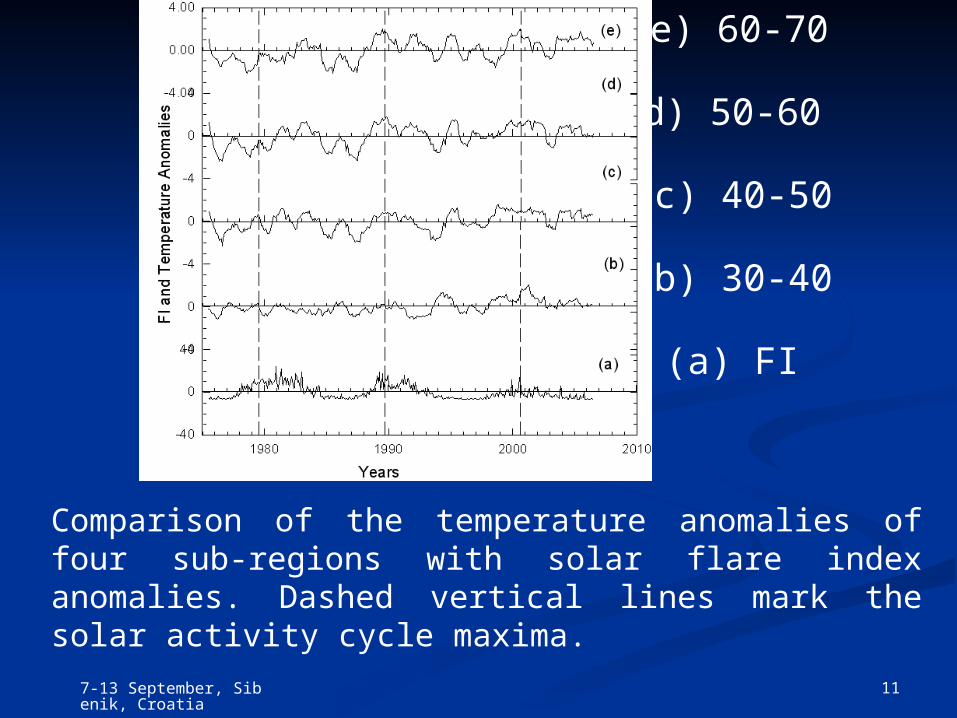
Comparison of the temperature anomalies of four sub-regions with solar flare index anomalies. Dashed vertical lines mark the solar activity cycle maxima.
(e) 60-70
(d) 50-60
(c) 40-50
(b) 30-40
(a) FI

7-13 September, Sibenik, Croatia
12
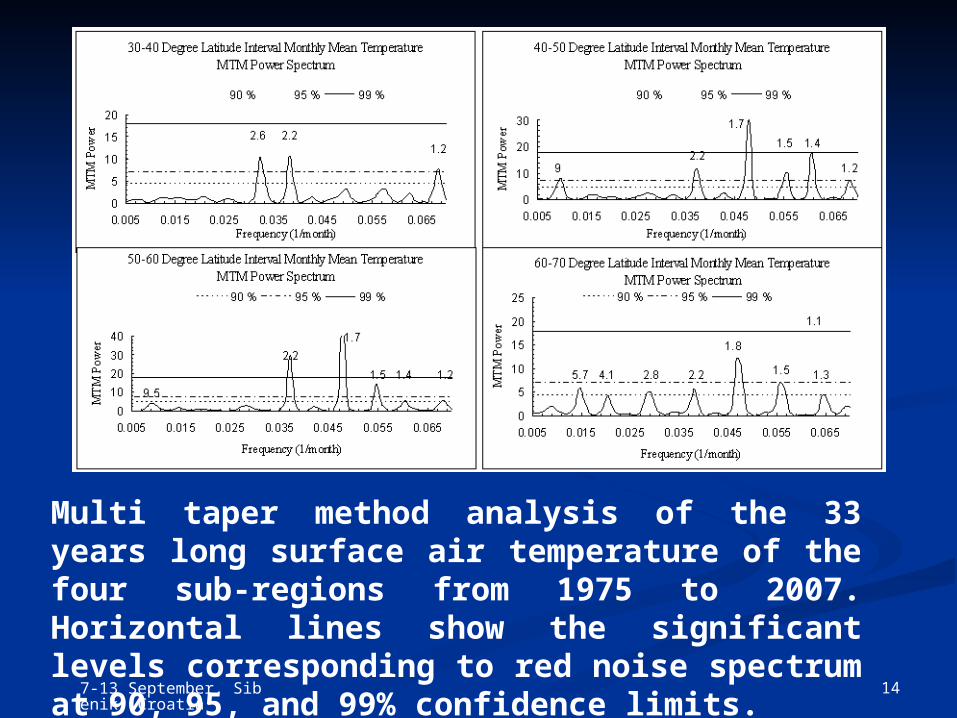
In order to compare the spectral characteristics of the flare index to the spectral characteristics of surface air temperature we used multi taper method (MTM). Data frequency range was selected from 0.005 to 0.07 (14 - 200 months) and 0.005 to 0.08 (12.5 - 200 months) for temperature and FI data sets respectively. Our significance test are carried out with respect to red noise, since the temperature records, like most climatic and other geophysical time series, have larger power at lower frequencies. All harmonic signals obtained by using of 95 % confidence level.

7-13 September, Sibenik, Croatia
13
Multi taper method analysis of the 33 years long of the solar flare index from 1975 to 2007. Horizontal lines show the significant levels corresponding to red noise spectrum at 90, 95, and 99% confidence limits.
7-13 September, Sibenik, Croatia
14
Multi taper method analysis of the 33 years long surface air temperature of the four sub-regions from 1975 to 2007. Horizontal lines show the significant levels corresponding to red noise spectrum at 90, 95, and 99% confidence limits.

7-13 September, Sibenik, Croatia
15
There are two meaningful groups of periods for the surface air temperature, which are at 1.3–1.8 and 2.4-2.6 years. The first group found in our study was reported by Kirivova and Solanki (2002) when analyzing the sunspot areas and the sunspot number data, respectively for the 1880 – 2000 and the 1750 – 2000 time periods.
Periodical analysis results show that all sub-regions temperature data sets have all about the same periodicity, albeit showing small differences
7-13 September, Sibenik, Croatia
16
Such a period of ~1.3-year can be a sub-harmonic of other periodic effects including the well known Schwabe cycle (10.5-year). This issue may be related to the quasi-biennial oscillations of occurring in the stratospheric winds. This is a possibility.
Obridko and Shelting (2007) recently reported that oscillations of 1.3-yr period are closely associated with quasi-biennial oscillations of large-scale solar magnetic field. This is another possibility.
7-13 September, Sibenik, Croatia
17
Spectral analysis of 60 - 70 degree group shows 5.7
years periodicity. This period may be related to
geomagnetic activity (5.25-year) and of course indirectly
to solar activity. However using the geomagnetic activity
index aa, Kane (1997) found a QBO and a 5.4-years
periodicity during the period of time 1868 – 1994. This
periodicity was also reported in the biological and
biophysical studies. Nevertheless, such a period is not
seen in the flare index spectral analysis.
7-13 September, Sibenik, Croatia
18
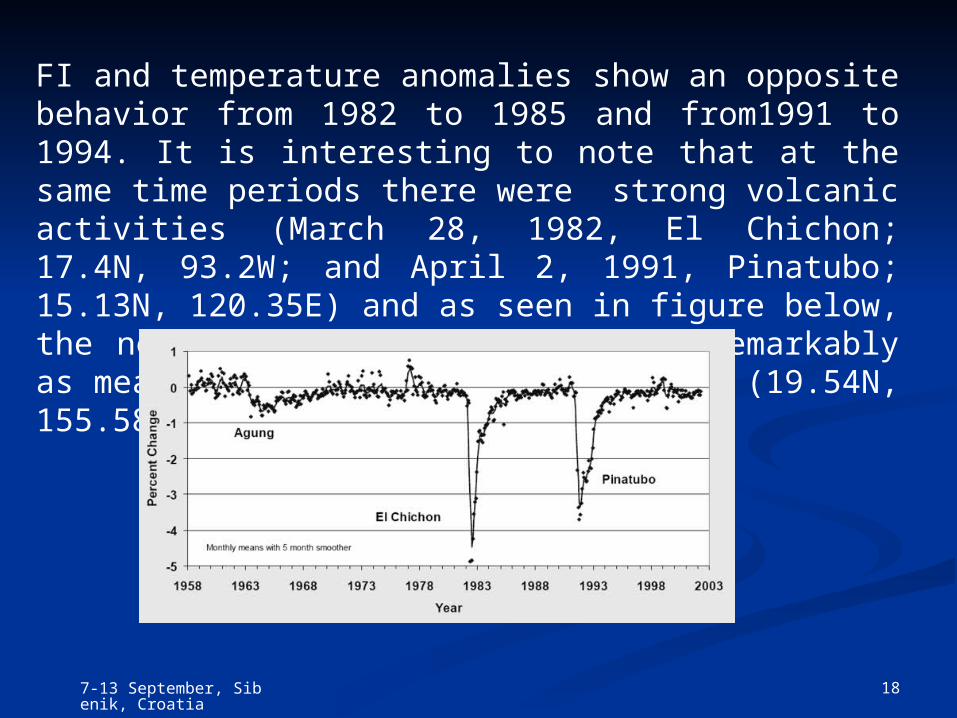
FI and temperature anomalies show an opposite behavior from 1982 to 1985 and from1991 to 1994. It is interesting to note that at the same time periods there were strong volcanic activities (March 28, 1982, El Chichon; 17.4N, 93.2W; and April 2, 1991, Pinatubo; 15.13N, 120.35E) and as seen in figure below, the net solar radiation decreased remarkably as measured at Mauna Loa observatory (19.54N, 155.58W).
7-13 September, Sibenik, Croatia
19
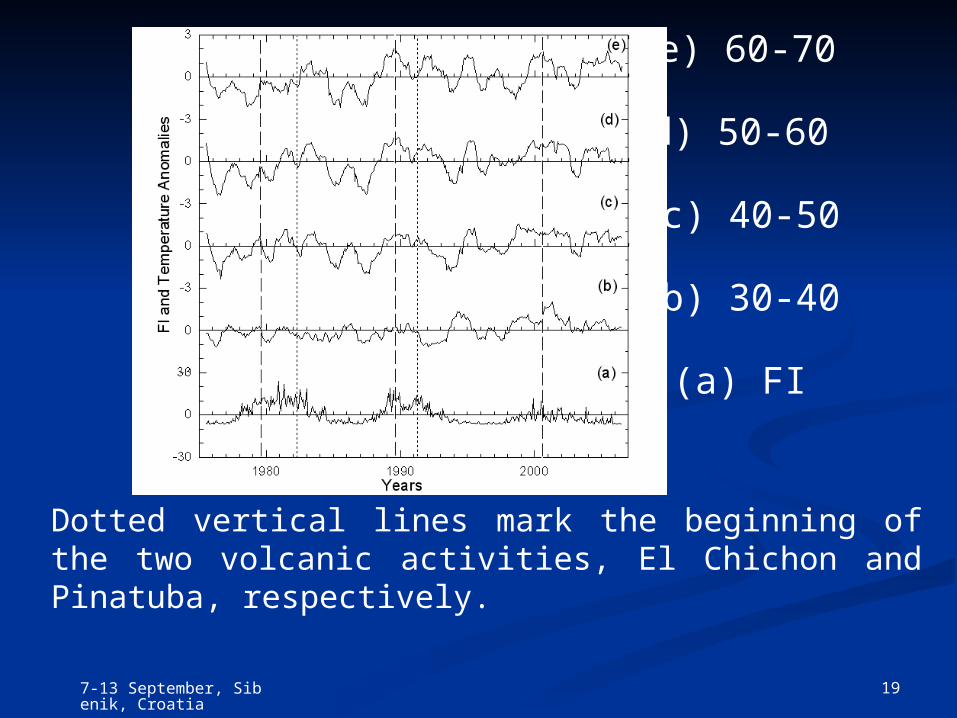
Dotted vertical lines mark the beginning of the two volcanic activities, El Chichon and Pinatuba, respectively.
(e) 60-70
(d) 50-60
(c) 40-50
(b) 30-40
(a) FI
7-13 September, Sibenik, Croatia
20
There is growing evidence that solar variability drives the
Earth climate system in various ways and on multiple time
scales resulting in various proxies. A list of these proxies
can be found for instance in Rozelot (1990). Among all of
them, the tree-ring time series is not frequently used but
might be significant. For instance suppressed time of solar
activity is well marked (Mauder Minimum), simply due to the
influence of the climate on the growth of the trees.

7-13 September, Sibenik, Croatia
21
Recently Rigozo et al., (2007) have found evidence for the
presence of the solar activity long term periods (~11, 22, 80,
and 208 years) by examining the tree ring time series
extended over a period of 400 years. They have also reported
that these periods are intermittent, possibly because solar
activity signals observed in the tree rings are mostly due to
solar influence on local climate.
7-13 September, Sibenik, Croatia
22
Conclusions
Signatures of solar activity effect exist on surface air temperature of some mid-latitude regions according to our statistical analysis and over the considered period of time.
Investigation of Sun-climate relationship on local scale may give better possibilities for understanding of the problem than global scale.

7-13 September, Sibenik, Croatia
23
Kane, R. P., 1997. Quasi-biennial and quasi-triennial oscillations in geomagnetic activity indices. Annales Geophysicae 15, 1581-1594.
Krivova, N.A., and Solanki, S.K., 2002. The 1.3-year and 156-day periodicities in sunspot data: Wavelet analysis suggests a common origin. Astronomy and Astrophysics 394, 701–706.
Obridko, VN; Shelting, BD, 2007. Occurrence of the 1.3-year periodicity in the large-scale solar magnetic field for 8 solar cycles. Advances in Space Research 40, 1006-1014.
Rigozo, N. R.,Nordemann, D.J.R., Souza Echer, M.P., Echer, E., da Silva, H.E., Prestes, A., Guarnieri, F.L., 2007. Solar activity imprints in tree ring width from Chili (1610-1991). JASTP 69, 1049-1056.
Rozelot, J.P., 1990. Historical reconstruction of past solar cycles and links with the Earth climate. In "New approaches in Geomagnetism and the Earth's Rotation", ed. S. Flodmark, World Scientific, London, pp. 245-253.
References

7-13 September, Sibenik, Croatia
24
THANK YOUTHANK YOU