Embed Size (px)
Citation preview

7-1

McGraw-Hill/Irwin Copyright © 2005 by The McGraw-Hill Companies, Inc. All rights reserved.
7
Market Potential
And Sales Forecasting
7-3
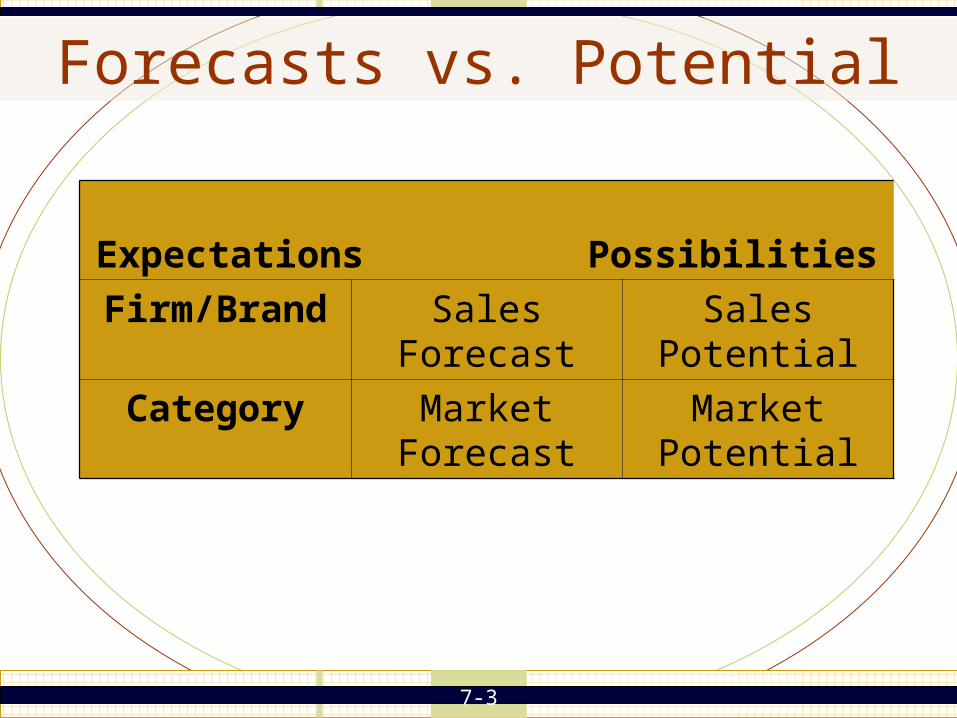
Forecasts vs. Potential
Expectations Possibilities
Firm/Brand Sales Forecast Sales Potential
Category Market Forecast Market Potential
7-4
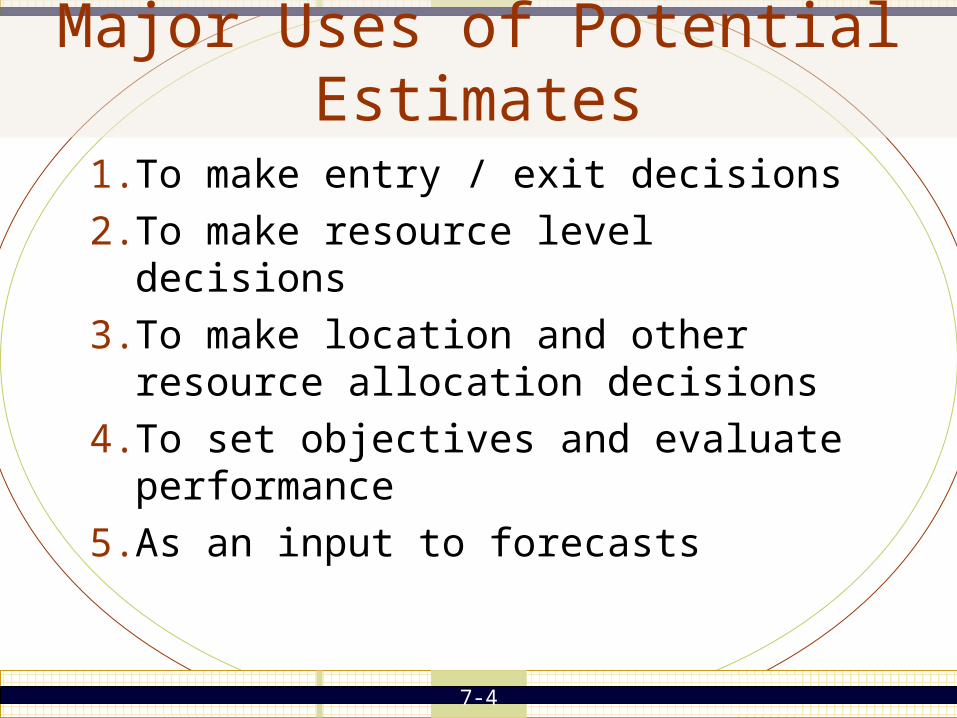
Major Uses of Potential Estimates
1. To make entry / exit decisions
2. To make resource level decisions
3. To make location and other resource allocation decisions
4. To set objectives and evaluate performance
5. As an input to forecasts
7-5
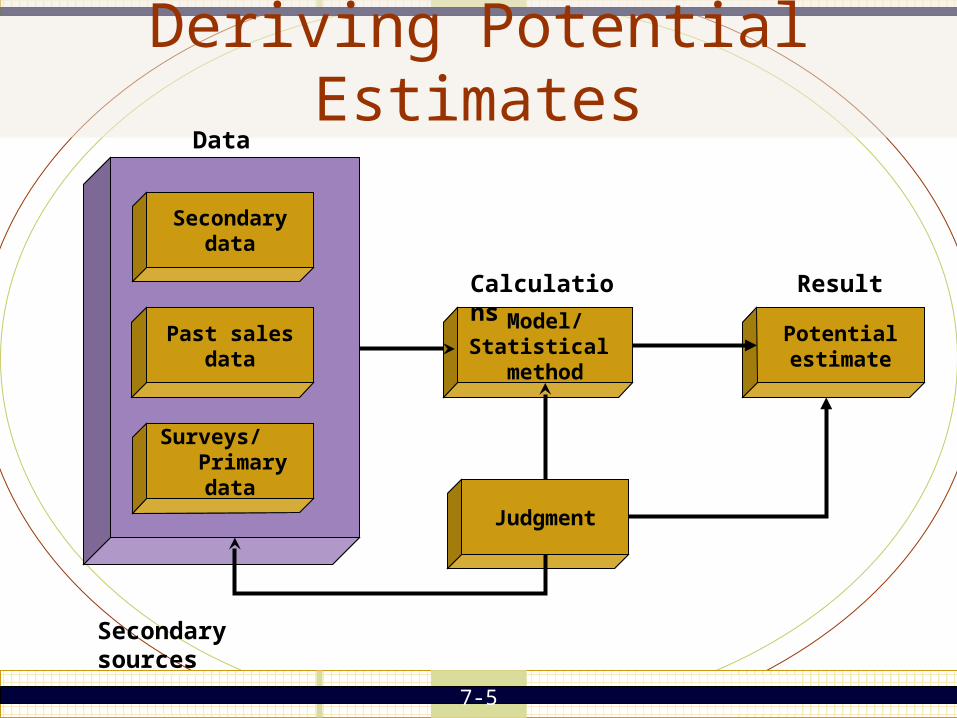
Deriving Potential Estimates
Potential estimate
Past sales data
Secondary data
Surveys/ Primary data
Model/Statistical method
Judgment
Secondary sources
Data
Calculations Result
7-6
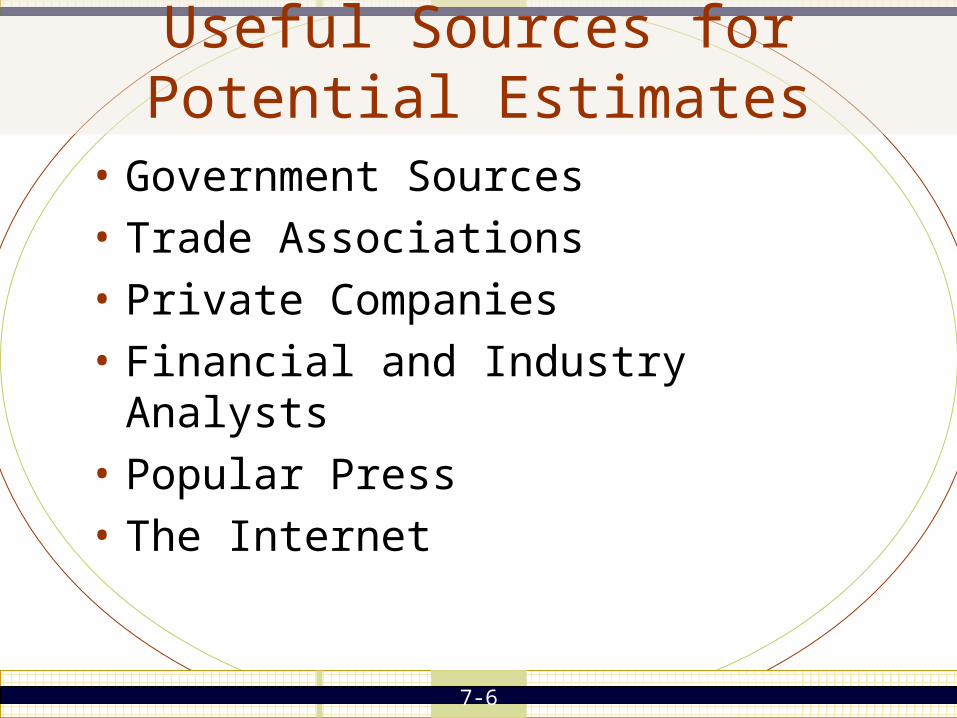
Useful Sources for Potential Estimates
• Government Sources
• Trade Associations
• Private Companies
• Financial and Industry Analysts
• Popular Press
• The Internet
7-7
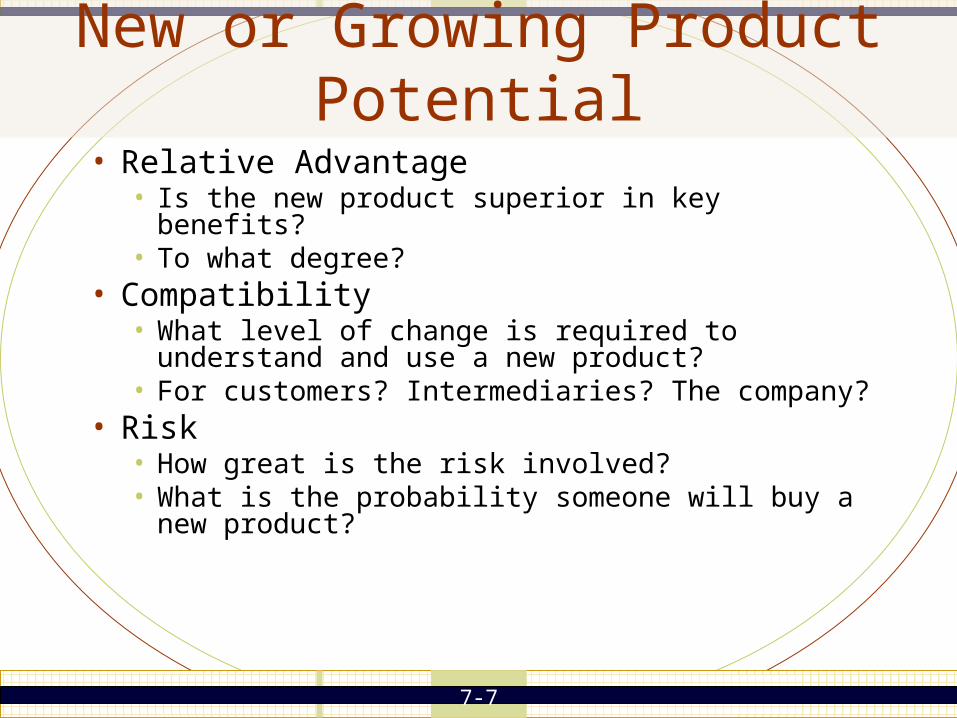
New or Growing Product Potential
• Relative Advantage• Is the new product superior in key benefits?• To what degree?
• Compatibility• What level of change is required to understand and use
a new product?• For customers? Intermediaries? The company?
• Risk• How great is the risk involved?• What is the probability someone will buy a new
product?
7-8
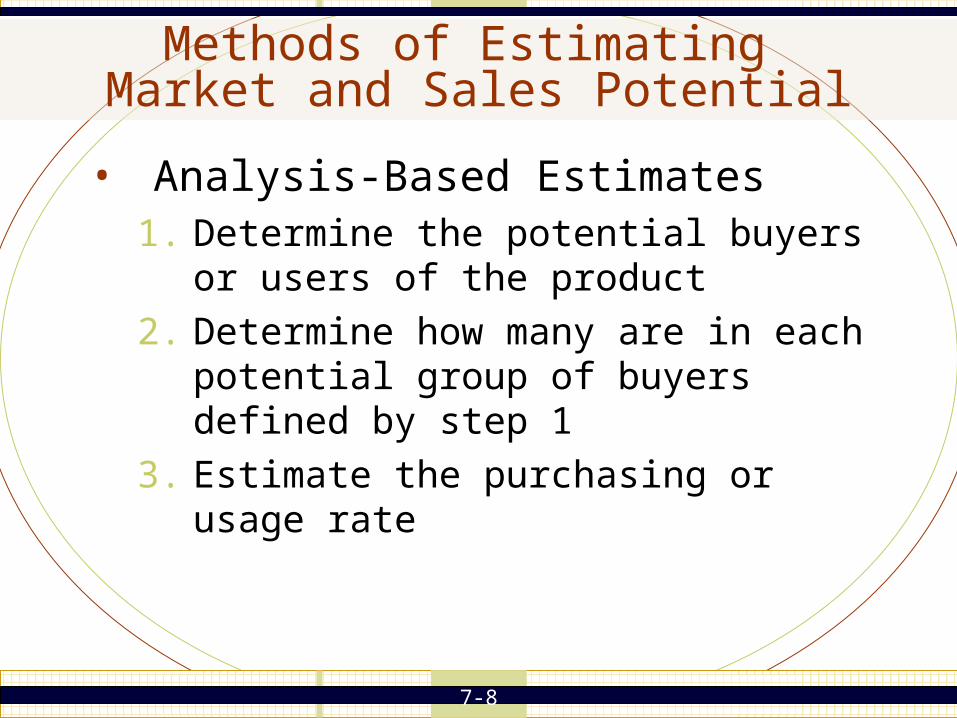
Methods of Estimating Market and Sales Potential
• Analysis-Based Estimates1. Determine the potential buyers or users of the
product
2. Determine how many are in each potential group of buyers defined by step 1
3. Estimate the purchasing or usage rate
7-9
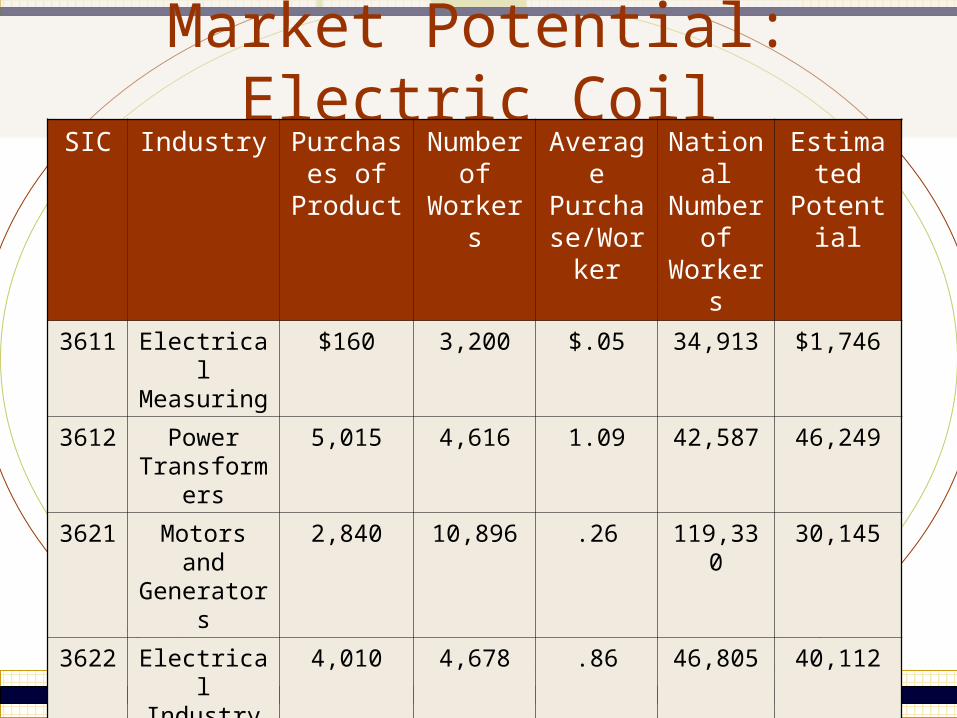
Market Potential: Electric CoilSIC Industry Purchases
of ProductNumber
of Workers
Average Purchase/Worker
National Number
of Workers
Estimated Potential
3611 Electrical Measuring
$160 3,200 $.05 34,913 $1,746
3612 Power Transformers
5,015 4,616 1.09 42,587 46,249
3621 Motors and Generators
2,840 10,896 .26 119,330 30,145
3622 Electrical Industry Controls
4,010 4,678 .86 46,805 40,112
$12,025 $119,252
7-10
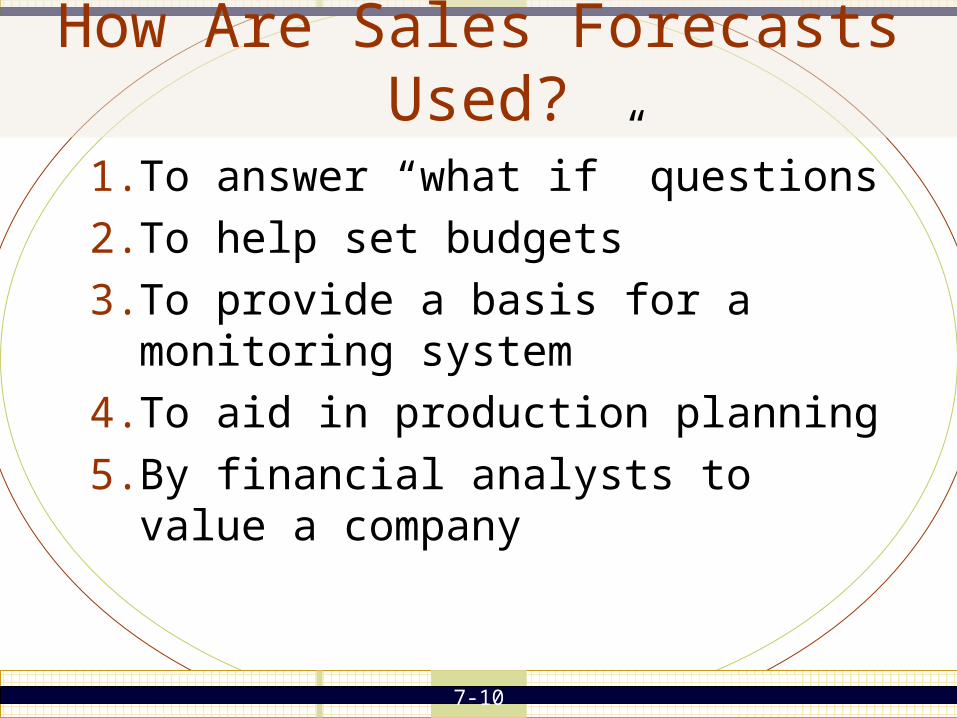
How Are Sales Forecasts Used?
1. To answer “what if” questions
2. To help set budgets
3. To provide a basis for a monitoring system
4. To aid in production planning
5. By financial analysts to value a company
7-11
Judgment-based Forecasting Methods
• Naïve extrapolation
• Sales force composite
• Jury of expert opinion
• Delphi method
7-12
Customer-Based Forecasting Methods
• Market testing• Situations in which potential customers are
asked to respond to a product concept• Mall Intercept Surveys• Focus Groups
• Market surveys• A form of primary market research in which
potential customers are asked to give some indication of their likelihood of purchasing a product
7-13
Time-Series Forecasting Methods
• Moving Averages
• Exponential Smoothing
• Regression Analysis
7-14
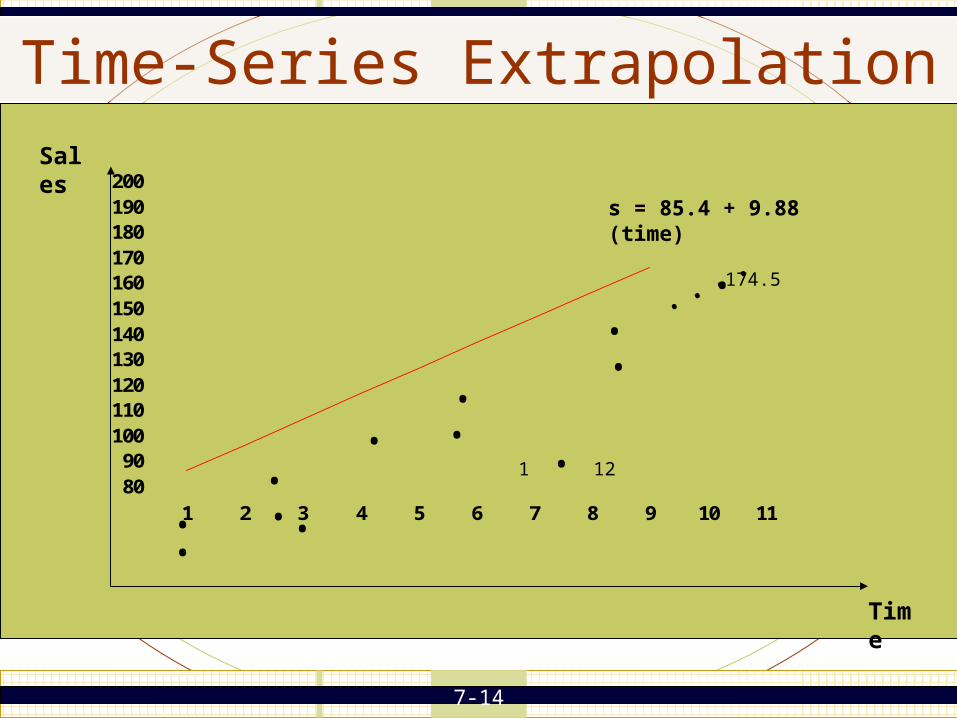
Time-Series Extrapolation
8090
100110120130140150160170180190200
1 2 3 4 5 6 7 8 9 10 11••• •
•
•
• •1 • 12
••
• • • • • 174.5
s = 85.4 + 9.88 (time)
Time
Sales
7-15
Model-Based Methods
• Regression analysis
• Leading indicators
• Econometric models
7-16
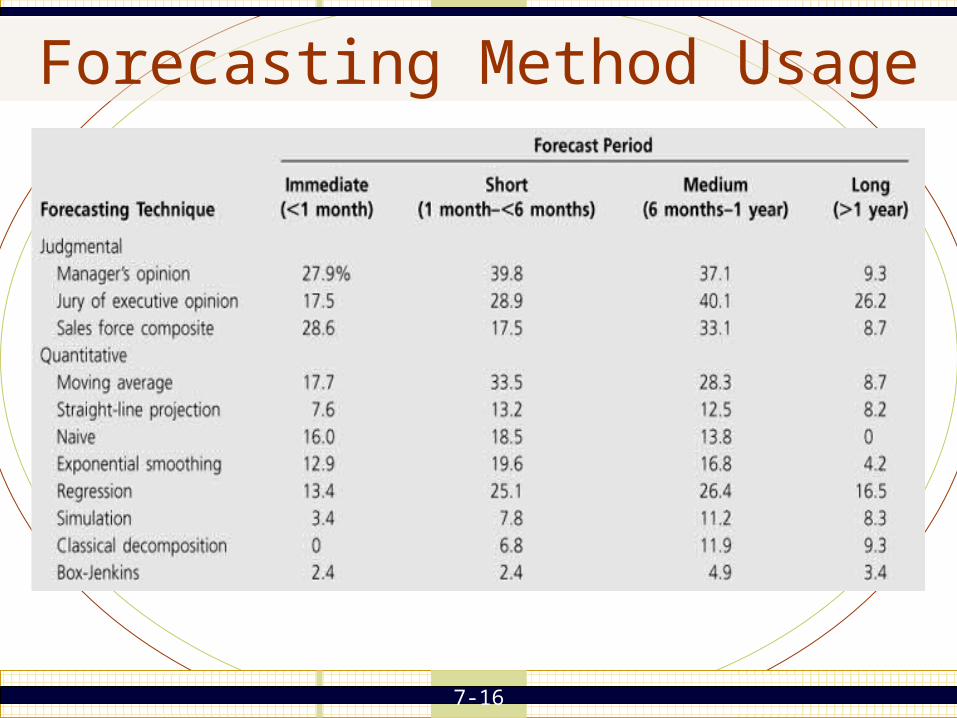
Forecasting Method Usage
7-17
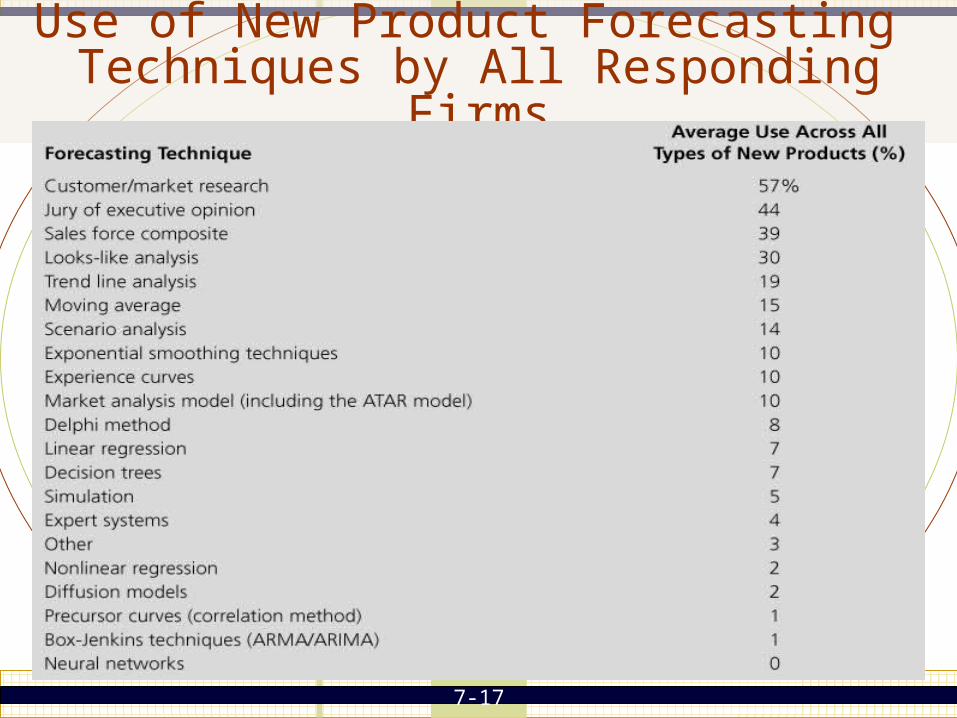
Use of New Product Forecasting Techniques by All Responding Firms
7-18
Developing Regression Models
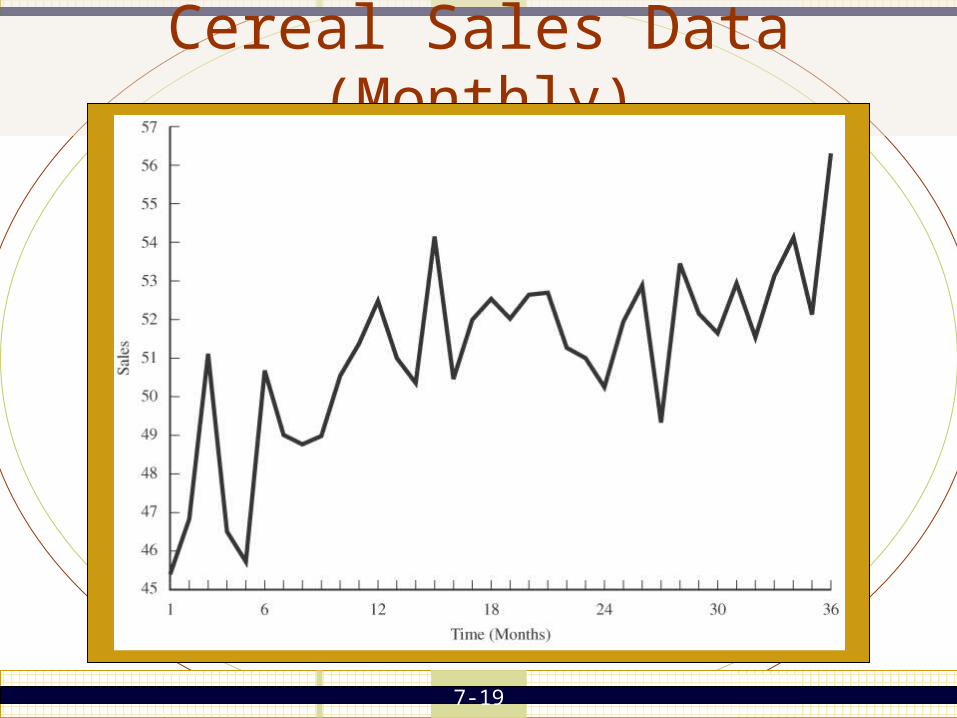
• Plot Sales Over Time• Consider the Variables that Are Relevant to
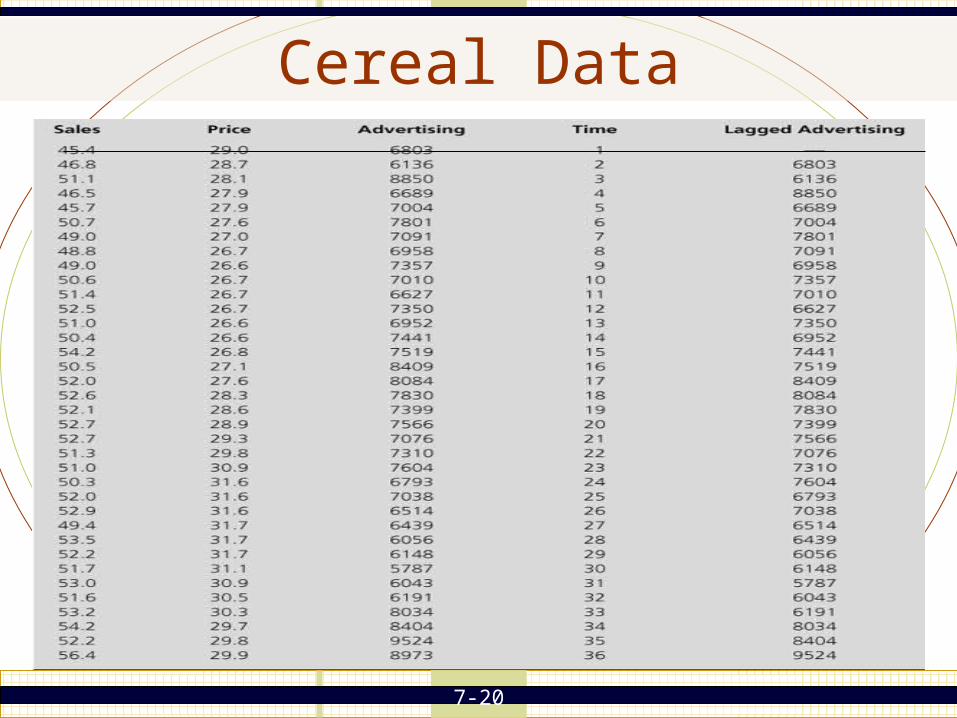
Predicting Sales• Collect Data• Analyze the Data
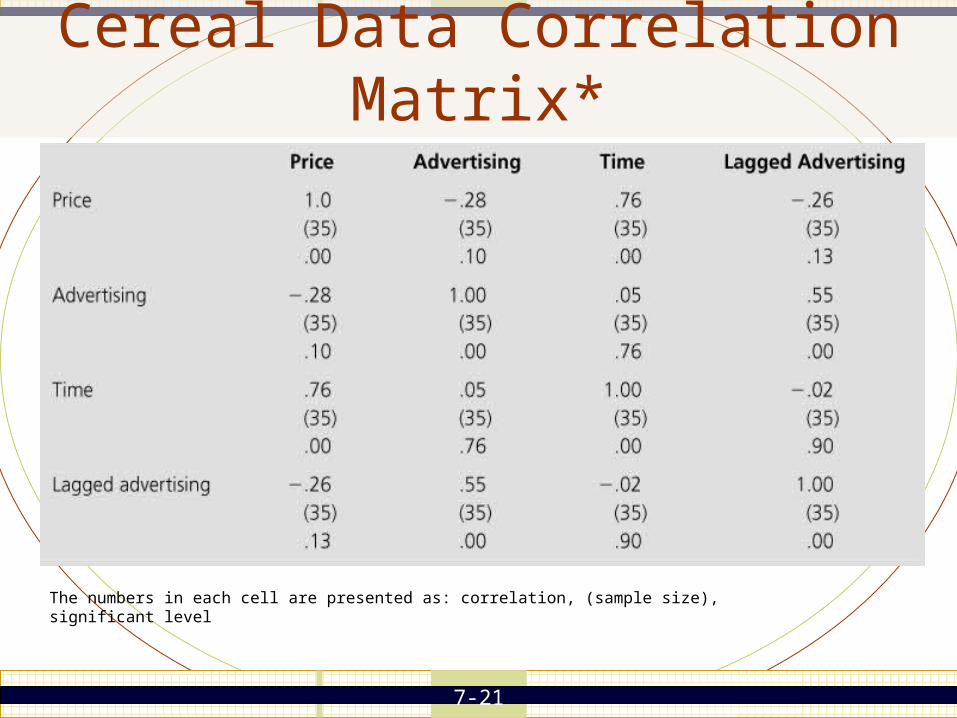
• Examine the correlations among the independent variables
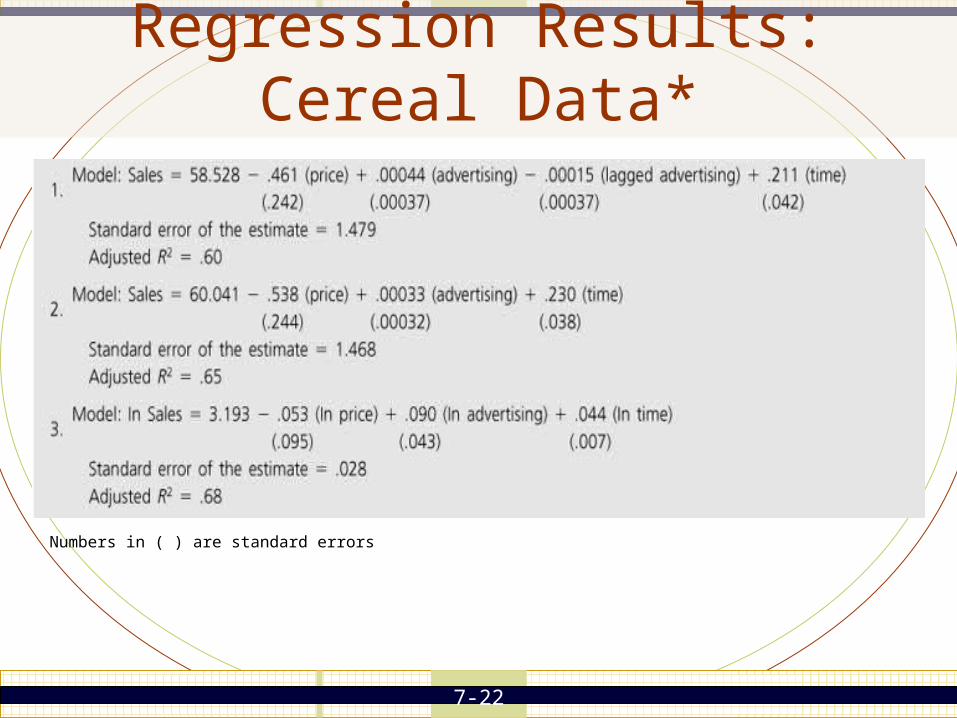
• Run the regression• Determine the significant predictors
7-19
Cereal Sales Data (Monthly)
7-20
Cereal Data
7-21
Cereal Data Correlation Matrix*
The numbers in each cell are presented as: correlation, (sample size), significant level
7-22
Regression Results: Cereal Data*
Numbers in ( ) are standard errors
7-23
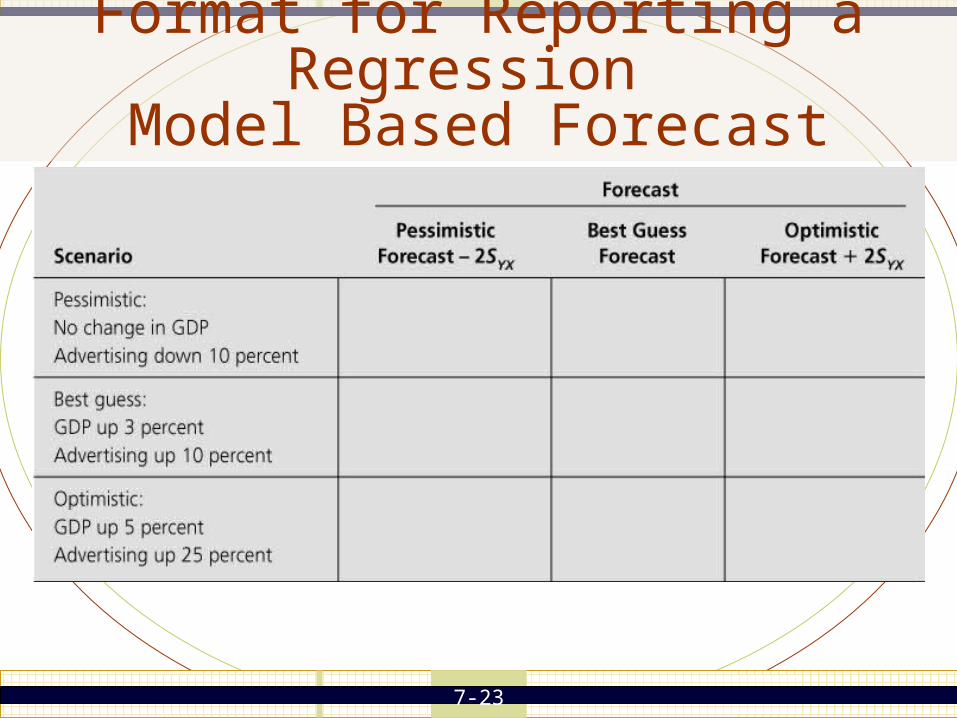
Format for Reporting a Regression Model Based Forecast
7-24
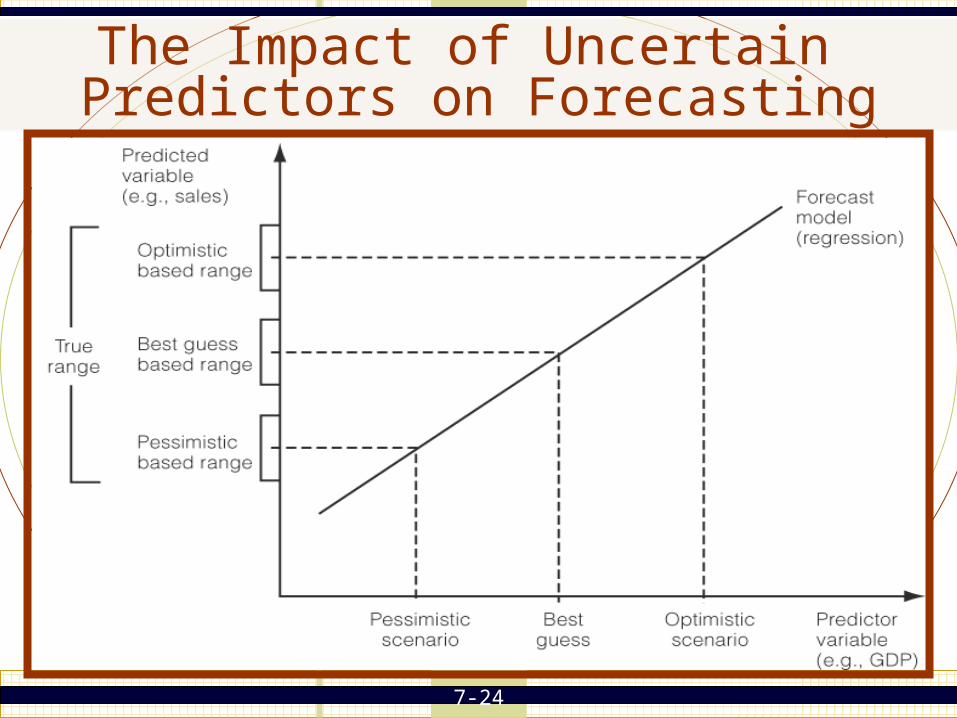
The Impact of Uncertain Predictors on Forecasting
7-25
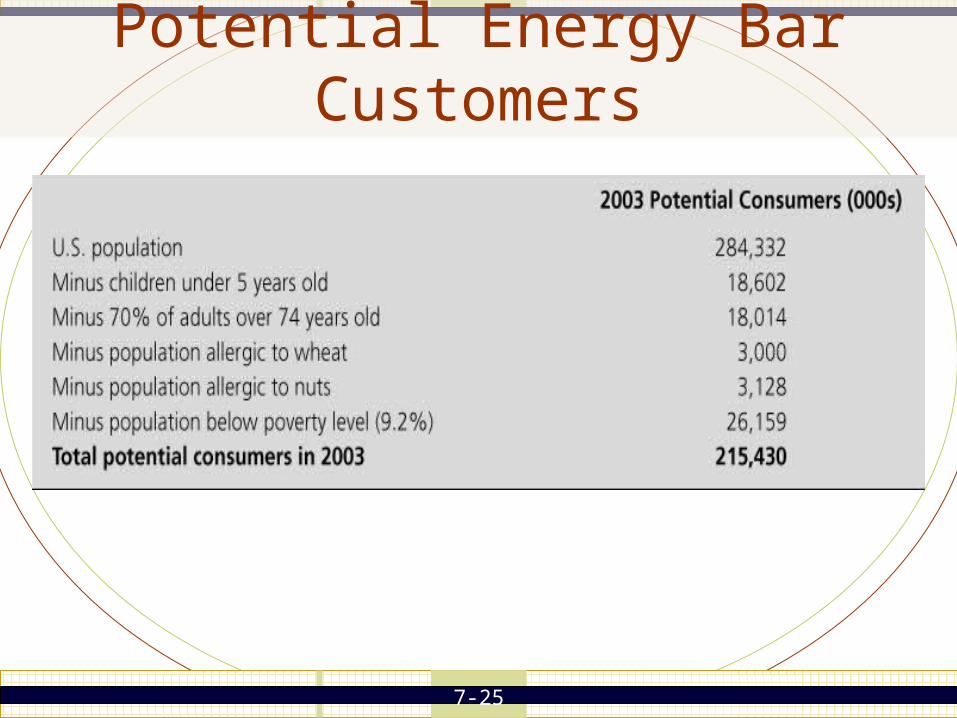
Potential Energy Bar Customers
7-26
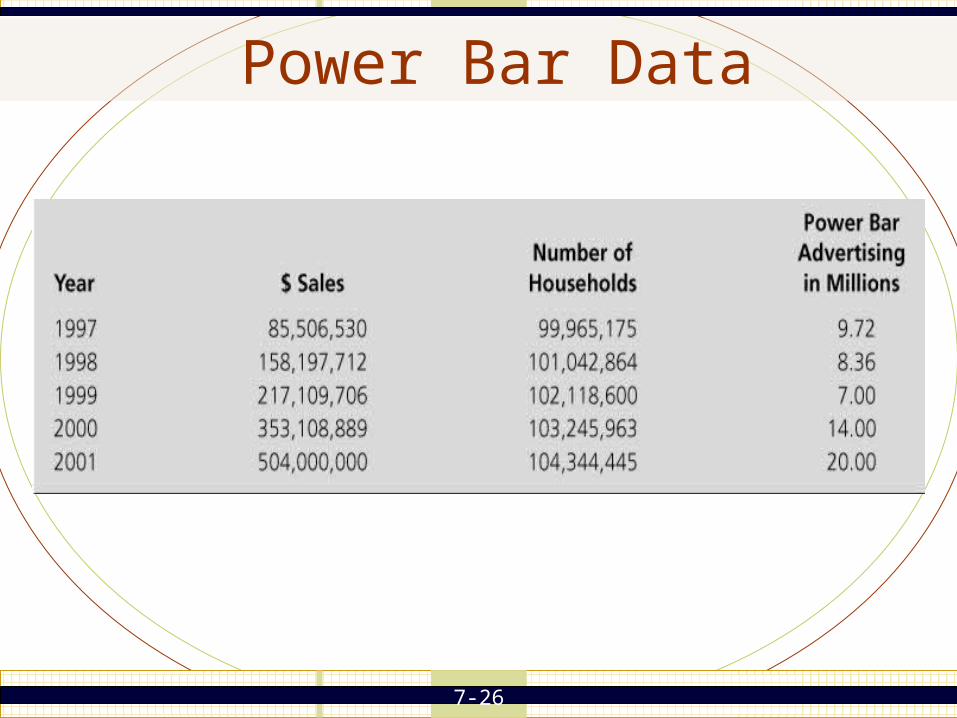
Power Bar Data
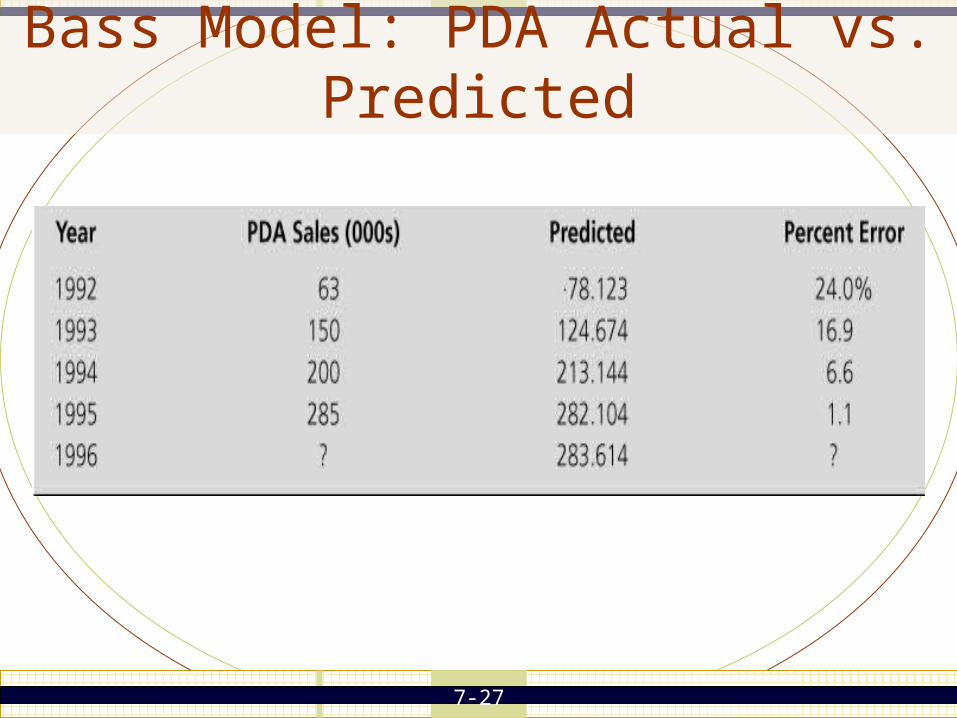
7-27
Bass Model: PDA Actual vs. Predicted
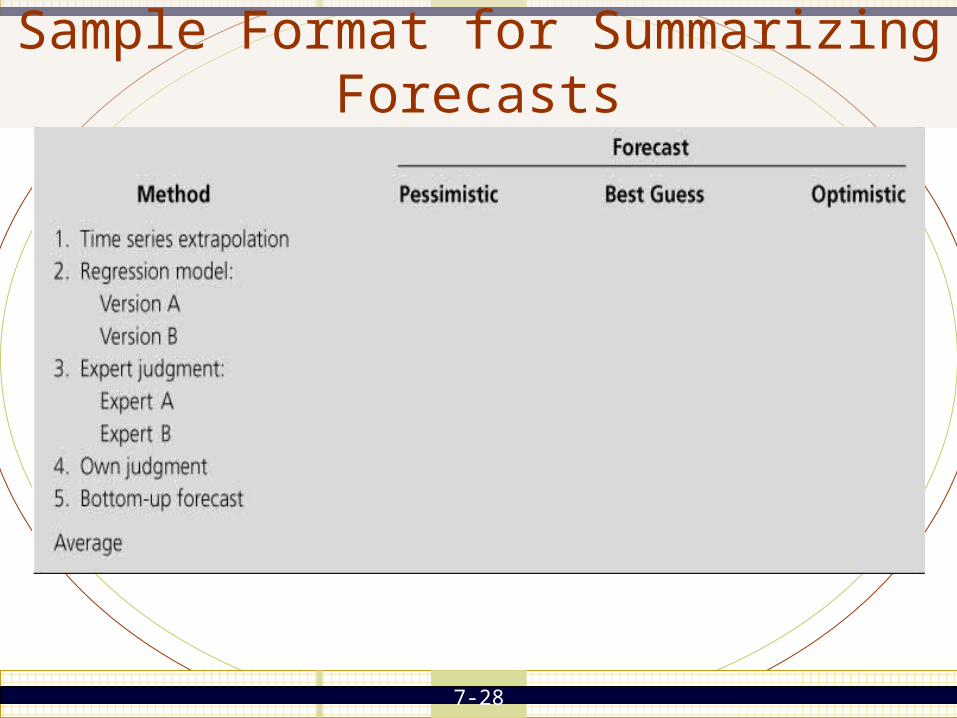
7-28
Sample Format for Summarizing Forecasts
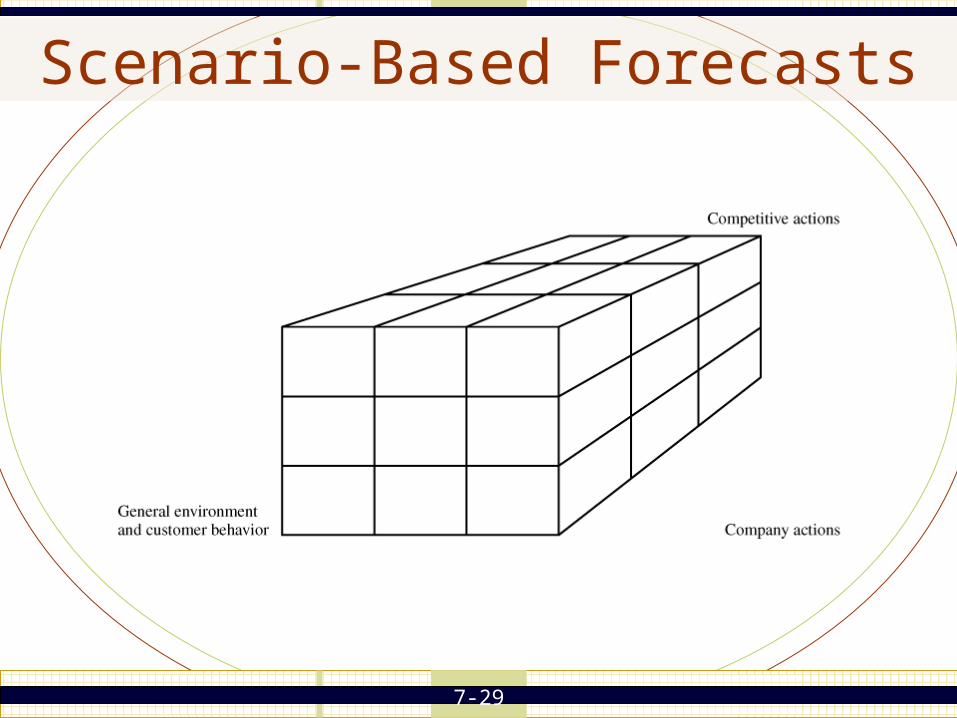
7-29
Scenario-Based Forecasts
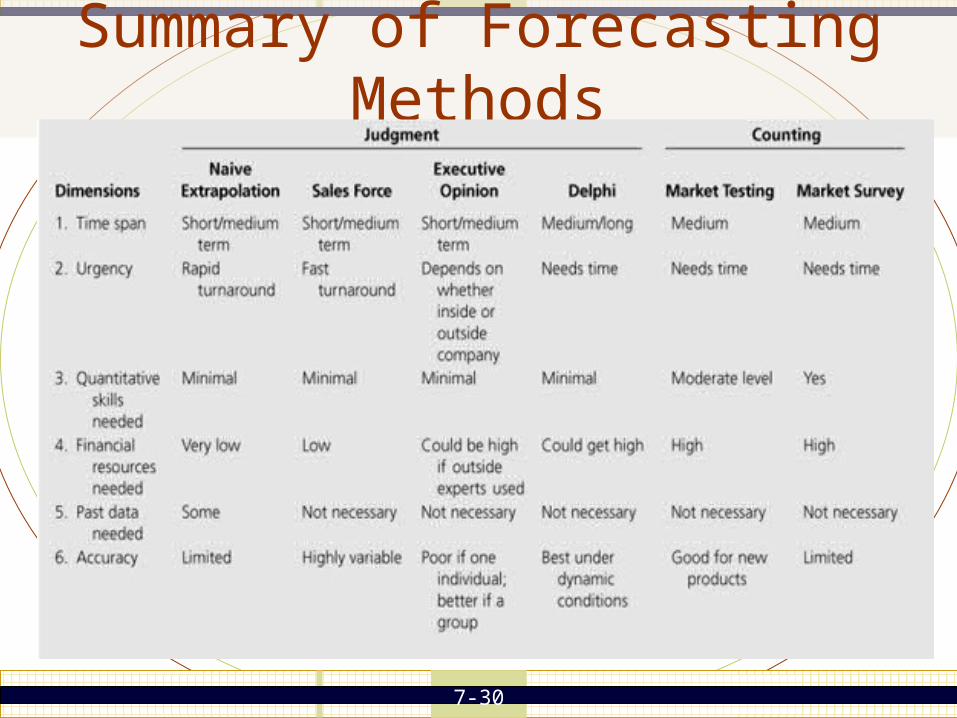
7-30
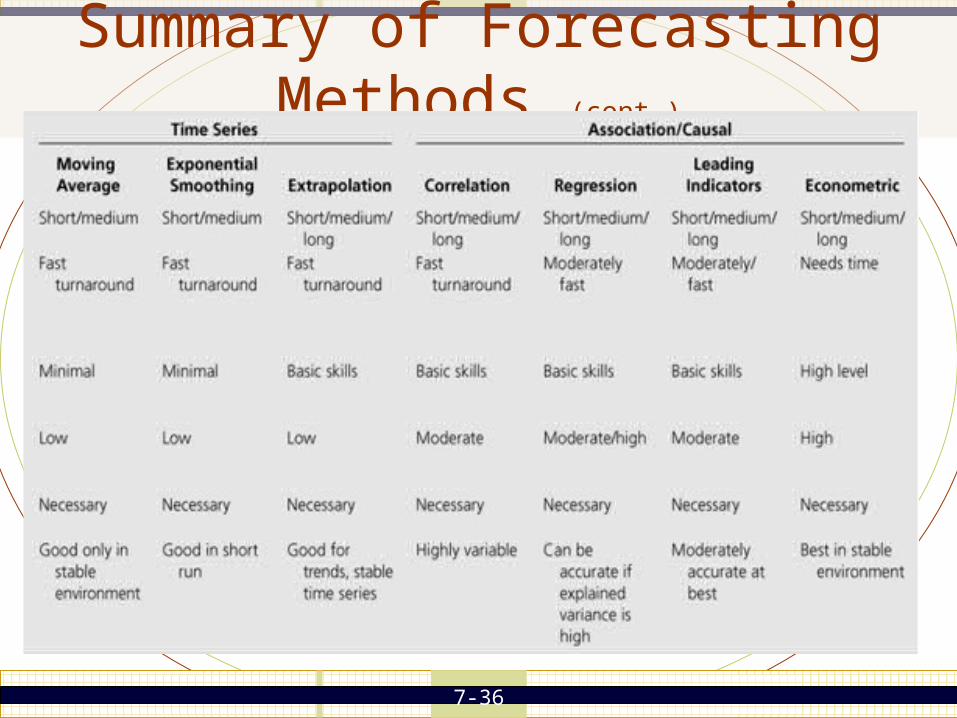
Summary of Forecasting Methods
7-31
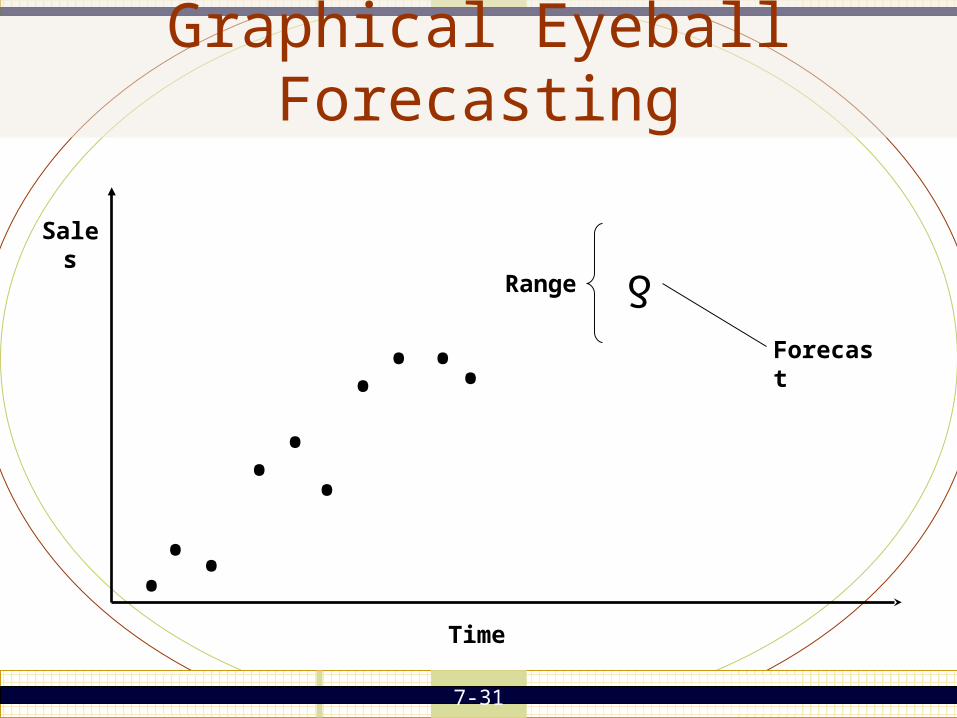
Graphical Eyeball Forecasting
Time
Sales
• ••
••
•
•• • •
Range ƍ
Forecast
7-32
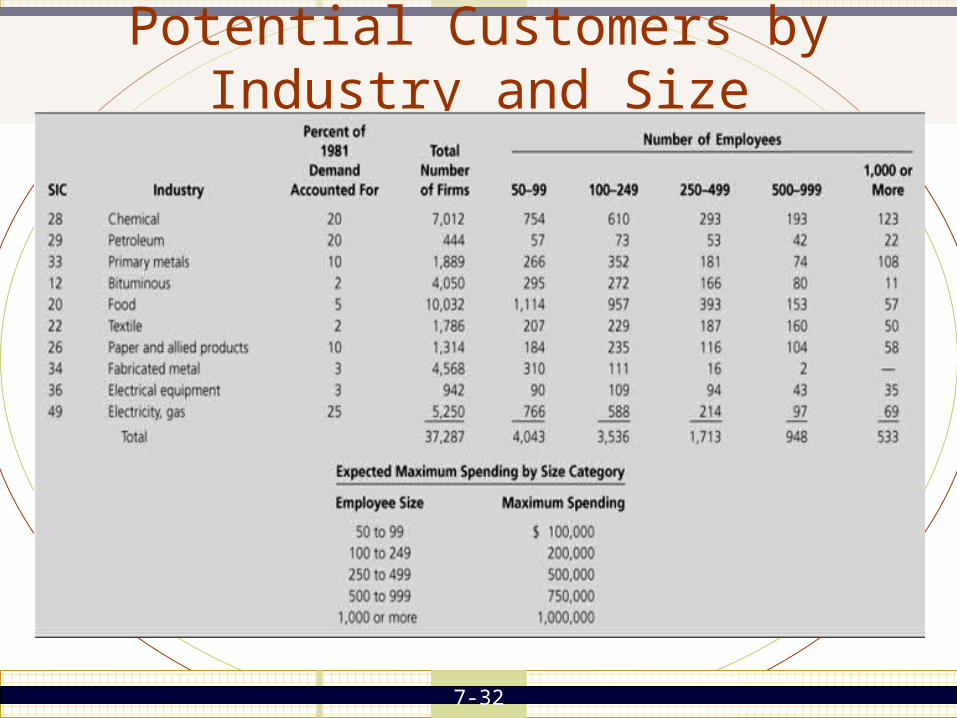
Potential Customers by Industry and Size
7-33
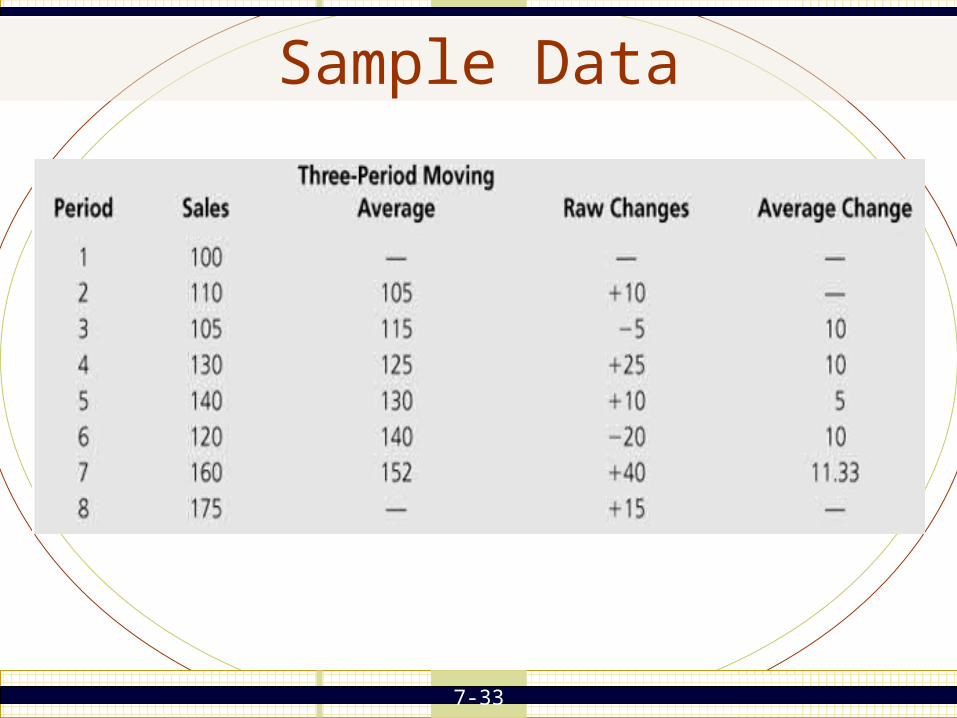
Sample Data
7-34
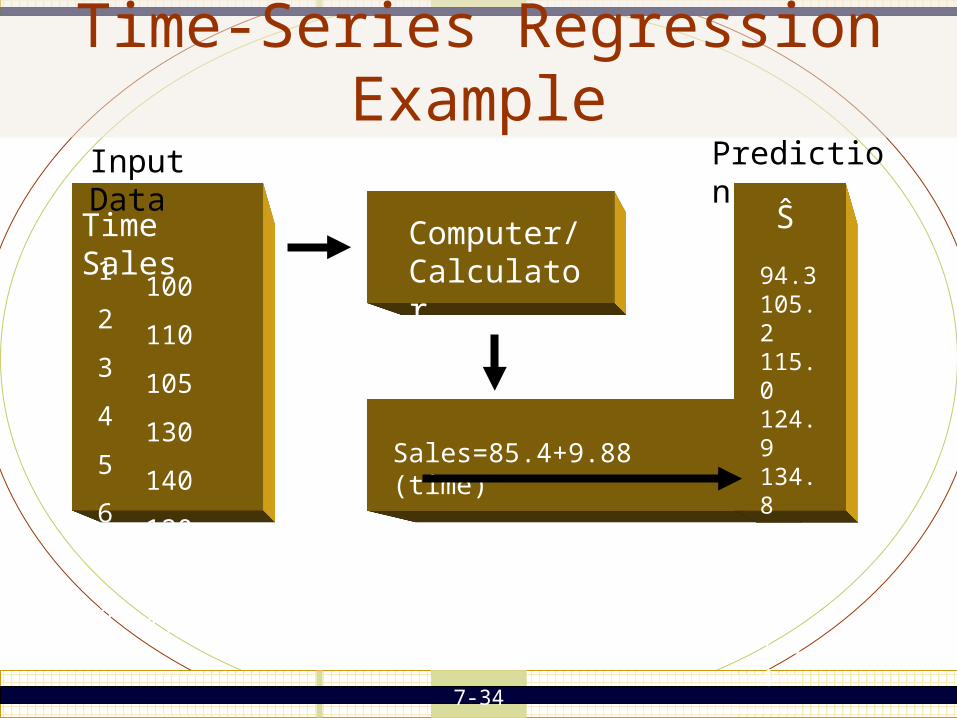
Time-Series Regression Example
1 1002 1103 1054 1305 1406 1207 1608 175
Time Sales
Input Data
Computer/ Calculator
Sales=85.4+9.88 (time)
Prediction
94.3 105.2 115.0 124.9 134.8 144.7 154.6 164.4
Ŝ
7-35
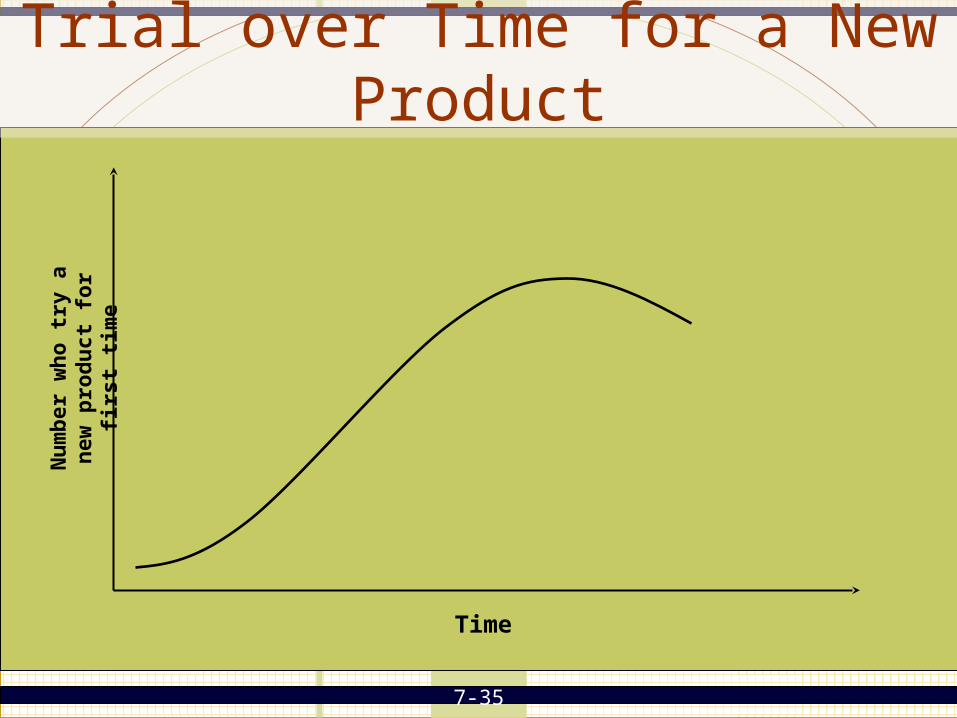
Trial over Time for a New Product
Time
Nu
mb
er w
ho
try
a n
ew
pro
du
ct f
or f
irst
tim
e
7-36
Summary of Forecasting Methods (cont.)


