Embed Size (px)
Citation preview
Makai Marine Advisors LLC
Product Tanker Outlook
6th Chemical and Product Tankers Conference
London, 11-12 March 2014
Jeff McGee
Makai Marine Advisors
2Makai Marine Advisors LLC March 2014
© 2014 Makai Marine Advisors, All Rights Reserved
Topics for discussion
• Macro & Demand Outlook
• Refining Developments
• Product Trade
• Product Tanker Supply
• Freight & Asset Price Outlook
• Conclusions
3Makai Marine Advisors LLC March 2014
Macroeconomic & Oil Demand Outlook
4Makai Marine Advisors LLC March 2014
© 2014 Makai Marine Advisors, All Rights Reserved
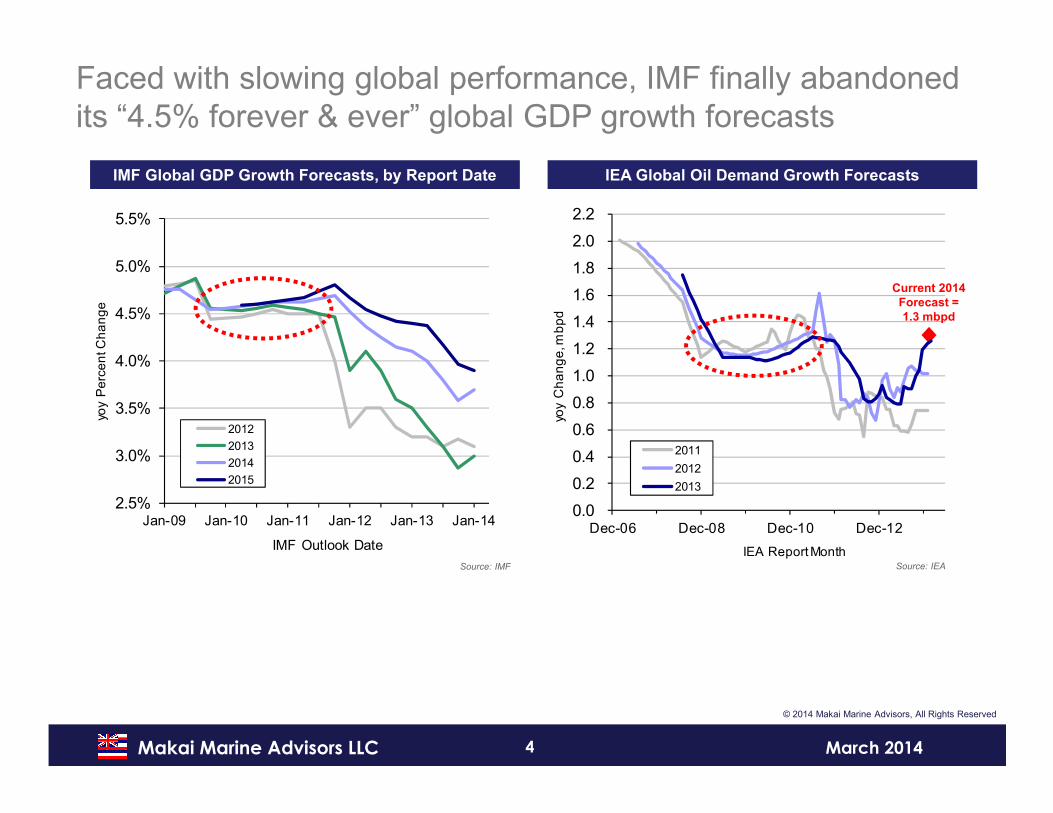
Faced with slowing global performance, IMF finally abandoned its “4.5% forever & ever” global GDP growth forecasts
IMF Global GDP Growth Forecasts, by Report Date IEA Global Oil Demand Growth Forecasts
Source: IMF Source: IEA
2.5%
3.0%
3.5%
4.0%
4.5%
5.0%
5.5%
Jan-09 Jan-10 Jan-11 Jan-12 Jan-13 Jan-14
yoy
Pe
rce
nt C
ha
ng
e
IMF Outlook Date
2012
2013
2014
2015
0.0
0.2
0.4
0.6
0.8
1.0
1.2
1.4
1.6
1.8
2.0
2.2
Dec-06 Dec-08 Dec-10 Dec-12
yoy
Ch
an
ge
, mb
pd
IEA Report Month
2011
2012
2013
Current 2014
Forecast =
1.3 mbpd
5Makai Marine Advisors LLC March 2014
© 2014 Makai Marine Advisors, All Rights Reserved
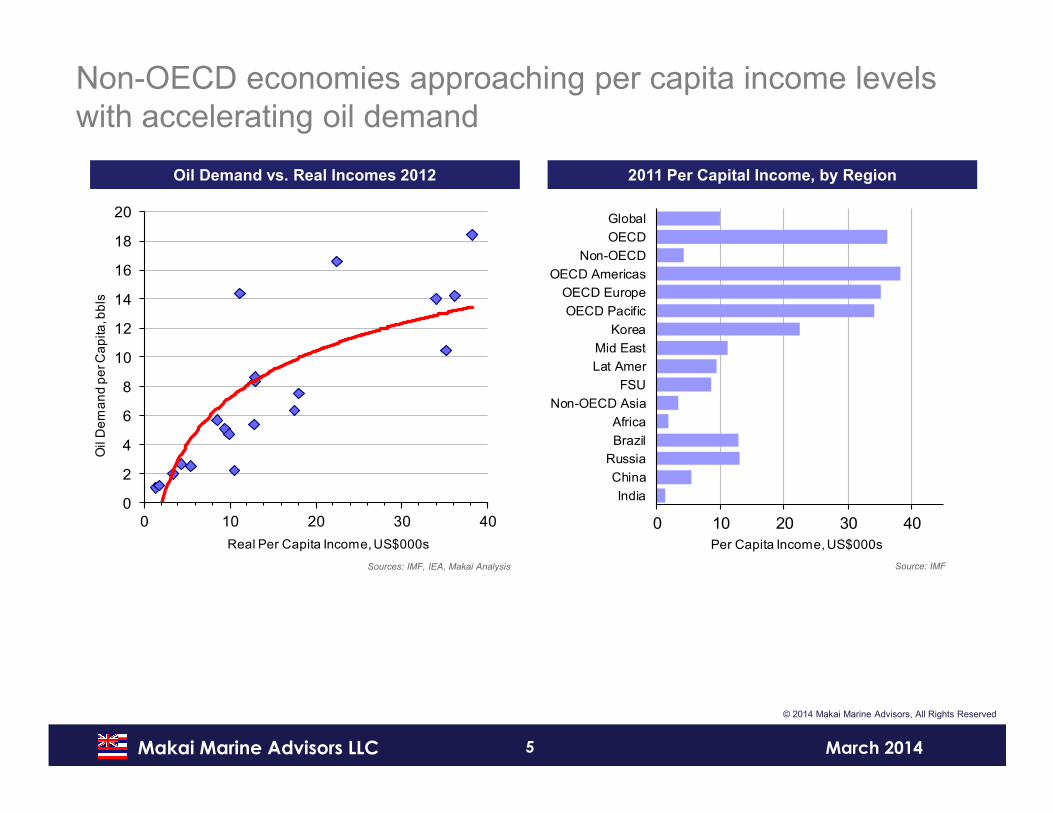
Non-OECD economies approaching per capita income levels with accelerating oil demand
Oil Demand vs. Real Incomes 2012 2011 Per Capital Income, by Region
Sources: IMF, IEA, Makai Analysis Source: IMF
0
2
4
6
8
10
12
14
16
18
20
0 10 20 30 40
Oil
De
ma
nd
pe
r Ca
pita
, bb
ls
Real Per Capita Income, US$000s
0 10 20 30 40
India
China
Russia
Brazil
Africa
Non-OECD Asia
FSU
Lat Amer
Mid East
Korea
OECD Pacific
OECD Europe
OECD Americas
Non-OECD
OECD
Global
Per Capita Income, US$000s
6Makai Marine Advisors LLC March 2014
© 2014 Makai Marine Advisors, All Rights Reserved
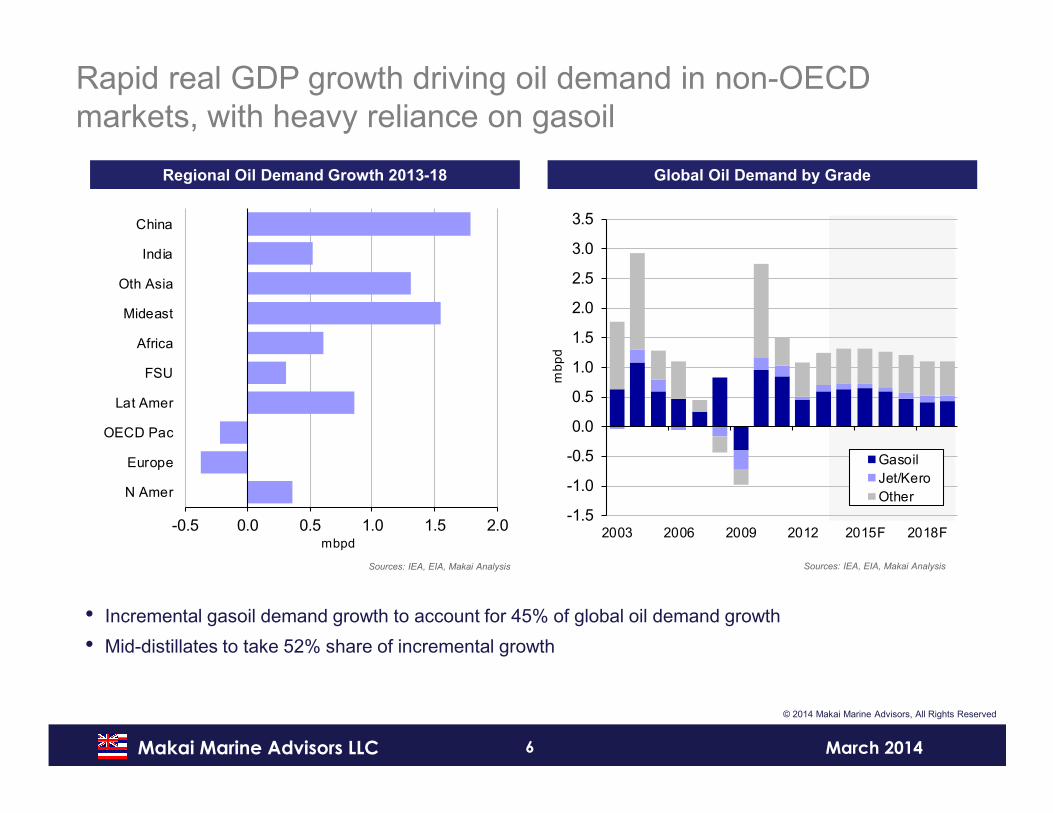
Rapid real GDP growth driving oil demand in non-OECD markets, with heavy reliance on gasoil
Regional Oil Demand Growth 2013-18 Global Oil Demand by Grade
Sources: IEA, EIA, Makai Analysis Sources: IEA, EIA, Makai Analysis
• Incremental gasoil demand growth to account for 45% of global oil demand growth
• Mid-distillates to take 52% share of incremental growth
-0.5 0.0 0.5 1.0 1.5 2.0
N Amer
Europe
OECD Pac
Lat Amer
FSU
Africa
Mideast
Oth Asia
India
China
mbpd
-1.5
-1.0
-0.5
0.0
0.5
1.0
1.5
2.0
2.5
3.0
3.5
2003 2006 2009 2012 2015F 2018F
mb
pd
Gasoil
Jet/Kero
Other
7Makai Marine Advisors LLC March 2014
Refining Developments
8Makai Marine Advisors LLC March 2014
© 2014 Makai Marine Advisors, All Rights Reserved
0.0
0.5
1.0
1.5
2.0
2.5
3.0
3.5
2003 2007 2011 2015F 2019F
yoy
Ch
an
ge
, mb
pd
Atl Basin Other Asia
China Mideast
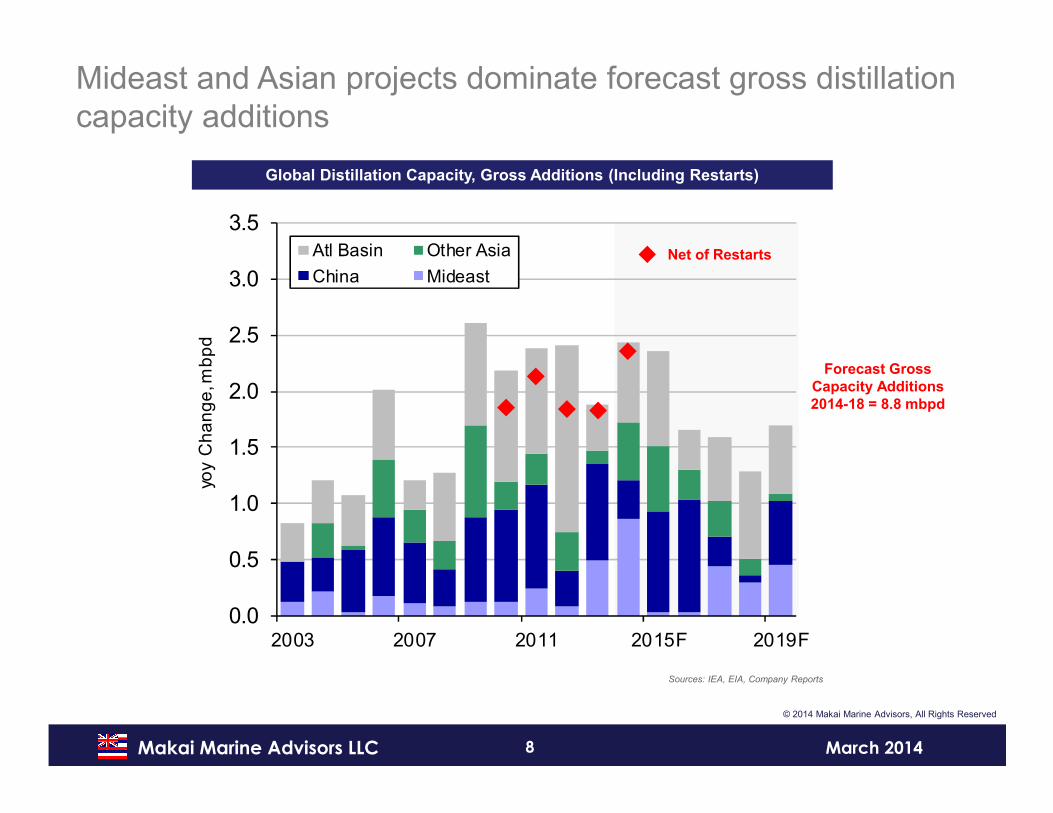
Mideast and Asian projects dominate forecast gross distillation capacity additions
Global Distillation Capacity, Gross Additions (Including Restarts)
Sources: IEA, EIA, Company Reports
Forecast Gross
Capacity Additions
2014-18 = 8.8 mbpd
Net of Restarts
9Makai Marine Advisors LLC March 2014
© 2014 Makai Marine Advisors, All Rights Reserved
0.0
0.5
1.0
1.5
2.0
2.5
2002 2006 2010 2014F 2018F
mb
pd
AsiaOth EuropeLat AmerEU-15US/Canada
0.0
0.5
1.0
1.5
2.0
2.5
2003 2007 2011 2015F 2019F
yoy
Ch
an
ge
, mb
pd
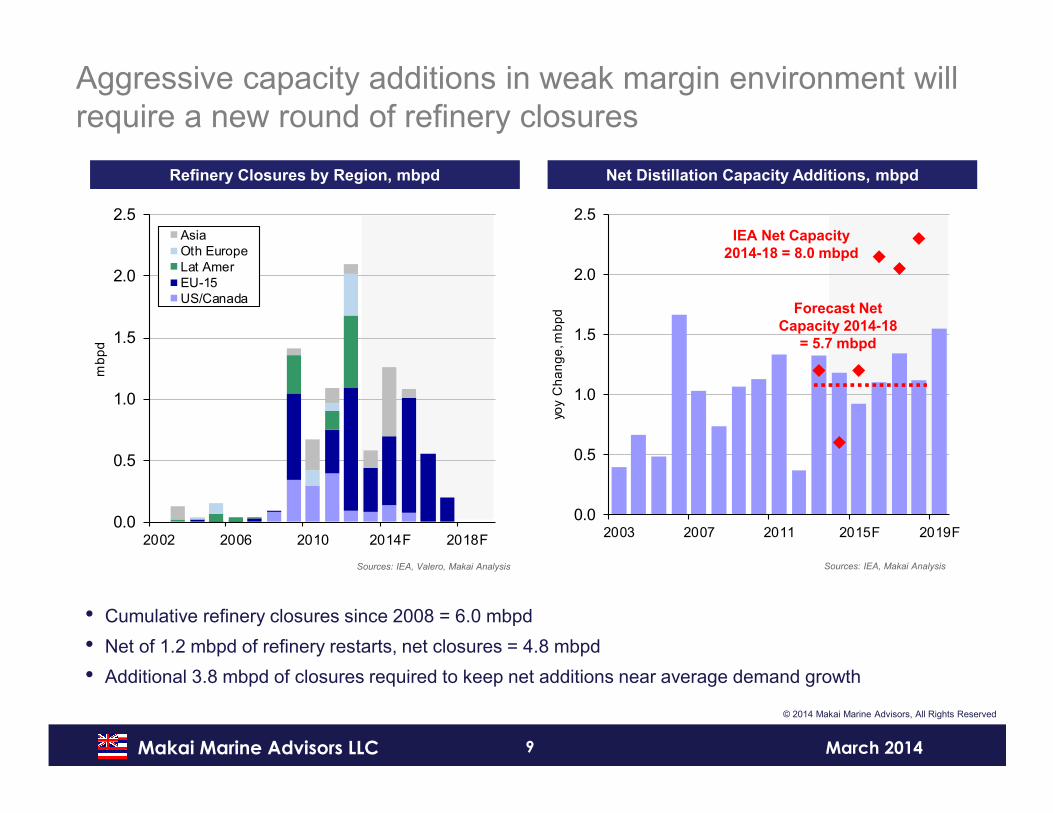
Aggressive capacity additions in weak margin environment will require a new round of refinery closures
Refinery Closures by Region, mbpd Net Distillation Capacity Additions, mbpd
Sources: IEA, Valero, Makai Analysis Sources: IEA, Makai Analysis
• Cumulative refinery closures since 2008 = 6.0 mbpd
• Net of 1.2 mbpd of refinery restarts, net closures = 4.8 mbpd
• Additional 3.8 mbpd of closures required to keep net additions near average demand growth
Forecast Net
Capacity 2014-18
= 5.7 mbpd
IEA Net Capacity
2014-18 = 8.0 mbpd
10Makai Marine Advisors LLC March 2014
© 2014 Makai Marine Advisors, All Rights Reserved
-2.5
-2.0
-1.5
-1.0
-0.5
0.0
0.5
1.0
1.5
2.0
2.5
2006 2009 2012 2015F 2018F
mb
pd
Atl Basin
OECD Pac
China
Oth Asia
AG
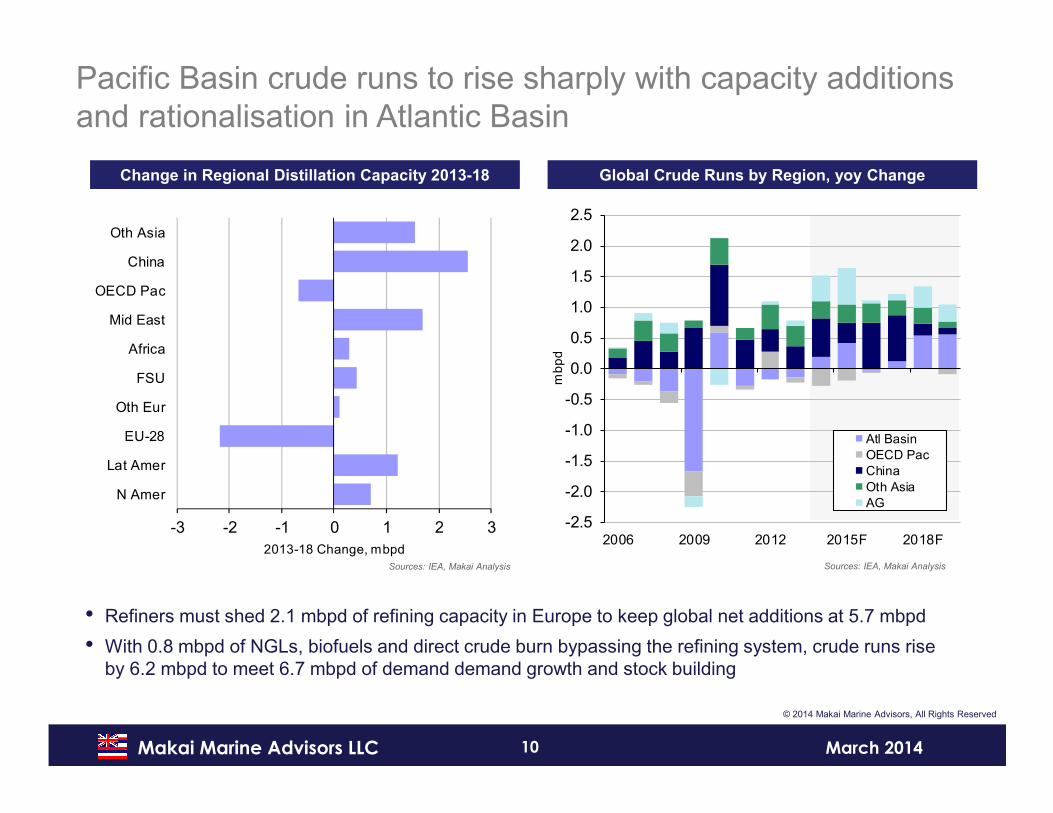
Pacific Basin crude runs to rise sharply with capacity additions and rationalisation in Atlantic Basin
Change in Regional Distillation Capacity 2013-18 Global Crude Runs by Region, yoy Change
Sources: IEA, Makai Analysis Sources: IEA, Makai Analysis
-3 -2 -1 0 1 2 3
N Amer
Lat Amer
EU-28
Oth Eur
FSU
Africa
Mid East
OECD Pac
China
Oth Asia
2013-18 Change, mbpd
• Refiners must shed 2.1 mbpd of refining capacity in Europe to keep global net additions at 5.7 mbpd
• With 0.8 mbpd of NGLs, biofuels and direct crude burn bypassing the refining system, crude runs rise by 6.2 mbpd to meet 6.7 mbpd of demand demand growth and stock building
11Makai Marine Advisors LLC March 2014
US Refining
12Makai Marine Advisors LLC March 2014
© 2014 Makai Marine Advisors, All Rights Reserved
-400
-200
0
200
400
600
800
1,000
1,200
2004 2008 2012 2016F 2020F
kbpd
Tight Oil
GoM
Alaska
Other US
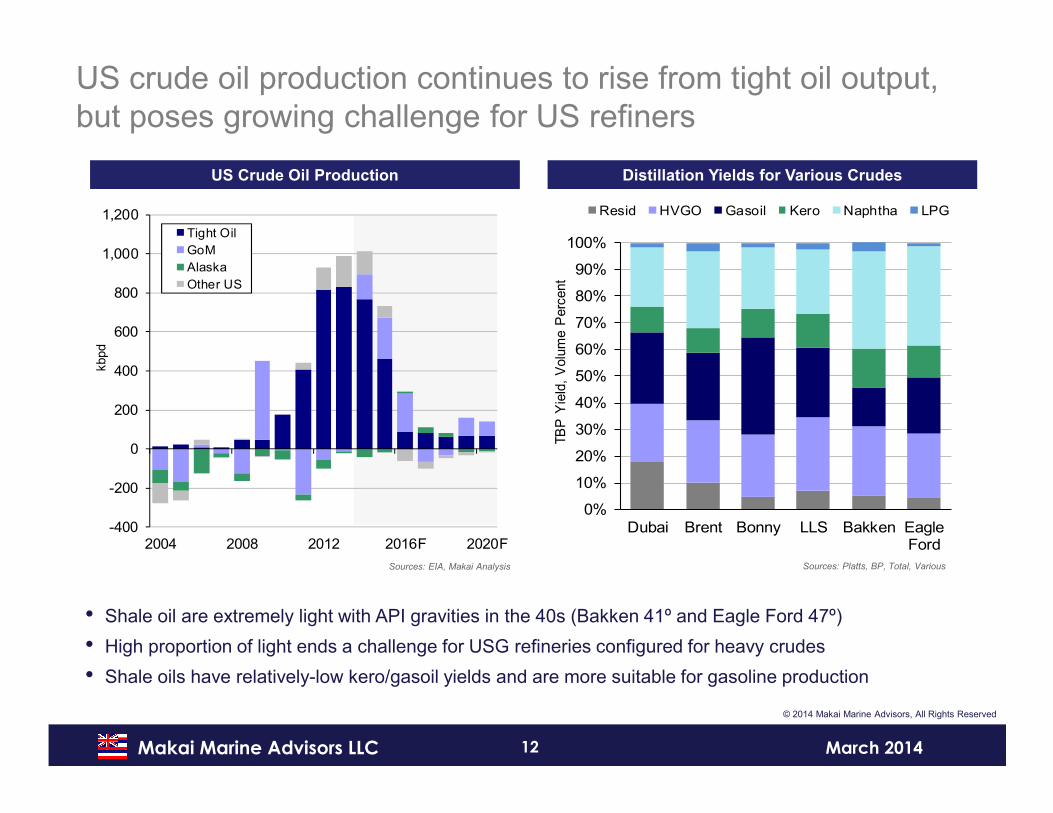
US crude oil production continues to rise from tight oil output, but poses growing challenge for US refiners
US Crude Oil Production Distillation Yields for Various Crudes
Sources: EIA, Makai Analysis Sources: Platts, BP, Total, Various
• Shale oil are extremely light with API gravities in the 40s (Bakken 41º and Eagle Ford 47º)
• High proportion of light ends a challenge for USG refineries configured for heavy crudes
• Shale oils have relatively-low kero/gasoil yields and are more suitable for gasoline production
0%
10%
20%
30%
40%
50%
60%
70%
80%
90%
100%
Dubai Brent Bonny LLS Bakken EagleFord
TB
P Y
ield
, V
olu
me P
erc
ent
Resid HVGO Gasoil Kero Naphtha LPG
13Makai Marine Advisors LLC March 2014
© 2014 Makai Marine Advisors, All Rights Reserved
-600
-400
-200
0
200
400
600
800
2003 2006 2009 2012 2015F 2018F
kbpd
USG
Midwest
USAC
USWC/Rockies
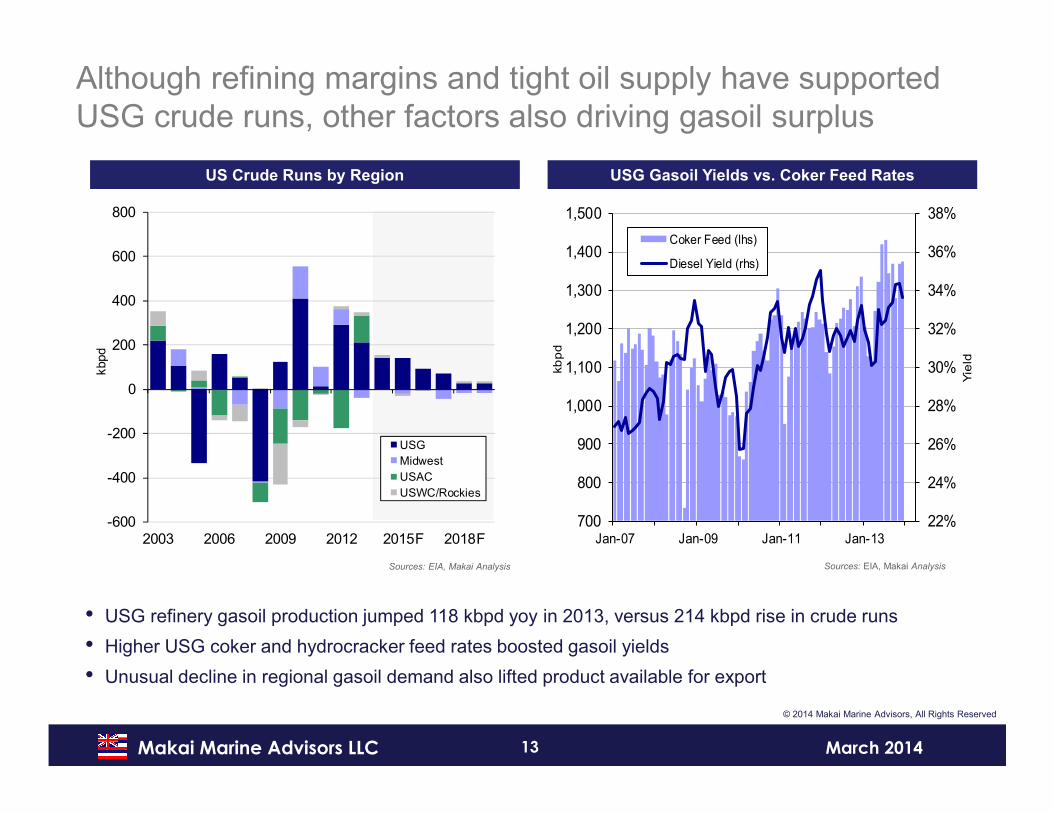
US Crude Runs by Region USG Gasoil Yields vs. Coker Feed Rates
Sources: EIA, Makai Analysis Sources: EIA, Makai Analysis
• USG refinery gasoil production jumped 118 kbpd yoy in 2013, versus 214 kbpd rise in crude runs
• Higher USG coker and hydrocracker feed rates boosted gasoil yields
• Unusual decline in regional gasoil demand also lifted product available for export
22%
24%
26%
28%
30%
32%
34%
36%
38%
700
800
900
1,000
1,100
1,200
1,300
1,400
1,500
Jan-07 Jan-09 Jan-11 Jan-13
Yie
ld
kb
pd
Coker Feed (lhs)
Diesel Yield (rhs)
Although refining margins and tight oil supply have supported USG crude runs, other factors also driving gasoil surplus
14Makai Marine Advisors LLC March 2014
© 2014 Makai Marine Advisors, All Rights Reserved
-800
-600
-400
-200
0
200
400
600
2003 2006 2009 2012 2015F 2018F
kb
pd
Mogas
Diesel
Jet
Heating Oil
Oth Clean
-1,500
-1,000
-500
0
500
1,000
1,500
1999 2003 2007 2011 2015F
kbpd
Mogas
Jet
Gasoil
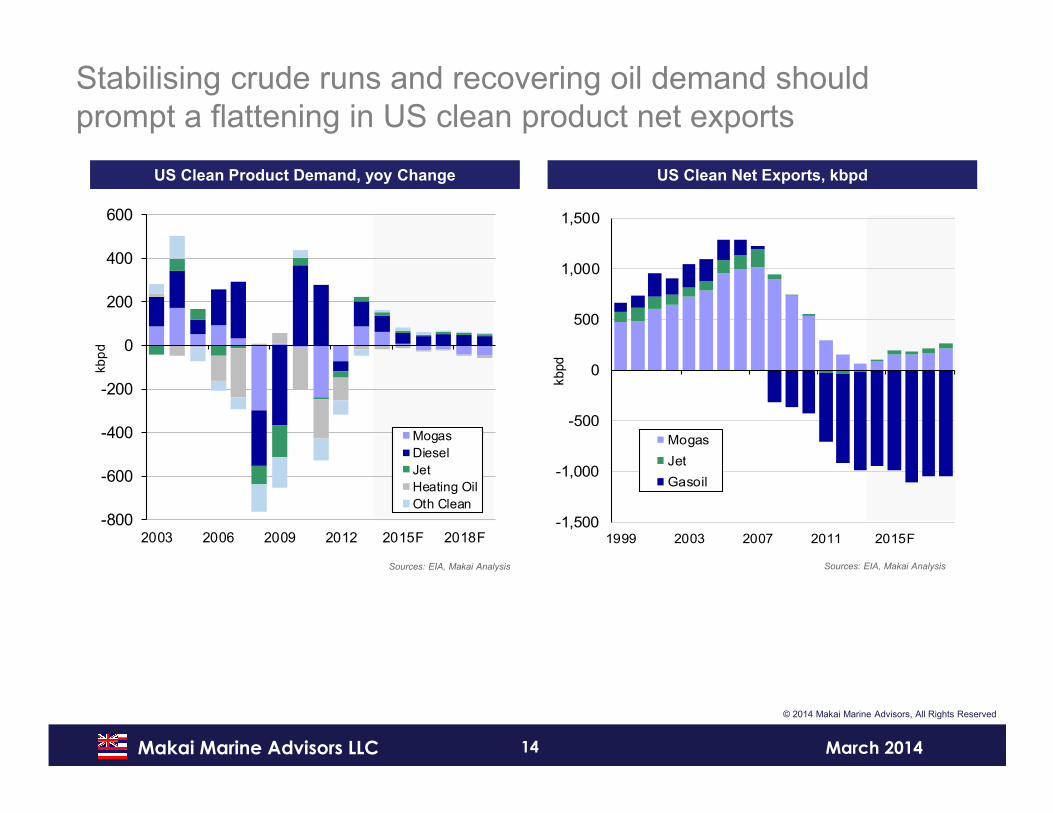
Stabilising crude runs and recovering oil demand should prompt a flattening in US clean product net exports
US Clean Product Demand, yoy Change US Clean Net Exports, kbpd
Sources: EIA, Makai Analysis Sources: EIA, Makai Analysis
15Makai Marine Advisors LLC March 2014
Product Trade
16Makai Marine Advisors LLC March 2014
© 2014 Makai Marine Advisors, All Rights Reserved
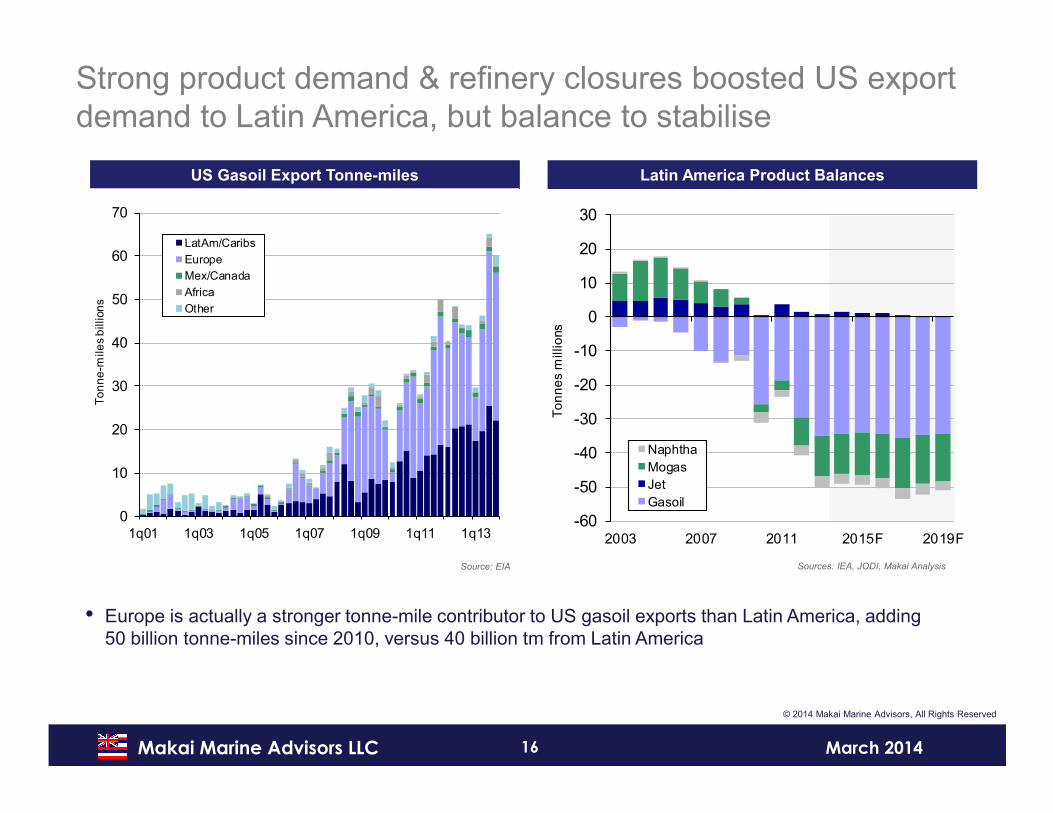
Strong product demand & refinery closures boosted US export demand to Latin America, but balance to stabilise
US Gasoil Export Tonne-miles Latin America Product Balances
Source: EIA Sources: IEA, JODI, Makai Analysis
• Europe is actually a stronger tonne-mile contributor to US gasoil exports than Latin America, adding 50 billion tonne-miles since 2010, versus 40 billion tm from Latin America
0
10
20
30
40
50
60
70
1q01 1q03 1q05 1q07 1q09 1q11 1q13
To
nn
e-m
ile
s b
illio
ns
LatAm/Caribs
Europe
Mex/Canada
Africa
Other
-60
-50
-40
-30
-20
-10
0
10
20
30
2003 2007 2011 2015F 2019F
To
nn
es
millio
ns
Naphtha
Mogas
Jet
Gasoil
17Makai Marine Advisors LLC March 2014
© 2014 Makai Marine Advisors, All Rights Reserved
0
10
20
30
40
50
60
70
2003 2007 2011 2015F 2019F
To
nn
es
millio
ns
Jet
Gasoil
Weak
Strong
-50
0
50
100
150
200
250
2003 2007 2011 2015F 2019F
yoy
Ch
an
ge
, kb
pd
Mogas Jet/Kero Gasoil
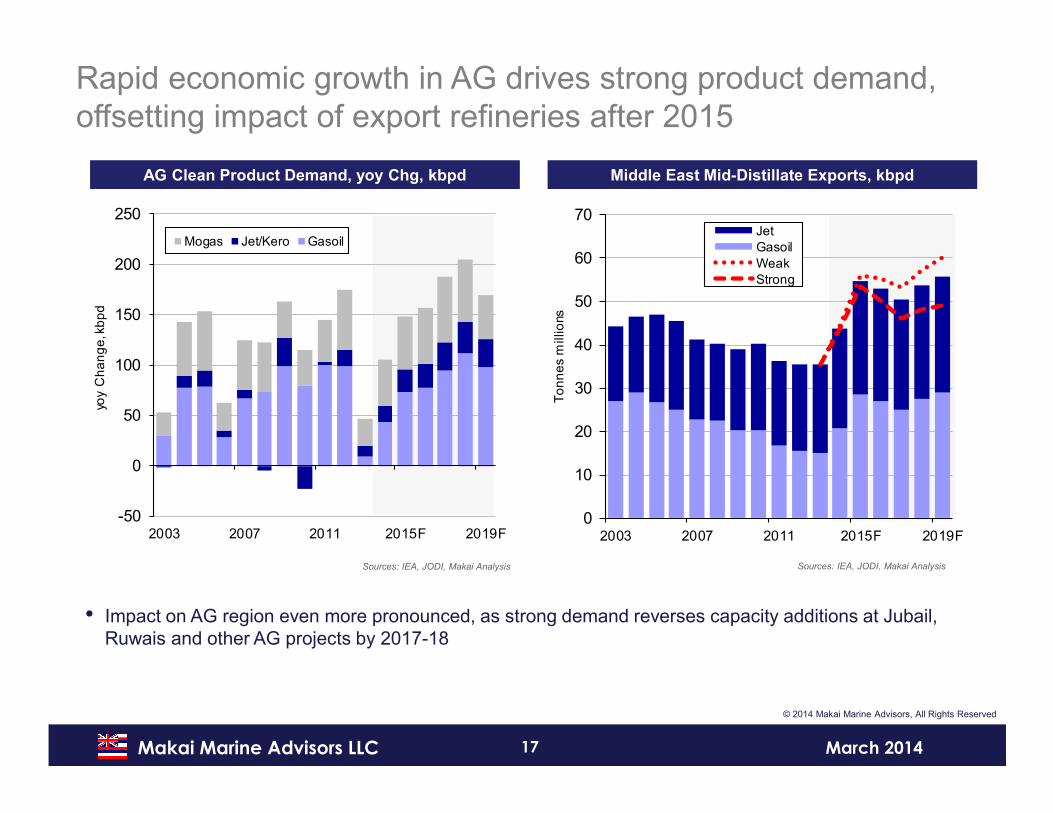
Rapid economic growth in AG drives strong product demand, offsetting impact of export refineries after 2015
AG Clean Product Demand, yoy Chg, kbpd Middle East Mid-Distillate Exports, kbpd
Sources: IEA, JODI, Makai Analysis Sources: IEA, JODI, Makai Analysis
• Impact on AG region even more pronounced, as strong demand reverses capacity additions at Jubail, Ruwais and other AG projects by 2017-18
18Makai Marine Advisors LLC March 2014
© 2014 Makai Marine Advisors, All Rights Reserved
-30
-20
-10
0
10
20
30
40
50
60
70
2003 2006 2009 2012 2015F 2018F
To
nn
es
millio
ns
N Amer FSU
Mideast India
-100
-80
-60
-40
-20
0
20
2003 2006 2009 2012 2015F 2018F
To
nn
es
millio
ns
Europe
Africa
Lat Amer
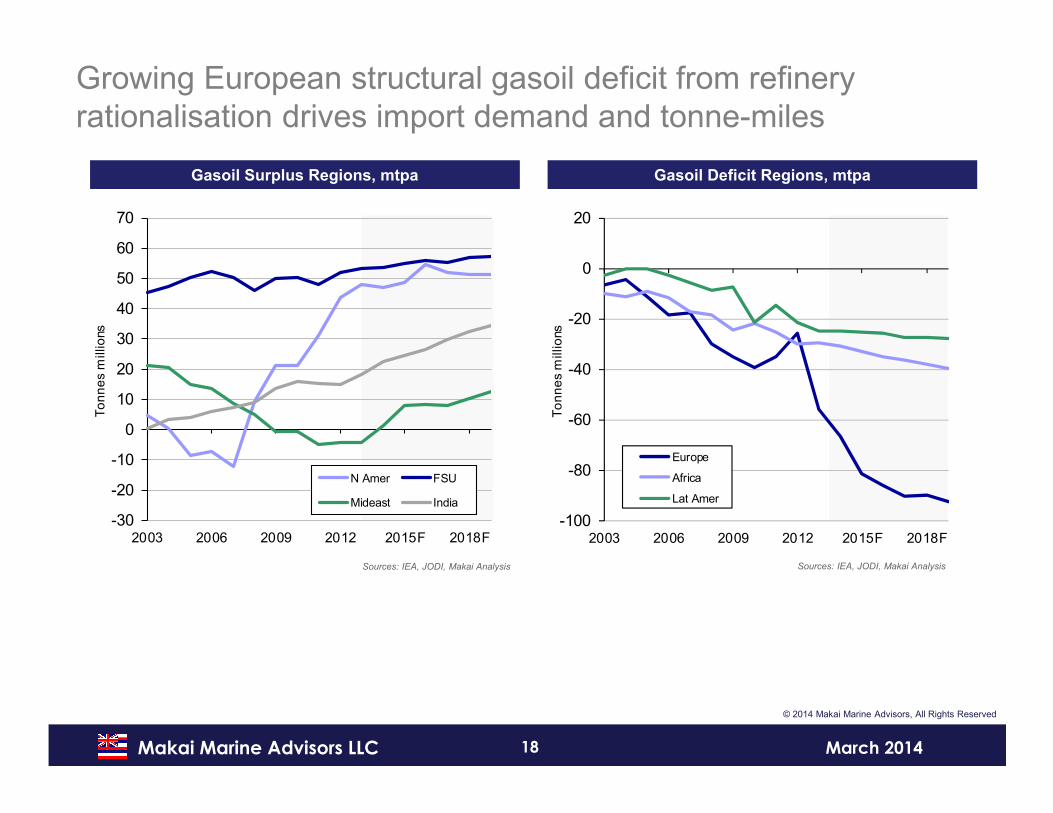
Growing European structural gasoil deficit from refinery rationalisation drives import demand and tonne-miles
Gasoil Surplus Regions, mtpa Gasoil Deficit Regions, mtpa
Sources: IEA, JODI, Makai Analysis Sources: IEA, JODI, Makai Analysis
19Makai Marine Advisors LLC March 2014
© 2014 Makai Marine Advisors, All Rights Reserved
-1.5
-1.0
-0.5
0.0
0.5
1.0
1.5
2.0
1999 2003 2007 2011 2015F 2019F
mb
pd
-10%
-5%
0%
5%
10%
15%
20%
1999 2003 2007 2011 2015F 2019F
yoy
Pe
rce
nt C
ha
ng
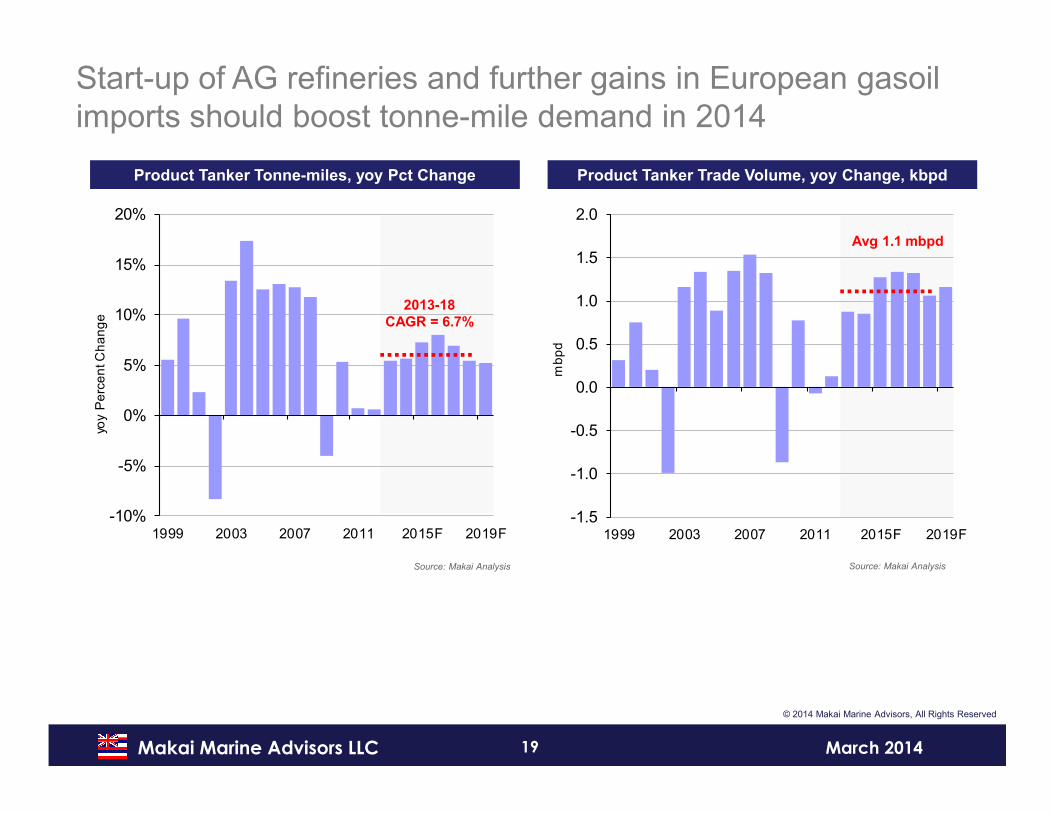
eStart-up of AG refineries and further gains in European gasoil imports should boost tonne-mile demand in 2014
Product Tanker Tonne-miles, yoy Pct Change Product Tanker Trade Volume, yoy Change, kbpd
Source: Makai Analysis Source: Makai Analysis
2013-18
CAGR = 6.7%
Avg 1.1 mbpd
20Makai Marine Advisors LLC March 2014
Product Tanker Supply
21Makai Marine Advisors LLC March 2014
© 2014 Makai Marine Advisors, All Rights Reserved
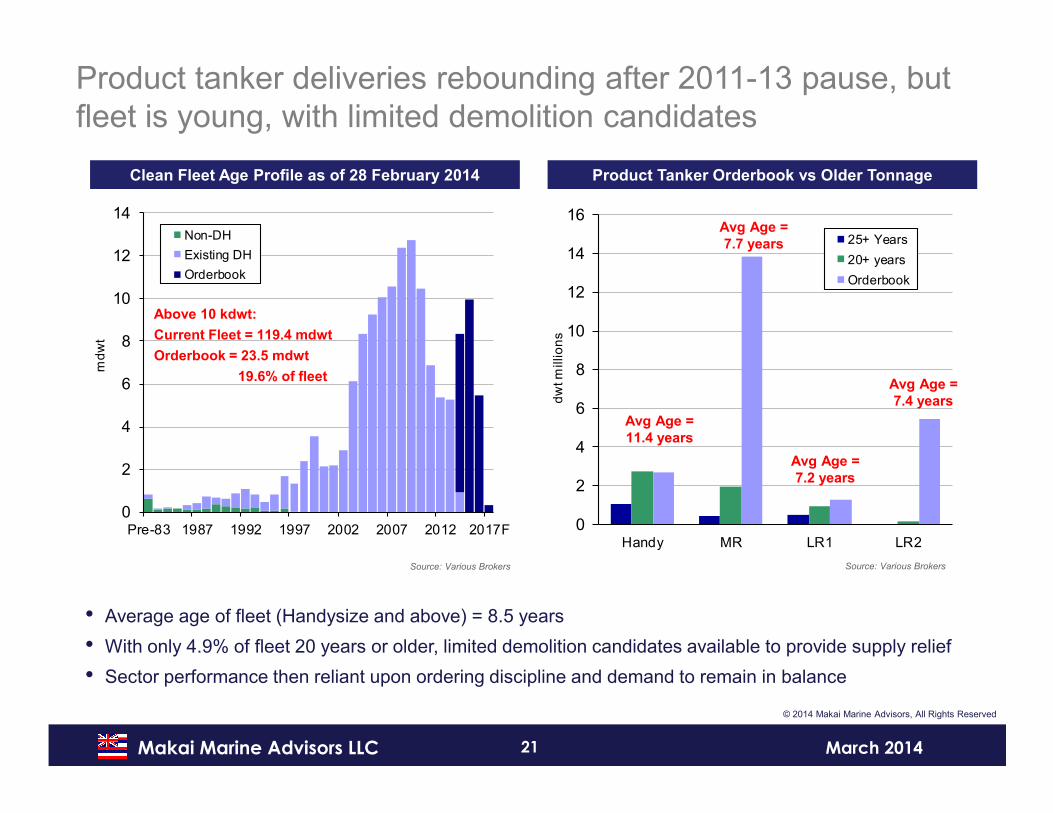
Product tanker deliveries rebounding after 2011-13 pause, but fleet is young, with limited demolition candidates
Clean Fleet Age Profile as of 28 February 2014 Product Tanker Orderbook vs Older Tonnage
Source: Various Brokers Source: Various Brokers
• Average age of fleet (Handysize and above) = 8.5 years
• With only 4.9% of fleet 20 years or older, limited demolition candidates available to provide supply relief
• Sector performance then reliant upon ordering discipline and demand to remain in balance
0
2
4
6
8
10
12
14
16
Handy MR LR1 LR2d
wt m
illio
ns
25+ Years
20+ years
Orderbook
0
2
4
6
8
10
12
14
Pre-83 1987 1992 1997 2002 2007 2012 2017F
md
wt
Non-DH
Existing DH
Orderbook
Above 10 kdwt:
Current Fleet = 119.4 mdwt
Orderbook = 23.5 mdwt
19.6% of fleet
Avg Age =
11.4 years
Avg Age =
7.7 years
Avg Age =
7.2 years
Avg Age =
7.4 years
22Makai Marine Advisors LLC March 2014
© 2014 Makai Marine Advisors, All Rights Reserved
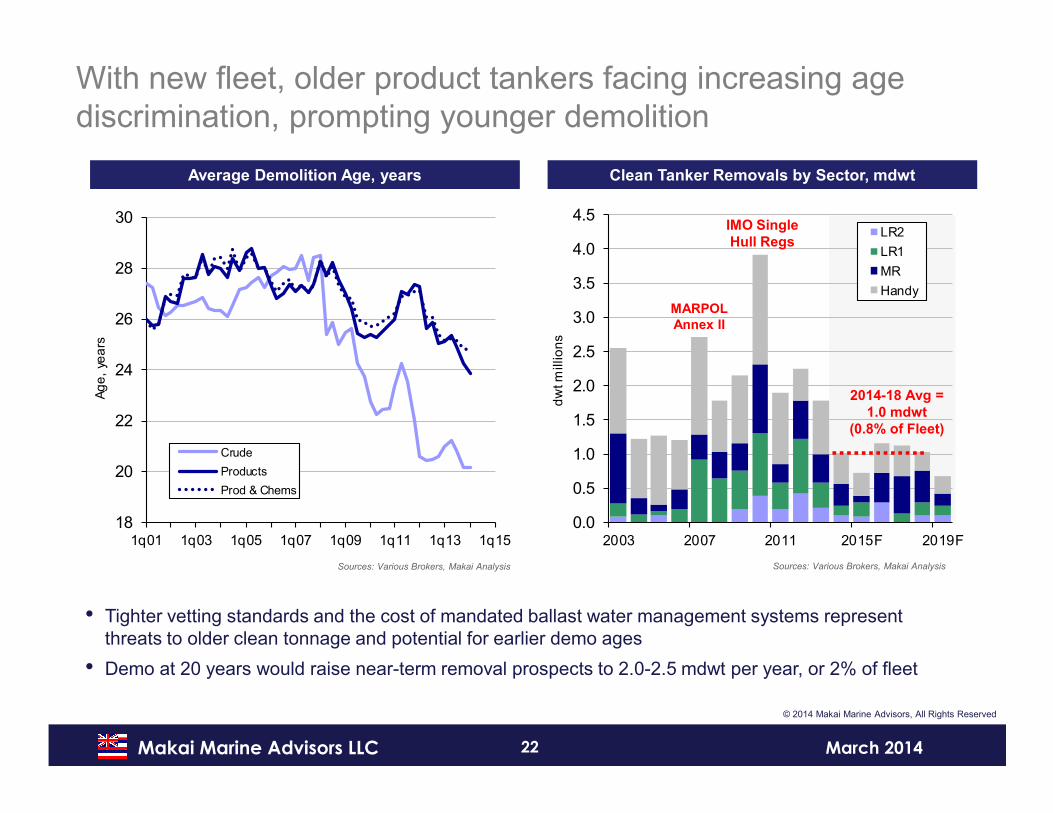
With new fleet, older product tankers facing increasing age discrimination, prompting younger demolition
Average Demolition Age, years Clean Tanker Removals by Sector, mdwt
Sources: Various Brokers, Makai Analysis Sources: Various Brokers, Makai Analysis
• Tighter vetting standards and the cost of mandated ballast water management systems represent threats to older clean tonnage and potential for earlier demo ages
• Demo at 20 years would raise near-term removal prospects to 2.0-2.5 mdwt per year, or 2% of fleet
0.0
0.5
1.0
1.5
2.0
2.5
3.0
3.5
4.0
4.5
2003 2007 2011 2015F 2019Fd
wt m
illio
ns
LR2
LR1
MR
Handy
18
20
22
24
26
28
30
1q01 1q03 1q05 1q07 1q09 1q11 1q13 1q15
Ag
e,
yea
rs
Crude
Products
Prod & Chems
2014-18 Avg =
1.0 mdwt
(0.8% of Fleet)
MARPOL
Annex II
IMO Single
Hull Regs
23Makai Marine Advisors LLC March 2014
© 2014 Makai Marine Advisors, All Rights Reserved
0
5
10
15
20
25
30
35
40
0%
1%
2%
3%
4%
5%
6%
7%
8%
1q08 1q10 1q12 1q14F 1q16F
Re
al W
td S
po
t E
arn
ing
s, U
S$
00
0s/d
ay
Ord
eri
ng
, Pe
rce
nt o
f F
lee
t
Ordering (lhs)
Avg Earnings (rhs)
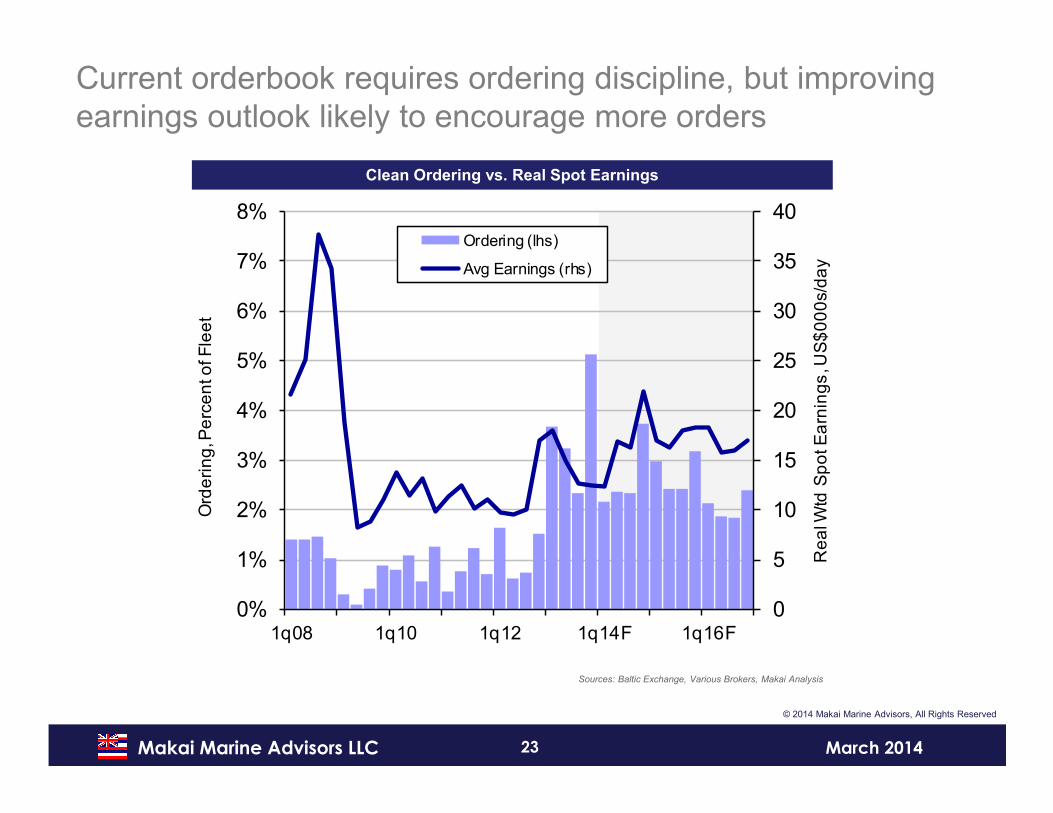
Current orderbook requires ordering discipline, but improving earnings outlook likely to encourage more orders
Clean Ordering vs. Real Spot Earnings
Sources: Baltic Exchange, Various Brokers, Makai Analysis
24Makai Marine Advisors LLC March 2014
© 2014 Makai Marine Advisors, All Rights Reserved
0%
2%
4%
6%
8%
10%
12%
14%
16%
1998 2003 2008 2013F 2018Fyo
y P
erc
en
t Ch
an
ge
0%
5%
10%
15%
20%
25%
30%
35%
0
5
10
15
20
25
30
35
2005 2008 2011 2014F 2017F 2020F
Pe
rce
nt o
f F
lee
t
dw
t m
illio
ns
LR2 LR1MR HandyPct of Fleet (rhs)
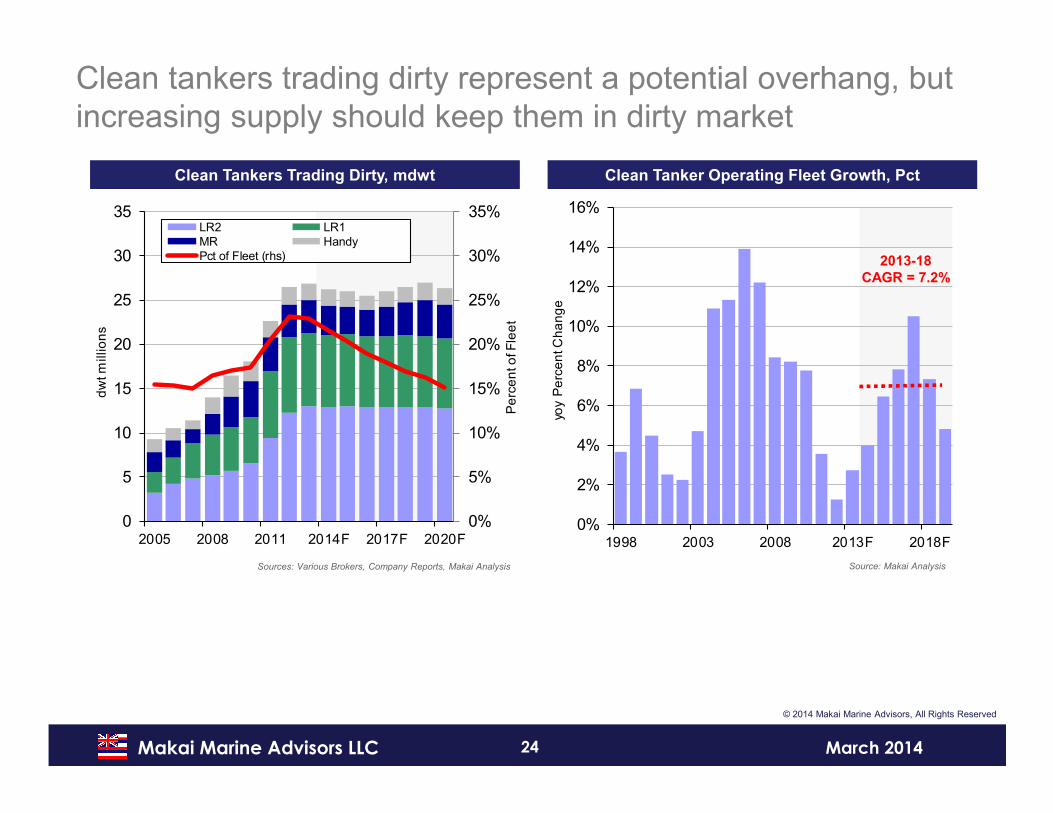
Clean tankers trading dirty represent a potential overhang, but increasing supply should keep them in dirty market
Clean Tankers Trading Dirty, mdwt Clean Tanker Operating Fleet Growth, Pct
Sources: Various Brokers, Company Reports, Makai Analysis Source: Makai Analysis
2013-18
CAGR = 7.2%
25Makai Marine Advisors LLC March 2014
Freight & Asset Price Outlook
26Makai Marine Advisors LLC March 2014
© 2014 Makai Marine Advisors, All Rights Reserved
0
5
10
15
20
25
30
1999 2004 2009 2014F 2019F
Ind
exe
d N
om
ina
l US
$0
00
s/d
ay
78%
80%
82%
84%
86%
88%
90%
92%
94%
1999 2004 2009 2014F 2019F
Utilis
atio
n R
ate
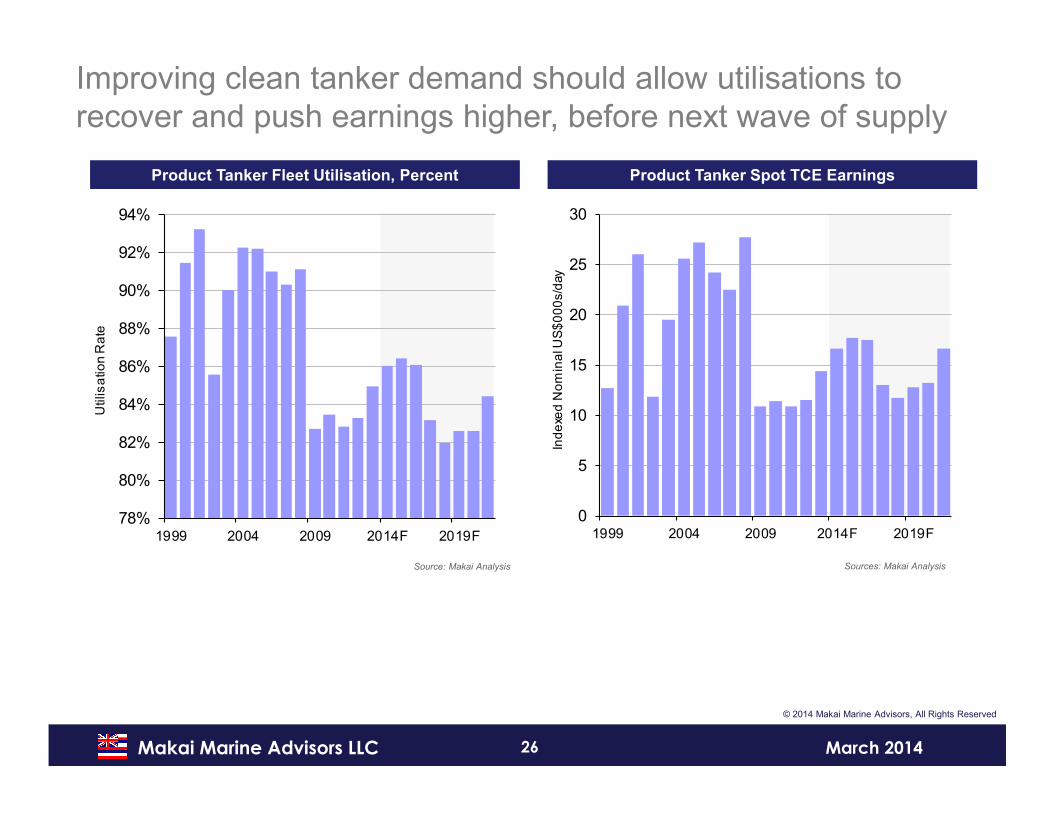
Improving clean tanker demand should allow utilisations to recover and push earnings higher, before next wave of supply
Product Tanker Fleet Utilisation, Percent Product Tanker Spot TCE Earnings
Source: Makai Analysis Sources: Makai Analysis
27Makai Marine Advisors LLC March 2014
© 2014 Makai Marine Advisors, All Rights Reserved
0
2
4
6
8
10
12
14
16
18
20
22
24
26
28
1q09 1q11 1q13 1q15F 1q17F 1q19F
No
min
al 1
2-m
o T
C R
ate
s, U
S$
00
s/d
ay
LR2
LR1
MR
Handy
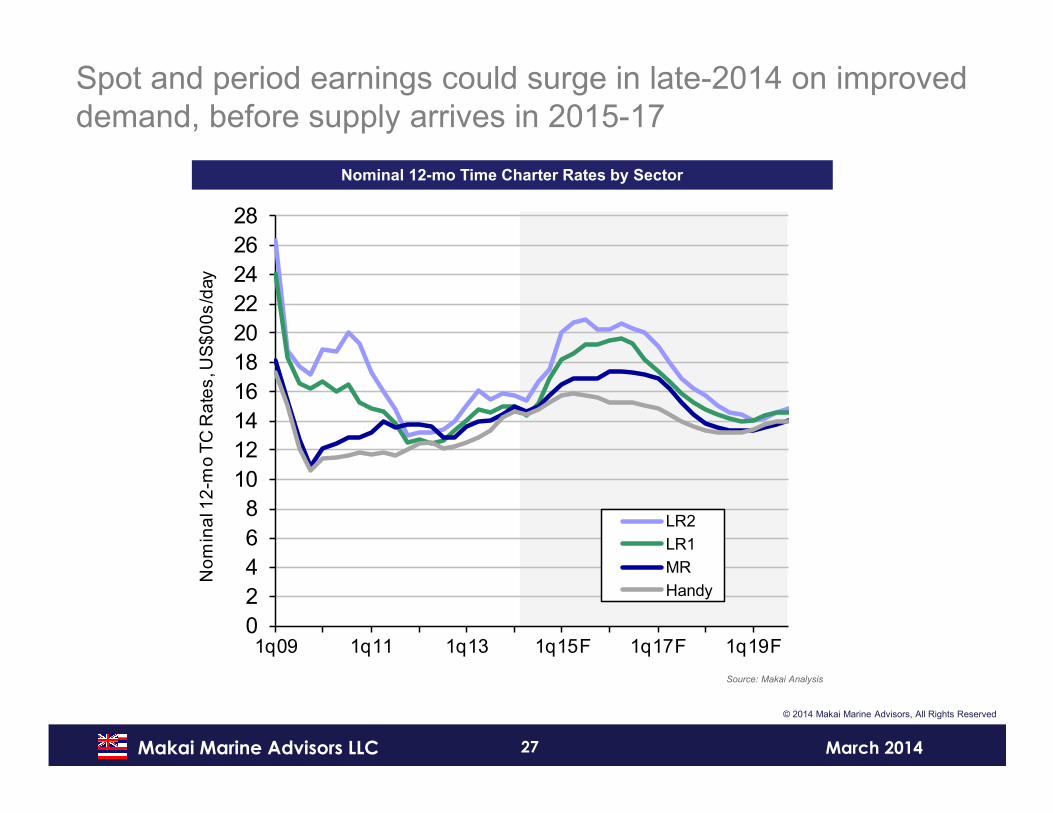
Spot and period earnings could surge in late-2014 on improved demand, before supply arrives in 2015-17
Nominal 12-mo Time Charter Rates by Sector
Source: Makai Analysis
28Makai Marine Advisors LLC March 2014
© 2014 Makai Marine Advisors, All Rights Reserved
0
10
20
30
40
50
60
1q09 1q11 1q13 1q15F 1q17F 1q19F
No
min
al 5
-yr V
es
se
l Pri
ce
s, U
S$
million
s
LR2
LR1
MR
Handy
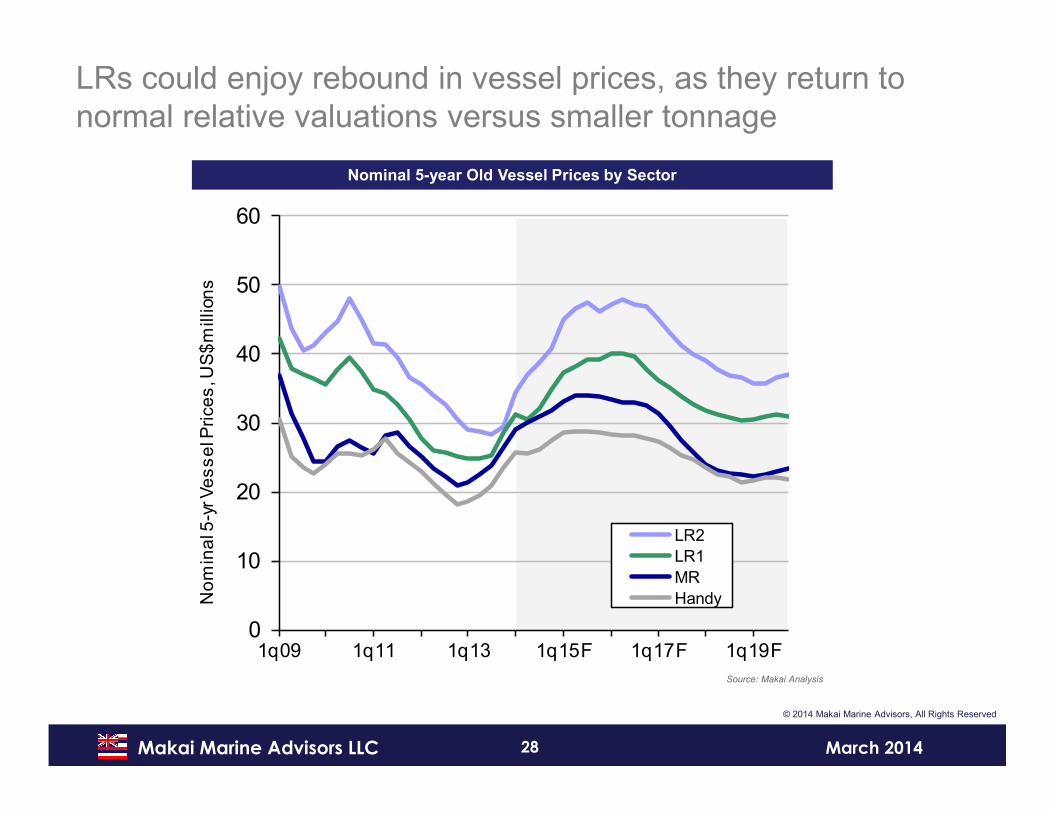
LRs could enjoy rebound in vessel prices, as they return to normal relative valuations versus smaller tonnage
Nominal 5-year Old Vessel Prices by Sector
Source: Makai Analysis
29Makai Marine Advisors LLC March 2014
© 2014 Makai Marine Advisors, All Rights Reserved
Key Observations
• Gasoil remains a key driver for product tanker demand
• Refinery geographic displacement hypothesis still intact, with new Pacific Basin capacity likely to prompt Atlantic Basin refinery rationalisation
- Growing structural mid-distillate deficit in Europe, from rationalisation, is critical element to demand growth
• Strong enthusiasm for product tanker sector in capital markets and private equity sector, based upon this investment hypothesisM
• Mbut ardour may be cooling
• Recognition that upcoming supply growth from over-ordering may outpace these positive demand fundamentals
• Ordering discipline could still protect markets from 2018-19 downturn
30Makai Marine Advisors LLC March 2014
Thank you!
(Mahalo Nui!)
Contact Details:
Makai Marine Advisors LLC5200 Martel AvenueDallas, Texas 75206
US Mobile +1 914 218 7579UK Mobile +44 7976 738 [email protected]
www.makaimarine.com
Twitter: @MakaiMarine