Embed Size (px)
Citation preview

APPROVED:
Thomas R. Cundari, Major Professor Mohammad A. Omary, Committee Member Robby A. Petros, Committee Member Michael G. Richmond, Committee Member Mary E. Anderson, Committee Member William E. Acree, Chair of the Department
of Chemistry Costas Tsatsoulis, Interim Dean of the
Toulouse Graduate School
THE MECHANISMS OF HUMAN GLUTATHIONE SYNTHETASE AND
RELATED NON-ENZYMATIC CATALYSIS
Brandall L. Ingle, B.S.
Dissertation Prepared for the Degree of
DOCTOR OF PHILOSOPHY
UNIVERSITY OF NORTH TEXAS
May 2015
Ingle, Brandall L. The Mechanisms of Human Glutathione Synthetase and Related Non-
Enyzmatic Catalysis. Doctor of Philosophy (Chemistry-Inorganic Chemistry), May 2015, 82 pp.,
12 tables, 22 figures, 2 schemes, chapter references.
Human glutathione synthetase (hGS) is a homodimeric enzymes that catalyzes the second
step in the biological synthesis of glutathione, a critical cellular antioxidant. The enzyme exhibits
negative cooperativity towards the γ-glutamylcysteine (γ-GC) substrate. In this type of allosteric
regulation, the binding of γ-GC at one active site significantly reduces substrate affinity at a second
active site over 40 Å away. The presented work explores protein-protein interactions, substrate
binding, and allosteric communication through investigation of three regions of hGS: the dimer
interface, the S-loop, and the E-loop. Strong electrostatic interactions across the dimer interface of
hGS maintain the appropriate tertiary and quaternary enzymatic structure needed for activity. The
S-loop and E-loop of hGS form walls of the active site near γ-GC, with some residues serving to
bind and position the negatively cooperative substrate. These strong interactions in the active site
serve as a trigger for allosteric communication, which then passes through hydrophobic
interactions at the interface. A comprehensive computational and experimental approach relates
hGS structure with activity and regulation.
ATP-grasp enzymes, including hGS, utilize ATP in the nucleophilic attack of a carboxylic
acid in a reaction thought to proceed through the formation of an acylphosphate intermediate.
Small metal cations are known to chelate the terminal phosphates of actives site ATP, yet the role
of these atoms remains unclear. In the presented work, a computational metal substitution study
establishes the role these divalent cations in the catalysis of peptide bonds. The simple model is
used to determine the impact of metal cations on the thermodynamics and kinetics, an important
stepping stone in understanding the importance of metal cations in larger biological systems.

Copyright 2015
by
Brandall L. Ingle
ii

ACKNOWLEDGEMENTS
A very wise band of Wizard Wrockers once said, “Trees are not books yet, just friends who
give shade, but they’re just as important to know.” That sentiment rings especially true for
scientists, as it is our duty to look at beautiful world that surrounds us and seek out the truths
behind it. I would like to thank my advisor, Dr. Tom Cundari, for the opportunity to stretch my
knowledge far beyond books and push the frontiers of chemistry. With his guidance and support,
I have learned how to think on my feet and speak confidently. It has been an honor to be a part of
Team Cundari. Thanks are also due to Dr. Mary Anderson taught me much more than biochemistry
in her lab by offering insight into the nuts and bolts of academic leadership.
Without the support of all the graduate students in my lab, past and present, I could never
have made it to this point. My deepest thanks also go out to Mannie Gonzalez, Yinka Ojo, Cong
Lui, Bruce Prince, and Bisesh Shrestha. Margie De Jesus started as a mentor and has become a
dear friend. My scientific brothers, Daniel Pardue and Dale Pahls, made every day an adventure.
Thanks also go out to my family and friends, whose positive influence has extended far
beyond my academic career. Matt Carlson, thank you for embracing my crazy and bringing me
such joy. My dear friend Laura Maroun continually inspires me. So many thanks go out to my
baking buddy, singing partner, secret-keeper, sister, and best friend, Megan Ingle; her support kept
me going. I am grateful to my mother, Tiffany Ingle, who led by example and instilled in me the
belief that I could be whatever I wanted to be. Many thanks also go to my grandparents, Sharon
and Larry Nolan, who are always there for me with unconditional love, support, and care packages.
Finally, I would like to thank the National Science Foundation as well as the National
Institutes for Health for funding. Thanks also go out to Springer Science and Business Media and
Taylor and Francis for allowing me to include work published within these journals.
iii

TABLE OF CONTENTS
Page
ACKNOWLEDGEMENTS ........................................................................................................... iii
LIST OF TABLES .......................................................................................................................... v
LIST OF FIGURES AND SCHEMES .......................................................................................... vi
LIST OF ABBREVIATIONS ...................................................................................................... viii
CHAPTER 1 INTRODUCTION TO HUMAN GLUTATHIONE SYNTHETASE ..................... 1
CHAPTER 2 METHODS ............................................................................................................... 7
CHAPTER 3 ELECTROSTATIC INTERACTIONS AT PROTEIN INTERFACES ................. 15
CHAPTER 4 LINKS BETWEEN ALLOSTERY AND SUBSTRATE BINDING ..................... 26
CHAPTER 5 ALLOSTERIC COMMUNICATION ACROSS REGIONS ................................. 45
CHAPTER 6 ROLE OF METAL CATIONS IN PEPTIDE BOND FORMATION ................... 56
CHAPTER 7 CONCLUSIONS AND FUTURE DIRECTIONS ................................................. 73
APPENDIX ADDITIONAL INFORMATION ............................................................................ 76
iv

LIST OF TABLES
Page
Table 2.1 Primers for site directed mutagenesis of hGS residues. Mutations underlined .....10
Table 3.1 Activity, kinetic properties and thermal stability of hGS ......................................17
Table 3.2 Comparison of the conservation of hGS residues near the dimer interface between higher eukaryotes and mammals .............................................................20
Table 3.3 RMSD of hGS mutants relative to wild-type hGS in Å.........................................21
Table 4.1 Percent conservation of hGS S-loop residues in higher eukaryotes and mammals ................................................................................................................29
Table 4.2 Impact of S-loop mutations on experimental activity, kinetic parameters and thermal stabilities of hGS.......................................................................................34
Table 5.1 Sequence conservation of E-loop residues in hGS ................................................47
Table 5.2 Experimental activity and kinetic parameters of E-loop mutants ..........................53
Table 6.1 Energetics of peptide bond formation in the presence of metal cations. All values are free energies in kcal mol-1. Calculations with B3LPY//6-311+G(d) ....65
Table A.1 Hydrogen bond analysis of wild-type and mutants hGS; bond lengths in Å; bond angles in degrees ...........................................................................................79
Table A.2 Interaction energy between γ-GC and hGS residues over course of 5-10 ns MD run in WT and S-loop mutants .......................................................................80
Table A.3 Interaction energy between γ-GC and hGS residues over course of 5-10 ns MD run in WT and E-loop mutants...............................................................................81
v

LIST OF FIGURES AND SCHEMES
Page
Figures
Figure 1.1 Crystal structure of dimeric hGS with active sites shown as blue-red-grey surface ......................................................................................................................2
Figure 3.1 Dimer interface of hGS from crystal structure (2HGS) with D24, S42, and R211 in yellow space filling models and active site shown as grey-blue-red surface ....16
Figure 3.2 Activity of wild-type and hGS mutant enzymes R221A and D24A over time .....19
Figure 3.3 Hydrogen bonding in (a) wild-type hGS and (b) D24A hGS ................................22
Figure 3.4 Hydrogen bonding in (a) S42A and (b) R221A hGS .............................................22
Figure 4.1 S-loop of hGS in dimeric hGS from crystal structure (2HGS) ..............................27
Figure 4.2 Average interaction energy (kJ/mol) between γ-GC and important residues over the course of 5 - 10 ns MD runs for WT and S-loop mutant hGS .................30
Figure 4.3 Important residues in binding γ-GC near the S-loop of hGS in the lowest energy structure in the last ns of MD simulations .................................................31
Figure 4.4 Structure of the S-loop of hGS in the lowest energy structure in the last ns of MD simulations ......................................................................................................32
Figure 5.1 Dimeric hGS with the E-loop shown as a yellow ribbon.......................................46
Figure 5.2 Important bonding within and near the E-loop of WT hGS ..................................47
Figure 5.3 Important bonding within and near the E-loop of hGS in (a) E214A, (b) E214S, (c) N216A, and (d) N216V ....................................................................................49
Figure 5.4 Average interaction energies with γ-GC in WT hGS and various E-loop mutants over the MD run in kJ/mol .....................................................................................50
Figure 5.5 Important bonding within and near the E-loop of hGS (a) Q211A, and (b) R215A ...............................................................................................................52
Figure 6.1 Modeled peptide bond formation ...........................................................................59
Figure 6.2 Reactant acylphosphate complexes ......................................................................................................... 61
Figure 6.3 Product metal phosphates complexes .................................................................................................... 62
vi

Figure 6.4 Transition states for Mg2+ catalyzed synthesis of a peptide bond .........................63
Figure 6.5 Reactant acylphosphate Mg2+ complexes studied ..................................................67
Figure A.1 Sample of GAB kinetics plot used to determine the Vmax and Km in N216A hGS ..... 77
Figure A.2 Sample Hill plot used to determine the Hill coefficient of N216A hGS .................... 78
Figure A.3 Sample DSC scan of D268A ....................................................................................... 78
Schemes
Scheme 1.1 Biosynthesis of GSH ................................................................................................1
Scheme 6.1 Peptide bond formation through acylphosphate intermediate ...............................56
vii

LIST OF ABBREVIATIONS
GSH glutathione
hGS human glutathione synthetase
γ-GC γ-glutamylcysteine
WT wild-type
IPTG isopropyl-1-thio-β-galactopyranoside
γ-GluABA L-γ-glutamyl-L-α-aminobutyrate
PK pyruvate kinase
LDH lactate dehydrogenase
PEP phosphoenolpyruvic acid
DSC differential scanning calorimetry
Tm transition midpoint
MD molecular dynamics
RMSD root mean square deviation
Eint average energy of interaction.
viii

CHAPTER 1
INTRODUCTION TO HUMAN GLUTATHIONE SYNTHETASE1
1.1 Glutathione Biosynthesis by Human Glutathione Synthetase
The intracellular tripeptide glutathione (L-γ-glutamyl-L-cysteinylglycine, GSH) relieves
oxidative stress, aids in the excretion of toxins, and serves as a coenzyme for several cellular
processes.1 Deficiencies in GSH are associated with a variety of disease states, including
Parkinson’s disease, Alzheimer’s disease, cystic fibrosis, and HIV.2-4 In the first step of the
glutathione biosynthetic pathway in eukaryotes, γ-glutamylcysteine synthetase ligates glutamate
and cysteine to form the dipeptide γ-glutamylcysteine (γ-GC) with a unique γ-linkage.1 Glutathione
synthetase then catalyzes the synthesis of a peptide bond between γ-glutamylcysteine and glycine
to form glutathione in an ATP-dependent reaction, as shown in Scheme 1.1.1
Glutamine + Cysteine + ATP GCS γ-Glutamylcysteine + ADP + Pi + H2O
γ-Glutamylcysteine + Glycine + ATP hGS Glutathione + ADP + Pi + H2O
Scheme 1.1 Biosynthesis of GSH.
An obligate homodimer with C2 symmetry, hGS has distant active sites (40 Å apart)
separated by a relatively small dimer interface.5 The two subunits of hGS are negatively
cooperative with respect to the γ-GC substrate (Hill coefficient of 0.69); 6,7 therefore, when γ-GC
binds at one active site, the second subunit is less likely to catalyze the reaction. Such allosteric
regulation of hGS likely mediates the flux of γ-GC, while maintaining the cellular levels of GSH
1 Sections of this chapter are reproduced from De Jesus, M.C.; Ingle, B.L.; Barakat, K.A.; Shrestha, B., Slavens, K.D.; Cundari, T.R.; Anderson, M.E. Protein J., 2014, 33, 403-409 with kind permission from Springer Science and Business Media, Copyright 2014.
1

required to relieve oxidative stress.8,9 Patients with genetic mutations in hGS can have significant
deficiencies in GSH and suffer from a variety of symptoms, most notably hemolytic anemia and
neurological disorders.10,11
Structurally, hGS is similar to other members of the ATP-grasp superfamily of enzymes
with a characteristic ATP-grasp fold, which aids in the ATP driven formation of a carbon-nitrogen
bond.12 Like all members of the ATP-grasp family of enzymes, hGS has divalent cations (Mg2+)
within the active sites, which chelate the terminal phosphates of ATP.13 The terminal phosphate is
then thought to form an acylphosphate intermediate, which undergoes nucleophilic attack to yield
the new carbon-nitrogen bond.14,15 As one of the few mammalian ATP-grasp enzymes whose
crystal structure is known, hGS provides insight into the structural and functional similarities, as
well as differences, between mammalian and prokaryotic ATP-grasp enzymes, which are often
targeted by antibiotics.16
Figure 1.1 Crystal structure of dimeric hGS with active sites shown as blue-red-grey surface, products (GSH, ADP, Pi, Mg2+) shown with ball and stick models.
2
Four highly conserved active site residues (E144, N146, K305, and K364) bind the ATP
needed to fuel peptide bond formation.17 Two catalytic loops (A-loop and G-loop) near the ATP
and glycine binding sites exhibit large shifts in structure during the catalytic cycle of hGS, which
regulates access to the active sites.18 Residues of the A-loop and G-loop have large impacts on the
substrate binding and subsequent activity of hGS.19,20 A third loop near the γ-GC binding site (S-
loop) was shown in computational models to not exhibit large catalytic loop motion.18
As a symmetrical, relatively small enzyme (52 kDa per subunit) hGS serves as an ideal
model for studying negative cooperativity. Previous work from our groups has identified two
dimer interface residues, V44 and V45, which modulate the allosteric communication necessary
for negative cooperativity in hGS.21 Disruption of the weak, hydrophobic interactions at V44 and
V45 through point mutations at these sites leads to a decrease in negative cooperativity. 21 Of the
474 amino acid in each subunit of hGS, only V44 and V45 have thus far been identified to
modulate allostery. The identification of additional residues needed for allosteric communication,
as well as an understanding of the types of interactions that modulate negative cooperativity, would
shed light on the wider field of allosteric inhibition.
Although allosteric regulation in proteins was discovered over a century ago, the precise
mechanism of allosteric regulation remains a mystery.22,23 Allosteric modulation plays a large role
in many biological systems, including the O2 binding by hemoglobin and cell signaling with G-
protein coupled receptors.24,25 While rare, negatively cooperative systems include insulin binding
proteins and β-adrenergic receptors.26,27 Allosteric binding sites are increasingly pursued as drug
targets as the pharmaceutical industry branches away from simple biomimetic drugs.28,29 A deeper
understanding of allosteric communication at binding sites and protein interfaces would thus have
broad implications for medicinal chemistry.
3
The present research utilizes hGS as a model enzyme to investigate links between allosteric
communication, substrate binding and protein structure through the exploration of three regions:
the dimer interface, the substrate binding S-loop, and the intermediate E-loop. Within the dimer
interface, three residues have strong electrostatic interaction across the subunits. These strong
electrostatic interactions are theorized to have a significant role in the structural stability of hGS.
Residues of the S-loop form a wall of the active site and are thought to bind the negatively
cooperative substrate (γ-GC). The E-loop stretches between these two regions and is an ideal
candidate for modulating allosteric communication in hGS. Comprehensive computational and
experimental analysis of these regions of hGS may shed light on important components of
substrate binding, structural stability and allosteric communication, insights that can be applied to
a wide range of proteins.
1.2 References
1. Meister, A.; Anderson, M.E. Ann. Rev. Biochem., 1983, 52, 711-760.
2. Ansari, M.A.; Scheff, S.W. J. Neuropathol. Exp. Neurol., 2010, 69, 155-167.
3. Schulz, J.B.; Lindenau, J.; Seyfried, J.; Dichgans, J. Eur. J. Biochem., 2000, 267, 4904-4911.
4. Townsend, D.M.; Tew, K.D.; Tapiero, H. Biomed. Pharmacother., 2003, 57, 145-155.
5. Polekhina, G.; Board, P.G.; Gali, R.R.; Rossjohn, J.; Parker, M.W. EMBO J., 1999, 18, 3204-3213.
6. Oppenhiemer, L.; Wellnew, V.P.; Griffith, O.W.; Alton, M. J. Biol. Chem., 1979, 254, 5184-5190.
7. Luo, J.L.; Huang, C.S.; Babauglu, K.; Anderson, M.E. Biochem. Biophys. Res. Comm., 2000,
275, 577-581.
8. Bush, E.C.; Clark, A.E.; DeBoever, C.M.; Haynes, L.E.; Hussain, S.; Ma, S.; McDermott, M.M.; Novak, A.M.; Wentworth, J.S. PLoS One, 2012, 7, e48920
4

9. Cornish-Bowden, A. J. Theor. Biol., 2013, 319, 144-147.
10. Ristoff, E.; Mayatepek, E.; Larsson, A. J. Pediatr., 2001, 139, 79-84.
11. Dahl, N.; Pigg, M.; Ristoff, E.; Gali, R.; Carlsson, B.; Mannervik, B.; Larsson, A.; Board, P. Hum. Mol. Gen., 1997, 6, 1147-1152.
12. Galperin, M.Y.; Koonin, E.V. Protein Sci., 1997, 6, 2639-2643.
13. Esser, L.; Wang, C.R.; Hosaka, M.; Smagula, C.S.; Sudhof, T.C.; Deisenhofer, J. EMBO J., 1998, 17, 977-984.
14. Chakravarty, P.K.; Greenlee, W.J.; Parsons, W.H.; Patchett, A.A.; Combs, P.; Roth, A.; Busch, R.D.; Mellin, T.N. J. Med. Chem., 1989, 32, 1886-1890.
15. Eroglu, B.; Powers-Lee, S.G. Arch. Biochem. Biophys., 2002, 407, 1-9.
16. Halouska, S.; Fenton, R.J.; Zinniel, D.K.; Marshall, D.D.; Barletta, R.G.; Powers, R. J.
Proteome Res., 2014, 13, 1065-1076.
17. Dinescu, A.; Cundari, T.R.; Bhansali, V.S.; Luo, J.; Anderson, M.E. J. Biol. Chem., 2004, 279, 22412-22421.
18. Dinescu, A.; Anderson, M.E.; Cundari, T.R. Biochem. Biophys. Res. Comm., 2007, 353, 450-456.
19. Dinescu, A.; Brown, T.R.; Barelier, S.; Cundari, T.R.; Anderson, M.E. Biochem. Biophys. Res. Comm., 2010, 400, 511-516.
20. Brown, T.R.; Drummond, M.L.; Barelier, S.; Crutchfield, A.S.; Dinescu, A.; Slavens, K.D.; Cundari, T.R.; Anderson, M.E. Biochem. Biophys. Res. Comm., 2011, 411, 536-542.
21. Slavens, K.D.; Brown, T.R.; Barakat, K.A.; Cundari, T.R.; Anderson, M.E. Biochem. Biophys. Res. Comm., 2011, 410, 597-601.
22. Bohr, C.; Hasselbach, K.A.; Krogh, A. Skand Arch Physiol., 1904, 16, 401-412.
23. Cornish-Bowden, A. FEBS J., 2014, 281, 621-632.
24. Perutz, M.F. Nature, 1970, 228, 726-734.
25. Keov, P.; Sexton, P.M.; Christopoulos, A. Neuropharmacol., 2011, 60, 24-35.
26. De Meyts, P. Trends Biochem. Sci., 2008, 33, 376-385.
27. Limbird, L.E.; De Meyts, P.; Lefkowitz, R.J. Biochem. Biophys. Res. Comm., 1975, 64, 1160-1168.
5

28. Wells, J.A.; McClendon, C.L. Nature, 2007, 450, 1001-1009.
29. Keov, P.; Sexton, P.M.; Christopoulos, A. Neuropharmacol., 2011, 60, 24-35.
6

CHAPTER 2
METHODS2
2.1 Introduction to Methods
Similar methods were used throughout for the study of human glutathione synthetase
(hGS). The following chapter outlines the computational methods used for each project. The force
fields and simulation lengths used varied between projects in order to utilize the best method for
each system. The computational methods utilized for each project are noted in the headings.
Experimental work was conducted by the candidate in Dr. Mary E. Anderson’s laboratory
at Texas Woman’s University. The experimental work presented herein spans several years and
the work of several students. Experimental work described in Chapter 3 was completed by
Margerita De Jesus, Bisesh Shrestha and Kerri Slavens, but was included in order to provide
context for the associated computational work. I have performed each of the experimental
procedures outlined below multiple times and contributed a large portion of the experimental work
in Chapters 4 and 5. In each case, those mutants not purified by me are noted with an asterisk, and
the responsible collaborator recognized.
2.2 Computational Methods
2.2.1 Sequence Analysis
Using the NCBI database, the sequence of hGS (2HGS) was matched to known protein
sequences using BLAST and a non-redundant database and aligned using the BLOSUM62
matrix.1-4 Hypothetical and theoretical sequences were eliminated from the alignment.
2 Sections of this chapter are reproduced from De Jesus, M.C.; Ingle, B.L.; Barakat, K.A.; Shrestha, B., Slavens, K.D.; Cundari, T.R.; Anderson, M.E. Protein J., 2014, 33, 403-409 with kind permission from Springer Science and Business Media, Copyright 2014.
7

Conservation was determined for all higher eukaryote and all mammalian sequences. Percent
conservation of each residue was calculated relative to wild-type hGS. Percent charge conservation
at each site was also calculated assuming biological a pH of 7.6. Aspartic and glutamic acid side
chains were assumed to be negatively charged, while arginine and lysine were treated as positively
charged. All other amino acids were considered neutral.
2.2.2 Molecular Dynamics Simulations for Dimer Interface Calculations
Using MOE,5 all water molecules and substrates were removed from a crystal structure of
hGS (PDB ID = 2HGS).2 The resulting file was used as input for molecular dynamics (MD)
simulations in GROMACS 4.5.5.6 The AMBER99 force field was used for calculations.7,8 Within
GROMACS, H atoms were added to the enzyme, which was placed in a dodecahedral box with
borders at least 10.0 Å from the edge of the protein. The box was solvated using the simple point
charge (SPC) water model.9 The charge was neutralized with randomly dispersed Na+ and Cl- to a
concentration of 0.15 M. The Particle Mesh Ewald method was used for long range electrostatic
interactions.10,11 An initial geometry optimization was conducted in GROMACS with the structure
converging with forces ≤ 10 kJ mol-1 nm-1. Finally, an unconstrained molecular dynamics run was
conducted. The temperature increased from 0 to 300 K over a 1 ps interval. Simulations were
conducted under constant NPT; the Parrinello-Rahman barostat was used for an isotropic run with
a 1.0 ps coupling constant.12 The wild-type hGS MD simulation ran for 8 ns in 0.5 fs time steps
with data saved every 0.5 ps. Mutant hGS enzymes were simulated using the same method with
the variation that simulations were run for 1 ns with 0.5 fs time steps.
The lowest energy conformation from the wild-type hGS MD run was extracted and used
as the starting structure for mutants. For each dimer mutant, the relevant residues (S42, R221 and
8

D24) in each chain were mutated to alanine. These structures were then used as inputs for the
aforementioned MD run. Low energy structures were extracted for further analysis.
2.2.3 Variations in Molecular Dynamics Simulations for S-loop and E-loop Calculations
MD simulations of S-loop and E-loop mutants were conducted with a slight variation of
the above method. An AMBER99sb force field was used for MD simulations of free wild-type (10
ns) and mutant (5 ns) hGS.7,8,13 As mutant structures began from low energy WT structures, the
potential energy and RMSD of mutant structures converged within the 5 ns simulation.
The negatively cooperative substrate (γ-GC) was docked into a single active site of each
low energy structure with the induced fit docking method in MOE and an AMBER99 force field,
using the London and GBVI/WSA scoring functions.5,14,15 A pose was selected for further MD
simulations based on similarity to the crystal structure. The ligand was added to the protein with
the acpype program, before conducting MD simulations in GROMACS with the procedure
outlined above. Utilizing GROMACS, the average interaction energy of each residue within 4.5 Å
of the ligand was determined for the course of the MD run.
2.2.4 Post MD Analysis
The lowest energy structure in the last ns of each MD simulation was extracted for bond
analysis and docking studies. All hydrogen bonds are compared to an ideal bond (3.0 Å, 180º).
Mutants were aligned to low energy WT hGS structures using an all atom sequence and structure
alignment in MOE.5 The root mean square deviation (RMSD) for each mutant was then collected
for the α-carbons. The average deviation of the chains was taken as the RMSD for each residue.
9

Table 2.1 Primers for site directed mutagenesis of hGS residues. Mutations underlined.
Enzyme DNA Sequence
S-loop R267A 5’- GGTTTACTTCGCGGATGGCTACATGC - 3’ 5’ - GCATGTAGCCATCCGCGCAGTAAACC - 3’
R267K 5’ - GGTTTACTTCAAGGATGGCTACATGCCTCG - 3’ 5’ - CGAGGCATGTAGCCATCCTTGAAGTAAACC -3’
R267W 5’ - GGTTTACTTCTGGGATGGCTACATGC - 3’ 5’ - GCATGTAGCCATCCCAGAAGTAAACC - 3’
D268A 5’- GGTTTACTTCCGGGCTGGCTACATGC - 3’ 5’ - GCATGTAGCCAGCCCGGAAGTAAACC - 3’
D268E 5’- GGTTTACTTCCGGGAAGGCTACATGC - 3’ 5’ - GCATGTAGCCTTCCCGGAAGTAAACC - 3’
G259V 5’ - GGTTTACTTCCGGGATGTCTACATGCC - 3’ 5’ - GGCATGTAGACATCCCGGAAGTAAACC - 3’
Y270A 5’ - GGATGGCGCCATGCCTCGTCAGTACAG - 3’ 5’ - CTGTACTGACGAGGCATGGCGCCATCC - 3’
Y270F 5’ - GGATGGCTTCATGCCTCGTCAGTACAG - 3’ 5’ - CTGTACTGACGAGGCATGAAGCCATCC - 3’
P272A 5’ - GGATGGCTACATGGCTCGTCAGTACAG - 3’ 5’ - CTGTACTGACGAGCCATGTAGCCATCC - 3’
Y257A 5’ - GCCTCGTCAGGCCAGTCTACAGAATTGG - 3’ 5’ - CCAATTCTGTAGACTGGCCTGACCAGGC - 3’
Y275F 5’ - GCCTCGTCAGTTCAGTCTACAGAATTGG - 3’ 5’ - CCAATTCTGTAGACTGAACTGACCAGGC - 3’
E-loop Q211A 5’ - GCTACTGATTGCTGCCGAGAAGG - 3’ 5’ - CCTTCTCGGCAGCAATCAGTAGC - 3’
E214A 5’ - GCTCAAGAGAAGGCGAGAAACATATTTGACCAGCG - 3’ 5’ - CGCTGGTCAAATATGTTTCTCGCCTTCTCTTGAGC - 3’
E214S 5’ - GCTCAAGAGAAGAGCAGAAACATATTTGACCAGCG - 3’ 5’ - CGCTGGTCAAATATGTTTCTGCTCTTCTCTTGAGC - 3’
R215A 5’ - GCTCAAGAGAAGGAAGCAAACATATTTGACC - 3’ 5’ - GGTCAAATATGTTTGCTTCCTTCTCTTGAGC - 3’
N216A 5’ - GCTCAAGAGAAGGAAAGAGCCATATTTGACC - 3’ 5’ - GGTCAAATATGGCTCTTTCCTTCTCTTGAGC - 3’
N216V 5’ - GCTCAAGAGAAGGAAAGAGTCATATTTGACC - 3’ 5’ - GGTCAAATATGACTCTTTCCTTCTCTTGAGC - 3’
10

2.3 Experimental Methods
2.3.1 Materials
Oligomer primers (Table 2.1) were purchased from Integrated DNA Technologies, Inc.
Sequencing was conducted by GeneWiz, Inc. QuickChangeTM Mutagenesis Kits were purchased
from Stratagene, while Wizard® Plus Midiprep DNA Purifcation Systems were from Promega.
Novagen, Inc. supplied expression vector pET-15b, E. coli XL1 Blue competent cells and Ni-NTA
His-Bind® resin. Isopropyl-1-thio-β-galactopyranoside (IPTG) was purchased from American
Bioanalytical, Inc. L-γ-glutamyl-L-α-aminobutyrate (γ-GluABA) was supplied by Bachem, Inc.
or synthesized.16 Other reagents were obtained in the highest purity from Sigma-Aldrich, US
Biological, Fisher Scientific or Amresco.
2.3.2 Preparation and Purification of hGS
Wild-type hGS with an N-terminal 6x histidine tag was inserted in a pET-15b expression
vector (hGS-pET-15b).17 Site-directed mutagenesis of the vector was conducted through PCR with
the QuickChangeTM Mutagenesis Kit. Resulting plasmids were transformed into E. coli XL1 Blue
competent cells. DNA was purified with Wizard® Plus Midiprep DNA Purifcation Systems; wild-
type and mutant cDNA was sequenced by GeneWiz, Inc. After hGS-pET-15b plasmids were
expressed in E. coli BL21(DE3) cells, the protein was purified as previously reported.17
Purified wild-type and mutant protein was dialyzed overnight in a Tris buffer (20 mM Tris-
Cl, 1 mM EDTA, pH 8.6) then stored in sterile cryogenic tubes at 4 ºC. Pure protein was confirmed
by SDS-PAGE. The Lowry method was used with a bovine albumin standard to ascertain protein
concentration.18
11

2.3.3 Enzyme Activity and Kinetic Assays
Activity assays of purified hGS were conducted using a pyruvate kinase (PK)/lactate
dehydrogenase (LDH) coupled assay at 37 ºC.17 In order to avoid complications associated with
oxidation by a thiol, the native substrate (γ-GC) was substituted for γ-GluABA, which exhibits the
same activity and kinetics as γ-GC.16 An assay mixture of 100 mM Tris (pH 8.2, 25 ºC), 50 mM
KCl, 20mM MgCl2, 5 mM phosphoenolpyruvic acid (PEP), 10 units/assay LDH (type II rabbit
muscle), 10 units/assay PK (type II rabbit muscle), 0.3 mM NADH and 10 mM each of γ-GluABA,
ATP and glycine was incubated at 37 ºC for 11 min prior to addition of 10 µL of hGS for a total
volume of 0.2 mL. The rate was continuously monitored at 340 nm. A unit of activity is defined
as the amount of enzyme required to catalyze the formation of 1 µmol of product/min at 37 ºC.
Assays without γ-GluABA served as controls, confirming specificity within the assay. Kinetics
assays were conducted in the same manner, with concentrations of GAB varied 10 fold above and
below the standard. The Sigma Plot software was used to determine kinetic parameters as shown
if Figures A1 and A2 in the Appendix (Km, Vmax, and Hill coefficient).17,19,20
2.3.4 Differential Scanning Calorimetry (DSC)
Purified proteins were dialyzed overnight in sodium phosphate buffer (10 mM, pH 7.5, 4
ºC). Enzyme samples were concentrated (1 - 2 mg/mL) and degassed for 15 minutes.21 The
Calorimetry Sciences Nan Series III differential scanning calorimeter was used to conduct scans
at 1.0 atm, from 10 - 90 ºC at a rate of 1.0 ºC/min. Scans were baseline corrected against the sodium
phosphate buffer specified above. A sample run is shown in Figure A3 in the Appendix.
12

2.4 References
1. Polekhina, G.; Board, P.G.; Gali, R.R.; Rossjohn, J.; Parker, M.W. EMBO J., 1999, 18, 3204-3213.
2. Altschul, S.F.; Madden, T.L.; Schäffer, A.A.; Zhang, J.; Zhang, Z.; Miller, W.; Lipman, D.J. Nucleic Acids Res., 1997, 25, 3389-3402.
3. Berman, H.M.; Westbrook, J.; Feng, Z.; Gilliland G.; Bhat, T.N.; Weissig, H.; Shindyalov, I.N.; Bourne, P.E. Nucleic Acids Res., 2000, 28, 235-42. (www.pdb.org)
4. Meng, E.C.; Pettersen, E.F.; Couch, G.S.; Huang, C.C.; Ferrin, T.E. BMC Bioinformatics, 2006, 7, 339-349.
5. Molecular Operating Environment (MOE), 2013.08 (2014) Chemical Computing Group Inc. Montreal, QC, Canada. http://www.chemcomp.com/
6. Hess, B.; Kutzner, C.; van der Spoel, D.; Lindahl, E. J. Chem. Theory Comp., 2008, 4, 435-447.
7. Cornell, W.D.; Cieplak, P.; Bayly, C.L.; Gould, I.R.; Merz, K.M. Jr.; Ferguson, D.M.; Spellmeyer, D.C.; Fox, T.; Caldwell, J.W.; Kollman, P.A. J. Am. Chem. Soc., 1995, 117, 5179-5197.
8. Wang, J.; Cieplak, P.; Kollman, P.A. J. Comput. Chem., 2000, 21, 1049-1074.
9. Berendsen, H.J.C.; Postma, J.P.M.; van Gunsteren, W.F.; Hermans, J. Intermolecular Forces (Pullman, B. Ed.) 1981, pp 331-3432, D. Reidel Publishing, Dordrecht.
10. Darden, T.; York, D.; Pedersen, L. J. Chem. Phys., 1993, 98, 100089-100092.
11. Essmann, U.; Perera, L.; Berkowitz, M.L.; Darde, T.; Lee, H.; Pedersen, L.G. J. Chem. Phys., 1995, 103, 8577-8592.
12. Parrinello, M.; Rahman, A. J. Appl. Phys., 1981, 52, 7182-7190.
13. Hornak, V.; Abel, R.; Okur, A.; Strockbine, B.; Roitber, A.;, Simmerling, C. Proteins: Struct., Funct., Bioinf., 2006, 65, 712-725.
14. Labute, P. J. Comput. Chem., 2008, 29, 1693-1698. 15. Corbeil, C.R.; Williams, C.I.; Labute, P. J. Comput. Aided Mol. Des., 2012, 26, 775-786.
16. Oppenhiemer, L.; Wellnew, V.P.; Griffith, O.W.; Alton, M. J. Biol. Chem., 1979, 254, 5184-5190.
17. Dinescu, A.; Cundari, T.R.; Bhansali, V.S.; Luo, J.; Anderson, M.E. J. Biol. Chem., 2004, 279, 22412-22421.
13

18. Lowry, O.H.; Rosebrough, N.J.; Farr, A.L.; Randall, R.J. J. Biol. Chem., 1951, 193, 265-275.
19. Dinescu, A.; Brown, T.R.; Barelier, S.; Cundari, T.R.; Anderson, M.E. Biochem. Biophys. Res. Comm., 2010, 400, 511-516.
20. Brown, T.R.; Drummond, M.L.; Barelier, S.; Crutchfield, A.S.; Dinescu, A.; Slavens, K.D.; Cundari, T.R.; Anderson, M.E. Biochem. Biophys. Res. Comm., 2011, 411, 536-542.
21. Slavens, K.D.; Brown, T.R.; Barakat, K.A.; Cundari, T.R.; Anderson, M.E. Biochem. Biophys. Res. Comm., 2011, 410, 597-601.
14

CHAPTER 3
ELECTROSTATIC INTERACTIONS AT PROTEIN INTERFACES3
3.1 Introduction
Conformational changes induced by protein-protein interactions facilitate numerous
cellular processes in regulated biological pathways.1-3 For example, G-protein coupled receptors
such as metabotropic transmembrane γ-aminobutyric acid receptors (GABAB) and metabotropic
glutamate receptors (mGluRs) exhibit long distance conformational and therefore functional
changes at distant sites upon ligand binding.4 Such protein-protein interaction sites are increasingly
pursued as drug targets in the treatment of cancers, autoimmune diseases, and bacterial
infections.5,6 The intersection of protein-protein interactions and protein cooperativity, particularly
with regard to interchain salt bridges and hydrogen bonds, is an increasingly relevant area of
study.7,8
Human glutathione synthetase (hGS) provides an ideal model for exploring the role of
protein-protein interactions in allosteric communication as the obligate homodimer (C2 symmetry)
has a relatively small dimer interface. The enzyme is negatively cooperative towards its γ-
glutamylcysteine (γ-GC) substrate; thus, when the first γ-GC substrate binds, the substrate affinity
of the second subunit of hGS decreases.9 Communication between the active sites of hGS (40 Å
apart) must pass through the dimer interface. The current study of the dimer region of hGS,
particularly the electrostatic interactions across the interface, may provide crucial information on
the role of protein-protein interactions in maintaining the tertiary structure of the enzyme and the
origins of allosteric communication.
3 The entire chapter was reproduced from De Jesus, M.C.; Ingle, B.L.; Barakat, K.A.; Shrestha, B., Slavens, K.D.; Cundari, T.R.; Anderson, M.E. Protein J., 2014, 33, 403-409 with kind permission from Springer Science and Business Media, Copyright 2014.
15

Recent research on the hydrophobic interactions of V44 and V45 at the interface of hGS
highlights the importance of this region in both allostery and stability.10 All V44/45 mutations
resulted in decreased activity, decreased negative cooperativity, and decreased thermal stability
relative to wild-type hGS.10 The remarkable finding that V44 and V45 lie along the allosteric
pathway of hGS and that disruption of the hydrophobic interactions at this site impacts the global
geometry of hGS invites further study into dimer interface interactions.
In the current work, computational analysis of hGS indicates that the amino acids S42 and
R221 participate in electrostatic interactions with D24 across the dimer interface (separations <
3.0 Å), Figure 3.1. The strength of these interactions, relative to the hydrophobic interactions at
V44 and V45, suggests that these residues may be crucial to the function of hGS. Since D24
participates in two significant interactions (a salt bridge with R221 and an ionic hydrogen bond
with S42), it is reasonable to hypothesize that this residue plays the largest role in hGS activity
and stability. The present research delineates the function of dimer interface interactions between
S42, R221, and D24 in terms of the activity, cooperativity and stability of hGS.
Figure 3.1 Dimer interface of hGS from crystal structure (2HGS) with D24, S42, and R211 in yellow space filling models and active site shown as grey-blue-red surface.
16

3.2 Experimental Results
3.2.1 Experimental Activity and Kinetic Studies of hGS Mutant Enzymes
The functional effects of dimer interface mutations, S42A, R221A and D24A, relative to
wild-type (WT) hGS were assessed by activity: kcat (s-1) = 15.6, 13.5, 11.9, and 18.2 (WT),
respectively. These mutations lead to lower activity (by ~ 15 - 35%) than wild-type hGS when
measured immediately after (within a few hours) purification (Table 3.1). Wild-type hGS displays
negative cooperativity toward its γ-glutamyl substrate (γ-GluABA) with a Hill coefficient of
0.69.11 The mutant hGS dimer interface enzymes prepared here have nearly identical Hill
coefficients (0.68 to 0.72) (Table 3.1). Thus, rather surprisingly, the three dimer interface residues
involved in electrostatic interactions lower the kcat of the enzyme without significantly impacting
negative cooperativity in hGS.
Table 3.1 Activity, kinetic properties and thermal stability of hGS. Enzyme* kcat (s-1) Km (mM) kcat/ Km ( s-1 mM-1) Hill Coef. Tm (°C)
WT 18.2 ± 2.0 (100%) 1.31 ± 0.13 1.39 x 10⁻⁴ 0.69 ± 0.03 60.3 ± 0.3
D24A 11.9 ± 0.3 (65%) 0.71 ± 0.02 1.68 x 10⁻⁴ 0.68 ± 0.05 39.3 ± 0.1
S42A 15.6 ± 0.5 (85%) 0.95 ± 0.08 1.64 x 10⁻⁴ 0.72 ± 0.06 49.7 ± 0.1
R221A 13.5 ± 3.0 (74%) 0.68 ± 0.08 1.99 x 10⁻⁴ 0.68 ± 0.04 42.5 ± 0.4 *Duplicate assays carried out on 2 - 3 independent purifications (per enzyme) so that n = 4 - 6.
The γ-GluABA Michaelis constant (Km) represents the γ-GluABA concentration where the
reaction rate is half of Vmax, and relates to substrate affinity. The wild-type hGS, S42A, R221A
and D24A have Km values of 1.31, 0.95, 0.68 and 0.71 mM, respectively (Table 3.1). The apparent
increase in affinity for γ-GluABA exhibited by the Km of these dimer interface mutants is due to
tighter substrate binding, possibly coupled with a decrease in rates of product formation and
substrate dissociation. Compared to wild-type there is a slight increase in catalytic efficiency
(kcat/Km) of the dimer interface mutants S42A, R221A and D24A (Table 3.1). Therefore, hGS
17

residues (S42, R221 and D24) that have hydrogen bonding and ionic interactions across the dimer
interface decrease activity, maintain negative cooperativity, increase γ-GluABA affinity, and
increase catalytic efficiency when mutated to alanine.
3.2.2 Temporal Analysis of Enzyme Activity
While wild-type hGS is stable for several years when stored in a Tris-Cl buffer (20 mM
Tris-Cl and 1 mM EDTA, pH 8.6) in sterile cryogenic tubes at 4 °C, the hGS dimer interface
mutant enzymes lost activity in the 30 hours after purification. Both R221A and D24A lost activity
in a biphasic manner (Figure 3.2) within a few hours; D24A lost 30% of activity in 4 hours, while
R221A activity decreased by 20% in 7.5 hours. Interestingly, despite different initial activities,
both R221A and D24A plateaued at a similar kcat (~ 8 s-1). Several hGS mutants have exhibited
the temporal shift in activity.12,13 While MD simulations do not allow for models on such long time
scales, it is likely that the disrupted interchain bonding in D24A and R221A results in a gradual
loss in activity as the mutant enzymes denature. The plateaus in activity may represent a point at
which the enzymes reach a new structural equilibrium. In contrast, the S42A mutant was fairly
stable, with a 10% loss in activity in 3 days and a 40% drop in activity after 6 weeks (data not
shown). All three dimer interface hGS mutants lose activity over time, an exceptionally fast
change in the case of R221A and D24A.
3.2.3 Experimental Measurement of Thermal Stability
Differential scanning calorimetry (DSC) was used to compare enzyme stability. Wild-type
hGS has an unfolding or transition midpoint (Tm) of 60.3 °C. The Tm values of S42A, R221A and
D24A are 49.7, 42.5 and 39.3 °C, respectively (Table 3.2). The stability of each hGS mutant
enzyme decreased compared to wild-type, supporting computational predictions of the importance
of these residues from the conservation and structural analyses (vide supra).
18

Figure 3.2 Activity of wild-type and hGS mutant enzymes R221A and D24A over time. Values represent an average of two assays of at least two independent purifications (per enzyme). Enzymes were stored in sterile cryogenic tubes in Tris-Cl buffers (20 mM Tris-Cl and 1 mM EDTA, pH 8.6) at 4 °C.
3.3 Computational Results
3.3.1 Sequence Analysis
Sequence alignment of hGS compared to glutathione synthetase of higher eukaryotes and
mammals shows moderate overall sequence identity, 43% and 71%, respectively (Table 3.2).
Among mammals the polar residues S42, R221 and D24 have sequence conservation comparable
to the hydrophobic dimer interface residues V44 (67%) and V45 (62%), which were shown in
previous research to be important in allostery and stability.10 The mammalian conservations of S42
19

(62%), R221 (71%), and D24 (71%) suggest a genetic drive across species to retain those residues
at these locations, especially in the case of R221 and D24.
Table 3.2 Comparison of the conservation of hGS residues near the dimer interface between higher eukaryotes and mammals.
Higher Eukaryotes Mammals
Residue Identity Cons. Charge Cons. Identity Cons. Charge Cons.
D24 63.4 64.6 71.4 71.4
S42 24.4 59.8 61.9 66.7
E43 7.3 14.6 23.8 52.4
V44 39.0 51.2 66.7 76.2
V45 15.9 51.2 61.9 76.2
Y47 22.0 81.7 81.0 81.0
R221 40.2 40.2 71.4 71.4
Average* 42.6 60.3 70.5 76.0
Std Dev* 18.2 19.8 17.3 11.2
*Average and standard deviation of all amino acids in sequence relative to hGS. Cons. = conservation
3.3.2 RMSD Analysis of Molecular Dynamics Geometries
The structural alignment of S42A, R221A and D24A with wild-type hGS (all are the
lowest-energy structures obtained from MD simulations) resulted in average root mean square
deviations (RMSD) of 1.24, 1.88 and 1.25 Å, respectively (Table 3.3). Although the D24A and
S42A mutants showed similar movement within the protein as a whole, the S42A mutation had a
larger impact on the dimer region geometry. Of the mutants studied, R221A exhibited the largest
RMSD both within the dimer region and the entire protein, indicating conformational change.
20

3.3.3 Hydrogen Bond Analysis of Molecular Dynamics Geometries
A summary of all bonds within 4.5 Å of S42, R221 and D24 within the wild-type and
mutant hGS enzymes elucidates the structural significance of these residues (Table A.1, the two
subunits are designated “a” and “b”). In the wild-type there are six significant electrostatic
interactions across the two chains: two ionic hydrogen bonds and a salt bridge between D24 and
R221, two ionic hydrogen bonds between D24 and S42, and one ionic hydrogen bond between
E43b and S46a (Figure 3.2). A comprehensive list of intrachain interactions is given in Table A.1.
Table 3.3 RMSD of hGS mutants relative to wild-type hGS in Å.
Residue D24A S42A R221A D24 0.84 0.81 0.93 S42 0.96 1.26 1.58 E43 1.62 1.66 2.45 V44 1.06 1.19 1.54 V45 0.52 0.56 0.99 Y47 0.65 1.01 0.75 R221 0.62 0.41 1.17
Average 1.26 1.24 1.88 St Dev 0.74 0.75 1.21
Intrachain bonding is largely unaffected by the D24A mutation. Upon D24A mutation, two
symmetrical interchain hydrogen bonds between residues E43 and S46 remain but all of the other
surrounding intrachain hydrogen bonds are disrupted, Figure 3.3. Although the mutation of S42A
disrupts some interchain interactions, it also creates new interchain hydrogen bonds (Figure 3.3),
consistent with the moderate drop in activity. A salt bridge (D24-R34) and an interchain hydrogen
bond (S46-A42) form in the S42A mutant in place of the S42-D24, and S42-E43 interchain bonds
of the wild-type enzyme, Figure 3.4. In the R221A mutant, the interchain salt bridge and hydrogen
bonds between R221 and D24 are broken, and a new salt bridge forms between R34 and D24. The
R221A mutation also has a large impact on the intrachain bonding structure (Table A.1 in
Appendix; Figure 3.4). Overall, the R221A mutation results in a moderate loss of interchain bonds,
21

when compared with the dramatic drop in interchain bonds in the D24A mutant and the small shift
in interchain bonds in the S42A mutant, Table A.1 in Appendix.
Figure 3.3 Hydrogen bonding in (a) wild-type hGS and (b) D24A hGS. Chain A is in red (dark) and chain B is in blue (light).
Figure 3.4 Hydrogen bonding in (a) S42A and (b) R221A hGS. Chain A is in red (dark) and chain B is in blue (light).
22

3.4 Discussion
Computational analysis of the dimer interface of hGS indicated that electrostatic
interactions between S42, D24, and R221 dominated subunit:subunit interactions. An initial
hypothesis posited that these interactions may stabilize the obligate homodimer and affect the
allostery of the negatively cooperative enzyme. Alanine scans of these residues (S42A, R221A,
and D24A) and MD simulations of the mutants were conducted to assess the impact on activity,
stability and cooperativity.
Molecular dynamics simulations indicate that while alanine mutations of S42, R221, and
D24 impact the overall conformation of hGS (Table 3.2), these mutations primarily disrupt the
strong ionic salt bridges and hydrogen bonds across the dimer interface. The number and strength
of interchain bonds lost directly correlates to the observed drop in thermal stability (Tm). This
change in secondary structure is mirrored by small changes in the CD spectra of the mutant
enzymes relative to wild-type hGS. Upon loss of the strong dimer interface interactions, the
vibrational freedom of the mutant proteins increases, allowing for greater motion, and therefore
decreased stability, within the entire enzyme. Indeed, the present research in conjunction with
previous studies of V44/45 infers that hGS is an obligate dimer.10 All experimental and
computational studies show that the mutation at D24 results in the greatest loss of interchain bonds
and the most dramatic variation in overall structure.
The activity of the dimer interface mutants (S42A > R221A > D24A) also parallels the loss
of interchain bonds (Figure 3.3). The rapid drops in activity over time exhibited by the D24A and
R221A mutants, coupled with the moderate temporal drop in activity for S42A (Figure 3.2) further
support the role of interchain interactions in the function of the enzyme. The reduced enzyme
stability may also impact the activity of the mutations, especially in D24A. With two strong
23

electrostatic interactions at the interface, D24 plays the most pivotal role in maintaining hGS
activity.
Kinetic studies of dimer interface mutants (S42A, R221A, and D24A) show that changes
at the interface have a long distance impact on the active site of hGS. The Michaelis constant (Km)
for γ-GluABA decreased upon mutation of these residues, which may explain the drops in activity
exhibited by these mutants. While the mutant enzymes may bind γ-GluABA better than wild-type,
the reaction does not proceed to product as quickly. Notably, the Hill coefficients of S42A, R221A,
and D24A were similar to wild-type, indicating that these mutations do not alter the negative
cooperativity of hGS. The low Michaelis constants and negligible changes in Hill coefficients
suggest that while S42, R221, and D24 do not lie along the allosteric pathway, these residues
remain important for the activity and stability of the enzyme.
In conclusion, the present research on homodimeric hGS implies that strong electrostatic
interactions are essential for the stability of multimeric enzymes, but need not necessarily mediate
allosteric communications. Alternatively, weaker chemical bonding phenomena, e.g., hydrophobic
interactions,10 may provide a more flexible (chemically and evolutionarily) communication
pathway between enzyme active sites separated by long distances. By extension, allosteric
pathways in enzymes may arise not from a few strong chemical bonds, but rather a “conspiracy”
among larger numbers of weaker interactions. Perhaps the polar dimer interface residues do not
modulate cooperativity, because the disruption of strong electrostatic interactions across the
protein-protein interface has such a drastic impact on the functional stability of hGS. Studies are
currently underway in our laboratory to further delineate the allosteric pathways and protein-
protein interactions of hGS, providing the essential data needed to test the various models of
protein allostery and interaction.
24

3.5 References
1. Haber, J.E.; Koshland, D.E. Jr. Proc. Natl. Acad. Sci. USA, 1967, 58, 2087-2093.
2. Kirtley, M.E.; Koshland, D.E. Jr. J. Biol. Chem., 1967, 242, 4192-4205.
3. Kantrowitz, E.R. Arch. Biochem. Biophys., 2012, 519, 81-90.
4. May, L.T.; Leach, K.; Sexton, P.M.; Christopoulos, A. Annu. Rev. Pharmacol. Toxicol., 2007, 47, 1-51.
5. Geitmann, M.; Elinder, M.; Seeger, C.; Brandt, P.; de Esch, I.W.J.; Danielson, U.H. J. Med. Chem., 2011, 54, 699-708.
6. Wells, J.A.; McClendon, C.L. Nature, 2007, 450, 1001-1009.
7. Jones, S.; Thornton, J.M. Pro. Natl. Acad. Sci. USA, 1996, 93, 13-20.
8. Keskin, O.; Gursoy, A.; Ma, B.; Nussinov, R. Chem. Rev., 2008, 108, 1225-1244.
9. Oppenheimer, L.; Wellner, V.P.; Griffith, O.W.; Meister, A. J. Biol. Chem., 1979, 254, 5184-5189.
10. Slavens, K.D.; Brown, T.R.; Barakat, K.A.; Cundari, T.R.; Anderson, M.E. Biochem. Biophys. Res. Comm., 2011, 410, 597-601.
11. Luo, J.L.; Huang, C.S.; Babaoglu, K.; Anderson, M.E. Biochem. Biophys. Res. Commun., 2000, 275, 577-581.
12. Larsson, A.; Ristoff, E.; Anderson, M.E. In: Scriver CR, Beaudet AL, Sly WS, Valle D (eds) Metabolic Basis of Inherited Disease, Online (genetics.accessmedicine.com). McGraw Hill, New York 2005.
13. Brown, T.R.; Drummond, M.L.; Barelier, S.; Crutchfield, A.S.; Dinescu, A.; Slavens, K.D.; Cundari, T.R.; Anderson, M.E. Biochem. Biophys. Res. Comm., 2011, 411, 536-542.
25

CHAPTER 4
LINKS BETWEEN ALLOSTERY AND SUBSTRATE BINDING
4.1 Introduction
The research presented herein focuses on elucidating key aspects of substrate binding in
human glutathione synthetase (hGS) in an effort to better understand both glutathione biosynthesis
and regulation. Homodimeric hGS exhibits negative cooperativity towards the γ-glutamylcysteine
(γ-GC) substrate (Hill coefficient of 0.69),1,2 a type of allosteric regulation wherein the binding of
γ-GC to one subunit of the enzyme results in a decreased affinity for γ-GC at the second active site
ca. 40 Å away. While allosteric communication at the protein-protein interface of hGS is
modulated exclusively by weak, hydrophobic interactions, the residues responsible for allostery at
the substrate binding sites remain unexplored. 3,4
The S-loop comprises of a series of eleven residues identified with the first crystal structure
of the enzyme as forming a wall of the active site of hGS near the negatively cooperative (γ-GC)
substrate: (F266-R267-D268-G269-Y270-M271-P272-R273-Q274-Y275-S276), Figure 4.1.
Previous work from our group has shown that the S-loop does not undergo significant catalytic
motion during peptide bond formation as compared to the G- and A-loops, but suggested that the
S-loop has a role in substrate binding.5 Investigation of the S-loop may shed light upon both the
mechanisms of substrate binding and the initiation of allosteric communication in hGS.
Mutations in the enzymes responsible for the biosynthesis of GSH have been shown to
result in metabolic acidosis, hemolytic anemia, and moderate to severe neurological disorders.6,7
Two S-loop residues have been implicated in patients with mutations in hGS: R267 and Y270.
Patients with a single hGS mutation at Y270 to either cysteine or histidine exhibit low GSH levels,
severe reductions in hGS activity, hemolytic anemia, and metabolic acidosis.6,7 A patient with a
26

double mutation (R267W and R283C) had similar symptoms. Most drastically, a patient born with
both R267W and D469E mutations had the aforementioned symptoms in addition to seizures and
psychomotor retardation; the patient died at 5 days of age.6,7 Rare mutations in hGS can have acute
physiological consequences, which underscore the importance of the enzyme in GSH production.
Figure 4.1 S-loop of hGS in dimeric hGS from crystal structure (2HGS). S-loop shown as yellow ribbon, GSH shown as ball-and-stick model, and active site shown as grey-blue-red surface.
The severity of S-loop patient mutations, coupled with high sequence conservation (results
section) and proximity to the negatively cooperative γ-GC substrate suggests that the region has a
crucial role in the activity of hGS. In the presented work, molecular dynamics simulations and
experimental point mutations are used probe the role of S-loop residues in tertiary structure,
substrate binding, and allosteric communication. Alterations in bonding architectures, activity,
cooperativity, and thermal stability indicate S-loop residues modulate both substrate binding and
allostery in hGS.
27

4.2 Results
4.2.1 Sequence Analysis of hGS
The identity of S-loop residues near the γ-GC binding site of hGS is relatively well
conserved in both higher eukaryotes and mammals (Table 4.1). S-loop residues F266, R267, G269,
Y270, P272, Y275 and S276 have identify conservations above the 43% average for the entire
enzyme in higher eukaryotes. Although D268 is not well conserved in higher eukaryotes
(conservation 18%), it has a very high identity conservation in mammals (71%). Several S-loop
residues have sequence conservations greater than 70% in mammals: F266, R267, D268, G269,
Y270, M271, P272, and Y275. While it is difficult to prioritize residues for further study based
solely upon sequence conservation, several S-loop residues were selected for further study due to
their prevalence in patient mutations and their position within the crystal structure.8
4.2.2 Substrate Binding and S-loop Structure in WT hGS
Computational models show two S-loop residues, R267 and Y270, bind γ-GC within the
active site of hGS. Over a 10 ns MD run, the average interaction energy (Eint) between γ-GC and
R267 of -117 kJ/mol corresponds to a salt-bridge and hydrogen bond(s) formed between R267 and
γ-GC (Figure 4.2 and Table A.2). In the lowest energy structure from the last ns of the MD run,
the R267 guanidyl forms a salt bridge and hydrogen bond with the α-carboxyl of the γ-GC
glutamyl, Figure 4.3. At some steps of the MD run, the backbone carbonyl of R267 forms an
additional hydrogen bond with the glutamyl α-amino of γ-GC. To a lesser extent, Y270 also binds
γ-GC in WT hGS through the formation of a hydrogen bond between the Y270 hydroxyl and the
terminal γ-GC amine with an average interaction energy of -27 kJ/mol. In WT hGS, both R267
and Y270 strongly bind γ-GC.
28

Table 4.1 Percent conservation of hGS S-loop residues in higher eukaryotes and mammals. Higher Eukaryotes Mammals
Residue Identity Cons. Charge Cons. Identity Cons. Charge Cons.
F266 61.0 75.6 71.4 71.4
R267 64.6 64.6 71.4 71.4
D268 18.3 18.3 71.4 71.4
G269 64.6 75.6 71.4 71.4
Y270 68.3 72.0 71.4 71.4
M271 20.7 67.1 71.4 76.2
P272 63.4 74.4 76.2 76.2
R273 8.5 8.5 23.8 23.8
Q274 17.1 42.7 66.7 76.2
Y275 59.8 74.4 76.2 76.2
S276 48.8 74.4 47.6 76.2
Average* 42.6 60.3 70.5 76.0
Std Dev* 18.2 19.8 17.3 11.2 *Average and standard deviation of all amino acids in sequence relative to hGS. Cons. = conservation.
Several residues outside of the S-loop also interact with the negatively cooperative
substrate (γ-GC), Figure 4.2. Most notably, R125 forms a salt bridge and two hydrogen bonds with
the cysteine carboxyl group of γ-GC in the lowest energy structure from the last ns of the MD
simulation, which corresponds to an average interaction energy of -111 kJ/mol. Hydrogen bonds
at S151, E214, N216 and Q220 stabilize γ-GC in the active site (Eint = -29, -67, -37 and -42 kJ/mol,
respectively), while S149 and F152 exhibit more moderate substrate binding (Eint = -11 and -18
kJ/mol, respectively). The comparison of interaction energies and bonds thus shows that the early
S-loop residues play a dominant role in γ-GC binding.
29

Figure 4.2 Average interaction energy (kJ/mol) between γ-GC and important residues over the course of 5 - 10 ns MD runs for WT and S-loop mutant hGS.
Another S-loop residue, D268, helps maintain the structure of the active site near γ-GC.
The carboxyl side chain of D268 forms hydrogen bonds with G269 and Q274, which vary across
several low energy MD structures. More interestingly, D268 forms a consistent hydrogen bond
with Q211, a residue on a neighboring active site loop, which may help to bring these two γ-GC
binding regions into close proximity (Figure 4.3). Over the course of 10 ns MD run, D268 has an
average interaction energy with γ-GC (-7 kJ/mol), which is very small compared with the
previously discussed substrate binding residues, R267 and Y270. While playing only a minor role
in γ-GC binding, the flexible hydrogen bonding network of D268 maintains the active site structure
of hGS.
-180
-160
-140
-120
-100
-80
-60
-40
-20
0
20
Inte
ract
ion
Ener
gy (k
J/m
ol)
Interaction Energies of γGC with hGS Residues
WT R267A R267K R267W D268A D268E
G269V Y270A Y270F P272A Y275A Y275F
30

Figure 4.3 Important residues in binding γ-GC near the S-loop of hGS in the lowest energy structure in the last ns of MD simulations of (a) WT hGS, (b) R267W, (c) D268A, and (d) Y270F.
As one of the “walls” of the active site of hGS, the S-loop plays a crucial role in maintaining
the ideal environment for γ-GC binding. Interactions between three S-loop residues (G269, P272
and Y275) serve to bend the flexible loop into an optimal geometry, which is maintained in
throughout the catalytic cycle. In low energy frames from both free and γ-GC containing WT hGS
MD simulations, G269 forms backbone hydrogen bonds with the hydroxyl of Y275 and the
carbonyl of Q274; these interactions on either side of G269 form the tiny loop of the C-terminus
31
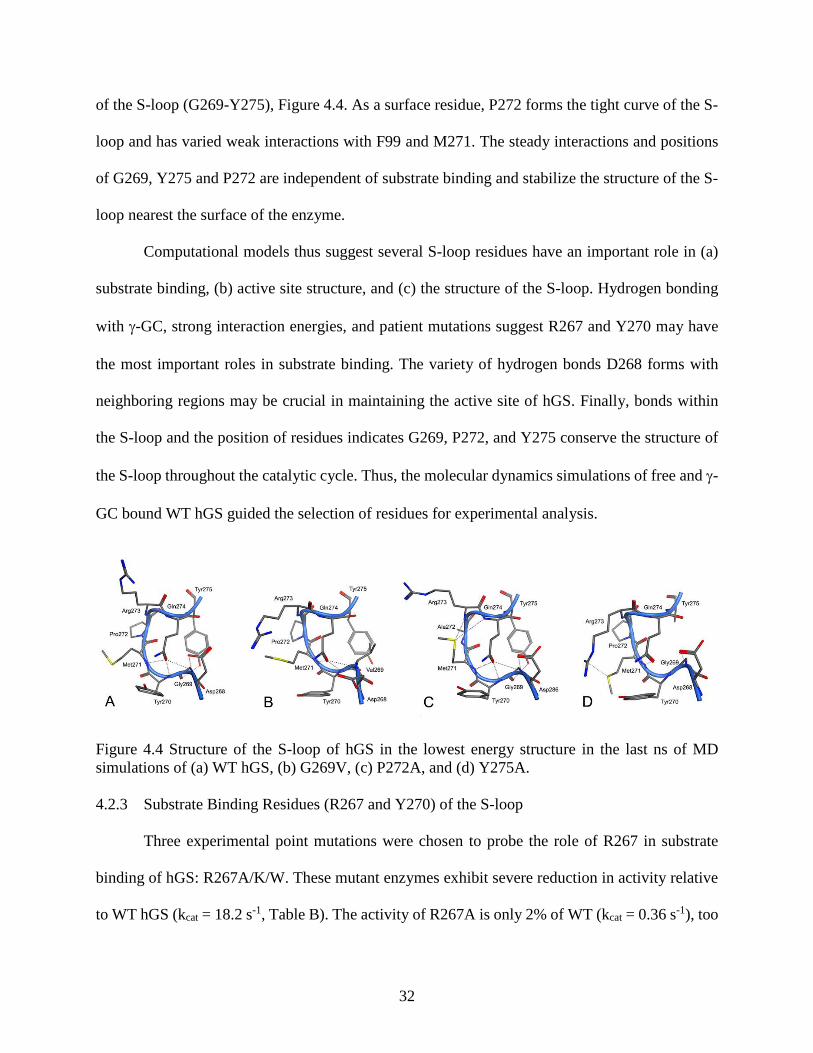
of the S-loop (G269-Y275), Figure 4.4. As a surface residue, P272 forms the tight curve of the S-
loop and has varied weak interactions with F99 and M271. The steady interactions and positions
of G269, Y275 and P272 are independent of substrate binding and stabilize the structure of the S-
loop nearest the surface of the enzyme.
Computational models thus suggest several S-loop residues have an important role in (a)
substrate binding, (b) active site structure, and (c) the structure of the S-loop. Hydrogen bonding
with γ-GC, strong interaction energies, and patient mutations suggest R267 and Y270 may have
the most important roles in substrate binding. The variety of hydrogen bonds D268 forms with
neighboring regions may be crucial in maintaining the active site of hGS. Finally, bonds within
the S-loop and the position of residues indicates G269, P272, and Y275 conserve the structure of
the S-loop throughout the catalytic cycle. Thus, the molecular dynamics simulations of free and γ-
GC bound WT hGS guided the selection of residues for experimental analysis.
Figure 4.4 Structure of the S-loop of hGS in the lowest energy structure in the last ns of MD simulations of (a) WT hGS, (b) G269V, (c) P272A, and (d) Y275A. 4.2.3 Substrate Binding Residues (R267 and Y270) of the S-loop
Three experimental point mutations were chosen to probe the role of R267 in substrate
binding of hGS: R267A/K/W. These mutant enzymes exhibit severe reduction in activity relative
to WT hGS (kcat = 18.2 s-1, Table B). The activity of R267A is only 2% of WT (kcat = 0.36 s-1), too
32

low to determine kinetic parameters. Substitution to a bulky aromatic group in R267W yields an
even lower activity (kcat = 0.05 s-1). In contrast, R267K retains nearly 15% of WT activity (kcat =
2.7 s-1) by preserving the positive charge with a flexible lysine substitution. The γ-GluABA
Michaelis constant of R267K (Km = 13.34 mM) suggests the mutant hGS does not bind the
substrate as tightly as WT (Km = 1.31 mM). Despite these large shifts in activity, mutations in
R267 have only a moderate impact on the structural stability of hGS (Tm = 60.3, 52.8, 54.3, and
53.7 °C, for WT, R267A/K/W, respectively). Mutations to R267 have a dramatic impact on the
activity and kinetics of hGS, without significant alterations in thermal stability.
In a low energy frame from an MD run of R267A, γ-GC fails to stay deep within the binding
pocket, instead forming new bonds with A-loop residues usually responsible for binding glycine
(V461 and A462). Interactions between γ-GC and E214, Q220 and R267 weaken by 33 - 83 kJ/mol,
relative to WT; γ-GC interactions with S149 and G370 strengthen by 16 and 10 kJ/mol,
respectively (Figure 4.2). The R267W mutant displays the largest shift in γ-GC binding, as the
substrate binds in a twisted orientation and is unable to fit deep into the binding pocket, Figure 4.3.
Of the 11 residues that interact with γ-GC in WT, only R125, N146, and Y270 form hydrogen
bonds with the substrate in R267W. Average interactions energies with γ-GC at E214, N216,
Q220, R267, and Y270 decrease by 40 - 96%. The hydrogen bond between active site residues
D268 and Q211 is also disrupted. In contrast, the positively charged amine of the R267K mutant
binds γ-GC and allows the substrate to adopt a similar orientation to WT hGS. Over a 5 ns MD
run, average interaction energies with γ-GC at S151 and E214 strengthen by 63 and 37 kJ/mol,
while interactions at R125, S149, and A150 increase moderately (13 - 19 kJ/mol) relative to WT
hGS. Binding of γ-GC at F152, N216, and Q220 weakens by 14 - 25 kJ/mol and repulsive
33

interactions with D219 increase by 7 kJ/mol. According to computational models, mutations in
R267 drastically impact γ-GC binding.
Experimental alanine and phenylalanine mutations at Y270 yield large drops in activity.
While Y270A shows a dramatic 98% reduction in activity (kcat = 0.33 s-1), the Y270F mutant has
a more moderate impact (kcat = 8.6 s-1). Indeed, the presence of the aromatic ring within the active
site is enough to maintain 48% of WT activity. The Y270F mutant exhibits lowered substrate
affinity (Km = 8.73 mM), similar to that displayed by R267K. With transition midpoints of 59.6
and 58.5 °C, respectively, Y270A/F mutant enzymes have structural thermal stabilities comparable
to WT hGS (Tm = 60.3 °C).
Table 4.2. Impact of S-loop mutations on experimental activity, kinetic parameters and thermal stabilities of hGS.
Enzyme* kcat (s-1) Km (mM) keff (s-1 M-1) Hill Coef. Tm (°C)
WT** 18.2 ± 2.0 1.31 ± 0.13 1.4 x 10⁴ 0.69 ± 0.03 60.3 ± 0.3
R267A‡ 0.36 ± 0.02 ND** ND ND 52.8 ± 0.01
R267K 2.7 ± 0.4 13.34 ± 1.6 2.0 x 10² 1.03 ± 0.09 54.3 ± 0.1
R267W 0.05 ± 0.02 ND ND ND 53.7 ± 0.04
D268A 11.8 ± 0.1 1.33 ± 0.17 8.9 x 10³ 0.78 ± 0.01 62.1 ± 1.0
D268E‡ 11.3 ± 0.7 0.19 ± 0.09 5.9 x 10⁴ 0.68 ± 0.06 54.4 ± 0.1
G269V‡ 0.6 ± 0.3 ND ND ND 45.5 ± 0.5
Y270A‡ 0.33 ± 0.06 ND ND ND 59.6 ± 0.2
Y270F‡ 8.6 ± 0.8 8.73 ± 0.99 9.9 x 10² 0.78 ± 0.03 58.5 ± 1.0
P272A‡ 1.19 ± 0.01 0.06 ± 0.02 2.0 x 10⁴ 1.02 ± 0.01 60.8 ± 0.3
Y275A 9.2 ± 1.0 0.05 ± 0.03 1.8 x 10⁵ 0.73 ± 0.08 57.8 ± 0.3
Y275F‡ 6.6 ± 0.7 0.10 ± 0.04 6.6 x 10⁴ 0.70 ± 0.03 59.4 ± 0.4 *Data from 2 - 3 independent purifications, with duplicate assays on each. **ND = activity too low to determine. **As published in our previous work.3 ‡Purified by Bisesh Shrestha, Stacey Grigar, and Jodi Johnston.
MD simulations of Y270A and Y270F show the mutated hGS enzymes bind γ-GC in a
slightly twisted orientation, wherein the glutamyl moiety of γ-GC displays many hydrogen bonds,
but its cysteine moiety is rotated further away from the S-loop than in WT (Figure 4.3). The
34

negatively cooperative substrate γ-GC maintains bonds with S151, E214, N216, and Q220 in the
lowest energy frames from the last ns of MD simulations of both Y270A and Y270F (Eint = - 46
to - 109 kJ/mol). Interestingly, Y270F exhibits stronger bonding of γ-GC than Y270A at R125 (Eint
= -135 and -73 kJ/mol) and R267 (Eint = -174 and -150 kJ/mol), Figure 4.2. The Y270F mutant
also forms a long hydrogen bond at the sulfur of γ-GC and the S149 hydroxyl (4.0 Å S-O distance,
137°). The bond between G269 and Q274 is disrupted in the Y270A mutant, allowing for a more
flexible S-loop. The aromatic ring maintained in Y270F allows for substrate binding and an S-loop
structure more similar to WT than that exhibited by the Y270A mutant.
4.2.4 Role of D268 in Active Site Structure
Two experimental point mutations were made to explore the role of D268 in active site
structure: D268A/E. The D268 mutants demonstrate similar activity of 62 - 65% of WT (kcat =
11.8 and 11.3 s-1, respectively). Despite these comparable activities, D268E binds γ-GluABA
tightly (Km = 0.19 mM), while D268A has a Michaelis constant nearly identical to WT (Km = 1.33
mM). In addition to altered substrate binding, D268E has a lower thermal stability, relative to WT
hGS (Tm = 54.4 °C). The D268A mutant maintains a thermal stability similar to WT (Tm = 62.1
°C). While both D268 mutations result in moderate decreases in activity, the D268E mutation also
alters substrate binding and thermal stability in hGS.
Low energy frames from MD simulations provide insight into the structural shifts induced
by D268 mutations. In D268A, the loss of a side chain carboxyl at 268 disrupts the hydrogen bond
between the residue and the side chain amide of Q211. The neighboring hydrogen bond between
Q220 and E214 exhibited by free WT hGS is replaced by a hydrogen bond between the side chain
carboxyl of E214 to the backbone α-amine of N216 in D268 mutant hGS. Although the D268E
maintains the interaction between the side chain carboxyl at 268 and the Q211 amide, the mutant
35

displays a similar shift in binding at E214. The MD simulations show mutations to D268 alter
hydrogen bonding interactions within the active site of hGS.
The binding of γ-GC is distorted in both D268 mutants. In an MD simulation of D268A,
the glutamyl side of the substrate twists away from the S-loop; additional hydrogen bonds form at
R267 and E214, but the distance from Y270 increases (Figure 4.3). Over the course of the MD
run, average γ-GC interaction energies strengthen at R125, S151, and E214 by 32, 65, and 41
kJ/mol, relative to WT. Interactions between γ-GC and residues S149, A150, and R267 also
increase by 13 - 19 kJ/mol (Figure 4.2). An MD simulation of D268E reveals a more dramatic shift
in γ-GC binding. Within the binding pocket, γ-GC adopts a twisted orientation wherein the
glutamyl α-amine of γ-GC forms a hydrogen bond with the thiol of the cysteine moiety of γ-GC.
Hydrogen bonding between γ-GC and residues deep in the pocket (E214, Q220, and R267) are
disrupted; interaction energies between these residues and γ-GC weaken by 65, 37, and 51 kJ/mol
in D268E, relative to WT. As the negatively cooperative substrate does not fit as deeply into the
pocket of D268E, interactions between the cysteine moiety of γ-GC and G368 strengthen by 23
kJ/mol over the course of the MD run, relative to WT. Binding of γ-GC is significantly altered
upon mutation of D268 in hGS.
4.2.5 S-Loop structure residues (G269, P272, and Y275)
Experimental point mutations of G269 and Y275 serve to explore the role of hydrogen
bonding within the S-loop of hGS. Insertion of a large hydrophobic residue into the S-loop with
the G259V mutation results in a remarkable 97% drop in activity (kcat = 0.6 s-1). Mutations at Y275
reveal a striking contrast, maintaining 36 – 50% activity of WT hGS. Both Y275A and Y275F
exhibit similar activities (kcat = 9.2 and 6.6 s-1, respectively) and comparable increases in γ-GC
binding affinities (Km = 0.05 and 0.10 mM, respectively). Although Y275 mutants have thermal
36

stabilities near that of WT (Tm = 57.8 and 59.4 °C), the transition midpoint of G269V is much
lower at 45.5 °C. Mutations to residues involved in hydrogen bonds within the S-loop can have
severe impacts on the activity, kinetics, and thermal stability of hGS.
An analysis of low energy frames from MD simulations of G269V provide insight into the
structural changes behind these activity change. Although an MD simulation of free G269V shows
the enzyme maintains the hydrogen bond between the backbone carbonyl of residue 269 and the
amide of Q300, the hydrogen bonds with Q274 and Y275 are disrupted. A compensating hydrogen
bond stretches across the S-loop from the side chain amine of Q274 to the backbone amine of
Y270. Interestingly, the hydrogen bond between Y275 and R283 is lost in both free and γ-GC
bound G269V. The γ-GC bound form of G269V exhibits a disruption of backbone hydrogen bonds
at V269 with Y275 and Q300. Not only is the hydrogen bond between Q274 and the backbone of
residue 269 conserved in G269V, an additional bond between Q274 and the backbone of Y270 is
present, Figure 4.4. MD simulations show the G269V mutation of hGS impacts the structure of
the S-loop through disruptions of hydrogen bonds between the backbone of residue 269 and the
side chains of Q274, Y275, and Q300.
Although γ-GC binds to G269V hGS in a similar orientation to WT, interactions with S149,
N216 and Q220 are disrupted in a low energy MD frame; the substrate does not nestle as tightly
into the pocket. Over the course of a 5 ns MD run of G269V, residues R267 and D268 have average
interaction energies with γ-GC of -172 and -56 kJ/mol, respectively, much stronger than in WT (-
117 and -7 kJ/mol, respectively), Figure 4.2. Interactions with γ-GC at R125 and E214 in G269V
weaken by 39 - 48 kJ/mol, while interactions at S149, S151, N216, Q220, and Y270 are within 12
kJ/mol of WT. Computational models show the G269V mutation has a large impact on γ-GC
binding in hGS.
37

Analysis of low energy frames from MD simulations of Y275 mutants show deviations in
the bonds between residues of the S-loop. With the loss of the Y275 hydroxyl in the free Y275A
and Y275F mutants, the hydrogen bond between residue 275 and G269 is lost. Yet, hydrogen
bonds between the side chain carbonyl of Q274 and the backbone amines of G269 and Y270 are
maintained in Y275 mutants. While the hydrogen bond from G269 to Q300 is disrupted in Y275A,
it remains in Y275F. Larger shifts in S-loop structure are apparent in MD simulations of the γ-GC
bound form of Y275A, Figure 4.4. Without the hydroxyl group of Y275, the hydrogen bond
between G269 and residue 275 is disrupted, as the hydrogen bond from G269 to Q274. Hydrogen
bonds between the Q274 side chain amine and the backbones of Y270 and M271 remain, helping
stabilize the twist in the S-loop. In contrast, the γ-GC bound Y275F mutant exhibits a loss of the
interaction between residue 275 and G269, while retaining three hydrogen bonds from Q274
(backbones of G269, Y270, and M271). In both γ-GC bound Y275 mutants, interactions between
the S-loop and R283 are disrupted, while only Y275A exhibits a disruption of the G269-Q300
hydrogen bond. The bonding network within the S-loop is impacted by mutations to Y275,
especially in the case of the alanine mutant.
Although MD simulations show Y275 mutant enzymes bind γ-GC in orientations similar
to WT hGS, the interaction energies between γ-GC and the active site residues vary (Figure 4.2).
Relative to WT, both Y275A and Y275F exhibit strengthened γ-GC interactions at S151 and E214
by 7 to 12 kJ/mol. Interestingly, interactions with γ-GC at R125 and R267 strengthen by 32 and
58 kJ/mol compared to WT in Y275A. The Y275F mutant has more moderate shifts of 3 to 9
kJ/mol at these same residues. While γ-GC interactions with G370 are ca. -3 kJ/mol in Y275A,
Y275F exhibits much stronger binding of -25 kJ/mol. Mutations to G269 and Y275 impact the
interaction of hGS with γ-GC.
38

Experimental mutation of P272A reveals a marked 94% drop in activity with a kcat of 1.19
s-1. Despite the low activity of P272, a Michaelis constant of 0.06 mM was determined for the
mutant, which is much lower than WT (Km = 1.31 mM). Interestingly, the mutant exhibits a
transition midpoint nearly identical to WT hGS (Tm = 60.8). In the lowest energy frames from the
last ns of a 5 ns of MD runs of free and γ-GC bound P272A, the bend in the S-loop is reinforced
through two new hydrogen bonds from the M271 sulfur to the backbone amines of R273 and Q274,
Figure 4.4. Although the position of γ-GC in the active site of P272A is similar to that in WT hGS,
the interaction energies over the course of a 5 ns MD run vary significantly. The P272 mutant has
average γ-GC interaction energies at S151 and R267 (-80 and -176 kJ/mol) that are 51-58 kJ/mol
stronger than in WT. The P272A mutant also exhibits strengthened interactions at R125, S149,
N216 (10 - 13 kJ/mol stronger than WT), and E214 (30 kJ/mol stronger than WT). In contrast,
interaction between γ-GC and Y270 is weaken by 7 kJ/mol in P272A. Clearly, the P272A mutation
has a large impact on the activity and binding properties of hGS.
4.2.6 Allosteric Modulation in the S-loop
WT hGS is negatively cooperative with respect to the γ-GC substrate with a Hill coefficient
of 0.69 (Table 4.2).3 Due to insufficient activity, the kinetic parameters of R267A, R267W, G269V
and Y270A could not be determined. In the case of P272A, a Km of 0.06 ± 0.02 mM and Hill
coefficient of 1.02 ± 0.01 were determined from γ-GluABA kinetic assays. While the duplicate
assays from independent purifications have high reproducibility, the low kcat of P272A (1.19 s-1)
could impact the uncertainty of the measured kinetic parameters. Mutations that increased γ-GC
binding affinities (D268E, Y275A and Y275F) have little impact on the cooperativity of hGS (Hill
coefficients of 0.68, 0.73 and 0.70, respectively). Both D268A and Y270A display a slight
decrease in negative cooperativity (Hill coefficients of 0.78). While the Michaelis constant of
39
D268A mirrors that of WT, MD simulations suggest that the mutation significantly increases γ-
GC interactions with R267 and E214, which bind and position γ-GC. In contrast, the decreased
negative cooperativity of Y270A is matched by a decrease in γ-GC binding. Most notably, the
R267K mutation results in a dramatic decrease in γ-GC binding, and is completely noncooperative
(Hill coefficient = 1.03).
4.3 Discussion
The tight curve at the end of the S-loop is maintained by P272 at the top of the loop and a
hydrogen bond between G269 and Y275 stretching across the region. While Y275 mutants exhibit
moderate reductions in activity upon the disruption of a hydrogen bond from G269 to Y275, the
severe reduction in activity in G269V likely results from the loss of an additional hydrogen bond
between G269 and Q274, as well as a general loss in flexibility with mutation from the small
glycine residue. Although the thermal stabilities of Y275 mutants suggest the residue does not
have a large impact on overall structure, G269V exhibits a low transition midpoint that may
indicate a folding problem in the mutant enzyme, which occurs on a longer time scale than can be
feasibly modeled with the conducted MD simulations. According to MD simulations, mutation at
P272A results in a long range impact on γ-GC binding, most notably at R267, which yields a severe
reduction in activity. A large increase in γ-GC binding affinity is coupled with a complete loss of
cooperativity in P272A. The interactions and positions of G269, Y275, and P272 form the tight
curve in the S-loop hGS, which is needed for the enzyme to maintain tertiary structure and properly
bind the negatively cooperative substrate.
Although D268 does not interact directly with γ-GC, the S-loop residue forms hydrogen
bonds with G269 and Q211 that maintain the structure of the active site. Disruption of such
40
interactions in D268 mutants lead to moderate decreases in both activity and thermal stability. The
altered γ-GC binding in D268E and decreased negative cooperativity of D268A indicate the
residue has an indirect role in the activity of hGS through control of active site structure.
Computational models indicate the positively charged guanidyl group of R267 binds and
positions γ-GC, while the aromatic ring and hydroxyl group of Y270 position γ-GC near its peptide
bond. The drastic reductions in the activity of R267A and R267W relative to R267K highlight the
importance of the positive charge of R267 in both mediating the repulsive negative charges
between γ-GC and D219 and the formation of a salt bridge with the substrate. The preserved
aromatic stabilization in Y270F allows for moderate activity not seen in Y270A; without the
aromatic stabilization of Y270, the cysteine moiety of γ-GC is not properly oriented relative to
glycine within the active site. Those mutants with sufficient activity to determine kinetic
parameters show decreased negative cooperativity, with a complete loss of cooperativity in the
case of R267K. With moderate reductions in the thermal stabilities, the changes activity and
allostery exhibited by R267 and Y270 mutants are likely the result of disrupted γ-GC binding by
these residues, rather than an overall denaturation of the enzyme.
The extensive experimental and computational research on the S-loop of hGS presented
here provides insight into patient mutations in hGS: Y270C, Y270H and R267W. The dramatic
reduction in GSH production expected from the disruption of interactions with γ-GC at residue
270 may be associated with the hemolytic anemia and metabolic acidosis exhibited by patients
with mutations at Y270 (Y270C and Y270H).6,7 The conservation of an aromatic interaction with
γ-GC in Y270H and the conservation of the hydrogen bonding capacity through the thiol of Y270C
allows patients with such mutations to maintain a moderate level of hGS activity and thus function
without severe neurological disorders. More dramatically, the extremely low activity of R267W at
41

least partially explains the extremely low GSH levels, psychomotor retardation, and premature
death of the patient with an R267W/D469E mutation.6,7 Of all the substrate binding residues in
hGS, R267 is perhaps the most important, serving to mediate repulsive interactions and bind γ-GC
though both the backbone and side chain.
In our exploration of substrate binding in γ-GC, two new regions stand out as worthy of
further study. The E-loop (A210-N216) stretches from the S-loop to the dimer interface region and
forms a wall of the active site with several residues binding the negatively cooperative substrate.
Similarly, the H-loop (T147-E152) serves as the bottom/back of the active site and also binds γ-
GC, though less tightly. Further exploration of these regions is currently underway in our labs as
we strive to expand our knowledge of substrate binding and allostery in hGS.
Extensive experimental and computational studies determined the role of S-loop residues
responsible for forming the curve of the S-loop (G269, Y275, and P272), maintaining active site
structure (D268), and binding the negatively cooperative substrate (R267 and Y270). Those
mutations that strongly alter γ-GC binding, either directly or indirectly, also impact allosteric
communication in hGS. The crucial role of the S-loop in allosteric communication is directly
linked to the importance of S-loop residues in both active site structure and γ-GC binding.
Residues that form or mediate salt bridges and hydrogen bonds with γ-GC, such as R267,
initiate allosteric communication in hGS in a highly specific manner. In contrast, allosteric
communication at the dimer interface of hGS occurs through hydrophobic interactions, such as
those at V44 and V45, as shown in previous work by our groups.4 Insights gained through the
study of negative cooperativity in hGS can be applied to a wider range of allosteric communication.
It can be posited that residues with strong substrate interactions serve to activate allosteric
communication at binding sites, while more flexible weak interactions modulate allostery at
42

protein-protein interfaces. The types of residues that modulate allosteric communication vary
depending on position within the protein in order to permit a wide variety of structural
conformation while ensuring sensitivity to substrate.
4.4 Funding and Acknowledgements
This work was supported by the National Institute of Health (NIH) Grant R15GM086833
(MEA), a UNT Faculty Research Grand (TRC), and a TWU Research Enhancement Grant (MEA).
The authors would like to thank Stacey Grigar, Jodi Johnston, Perla González, and Aisha Chughtai
for technical assistance. Much appreciation also goes out to Richard Sheardy for assistance with
DSC instrumentation. The authors would also like to thank the Chemical Computing Group for
the MOE software.
4.4 References
1. Oppenhiemer, L.; Wellnew, V.P.; Griffith, O.W.; Alton, M. J. Biol. Chem., 1979, 254, 5184-5190.
2. Luo, J.L.; Huang, C.S.; Babauglu, K.; Anderson, M.E. Biochem. Biophys. Res. Comm., 2000, 275, 577-581.
3. De Jesus, M.C.; Ingle, B.L.; Barakat, K.A.; Shrestha, B., Slavens, K.D.; Cundari, T.R.;
Anderson, M. E. Protein J., 2014, 33, 403-409.
4. Slavens, K.D.; Brown, T.R.; Barakat, K.A.; Cundari, T.R.; Anderson, M.E. Biochem. Biophys. Res. Comm., 2011, 410, 597-601.
5. Dinescu, A.; Anderson, M.E.; Cundari, T.R. Biochem. Biophys. Res. Comm., 2007, 353, 450-
456.
6. Ristoff, E.; Mayatepek, E.; Larsson, A. J. Pediatr., 2001, 139, 79-84.
7. Dahl, N.; Pigg, M.; Ristoff, E.; Gali, R.; Carlsson, B.; Mannervik, B.; Larsson, A.; Board, P. Hum. Mol. Gen., 1997, 6, 1147-1152.
43

8. Polekhina, G.; Board, P.G.; Gali, R.R.; Rossjohn, J.; Parker, M.W. EMBO J., 1999, 18, 3204-3213.
44

CHAPTER 5
ALLOSTERIC COMMUNICATION ACROSS REGIONS
5.1 Introduction
Human glutathione synthetase (hGS) is a negatively cooperative homodimeric enzyme.1,2
The binding of γ-glutamylcysteine (γ-GC) triggers a decrease in activity at the second active site
with allosteric communication between the two regions spanning over 40 Å.3 Within the active
sites of hGS, residues that strongly impact γ-GC binding also regulate cooperativity. In contrast,
those residues with weak hydrophobic interactions across the dimer interface of hGS mediate
allostery.4 However, those residues responsible for the communication between the polar residues
of the active site and hydrophobic residues of the protein interface remain a mystery.
The E-loop of hGS is comprised of a series of residues that stretch from the active site to
near the protein-protein interface (A210-Q211-E212-K213-E214-R215-N216), Figure 5.1. In the
crystal structure of hGS (2HGS) a few E-loop residues form hydrogen bonds and/or salt bridges
with the negatively cooperative substrate.3 The proximity of the loop to amino acids associated
with allosteric communication in hGS in both active sites and the dimer region suggests the E-loop
may have a role in allosteric communication.
In the presented research, bioinformatics and molecular dynamics simulations were used
to select several residues worthy of investigation due to conservation and position within the
enzyme: namely Q211, E214, R215, and N216. Mutagenesis and subsequent experimental activity
assays reveal the role of these residues in the activity, binding and allostery of hGS. The
comprehensive experimental and computational study broadens our knowledge of allostery and
substrate binding in hGS by exploring a region that bridges the substrate binding sites and the
protein-protein (dimer) interface.
45

Figure 5.1 Dimeric hGS with the E-loop shown as a yellow ribbon. Residues previously shown to modulate allosteric communication are shown with ball-and-stick, while glutathione is in space-filling. Active sites are the gray-blue-red surfaces.
5.2 Computational Analysis of the E-loop
5.2.1 Sequence Analysis of the E-loop of hGS
All E-loop residues have fairly high identity and charge conservation in mammalian
glutathione synthetase (Table 5.1). Among a wider range of higher eukaryotes (all known plants
and animal glutathione synthetase sequences), four E-loop residues exhibit above average identity
conservation: Q211, E214, R215, and N216. The identity conservation of these residues in both
eukaryotes and mammals is consistent with that of residues within the dimer region and the S-
loop, two regions which have crucial roles in the activity, allostery and structure of hGS. Due to
their remarkable sequence conservation, the E-loop residues Q211, E214, R215, and N216 were
selected for further computational and experimental study.
46

Table 5.1 Sequence conservation of E-loop residues in hGS. Higher Eukaryotes Mammals
Residue Identity Cons. Charge Cons. Identity Cons. Charge Cons.
A210 18.3 69.5 71.4 71.4
Q211 48.8 51.2 71.4 71.4
E212 19.5 35.4 71.4 71.4
K213 18.3 18.3 71.4 71.4
E214 50.0 50.0 71.4 71.4
R215 54.9 54.9 71.4 71.4
N216 64.6 79.3 66.7 76.2
Average* 42.6 60.3 70.5 76.0
Std Dev* 18.2 19.8 17.3 11.2 *Average and standard deviation of all amino acids in sequence relative to hGS. Cons. = conservation
Figure 5.2 Important bonding within and near the E-loop of WT hGS. The backbone of Chain A is in blue, while the backbone of Chain B is in pink. All labeled residues are on Chain A.
47

5.2.2 The E-loop WT hGS
A 10 ns MD simulation of WT hGS implies two residues within the E-loop (E214 and
N216) have a strong role in binding the negatively cooperative γ-GC substrate (Figure 5.2). The
terminal carboxyl group of E214 forms a hydrogen bond with the glutamyl α-amine of γ-GC as
well as the backbone amide of N216. The side chain amide of N216 also binds the γ-GC substrate
through a hydrogen bond with the glutamyl α-carboxyl. These bonds with γ-GC are reflected in
average interaction energies of E214 and N216 with γ-GC of 67 and 37 kJ/mol, respectively.
According to the MD simulation, E214 and N216 have the 3rd and 5th strongest interaction with γ-
GC, after R125, R267, and Q220, indicating E214 and N216 have a substantial role in substrate
binding (Figure 5.3, Table A.3).
In contrast, Q211 and R215 do not bond with γ-GC, but instead form hydrogen bonds with
D268 and R34, residues in regions that are known to modulate allosteric communication. At the
top of the active site, the amide of Q211 hydrogen bonds to the terminal carboxyl of D268, a
residue previously shown to have large role in the active site structure and allostery of hGS, as
shown in Chapter 4. Stretching in the opposite direction, side chain guanidyl group of R215 bonds
with backbone carbonyl of R34, a residue near the dimer interface. Of the more than ~ 25 Å
between the residues modulating allostery at active sites and dimer interfaces, the bonds with E-
loop residues Q211 and R215 span ~ 15 Å of this “gap” (Figure 5.2).
48
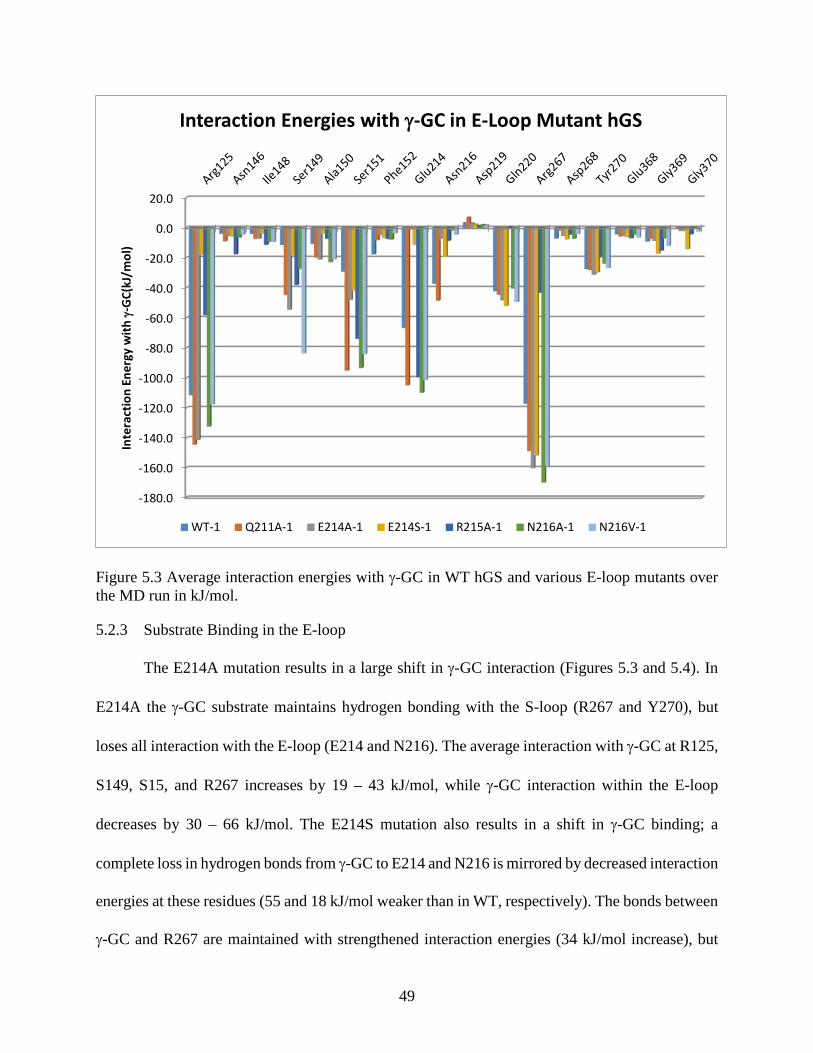
Figure 5.3 Average interaction energies with γ-GC in WT hGS and various E-loop mutants over the MD run in kJ/mol.
5.2.3 Substrate Binding in the E-loop
The E214A mutation results in a large shift in γ-GC interaction (Figures 5.3 and 5.4). In
E214A the γ-GC substrate maintains hydrogen bonding with the S-loop (R267 and Y270), but
loses all interaction with the E-loop (E214 and N216). The average interaction with γ-GC at R125,
S149, S15, and R267 increases by 19 – 43 kJ/mol, while γ-GC interaction within the E-loop
decreases by 30 – 66 kJ/mol. The E214S mutation also results in a shift in γ-GC binding; a
complete loss in hydrogen bonds from γ-GC to E214 and N216 is mirrored by decreased interaction
energies at these residues (55 and 18 kJ/mol weaker than in WT, respectively). The bonds between
γ-GC and R267 are maintained with strengthened interaction energies (34 kJ/mol increase), but
-180.0
-160.0
-140.0
-120.0
-100.0
-80.0
-60.0
-40.0
-20.0
0.0
20.0
Inte
ract
ion
Ener
gy w
ith γ
-GC(
kJ/m
ol)
Interaction Energies with γ-GC in E-Loop Mutant hGS
WT-1 Q211A-1 E214A-1 E214S-1 R215A-1 N216A-1 N216V-1
49

interaction at R125 decrease by 94 kJ/mol. Despite these large shifts in γ-GC binding, both E214
mutants maintain the cross-region bonds at Q211 and R215.
Figure 5.4 Important bonding within and near the E-loop of hGS in (a) E214A, (b) E214S, (c) N216A, and (d) N216V.
To a lesser extent, mutation to N216 also disrupts γ-GC binding in hGS (Figures 5.3 and
5.4). In both N216 mutants, bonds with E214 and R267 are maintained, while the hydrogen bond
with residue 216 is lost. The corresponding γ-GC interaction energies with E214 and R267 increase
by 32 - 53 kJ/mol, and decrease by 32 - 36 kJ/mol at residue 216. In the N216A mutant γ-GC
interaction at R125 increases by 21 kJ/mol, while N216V exhibits a 72 kJ/mol increase in γ-GC
interaction at S149. An additional hydrogen bond from the backbone of R215 to the guanidyl of
R34 is formed in both N216 mutants. While the hydrogen bond between Q211 and D268 is
50

conserved in the N216V, the interaction is lost in N216A. Computational models show that γ-GC
binding is altered in both N216 mutants, but the N216A mutation also incurs the loss of interaction
between the E-loop and S-loop.
5.2.4 Cross-Region Bonding from the E-loop
Relative to WT hGS, the Q211A mutant enzyme exhibits altered γ-GC binding and a loss
of interactions between active site residues (Figures 5.3 and 5.5). As expected, the mutation from
a large polar side chain to a small non-polar side chain at residue 211 disrupts the hydrogen bond
of this residue with D268. As with the N216 mutants an additional hydrogen bond forms between
R34 and R215. Interestingly, γ-GC binding is also altered. Mutant Q211A enzyme displays an
additional hydrogen bond between γ-GC and E214, while maintaining hydrogen bonds from γ-GC
to N216 and R267. The average interaction energies with γ-GC at E214 and R267 strengthen by
31 - 38 kJ/mol upon mutation of residues 211 from Q to A. Interaction between γ-GC and residues
at the bottom of the active site, S149 and S151, also increase by 33 and 66 kJ/mo, respectively.
Additionally, γ-GC interaction with R125 rises by 33 kJ/mol. Therefore, the Q211A mutation alters
hydrogen bonding within the active site, but results in an overall strengthening of γ-GC binding.
In R215A, interactions between the E-loop and R34 are disrupted, and γ-GC does not nestle
as deeply into the pocket (Figures 5.3 and 5.5). Mutation at R215 prevents not only the bond
between residue 215 and R34, but also the hydrogen bond between active site residues Q211 and
D268. Binding of γ-GC also shifts in R215A, such that hydrogen bonds from γ-GC to R125, N216,
and R267 are lost. Average interaction energies between γ-GC and these residues weaken by 29 -
74 kJ/mol. An additional hydrogen bond forms from the carboxyl of E214 to the glutamyl α-amine
of γ-GC, which corresponds to a 33 kJ/mol increase in interaction energy. Near the E-loop, Q220
exhibits a weakened interaction with γ-GC by 43 kJ/mol. Interactions from γ-GC to S149 and S151
51

at the bottom of the active site increase by 27 and 45 kJ/mol, respectively. Computational models
show that the R215A mutation has a long distance impact on both active site structure and γ-GC
binding.
Figure 5.5 Important bonding within and near the E-loop of hGS in (a) Q211A, and (b) R215A.
5.3 Experimental Analysis of the E-loop
Experimental point mutations to the E-loop of hGS result in enzymes with decreased
activity, and altered γ-GC affinity (Table 5.2). Mutation to E214 yields a 37 – 40% drop in activity.
While the E214A mutant enzyme exhibits a Michaelis constant similar to WT, the E214S mutant
has large increase in γ-GC binding affinity (Km = 1.4 and 0.5 mM, respectively). A 42% decrease
in activity in R215A is accompanied by an increase in γ-GC binding affinity (Km = 0.2 mM). In
contrast, N216A displays a decrease in γ-GC affinity (Km = 4.4 mM) with comparable 44%
reduction in activity. While all of the purified E-loop mutants exhibit moderate activity (56 - 63%
of WT), changes in substrate binding vary across the mutants. Further work is currently underway
to purify and assay two additional E-loop mutants: Q211A and N216V.
52

Table 5.2. Experimental activity and kinetic parameters of E-loop mutants.
Enzyme* kcat (s-1) Km (mM) keff (s-1 M-1) Hill Coef.
WT** 18.2 ± 2.0 1.31 ± 0.13 1.4 x 10⁴ 0.69 ± 0.03
E214A‡ 11.4 ± 0.6 1.4 ± 0.1 8.2 x 10³ 0.56 ± 0.04
E214S 10.9 ± 0.3 0.5 ± 0.1 2.2 x 10⁴ 0.91 ± 0.01
R215A‡† 10.5 0.2 5.3 x 10⁴ 0.84
N216A 10.2 ± 1.6 4.4 ± 0.3 2.3 x 10³ 0.59 ± 0.07 *Data from 2 - 3 independent purifications, with duplicate assays on each. **As published in our previous work.4 †Data from single purification with duplicate assays. ‡Purified by Myra Davis and Jose Gonzalez
Allosteric communication in altered in experimental E-loop mutant enzymes. Mutations to
E214 have the most drastic impacts on the negative cooperativity of hGS. Compared to the WT
hGS enzyme (Hill coefficient of 0.69), the E214A mutant exhibits nearly complete negative
cooperativity (single subunit active at a time) with a Hill coefficient of 0.56. In contrast, the E214S
mutant demonstrates only a slight negative cooperativity (Hill coefficient = 0.91). In R215A, there
is a less drastic, yet still significant, drop in negative cooperativity with a Hill coefficient of 0.84.
Finally, the N216A mutant has an escalated negative cooperativity (Hill coefficient = 0.59). Taken
together, these findings show that mutations to the E-loop have a large impact on the allostery of
hGS, a finding predicted by MD simulations.
5.4 Discussion of E-loop
Within the E-loop of hGS, two highly conserved active site residues bind γ-GC: E214 and
N216. The low activity of E214 mutants corresponds with the loss of hydrogen bond from the
carboxyl of E214 to the glutamyl α-amine of γ-GC seen in MD simulations. Despite a difference
in γ-GC binding orientation, E214A maintains a similar Michaelis constant to WT hGS, which
may be due to a strengthened γ-GC interaction energy with the S-loop and the bottom of the active
site that compensates for the weakened E-loop interaction. These compensating interactions are
53

much lower in E214S, a mutant with a large increase in experimental in γ-GC binding. Similarly,
the decreased activity and altered γ-GC binding in N216A may be explained by disruption of the
hydrogen bond between the amide of N216 and the glutamyl α-carboxyl of γ-GC, as well as a
general shift in γ-GC position within the active site from the E-loop towards the S-loop.
Computational models suggest these changes may be heightened in N216V, which is currently
under experimental investigation in the Anderson lab at Texas Woman’s University. The aggregate
of simulations and experiments confirms that both E214 and N216 have large roles in binding the
negatively cooperative γ-GC substrate.
The E-loop not only forms a wall of the active site near the S-loop, but also stretches
towards the protein interface; the highly conserved Q211 and R215 form hydrogen bonds with
these neighboring regions. The computational models of Q211 show that the residue has a large
impact on both bonding between the walls of the active site and the binding of γ-GC. Thus,
experimental work is currently underway to elucidate the implications for the Q211A mutation in
terms of activity and allostery. An experimental point mutation of R215A reveals that the residue
has a strong impact on the activity of hGS as well as substrate binding in the enzyme. Models
indicate the R215A mutation disrupts interactions between the E-loop and R34 as well as those
interaction with D268. The resulting shift in active site bonding yields altered γ-GC binding, which
is reflected in the low Michaelis constant of R215, Table 5.2. The hydrogen bonds that Q211 and
R215 form with D268 and R34 serve to properly position the E-loop for binding γ-GC.
Each of the experimental point mutations made within the E-loop yielded enzymes with
altered allostery relative to WT hGS, implying that the region has a crucial role in modulating
negative cooperativity. Alanine mutations of E214 and N216 led to strong increases in negative
cooperativity; the E214S mutant exhibits the opposite shift with a strong decrease in negative
54

cooperativity. The loss of negative cooperativity in R215A mirrors a shift in γ-GC bonding at E214
and N216 within the mutant. Such drastic allosteric changes upon alteration of substrate binding
aligns well with previous work on the S-loop of hGS. Indeed, it confirms the theory put forth in
Chapter 4 that residues with strong electrostatic interactions at binding sites serves a highly
specific triggers for allosteric communication.
The presented study of the E-loop of hGS serves to bridge the gap in our knowledge of
allosteric communication, while expanding an understanding of substrate binding. Those residues
that strongly impact γ-GC binding, either directly or indirectly, also modulate allosteric
communication. As residues closer to the dimer interface are identified as modulating negative
cooperativity in hGS, it is possible to begin to predict the route of larger allosteric paths across
larger protein systems.
5.5 References
1. Oppenhiemer, L.; Wellnew, V.P.; Griffith, O.W.; Alton, M. J. Biol. Chem., 1979, 254, 5184-5190.
2. Luo, J.L.; Huang, C.S.; Babauglu, K.; Anderson, M.E. Biochem. Biophys. Res. Comm., 2000, 275, 577-581.
3. Polekhina, G.; Board, P.G.; Gali, R.R.; Rossjohn, J.; Parker, M.W. EMBO J., 1999, 18, 3204-3213.
4. Slavens, K.D.; Brown, T.R.; Barakat, K.A.; Cundari, T.R.; Anderson, M.E. Biochem. Biophys. Res. Comm., 2011, 410, 597-601.
55
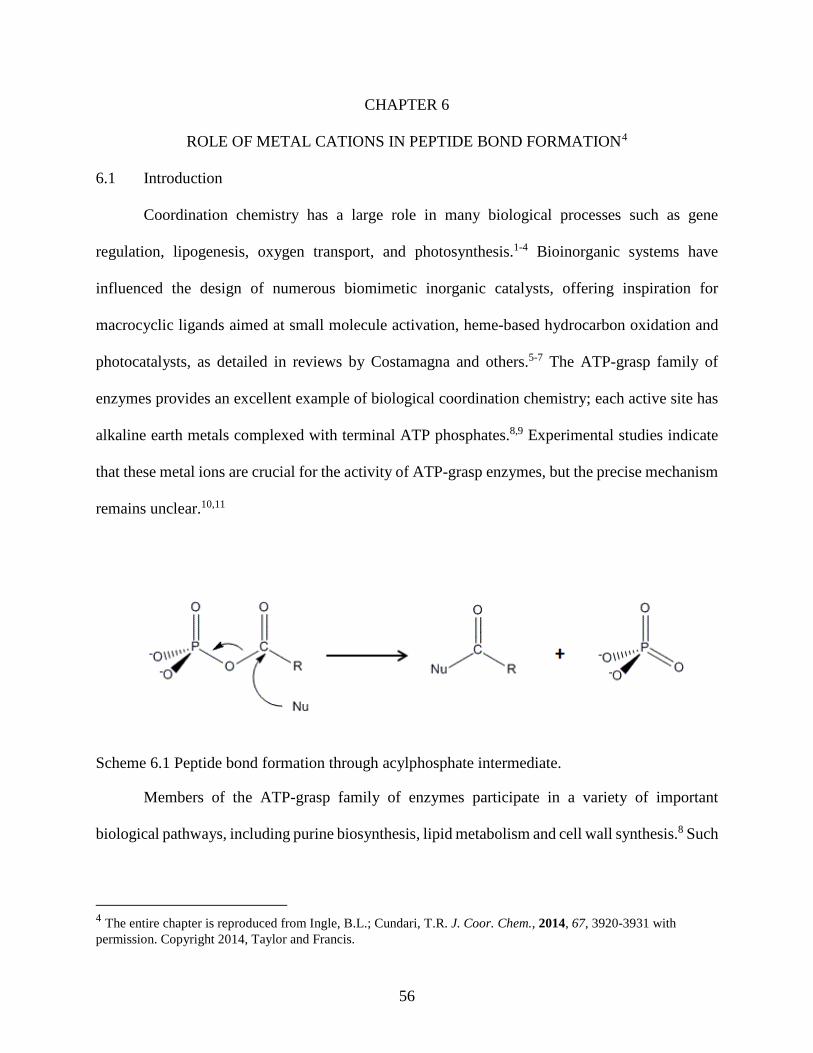
CHAPTER 6
ROLE OF METAL CATIONS IN PEPTIDE BOND FORMATION4
6.1 Introduction
Coordination chemistry has a large role in many biological processes such as gene
regulation, lipogenesis, oxygen transport, and photosynthesis.1-4 Bioinorganic systems have
influenced the design of numerous biomimetic inorganic catalysts, offering inspiration for
macrocyclic ligands aimed at small molecule activation, heme-based hydrocarbon oxidation and
photocatalysts, as detailed in reviews by Costamagna and others.5-7 The ATP-grasp family of
enzymes provides an excellent example of biological coordination chemistry; each active site has
alkaline earth metals complexed with terminal ATP phosphates.8,9 Experimental studies indicate
that these metal ions are crucial for the activity of ATP-grasp enzymes, but the precise mechanism
remains unclear.10,11
Scheme 6.1 Peptide bond formation through acylphosphate intermediate.
Members of the ATP-grasp family of enzymes participate in a variety of important
biological pathways, including purine biosynthesis, lipid metabolism and cell wall synthesis.8 Such
4 The entire chapter is reproduced from Ingle, B.L.; Cundari, T.R. J. Coor. Chem., 2014, 67, 3920-3931 with permission. Copyright 2014, Taylor and Francis.
56

enzymes are increasingly pursued as targets for antibiotics.12-14 However, further investigations
are required to build a deeper understanding of the mechanisms of catalysis in ATP-grasp enzymes.
While all members of the ATP-grasp family of enzymes catalyze the nucleophilic attack of a
carboxylic acid, several form peptide bonds, as in the case of D-alanine-D-alanine ligase and
glutathione synthetase.8,12,15 Named for a characteristic ATP-binding site, ATP-grasp enzymes
couple the cleavage of ATP into ADP and inorganic phosphate with the targeted ligation.16 The
reaction is hypothesized to proceed through the formation of an acylphosphate intermediate, which
then undergoes nucleophilic attack, as shown in Scheme 1.17,18
Most ATP-grasp enzymes have 1 - 3 catalytic Mg2+ ions in the active site; the sole
exception is synapsin Ia, which instead utilizes a single Ca2+.19 Crystal structures of several of
these enzymes show the Mg2+ complexes with the terminal ATP-phosphates, waters and charged
or polar active site residues.20,21 An experimental study of glutathione synthetase found that the
ATP-grasp enzyme requires a divalent cation to function.10 Substitution of the native 12.5 mM
Mg2+ with Mn2+ allowed the enzyme to function at a much lower cation concentration (2.25 mM),
albeit maintaining only 73 % of original activity. Similarly, addition of 5.0 mM Co2+ results in 77
% activity relative to Mg2+. Clearly, the identity of the metal cation can have a significant impact
on the rate of peptide bond formation.
While previous computational studies have probed the role of metal cations in peptide bond
formation, none have accounted for the interaction of the metal with the phosphate moiety of the
acylphosphate intermediate found in ATP-grasp enzymes.22,23 In the presented work, density
functional theory methods are used to model the formation of a peptide bond from an
acylphosphate and an amine. Models of this reaction with eight biologically relevant metal ions
(Mg2+, Ca2+, Mn2+, Fe2+, Co2+, Ni2+, Cu2+ and Zn2+) are used to assess the impact of the divalent
57

metal cation upon the reaction pathway. The trends in reaction barrier across these metals not only
elucidate critical aspects of peptide bond formation in biological systems, but also provide valuable
insight into the role of metal ion identity in catalysis.
6.2 Computational Methods
The Gaussian ’09 software package was used for all calculations.24 The B3LYP hybrid
density functional was used with the 6-311+G(d) basis set.25-28 All calculations were conducted at
1 atm, 298.15 K. Chloroform (ε = 4.7113) was used as solvent to best approximate relatively
“greasy” nature of the binding sites in ATP-grasp enzymes.21,29 All species were modeled as
neutrals, with the exception of the metal free phosphate system (charge of -2). Spin multiplicity
are noted for complexes with multiplicities not equal to 1; the high spin state was computed to be
the ground state for all species investigated. Free energies are reported in kcal mol-1. Optimized
ground and transition state geometries contained zero and one imaginary frequencies, respectively,
in the energy Hessian.
6.3 Results
6.3.1 Metal Free System
A simplified metal free system was used to highlight the importance of a metal cation on
peptide bond formation. Acetic acid served as a generic carboxylic acid, while methylamine was
used as a model for the nucleophile (Figure 6.1). A catalytic water molecule was included in the
transition state to aid in the transfer of a proton from the amine to the hydroxyl of the carboxylic
acid. The reaction was modeled for the product with the methyl groups of acetic acid and
methylamine in both cis and trans dispositions.
58

Figure 6.1 Modeled peptide bond formation in (a) metal free and (b) Mg2+ systems.
Calculations show the trans product is more stable, a finding consistent with the preference
for trans conformations about peptide bonds in nature. The ground states of the cis and trans
products are fairly similar (cis product 2.3 kcal mol-1 higher in energy), and the barrier for the
formation of the cis product is slightly higher than the trans (46.4 versus 45.7 kcal mol-1,
respectively). Therefore, only the trans conformation was considered for the remainder of the
calculations. The transition state for the formation of the trans peptide bond has a planar 6-
membered ring with the carboxyl C, methylamine N and H, water O and H, and finally the acetic
acid hydroxyl O (Figure 6.1). As the peptide bond is formed between acetic acid and methylamine,
a catalytic water shuttles a proton from the amine to the hydroxyl leaving group in an exergonic
reaction (ΔGrxn = -4.5 kcal mol-1).
Inclusion of a negatively charged phosphate group has a large impact on the energetics of
the reaction. The overall reaction remains exergonic (ΔGrxn = -3.5 kcal mol-1). The transition state
no longer requires a catalytic water; instead a six-membered ring forms wherein a phosphate
oxygen accepts the hydrogen directly (Figure 6.1). It follows that the barrier for the reaction is
59
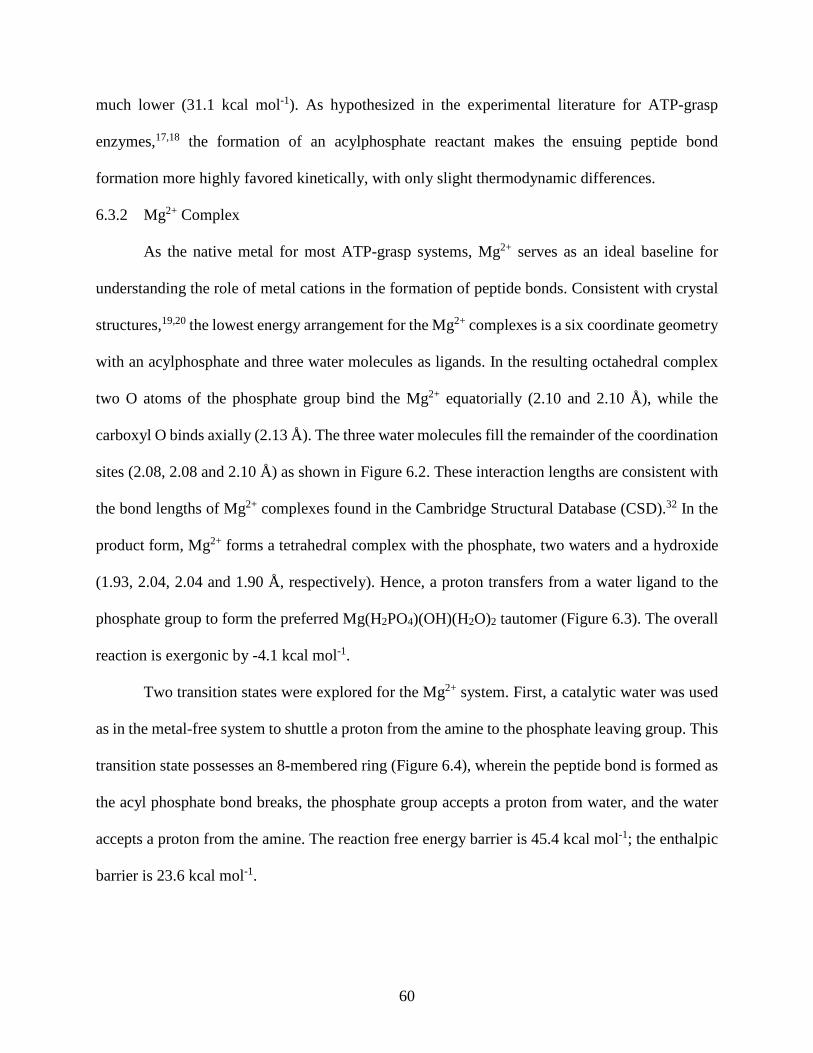
much lower (31.1 kcal mol-1). As hypothesized in the experimental literature for ATP-grasp
enzymes,17,18 the formation of an acylphosphate reactant makes the ensuing peptide bond
formation more highly favored kinetically, with only slight thermodynamic differences.
6.3.2 Mg2+ Complex
As the native metal for most ATP-grasp systems, Mg2+ serves as an ideal baseline for
understanding the role of metal cations in the formation of peptide bonds. Consistent with crystal
structures,19,20 the lowest energy arrangement for the Mg2+ complexes is a six coordinate geometry
with an acylphosphate and three water molecules as ligands. In the resulting octahedral complex
two O atoms of the phosphate group bind the Mg2+ equatorially (2.10 and 2.10 Å), while the
carboxyl O binds axially (2.13 Å). The three water molecules fill the remainder of the coordination
sites (2.08, 2.08 and 2.10 Å) as shown in Figure 6.2. These interaction lengths are consistent with
the bond lengths of Mg2+ complexes found in the Cambridge Structural Database (CSD).32 In the
product form, Mg2+ forms a tetrahedral complex with the phosphate, two waters and a hydroxide
(1.93, 2.04, 2.04 and 1.90 Å, respectively). Hence, a proton transfers from a water ligand to the
phosphate group to form the preferred Mg(H2PO4)(OH)(H2O)2 tautomer (Figure 6.3). The overall
reaction is exergonic by -4.1 kcal mol-1.
Two transition states were explored for the Mg2+ system. First, a catalytic water was used
as in the metal-free system to shuttle a proton from the amine to the phosphate leaving group. This
transition state possesses an 8-membered ring (Figure 6.4), wherein the peptide bond is formed as
the acyl phosphate bond breaks, the phosphate group accepts a proton from water, and the water
accepts a proton from the amine. The reaction free energy barrier is 45.4 kcal mol-1; the enthalpic
barrier is 23.6 kcal mol-1.
60

Figure 6.2 Reactant acylphosphate complexes with (a) Mg2+, (b) Ca2+, (c) Fe2+, (d) and Cu2+.
In contrast, a 6-membered transition state without the catalytic water has a lower free
energy barrier (38.1 kcal mol-1). While the 6-membered transition state has slightly higher
enthalpic barrier (26.4 kcal mol-1) than the 8-membered transition state, the drastic change in
entropy suggests the 6-membered state is preferred. Thus, further calculations on other divalent
metal ions focused on the 6-membered transition state where formation of the peptide bond
between carboxyl C and methylamine N is accompanied by proton transfer to the phosphate and
cleavage of the acylphosphate bond (Figure 6.3). While the computed barriers may seem high upon
61

initial observation, it should be noted that consideration of the enzymatic environment necessary
for the reaction to occur has been neglected. As such, these barriers provide a reasonable
approximation for exploring trends among metal systems.
6.3.3 Ca2+ Complex
The reaction pathway with a Ca2+ complex is remarkably different from the Mg2+ pathway,
even though this cation serves as the native ion for the ATP-grasp enzyme synapsin Ia. As shown
in Figure 6.2, the starting geometry of the acylphosphate Ca2+ complex approximates a distorted
trigonal prism with two O atoms from the phosphate and the carboxyl O forming one trigonal face
and three water molecules forming the other (2.39 - 2.44 Å). The overall reaction is endergonic by
2.2 kcal mol-1. The product Ca2+ complex is a distorted tetrahedral with the phosphate, two waters
and a hydroxide as ligands (2.28, 2.44, 2.41, and 2.18 Å, respectively). As with the Mg2+ complex,
the Ca(H2PO4)(OH)(H2O)2 tautomer is preferred over the Ca(HPO4)(H2O)3 tautomer.
Figure 6.3 Product metal phosphates complexes with (a) Mg2+ and (b) Mn2+.
The transition state for peptide bond formation exhibits a 6-membered ring similar to that
seen with the Mg2+ complex. The reaction barrier for the Ca2+ system (31.1 kcal mol-1) is lower
than that of the Mg2+ and metal-free systems. The lowered barrier relative to Mg2+ may be due in
part to the loose coordination of the acyl O by the Ca2+ in the reactant, which allows the system to
adopt a more favorable orientation with respect to the methylamine (Figure 6.2).
62

Figure 6.4 Transition states for Mg2+ catalyzed synthesis of a peptide bond with (a) 6-membered ring and (b) 8-membered ring with catalytic water. The ring of atoms involved in each transition is shown with dotted black lines. Atom colors are as follows: H is blue, C is yellow, N is purple, O is red, Mg is tan, and P is green. 6.3.4 Mn2+ Complex
Several multiplicities of Mn2+ complexes were modeled. The high spin complexes are
calculated to be 30 to 60 kcal mol-1lower in energy than the quartet and doublet complexes.
Therefore, high spin sextet complexes are the focus of further discussion. The overall reaction
pathway for the sextet Mn2+ system is exergonic by -8.8 kcal mol-1. The reactant acylphosphate
Mn2+ complex is a distorted octahedral with the carboxyl O, bidentate phosphate, and three waters
(2.14 to 2.30 Å). Bond distances are consistent with Mn2+ complexes in the CSD.32 Upon formation
of the peptide bond, square planar Mn2+ with phosphate, a hydroxide, and two waters coordinated
(1.97 to 2.22 Å) acts as the leaving group (Figure 6.3).
Calculations show the reaction proceeds through a 6-membered transition state similar to
that of the Mg2+ system. The free energy barrier for this reaction is 36.1 kcal mol-1. The Mn2+
system has a more favorable reaction pathway than the Mg2+ system in terms of barriers and overall
energetics (Mg2+: ∆Grxn = -4.1 kcal mol-1, ∆Gŧ = 38.1 kcal mol-1). The finding that the Mn2+
pathway is more favorable than the Mg2+ pathway is consistent with the experimental studies of
cation substitution in glutathione synthetase, which found that Mn2+ serves as a more potent ion in
the catalysis of peptide bond formation.10
63
6.3.5 Fe2+ Complex
Of the systems studied, the Fe2+ reaction pathway was the most thermodynamically
favored, with a ΔGrxn of -12.5 kcal mol-1 (Table 6.1). The quintet acylphosphate Fe2+ complex
displays square pyramidal coordination about the metal cation. In the equatorial positions, two
water molecules and bidentate phosphate coordinate around the Fe2+ (2.00 – 2.21 Å). The axial
water molecule forms a hydrogen bond to the carboxyl O as shown in Figure 6.2. The quintet Fe2+
phosphate product is a tetrahedral complex, with two waters, a hydroxide and phosphate
complexed around the metal ion (1.90 – 2.14 Å). Consideration of triplet and singlet spin states
yielded geometries that are 35 - 50 kcal mol-1 higher in energy than the quintet for the Fe2+ models.
The peptide bond transition state for the Fe2+ system mirrors the 6-membered ring of the
Mg2+ model. The barrier for the reaction is 32.6 kcal mol-1. It is hypothesized that the lower barrier
for Fe2+ relative to Mg2+ and Mn2+ systems may be due in part to the lack of interaction between
Fe2+ and the carboxyl O, which would decrease the energy needed to properly orient the
acylphosphate relative towards the amine.
6.3.6 Co2+ Complex
The reactant acylphosphate forms an octahedral complex with the quartet Co2+ cation. The
carboxyl O and a water molecule occupy axial positions (2.14 and 2.14 Å), while a bidentate
phosphate and two waters fill the equatorial sites (2.08 – 2.15 Å). In the product, the phosphate
chelates the quartet Co2+ in mondentate manner, with two waters and a hydroxide filling the other
coordination sites of the tetrahedral-like complex (1.89 – 2.08 Å). The reaction is exergonic by -
7.8 kcal mol-1. Consideration of low spin (doublet) states found structures ~15 kcal mol-1higher in
energy than the corresponding quartets.
64

Table 6.1 Energetics of peptide bond formation in the presence of metal cations. All values are free energies in kcal mol-1. Calculations with B3LPY//6-311+G(d).
System ΔGrxn (B3LYP) ΔGŧ (B3LYP) Metal Free -4.51 45.66
Metal Free PO42- -3.47 31.11
Mg Complex -4.07 38.07 Ca Complex 2.16 31.06 Mn Complex -8.82 36.14 Fe Complex -12.50 32.58 Co Complex -7.78 34.76 Ni Complex 0.04 38.49 Cu Complex -7.28 25.20 Zn Complex -11.67 34.40
The transition state for the Co2+ complex follows the pattern of the other transition metal
complexes. The barrier of 34.8 kcal mol-1 for the Co2+ system is lower than that of the Mg2+ system,
a finding supported by experimental cation substitution studies.10 The barrier to peptide bond
formation is ~3.5 kcal mol-1 lower in the Co2+ system than in the Mg2+, a difference that may
explain the high rates of catalysis at lower Co2+ concentrations shown experimentally. 10
6.3.7 Ni2+ Complex
Calculations indicate that the reaction of a complexed Ni2+ acylphosphate with amine to
form a peptide bond is nearly energetically neutral (ΔGrxn = 0.0 kcal mol-1). The triplet reactant
octahedral Ni2+ complex includes an equatorially coordinated bidentate phosphate, an axially
coordinated carboxyl O and three water molecules (2.08 – 2.10 Å). Among all the metal ions
studied, Ni2+ has the shortest bond to the carboxyl O (2.09 Å). In the product form, a monodentate
phosphate binds a triplet Ni2+ with two waters and a hydroxide in a tetrahedral complex (1.89 –
2.05 Å). Singlet ground states are 10 to 15 kcal mol-1 higher in energy than the triplet states and
thus were deemed chemically irrelevant.
The free energy barrier for the Ni2+ mediated peptide bond formation is 38.5 kcal mol-1,
the highest among all the metal systems studied. As with other metals, the transition state adopts
65

a 6-membered ring for the formation of the peptide bond. Overall, peptide bond formation in the
presence of Ni2+ is computed to be the least favored both thermodynamically and kinetically
among the metal systems studied, perhaps in part due to the tight carboxyl coordination.
6.3.8 Cu2+ Complex
The square planar doublet Cu2+ acylphosphate complex contains two waters and a bidentate
phosphate (2.02, 2.00, 2.00 and 1.98 Å). The carboxyl group is directly above the Cu2+ at a distance
of 2.51 Å (Figure 6.2). A third water is bound to a coordinated water and phosphate through a
hydrogen bonds. Similarly, the doublet Cu2+ phosphate product is square planar around the Cu2+
with a monodentate phosphate, two waters and a hydroxide (1.89 – 2.08 Å). The reaction is
exergonic by -7.3 kcal mol-1.
As in the previously described systems, the transition state for the formation of the peptide
bond is associated with the simultaneous loss of the acylphosphate bond and the transfer of the
amine hydrogen. The Cu2+ ion in the transition state maintains the same square planar geometry
exhibited by the ground state complexes. A relatively low free energy barrier of 25.2 kcal mol-1
may be associated with the lack of interaction between the metal cation and the carboxyl group, as
the rotated carboxyl group is the sterically favored conformation for the association of the amine
preceding peptide bond formation. Of all the metal ions studied, the Cu2+ system has the lowest
barrier by 5.9 kcal mol-1. When coupled with the overall reaction energetics, the simulation
suggests that Cu2+ may be the best cation for catalyzing the reaction, and certainly is an ion that
warrants further experimental scrutiny for ATP-grasp enzyme catalysis of peptide bonds.
6.3.9 Zn2+ Complex
The octahedral Zn2+ reactant complex includes a bidentate phosphate and two waters in
equatorial positions, while a water and carboxyl O coordinate axially (2.11 – 2.19 Å). The product
66

phosphate is complexed through a single O with the tetrahedral Zn2+ with two waters and
hydroxide coordinated (1.90 – 2.12 Å). The reaction is exergonic by -11.7 kcal mol-1.
The transition state for the Zn2+ system mimics that of the Mg2+ system with a 6-membered
ring central to the reaction. The free energy barrier for this reaction (34.4 kcal mol-1) lies in the
middle of the metal systems studied. It is interesting to note that while the ground state geometries
of the Zn2+ system differ from the Fe2+ system, these cations have similar energetics.
6.3.10 Additional Coordination
Interestingly, there is a correlation between the ionic radii of the divalent metal cation and
the ability of the complex to coordinate an additional water molecule. Complexes of larger ions
(Mg2+, Ca2+, Mn2+, and Fe2+) accept a fourth water, which replaces one of the phosphate O atoms,
thus maintaining the geometry about the metal of the tris-aqua reactant complexes (Figure 6.5).
Acylphosphate complexes with smaller ions (Co2+, Ni2+, Cu2+, and Zn2+) do not ligate the
additional water. For each metal system, the tris and tetra aqua systems were within 4 kcal mol-1
of each other. Due to the small energetic differences, only tris-aqua complexes were considered in
order to provide a consistent means of comparison across different metal cations.
Figure 6.5 Reactant acylphosphate Mg2+ complexes studied: (a) tetra-aqua complex, (b) tris-aqua complex, and (c) rotated carboxyl complex.
67

In several of the reactant acylphosphate complexes studied, the carboxyl O binds the metal
cation axially. In the process of the reaction, the O must rotate before the amine can associate and
form the peptide bond. The energetic impact of the coordination was considered by modeling both
the Mg2+ reactant with the carboxyl O bound to Mg2+ and rotated away from the metal (Figure
6.5). The resulting square pyramidal structure is 9.9 kcal mol-1 higher in energy than the bound
form. Therefore, a significant portion of the transition state barrier may arise from the carboxyl
rotation. Consistent with this proposal, the complexes that lack carboxyl O coordination (Fe2+ and
Cu2+) have some of the lowest calculated barriers.
6.4 Discussion
The native metal involved in peptide bond formation in most ATP-grasp enzymes is Mg2+.
Calculations show that reaction of Mg2+ acylphosphate reactant with an amine yields a simple
peptide in an exergonic reaction. Relative to a simple, metal and phosphate free reaction, the Mg2+
system is more thermodynamically and kinetically favored. The calculations also indicate the
reaction pathways of the Mn2+ and Co2+ systems are more favorable than the Mg2+ system, which
correlates with experimental metal substitution studies. 10 Not only are overall reaction free
energies are lower by 3 - 4 kcal mol-1 with Mn2+ and Co2+, but the transition state barriers are also
lower in energy by 2 - 3 kcal mol-1. Despite the neglect of protein environment, the model
presented herein correctly predicts that an acylphosphate reactant in preferred, reactions with Mg2+
are more favorable than those without a metal ion, and more specifically, that Mn2+ and Co2+ serve
as more efficient catalysts than Mg2+. Based on these findings, it is reasonable to assume that the
calculated trends would apply to related biological systems.
68

Consideration of the acylphosphate in metal free systems shows that the addition of the
phosphate group lowers the transition state barrier by ~15 kcal mol-1, without a large impact on
overall reaction thermodynamics. Within the active site of an ATP-grasp protein, the negatively
charged phosphate moiety would likely interact with polar or charged amino acids, thus impacting
the barrier. The resulting dispersion of electron density would decrease the ability of the
acylphosphate to accept the amine H. Therefore, the present simulations suggest that the protein
environment is likely to have a larger impact on the energetics of the metal free acylphosphate
system than any of the other reaction studied, which makes it difficult to draw comparisons to the
metal complexes.
Calculations of the Ca2+ reaction pathway show that while the kinetic barrier is fairly low
(31.1 kcal mol-1), the overall reaction in endergonic. Despite disparate geometries, Fe2+ and Zn2+
exhibit similar energetics in the formation of peptide bonds. Thermodynamically, these reactions
are 3 - 13 kcal mol-1 more exergonic than the other metal systems, and the moderate transition state
barriers are within 2.2 kcal mol-1. Among the metals studied, Ni2+ has the shortest metal-carboxyl
distance and is the least favored. The endothermic overall reaction coupled with the high barrier
makes the Ni system an unlikely choice for catalysis of peptide bonds. In contrast, Cu2+ exhibits a
very favorable reaction pathway. Thermodynamically, the Cu2+ reaction path is exergonic by 7.3
kcal mol-1, which is near the median for the metals studied. With the lowest transition state barrier
by 5.9 kcal mol-1, the Cu2+ system shows a significant kinetic drive to catalyze the reaction.
It seems likely that the ability of the metal cation to accept electron density impacts the
barrier of peptide bond formation. Among six coordinate aqua complexes of the divalent metals
studied, waters associated with octahedral Cu2+ have the lowest pKas.33-37 Perhaps the ability of
Cu2+ to easily accept electron density allows the complex to more easily cleave the bond between
69

the carboxyl C and the phosphate O. The relatively high reduction potential of Cu2+ also supports
the role of the metal in accepting electron density in this reaction.38 Finally, the loose coordination
of the carboxyl O also may contribute to the low barrier in the Cu2+ system. With a relatively low
reaction barrier and favorable thermodynamics, the Cu2+ system warrants further biological study
and offers promise as a potential biomimetic catalyst.
The research presented herein highlights the importance of metal cations in the synthesis
of peptide bonds by ATP-grasp enzymes. Calculations indicate the divalent metal ion complexes
with the acylphosphate to facilitate peptide bond formation. While the identity of the metal ion has
a moderate impact on the thermodynamics of the reaction, the kinetic barriers are highly sensitive
to the metal complex. A survey of several metals found that Mn2+ and Co2+ have more favorable
reaction pathways than Mg2+, as predicted by experiments. Simulations also suggest that Fe2+ and
Zn2+ may be auspicious metals ions. Interestingly, the Cu2+ system seems the most promising
reaction, with a low barrier and exergonic reaction. It seems the ability of metal ions to accept
electron density in the transition state plays a significant role in the catalysis of peptide bonds.
Further research, both computational and experimental, of these metal ions is needed to fully
elucidate the precise mechanism by which ATP-grasp enzymes harness the power of coordination
chemistry to catalyze the synthesis of peptide bonds.
6.5 References
1. Pabo,C.O.; Peisach,E.; Grant, R.A. Annu. Rev. Biochem., 2001, 70, 313-340.
2. Supuran, C.T. Nat. Rev. Drug Discovery, 2008, 7, 168-181.
3. Collman, J.P.; Boulatov, R.; Sunderland, C.J.; Fu. L. Chem. Rev., 2004, 104, 561-588.
4. Rappaport, F.; Diner, B.A. Coord. Chem. Rev., 2008, 252, 259-272.
70
5. Costamagna, J.; Ferraudi, G.; Matsuhiro, B.; Campos-Vallette, M.; Canales, J.; Villagrán, M.; Vargas, J.; Aguirre, M.J. Coord. Chem. Rev., 2000, 196, 125-164.
6. Que Jr., L.; Tolman, W.B. Nature, 2008, 455, 333-340.
7. Rau, S.; Walther, D.; Vos, J.G. Dalton Trans., 2007, 915-919.
8. Fawaz, M.V.; Topper, M.E.; Firestine, S.M. Bioorg. Chem., 2011, 39, 185-191.
9. Wang, W.; Kappock, T.J.; Stubbe, J.; Ealick, S.E. Biochemistry, 1998, 37, 15647-15662.
10. Oppenheimer, L.; Wellner, V.P.; Griffith, O.W.; Meister, A. J. Biol. Chem., 1979, 254, 5184-5190.
11. Ye, D.; Wei, M.; McGuire, M.; Huang, K.; Kapadia, G.; Herzberg, O.; Martin, B.M.; Dunaway-Mariano, D. J. Biol. Chem., 2001, 276, 37630-37639.
12. Triola, G.; Wetzel, S.; Ellinger, B.; Koch, M.A.; Hübel, K.; Rauh, D.; Waldmann, H. Bioorg.
Med. Chem., 2009, 17, 1079-1087.
13. Škedelj, V.; Tomašić, T.; Mašič, L.P.; Zega, A. J. Med. Chem., 2011, 54, 915-929.
14. Halouska, S.; Fenton, R.J.; Zinniel, D.K.; Marshall, D.D.; Barletta, R.G.; Powers, R. J. Proteome Res., 2014, 13, 1065-1076.
15. Dinescu, A.; Cundari, T.R.; Bhansali, V.S.; Anderson, M.E. J. Biol. Chem., 2004, 279, 22412-22421.
16. Murzin, A.G. Curr. Opin. Struc. Biol., 1996, 6, 386-394.
17. Chakravarty, P.K.; Greenlee, W.J.; Parsons, W.H.; Patchett, A.A.; Combs, P.; Roth, A.; Busch, R.D.; Mellin, T.N. J. Med. Chem., 1989, 32, 1886-1890.
18. Eroglu, B.; Powers-Lee, S.G. Arch. Biochem. Biophys., 2002, 407, 1-9.
19. Esser, L.; Wang, C.R.; Hosaka, M.; Smagula, C.S.; Sudhof, T.C.; Deisenhofer, J. EMBO J., 1998, 17, 977-984.
20. Polekhina, G.; Board, P.G.; Gali, R.R.; Rossjohn, J.; Parker, M.W. EMBO J., 1999, 18, 3204-3213.
21. Miller, G.J.; Wilson, M.P.; Majerus, P.W.; Hurley, J.H. Mol. Cell, 2005, 18, 201-212.
22. Remko, M.; Rode, B.M. Chem. Phys. Lett., 2000, 316, 489-494.
23. Remko, M.; Rode. B.M. Struc. Chem., 2004, 15, 223-232.
71

24. Frisch, M.J. et al .Gaussian 09, Revision D.01; Gaussian, Inc., Wallingford, CT 2009.
25. Becke, A.D. Phys. Rev. A, 1998, 38, 3098-3100.
26. Becke, A.D. J. Chem. Phys., 1993, 98, 5648-5652.
27. Stephens, P.J.; Devlin, F.J.; Chabalowski, C.F.; Frisch, M.J. J. Phys. Chem., 1994, 98, 11623-11627.
28. Andersson, M.P.; Uval, P. J. Phys. Chem. A, 2005, 109, 2937-2941.
29. Schutz, C.N.; Warshel, A. Proteins: Struc,. Funct., Genet.,2001, 44, 400-417.
30. Becke, A.D. J. Chem. Phys., 1997, 107, 8554-8560.
31. Grimme, S. J. Comp. Chem., 2006, 27, 1787-1799.
32. Allen, F.H.; Kennard, O. Chem. Des. Autom News, 1993, 8, 130-137.
33. Duffy, J.A.; Ingram, M.D. Inorg. Chem., 1978, 17, 2798-2802.
34. Li, J.; Fisher, C.L.; Chen, J.L.; Bashford, D.; Noodleman, L. Inorg. Chem., 1996, 35, 4694-4702.
35. Grzybkowski, W. Polish J. of Environ. Stud., 2006, 15, 655-663.
36. Gilson, R.; Durrant, M.C. Dalton Trans., 2009, 10223-10230.
37. Biondi, E.; Poudyal, R.R.; Forgy, J.C.; Sawyer, A.W.; Maxwell, A.W.R.; Burke, D.H. Nucleic Acids Res., 2013, 1-12.
38. Bratsch, S.G. J. Phys. Chem. Ref. Data, 1989, 18, 1-21.
72

CHAPTER 7
CONCLUSIONS AND FUTURE DIRECTIONS
7.1 Conclusions and Wider Applications
Key components of the enzymatic activity of hGS have been elucidated though a variety
of computational and experimental techniques. The handful of electrostatic interactions across the
dimer interface have a crucial role in both the tertiary and quaternary structure of the enzyme.
Within the active site, polar and charged residues of the S-loop and E-loop bind and orient the γ-
GC substrate needed for the reaction. Finally, Mg2+ aids in the catalysis of glutathione by chelating
with the terminal ATP phosphate and lowering the kinetic barrier of peptide bond formation. The
comprehensive computational study explains the structural and energetic shifts in hGS that lead to
wider experimental activity changes, which highlights the importance of relatively small
interactions within a biological systems.
The origins of allosteric communication in hGS at both active sites and the dimer interface
have also been delineated. Within the protein interface, allosteric modulation occurs exclusively
through the weak, hydrophobic interactions at V44-V45 rather than the strong electrostatic
interactions across the interface are required for the structural stability of the enzyme. In contrast,
those residues that form strong electrostatic interactions with the negatively cooperative γ-GC
modulate allosteric communication in the active site. Mutations within the S-loop that significantly
altered γ-GC binding at these residues also impacted the negative cooperativity of hGS. Finally,
the E-loop residues R215 was identified as an early step in an allosteric path between the γ-GC
binding site and the protein interface of hGS. The presented work not only shows that allosteric
regulation in hGS occurs through highly specific strong interactions at the active site and weak
73

flexible interactions at the interface, but also begins to trace the mechanisms of allosteric
communication between these regions.
The implications of this research stretch far beyond hGS into wider biological systems.
The groundbreaking work on allosteric communication indicates that the types of residues that
modulate negative cooperativity vary depending on their location within the protein. Therefore, it
is possible to predict important interactions in other proteins within the active site and at protein-
protein interfaces, two regions of great importance in medicinal chemistry. The substrate binding
interactions and key components of quaternary structure explored in hGS can serve as a model for
more complicated systems. At the intersection of inorganic chemistry and biochemistry, the metal
chelation study showed that active site metal cations can have a large impact on the activity of
enzymes and deserve attention in a multitude of biological pathways. Taken together the presented
work lays the groundwork for understanding the atomic level events that mediate enzymatic
activity.
7.2 Future Directions
The presented research on substrate binding and allosteric communication in hGS can be
extended to pinpoint regions of the enzyme that warrant further exploration. Within the E-loop of
hGS, several additional experimental point mutations and subsequent activity assays are currently
underway, including Q211A, R215A, and N216V. The interaction energies between γ-GC and WT
hGS indicate another region warrants further scrutiny: the H-loop (I148-S149-A150-S151-F152).
The H-loop stretches along the bottom of the active site with S149, A150 and S151 forming H-
bonds to γ-GC. Based on the present knowledge of negative cooperativity in hGS, these H-loop
residues can be posited to modulate allosteric communication within the enzyme. Further
74

experimental and computational work on this region is currently underway within the Cundari and
Anderson labs.
A simple DFT study of metal chelation in peptide bond formation can serve as an ideal
start for understanding the role of metal cations in the enzymatic catalysis of ATP-grasp enzymes.
A more comprehensive DFT study could include a larger carboxylic acid and amine, as well as
account for the active site residues involved in metal chelation with simplified amino acid side
chains as ligands. A larger QM/MM study of the natural metal (Mg2+) and promising alternative
transition metals (Fe2+ and Cu2+) in a model ATP-grasp enzyme such as hGS may provide
additional insight into the biological relevance of metal cations. An initial DFT study of peptide
bond formation serves as an ideal stepping stone for further exploration of the mechanisms of
ATP-grasp enzymes by pinpointing promising cations as well as identifying some electronic and
structural features of the reactant structure on the kinetics of the reaction.
75

APPENDIX
ADDITIONAL INFORMATION
76

Figure A.1 Sample of GAB kinetics plot used to determine the Vmax and Km in N216A hGS. Graph made and kinetic parameters determined with Sigma Plot.
77

Figure A.2 Sample Hill plot used to determine the Hill coefficient of N216A hGS. Graph made with Sigma Plot. Hill coefficient is slope of linear portion of the line.
Figure A.3 Sample DSC scan of D268A.
78

Table A.1 Hydrogen bond analysis of wild-type and mutants hGS; bond lengths in Å; bond angles in degrees.
Wild-type D24A Bonded Atoms Type Length Angle Bonded Atoms Type Length Angle Interchain Bonds
D24a S42b HB 2.66 168.5 Interchain Bonds
E43a S46b HB 2.85 157.6 D24a R221b SB 3.07 148.7 S46a E43b HB 2.72 170.8 D24a R221b HB 3.02 154.5 Intrachain
Bonds R34a S42a HB 3.06 170.8
S42a D24b HB 2.69 176.2 R221a E224a HB 2.74 159.4 S46a E43b HB 2.63 166.8 Q220a R236a HB 2.77 135.5
R221a D24b HB 3.05 143.8 Q220a R236a SB 2.79 151.5 Intrachain Bonds
R34a S42a HB 3.03 128.3 E224a R236a HB 2.82 149.5 R34a S42a SB 2.83 151.7 R34b S42b HB 3.13 137.5 E43a S41a HB 3.37 161.1 R34b S42b HB 3.03 155.5 S46a Y47a HB 2.99 131.8 S41b E43b HB 3.43 169.9
Q220a R236a HB 2.95 162.5 S41b E43b HB 2.65 142.0 Q220a R236a SB 2.71 138.1 Q220b R236b HB 2.93 148.2 E224a R326a HB 2.63 163.9 Q220b R236b SB 2.83 159.0 R34b S42b HB 2.88 150.0 R221b E224b HB 2.94 160.7 R34b S42b SB 3.06 134.0 E224b R236b HB 2.79 149.6 E43b S41b HB 2.56 168.6 S42A
Q220b R236b HB 3.07 142.8 Bonded Atoms Type Length Angle Q220b R236b SB 2.71 160.8 Interchain
Bonds
D24a R221b SB 2.80 139.3 E224b R236b HB 2.91 167.7 D24a R221b HB 2.72 154.5 E224b R221b HB 2.84 149.7 R34a D24b SB 2.96 159.1
R221A S46a A42a HB 2.74 124.0
Bonded Atoms Type Length Angle R221a D24b HB 2.78 156.3 Interchain Bonds
D24a S42b HB 2.67 160.2 R221a D24b SB 2.76 154.4 R34a D42b SB 2.75 147.0 Intrachain
Bonds
T40a T40a HB 2.64 119.0 S42a D24b HB 2.48 157.0 S46a Y47a HB 2.76 130.5 S46a E43b HB 2.95 160.5 Q220a R236a HB 2.80 144.9
Intrachain Bonds
Q220a R236a HB 2.91 135.0 Q220a R236a SB 2.91 139.4 Q220a R236a SB 2.92 149.5 R221a E224a HB 2.70 169.7 E224a R236a HB 2.83 162.2 E224a R236a HB 2.85 143.5 Q220b R236b HB 2.73 159.0 Q220b R236b HB 2.99 154.7 Q220b R236b SB 2.83 136.2 Q220b R236b SB 2.95 146.0 E224b R236b HB 2.83 157.6 R221b E224b HB 3.00 169.7
79

Table A.2 Interaction energy between γ-GC and hGS residues over course of 5-10 ns MD run in WT and S-loop mutants.
Residue WT R267A R267K R267W D268A D268E G269V Y270A Y270F P272A Y275A Y275F
Arg125 -111.5
± 9.0
-99.4 ±
12.4
-130.5 ±
21.8
-113.6 ±
10.5
-143.5 ±
11.0
-115.1 ± 6.4
-71.9 ±
40.0
-72.8 ±
20.9
-135.9 ±
14.6
-124.9 ±
27.8
-143.6 ± 8.1
-108.7 ±
19.6
Asn146 -4.0 ± 2.0
-4.2 ± 2.3
-10.1 ± 3.7
-9.6 ± 4.9
-10.6 ±
11.3
-6.2 ± 2.6
-11.1 ±
14.6
-2.6 ± 3.1
-7.0 ± 4.5
-3.6 ± 5.1
-8.8 ± 5.1
-3.9 ± 4.6
Ile148 -3.9 ± 0.9
-0.7 ± 0.9
-8.6 ± 5.0
-2.2 ± 2.3
-8.6 ± 4.1
-1.4 ± 0.7
-4.3 ± 2.9
-6.7 ± 2.9
-6.0 ± 3.2
-7.6 ± 3.0
-8.1 ± 4.5
-9.7 ± 5.4
Ser149 -11.4
± 6.4
-26.8 ±
15.2
-28.8 ± 4.0
-8.8 ± 4.4
-27.4 ± 3.8
-11.0 ± 7.0
-22.0 ±
16.2
-18.7 ± 8.8
-20.9 ± 5.4
-22.5 ± 9.1
-28.0 ± 4.0
-27.8 ± 4.3
Ala150 -10.8
± 4.8
-1.8 ± 0.6
-24.0 ± 3.3
-1.6 ± 0.6
-23.8 ± 3.3
-1.6 ± 1.0
-1.9 ± 1.0
-6.7 ± 5.2
-13.3 ± 7.5
-12.3 ± 6.0
-22.6 ± 3.3
-23.5 ± 3.2
Ser151 -29.2
± 17.9
-19.2 ± 5.9
-92.1 ± 9.2
-33.4 ±
22.4
-94.2 ±
10.4
-47.7 ± 9.7
-37.1 ±
15.5
-84.4 ±
11.8
-80.4 ±
21.5
-79.9 ±
28.0
-94.3 ± 7.2
-86.9 ±
12.9
Phe152 -17.7
± 3.1
-7.7 ± 5.4
-3.7 ± 1.1
-23.8 ± 4.3
-7.6 ± 4.4
-18.9 ± 3.2
-17.1 ± 4.1
-12.6 ± 4.0
-7.2 ± 5.7
-8.6 ± 5.2
-4.5 ± 1.0
-11.0 ± 4.5
Glu214 -66.6
± 11.2
-33.2 ±
45.0
-104.0 ±
10.7
-24.0 ±
35.6
-107.6 ± 9.0
-1.3 ± 6.8
-18.3 ±
22.3
-109.0 ±
10.9
-93.7 ±
13.9
-96.4 ± 9.1
-105.6 ± 8.6
-102.5 ± 9.5
Arg215 -0.3 ± 0.2
-1.8 ± 0.8
-0.8 ± 0.4
-1.7 ± 1.0
0.8 ± 0.5
-0.4 ± 0.2
-0.5 ± 0.2
-0.1 ± 0.2
-0.3 ± 0.2
-0.2 ± 0.3
-0.3 ± 0.2
0.1 ± 0.5
Asn216 -37.3
± 6.5
-27.6 ±
25.7
-13.7 ±
19.3
-10.4 ±
14.5
-42.2 ±
10.1
-40.2 ± 5.9
-49.5 ± 7.5
-48.2 ± 7.1
-50.4 ± 8.0
-47.6 ± 8.9
-48.4 ± 5.3
-43.2 ±
14.7
Asp219 3.1 ± 1.6
0.8 ± 3.0
10.2 ± 4.3
-0.3 ± 2.9
5.5 ± 2.5
3.8 ± 1.7
6.1 ± 3.0
7.3 ± 2.9
4.8 ± 2.1
3.6 ± 2.2
5.5 ± 1.9
3.0 ± 1.7
Gln220 -42.3
± 7.2
1.6 ±
10.2
-17.4 ±
18.2
-1.6 ± 3.5
-50.3 ± 6.3
-5.1 ± 6.7
-41.4 ±
10.0
-46.4 ± 6.5
-46.9 ± 4.9
-47.9 ± 5.2
-46.2 ± 5.3
-43.1 ±
10.1
Phe266 -0.2 ± 0.1
-0.6 ± 0.5
-0.3 ± 0.1
-0.1 ± 0.0
-0.3 ± 0.1
-0.1 ± 0.1
-0.2 ± 0.1
-0.4 ± 0.2
-0.3 ± 0.1
-0.4 ± 0.1
-0.4 ± 0.1
-0.3 ± 0.1
Arg267 -117.2
± 12.1
-33.9 ± 9.4
-124.8 ±
23.9
-10.3 ±
20.5
-136.6 ± 7.9
-65.7 ±
21.9
-172.1 ± 9.4
-149.7 ±
20.9
-173.6 ± 9.8
-175.7 ± 9.1
-174.9 ± 8.3
-126.2 ±
14.5
Asp268 -7.2 ±
18.8
-4.0 ± 1.4
-6.0 ± 2.4
-0.6 ± 1.8
-0.7 ± 0.2
-0.6 ± 1.0
-55.9 ±
19.7
-5.3 ± 5.2
-13.4 ±
19.5
-7.4 ± 2.4
-5.2 ±
1.9
-1.5 ± 1.5
Gly269 -0.1 ± 0.0
-0.1 ± 0.1
-0.2 ± 0.1
0.0 ± 0.0
-0.2 ± 0.1
0.0 ± 0.0
-0.1 ± 0.1
-0.3 ± 0.1
-0.1 ± 0.1
-0.2 ± 0.1
-0.1 ± 0.1
-0.1 ± 0.1
Tyr270
-27.5 ± 5.8
-13.4 ± 5.8
-34.3 ± 9.8
-16.4 ±
10.7
-25.9 ± 6.2
-21.1 ±
10.6
-17.9 ± 8.1
-3.4 ± 1.1
-6.7 ± 4.9
-21.0 ± 7.9
-17.8 ±
20.9
-29.8 ± 6.6
Met271 -0.5 ± 0.1
-0.6 ± 0.4
-1.1 ± 0.4
-0.2 ± 0.2
-1.9 ± 0.9
-0.4 ± 0.7
-0.9 ± 0.8
-2.4 ± 2.5
-0.8 ± 0.4
-0.6 ± 0.2
-2.8 ± 1.2
-0.6 ± 0.2
Pro272 0.0 ± 0.0
0.0 ± 0.0
0.0 ± 0.0
0.0 ± 0.0
0.0 ± 0.0
0.0 ± 0.0
0.0 ± 0.0
0.0 ± 0.0
0.0 ± 0.0
0.0 ± 0.0
0.0 ± 0.0
0.0 ± 0.0
Arg273 0.0 ± 0.1
0.0 ± 0.1
0.1 ± 0.6
0.0 ± 0.1
-0.1 ± 0.1
3.8 ± 4.1
-1.5 ± 5.1
0.2 ± 1.4
0.0 ± 0.1
0.0 ± 0.0
-0.2 ± 0.6
0.0 ± 0.1
Gln274 0.8 ± 0.9
0.1 ± 0.8
1.8 ± 1.6
1.3 ± 0.7
0.3 ± 0.9
1.4 ± 1.7
1.1 ± 1.2
0.4 ± 2.0
1.0 ± 1.4
1.2 ± 1.3
1.5 ± 1.6
2.4 ± 1.4
80

Tyr275 0.0 ± 0.0
0.0 ± 0.0
0.0 ± 0.0
0.0 ± 0.0
0.0 ± 0.0
0.0 ± 0.0
0.0 ± 0.0
0.0 ± 0.0
0.0 ± 0.0
0.0 ± 0.0
0.0 ± 0.0
0.0 ± 0.0
Ser276 0.0 ±0.0 0.0 ± 0.0
0.0 ± 0.0
0.0 ± 0.0
0.0 ± 0.0
0.0 ± 0.0
0.0 ± 0.0
0.0 ± 0.0
0.0 ± 0.0
0.0 ± 0.0
0.0 ± 0.0
0.0 ± 0.0
Glu368 -4.4 ± 0.9
-0.8 ± 0.4
-4.9 ± 2.2
-1.3 ± 0.6
-4.4 ± 2.1
-27.6 ±
22.7
-2.1 ± 1.6
-6.6 ± 2.5
-5.8 ± 1.7
-5.6 ± 2.1
-1.5 ± 4.5
-4.8 ± 1.8
Gly369 -9.2 ± 2.4
-12.6 ± 4.7
-8.9 ± 3.8
-11.7 ± 5.1
-9.8 ± 4.0
-2.1 ± 1.0
-5.2 ± 4.0
-10.5 ± 4.2
-13.1 ± 4.6
-10.3 ± 7.2
-8.7 ± 4.5
-14.9 ± 5.1
Gly370 -0.8 ± 0.2
-10.9 ± 3.1
-0.5 ± 0.3
-10.2 ± 3.0
-3.2 ± 1.4
-9.3 ± 4.9
-1.3 ± 1.1
-6.1 ± 4.6
-8.3 ±
10.4
-10.1 ±
11.1
-3.4 ± 1.9
-24.8 ± 7.2
*All values in kJ/mol. Standard deviations for full run included.
Table A.3 Interaction energy between γ-GC and hGS residues over course of 5-10 ns MD run in WT and E-loop mutants.
Residue WT Q211A E214A E214S R215A N216A N216V
Arg125 -111.5
± 9.0
-144.4 ±
8.1
-141.1 ±
12.0
-17.9 ±
11.1
-58.1 ±
35.7
-132.4 ±
14.4
-117.6 ±
36.6
Asn146 -4.0 ± 2.0
-9.0 ±
3.6
-5.7 ±
5.6
-5.8 ±
3.6
-17.7 ±
6.7
-6.6 ±
4.1
-4.6 ±
4.3
Ile148 -3.9 ± 0.9
-7.4 ±
4.9
-7.4 ±
4.4
-3.7 ±
2.8
-11.3 ±
3.1
-9.4 ±
5.1
-9.5 ±
3.6
Ser149 -11.4
± 6.4
-44.8 ±
23.6
-54.6 ±
32.0
-18.3 ±
7.8
-38.1 ±
7.4
-27.4 ±
4.8
-83.6 ±
6.8
Ala150 -10.8
± 4.8
-19.8 ±
3.7
-21.2 ±
4.3
-4.0 ±
3.2
-7.4 ±
2.0
-22.9 ±
3.5
-21.0 ±
3.5
Ser151 -29.2
± 17.9
-95.1 ±
7.0
-48.1 ±
17.1
-41.9 ±
36.1
-74.1 ±
6.6
-93.3 ±
8.3
-84.1 ±
7.5
Phe152 -17.7
± 3.1
-8.3 ±
3.5
-5.0 ±
5.2
-6.8 ±
4.1
-7.5 ±
4.3
-7.9 ±
4.1
-3.7 ±
2.0
Glu214 -66.6
± 11.2
-104.9 ±
9.4
-1.1 ±
0.7
-11.2 ±
13.2
-99.6 ±
12.0
-109.8 ±
8.2
-101.4 ±
9.7
Asn216 -37.3
± 6.5
-48.6 ±
5.5
-7.4 ±
21.0
-19.2 ±
18.4
-8.6 ±
5.7
-1.8 ±
1.5
-4.8 ±
1.4
Asp219 3.1 ± 1.6
6.9 ±
2.6
3.0 ±
2.4
2.2 ±
2.1
1.3 ±
0.9
2.0 ±
1.3
1.6 ±
0.8
Gln220 -42.3
± 7.2
-44.6 ±
7.4
-48.3 ±
6.8
-51.9 ±
6.3
0.4 ±
0.9
-40.5 ±
6.6
-49.5 ±
5.4
Arg267 -117.2
± 12.1
-148.6 ±
16.4
-160.2 ±
14.8
-151.6 ±
18.0
-43.2 ±
9.1
-170.0 ±
9.6
-159.0 ±
19.3
Asp268 -7.2 ±
18.8
-1.8 ±
1.4
-5.2 ±
2.4
-7.7 ±
8.0
-4.7 ±
0.7
-7.3 ±
2.8
-4.4 ±
1.9
Tyr270 -27.5
± 5.8
-28.2 ±
7.9
-31.2 ±
6.9
-29.7 ±
10.8
-19.7 ±
4.0
-23.8 ±
5.6
-26.9 ±
7.1
Glu368 -4.4 ±
-5.8 ±
-5.6 ±
-6.3 ±
-7.0 ±
-4.8 ±
-6.6 ±
81

0.9 1.8 1.9 2.5 2.7 2.2 1.6
Gly369 -9.2 ± 2.4
-7.4 ±
3.1
-8.6 ±
3.7
-17.2 ±
8.3
-15.3 ±
6.0
-7.1 ±
2.4
-12.0 ±
2.7
Gly370 -0.8 ± 0.2
-2.1 ±
0.8
-2.2 ±
1.4
-14.3 ±
10.8
-4.4 ±
3.4
-0.6 ±
0.2
-2.5 ±
1.2 *All values in kJ/mol. Standard deviations for full run included.
82


![Computational Organometallic Chemistry (Cundari, Thomas R.) (1st Edition, 2001) [0824704789] (428p)](https://img.pdfslide.us/doc/110x75/55721338497959fc0b91ddd9/computational-organometallic-chemistry-cundari-thomas-r-1st-edition-2001.jpg)