Embed Size (px)
Citation preview

SPIE Vol.6290-02 (2006) If EM fields do not operate on each other, how do we generate and manipulate
laser pulses?
Chandrasekhar Roychoudhuria , DongIk Leeb and Peter Poulosc
aPhysics Department, University of Connecticut, Storrs, CT 06269-5192 [email protected] bDepartment of Chemistry, University of Michigan, Ann Arbor, MI
cManchester Community College, Manchester, CT
Generating or shaping a light pulse requires complete knowledge of all the parameters of the complex pulse amplitude. But they are not directly available to us. Our gathered data is only proportional to the square modulus of the EM fields as reported to us by various detectors (including non-linear processes). These detector responses are “colored” by their unique quantum “preferences”. EM fields are not directly observable to us. They do not operate on (interfere with) each other either. Classical optics recognizes that light beams of different frequencies and of orthogonal polarizations do not “interfere” with each other. The success of Michelson’s Fourier Transform spectrometry relies on this non-interference of different frequencies. Yet, beat signal is a result of simultaneous actions of different frequencies on a fast detector. We are promoting the hypothesis of non-interference of light beams as a generalized principle irrespective of the similarities or dissimilarities of their parameters. All superposition effects can become manifest only when the interacting medium is capable of summing all the induced stimulations simultaneously. Accordingly, an array of CW beams with multiple frequencies cannot create temporal pulses as implied by the time-frequency Fourier theorem in free space or in a medium that does not interact with the fields. Dipole undulations induced by the superposed EM fields within appropriate media are always at the root of creating laser pulses, and this brings conceptual congruence between the processes in generating pulses whether they are due to spiking or mode-locking. To illustrate our position, we present a series of experiments: (i) Simple superposition of three coherent frequencies did not generate mode locking. (ii) A series of ordinary CW He-Ne laser beams can produce mode-lock like current pulses by a high speed detector. (iii) A Q-switched ps diode laser shows 100fs train of autocorrelation spikes but it is not mode locked. Keywords: Mode locking, Q-switching, autocorrelation spikes, superposition principle, non-interference of light
1. Introduction The objective of this paper is to underscore that an understanding of laser pulse generation (or shaping) and analysis should be done with explicit reference to the active properties of the material media (i.e. the material dipoles) that actually generate and process the pulses out of electromagnetic fields (EM). Most current texts and publications [1-5] dealing with the derivation and conceptual explanations for superposition effects due to multiple EM fields assume or imply that the EM fields modify each other and create spatial fringes or temporal pulses by themselves. This is incongruent with our understanding of the interaction of radiation and matter. Both classical physics by the late 1800’s and quantum physics from its inception have always referred to light-matter interaction via dipolar stimulation of the material media. We believe that we are overlooking many valuable details behind the actual physical processes occurring during the generation and detection of spatial fringes and temporal pulses when we physically superpose multiple EM fields on appropriate material media. Focusing on mode-locking physics for this paper, we analytically present the superposition phenomena as simply the summation of an equally spaced periodic set of CW optical frequencies [1-3]:
0 0
12 ( ) 2 2
00
sin( , ) ( )sin
c c
Ni n t i i t i i t i
n
N tE t e e Na t et
0 cπ ν δν φ πν φ πν φπδννπδν
−+ + + +
=
= ≈ ≡∑ (1a)
We have assumed, for convenience, that the amplitudes of all the coherent frequencies are equal to unity and defined as the normalized “carrier envelope” for the resultant modified field; the carrier frequency is( )a t 0ν that is the mean
frequency of the series. The traditional mode-locked optical intensity envelope, the peak normalized to unity, is now given by:
22 2 20( ) (1/ ) ( , ) (1/ )[sin sin ]2I t N E t N N t tν πδν πδν= = (1b)
1

Enforcing the mode locking condition normally implies that the absolute phases of individual modes n cφ φ= = constant. The tacit assumption in Eq.1a and b that optical fields by themselves “interfere” (operate on each other) to create mode lock pulses hides the “visualization” of the physical processes going on inside the intra-cavity saturable absorbers or the Kerr-media [4-5]. They not only enforce the necessary phase condition n cφ φ= = constant, they are also at the root of generating temporal undulation of the optical energy by becoming an oscillatory gate to the EM field energy generated within the laser cavity. In current analysis represented by Eq.1a & b, these physical effects are tacit and not explicit. At this time, a slight digression is necessary. It should be noted that there is an assumption of “incoherence” or more exactly “non-interference” between different optical frequencies that underlies the success of Fourier transform spectroscopy (FTS) established by Michelson as early as 1892 when he published a set of atomic spectral lines and their related characteristics [6]. As we are well aware, recording media like retinal molecules [7] (used quite a lot by Michelson to record his data), photographic plates, and modern slow photo-conducting detectors cannot respond to the cross superposition effects between different optical frequencies. Michelson’s FTS is a ubiquitously used and powerful tool - even today. Our acceptance that different optical frequencies are mutually “incoherent” came to question when Forrester et al. [8] published their work on beat frequency generation by devising a very fast photo-conductive detector and associated electronics taking the cue from radio physics and the responses of LCR circuits. Since then, heterodyne spectroscopy and other detection techniques have rapidly evolved in numerous domains, from LIDAR to high speed Fiber Optics Communications. Thus, it is not the “incoherence” of EM fields that determine a specific superposition effect; rather it is the interaction of the superposed fields jointly with the response of the detecting material with their own quantum characteristics that determine the measured outcome [9]. It is recognized that photo-conductive electron transfer (valence to conduction band) and photo-chemical reactions usually take place within femto or sub-femto seconds. But our detection process for these photon energy induced transformations has yet to reach such high speeds. Now, it is logical to question our assumption that EM fields could ever be characterized as “incoherent” to each other as long as the “carrier envelopes” contain several periods of E-vector undulations. This point is significantly poignant since we never “see” light except through the “eyes” of material detectors (dipole like entities responding either individually or collectively to the EM fields within fs periods). Further, well formed light beams do not “see” each other but rather pass through each other without influencing each other’s original energy distributions. If this were not true, the visual world would have appeared full of chaotic and glittering speckle patterns. Or, the multi-channel signals, we transmit through single mode fibers (using wavelength domain multiplexing), would have become random temporal beats destroying the actual data. This non-interaction between well formed EM beams in the absence of interacting material media is also theoretically appreciated by describing “Photons as Bosons”. Section 2 presents an experiment that demonstrate that simple superposition (with physical beam collinearity) of three CW coherent laser beams does not produce “mode-lock” pulses out of the combined CW beams. Section three presents results of experimental analysis of three CW multi-longitudinal-mode beams. Even though they are not mode locked and slow detectors and high resolution spectrometer tell us that they are running CW, the photo current generated by a fast detector is interpreted by a fast sampling scope (FSS) as “mode-lock-like” undulatory current. Further, the same photo current is analyzed by an electronic spectrum analyzer (ESA) as containing a series of “beat frequencies”,
( / 2 )n n c Lδν = . Thus, properties of detectors and the associated system (combination of hardware and the software) determine what effects due to the superposition of multiple optical frequencies will be displayed. Section 4 presents a very brief summary of the origin of laser pulses as due to the interaction between EM fields and material media dictated by their combined temporal characteristics. Finally, the Section 4 presents the data from a Q-switched diode laser whose autocorrelation trace appears to imply that it has 100fs mode locked train of pulses mixed within a 12ps Q-switch pulse. We present arguments, based on non-interference of light, that these 100fs spikes are produced by the periodic high-visibility (high peak intensity) due to the presence of 32 chip cavity mode carrier frequencies under the 12ps “carrier envelope”.
2. Can coherent optical frequencies produce pulses by themselves? First, we describe a simple experiment that was designed to test whether simple superposition of mutually “coherent” CW laser beams with equally spaced frequencies (with fixed phase relation) can produce a temporal pulse train without the intervention of some interacting medium. Fig.1 shows the experimental arrangement for producing three equally spaced frequencies from a single frequency CW diode laser. Both the undiffracted and diffracted beams through an acousto-optic modulator (AOM) were double passed. The AOM was set to introduce an approximate 2GHz frequency shift. The process gives rise to ν0 and ν0 ± δν. The three beams were combined (superposed) by a set of beam splitters and mirrors into a
2

single collinear beam for further analysis. The optical amplitude envelope and the normalized optical intensity can be derived from Eq.1 assuming N=3:
2
0 00
( , ) exp[ 2 ( ) ] (1 2cos 2 ) exp[ 2 ]c cn
0E t i n t i t i t iν π ν δν φ πδν πν φ=
= + + = +∑ + (2a)
2
2
1 sin 3 1( ) [3 4cos 2 2cos 2 2 ]9 sin 9
tI tt
πδν t tπδν π δνπδν
= = + + (2b)
Our experimental analysis clearly demonstrated that simulated 3-mode “mode-locking” does not work by simple superposition! The fast detection process and the very fast sampling scope with its resident program facilitate the recognition of the fast photo-detector current as simultaneous presence of three equally spaced “modes” (Fig.2b). This may look like mode locking but it is not. This is evident from the experimental results shown in Fig.2a. It shows the output from a high resolution slowly scanning Fabry-Perot spectrometer (FP). It displays all the three frequencies well resolved as CW signal. The GHz detector registering this slowly scanned spectrum did not register any δν/3 = 2/3 GHz temporal signal. If the three frequencies were mode-locked, as implied by Fig.2b and described by Eq.2b, then our optical spectrum should have appeared as a single spectral line at frequency 0ν , whose intensity should have given a “carrier envelope” identical to the one shown in Fig.2b. But instead we still get the original three spectral lines with CW intensity. We do not know of any physical process that allows a pair of parallel beam splitters (that constitute a Fabry-Perot) to restore three CW optical frequencies out of a amplitude modulated single frequency signal [10] given by Eq.2a and b..
M3 L4 ν + δν, ν - δν
M4
L3 Half mirror
Figure 1 – Experimental arrangement to generate three coherent beams of three different frequencies from a single frequency diode laser using an AOM. The beams are then collinearly superposed and analyzed for possible mode-lock behavior.
Fiber
RF spectrum analyzer
Sampling oscilloscope
Fabry-Perot
High-speed detector
Detector
AO frequency shifter δν = 1.77 GHz
M2
M5
M1
M6 M7
L1
Attenuator
L2
Beam splitter L5
ν Diode laser ( ν) Isolator
Oscilloscope
3
0.00E+000 5.00E-010 1.00E-009 1.50E-009 2.00E-009
-0.04
-0.02
0.00
0.02
0.04
0.06
0.08
0.10
Modulation of 3 frequencies by AOM from sigle mode diode laser (637nm)
Inte
nsity
(mV)
Time (sec)
(a) (b) Figure 2 – Results of the collinearly superposed three beams with three different frequencies generated by the setup of Fig.1. 2a shows the spectral display of the three frequencies through a slowly scanning high resolution Fabry-Perot (FP) spectrometer. 2b displays the photo-electric current on a high speed sampling scope (HSS) generated by a high speed photo-detector. We carried out a separate but more refined experiment [11] which further supports and illustrates this point. In that experiment two CW “coherent” beams with two frequencies symmetrically about 1GHz above and below the Rb resonance line were made collinear (perfect superposition) and then passed through a Rb gas tube. We did not register any resonant fluorescence until the frequency of one of the beams was separately tuned to match the Rb resonance line. Superposition of “coherent” CW light beams does not modify their intensity profile or generate a new mean carrier frequency for the E-vector by themselves. Although the mathematics of Fourier’s time-frequency theorem implies a field-field interaction, the real world requires appropriate mediation by interacting material dipoles.
3. Why does a CW gas laser give mode-lock like detector current? It is a common practice for some introductory laser classes to demonstrate mode beating between the longitudinal modes of He-Ne lasers to illustrate the cavity length and laser modes relationship δν = c/2L. If the multiple CW He-Ne modes, defined by 2L = mλ, allowed by the inhomogeneous gain medium [2] are really incoherent (not phase or mode locked) then how is mode beating observed? We have already underscored the notion that collinearly superposed frequencies or longitudinal modes (belonging to the same spatial mode) do not produce intensity modulations. All the longitudinal modes of a non mode-locked He-Ne lasers run CW. Their individual linewidth is quite narrow, in the domain of 100 kHz with a temporal coherence length of about 10 sµ . So, when a broadband and electronically fast photo-detector receives this beam, its molecules collectively get stimulated by all the frequencies simultaneously; this is represented by:
0 0
12 ( ) 2 2
(1) (1) (1)0
sin( ) ( )sin
c c
Ni n t i i t i i t i
n
N tD t e e Na t et
0 cπ ν δν φ πν φ πν φπδνχ χ χπδν
−+ + + +
=
= = ≡∑ (3a)
Where (1)χ is the linear polarizability of the first order for the detector molecules; we have also assumed that this
polarizability is constant for all the stimulating frequencies 0( n )ν δν+ . This undulating stimulation is then converted in a time-rate of energy absorption from the superposed fields, which is then manifested into a time-rate of electron transfer from its valence to the conduction band. These electrons do not carry any more information about the original stimulating E-vector frequencies but produce an undulating “DC” current in an external circuit that provides the right potential difference. When normalized, this energy transfer or the “DC” current can be presented as:
2 2 2 2 2(1)( ) ( ) ( / )[sin sin ]i t D t N N t tχ πδν πδν= = (3b)
4

For mathematical convenience, we have assumed that the individual absolute phases nφ are equal to modulo- 2π . We have studied a number of He-Ne lasers whose cavity lengths were approximately 48cm, 80cm and 200cm. The results are shown in Figures 3, 4 and 5, respectively. For each of these three lasers we have recorded the (i) high resolution optical spectra by our FP, (ii) fast photo-detector current directly displayed by a fast sampling oscilloscope (FSS) and (iii) a beat current analysis of the photocurrent using an electronic spectrum analyzer (ESA). In all these cases, we see that the spectra consist of discrete CW longitudinal modes determined by / 2c Lδν = within the inhomogeneously broadened gain linewidth of about 1.5 GHz for Ne. They are clearly not mode locked but rather running in a discrete set of longitudinal modes and the intensities are CW, not temporally modulating. The direct display of the fast photo-detector current implies mode-lock like behavior of the current. But they are not, this is obvious from the CW spectral lines. The ESA analysis of the photocurrent gives all possible combinations of beat between any pair of modes. Where are these nδν beat lines coming from if the direct current is given by 2 2[sin sin ]N t tπδν πδν ? It is the property of the ESA. The hardware and software is designed to display any undulatory current into a “best” set of possible harmonic frequencies that can reconstruct the original current envelope by Fourier synthesis. The beat currents do fluctuate as the phase of the CW He-Ne laser modes do; but they are sufficiently stable for the ESA time constant to “freeze a snap shot” and choose the best harmonic representation. It is straightforward to derive this harmonic representation from Eq.3a by using and make term by term multiplication between the two series instead of using the directly the analytical form given by the square modulus:
( ) ( )D t D t∗
2 2 1(1) (1)
21
2( ) ( ) ( ) ( ) cos[2 ]
N
pi t D t D t N p p t
N Nχ χ
π δν−
∗
=
= = + −∑ (3c)
2 1(1)2
1
2( ) ( ) cos[2 ]
N
oscp
i t N p p tNχ
π δν−
=
= −∑ (3d)
Eq.3b and 3c are identical but expressed in different form; they both represent the photo current due to the superposed coherent modes displayed by the FSS. Eq.3d helps us appreciate the ESA display as a discrete set of spikes at intervals pδν . The hardware and software of ESA is designed to present an undulatory current (AC-coupling of the undulatory DC photo current) as a summation of the best possible set of harmonics. The time constant of the photo-electron transfer is in the domain of a fs or less. The phase nφ of the individual mode is stable over periods of 10-5 seconds. This is at least about 10 orders of magnitude longer than the photo-excitation time constant. Thus, as far as the photo-detector molecules are concerned, the He-Ne modes are highly “coherent” (phase stable); the drift only occasionally gives rise to shifts in the rate of electron transfer (or the phase of the resultant electric current). In fact, this conclusion can be drawn from the FSS display of the 5-mode current. Surprisingly, the FSS display for the 20 mode photo-current shows remarkably sharp temporal pulses that can be captured at times. Thus, one can conclude that properties of the detecting materials and their time constant, coupled with the hardware and software characteristics of the detector system, display the characteristics of the superposed laser modes as they “see” it; not what the fields are in reality. Beams of different frequencies do not modulate themselves in the absence of interacting materials.
5

(a) (b)
5´ 10 - 1 0 1´ 10 - 9 1.5 ´ 10 - 9 2´ 10 - 9 2.5 ´ 10 - 9 3´ 10 - 9
10
20
30
40
0 .00 E +0 00 2 . 00E -0 0 9 4 . 0 0 E -00 9 6 .0 0 E -00 9 8 . 00E -009 1 .0 0E -0 0 8 1 . 2 0E -00 8-0 .4
-0 .2
0 .0
0 .2
0 .4
0 .6
0 .8
M o d u la t io n o f 4 8 c m H e N e L a s e r
Inte
nsi
ty (
volt
)
T i m e (se c ) (c) (d) Figure 3 – Behavior of a multi-frequency CW He-Ne laser beam of cavity length 48 cm. 3a is the spectral display of the laser modes by a slowly scanning FP; three strong and two weak modes are visible. 3b is a computer simulation of the E-field of the three coherently superposed modes. 3c is the actual display of the photo-electric beat current by a HSS. 3d contains an analysis of the above photo-current by an electronic spectrum analyzer (ESA). The ESA decomposes the periodic current into a “best” set of sinusoidal harmonics. The intervals are multiples of cavity mode spacing δν = c/2L.
(a) (b)
(c) (d)
Figure 4 - Eighty (80) cm. He-Ne cavity beam mode behavior. 4a shows the high resolution spectral display of the modes by a slowly scanning FP. 4b is a computer simulation of 5 coherently superposed frequencies. 4c is the actual display of the photo-electric beat current by a HSS. 4d illustrates the decomposition of the beat current as a “best” set of harmonic currents. The intervals are multiples of cavity mode spacing δν = c/2L.
6
(a)
0 .0 0 E + 0 0 01 .0 0 E -0 0 82 .0 0 E -0 0 83 .0 0 E - 0 0 84 .0 0 E -0 0 85 .0 0 E -0 0 86 .0 0 E - 0 0 8
- 0 .1 0
- 0 .0 8
- 0 .0 6
- 0 .0 4
- 0 .0 2
0 .0 0
0 .0 2
0 .0 4
0 .0 6
0 .0 8
Am
plit
ud
e (
mV
)
T im e ( s e c )
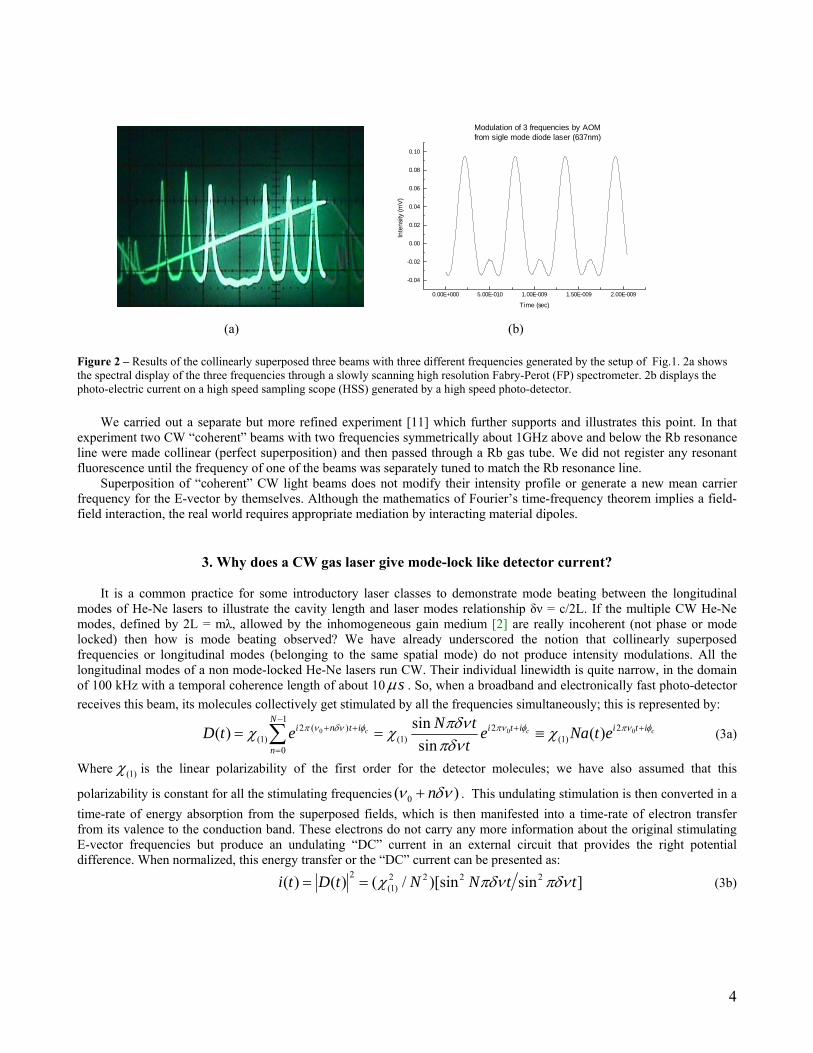
(b) (c) Figure 5 – Two hundred (200) cm He-Ne cavity beam mode behavior. 5a shows the high resolution spectral display of the modes by a slowly scanning FP (with Burleigh software control for very high resolution). 5b is the actual display of the photo-
4. How do Q-switch and mode-lock lasers produce pulses? In this section we will summarize the text book explanations while underscoring that it is the gain manipulation mechanism inherent in the material dipoles that generate various types of pulses. The EM fields simply provide stimulations to other dipoles. Dipoles with the right quantum bands accept these stimulations followed by the energy transfer that is proportional to the square modulus of the sum of all the complex amplitudes that are simultaneously present on them. 4.1 Laser Spiking: The spiking intensity behavior of the first visible Ruby-laser provides the ideal example of the interacting temporal dynamics between the time rate of variation of the pump energy and the population relaxation along with the cavity round trip time. The spiking is very marked in Ruby-lasers because it is a “three level” rather than a “four level” laser system [2] that allows easier sustainability of population inversion. Spiking was rightly recognized from the very beginning as an effect that is mediated by the active medium and the EM fields. 4.2 Q-switching: It was soon recognized that the cavity gain or quality factor (Q) can be changed or modulated with the right time constant for a given cavity round trip time, pump pulse energy rate and duration. Along with the lasing atomic gain dynamics, one can store significant amounts of the pump power over a period of time and then suddenly extract the stored energy in a short burst [2]. Again the Q-switched pulse generation is clearly explained in terms of the dynamics of the material media. 4.3 Mode-locking: Unfortunately, elegant and simple looking equations such as Eq.1 resulted in a paradigm shift. The “explanation” for steady state pulse generation now has become the interference effect between mode-locked (modulo- 2π constant phase) between the allowed laser cavity modes with frequency spacing / 2c Lδν = . We have now started almost ignoring the mediation by materials, their quantum mechanical dipolar behavior and the related linear polarizability factor (1)χ . The pulse train we can generate is also spaced equally in time as dictated by the cavity round trip gain
mechanism with intervals 2 /t L cδ = . We should underscore here that it is possible to impose pulse periods that are
7
higher harmonics of tδ , or even sub-harmonics. However, it is hard to resist from making the analogy of the product of the half-widths of the time-frequency Fourier transform pair of functions; the so called time-frequency uncertainty relation
1tδνδ ≥ . Readers may recognize that any and all mode-locked laser cavities, locked actively or passively [2], must always contain some intra-cavity material that manipulates the round trip stimulated emission gain by virtue of saturable absorption [2], Kerr-focusing [4-5], etc., so that the lasing media can maximize the delivery of the intermittent output power from the continuously stored pump power. Access to the output mirror by the spontaneously emitted photons to maximize their gain through stimulated emission is temporally gated with these intra-cavity devices. The depletion time for the cavity energy provided by pumping and the relaxation time of the intra-cavity “mode-locking” device physics must be compatible with the cavity round trip time to generate the maximum high peak energy. Note that the high energy of the pulse is released during the period when the intra-cavity device gate opens up briefly. All existing photons get amplified to create the high energy during this process of opening the “gate”. It is the physical process of opening the gate that dictates the locking of the phases of the spontaneously emitted opportune photons whose in-phase collaborative stimulation of the saturable absorber (or the Kerr medium) facilitates the opening the “mode locking gate”. Accordingly, the in-phase photons establish the dominant re-circulating EM fields; they are phase-locked only because the lowest total cavity energy that can open the cavity gate has to be in-phase to provide the maximum possible stimulation to the mode-locking-device molecules. In a very high gain medium an enormous amount of spontaneous emission can also open the “mode-locking” gate. When the gate opens, the output will have cavity modes over the entire gain band width even though the medium may be essentially homogeneously broadened. This is essentially the mechanism behind some repetitive Q– switched lasers that are discussed in Section 5 of this paper. Note that a good quality CW diode laser dominantly runs in single cavity mode (frequency).
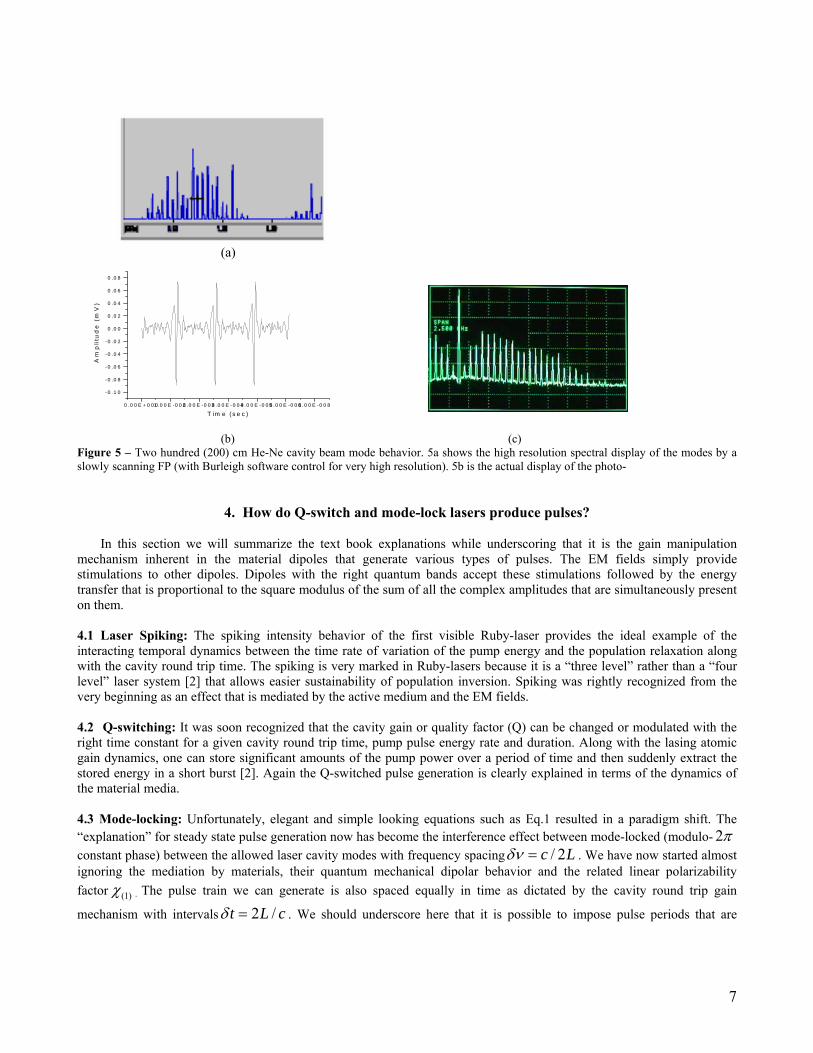
5. Difficulty in drawing unambiguous conclusions about Q-switch diode laser pulses Let us now discuss and analyze the observed results of a Q-switched diode laser pulse. This diode laser had a built-in integrated saturable absorber as shown in Fig.6a. This was accomplished by Nitrogen-ion bombardment on the facet [12]. The time average optical spectrum in Fig.6c shows that there are about 32 chip cavity modes oscillating with mode spacing of δλ = 0.4839 nm, or δν ≈ 200 GHz (199.74 GHz) at λ = 852.5 nm, which implies a round trip time interval of 5 ps. The non-collinear auto-correlation trace of the second harmonic intensity profile shown in Fig.6b indicates the average width of the Q-switched pulse was about 12 ps (Lorentzian fitting). From the spectral record, it is clear that this 12 ps pulse contained all the 32+ spectral lines as carrier frequencies. Also, the pulse width of 12ps implies that the individual spectral fringe width should be about δν = 83.3 GHz (≈ 80 GHz). This suggests that the fringe width should be less than the line spacing of ~ 200 GHz by a factor of two or more, which is borne out by Fig.6c. Let us now pay attention to the interesting features on the autocorrelation trace. It shows a series of sharp spikes at the top of the trace. As shown in Fig.6d, the width of the central spike is about 94 fs. Can we conclusively claim that our laser produced a mixture of a 12ps Q-switched pulse and a train of ~100fs mode-locked pulses spaced by 5ps interval that corresponds exactly to the cavity round trip time? Spiking and phase noises could produce only a central spike due to “coherence” around zero-path delay. But it cannot create a mode-lock-like train of pulses. If 32 spectral modes are perfectly phase-locked, one could generate mode-locked pulses of width ~160 fs (156.25 fs); this is supportable by the total spectral width, ∆λ = 32 * δλ = 15.48 nm. So, 160 fs appears to be a reasonable number if we imagine the extrapolation of the central spike down to the x-axis and then measure the half-width in Fig.6b. However, these fs spikes, if generated by mode locking, should correspond to a broadening only of the central spectral fringe of Fig.6c. Note that the traditional mode-lock concept also implies that the carrier frequency of the mode-lock pulse train must be the mean central frequency only. This would imply that only the central spectral fringe should have been broadened; leaving all the other spectral fringe broadening due to the 12ps Q-switching.. But the central spectral fringe does not show any extra broadening compared to the rest of the other spectral fringes. The total spectral energy content implied by the area under all the fs spikes should have made this extra broadening measurable, but it did not. Now that we have raised some doubt about the presence of mode locking, let us now propose an alternate interpretation. There simply was no fs pulse train contained within the ps pulse or some phase noise with cavity round trip periodicity. The periodic spikes on the auto-correlation trace were generated as stronger than usual second harmonic generation (SHG) signals due to the collaborative stimulation by the “high visibility” (peak intensity) fringes produced by the periodic set of the 32 cavity modes. The significance of this is as follows.
8

-20 -10 0 10 20
Lorentzian fittingcenter:� -0.26 psecFWHM: 24.2 psecpulsewidth: 12.1 psec
τ , psec
single pulse domainpulse Energy: 12 pJ;Rep. Rate: 1 MHz
Al0.06Ga0.94Asactive layer
stripemetal
GaAssubstrate
N+ ion implantation
saturableabsorber
(6a) (6b)
-1.0 -0.5 0.0 0.5 1.0
central spikepulse Energy: 12 pJ;Rep. Rate: 1 MHz
Lorentzian fittingcenter:� -0.06 psecFWHM:� 188 fsecpulsewidth: 94 fsec
τ , psec844 846 848 850 852 854 856 858 860
Inte
nsity
, a.u
.
wavelength, nm
(6c) (6d)
Figure 6 – Analysis of a Q–switched 12 ps diode laser pulse. 6a shows the diode with an amorphized saturable absorber facet. 6b is a non-collinear autocorrelation trace showing 12 ps pulses with a train of narrow spikes. 6c shows the optical spectrum with cavity mode spacing δν ≈ 200GHz. Figure 6d show the width of the narrow spikes to be about 100fs.
9

(a)
844 846 848 850 852 854 856 858 860
Inte
nsity
, a.u
.
wavelength, nm
(b) (c)
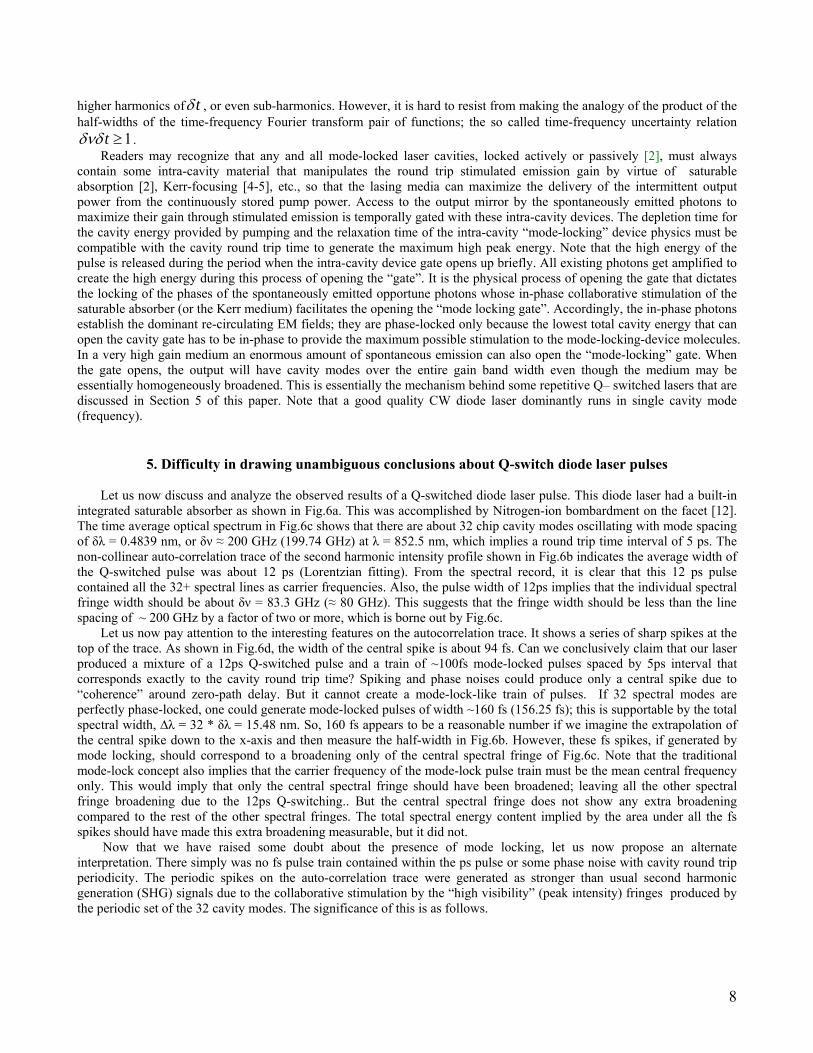
Figure 7 – Computer simulation of the fringe visibility for a pulse with a single and multiple carrier frequencies. (7a) shows the degradation of the fringe visibility for the case of a single carrier frequency. It shows the overall autocorrelation envelope and the fringe qualities for increasing delays between the superposed two pulses. (7b) shows the repetition of the Q-switched diode spectrum (repeated from Fig.6c). 7c is a computer trace of the visibility curve, or peak intensity, when the same Q-switch pulse envelope contains some 32 carrier frequencies as the diode spectrum suggests. 5.1 No mode-locking: We pumped the diode laser with a train of ns current pulses at about one MHz rate. The spontaneous emission lifetime of the electron-hole pairs in the diode junction is in the ns domain. The cavity round trip time of 5 ps and the gain-loss dynamics jointly imposed by the diode and the saturable absorber (≈ 10 ps) conform to the 12 ps Q-switched pulse. The generation of a fs mode-locked pulse train would have required the saturable absorber to possess the capacity to achieve a second and higher level of transparency with a time constant around 50 to 100 fs. We are not aware of any such property of an N-bombarded amorphous facet of a diode laser.
10

5.2 Collaborative SHG generation: In non-collinear autocorrelation SHG signal generation, one normally uses a Mach-Zehnder like setup [1, 3]. The laser pulse is split into two beams and crossed inside a SHG crystal at an angle while the path delay can be accurately and continuously changed. We varied the path delay from τ = -25 ps to +25 ps. It is clear that as we varied τ, all the fringes due to 32 modes became spatially coincident periodically at the center of the two-beam crossing for values of τ at every modulo-5 ps interval (mode spacing). This process creates much higher than average intensity spots accentuating the second harmonic polarizability. Let us first assume that our pulse contained only one carrier frequency. Then the resultant intensity experienced by the nonlinear dipole molecules can be given by:
2 21 2 1 2 1 2 (2)( ) [ ( ) ( ) 2 ( ) ( ) cos 2 ]; ( ) / ; ( ) ( ) i t d t t d t t d t t d t t t t c d t a tπντ τ χ= − + − + − ⋅ − ≡ − = ∆ = (4)
Since we detect time integrated response for each value ofτ , Eq.4 should be integrated over the entire duration of the two partially superposed pulse pair. Then the normalized expression for the energy would be proportional to:
2
0( , ) ( ) 2 [1 ( ) cos 2 ]
T t
plsD i t dt Eδ
ν τ γ>
= = +∫ τ πντ (5)
2 2 2 2(2) 1 (2) 2 (2)( ) ( ) ( ) ( )
T t T ta t t a t t dt a t dt
δ δγ τ χ χ χ
> >= − ⋅ −∫ ∫
( )( )
0 0 (6)
plsE in Eq.5 represents the total pulse energy contained under the “carrier envelope” a t , which is the denominator of
Eq.6. γ τ
V I I I I
is the autocorrelation function for the “carrier envelope”. The peak intensity of the fringes due to this non-collinear superposition of the pulse inside the crystal is given by the “visibility of the fringes” [13]:
max min max min( , ) ( ) /( ) ( )ν τ γ τ= − + = (7) If we now assume that the “carrier envelope” contained M=32 carrier frequencies, instead of just one, then the resultant visibility of the fringes will be modulated by the sum of the fringe intensities due to all the individual frequencies. That is
( )γ τ of Eq.7 should be multiplied by the normalized sum of a periodic set of cosine functions 0cos 2 ( )mπ ν δν τ+sin / sin )M
∑
whose envelope will look like ( πδντ πδντ2 2/ sin )M
. So, the final second harmonic intensity will be the square of the
sum of the visibility of the fundamental frequencies, (sin πδντ πδντ2
as shown in Fig.7c, multiplied by the
square of the “carrier envelope” autocorrelation ( )γ τ . Our measured autocorrelation trace of Fig.6b appears very much like this product.
6. Conclusion We observe the presence of light through light-matter interactions and not light-light interaction. However, we tend to explain many observed phenomena as if they happen as light-light interaction. In doing so, we tend to miss out on the subtleties behind many light-matter interaction phenomena [14, 15]. In this paper we have drawn attention to the physical process behind various levels of laser pulse generation as light-matter interactions. We have highlighted examples of conceptual contradictions and complexities we encounter whenever we try to explain pulsed signals generated by photo-electric and SHG devices as pure light-light or field-field interactions.
Acknowledgements
The data of Fig. 6 and 7 were taken by O. Smolski while working at the University of Connecticut. CR would like to acknowledge some private discussions with N. Stelmakh regarding Section 5 and also partial support for this work from the Nippon Sheet Glass Corporation. We would also like to thank C. Seaver for some assistance in putting together this manuscript.
11

References
1. S. L. Shapiro, Ultrashort light pulses, Springer Verlag (1977). 2. A. Siegman, Lasers, University Science Books (1986). 3. R. Trebino, Frequency resolved optical gating, Kluwer Academic (2000). 4. S. T. Cundiff, J. Ye and J. L. Hall, Rev. Sc. Instrum. 72, .3749-3771 (2001); “Optical frequency synthesis based
on mode locked lasers”. 5. R. Paschotta, Appl. Phys. B 79, 153-162 (2004); “Noise of mode-locked lasers (Part I): numerical model”. 6. M A. Michelson, (i) Phil. Mag. 31, 338-346, Plate VII (1891)."On the Application of Interference-Methods to
Spectroscopic Measurements, I". (ii) Phil. Mag. 34, 280-299, Plates V-VIII (1892), "On the Application of Interference-Methods to Spectroscopic Measurements, II".
7. C. Roychoudhuri and V. Lakshminarayanan , SPIE Proc. 6285, paper #8 (2006), “Role of the retinal detector array in perceiving the superposition effects of light”
8. A. T. Forrester, R. A. Gudmundsen and P. O. Johnson, “Photoelectric mixing of incoherent light”, Phys. Rev. 99 , 1691 (1955).
9. C. Roychoudhuri, Proc. SPIE LASE Conference, Vol. 6108, paper #50 (2006); “Reality of superposition principle and autocorrelation function for short pulses”.
10. C. Roychoudhuri; J. Opt. Soc. Am.; 65 (12), 1418 (1976); "Response of Fabry-Perot Interferometers to Light Pulses of Very Short Duration".
11. DongIk Lee and C. Roychoudhuri., Optics Express 11(8), 944-51, (2003); “Measuring properties of superposed light beams carrying different frequencies”. [http://www.opticsexpress.org/abstract.cfm?URI=OPEX-11-8-944]
12. Device fabricated by Efim Portnoi’s group at the Ioffe Institute, Russia. 13. (i) M. Born and E. Wolf, Principles of Optics, 6th Ed., Cambridge U. Press (1980). (ii) L. Mandel and E. Wolf,
Optical Coherence and Quantum Optics, Cambridge U. Press (1995). 14. C. Roychoudhuri and M. Tayahi, Int. J. of Microwave and Optics Tech., July 2006; "Spectral Super-Resolution
by Understanding Superposition Principle & Detection Processes", manuscript ID# IJMOT-2006-5-46: http://www.ijmot.com/papers/papermain.asp
15. C. Roychoudhuri, Phys.Essays 19 (3), September 2006, to be published, “Locality of superposition principle is dictated by detection processes”.
12