Embed Size (px)
Citation preview

Minimizing Veiling Glare in the High-Luminance-Range Visualization ofMedical Images
Mina Choi†, Joel Wang†, Luigi Albani‡, Aldo Badano†
†Center for Devices and Radiological Health, FDA, Silver Spring, MD. ‡FIMI/BARCO, Saronno, Italy.
AbstractWe propose a method to adjust the luminance mapping ofmedical images on high-dynamic-range (HDR) display devicesthat minimizes perceptual and hardware veiling glare effects.We utilize the DICOM grayscale standard display function tocompute the maximum number of just-noticeable-differences(JND) for an HDR prototype (dual-layer LCD). Using previousfindings, a unique image will be displayed with a front andback LCD panel such that the combined light modulationproduces the most accurate luminance representation of theimage and the least hardware glare. Next, we use an empirical,image-dependent model to analyze regions of interest in theimage that may suffer from perceptual veiling glare andadjust the luminance mapping until a reasonable degradationtolerance for detection thresholds is reached.
1. IntroductionHigh-dynamic-range (HDR) technologies offer larger lumi-nance ranges and bit-depths than conventional displays al-lowing for more information to be presented. However, alimitation to HDR displays is scattered light in the humanvisual system from bright areas in the image that reducethe visible contrast in neighboring areas. This phenomenonis known as veiling glare (VG). Stiles [1] and Holladay [2]introduced the concept of disability glare (see Eq. 1) in termsof the equivalent luminance to the International Commissionon Illuminance (CIE). The equation is as follows:
Leq
Egl=
k
θn, 1 < θ < 30, (1)
where Leq/Egl is the equivalent luminance over the illumi-nance of the glare, θ is the angular distance from the glaresource to the target, and k, n, and C are constants. Additionalstudies have been conducted to increase the validity domainof the model [3] and to include an age factor [4].In our previous work [5], a study was conducted to testcontrast thresholds with varying ring-patterned glare sources.The results were empirically modeled to show a similarrelationship of angular distance from the detection target tothe VG source and illuminance of the VG source to contrastthreshold. We used a model based on Eq. 2 with parameterstabulated in Table I,
From the Division of Imaging and Applied Mathematics, Office of Science and Engineering Laboratories, Center forDevices and Radiological Health, U.S. Food and Drug Administration. 10903 New Hampshire Ave., Building 62, Room3116, Silver Spring, MD 20993, phone 301-796-2534, email [email protected]. The mention of commercialproducts herein is not to be construed as either an actual or implied endorsement of such products by the Department ofHealth and Human Services. This is a contribution of the Food and Drug Administration and is not subject to copyright.
τc(Es, θ) =kEs
θn+ C. (2)
We extended the empirical model (EM) [5] to an image-dependent model (IDM) [6], which predicts contrast detectionthresholds in complex images. Each pixel of the display isconsidered a VG source whose angular distance to the targetand illuminance is assumed to influence detection. The sumof the contributions from each pixel was noted as the absolutecontrast threshold. The IDM is expressed as follows,
τc(x, y) =∑i
∑j
∆τ(i, j) + τ0, (3)
where ∆τ is the increase in contrast threshold from each pixel(i, j) depending on the pixel illuminance and angular distanceto the detection target (x, y), and τ0, is the contrast detectionthreshold when no VG source is present. In our model, ∆τ iscalculated as,
∆τ(i, j) =kEs(i, j)
θ(i, j)n, (4)
where k and n are empirical constants known to depend onbackground level. The sum over all image pixels of ∆τ(i, j)determines the total increase in the contrast threshold due toveiling glare.In order to determine the constants (k, τ0, and n) for theIDM, we analyzed the experimental trial images of the EMstudy with known backgrounds and interpolated points linearlybetween the parameters and the mean value of the user-specified region-of-interest (ROI) luminance (µ) and foundthese following relationships.
k = −0.0018µ+ 0.1229n = −0.0043µ+ 0.995τ0 = −0.0021µ+ 0.1636
(5)
The IDM allows us to predict which areas of the image willcause an observer to experience veiling glare and offers an
Background graylevel 20 60k 0.20 0.04n 0.91 0.74C 0.13 0.04
TABLE I: Table of coefficients for the VG model for abackground of 20 and 60 using Eq. 2 fit.
60.2 / M. Choi
816 • SID 2012 DIGEST ISSN 0097-966X/12/4302-0816-$1.00 © 2012 SID

estimate of the increase in contrast needed to match a certaindetection threshold.One method to reducing veiling glare is by limiting thedynamic range of the image displayed. This can be optimizedby adjusting the mapping to luminance. One of the more well-known models is the Digital Imaging and Communicationsin Medicine (DICOM) grayscale standard display function(GSDF) [7]. The DICOM GSDF is based on Barten’s workon human contrast sensitivity [8].The GSDF increases the contrast in the dark areas of an imagewhere the human eye is less sensitive to improve visibility, andattempts to implement a perceptual linearization, where eachunit change in graylevel corresponds to a change in luminancevalue linearly related to the minimum change in luminanceneeded to achieve a just-noticeable difference (JND). Anotherpurpose of the DICOM GSDF is that it renders images suchthat they have a similar appearance on all displays that areGSDF-calibrated independently of the luminance range.In this work, we describe a method to optimize the presen-tation of 16-bit images on an HDR dual-layer LCD display.The IDM is used to provide feedback for correction if theveiling glare in the image is above the detection threshold.Our goal is to optimize the display of medical images so thatthe maximum amount of information in the luminance spaceis presented with a minimum amount of veiling glare.
2. MethodsWe used a dual-layer HDR display prototype with two, full-resolution LCD panels that modulate the CCFL backlight.Each pixel on both LCD panels can be independently con-trolled. We used a spectroradiometer (PR-730, PhotoResearch,Inc., Chatsworth, CA) to measure the luminance response ofall 65536 grayscale combinations. The maximum output of ourdisplay was 566.2 cd/m2 and the minimum was 0.0439 cd/m2.The graylevel information from the image was mapped to theentire dynamic range of the display using the DICOM GSDF[7]. For this particular display, there are 723 available JNDs.All images are mapped to 1 JND per digital driving level(DDL) initially.
2.1. Hardware veiling glare correctionThe dual-layer prototype allows us to drive every pixel onboth LCD panels. Theoretically, the combination of two 8-bit displays gives 16-bit grayscale resolution, however, severalgraylevel combinations of the front and back layers weremeasured to output very similar luminances. In a study byWang & Badano, different graylevel combinations of the sameluminance were compared in a veiling glare test. In the test,a smaller black inner circle was displayed in the center ofa bright circle. The luminance of the black circle was mea-sured using a luminance probe (IL-1700, International Light,Peabody, Massachusetts). The light from the bright circlescattered into the smaller black circle causing the luminancereading to be higher than the luminance of the black circlewithout the glare source.
Less hardware VG affected the black circle readings as theradius of the inner circle grew. Different combinations of thefront and back for the same luminance were tested on the outerand inner circle. The findings show the graylevel combinationthat has the lowest front value for the inner dark circle and thelowest back combination for the outer white circle minimizedthe display glare. However, due to the parallax effect, Wang& Badano found it is better use the lowest front combinationfor both the bright and dark regions in images that are lesscontrolled.
Inputimage
GenerateLUT
Split imageto two 8-bit
Output gb,gf , lum
Select locationof target andbackground
region
CalculateVG influenceon detection
threshold
Is VGtolerable?
DisplayDecreasemaximumluminance
yes
no
Image-Dependent Model
Fig. 1: HDR optimization feedback loop. The calculationsperformed in the IDM are performed using Eq. 3, 4, and 5.
2.2. Perceptual veiling glare correction
The image-dependent model (IDM) [6] is utilized to calculatethe veiling glare influence on contrast detection thresholds.First, the image is shown so the user can select a rectangularregion of interest (ROI) representing the target background andthe target location within that region. The average pixel valueof the ROI is recorded as the background and used to calculateconstants k, n, and C in Eq. 5. Since the IDM assumes everypixel in the display as a veiling glare source, the contrastdetection threshold not affected by veiling glare (τ0) is thesummation of the pixel contributions to VG of only the ROI.The summation of all pixel contributions to VG is τ . Then(τ − τ0)/τ0 is calculated to determine the added detectionthreshold due to the veiling glare. If the ∆τ/τ0 is less than acertain predefined tolerance, the image (gf and gb) is displayedon the dual-layer HDR display device.Otherwise, the luminance mapping is adjusted by reducingone JND from the maximum luminance. In situations whereveiling glare is present, having a large luminance range mayactually hinder readers in detection tasks. The feedback loopin Fig. 1 is used to find the optimal luminance range thatminimizes veiling glare without sacrificing too many JNDs.The luminance mapped to each JND is shown in Fig. 2.
60.2 / M. Choi
SID 2012 DIGEST • 817

Fig. 2: Luminance mapped to JND. For every iteration, thenumber of JNDs were reduced starting from the maximumluminance.
Fig. 3: The added contrast threshold from veiling glare forthree ROIs in an image for every iteration of the feedbackloop. The x-axis shows the number of JNDs available for eachiteration. An image was saved at each of the pink vertical linesand shown in Fig. 4.
3. ResultsWe calculated the VG added contrast threshold for threeROIs for every iteration of the feedback loop of a computergenerated image of a car with headlights at night (Fig. 3).The VG influence dropped exponentially as we decreased themaximum luminance. Visually, the VG became less apparentas the feedback loop continued (Fig. 4).
4. DiscussionThe IDM serves as a coarse estimation of the degradation inobserver detection performance due to perceived veiling glare.Results might be only qualitative when the target is close to abright veiling glare source due to the changes in the reader’sadaptation state, not accounted for in the IDM. In addition, aLambertian emission of the display was assumed. To improvethe IDM, we can measure the display emissive properties. Weconsider this a significant but minor effect. Moreover, observerexperiments are needed to further validate the findings IDM.
5. ConclusionWe described a method that determines appropriate luminancemappings of images shown on an HDR display for minimizingVG effects. We utilized the DICOM GSDF to assess themaximum number of JNDs available in the display and splitthe image to two 8-bit images for the front and back panelof the dual-layer device. The lowest-front splitting algorithmallows us to most accurately represent the luminance profilewhile minimizing hardware veiling glare. The IDM was usedto determine how much human perceived veiling glare ispresent for a detection task at a predetermined location in theimage.If the veiling glare contribution to the increase in contrastthreshold exceeded a tolerance level, the number of JNDs weredecreased and the maximum luminance lowered. Otherwise,the image was displayed on the HDR.The tool has promising applications for the reading of CT andother medical images where VG effects may be significant.We are developing a version of this tool to analyze images in-stantaneously for real-time processing when scanning throughthe z-axis of a thoracic CT dataset. Applications in other areasinclude visualization of HDR scenes in games and videos.
6. AcknowledgementsThis research is funded in part with a Cooperative Re-search and Development Agreement between FDA and FIMI,Saronno, Italy (a BARCO company).
References[1] WS Stiles. The scattering theory of the effect of glare on the brightness
difference threshold. Proceedings of the Royal Society of London,105:131–145, 1929.
[2] LL Holladay. The fundamentals of glare and visibility. Journal of theOptical Society of America, 12:271–319, 1929.
[3] JJ Vos. Disability glare- a state of the art report. CIE-Journal, 3:3953,1984.
[4] JJ Vos. On the cause of disability glare and its dependence on glare angle,age and ocular pigmentation. Clinical and Experimental Optometry,86:363–370, 2003.
[5] M Choi, F Zafar, D Sharma, WC Cheng, L Albani, and A Badano. Doesveiling glare in the human eye hinder detection in high-dynamic-rangedisplays? Journal of Display Technology, 2012.
[6] M Choi, L Albani, and A Badano. An image-dependent model of veilingglare effects on detection performance in large-luminance-range displays.In Proceedings of SPIE, 2012.
[7] Digital Imaging and Communications in Medicine (DICOM), part 3.14,grayscale standard display functions. Technical report, National ElectricalManufacturers Association, 1988.
[8] PGJ Barten. Physical model for the contrast sensitivity of the human eye.Proceedings of SPIE, 1666:57–72, 1992.
60.2 / M. Choi
818 • SID 2012 DIGEST
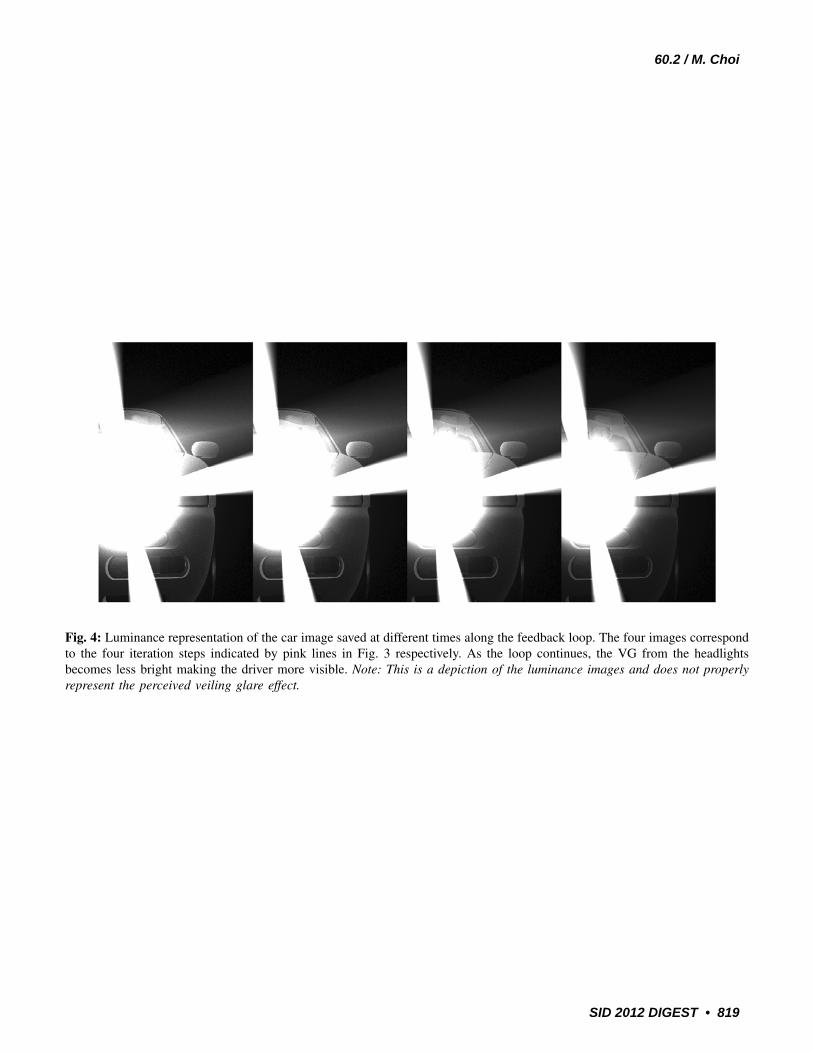
Fig. 4: Luminance representation of the car image saved at different times along the feedback loop. The four images correspondto the four iteration steps indicated by pink lines in Fig. 3 respectively. As the loop continues, the VG from the headlightsbecomes less bright making the driver more visible. Note: This is a depiction of the luminance images and does not properlyrepresent the perceived veiling glare effect.
60.2 / M. Choi
SID 2012 DIGEST • 819