Embed Size (px)
Citation preview
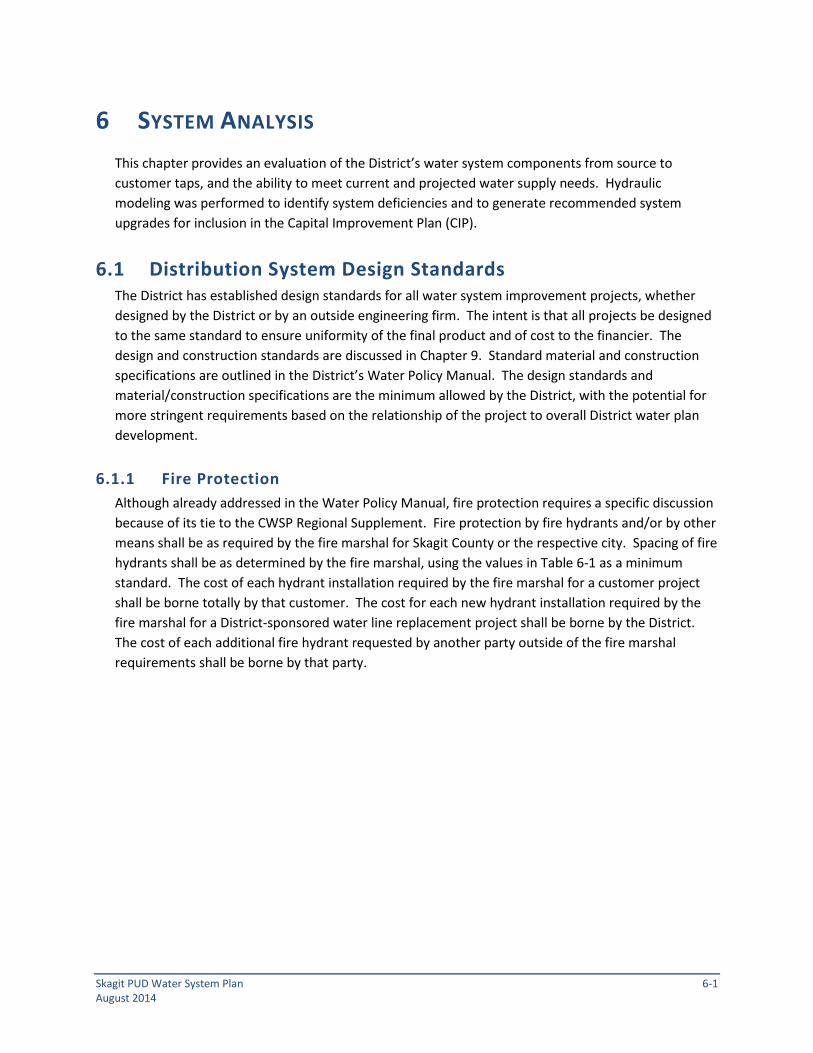
6 SYSTEM ANALYSIS This chapter provides an evaluation of the District’s water system components from source to customer taps, and the ability to meet current and projected water supply needs. Hydraulic modeling was performed to identify system deficiencies and to generate recommended system upgrades for inclusion in the Capital Improvement Plan (CIP).
6.1 Distribution System Design Standards The District has established design standards for all water system improvement projects, whether designed by the District or by an outside engineering firm. The intent is that all projects be designed to the same standard to ensure uniformity of the final product and of cost to the financier. The design and construction standards are discussed in Chapter 9. Standard material and construction specifications are outlined in the District’s Water Policy Manual. The design standards and material/construction specifications are the minimum allowed by the District, with the potential for more stringent requirements based on the relationship of the project to overall District water plan development.
6.1.1 Fire Protection Although already addressed in the Water Policy Manual, fire protection requires a specific discussion because of its tie to the CWSP Regional Supplement. Fire protection by fire hydrants and/or by other means shall be as required by the fire marshal for Skagit County or the respective city. Spacing of fire hydrants shall be as determined by the fire marshal, using the values in Table 6-1 as a minimum standard. The cost of each hydrant installation required by the fire marshal for a customer project shall be borne totally by that customer. The cost for each new hydrant installation required by the fire marshal for a District-sponsored water line replacement project shall be borne by the District. The cost of each additional fire hydrant requested by another party outside of the fire marshal requirements shall be borne by that party.
Skagit PUD Water System Plan 6-1 August 2014

Table 6-1. Minimum Fire Flow and Hydrant Spacing
Minimum Fire Flow Design Standards For New And Expanding Water Systems(1)
Land Use Designations Or Densities
Minimum Fire Flow (Gallons Per Minute)
Minimum Duration (Minutes)
Maximum Hydrant Spacing (Feet)
Urban Growth Areas (2) Industrial 1500 60 (3)
Commercial 1500 60 (3)
Multi-Family Residential 1500 60 500 Single-Family & Duplex Residential 1000 60 500 Non-Urban Growth Areas Commercial / Industrial 1500 (4) 60 (4) (4)
1 Dwelling Unit Per Lot Less Than 2.5 Acres 500 (5) 30 (5) 900 (5) 1 Dwelling Unit Per Lot 2.5 Acres Or Larger NONE (5) NONE (5) NONE (5),
(6) Natural Resource Lands NONE (5) NONE (5) (5), (6)
(1) The design standards may be amended to reflect changes to Comprehensive Plan land use designations and/or their densities. Proposed amendments will be presented to the Skagit County CWSP WUCC for approval.
(2) These criteria establish a minimum water system design standard. Each water system in an urban growth area must comply with the standards of the local government with jurisdiction. When there are different or conflicting standards, the most stringent standard shall apply. Prior to the issuance of a development permit, the approving authority shall establish fire flow, duration and hydrant spacing requirements.
(3) As determined by the appropriate fire official. (4) Fire flow for individual buildings or groups of buildings is to be determined by the Skagit County Fire Marshal
per Uniform Fire Code Appendix IIIA and the Skagit County Fire Marshal policy on fire flow. The application of lesser or alternative standards shall be in accordance with Section 4.3.5 (Interpretation of Standards).
(5) Fire flow will be required for a Conservation and Reserve Development (CaRD) land division as follows.
CaRD Characteristics
Fire Flow Requirement
5 or more lots
Option 1: Fire flow of 500 gpm for 30 minutes with hydrant spacing of 900 ft. or,
Option 2: Fire Marshal approved fire prevention water system that provides adequate pressure and flow to support NFPA 13D sprinkler systems is required for all residential dwellings. In addition, if the property is located in an Industrial Forest, Secondary Forest, or Rural Resource designated land the fire protection requirements as listed in Skagit County Code 14.04.190(14)(b)(iii)(b-e) also apply.
4 or fewer lots
None required, unless the property is located in an Industrial Forest, Secondary Forest, or Rural Resource designated land. If the property is located in such designated land the fire protection requirements as listed in Skagit County Code 14.04.190(14)(b)(iii)(b-e) apply. However, NFPA 13D sprinklers are only applicable to residential dwellings.
As of the effective date of the CWSP, where in-fill development or extension of an existing water system occurs to serve an existing platted lot, the Skagit County Fire Marshal may limit the requirement for fire flow or fire suppression in accordance with Table 4-1 to the newly developed lot only. Group B public systems may choose to separate the fire flow from water flow. Separate tank and hydrant(s) location is subject to Skagit County Fire Marshal approval.
(6) Hydrants shall be installed when water lines are installed or replaced and are capable of supplying a tanker truck with a minimum of 500 gallons per minute at a minimum residual pressure of 20 psi. Tanker truck filling hydrants are to be located at major roadway intersections and along roads at a spacing not to exceed one mile to assist in fire protection.
6-2 Skagit PUD Water System Plan August 2014

6.1.2 Distribution System The following water distribution system design standards are from the District’s Water Policy Manual. They are an overview of the design and construction standards, with more detail available in Chapter 9.
PRESSURE The District has a desirable and allowable pressure range for all new construction (see Table 6-2). The pressure is measured at the water meter. If the pressure is greater than 80 psi at the water meter, individual pressure reducing valves are required on each service connection.
Table 6-2. Pressure Standards
Allowable Desirable
Minimum (psi) 30 40
Maximum (psi) 125 80
MINIMUM PIPE DIAMETER • 8-inch diameter minimum as a general rule
• 6-inch diameter is allowable if there is no likelihood of a future water line extension. Use of any pipe with a diameter smaller than 8 inches must be approved by the District’s Engineering Department.
Refer to the Water Policy Manual for specific issues related to water line construction as it pertains to new development.
FIRE FLOW REQUIREMENTS A minimum of 20 psi must be maintained at the nearest fire hydrant and also throughout the entire system. The fire flow requirements are as set out in Table 6-1.
VALVE AND HYDRANT SPACING • Water valves are usually placed on each leg of a tee or a cross, depending on the location of
nearby valves.
• Air vacuum /relief valves shall be placed at local high points in the water line and at the direction of the District.
• Fire hydrant locations are as provided in Table 6-1.
Other specific valve location requirements are provided in the District’s Water Policy Manual.
Skagit PUD Water System Plan 6-3 August 2014
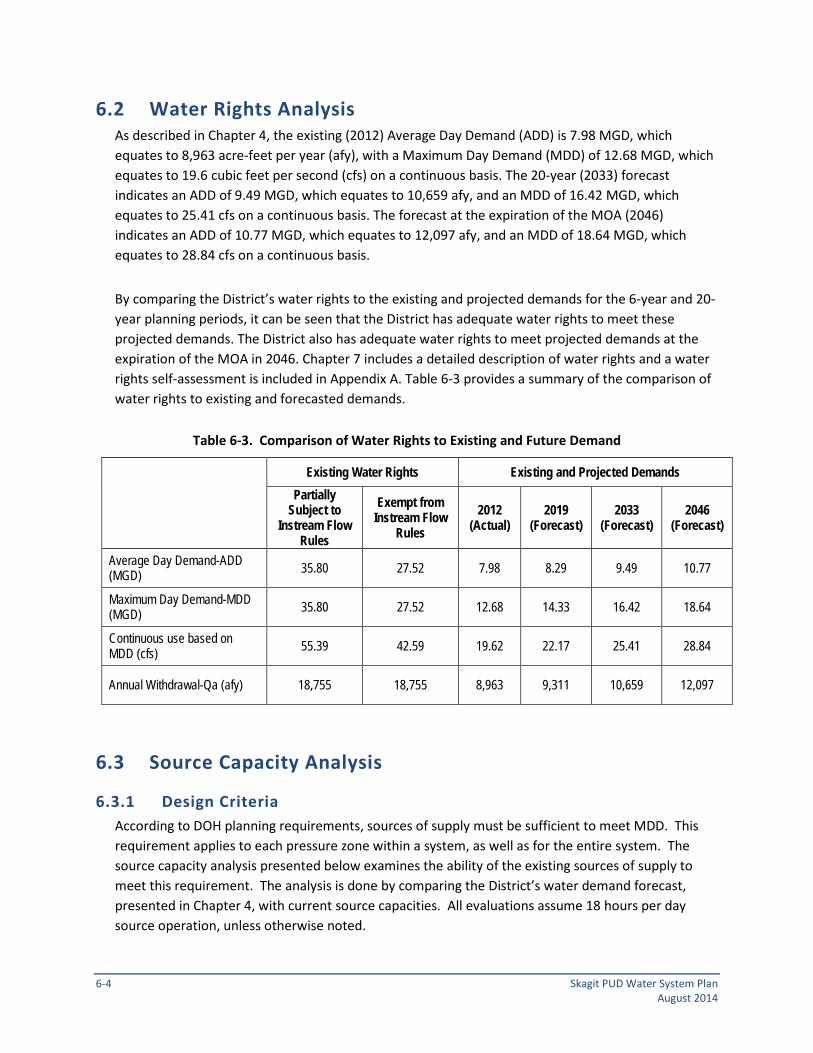
6.2 Water Rights Analysis As described in Chapter 4, the existing (2012) Average Day Demand (ADD) is 7.98 MGD, which equates to 8,963 acre-feet per year (afy), with a Maximum Day Demand (MDD) of 12.68 MGD, which equates to 19.6 cubic feet per second (cfs) on a continuous basis. The 20-year (2033) forecast indicates an ADD of 9.49 MGD, which equates to 10,659 afy, and an MDD of 16.42 MGD, which equates to 25.41 cfs on a continuous basis. The forecast at the expiration of the MOA (2046) indicates an ADD of 10.77 MGD, which equates to 12,097 afy, and an MDD of 18.64 MGD, which equates to 28.84 cfs on a continuous basis.
By comparing the District’s water rights to the existing and projected demands for the 6-year and 20-year planning periods, it can be seen that the District has adequate water rights to meet these projected demands. The District also has adequate water rights to meet projected demands at the expiration of the MOA in 2046. Chapter 7 includes a detailed description of water rights and a water rights self-assessment is included in Appendix A. Table 6-3 provides a summary of the comparison of water rights to existing and forecasted demands.
Table 6-3. Comparison of Water Rights to Existing and Future Demand
Existing Water Rights Existing and Projected Demands Partially
Subject to Instream Flow
Rules
Exempt from Instream Flow
Rules 2012
(Actual) 2019
(Forecast) 2033
(Forecast) 2046
(Forecast)
Average Day Demand-ADD (MGD) 35.80 27.52 7.98 8.29 9.49 10.77
Maximum Day Demand-MDD (MGD) 35.80 27.52 12.68 14.33 16.42 18.64
Continuous use based on MDD (cfs) 55.39 42.59 19.62 22.17 25.41 28.84
Annual Withdrawal-Qa (afy) 18,755 18,755 8,963 9,311 10,659 12,097
6.3 Source Capacity Analysis
6.3.1 Design Criteria According to DOH planning requirements, sources of supply must be sufficient to meet MDD. This requirement applies to each pressure zone within a system, as well as for the entire system. The source capacity analysis presented below examines the ability of the existing sources of supply to meet this requirement. The analysis is done by comparing the District’s water demand forecast, presented in Chapter 4, with current source capacities. All evaluations assume 18 hours per day source operation, unless otherwise noted.
6-4 Skagit PUD Water System Plan August 2014

6.3.2 Source Capacity Evaluation Two levels of source capacity evaluation were conducted:
• The first level is for the entire Judy System, using the District’s water treatment plant (WTP) as the source. This analysis includes the demands from all customers in the Judy System.
• The second level of source capacity evaluation is for all the different pressure zones and pressure zone combinations within the Judy System. A separate evaluation was completed for each pressure zone or pressure zone combination that has a dedicated source involving a pump station. Zones that are fed by a pump station or a pressure-reducing valve (PRV) station were included in a source analysis when they exclusively provide water to another zone. For example, the Fir–Waugh booster station provides water to the 560-foot HGL pressure zone, which then serves the 420-foot HGL pressure zone through PRVs. The source analysis for the 560-foot HGL zone includes the demand for the 420-foot HGL zone.
Table 6-4 shows the source analysis for the entire Judy System. It shows that there is a surplus of water source available for the entire system up to 2033 based on the capacity of the WTP, and that utilization of the maximum water rights available allows for a maximum of over 129,000 equivalent residential units (ERUs).
Table 6-4. Evaluation of Source Adequacy for the Judy System
Year 2014 2019 2033 Max(4) Projected ERUs and Demand(1) Equivalent Residential Units (ERUs) 45,210 47,038 53,878 129,092 Average Day Demand (gpd) 7,247,297 7,540,230 8,636,710 20,693,642(5) Maximum Day Demand (gpd) 12,537,823 13,044,598 14,941,508 35,800,000 Available Existing Source Skagit PUD Water Treatment Plant(2) (gpd) 24,000,000 24,000,000 24,000,000 35,800,000
Source Surplus/(Deficiency) (gpd)(3) 11,462,177 10,955,402 9,058,492 0 Notes:
1. Projected demands as presented in Chapter 4. This includes all of the District's service area, including industrial and wholesale customers. ERUs calculated as Average Day Demand / ERU water use factor (160 gpd/ERU).
2. The current treatment capacity of the WTP is 24 MGD. The maximum water right is equal to 35.8 MGD and is used for the maximum case.
3. Calculation based on Maximum Day Demand.
4. Maximum ERUs to be served with existing sources, based on maximum production rate.
5. A peaking factor of 1.73 was used to back-calculate the Average Day Demand based on the Maximum Day Demand.
Table 6-5 summarizes the source analysis for each of the individual pressure zones. The individual pressure zone analysis includes the projected number of ERUs for the given planning year and the
Skagit PUD Water System Plan 6-5 August 2014

associated surplus or deficiency in the amount of source for that year. Details of each pressure zone analysis are included in Appendix I.
Table 6-5. Source Analysis Summary
2014 2019 2033 Maximum
Pressure Zone ERUs Surplus/
(Deficiency) (gal)
ERUs Surplus/
(Deficiency) (gal)
ERUs Surplus/
(Deficiency) (gal)
ERUs
180/214A,E (Burl-Custer) 9,218 18,683,556 9,591 18,580,226 10,986 18,193,448 76,590
195/214C,D,F (MTV-County)/290 12,931 68,053,907 13,454 67,908,958 15,410 67,366,400 258,327
214B (SW) 5,431 28,589,734 5,651 28,528,851 6,473 28,300,961 108,523
220/322A,B 7,350 16,998,572 7,647 16,916,187 8,759 16,607,814 68,645
230/270/290 3,747 4,576,969 3,898 4,534,971 4,465 4,377,771 20,251
284 300 6,771,086 313 6,767,719 358 6,755,114 24,716
322C (Cascade 1) 31 45,498 32 45,154 37 43,868 195
350 580 12,511,218 603 12,504,719 691 12,480,394 45,694
356A 817 3,013,533 850 3,004,380 973 2,970,116 11,683
365 176 3,191,252 183 3,189,281 209 3,181,906 11,683
412 91 39,684 94 38,669 108 34,869 234
430 80 2,569,835 83 2,568,939 95 2,565,586 9,347
450 118 (4,567) 122 (5,886) 140 (10,825) 101
456 48 796,792 50 796,259 57 794,260 2,921
459A,B,C 947 6,937,498 985 6,926,888 1,128 6,887,173 25,963
463 76 195,036 79 194,189 90 191,017 779
506/415 66 262,536 69 261,798 78 259,034 1,013
560/420/356B 3,028 780,225 3,151 746,281 3,609 619,227 5,842
592 37 205,620 39 205,200 45 203,630 779
645 193 16,000 218 6,000 250 (14,000) 209
684 57 92,168 59 91,529 68 89,133 389
705 42 9,902 44 9,429 50 7,659 78
858/720 41 204,602 43 204,142 49 202,417 779
6-6 Skagit PUD Water System Plan August 2014

Based on the evaluation of each individual pressure zone, only the 450-foot HGL and 645-foot HGL zones have a source deficiency that will limit the growth of that particular zone within this planning period. Both of these pressure zones are small areas with a limited amount of demand and are supplied by a small booster station. There are no current plans to increase the source of supply for these zones.
6.4 Storage Capacity Analysis
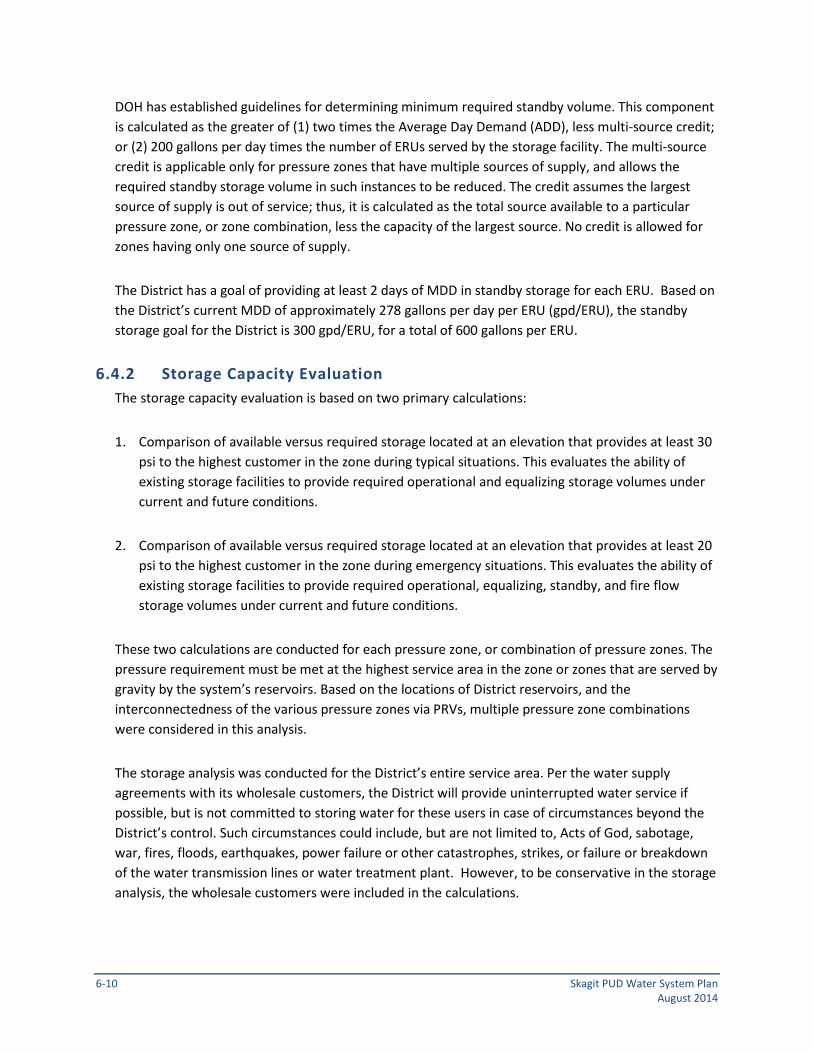
6.4.1 Design Criteria Water storage is required for the District’s water distribution system to provide equalizing capacity for diurnal peak demands during high-demand periods and to provide emergency supply for fire protection and other purposes. According to DOH requirements, water system storage volume is comprised of five separate components:
• Operating storage volume
• Equalizing storage volume
• Fire flow storage volume
• Standby storage volume
• Dead storage volume
These required volume components are illustrated in Figure 6-1. All storage components are described in more detail below.
The demands on a reservoir are used to calculate the equalizing and standby storage volume requirements. These demands are defined as any volume that could be required from the reservoir, even if the demands are not served by gravity. The criteria for storage volume requirements are to include demands that may be required out of the reservoir by any means, including pump stations.
OPERATING AND DEAD STORAGE VOLUMES Operating volume is the water that lies between low and high water storage levels set by District operations staff to control system pumps and flow control valves. The operating volumes for the District reservoirs are typically about 5 feet high. The dead volume is the volume at the bottom of the tank that cannot be used because it is physically too low to provide sufficient pressures. Operating and dead storage volumes are subtracted from total storage to determine the effective storage available for equalizing, standby, and fire flow.
Skagit PUD Water System Plan 6-7 August 2014

EQUALIZING STORAGE VOLUME Equalizing volume is the total volume needed to moderate daily fluctuations in diurnal demands during periods when the demand exceeds the capacity of the supply system. Equalizing volume requirements are greatest on the day of peak demand. Operation of a properly balanced system results in (1) replenishment of storage facilities during times of day when the demand curve is below the capacity of the supply system, and (2) depletion of storage facilities when the demand exceeds the supply capacity. The equalizing volume of a storage tank must be located at an elevation that provides a minimum pressure of 30 psi to all customers served by the tank.
Equalizing storage volume is calculated based on the peak hour demand (PHD) as defined by the DOH Water System Design Manual (WSDM) (December 2009). This storage is the greater of either (a) [(PHD - Total Available Source) * 150 minutes], or (b) 5% of MDD. PHD is also defined in the WSDM. For the storage analysis conducted as part of this Water System Plan, the formula is also documented in the footnotes of each storage table included in Appendix I for the complete storage analysis.
The total available source is defined as the total of all active source capacities into the interested zone except emergency sources (such as a fire pump). The total available source is documented in the footnotes of each storage table included in Appendix I for the complete storage analysis.
The 5% of MDD is not an equalizing requirement, but is included so that equalizing storage is never zero.
FIRE FLOW STORAGE VOLUME The required fire flow volume for a given pressure zone or zone combination is calculated as the required fire flow multiplied by the required duration, as established by the local fire authority. Required fire flows and durations vary across the service area, depending on the zoning and land use. The maximum fire flow requirement considered in this analysis is 1,500 gpm for 1 hour, which applies to portions of the District where commercial and industrial development exists. Single-family residential fire flow requirements are 1,000 gpm for 1 hour. The detail of the fire flow requirement for each storage analysis is documented in the footnotes of each storage table included in Appendix I for the complete storage analysis.
The fire flow volume of a storage tank must be located at an elevation that provides a minimum pressure of 20 psi to all customers served by the tank.
DOH allows for optional “nesting” of the fire flow and standby storage volumes. Nesting is when only the larger of the two components is used, rather than the sum of both components. While there are reservoirs that have nesting included in the design, the District does not typically allow nesting, resulting in a more conservative analysis.
6-8 Skagit PUD Water System Plan August 2014

Figure 6-1. Reservoir Storage Components
STANDBY STORAGE VOLUME Standby volume is required to supply reasonable system demands during a foreseeable system emergency or outage. A key concept in establishing standby volume is distinguishing between reasonable system outages and major system emergencies, as follows:
1. Reasonable System Outages: These are addressed by standby storage. These are outages that can be expected to occur under normal operating conditions, such as a pipeline failure, power outage, or valve failure.
2. Major System Emergencies: These are not addressed by standby storage. These are intended to be covered by emergency system operations planning, because construction of sufficient reserve volume to accommodate sustained system demands under emergency conditions is not economically feasible. Examples include outages due to an earthquake or problems at the water treatment plant resulting in a longer-term plant shutdown.
Skagit PUD Water System Plan 6-9 August 2014
DOH has established guidelines for determining minimum required standby volume. This component is calculated as the greater of (1) two times the Average Day Demand (ADD), less multi-source credit; or (2) 200 gallons per day times the number of ERUs served by the storage facility. The multi-source credit is applicable only for pressure zones that have multiple sources of supply, and allows the required standby storage volume in such instances to be reduced. The credit assumes the largest source of supply is out of service; thus, it is calculated as the total source available to a particular pressure zone, or zone combination, less the capacity of the largest source. No credit is allowed for zones having only one source of supply.
The District has a goal of providing at least 2 days of MDD in standby storage for each ERU. Based on the District’s current MDD of approximately 278 gallons per day per ERU (gpd/ERU), the standby storage goal for the District is 300 gpd/ERU, for a total of 600 gallons per ERU.
6.4.2 Storage Capacity Evaluation The storage capacity evaluation is based on two primary calculations:
1. Comparison of available versus required storage located at an elevation that provides at least 30 psi to the highest customer in the zone during typical situations. This evaluates the ability of existing storage facilities to provide required operational and equalizing storage volumes under current and future conditions.
2. Comparison of available versus required storage located at an elevation that provides at least 20 psi to the highest customer in the zone during emergency situations. This evaluates the ability of existing storage facilities to provide required operational, equalizing, standby, and fire flow storage volumes under current and future conditions.
These two calculations are conducted for each pressure zone, or combination of pressure zones. The pressure requirement must be met at the highest service area in the zone or zones that are served by gravity by the system’s reservoirs. Based on the locations of District reservoirs, and the interconnectedness of the various pressure zones via PRVs, multiple pressure zone combinations were considered in this analysis.
The storage analysis was conducted for the District’s entire service area. Per the water supply agreements with its wholesale customers, the District will provide uninterrupted water service if possible, but is not committed to storing water for these users in case of circumstances beyond the District’s control. Such circumstances could include, but are not limited to, Acts of God, sabotage, war, fires, floods, earthquakes, power failure or other catastrophes, strikes, or failure or breakdown of the water transmission lines or water treatment plant. However, to be conservative in the storage analysis, the wholesale customers were included in the calculations.
6-10 Skagit PUD Water System Plan August 2014

Table 6-6 includes the storage analysis for the entire Judy System. Based on the current storage available in the Judy System, including the new 6-MG Division Street Reservoir replacing the existing 1-MG reservoir, there is surplus storage available throughout the planning period according to DOH requirements.
Another item to note in the storage analysis is that the District has nearly 6 MG of storage at the clearwells located at the WTP. This storage was distributed to various pressure zones within the system that did not already have storage, primarily the 214-foot HGL pressure zones and the 459-foot HGL pressure zones. Each individual storage evaluation indicates the amount of storage distributed to that particular zone.
Table 6-7 summarizes the storage analysis for each of the individual pressure zones. The individual pressure zone analysis includes the projected number of ERUs for the given planning year and the associated surplus or deficiency in the amount of source for that year. Details of each pressure zone analysis are included in Appendix I.
Skagit PUD Water System Plan 6-11 August 2014

Table 6-6. Evaluation of Storage Adequacy for Judy System
Year 2014 2019 2033 Max(12) Projected ERUs and Demand(1) Equivalent Residential Units (ERUs)(2) 45,210 47,038 53,878 76,812 Average Day Demand (gpd) 7,247,297 7,540,20 8,636,710 12,313,053 Maximum Day Demand (gpd) 12,537,823 13,044,598 14,941,508 21,301,582 Available Source (gpd) Water Treatment Plant Source(3) 24,000,000 24,000,000 24,000,000 35,800,000 Multi-Source Credit (gpd)(4) Required Storage Components Operational Storage (gal)(5) 3,001,281 3,001,281 3,001,281 3,001,281 Equalizing Storage (gal)(6) 626,891 652,230 747,075 1,065,079 Standby Storage (gal)(7) 18,084,107 18,815,062 21,551,096 30,724,640 Fire Flow Storage (gal)(8) 90,000 90,000 90,000 90,000 Required Storage Criteria Greater than 30 psi at highest meter (gal)(9) 3,628,172 3,653,511 3,748,356 4,066,360 Greater than 20 psi at highest meter (gal)(10) 21,802,280 22,558,573 25,389,453 34,881,000 Existing Storage Greater Than 30 psi (gal)(11) TOTAL 29,881,000 34,881,000 34,881,000 34,881,000 Storage Surplus/(Deficiency) at 30 psi (gal) 26,252,828 31,227,489 31,132,644 30,814,640 Existing Storage Greater Than 20 psi (gal)(11) TOTAL 29,881,000 34,881,000 34,881,000 34,881,000 Storage Surplus/(Deficiency) at 20 psi (gal) 8,078,720 12,322,427 9,491,547 0
1. Projected demands as presented in Chapter 4. ERUs calculated as Average Day Demand / ERU water use factor (160 gpd/ERU).
2. Number of ERUs is based on Average Day Demand divided by 160 gpd per ERU. 3. Available source is assumed to be the current treatment capacity of the water treatment plant of 24 MGD. The maximum
water right is equal to 35.8 MGD and is used for the maximum case. 4. No multi-source credit is used. 5. Required operational storage is based on storage tank level when pump turns on. The volume indicated is the total
operational volume in the system. 6. Required equalization storage is the greater of either [(PHD - Total Available Source) * 150 minutes] or [5% of MDD].
PHD: (Maximum Day Demand per ERU / 1440) * [(C) * (N) + F] + 18 (C & F values obtained from Table 5-1 in DOH Dec 2009 WSDM) (N is the number of ERUs)
7. Required standby storage for existing source = greater of (2*ADD - Multi source credit) or 200 gallons per day per ERU. PUD has a goal of 2*MDD per ERU, equivalent to 600 gallons per ERU.
8. Required fire flow storage = 1,500 gpm x 1 hour for commercial, industrial, and multi-family construction in the Urban Growth Area (UGA).
9. Total required storage greater than 30 psi is equal to the total of operational and equalizing storage. 10. Total required storage greater than 20 psi is equal to the total of operational, equalizing, and the greater of standby or fire
flow storage. 11. The 20 psi and 30 psi requirement is based on the highest service within any given pressure zone, and total storage
available within the system. 12. Maximum ERUs supported by available storage.
6-12 Skagit PUD Water System Plan August 2014
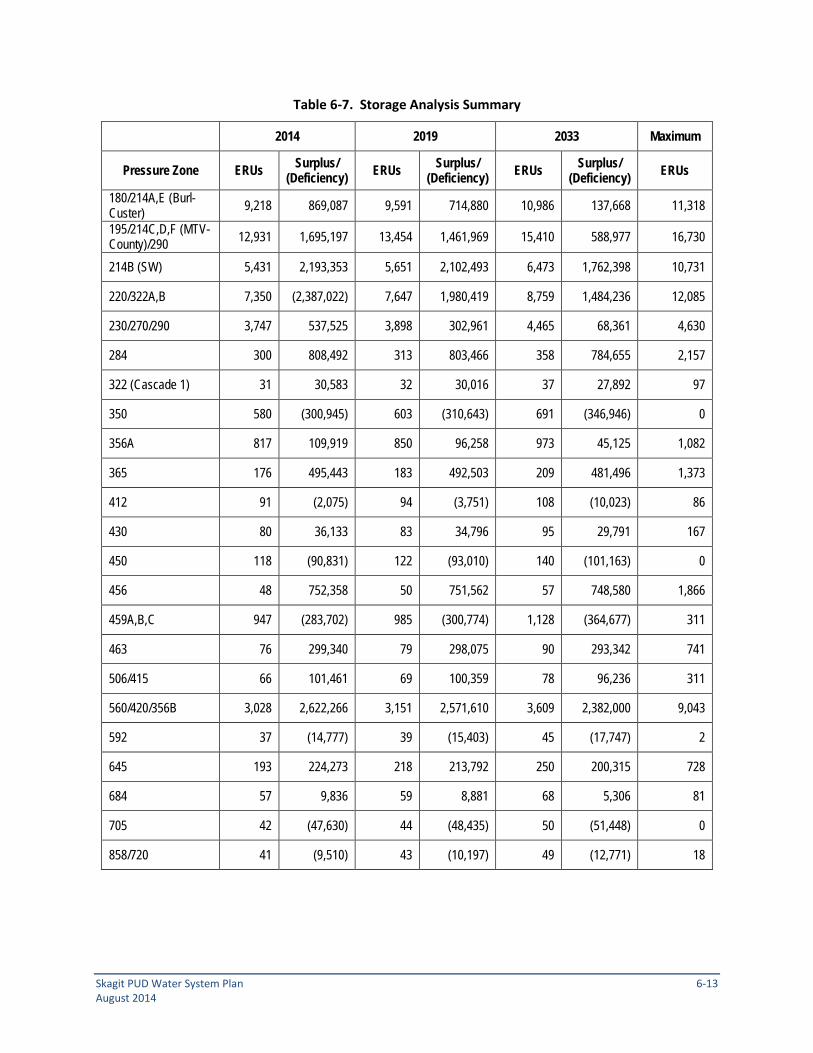
Table 6-7. Storage Analysis Summary
2014 2019 2033 Maximum
Pressure Zone ERUs Surplus/ (Deficiency) ERUs Surplus/
(Deficiency) ERUs Surplus/ (Deficiency) ERUs
180/214A,E (Burl-Custer) 9,218 869,087 9,591 714,880 10,986 137,668 11,318
195/214C,D,F (MTV-County)/290 12,931 1,695,197 13,454 1,461,969 15,410 588,977 16,730
214B (SW) 5,431 2,193,353 5,651 2,102,493 6,473 1,762,398 10,731
220/322A,B 7,350 (2,387,022) 7,647 1,980,419 8,759 1,484,236 12,085
230/270/290 3,747 537,525 3,898 302,961 4,465 68,361 4,630
284 300 808,492 313 803,466 358 784,655 2,157
322 (Cascade 1) 31 30,583 32 30,016 37 27,892 97
350 580 (300,945) 603 (310,643) 691 (346,946) 0
356A 817 109,919 850 96,258 973 45,125 1,082
365 176 495,443 183 492,503 209 481,496 1,373
412 91 (2,075) 94 (3,751) 108 (10,023) 86
430 80 36,133 83 34,796 95 29,791 167
450 118 (90,831) 122 (93,010) 140 (101,163) 0
456 48 752,358 50 751,562 57 748,580 1,866
459A,B,C 947 (283,702) 985 (300,774) 1,128 (364,677) 311
463 76 299,340 79 298,075 90 293,342 741
506/415 66 101,461 69 100,359 78 96,236 311
560/420/356B 3,028 2,622,266 3,151 2,571,610 3,609 2,382,000 9,043
592 37 (14,777) 39 (15,403) 45 (17,747) 2
645 193 224,273 218 213,792 250 200,315 728
684 57 9,836 59 8,881 68 5,306 81
705 42 (47,630) 44 (48,435) 50 (51,448) 0
858/720 41 (9,510) 43 (10,197) 49 (12,771) 18
Skagit PUD Water System Plan 6-13 August 2014

Looking at the results of Table 6-7, there are a few zones that show a deficiency in the amount of storage required. Each of the deficient zones is addressed below.
180/214-foot HGL (214A, E) – This pressure zone is located in Burlington and the northern part of Skagit County. While there will not be a storage deficiency during the planning period, the total storage will be greatly reduced by 2033. Because this is the District’s second-largest pressure zone in terms of overall demand and total ERUs, adding storage would be prudent to achieve the District’s goal of 600 gallons per ERU of standby storage. Therefore, a new reservoir is planned for this area as part of the CIP program; see Chapter 10 for details.
195-foot and 214-foot HGL (214C, D, F)/290 – This pressure zone is located in Mount Vernon, the southern part of Skagit County, and Pleasant Ridge. For the 214 and 195 portions of this pressure zone there will not be a storage deficiency during the planning period, but the total storage will be greatly reduced by 2033. Because this is the District’s largest pressure zone in terms of overall demand and total ERUs, adding storage would be prudent to achieve the District’s goal of 600 gallons per ERU of standby storage. For the 290 Pleasant Ridge portion of the pressure zone, there is no current storage and a new reservoir is required. Therefore, a new reservoir is planned for Pleasant Ridge and a new reservoir is planned for the south Mount Vernon/County area as part of the CIP program; see Chapter 10 for details.
220/322A, B – This pressure zone is located in Mount Vernon, and there will be a new 6-MG reservoir constructed in 2015 to address the current storage deficiency. See Chapter 10 for details on the project.
350-foot HGL – This pressure zone is located in Sedro-Woolley and currently does not have any storage. A new reservoir is planned for this area as part of the CIP program; see Chapter 10 for details.
412-foot HGL – This is the Hermway Heights pressure zone located in Conway and it currently has a 60,000-gallon reservoir that is now too small to provide adequate storage for this area. As part of construction of the nearby Bulson Creek Subdivision, a new reservoir will be put into service that will replace the Hermway Heights Reservoir to increase the storage and solve the deficiency. The completion date for the Bulson Creek Subdivision is not known at this time.
450-foot HGL – This pressure zone is located in Big Lake near the Nookachamps development and does not have any storage. A regional reservoir has been planned for this area for quite some time, but it is dependent on development and growth of the population in this area. As planned developments start to be initiated, the regional reservoir can be constructed to support them.
459-foot HGL – This is the pressure zone for the main transmission lines that go from the WTP to Sedro-Woolley and also to Mount Vernon. The clearwells at the WTP provide storage for this
6-14 Skagit PUD Water System Plan August 2014

pressure zone, but they also provide storage to other areas in the Judy System, primarily the 214-foot HGL pressure zone. So when additional storage is constructed in the 214-foot HGL zone, then more of the storage from the clearwells can be allocated to the 459-foot HGL zone.
592/720/858 foot-HGL – These pressure zones are located on the upper portions of Cascade Ridge and they currently have about 55,000 gallons of storage in two reservoirs that are now unable to provide adequate storage and growth allowances. The reservoir for the 592-foot HGL zone is too small and services have been constructed at an elevation in the 858-foot HGL zone that render the 858 reservoir too short. A new reservoir is being planned for Cascade Ridge as part of the CIP to address the lack of storage and to address increasing maintenance issues with the existing reservoirs. See Chapter 10 for details on the project.
705-foot HGL – This is the Panorama pressure zone and it is located near the WTP. There is currently no storage in this zone and there are no plans to construct a reservoir at this time.
As mentioned earlier, based on the District’s goal of providing 2 days of MDD for a total of 600 gallons per ERU, the District is looking at each of the following pressure zones to add additional storage by the end of the planning period in 2033:
195-foot and 214-foot HGL (214C, D, F) – A new reservoir is planned for this area as part of the CIP program; see Chapter 10 for details.
214-foot HGL (214A, E) – A new reservoir is planned for this area as part of the CIP program; see Chapter 10 for details.
220/322A, B – This pressure zone is located in Mount Vernon and there will be a new 6-MG reservoir constructed in 2015 to address the current storage deficiency. See Chapter 10 for details on the project.
230/270/290 – This pressure zone is located in Bay View and is a potential location for new residential and industrial growth within Skagit County. When growth plans are developed for this area and the future water demand can be estimated, additional storage projects will be considered in conjunction with developer required storage projects.
350-foot HGL – This pressure zone is located in Sedro-Woolley and currently does not have any storage. A new reservoir is planned for this area as part of the CIP program; see Chapter 10 for details.
356A – This pressure zone is located in Big Lake at the Nookachamps development. As mentioned earlier for the 450-foot HGL zone, a regional reservoir has been planned for this area for quite some
Skagit PUD Water System Plan 6-15 August 2014

time, and as the planned developments start to be initiated, the regional reservoir can be constructed to support them.
412-foot HGL – A new reservoir is planned to be put into service that will replace the Hermway Heights Reservoir to increase the storage. The completion date for the Bulson Creek Subdivision and the new reservoir is not known at this time.
450-foot HGL – There is a regional reservoir that has been planned for this area for quite some time, but it is dependent on development and growth of the population in this area. As planned developments start to be initiated, the regional reservoir can be constructed to support them.
459-foot HGL – When additional storage is constructed in the 214-foot HGL zone, then more of the storage from the clearwells can be allocated to the 459-foot HGL zone.
592/720/858-foot HGL – A new reservoir is being planned for Cascade Ridge as part of the CIP to address the lack of storage and to address increasing maintenance issues with the existing reservoirs. See Chapter 10 for details on the project.
684 – This pressure zone is located in southern Skagit County near Lake Sixteen. Similar to the storage deficiency at the 412-foot HGL zone (Hermway Heights), the construction of nearby developments like Bulson Creek and Swan Ridge Estates will provide additional storage that will solve the deficiency. The completion dates for the two developments is not known at this time.
705-foot HGL – This is the Panorama pressure zone and it is located near the WTP. There is currently no storage in this zone and there are no plans to construct a reservoir at this time.
6-16 Skagit PUD Water System Plan August 2014

6.5 Hydraulic Analysis A hydraulic model of the District’s water distribution system was used to perform the following two types of analysis:
Peak Hour Analysis: A minimum pressure of 30 psi must be maintained at all customer connections under peak hour demand (PHD) conditions, with equalizing storage depleted in the reservoirs.
Fire Flow Analysis: A minimum of 20 psi must be maintained for fire flows under MDD conditions, with equalizing and fire flow storage depleted in the reservoirs.
Aging infrastructure, inadequately sized or dead-end pipes, and increasing demands all contribute to areas of low pressure during peak hour demands and substandard fire flows such that the existing system cannot provide adequate service during existing and future MDD conditions.
For areas that did not meet the pressure criteria, the model was used to develop improvements using an iterative process until the pressure criteria were satisfied with a minimum of total pipe and facility additions.
6.5.1 Hydraulic Model The hydraulic model of the District’s water distribution system was originally built using WaterGems software, but was updated recently to Innovyze, which is a Geographic Information System (GIS) based water modeling program. The District is transitioning into a GIS-based data management and mapping system, so the Innovyze product works well with other new software products at the District.
The model includes the following water system components:
• Pipes
• PRVs
• Reservoirs
• Pump stations
• Fire hydrants (and their associated service lines)
• Source information
Information regarding the water system components was imported from the previous WaterGems hydraulic model. The pipe and valve information (including diameter, material, and age) was provided from the District’s AutoCAD Map software system. The reservoirs, pump stations, and
Skagit PUD Water System Plan 6-17 August 2014

source information was based on design information, record drawings, maintenance records, and SCADA information. Facility controls, pump curves, and PRV settings were set based on discussions with District water distribution staff. Fire hydrants were included in the model so that available fire flow could be modeled within the system.
Elevation information for the hydraulic model was also imported from the WaterGems model, but investigation is currently being performed into the accuracy of that information. While most of the information is believed to be accurate, a GIS shapefile will be used to check the ground elevations of certain infrastructure.
The hydraulic model is continually being checked for network errors consisting of overlapping nodes, disconnected nodes, and closed valves and pipes. District water distribution staff will be enlisted to help troubleshoot the model.
6.5.2 Calibration Calibration, a critical step in the development of a hydraulic model, is required prior to using the model as a tool to analyze system performance. Calibration consists of measuring pressure and flows in the field and comparing them with the same pressures and flows simulated in the model. Over the past 2 years, a total of 24 hydrant tests were conducted by District staff to assist with calibration of the steady-state model. The test locations were focused heavily on the District’s biggest pressure zones: the 214-foot HGL and the 322-foot HGL zones.
It is acknowledged that the number and spacing of the tests throughout the pressure zones were inadequate considering the size of the Judy System. The District will be embarking on a more thorough program of hydrant testing to help provide information for calibration of the hydraulic model. This program will begin in 2015 and will be structured so that at least two hydrant tests are performed in each pressure zone, with additional tests depending on the size of the pressure zone.
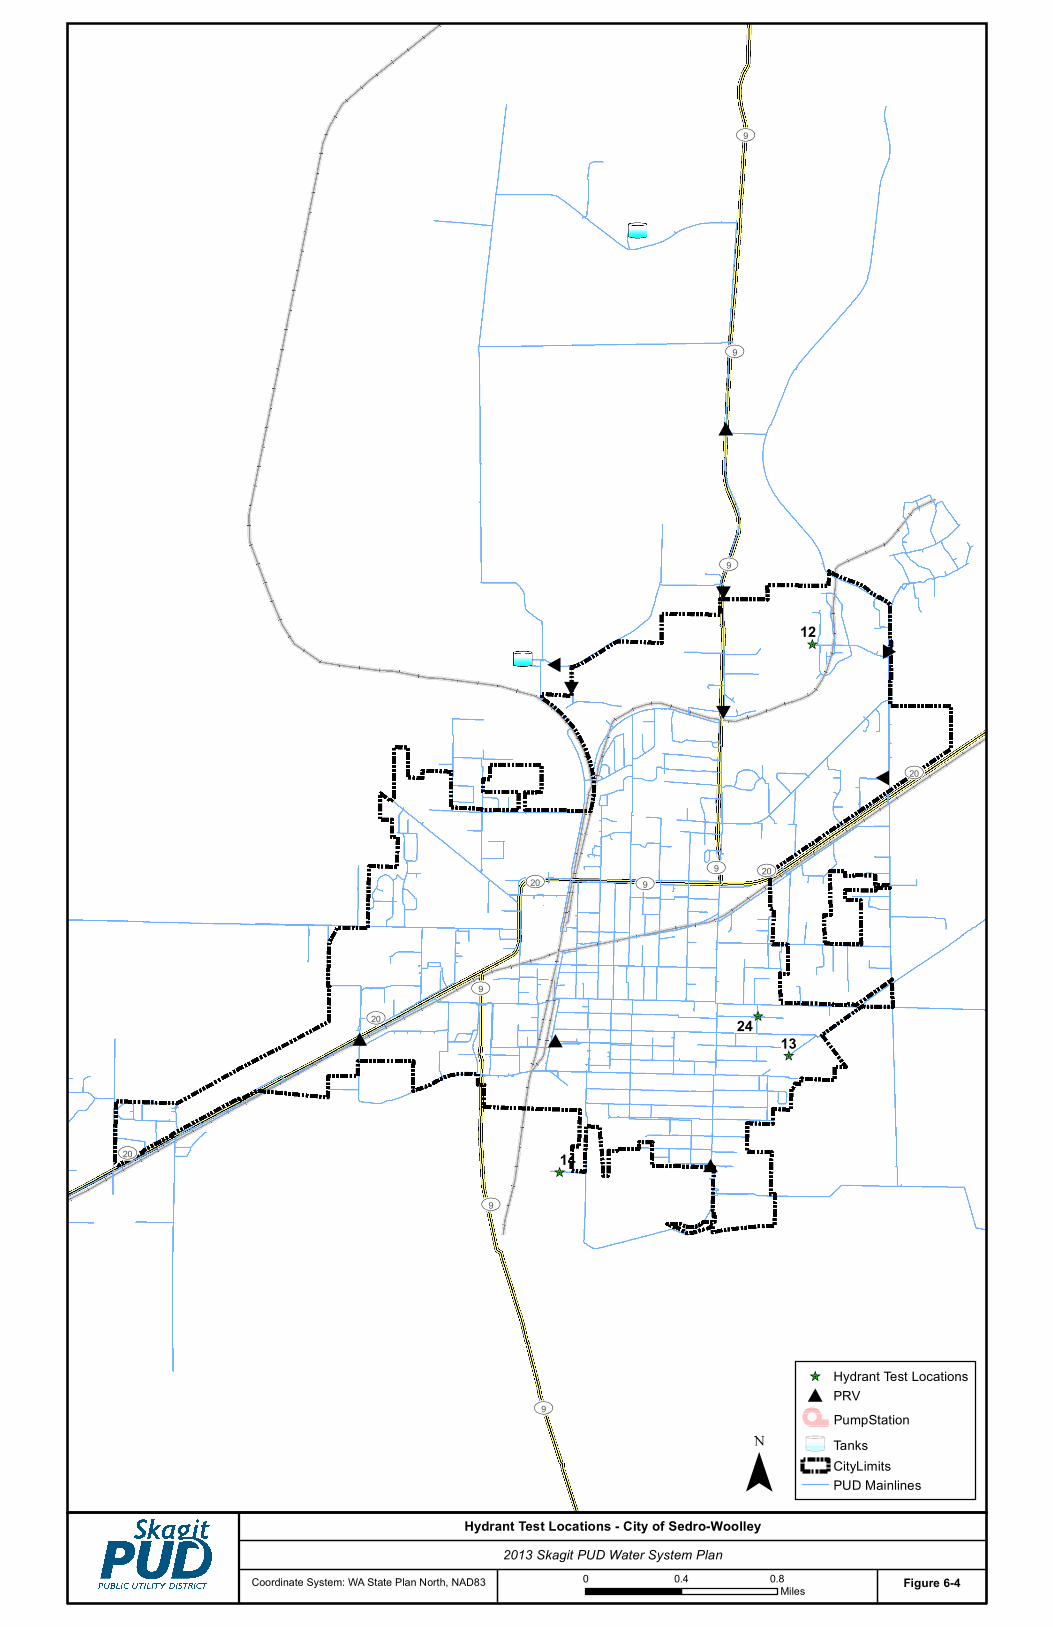
Figures 6-2 through 6-5 show the locations of the hydrant tests in Mount Vernon, Burlington, Sedro-Woolley, and the rural areas. Table 6-8 shows the results of the hydrant flow tests.
For the hydrant tests that were conducted, a pressure gage was placed on the fire hydrant and the pressure was measured under normal operating or “static” conditions (i.e., no hydrant flowing). Once the pressure was recorded, the hydrant was opened and the flow was measured using a pitot gage. The residual pressure was measured at a second hydrant as the first hydrant was flowing for only some of the tests. The new hydrant flow tests that will be conducted will use two different hydrants so that the static pressure and the residual pressure can be monitored when the hydrant is flowing.
Table 6-8 shows that all the observed static pressures in the field were measured within 4 psi of the simulated hydraulic model pressures. Any discrepancies between the measured and simulated
6-18 Skagit PUD Water System Plan August 2014

pressures were addressed by adjustments of model demands, controls, and friction factors (based on pipe age and material) to achieve steady-state calibration.
For the purposes of comprehensive planning, the District model is considered to be reasonably calibrated for steady-state conditions. This assessment was made based on two comparisons between the model and field measurements:
• The first comparison is between the modeled results and the field measurements for static pressures. This comparison assessed the overall accuracy of the model node elevations, tank elevations, and PRV settings under normal demand conditions. The comparison of the modeled static pressure to the measured static pressure is important because there is less reason for variability in the static condition calculation and measurement than in the dynamic condition. In addition, if the static pressures do not correlate, the residual pressure will be skewed. This comparison is found to be good.
• The second comparison was between the modeled results and the field measurements for the drop in pressure between static conditions and those when a hydrant is flowing. This comparison is only able to be done for five of the tests, so it is not a big enough sample size to determine the quality of the results. This comparison is found to be below average.
Even though additional information would help to further calibrate the model, the District feels confident in the results that were obtained.
Skagit PUD Water System Plan 6-19 August 2014

Table 6-8. Hydrant Test Results
Test Location Area Pressure Zone
Field Measured
Static Pressure
(psi)
Modeled Static
Pressure (psi)
Static Pressure
Difference (psi)
Field Measured Residual Pressure
(psi)
Modeled Residual Pressure
(psi)
Residual Pressure
Difference (psi)
1 10th & Kincaid MV 322 62 63 1 61 59.28 1.72 2 Seneca Drive MV 322 104 103.8 0.2 90 92.91 2.91 3 S. 9th & Division MV 322 56 60 4 n/a 59 4 Wayward Way Rural 284 76 76 0 5 Upland & Comanche MV 322 105 101 4 6 Bradshaw Rural 214 84 81 3 7 Dodge Valley/Pickle Plant Rural 214 76 72.5 3.5 10 14 4 8 Valentine Road Rural 214 36 35.2 0.8 16 17.3 1.3 9 Rudene Road Rural 214 97 99.7 2.7 91 91.5 0.5
10 Spruce & Greenfield Conway 195 81 81.5 0.5 11 Nookachamp Hills Big Lake 356 42 40.8 1.2 12 Portobello SW 350 63 63.3 0.3 13 Railroad Avenue SW 214 74 73.6 0.4 14 Morris Street SW 214 75 75.3 0.3 15 Bayview Edison Road Rural 270 113 111 2 16 Rector Road Rural 270 37 35.9 1.1 17 E. Rio Vista & Vine Street Burl 214 75 76.1 1.1 18 Andis Place Burl 214 83 80.3 2.7 19 Spruce & Avon Burl 214 80 78.9 1.1 20 E. Fairhaven & Holly Burl 214 77 77.5 0.5 21 Quail Drive Rural 592 35 35.1 0.1 22 Laurel Court & Eaglemont Dr MV 560 45 45 0 23 Warren & 11th MV 322 59 58.1 0.9 24 Talcott & 11th SW 214 71 70.8 0.2
6-20 Skagit PUD Water System Plan August 2014

###
#
##
##
##
#
#
#
#
# #
#
#
##
## #
#
^
^
^
^^
^
^
^
^
^
^
P7
Tina'sComa PRV506'-402'
CASCADERIDGE #3 30k858' Spill
CASCADERIDGE #1 80k
322' Spill
CASCADERIDGE #2 20k592' Spill
TINAS COMA230k
506' Spill
BIG LAKE -WEST 140k
356' Spill
Tina's ComaBooster
270'-506'Tina's ComaPRV 506'-402'
SkagitSkagitRiverRiver
BarneyBarneyLakeLake
GagesGagesLakeLake
Ten LakeTen LakeSouth ForkSouth Fork
SkagitSkagitRiverRiver
UV20
UV9
UV536
UV538
§¦5
§¦5
§¦5
2
6
22
233
1
18
19
20
17
21
^ Hydrant Test Locations# PRV
PumpStationTanksCityLimitsPUD Mainlines
0 0.5 1Miles Figure 6-2
Hydrant Test Locations - City of Mount Vernon2013 Skagit PUD Water System Plan
Coordinate System: WA State Plan North, NAD83


#
#
#
^
^
^
^
SkagitSkagitRiverRiver
GagesGagesLakeLake
§¦5
§¦5
§¦5
§¦5
18
19
20
17
^ Hydrant Test Locations# PRV
TanksPumpStationCityLimitsPUD Mainlines
0 0.25 0.5Miles Figure 6-3
Hydrant Test Locations - City of Burlington¯
2013 Skagit PUD Water System PlanCoordinate System: WA State Plan North, NAD83

#
#
#
#
#
# #
# #
#^
^
^
^
UV20 UV9
UV20
UV20
UV9
UV9
UV9
UV9
UV20
UV20
UV9
UV9
UV9
14
1324
12
^ Hydrant Test Locations# PRV
PumpStationTanksCityLimitsPUD Mainlines
0 0.4 0.8Miles Figure 6-4
Hydrant Test Locations - City of Sedro-Woolley2013 Skagit PUD Water System Plan
Coordinate System: WA State Plan North, NAD83


#
#
#
#
##
## #
## #
##
#
#
#
#
# #
#
#
^^
^
^
^
^
^^
^
^
^^
^
^
^
^
^
^
^
^
^
^
^
CITY OFMOUNT VERNON
(SEE DETAIL)
CITY OFBURLINGTON(SEE DETAIL)
CITY OFSEDRO-WOOLLEY
(SEE DETAIL)
UV20
UV20
UV20
UV9
UV9
UV9
UV530
UV11
UV11
UV11
UV536
UV536
UV534
UV534
UV237
UV237
UV237
UV20 UV20
UV9
UV9
UV9
UV9
UV9
UV20
UV9
§¦5
§¦5
§¦5
§¦5
1817
14
21
98
76
10
11
4
16
15
CityLimits^ Hydrant Test Locations# PRV
TanksPumpStationPUD Mainlines
0 1 2Miles Figure 6-5
Hydrant Test Locations - Rural Areas¯
2013 Skagit PUD Water System PlanCoordinate System: WA State Plan North, NAD83


6.5.3 Modeling Scenarios Four steady-state hydraulic analyses were completed for each pressure zone for 6-year (2019) and 20-year (2033) demand conditions. It was found that the demand did not increase significantly between the existing and 6-year demands, so an analysis for the existing demands was not done. The increases in demand for the 6-year and 20-year scenarios were allocated spatially based on available parcels and the District’s knowledge of projected growth locations. The analyses considered peak hour demand and fire flow demand (MDD plus fire flow) conditions. Table 6-9 describes the modeling scenarios; the scenarios are listed in the sequence in which they were performed.
Table 6-9. Modeling Scenarios
Description Demand
Plan Year 6 (2019) Peak Hour Plan Year 6 Peak Hour Demand
Plan Year 6 (2019) Fire Flow Plan Year 6 Maximum Day Demand plus fire flow
Plan Year 20 (2033) Peak Hour Plan Year 20 Peak Hour Demand
Plan Year 20 (2033) Fire Flow Plan Year 20 Maximum Day Demand plus fire flow
6.5.4 Peak Hour Analysis Peak hour analyses were run for 6-year and 20-year demands. Peak hour analyses are run as steady-state evaluations, which evaluate system conditions at a single point in time. Initial tank levels for all reservoirs were set at such a level that the equalizing and operating portions of the storage were depleted.
For the most part, the Judy System performs very well during 6-year and 20-year peak hour demands. The areas with low pressures and pipelines that are exceeding velocity criteria are spread out between various locations in Mount Vernon, a few locations in Sedro-Woolley, and some locations in the rural areas. After the analysis, projects were identified for locations that did not meet the 20-psi minimum pressure criteria, as well as for pipelines that exceeded District velocity criteria of a maximum of 8 feet per second. However, projects were also identified if locations were nearing the pressure and velocity criteria.
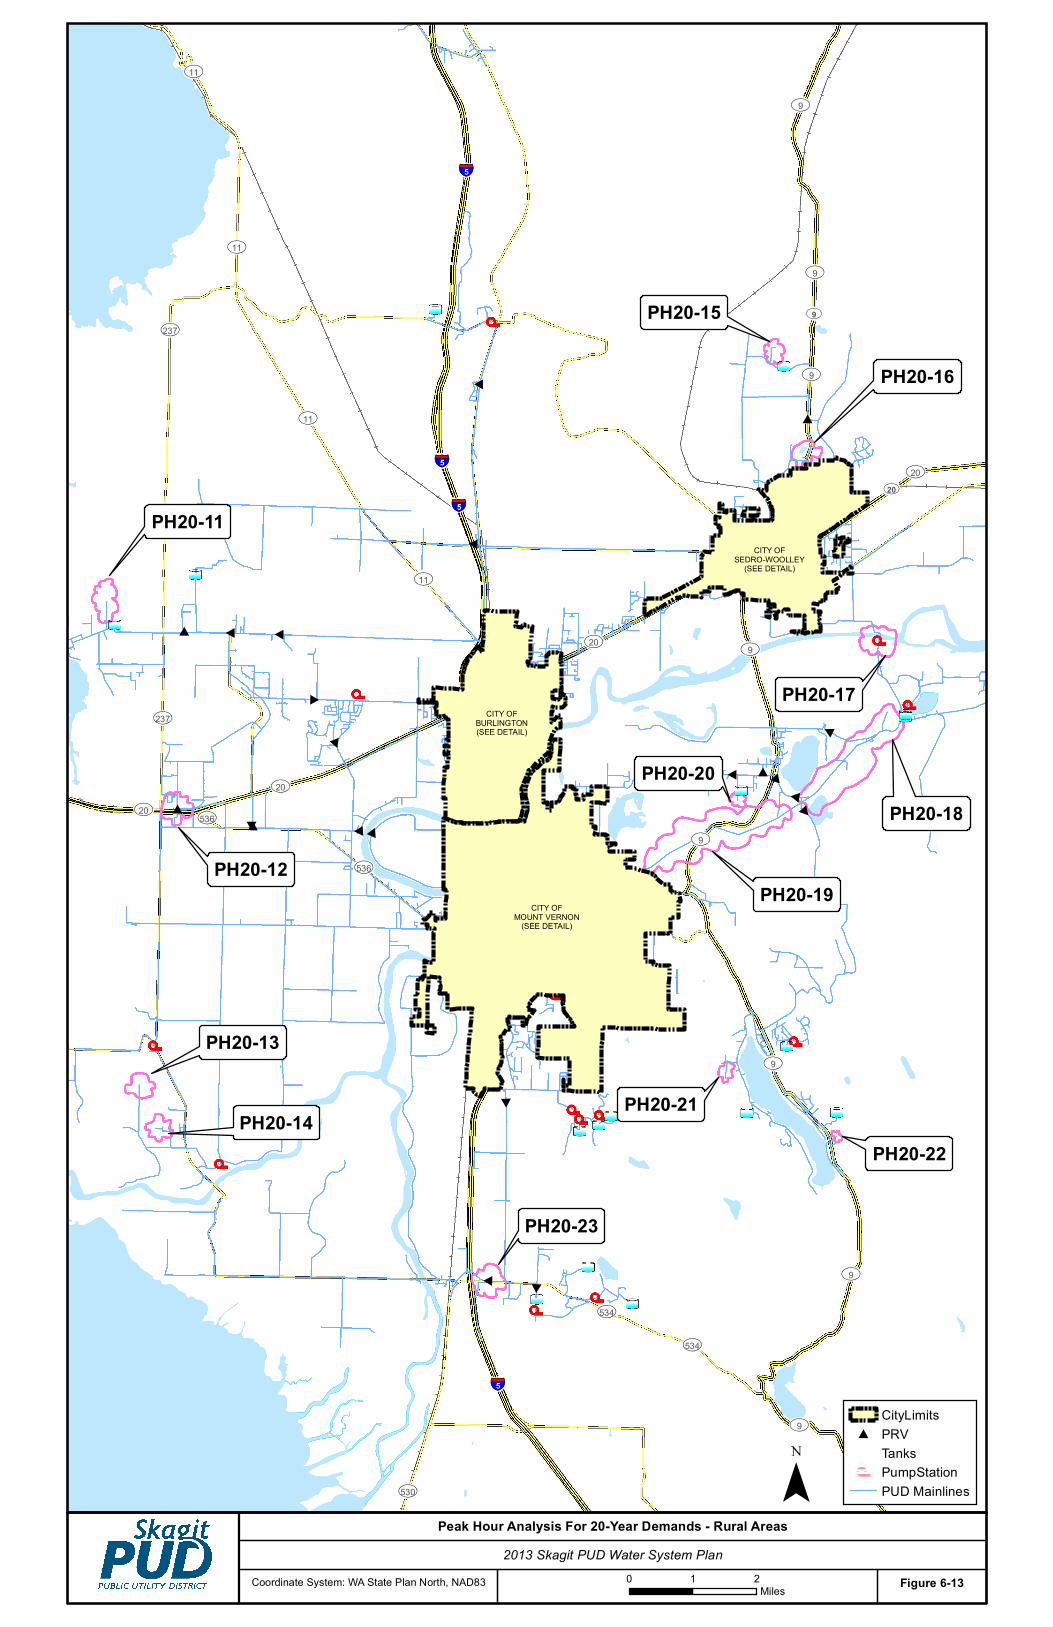
The locations for the resultant projects are shown on Figures 6-6 through 6-9 for the 6-year demands, and Figures 6-10 through 6-13 for 20-year demands. Brief descriptions for each of the projects listed on the figures are described below.
Skagit PUD Water System Plan 6-29 August 2014

Mount Vernon 6-Year Projects
PH6-1, 9th and Highland
• The 6-inch-diameter ductile iron pipe connection to the 24-inch-diameter CCP transmission main that is feeding the 322 pressure zone (9th & Highland PRV) is approaching District velocity criteria.
• The fire hydrant at the intersection of North 8th Street and E. Highland Avenue is approaching minimum pressure requirements.
PH6-2, Laventure / Kulshan PRV
• The 12-inch-diameter ductile iron piping network that feeds the Laventure/Kulshan PRV is approaching District velocity criteria.
PH6-3, Fir-Waugh Booster Station
• The 8-inch-diameter PVC and ductile iron pipe on Waugh Road beginning from the 24/36-inch-diameter transmission main near Seneca Drive, south of the Fir-Waugh pump station, is approaching District velocity criteria.
PH6-4, Lilac Drive
• The fire hydrant at the intersection of Lilac Drive and Honeysuckle Drive is approaching the minimum pressure requirements.
PH6-5, East Blackburn
• The blow-off serving a few residential houses on the east end of East Blackburn Road is approaching the minimum pressure requirements. The houses are located on a dead-end line and their elevation is higher than the water main located on East Blackburn Road.
Burlington 6-Year Projects
There were no projects identified in Burlington for the 6-year analysis.
Sedro-Woolley 6-Year Projects
There were no projects identified in Sedro-Woolley for the 6-year analysis.
6-30 Skagit PUD Water System Plan August 2014

Rural Areas 6-Year Projects
PH6-6, Bay View Ridge
• A blow-off at the end of the 8-inch-diameter ductile iron main on Rector Road in Bay View Ridge is approaching the minimum pressure requirements.
PH6-7, Hoogdal
• A blow-off at the end of the 6-inch-diameter ductile iron main on Dennis Lane, near the Hoogdal Tank, is below the minimum 20-psi limit. This is due to the line being a dead-end and at a substantially higher elevation than the main water line.
PH6-8, Old Day Creek Road
• A blow-off at the end of the 6-inch-diameter PVC main on Old Day Creek Road is approaching the minimum pressure requirements.
PH6-9, Teak Lane
• A blow-off at the end of the 8-inch-diameter ductile iron main on Teak Lane, near the Buchanan Hill Reservoir, is approaching the minimum pressure requirements.
PH6-10, Amick Road
• The fire hydrant near the end of the 8-inch-diameter ductile iron main on Amick Road, on the west side of Big Lake, is approaching the minimum pressure requirements.
PH6-11, Big Lake
• The fire hydrant near the end of the 8-inch-diameter ductile iron main on Stonewood Drive, on the east side of Big Lake south of the reservoirs, is approaching the minimum pressure requirements.
Mount Vernon 20-Year Projects
PH20-1, 9th and Highland (Same as PH6-1)
• The 6-inch-diameter ductile iron pipe connection to the 24-inch-diameter CCP transmission main that is feeding the 322 pressure zone (9th & Highland PRV) is approaching District velocity criteria.
• The fire hydrant at the intersection of North 8th Street and E. Highland Avenue is approaching minimum pressure requirements.
Skagit PUD Water System Plan 6-31 August 2014

PH20-2, Kulshan PRV
• The District velocity criterion through the 2-inch 9th & Kulshan PRV is exceeded.
• The District velocity criterion through the 3-inch 9th & Williams Way PRV is exceeded.
PH20-3, LaVenture / Kulshan PRV (Same as PH6-2)
• The 12-inch-diameter ductile iron piping network that feeds the Laventure/Kulshan PRV is approaching District velocity criteria.
PH20-4, Fir-Waugh Booster Station (Same as PH6-3)
• The 8-inch-diameter PVC and ductile iron pipe on Waugh Road beginning from the 24/36-inch-diameter transmission main near Seneca Drive, south of the Fir-Waugh pump station, is approaching District velocity criteria.
PH20-5, College Way / Monte Vista PRV
• The velocity through the 3-inch-diameter pipe serving the College Way/Monte Vista PRV is exceeding District criteria.
PH20-6, Lilac Drive (Same as PH6-4)
• The fire hydrant at the intersection of Lilac Drive and Honeysuckle Drive is approaching the minimum pressure requirements.
PH20-7, East Blackburn (Same as PH6-5)
• The blow-off serving a few residential houses on the east end of East Blackburn Road is approaching the minimum pressure requirements. The houses are located on a dead-end line and their elevation is higher than the water main located on East Blackburn Road.
Burlington 20-Year Projects
There were no projects identified in Burlington for the 20-year analysis.
Sedro-Woolley 20-Year Projects
PH20-8, Rhodes Road
• The velocity criterion for the 6-inch-diameter pipe serving the Rhodes Road PRV is being exceeded.
6-32 Skagit PUD Water System Plan August 2014

• The 12-inch-diameter ductile iron pipe at the Rhodes Road PRV, connected to the transmission main and running north to serve Cook Road, is approaching the District’s velocity criterion.
PH20-9, SR 9 and State Street
• At the intersection of West State Street and SR 9, there is a section of 16-inch-diameter ductile iron pipe that runs east/west under SR 9 in steel casing that is approaching District velocity criteria.
PH20-10, 1st and Nelson
• At the intersection of 1st and Nelson, there is a section of 16-inch-diameter pipe that is approaching District velocity criteria.
Rural Areas 20-Year Projects
PH20-11, Bay View (Same as PH6-6)
• A blow-off at the end of the 8-inch-diameter ductile iron main on Rector Road in Bay View Ridge is approaching the minimum pressure requirements.
PH20-12, Fredonia PRV
• The 6-inch-diameter pipe at the 8-inch Fredonia PRV is exceeding District velocity criteria.
PH20-13, Valentine Road
• A blow-off at the end of the 8-inch-diameter ductile iron main on Valentine Road is approaching minimum pressure requirements.
PH20-14, Lesord Lane
• A blow-off at the end of the 8-inch-diameter ductile iron main on Lesord Lane is approaching minimum pressure requirements.
PH20-15 Hoogdal (Same as PH6-7)
• A blow-off at the end of the 6-inch-diameter ductile iron main on Dennis Lane, near the Hoogdal Tank, is below the minimum 20 psi limit. This is due to the line being a dead-end and at a substantially higher elevation than the main water line.
PH20-16, SR 9 and Bassett Road PRV
• The velocity through the 3-inch-diameter steel pipe at the SR 9/Bassett Road PRV is exceeding District velocity criteria.
Skagit PUD Water System Plan 6-33 August 2014

PH20-17, Judy to Sedro-Woolley Transmission Main
• The section of 20-inch-diameter CCP transmission main, south of the Skagit River, is exceeding District velocity criteria.
PH20-18, Old Day Creek Road
• A blow-off at the end of the 6-inch-diameter PVC main on Old Day Creek Road is approaching the minimum pressure requirements.
• The section of the 24-inch-diameter CCP transmission main that runs from the WTP to Beaver Lake Road is exceeding District velocity criteria.
• The 2-inch-diameter piping and PRV at Beaver Lake and Fox Road that serves the Clear Lake area exceeds District velocity criteria.
PH20-19, Judy Reservoir to Mount Vernon Transmission Main
• The section of the 24-inch-diameter CCP transmission main that runs from Beaver Lake Road to College Way is approaching District velocity criteria.
PH20-20, Teak Lane (Same as PH6-9)
• A blow-off at the end of the 8-inch-diameter ductile iron main on Teak Lane, near the Buchanan Hill Reservoir, is approaching the minimum pressure requirements.
PH20-21 Amick Road (Same as PH6-10)
• The fire hydrant near the end of the 8-inch-diameter ductile iron main on Amick Road, on the west side of Big Lake, is approaching the minimum pressure requirements.
PH20-22 Big Lake (Same as PH6-11)
• The fire hydrant near the end of the 8-inch-diameter ductile iron main on Stonewood Drive, on the east side of Big Lake south of the reservoirs, is approaching the minimum pressure requirements.
PH20-23, Conway PRV
• The 2-inch-diameter piping and PRV on SR 534 serving the Conway area exceeds District velocity criteria.
6-34 Skagit PUD Water System Plan August 2014

###
#
##
##
##
#
#
#
#
# #
#
#
##
## #
#
PH6-5
P7
PH6-1
PH6-2PH6-3
PH6-4
Tina'sComa PRV506'-402'
CASCADERIDGE #3 30k858' Spill
CASCADERIDGE #1 80k
322' Spill
CASCADERIDGE #2 20k592' Spill
TINAS COMA230k
506' Spill
Tina's ComaBooster
270'-506'Tina's ComaPRV 506'-402'
SkagitSkagitRiverRiver
BarneyBarneyLakeLake
GagesGagesLakeLake
Ten LakeTen Lake
South ForkSouth ForkSkagitSkagitRiverRiver
UV20
UV9
UV536
UV538
§¦5
§¦5
§¦5
# PRVPumpStationTanksCityLimitsPUD Mainlines
0 0.5 1Miles Figure 6-6
Peak Hour Analysis For Current & 6-Year Demands - City of Mount Vernon¯
2013 Skagit PUD Water System PlanCoordinate System: WA State Plan North, NAD83


#
#
#
SkagitSkagitRiverRiver
GagesGagesLakeLake
§¦5
§¦5
§¦5
§¦5
# PRVTanksPumpStationCityLimitsPUD Mainlines
0 0.25 0.5Miles Figure 6-7
Peak Hour Analysis for Current & 6-Year Demands - City of Burlington¯
2013 Skagit PUD Water System PlanCoordinate System: WA State Plan North, NAD83


#
#
#
#
#
# #
# #
#
UV20 UV9
UV20
UV20
UV9
UV9
UV9
UV9
UV20
UV20
UV9
UV9
UV9 # PRVPumpStationTanksCityLimitsPUD Mainlines
0 0.4 0.8Miles Figure 6-8
Peak Hour Analysis for Current & 6-year Demands - City of Sedro-Woolley
¯2013 Skagit PUD Water System Plan
Coordinate System: WA State Plan North, NAD83


#
#
#
###
## #
#
# #
##
#
#
#
#
# #
#
#
CITY OFMOUNT VERNON
(SEE DETAIL)
CITY OFBURLINGTON(SEE DETAIL)
CITY OFSEDRO-WOOLLEY
(SEE DETAIL)
PH6-11PH6-10
PH6-9PH6-8
PH6-7
PH6-6
UV20
UV20
UV20
UV9
UV9
UV9
UV530
UV11
UV11
UV11
UV11
UV536
UV536
UV534
UV534
UV20
UV237
UV237
UV9
UV9
UV9
UV9
UV20
UV9
§¦5
§¦5
§¦5
§¦5
CityLimits# PRV
TanksPumpStationPUD Mainlines
0 1 2Miles Figure 6-9
Peak Hour Analysis For Current & 6-Year Demands - Rural Areas¯
2013 Skagit PUD Water System PlanCoordinate System: WA State Plan North, NAD83


###
#
##
##
##
#
#
#
#
# #
#
#
##
## #
#
PH20-7
P7
PH20-1
PH20-3PH20-4
PH20-6
PH20-2
Tina'sComa PRV506'-402'
CASCADERIDGE #3 30k858' Spill
CASCADERIDGE #1 80k
322' Spill
CASCADERIDGE #2 20k592' Spill
TINAS COMA230k
506' Spill
Tina's ComaBooster
270'-506'Tina's ComaPRV 506'-402'
SkagitSkagitRiverRiver
BarneyBarneyLakeLake
GagesGagesLakeLake
Ten LakeTen Lake
South ForkSouth ForkSkagitSkagitRiverRiver
UV20
UV9
UV536
UV538
§¦5
§¦5
§¦5
# PRVPumpStationTanksCityLimitsPUD Mainlines
0 0.5 1Miles Figure 6-10
Peak Hour Analysis For 20-Year Demands - City of Mount Vernon2013 Skagit PUD Water System Plan
Coordinate System: WA State Plan North, NAD83


#
#
#
SkagitSkagitRiverRiver
GagesGagesLakeLake
§¦5
§¦5
§¦5
§¦5
# PRVTanksPumpStationCityLimitsPUD Mainlines
0 0.25 0.5Miles Figure 6-11
Peak Hour Analysis For 20-Year Demands - City of Burlington¯
2013 Skagit PUD Water System PlanCoordinate System: WA State Plan North, NAD83


#
#
#
#
#
# #
# #
#
PH20-10
PH20-9PH20-8
UV20 UV9
UV20
UV20
UV9
UV9
UV9
UV9
UV20
UV20
UV9
UV9
UV9 # PRVPumpStationTanksCityLimitsPUD Mainlines
0 0.4 0.8Miles Figure 6-12
Peak Hour Analysis For 20-year Demands - City of Sedro-Woolley2013 Skagit PUD Water System Plan
Coordinate System: WA State Plan North, NAD83

#
#
#
###
## #
#
# #
##
#
#
#
#
# #
#
#
CITY OFMOUNT VERNON
(SEE DETAIL)
CITY OFBURLINGTON(SEE DETAIL)
CITY OFSEDRO-WOOLLEY
(SEE DETAIL)
PH20-22
PH20-21
PH20-20PH20-18
PH20-15
PH20-11
PH20-12
PH20-13
PH20-14
PH20-23
PH20-19
PH20-17
PH20-16
UV20
UV20
UV20
UV9
UV9
UV9
UV530
UV11
UV11
UV11
UV11
UV536
UV536
UV534
UV534
UV20
UV237
UV237
UV9
UV9
UV9
UV9
UV9
UV20
UV9
§¦5
§¦5
§¦5
§¦5
CityLimits# PRV
TanksPumpStationPUD Mainlines
0 1 2Miles Figure 6-13
Peak Hour Analysis For 20-Year Demands - Rural Areas2013 Skagit PUD Water System Plan
Coordinate System: WA State Plan North, NAD83

6.5.5 Fire Flow Analysis Fire flow analyses were run for the 6-year and 20-year demands. Fire flow analyses are run as steady-state evaluations, which evaluate system conditions at a single point in time. For the District system, a batch fire flow analysis was run within each pressure zone using a requirement of 500 gpm for all hydrants located within residential zoned areas and 1,500 gpm for all hydrants located within commercial zoned areas.
Available fire flow is the amount of water that can be withdrawn from a single fire hydrant without dropping the pressure at the hydrant or throughout the zone to less than 20 psi. Thus, a pressure somewhat remote from the flowing hydrant could limit the available fire flow. Fire flow simulations assume that water levels in the storage reservoir are set with equalizing, operating, and fire flow storage completely depleted.
Fire flow analyses for the 20-year demand identified a number of areas that were unable to meet fire flow requirements. In all cases, the deficiencies were due to dead-end lines or small areas of the system that consist of 2-, 3-, or 4-inch-diameter water lines that were installed when fire flow requirements were not the primary factor in sizing the pipes. Recommendations to resolve the deficiencies include replacing the undersized pipelines and trying to loop the system where possible to eliminate the dead-end lines. Many projects were developed to replace the undersized pipelines, and most of these were combined with other projects that were developed as part of the minor capital project list (see Chapter 10) to make the projects cost effective. Projects to loop the system where possible were also developed, and these were also combined with other projects to make them cost effective.
In general, most of the fire flow deficient areas will be remedied through the District’s minor capital projects. However, there are a number of areas that have long, undersized dead-end lines that are on the list of projects that need to be completed, but will take some time to complete because of the large number of other projects that are also a priority. The Judy System is very large and the District has many other projects to complete in order to ensure that aging and leaking pipes are replaced. This is the reason for the District’s asset management approach to project selection, which is described in detail in Section 10.2. This approach helps the District score and rank each potential project using a number of evaluation criteria so that the projects can be prioritized. Fire flow availability is one of the evaluation criteria, and it is weighted very high in terms of importance.
The 6-year fire flow analysis was also completed, but did not add any additional projects over and above the 20-year analysis.
Figures were not developed to show the location of the fire flow deficient areas because of the size and scale of the Judy System with respect to the number of undersized and dead-end pipelines.
Skagit PUD Water System Plan 6-51 August 2014

6.5.6 Model Improvements Based on the modeling results of the peak hour and fire flow analyses that were completed in conjunction with the asset management approach in the selection of other projects, the major and minor CIP projects were developed and are presented in Chapter 10. The projects were grouped together where possible to provide cost efficiencies.
In the process of performing the analyses and documenting other activities related to the hydraulic model, the District identified some tasks that will be performed to improve the accuracy and reliability of the hydraulic model, as listed below:
• During the conversion of the hydraulic model from WaterGEMS to Innovyze, some pipeline information was not associated with nodes and some asset information was not filled in, such as year, material, etc. The model will be examined for pipeline inconsistencies, disconnected nodes, duplicate pipelines, and asset information related to pipelines, PRVs, pump stations, and reservoirs.
• The hydrant flow tests that were performed and documented as described earlier in this chapter show that the hydraulic model is reasonably accurate when compared to static conditions in the field. However, there were not enough hydrant flow tests considering the number of pressure zones in the Judy System, and residual pressures were not taken when the hydrant was flowing. The District will embark on a more thorough and expansive calibration program to perform more hydrant flow tests in order to calibrate the hydraulic model.
• The District was able to perform extended period simulations for each individual pressure zone, but had difficulty performing the simulation for the entire Judy System because of the number of reservoirs, PRVs, and pump stations. The District will continue to work with the developer of the hydraulic model to improve the performance of the model when working with the Judy System.
6-52 Skagit PUD Water System Plan August 2014