Embed Size (px)
Citation preview
CHAPTER 6 Measurement of viscosity in laboratory
101
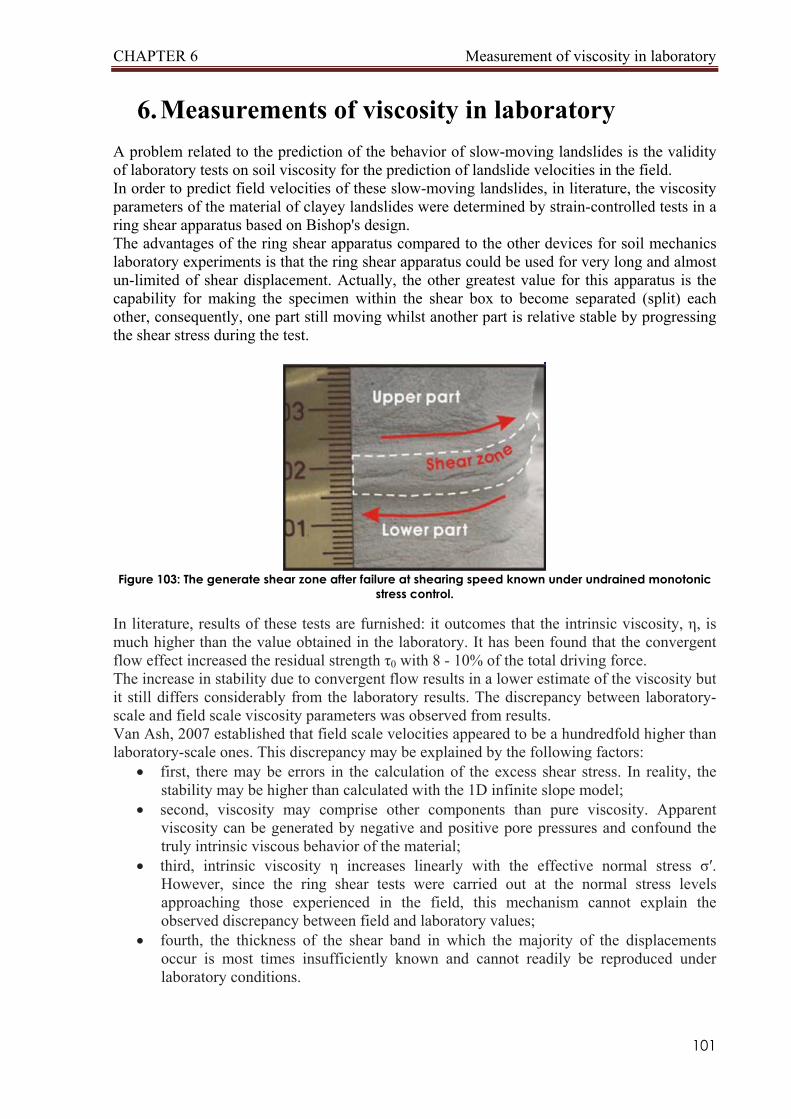
6. Measurements of viscosity in laboratory A problem related to the prediction of the behavior of slow-moving landslides is the validity of laboratory tests on soil viscosity for the prediction of landslide velocities in the field. In order to predict field velocities of these slow-moving landslides, in literature, the viscosity parameters of the material of clayey landslides were determined by strain-controlled tests in a ring shear apparatus based on Bishop's design. The advantages of the ring shear apparatus compared to the other devices for soil mechanics laboratory experiments is that the ring shear apparatus could be used for very long and almost un-limited of shear displacement. Actually, the other greatest value for this apparatus is the capability for making the specimen within the shear box to become separated (split) each other, consequently, one part still moving whilst another part is relative stable by progressing the shear stress during the test.
Figure 103: The generate shear zone after failure at shearing speed known under undrained monotonic
stress control.
In literature, results of these tests are furnished: it outcomes that the intrinsic viscosity, η, is much higher than the value obtained in the laboratory. It has been found that the convergent flow effect increased the residual strength τ0 with 8 - 10% of the total driving force. The increase in stability due to convergent flow results in a lower estimate of the viscosity but it still differs considerably from the laboratory results. The discrepancy between laboratory-scale and field scale viscosity parameters was observed from results. Van Ash, 2007 established that field scale velocities appeared to be a hundredfold higher than laboratory-scale ones. This discrepancy may be explained by the following factors:
• first, there may be errors in the calculation of the excess shear stress. In reality, the stability may be higher than calculated with the 1D infinite slope model;
• second, viscosity may comprise other components than pure viscosity. Apparent viscosity can be generated by negative and positive pore pressures and confound the truly intrinsic viscous behavior of the material;
• third, intrinsic viscosity η increases linearly with the effective normal stress σ′. However, since the ring shear tests were carried out at the normal stress levels approaching those experienced in the field, this mechanism cannot explain the observed discrepancy between field and laboratory values;
• fourth, the thickness of the shear band in which the majority of the displacements occur is most times insufficiently known and cannot readily be reproduced under laboratory conditions.
CHAPTER 6 Measurement of viscosity in laboratory
102
Laboratory-scale viscosity parameters from strain controlled ring shear tests are inconsistent with field scale findings from back analyses; the laboratory values proved to be a 10 to 1000 times lower than those from the field. Viscosities derived from strain-controlled direct shear tests over a smaller strain range on not disrupted material proved to be more apt to describe visco-plastic creep movements in a broader zone above the discrete shear band. Apart from the difficulty of measuring the real viscosity in the shear band, the prediction of displacement rates in the field remains very difficult due to other field factors. The local geometry of landslides and the elasticity of their material generate an uneven distribution of the excess shear stress along the landslide. Zones of compression and extension create positive and negative excess pore pressures that result in a hysteresis in the apparent viscosity which renders it extremely difficult to predict the mobility of slow-moving landslides in detail.
CHAPTER 6 Measurement of viscosity in laboratory
103
6.1. Equipment previous measurements In order to furnish a physical sense at viscosity, in 2007 in UPC have been made several activities about Vallcebre’s soil samples:
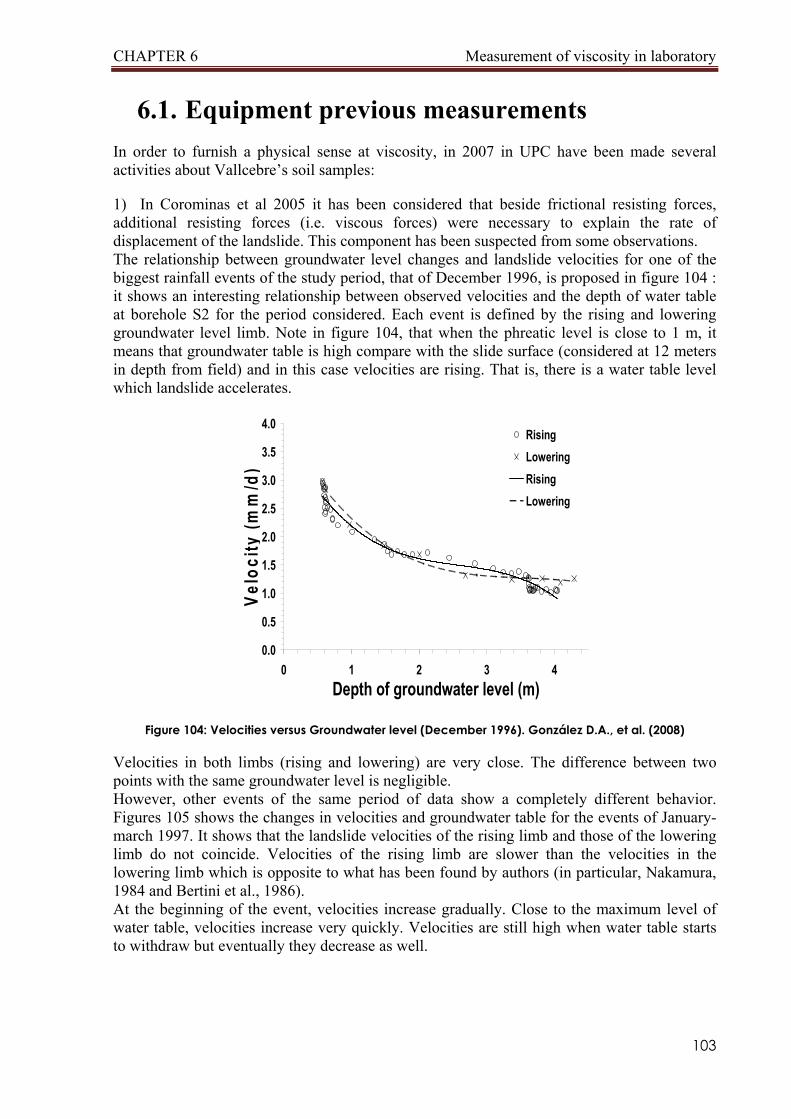
1) In Corominas et al 2005 it has been considered that beside frictional resisting forces, additional resisting forces (i.e. viscous forces) were necessary to explain the rate of displacement of the landslide. This component has been suspected from some observations. The relationship between groundwater level changes and landslide velocities for one of the biggest rainfall events of the study period, that of December 1996, is proposed in figure 104 : it shows an interesting relationship between observed velocities and the depth of water table at borehole S2 for the period considered. Each event is defined by the rising and lowering groundwater level limb. Note in figure 104, that when the phreatic level is close to 1 m, it means that groundwater table is high compare with the slide surface (considered at 12 meters in depth from field) and in this case velocities are rising. That is, there is a water table level which landslide accelerates.
0.0
0.5
1.0
1.5
2.0
2.5
3.0
3.5
4.0
0 1 2 3 4Depth of groundwater level (m)
Velo
city
(mm
/d)
RisingLoweringRisingLowering
Figure 104: Velocities versus Groundwater level (December 1996). González D.A., et al. (2008)
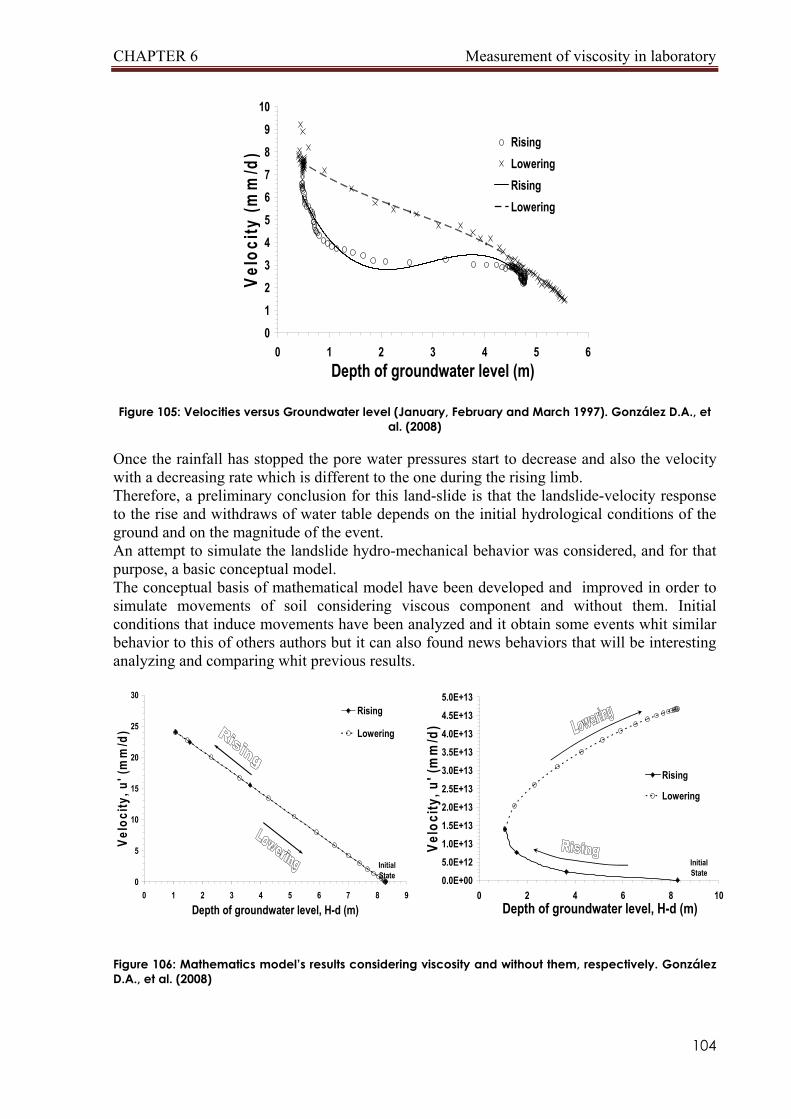
Velocities in both limbs (rising and lowering) are very close. The difference between two points with the same groundwater level is negligible. However, other events of the same period of data show a completely different behavior. Figures 105 shows the changes in velocities and groundwater table for the events of January-march 1997. It shows that the landslide velocities of the rising limb and those of the lowering limb do not coincide. Velocities of the rising limb are slower than the velocities in the lowering limb which is opposite to what has been found by authors (in particular, Nakamura, 1984 and Bertini et al., 1986). At the beginning of the event, velocities increase gradually. Close to the maximum level of water table, velocities increase very quickly. Velocities are still high when water table starts to withdraw but eventually they decrease as well.
CHAPTER 6 Measurement of viscosity in laboratory
104
01
234
5
678
9
10
0 1 2 3 4 5 6Depth of groundwater level (m)
Velo
city
(mm
/d) Rising
LoweringRisingLowering
Figure 105: Velocities versus Groundwater level (January, February and March 1997). González D.A., et al. (2008)
Once the rainfall has stopped the pore water pressures start to decrease and also the velocity with a decreasing rate which is different to the one during the rising limb. Therefore, a preliminary conclusion for this land-slide is that the landslide-velocity response to the rise and withdraws of water table depends on the initial hydrological conditions of the ground and on the magnitude of the event. An attempt to simulate the landslide hydro-mechanical behavior was considered, and for that purpose, a basic conceptual model. The conceptual basis of mathematical model have been developed and improved in order to simulate movements of soil considering viscous component and without them. Initial conditions that induce movements have been analyzed and it obtain some events whit similar behavior to this of others authors but it can also found news behaviors that will be interesting analyzing and comparing whit previous results.
0.0E+00
5.0E+12
1.0E+13
1.5E+13
2.0E+13
2.5E+13
3.0E+13
3.5E+13
4.0E+13
4.5E+13
5.0E+13
0 2 4 6 8 10Depth of groundwater level, H-d (m)
Velo
city
, u' (
mm
/d)
Rising
Lowering
Initial State
Figure 106: Mathematics model’s results considering viscosity and without them, respectively. González D.A., et al. (2008)
0
5
10
15
20
25
30
0 1 2 3 4 5 6 7 8 9
Depth of groundwater level, H-d (m)
Velo
city
, u' (
mm
/d)
Rising
Lowering
Initial State
CHAPTER 6 Measurement of viscosity in laboratory
105
In figure 106 the relationship between velocities and depth of groundwater level taking into account a viscous component is shown. Note that with this model, the response of velocities to the rising and lowering limb of groundwater level is the same.
In the case in which the viscosity term has been neglected, in the rising limb the velocity is increasing and in the lowering limb continues increasing without deceleration of the mass movement when the groundwater level is low. That is, the viscosity provides with a mechanism for dissipating energy in the system, and eventually helps reducing velocity and stabilising the landslide. Yet now UPC’s group is choosing some events in periods of September 1998 untill September 2007 to obtain similar behaviors and to more understand real mechanism of the same.
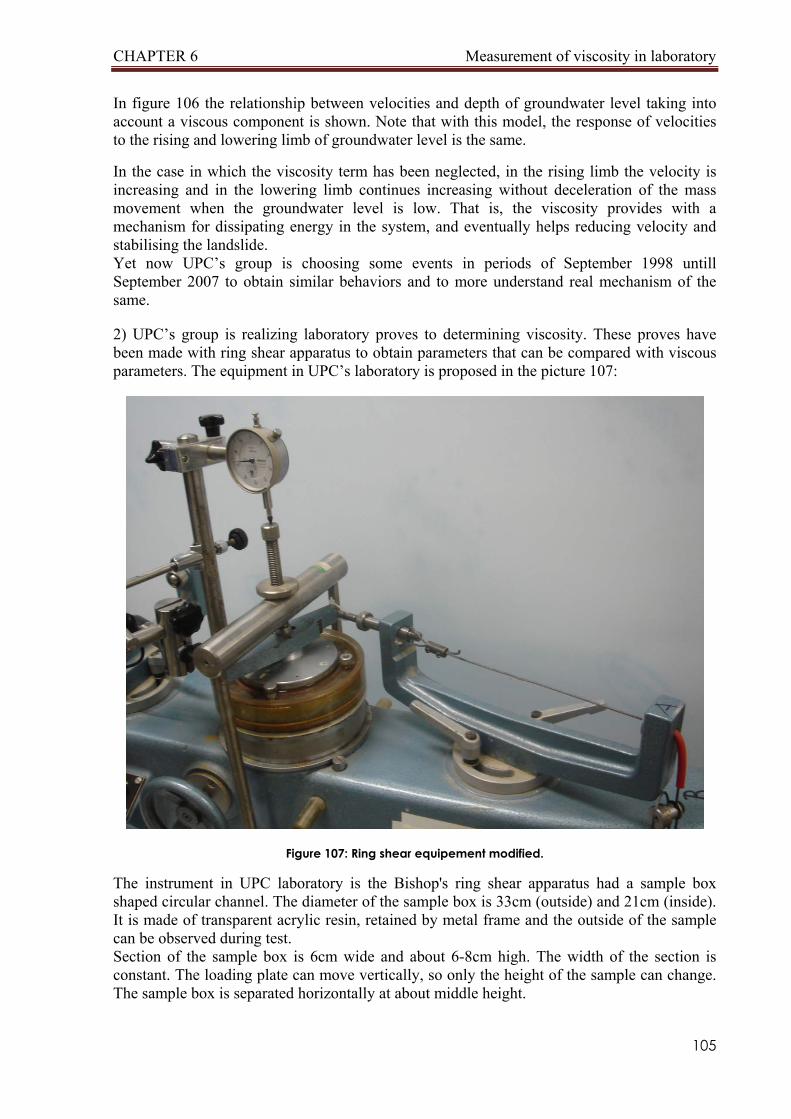
2) UPC’s group is realizing laboratory proves to determining viscosity. These proves have been made with ring shear apparatus to obtain parameters that can be compared with viscous parameters. The equipment in UPC’s laboratory is proposed in the picture 107:
Figure 107: Ring shear equipement modified.
The instrument in UPC laboratory is the Bishop's ring shear apparatus had a sample box shaped circular channel. The diameter of the sample box is 33cm (outside) and 21cm (inside). It is made of transparent acrylic resin, retained by metal frame and the outside of the sample can be observed during test. Section of the sample box is 6cm wide and about 6-8cm high. The width of the section is constant. The loading plate can move vertically, so only the height of the sample can change. The sample box is separated horizontally at about middle height.
CHAPTER 6 Measurement of viscosity in laboratory
106
In the original apparatus, the lower one is rotated by servo-control motor for shear. Several non-skid needle assemblies are fixed on the base and the ceiling (loading plate) of the sample box and they prevent the sample from slipping on either side. So, rotation of the lower sample box causes torsion of sample. Vertical displacement of the sample is measured with the dial gauge. As the sample box cannot deform sideways, the measured vertical displacement multiplied by the area of loading plate is variation of volume of the sample. Shear displacement is measured with rotary encoder which contact with the lower part of the sample box which rotates during test. The shear speed is calculated from the rate of rotation and it is displayed at each result of the tests shown below as the shear speed at the center of the sample. All these measured parameters (in particular shear displacement as rotations) are output as electric voltage through the amplifier unit.
CHAPTER 6 Measurement of viscosity in laboratory
107
6.2. Experiment at UPC This study is focus on other type of prove with same instruments but it deals on a ring shear apparatus modified. These changes have been applied to control loads and not displacements as usually is done. In this way it would be possible bring sample to it rupture state and observe behavior and individuate, if it is possible, incidence of viscous component.
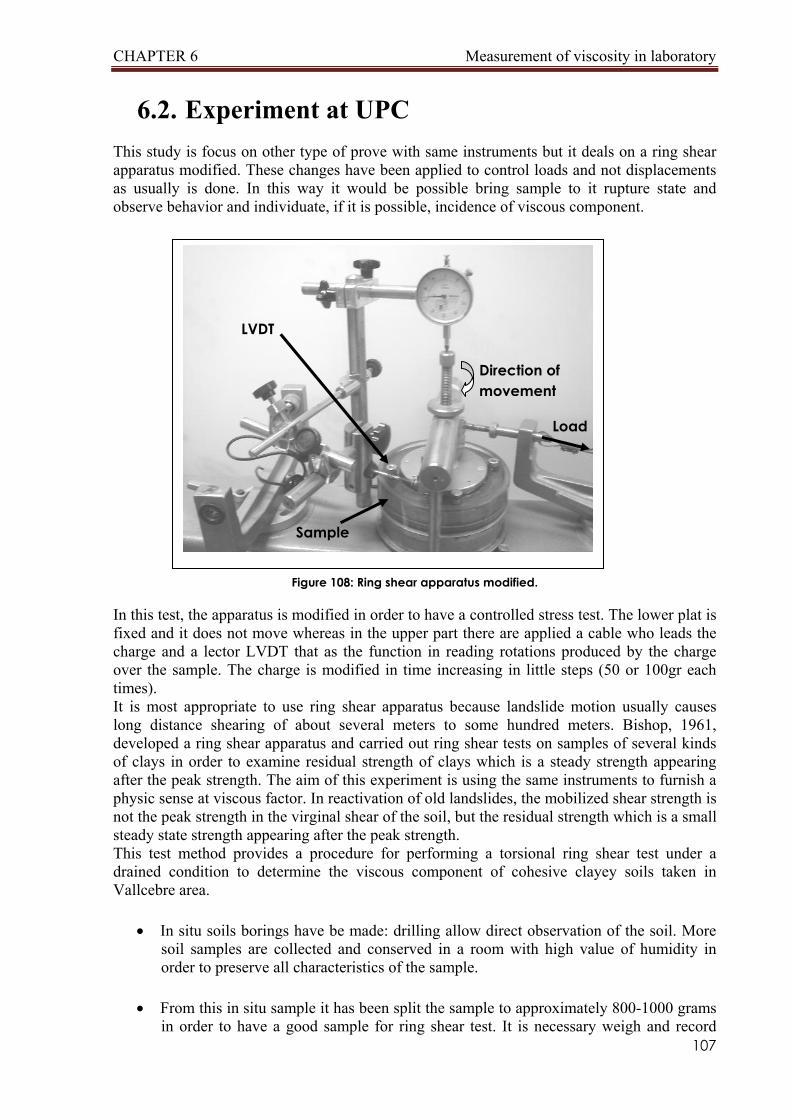
Figure 108: Ring shear apparatus modified.
In this test, the apparatus is modified in order to have a controlled stress test. The lower plat is fixed and it does not move whereas in the upper part there are applied a cable who leads the charge and a lector LVDT that as the function in reading rotations produced by the charge over the sample. The charge is modified in time increasing in little steps (50 or 100gr each times). It is most appropriate to use ring shear apparatus because landslide motion usually causes long distance shearing of about several meters to some hundred meters. Bishop, 1961, developed a ring shear apparatus and carried out ring shear tests on samples of several kinds of clays in order to examine residual strength of clays which is a steady strength appearing after the peak strength. The aim of this experiment is using the same instruments to furnish a physic sense at viscous factor. In reactivation of old landslides, the mobilized shear strength is not the peak strength in the virginal shear of the soil, but the residual strength which is a small steady state strength appearing after the peak strength. This test method provides a procedure for performing a torsional ring shear test under a drained condition to determine the viscous component of cohesive clayey soils taken in Vallcebre area.
• In situ soils borings have be made: drilling allow direct observation of the soil. More soil samples are collected and conserved in a room with high value of humidity in order to preserve all characteristics of the sample.
• From this in situ sample it has been split the sample to approximately 800-1000 grams
in order to have a good sample for ring shear test. It is necessary weigh and record
LVDT
Load
Sample
Direction of movement
CHAPTER 6 Measurement of viscosity in laboratory
108
weight (starting sample weight) on a form, used for sieve test data and subsequently dry the sample to a substantially constant weight at a temperature that should not exceed 230[degrees]F and set aside to cool. After cooling the sample, the weight under dry weight has been recorded.
• This sample is placed into a set of sieves. In this analysis, only sieve D40 has been used and stacked starting on the bottom with the pan and getting larger as you go up. The sieve stack is then shaken until all materials have found their proper stopping. Sieve tests can usually be shaken for 3-5 minutes.
• Carefully the material remaining at D40 sieve has been deposited into the balance scale pan and carefully weighed and recorded this weight on the sieve worksheet. Under grams retained, it has been used a brass brush to brush each sieve to make sure all sample is removed.
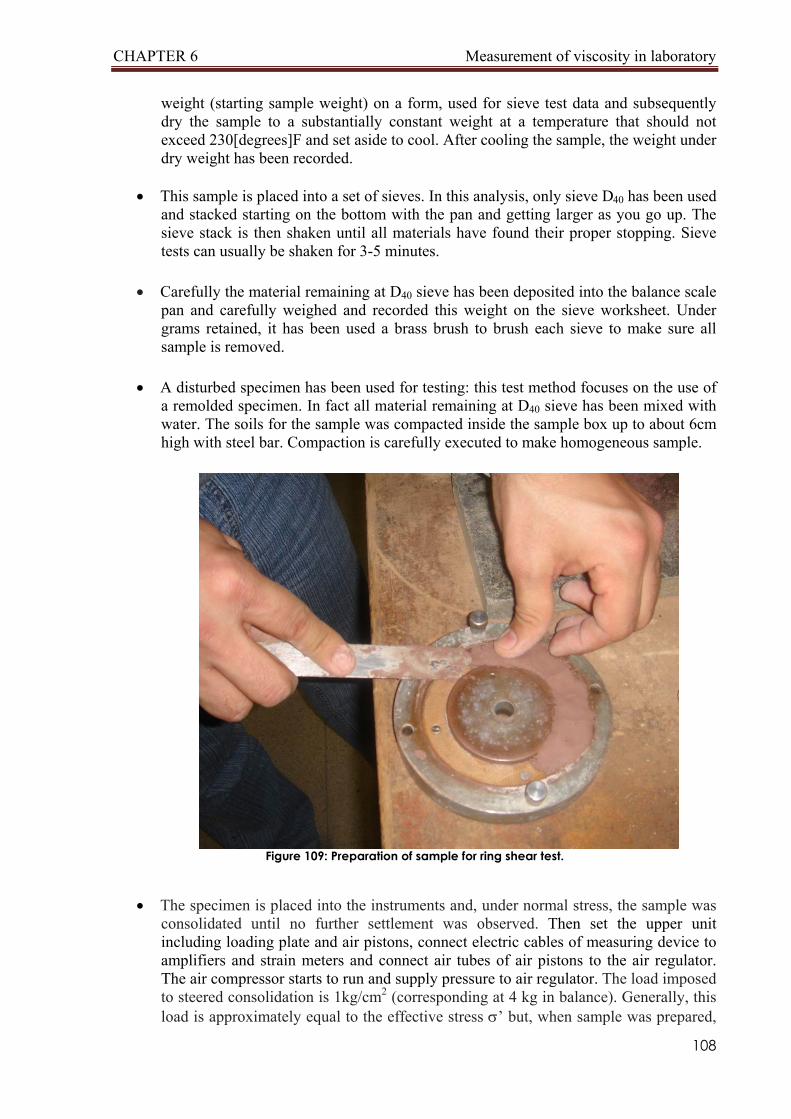
• A disturbed specimen has been used for testing: this test method focuses on the use of a remolded specimen. In fact all material remaining at D40 sieve has been mixed with water. The soils for the sample was compacted inside the sample box up to about 6cm high with steel bar. Compaction is carefully executed to make homogeneous sample.
Figure 109: Preparation of sample for ring shear test.
• The specimen is placed into the instruments and, under normal stress, the sample was
consolidated until no further settlement was observed. Then set the upper unit including loading plate and air pistons, connect electric cables of measuring device to amplifiers and strain meters and connect air tubes of air pistons to the air regulator. The air compressor starts to run and supply pressure to air regulator. The load imposed to steered consolidation is 1kg/cm2 (corresponding at 4 kg in balance). Generally, this load is approximately equal to the effective stress σ’ but, when sample was prepared,
CHAPTER 6 Measurement of viscosity in laboratory
109
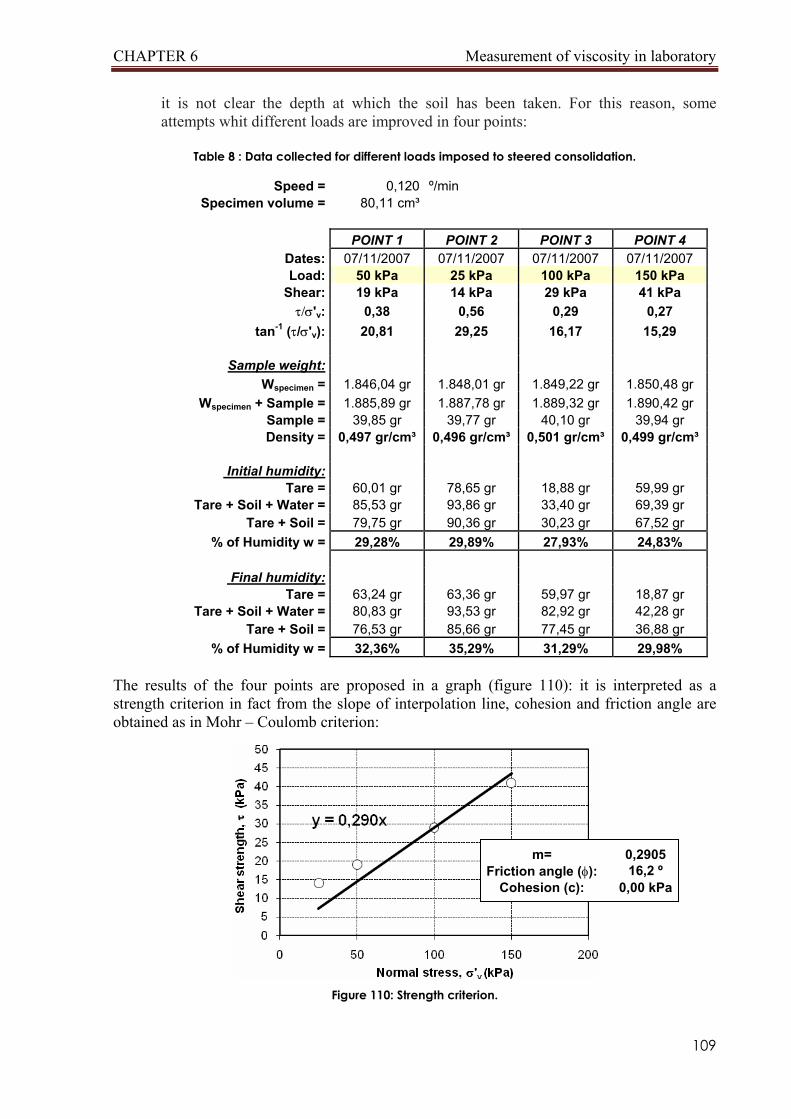
it is not clear the depth at which the soil has been taken. For this reason, some attempts whit different loads are improved in four points:
Table 8 : Data collected for different loads imposed to steered consolidation.
Speed = 0,120 º/min Specimen volume = 80,11 cm³ POINT 1 POINT 2 POINT 3 POINT 4 Dates: 07/11/2007 07/11/2007 07/11/2007 07/11/2007 Load: 50 kPa 25 kPa 100 kPa 150 kPa Shear: 19 kPa 14 kPa 29 kPa 41 kPa τ/σ'v: 0,38 0,56 0,29 0,27 tan-1 (τ/σ'v): 20,81 29,25 16,17 15,29 Sample weight: Wspecimen = 1.846,04 gr 1.848,01 gr 1.849,22 gr 1.850,48 gr Wspecimen + Sample = 1.885,89 gr 1.887,78 gr 1.889,32 gr 1.890,42 gr Sample = 39,85 gr 39,77 gr 40,10 gr 39,94 gr Density = 0,497 gr/cm³ 0,496 gr/cm³ 0,501 gr/cm³ 0,499 gr/cm³ Initial humidity: Tare = 60,01 gr 78,65 gr 18,88 gr 59,99 gr Tare + Soil + Water = 85,53 gr 93,86 gr 33,40 gr 69,39 gr Tare + Soil = 79,75 gr 90,36 gr 30,23 gr 67,52 gr % of Humidity w = 29,28% 29,89% 27,93% 24,83% Final humidity: Tare = 63,24 gr 63,36 gr 59,97 gr 18,87 gr Tare + Soil + Water = 80,83 gr 93,53 gr 82,92 gr 42,28 gr Tare + Soil = 76,53 gr 85,66 gr 77,45 gr 36,88 gr % of Humidity w = 32,36% 35,29% 31,29% 29,98%
The results of the four points are proposed in a graph (figure 110): it is interpreted as a strength criterion in fact from the slope of interpolation line, cohesion and friction angle are obtained as in Mohr – Coulomb criterion:
Figure 110: Strength criterion.
m= 0,2905 Friction angle (φ): 16,2 º
Cohesion (c): 0,00 kPa
CHAPTER 6 Measurement of viscosity in laboratory
110
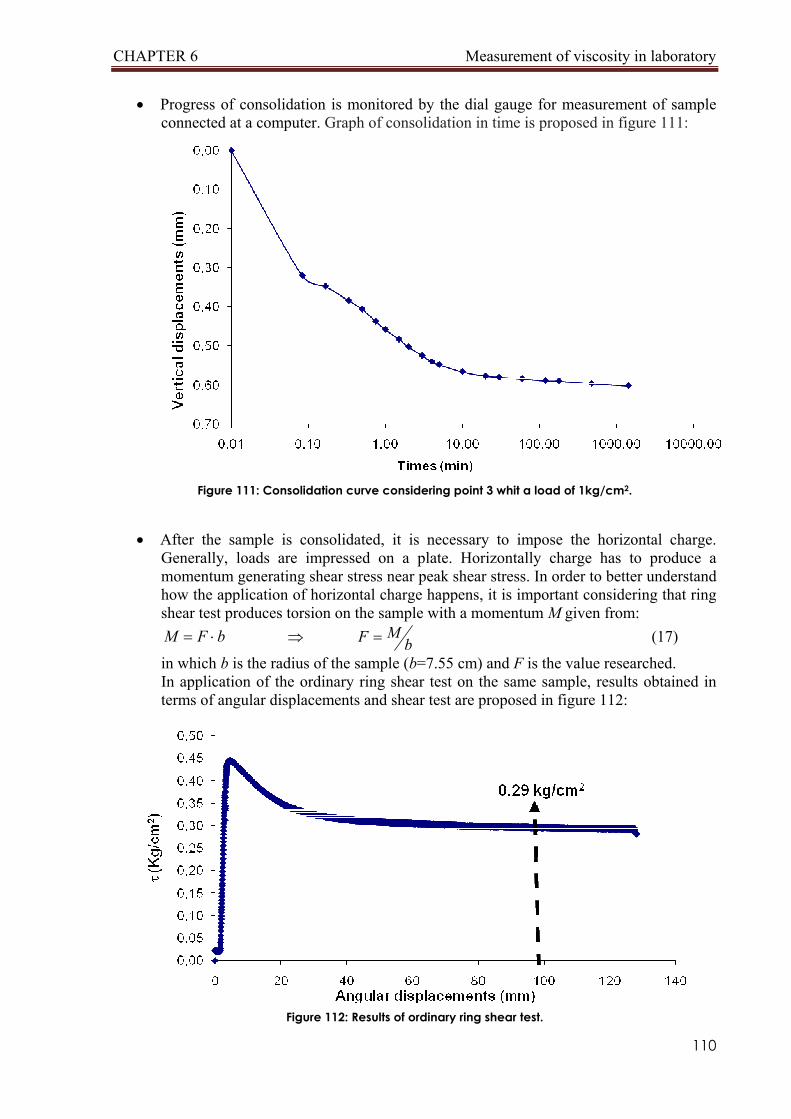
• Progress of consolidation is monitored by the dial gauge for measurement of sample connected at a computer. Graph of consolidation in time is proposed in figure 111:
Figure 111: Consolidation curve considering point 3 whit a load of 1kg/cm2.
• After the sample is consolidated, it is necessary to impose the horizontal charge.
Generally, loads are impressed on a plate. Horizontally charge has to produce a momentum generating shear stress near peak shear stress. In order to better understand how the application of horizontal charge happens, it is important considering that ring shear test produces torsion on the sample with a momentum M given from:
bFM ⋅= ⇒ bMF = (17)
in which b is the radius of the sample (b=7.55 cm) and F is the value researched. In application of the ordinary ring shear test on the same sample, results obtained in terms of angular displacements and shear test are proposed in figure 112:
Figure 112: Results of ordinary ring shear test.
CHAPTER 6 Measurement of viscosity in laboratory
111
In the graph, values of peak shear stress and residual shear stress are underlined. In this case, peak shear is about 2/45.0 cmkg=τ . The idea in this unconventional test is into apply a shear value near the pick value, in this case 2/40.0 cmkg=τ . From recorded data of previous experiment in ordinary condition of ring shear test, it has been possible to read the correspondent value of momentum that corresponds at
2/40.0 cmkg=τ . This momentum is imposed in equation 17 and the force required is found. This load was incremented in time in order to move shear stress closer to peak of shear test.
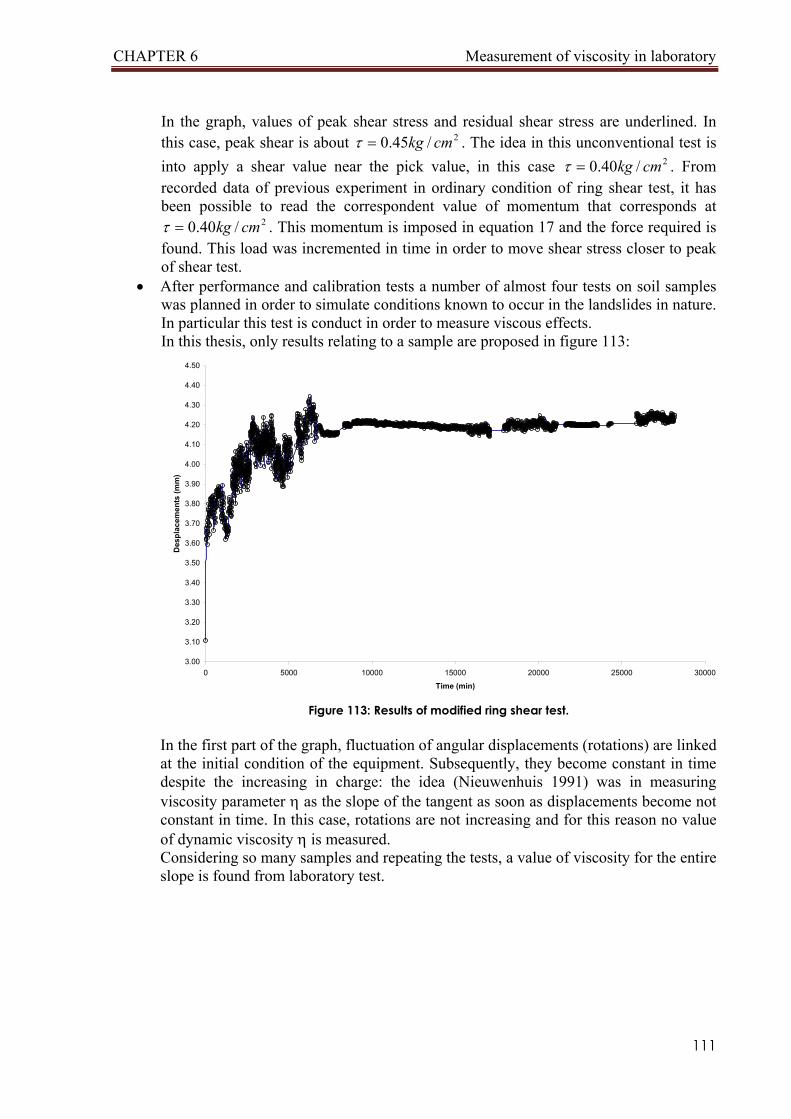
• After performance and calibration tests a number of almost four tests on soil samples was planned in order to simulate conditions known to occur in the landslides in nature. In particular this test is conduct in order to measure viscous effects. In this thesis, only results relating to a sample are proposed in figure 113:
3.00
3.10
3.20
3.30
3.40
3.50
3.60
3.70
3.80
3.90
4.00
4.10
4.20
4.30
4.40
4.50
0 5000 10000 15000 20000 25000 30000
Time (min)
Des
plac
emen
ts (m
m)
Figure 113: Results of modified ring shear test.
In the first part of the graph, fluctuation of angular displacements (rotations) are linked at the initial condition of the equipment. Subsequently, they become constant in time despite the increasing in charge: the idea (Nieuwenhuis 1991) was in measuring viscosity parameter η as the slope of the tangent as soon as displacements become not constant in time. In this case, rotations are not increasing and for this reason no value of dynamic viscosity η is measured. Considering so many samples and repeating the tests, a value of viscosity for the entire slope is found from laboratory test.