Embed Size (px)
DESCRIPTION
gce
Citation preview
Gas chromatography
First instrumental chromatographic method developed commercially.
Reason - it is relatively easy to produce a stable flow and pressure for the mobile phase -
carrier gas.
All that is really needed is a tank of compressed gas, pressure regulator and a valve.
Schematic of a packed columngas chromatograph
carriergas
datasystem
detector
sampleintroduction
column
heatedzones
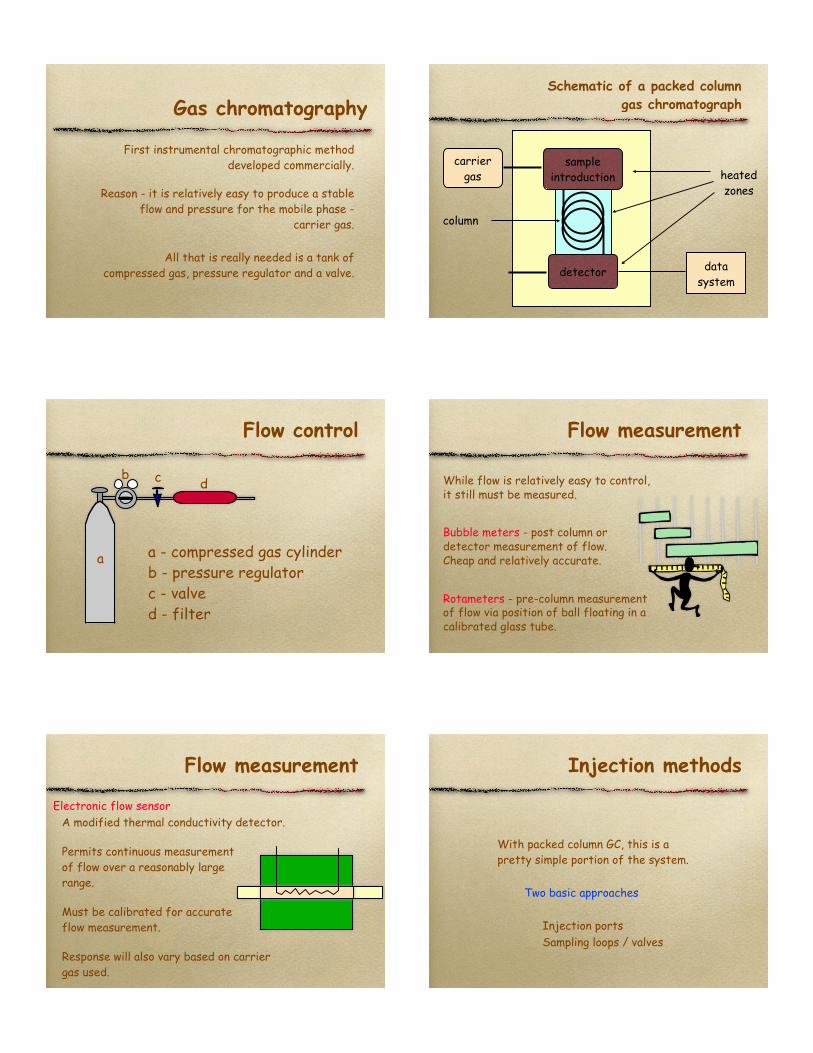
Flow control
a
b c d
a - compressed gas cylinderb - pressure regulatorc - valved - filter
Flow measurement
While flow is relatively easy to control, it still must be measured.
Bubble meters - post column or detector measurement of flow. Cheap and relatively accurate.
Rotameters - pre-column measurement of flow via position of ball floating in a calibrated glass tube.
Flow measurement
Electronic flow sensorA modified thermal conductivity detector.
Permits continuous measurementof flow over a reasonably large range.
Must be calibrated for accurateflow measurement.
Response will also vary based on carrier gas used.
Injection methods
With packed column GC, this is a pretty simple portion of the system.
Two basic approaches
Injection ports Sampling loops / valves

Injection port
septum
heat source
carrier in
liner
column
Injection port
Purpose of port is to flash evaporate your sample and introduce it into the column.
TINJ 25 - 50oC above Tcolumn
Injection is through a septum.
Septum must be stable at the Tinj
replaced regularly to maintain seal
Injection port
Liner.Provides a known area for the flash vaporization.
Typically made of glass although metal liners may be used. Some instruments don’t have liners. Some columns will extend through the port, directly to the septum.
It can and should be replaced at regular intervals - all non-volatile materials and degradation products end up here.
Syringes
Syringes are used to introduce a known volume of a liquid or gas samples .
Adapters can be used to help control the volume injected.
Syringes
Various styles are available
Fixed needle Removable needle Several needle lengths and angles
Sample volumes from < 1 µl an up Body loading Through the barrel plungers
Syringes
‘Through the barrel’ syringe equipped with a Chaney Adapter and removable needle.

Autoinjector Syringe injection methods
Major source of precision error is from poor injection technique.
Both automatic and manual injection methods are available.
If automatic equipment is present, use it. If not, several approaches can be tried to help reduce injection errors.
Syringe injection
The first step is tomake sure that thesyringe is properlyloaded -- containingno air bubbles.
Syringe injection
Samples should beinjected as a plug.
Rapid and consistent injection is necessary in order to obtain acceptable precision.
Slow Fast
Syringe injection
After injection, it isrelatively easy todetermine how muchmaterial remains inthe needle.
Syringe injection
When loading a syringe, you can see how much sample is in the barrel but not in the needle.
During injection, some sample can volatilize from the needle tip, causing poor precision.
This can result in sample discrimination- worst for capillary column injections.

Example of sample discrimination.C10 - C24 n-alkanes
Filled needle method Hot needle method
coldon-columninjection
Syringe injection
Several techniques can be tried to help improve manual injection precision.
Try different, less volatile solventUse syringe guide
Use ‘through the barrel’ syringeMeasure needle volume“Hot needle” method
Syringe loading
Needle volume correction
Load sample into syringe
Read the volume
Rapidly inject the sample - remove the syringe
Start run then pull back on syringe
Subtract the needle volume from the total
Hot needle method
1. Draw sample into syringe barrel.
2. Next, draw 2-3 µl air into barrel.
3. Insert needle into injection port and allow to heat for a few seconds.
4. Rapidly inject sample and withdraw the needle.
This insures that all sample is injected and the ‘hot needle’ assists in solvent volatilization.
Syringe loading methods
sample only
sample + air
air + sample + air
solvent + air + sample + air
Sample size
Liquids 0.1 - 10 µl is typical
Gases 0.5 - 5 ml is typical
Injection precision with a syringe is +/- 1%
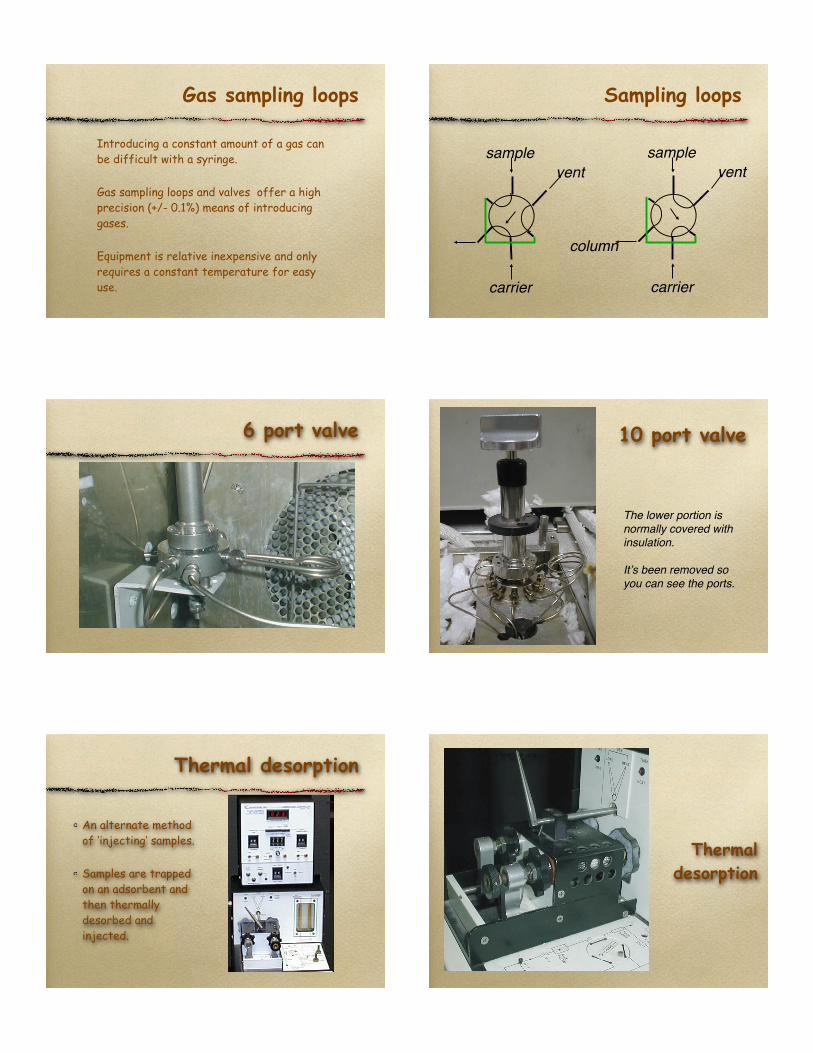
Gas sampling loops
Introducing a constant amount of a gas can be difficult with a syringe.
Gas sampling loops and valves offer a high precision (+/- 0.1%) means of introducing gases.
Equipment is relative inexpensive and only requires a constant temperature for easy use.
Sampling loops
samplevent
carrier
samplevent
carrier
column
6 port valve 10 port valve
The lower portion is normally covered with insulation.
Itʼs been removed so you can see the ports.
Thermal desorption
An alternate method of ‘injecting’ samples.
Samples are trapped on an adsorbent and then thermally desorbed and injected.
Thermal desorption

Columns
• Heart of the separation process.
• Vast number of materials have been evaluated.
• It is usually best to refer to various catalogs as an up to date reference.
• Can be classified by tubing diameter and packing type.
Types of columns
Conventional 1/8-1/4” OD, stainless steel or glass tube 6 - 20 feet in length
Preparative > 1/4” >10 feet in length
Capillary 0.1 - 0.5 mm ID 10 - 100 meters in length
Types of columns
ColumnsOpen tubular
(capillary)
coated withporous layer
boundphase
liquid coatedwall
Packed withporous layer
liquidcoated
packedcapillary
Packed
non-porouspacking
porouspacking
Types of columns
Packed open (capillary)
WallCoatedOpenTube
PorousLayerOpenTube
bead column
porous layer
conventional
1/4” packed column 1/8” packed column

Stainless steel capillary column
This is a real antique.
All of these were internally coated.
Fused silica capillary column
Packed column selection
We’ll deal with capillary columns in the next unit. For now, let’s go over how to select an appropriate column.
Unless you’re developing new packing materials or methods, the best starting point is to consult a chromatographic catalog.
They provide a wealth of information regarding cost, temperature limits, sample applications . . . .
Examples of stationary phases
Copyright, 1997, Supelco Inc.
Bellefonte, PA. Used with permission.
Examples of packings
Copyright, 1997, Supelco Inc., Bellefonte, PA. Used with permission.
Examples of empty columns
Copyright, 1997, Supelco Inc., Bellefonte, PA. Used with permission.

Packed column examples
Copyright, 1997, Supelco Inc., Bellefonte, PA. Used with permission.
Example application
Copyright, 1997, Supelco Inc., Bellefonte, PA. Used with permission.
Exampleapplication
Copyright, 1997, Supelco Inc., Bellefonte, PA. Used with permission.
When all else fails!
Most chromatographic supply companies offer toll free technical support.
Before calling, be ready to answer with
!Instrument and model.
!Injection and detection method.
!If capillary or packed columns are desired.
!Type of sample, solvent and concentrations of each component expected.
Kovats retention index
Each chromatographic setup will vary to some degree.
Retention times for a known set of species can be hard to reproduce from one lab to another or even one instrument to another.
Retention indexing helps to standardize your results.
Kovats retention index
Method is based on results of homologous series where log tR ! n .
log
t R
number of carbon

The index value for any material can be found from:
Vo
R - net retention volume, can use tR
VoR(n-Cn) < Vo
R(unknown) < VoR(n-Cn+1)
n-paraffins are used as reference standards and must bracket the unknown.
Kovats retention index
I= 100 logVR(n-Cn+1)O - logVR(n-Cn)
OlogVR(unk)
O - logVR(n-Cn)O
+ 100n
Kovats retention index
tR, column 1
tR, column 2
I
octa
ne
hept
ane
hexa
ne
pent
ane
buta
ne
tolu
ene
800 600 400
Kovats retention index
All that is really being done is to normalize each component compared to n-paraffins.
It assumes that you are dealing with either identical or at least very similar columns or packings.
Packing that have large differences can result in peaks eluting in different orders - the method would then be useless
McReynolds constants
Method to evaluate a wide range of phases.
• Based on measuring performance for a set of representative substances.
• Often provided by suppliers
• Can tell if two phases should give comparable performance or if a phase is better for specific functional groups.
McReynolds constants
Group Substance Symbolaromatic, benzene X’olefinic
alcohols, 1-butanol Y’phenols, acids
ketones, ethers, methyl-n-propyl Z’esters, aldehydes ketone
nitro, nitriles nitropropane U’
bases, aromatic pyridine S’hetrocyclics
McReynolds constants
Squalane is used as the reference material and all other packings are normalized to it.
Packing TMAX X’ Y’ Z’ U’ S’squalane 150 0 0 0 0 0SE-30 350 15 53 44 64 41OV-7 350 69 113 111 171 128Carbowax 20M 250 322 536 368 572 59

Temperature programming
The column sits in an oven.
If the temperature is held constant during the entire analysis it is isothermal.
If you vary the temperature during the analysis, you typically use a temperature program.
Why bother?
Temperature programming
• With homologues, the retention time increases exponentially with the number of carbon.
• As tR increases, width increases and the height decreases, making detection impossible after a few peaks have eluted.
• Since solubility of a gas in a liquid decreases as temperature goes up, we can reduce the retention of a material by increasing Tcolumn.
Example
isothermal
programmedtemperature
Temperature programming
Factors to consider: Variations in solubility of solutes Changes in volatility of solutes Stability of solutes Flowrate changes Stability of stationary phase
Must stay within Tmin/Tmax of column.Other factors are found experimentally.
A temperature program
(a)(b)
(c)
a - initial temperature and timeb - ramp (oC/min)c - final hold time and temperature
Most GCs will allow for a more complex program.
Temperature programming
General steps to create a program assuming that the separation is possible.
1. Determine initial temperature and time based on best possible separation of first few peaks.
2. Repeat 1 for the last few peaks to find the best final temperature and time.
3. Experiment with various ramps to account for the rest of the components.

Detectors
We need a way to measure our eluents as they evolve from the column.
Virtually every method of directly or indirectly observing eluents as been looked at.
We’ll cover some of the more common types.
Detectors
Each can be roughly classified based on
Destructive vs. nondestructive
General vs. some discrimination vs. very discriminating
Let’s start by reviewing some general concepts such as detection limit and sensitivity.
Properties of a good detector
High sensitivity - possible selectivity
Rapidly respond to concentration changes
Large linear range
Stable with respect to noise and drift
Low sensitivity to variations in flow, pressure and temperature
Produces an easily handled signal
Detector Response Characteristics
SensitivityResponse per amount of sample. Slope of response/amount curve.
Minimum detectable level (MDL)The amount of sample in which the peak height is 2 or 3 times the noise height.
Dynamic Range.Range where detector gives increasing response with increasing amount (amount/ml carrier gas.)
Linear Dynamic Range.Range when detector gives linear response (amount/ml carrier gas.)
S/N 5
S/N 4
S/N 3
S/N 2
S/N 1
Signal to noise example Dynamic Range
Lineardynamicrange
Dynamicrange

ConcentrationLinear range.Linear range of detector will tell you maximum at any given measurement.
Linear range for analysis will work work with the sum of all measurements -- range is much larger than detector range.
GC detectors sensitivities and ranges
AED
TCD
FID
ECD
NPD (N)
NPD (P)
FPD (S)
FPD (P)
FTIR
MS (SIM) MS (Scan)
10-15 g 10-12 g 10-9 g 10-6 g 10-3 g
Thermal conductivity detector
• General purpose• Nondestructive• Limit of detection ~ 400 pg/ml carrier• Linear range ~ 106
Mode of detection Change in resistance of a wire based on variations in the thermal conductivity of the gas evolving from a column.
Representative thermalconductivity values, 100oC
Thermal conductivitySpecies 105 cal/cm sec oC
hydrogen 49.93helium 39.85nitrogen 7.18ethane 7.67water 5.51benzene 4.14acetone 3.96chloroform 2.33
Thermal conductivity detector
While hydrogen has the largest TC value, helium is commonly used - less reactive.
Hydrogen will give a negative peak when helium is the carrier gas.
Peak response is a function the the TC value for a species so you must standardize for each eluent of interest.
Thermal conductivity detector
powersupply
detectorblock
recorder
zerocontrol carrier +
sample
carrierreference
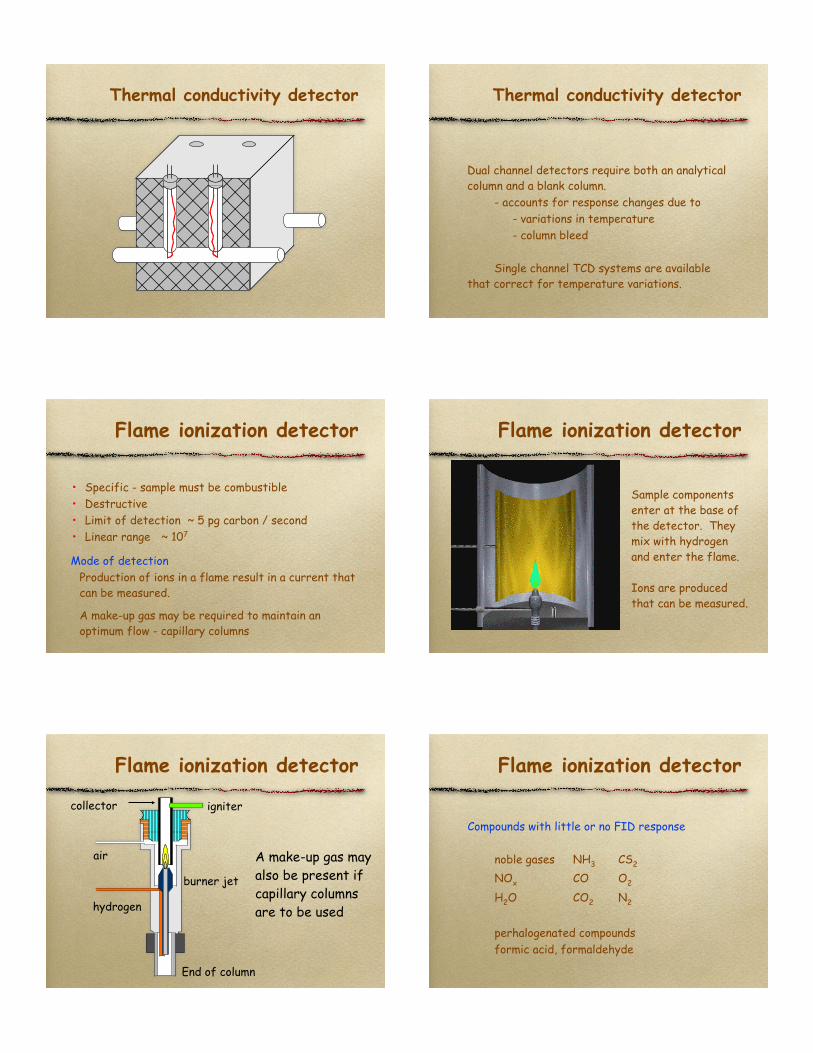
Thermal conductivity detector Thermal conductivity detector
Dual channel detectors require both an analytical column and a blank column. - accounts for response changes due to - variations in temperature - column bleed
Single channel TCD systems are available that correct for temperature variations.
Flame ionization detector
• Specific - sample must be combustible• Destructive• Limit of detection ~ 5 pg carbon / second• Linear range ~ 107
Mode of detection Production of ions in a flame result in a current that can be measured.
A make-up gas may be required to maintain an optimum flow - capillary columns
Flame ionization detector
Sample componentsenter at the base ofthe detector. Theymix with hydrogenand enter the flame.
Ions are producedthat can be measured.
Flame ionization detector
air
hydrogen
End of column
burner jet
collector igniter
A make-up gas may also be present ifcapillary columnsare to be used
Flame ionization detector
Compounds with little or no FID response
noble gases NH3 CS2
NOx CO O2
H2O CO2 N2
perhalogenated compounds formic acid, formaldehyde

FID responsefo
rmic
aci
d
acet
ic a
cid
prop
ioni
c ac
id
buta
noic
aci
d
pent
anoi
c ac
id
met
hane
etha
ne
prop
ane
buta
ne
Response is based on the number of carbon and if other elements like halogens or oxygen are present which reduce combustion.
Effect of carrier gas typeThe carrier gas used will affect the type of response you obtain.
FID
Res
pons
e
CarrierHydrogen
Ratio
N2
He
View of FID and TCD FID and TCD
FID
TCD
Electron capture
• Specific - sample must contain a gas phase electrophore
• Non-destructive• Limit of detection ~ 0.1 pg Cl / second• Linear range ~ 104
Mode of detection Absorption of " particles by species containing halogens, nitriles, nitrates, conjugated double bonds, organometallics.
Electron capture
!- are emitted byan 63Ni source.
Electrophores will absorb !- , reducing thecurrent.
This is the basisfor the response

Electron capture
anode
63Ni plated surface
columnmakeup gas
ventanode purge
Electron capture detector
Provides excellent trace analysis of halogenated compounds nitro group compounds eluents with conjugated double bonds
Most common use is environmental analysis of organochlorine pesticides
Major problem - detector is radioactive. Requires regular area testing and must be licensed.
Electron capture detector
Relative responses100 hydrocabons
101 esters, ethers
102 alcohols, ketones, monochlorides, amines
103 monobromides, dichlorides
104 anhydrides, trichlorides105 - 106 poly halogenated, mono and diiodo
ECD exampleChlorinated pesticides in apples
Nitrogen-phosphorous detector
• Specific - sample must contain nitrogen or phosphorous - based on operational mode.
• Destructive• Limit of detection ~ 0.4 pg N / second ~ 0.2 pg P / second• Linear range ~ 104
Mode of operation. Essentially a modified FID. Active element acts to block undesired species
NPD
collector
active element
jet
column
air
hydrogen Active element is a K or Rb salt.
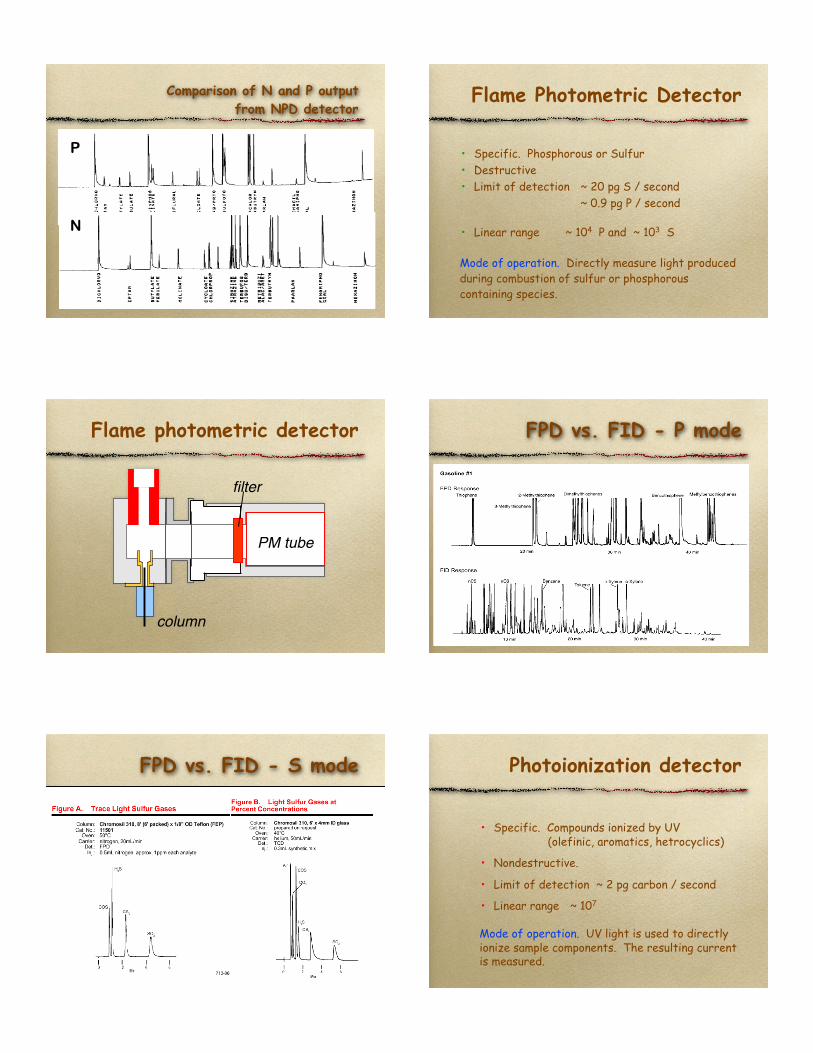
Comparison of N and P output from NPD detector
P
N
Flame Photometric Detector
• Specific. Phosphorous or Sulfur• Destructive• Limit of detection ~ 20 pg S / second ~ 0.9 pg P / second
• Linear range ~ 104 P and ~ 103 S
Mode of operation. Directly measure light produced during combustion of sulfur or phosphorous containing species.
Flame photometric detector
PM tube
column
filter
FPD vs. FID - P mode
FPD vs. FID - S mode Photoionization detector
• Specific. Compounds ionized by UV (olefinic, aromatics, hetrocyclics)
• Nondestructive.
• Limit of detection ~ 2 pg carbon / second
• Linear range ~ 107
Mode of operation. UV light is used to directly ionize sample components. The resulting current is measured.
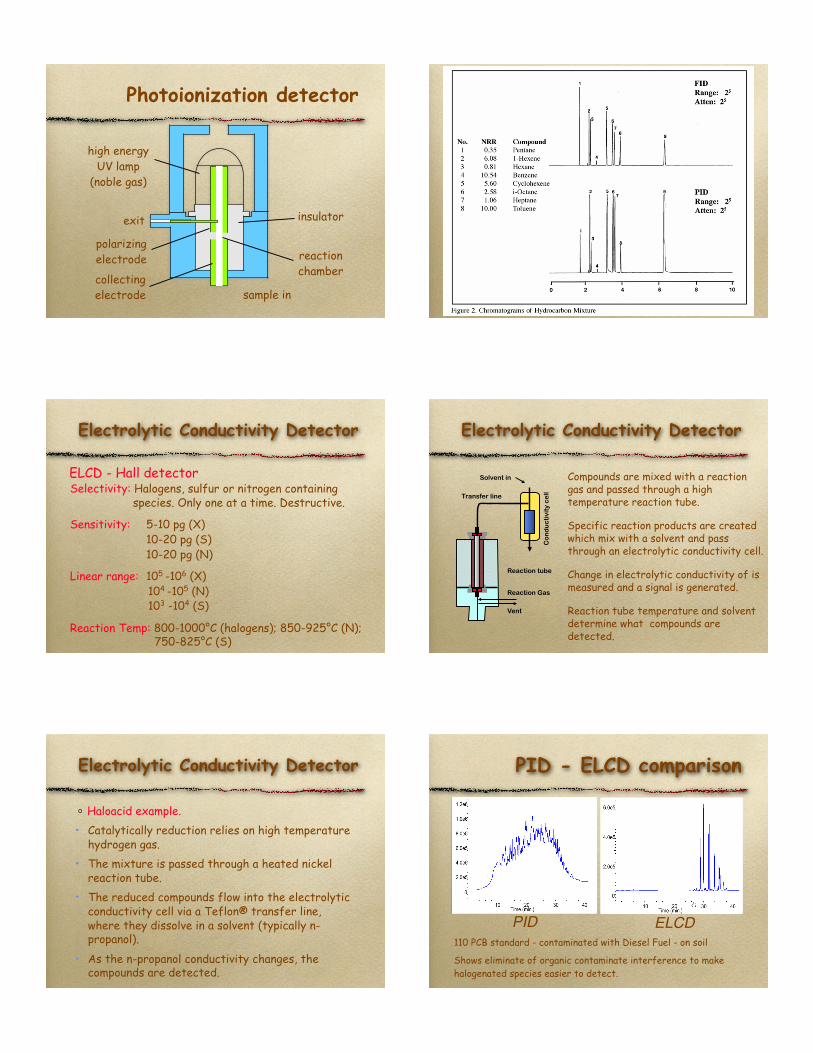
Photoionization detector
exit
sample incollectingelectrode
polarizingelectrode
insulator
reactionchamber
high energyUV lamp
(noble gas)
Electrolytic Conductivity Detector
ELCD - Hall detectorSelectivity: Halogens, sulfur or nitrogen containing species. Only one at a time. Destructive.
Sensitivity: 5-10 pg (X) 10-20 pg (S) 10-20 pg (N)
Linear range: 105 -106 (X) 104 -105 (N) 103 -104 (S)
Reaction Temp: 800-1000°C (halogens); 850-925°C (N); 750-825°C (S)
Electrolytic Conductivity Detector
Compounds are mixed with a reaction gas and passed through a high temperature reaction tube.
Specific reaction products are created which mix with a solvent and pass through an electrolytic conductivity cell.
Change in electrolytic conductivity of is measured and a signal is generated.
Reaction tube temperature and solvent determine what compounds are detected.
Reaction Gas
Vent
Reaction tube
Transfer line
Co
nd
uc
tivi
ty c
ell
Solvent in
Electrolytic Conductivity Detector
Haloacid example.• Catalytically reduction relies on high temperature
hydrogen gas.• The mixture is passed through a heated nickel
reaction tube. • The reduced compounds flow into the electrolytic
conductivity cell via a Teflon® transfer line, where they dissolve in a solvent (typically n-propanol).
• As the n-propanol conductivity changes, the compounds are detected.
PID - ELCD comparison
110 PCB standard - contaminated with Diesel Fuel - on soil
Shows eliminate of organic contaminate interference to make halogenated species easier to detect.
PID ELCD

Halogen Specific Detector (XSD)
• Specific: Halogenated compounds.
• Selectiviy: 104 Cl to hydrocarbon
• Destructive.
• Limit of detection: <1 pg Cl / second
• Linear range > 104
Mode of operation. Compounds are oxidatively pyrolyzed at 900-1100 oC - forming free halogen atoms. Atoms are then collected on cathode, forming electrons and halogen ions (thermionic emission).
Hyphenated methods
We’ll cover these approaches in another unit.
Overall - this approach amounts to attaching a GC to a second instrument that will produce qualitative data.
GC - MSGC - FTIRGC - AES