Embed Size (px)
Citation preview
7/24/2019 6 2 Hegyihinczmiktex v6n2
http://slidepdf.com/reader/full/6-2-hegyihinczmiktex-v6n2 1/17
Journal of Computational and Applied Mechanics, Vol. 6., No. 2., (2005), pp. 219–235
LONG-TERM ANALYSIS OF PRESTRESSED MEMBRANE
STRUCTURES
Dezső Hegyi
Department of Mechanics, Materials and StructuresBudapest University of Technology and Economics
Műegyetem rkp. 3-5., K. 323., H-1111 Budapest, Hungary
Krisztián Hincz
Research Group for Computational Structural MechanicsHungarian Academy of Sciences and Budapest University of Technology and Economics
Műegyetem rkp. 3-5., K. 323., H-1111 Budapest, Hungary
[Received: June 24, 2004]
Abstract. Our research can be divided into two different areas according to our mainobjectives. On the one hand, we made experiments to learn as much as possible about thelong-term behavior of the PVC-coated polyester textile; the most commonly used materialtype for the construction of tents in Hungary. On the other hand, we developed a procedurefor the numerical analysis of prestressed membrane structures on the basis of a visco-elasticmaterial model. In this paper we report about our first experimental and computationalresults.
Mathematical Subject Classification: 74K25Keywords : Membrane structure, creep, long-term analysis
1. Introduction
Prestressed tents are statically in- and overdeterminate structures. They can carrythe external loads only with prestress. If the level of prestress decreases, then thestiffness of the structure decreases. It means not only larger deformations, but ahigher risk of fluttering as well. If the level of prestress is extremely low, then anordinary wind can destroy the structure. If the prestress decreases to zero in onedirection, it results in undesired wrinkles.
After the erection of membrane structures the relaxation of the material is a generalexperience. Thus the structure has to be post-tensioned some days after constructionand sometimes after the first snowy winter again.
The relaxation of the PVC-coated polyester textile is well-known, but the literaturedoes not deal with the effect of relaxation on the static behavior and usability of thestructure. In our research we bring into focus the long-term behavior of the materialand its effect on the structure.
c2005 Miskolc University Press
7/24/2019 6 2 Hegyihinczmiktex v6n2
http://slidepdf.com/reader/full/6-2-hegyihinczmiktex-v6n2 2/17
220 D. Hegyi, K. Hincz
2. Creep test of the PVC-coated polyester textile
2.1. Aim of the tests. The aim of the material tests is to determine the time-dependent material law for the PVC coated polyester textile. In the case of pre-stressed membrane structures, time dependent deformation cannot be divided intocreep (increasing elongation while the stress is constant) and relaxation (decreasingstress while the elongation is constant). In practice the stresses and strains change
continuously. We started to make creep tests, because measurements on the relaxationrequire a higher technical level, therefore they are more expensive.
For the experiments we use material pieces according to the Hungarian and Germanstandards. The width of the specimen is 50 mm; the distance between the attachedpoints is 200 mm (a 100 mm-long part in the middle is analyzed). Till now we havemade experiments in four configurations:
– in warp direction under a load of 300, 600 and 900 N,– in a direction inclined by 45˚ to the warps under a load of 300 N.
Our experiences can be divided into two parts:
– results about material behavior,– experiences about the technique of measurements.
2.2. Experiences about the measuring technique. Textiles used for engineeringpurposes are more sensitive than the common building materials, so we have to plan
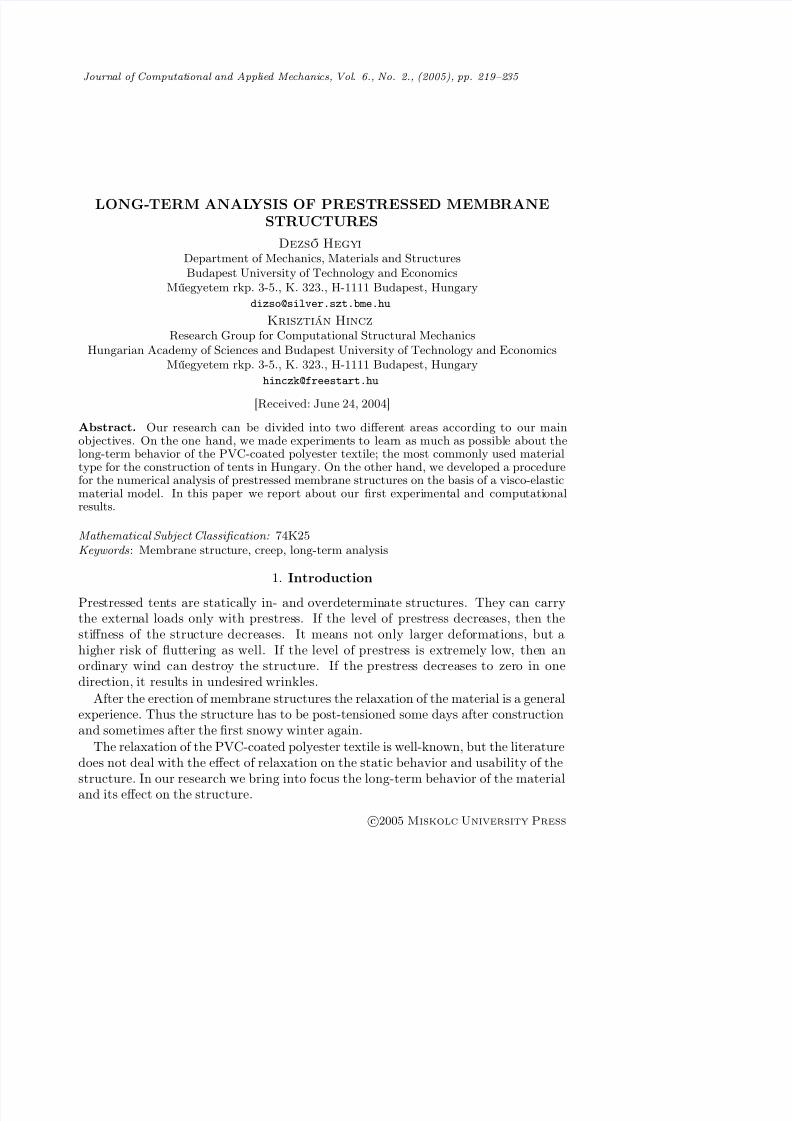
Figure 1. a. Setup of the experiment (on the left); b. Front view of a specimen with the paperboard panel (in the middle); c. Perpen-dicular view of the specimen (on the right)
the tests with special care. Our intention is to exclude any effects caused by the toolsof the measurement and external factors in the course of the experiments. We cannot
7/24/2019 6 2 Hegyihinczmiktex v6n2
http://slidepdf.com/reader/full/6-2-hegyihinczmiktex-v6n2 3/17
Long-term analysis of prestressed membrane structures 221
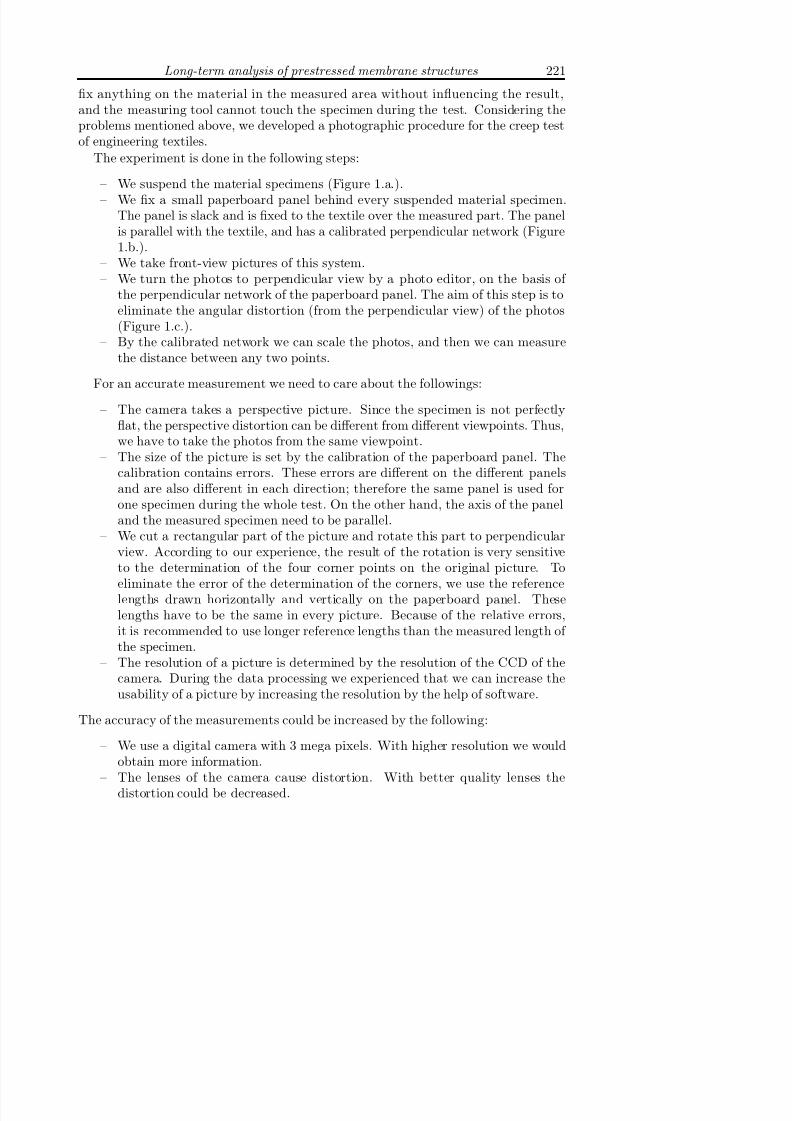
fix anything on the material in the measured area without influencing the result,and the measuring tool cannot touch the specimen during the test. Considering theproblems mentioned above, we developed a photographic procedure for the creep testof engineering textiles.
The experiment is done in the following steps:
– We suspend the material specimens (Figure 1.a.).
– We fix a small paperboard panel behind every suspended material specimen.The panel is slack and is fixed to the textile over the measured part. The panelis parallel with the textile, and has a calibrated perpendicular network (Figure1.b.).
– We take front-view pictures of this system.– We turn the photos to perpendicular view by a photo editor, on the basis of
the perpendicular network of the paperboard panel. The aim of this step is toeliminate the angular distortion (from the perpendicular view) of the photos(Figure 1.c.).
– By the calibrated network we can scale the photos, and then we can measurethe distance between any two points.
For an accurate measurement we need to care about the followings:
– The camera takes a perspective picture. Since the specimen is not perfectlyflat, the perspective distortion can be different from different viewpoints. Thus,we have to take the photos from the same viewpoint.
– The size of the picture is set by the calibration of the paperboard panel. Thecalibration contains errors. These errors are different on the different panelsand are also different in each direction; therefore the same panel is used forone specimen during the whole test. On the other hand, the axis of the paneland the measured specimen need to be parallel.
– We cut a rectangular part of the picture and rotate this part to perpendicularview. According to our experience, the result of the rotation is very sensitiveto the determination of the four corner points on the original picture. To
eliminate the error of the determination of the corners, we use the referencelengths drawn horizontally and vertically on the paperboard panel. Theselengths have to be the same in every picture. Because of the relative errors,it is recommended to use longer reference lengths than the measured length of the specimen.
– The resolution of a picture is determined by the resolution of the CCD of thecamera. During the data processing we experienced that we can increase theusability of a picture by increasing the resolution by the help of software.
The accuracy of the measurements could be increased by the following:
– We use a digital camera with 3 mega pixels. With higher resolution we wouldobtain more information.
– The lenses of the camera cause distortion. With better quality lenses thedistortion could be decreased.

7/24/2019 6 2 Hegyihinczmiktex v6n2
http://slidepdf.com/reader/full/6-2-hegyihinczmiktex-v6n2 4/17
222 D. Hegyi, K. Hincz
– We use an alcoholic pen with a toe of 0.1 mm. The thickness of the line onthe material is 0.2-0.3 mm. With thinner lines we could increase the accuracy.
With the available tools, choosing a 10 cm base length on the specimen and a 14cm x 7 cm perpendicular network on the panel we can measure length with 0.1 mmaccuracy. Because of the relative errors the method can be used for the measurementof relative distances.
We take photos about the whole specimen, so we can measure the vertical andhorizontal elongations alike. In horizontal direction the length is smaller (5 cm), sothe relative error is bigger.
2.3. Experiences about the behavior of the material.
2.3.1. Time-strain curves. First we loaded the material with 600N. The time-straindiagram shows the characteristics of the serially connected Maxwell and Kelvin-Voigtmaterial models. The duration of the test was 24 days. On the 17th day we decreasedthe 600N load to 50N. We regard the time between the 17th and 24th days as theunloading period. Figure 2. contains the time-strain data of the test.
Figure 2. Time-strain data of the test under 600 N
The second and third tests, under 300N and 900N, were disturbed by changing thehumidity and temperature.
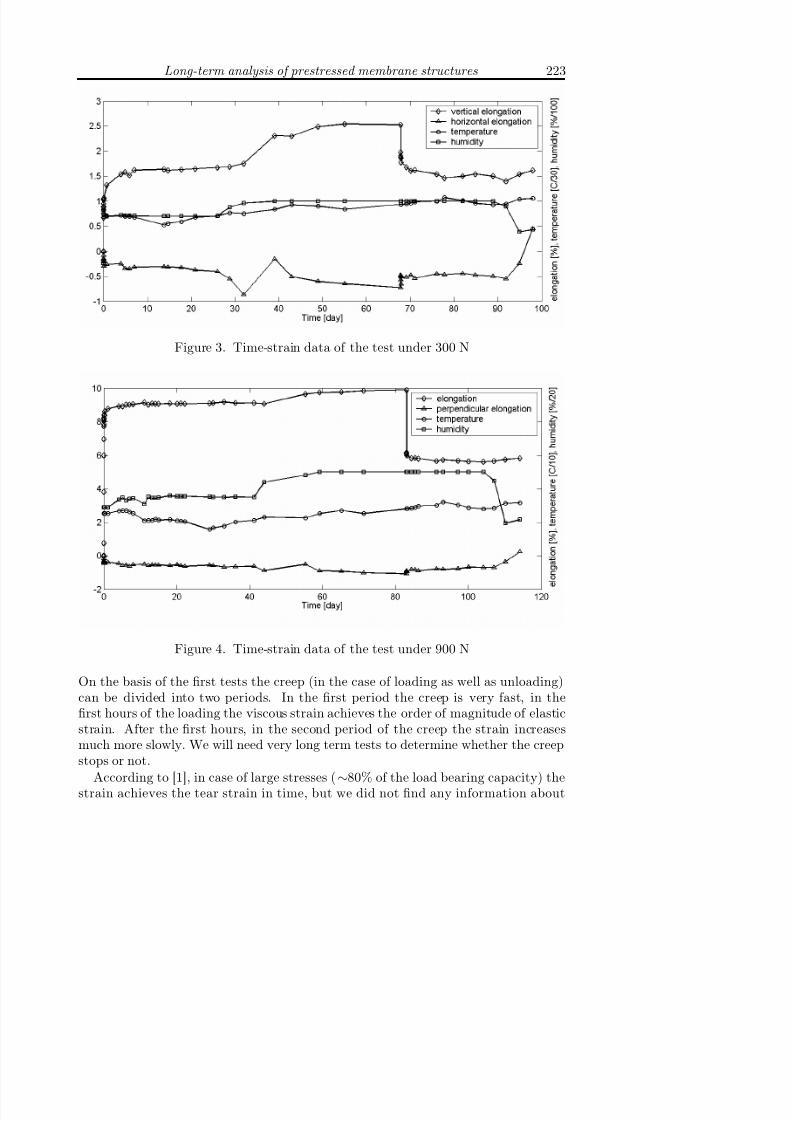
Figure 3 represents the time-strain-temperature-humidity data of the test under300N. The duration of the test was 98 days. On the 68th day we decreased the 300Nload to 50N.
Figure 4 shows the data of the test under 900N. The duration of the test was 114days. After 82 days we decreased the load to 90N.
7/24/2019 6 2 Hegyihinczmiktex v6n2
http://slidepdf.com/reader/full/6-2-hegyihinczmiktex-v6n2 5/17
Long-term analysis of prestressed membrane structures 223
Figure 3. Time-strain data of the test under 300 N
Figure 4. Time-strain data of the test under 900 N
On the basis of the first tests the creep (in the case of loading as well as unloading)can be divided into two periods. In the first period the creep is very fast, in thefirst hours of the loading the viscous strain achieves the order of magnitude of elasticstrain. After the first hours, in the second period of the creep the strain increasesmuch more slowly. We will need very long term tests to determine whether the creepstops or not.
According to [1], in case of large stresses (∼80% of the load bearing capacity) thestrain achieves the tear strain in time, but we did not find any information about

7/24/2019 6 2 Hegyihinczmiktex v6n2
http://slidepdf.com/reader/full/6-2-hegyihinczmiktex-v6n2 6/17
224 D. Hegyi, K. Hincz
similar behavior at lower stress levels. (The allowed stress in membrane structures isnever higher than 33% of the load bearing capacity.) If the creep does not stop, itcan lead to fracture at a low stress level in a very long time. (This time has to belonger than the lifetime of the structure.)
Figure 5. Maxwell and Kelvin-Voigt material models connected in series
There are four parameters to be determined if we want to use serially connectedMaxwell and Kelvin-Voigt material models, the elasticity modulus E 1, E 2 and thecreep constant µ1, µ2.
E 1 can be determined on the basis of the length before loading (l0) and the firstmeasured length after loading (l1) :
E 1 = l0l1 − l0
∆σl, (2.1)
or on the basis of the last measured length before unloading (lmax) and the firstmeasured length after unloading (lmax+1):
E 1 = lmax+1 − lmax
l0∆σu, (2.2)
where ∆σl and ∆σu are the alterations of the stress during loading and unloading.(2.2) gives the following result at three different applied load levels:
E 1=9.37 kN/cm (300 N), E 1=5.98 kN/cm (600 N), E 1=4.52 kN/cm (900 N).
This method for the determination of E 1 is fairly inaccurate, because it depends onthe time between the loading (or unloading) and the first measurement (the firstphoto). The classical load bearing capacity test would give more accurate result. Thetangent of the stress-strain diagram at the current stress level gives the value of E 1.
The other 3 material constants were determined by regression analysis. The strainin the serially connected Maxwell and Kelvin-Voight models can be described by:
ε(t) = σ
E 1+
σ
µ1t +
σ
E 2
1 − e
−
E2µ2
t
. (2.3)
For the determination of the material constants, the following function has to beminimized:
ϕ(µ1,E 2,µ2) =ni=0
εi −
σ
E 1+
σ
µ1ti +
σ
E 2
1 − e−
E2µ2
ti
. (2.4)
In the course of the evaluation of the test results we have obtained the followingvalues:

7/24/2019 6 2 Hegyihinczmiktex v6n2
http://slidepdf.com/reader/full/6-2-hegyihinczmiktex-v6n2 7/17
Long-term analysis of prestressed membrane structures 225
Load µ1 E 2 µ2N kN*day/cm kN/cm kN*day/cm
300 1343.81 8.66 5.95600 530.04 8.62 0.83900 6313.96 9.39 3.68
The differences between the viscous constants determined from the 3 experiments are
significant. Probably the strong disturbing effects (the change in temperature andhumidity) and the unsettled measuring technique caused the unexpected discrepancyin the constants.
On the basis of future test results we will make the material model more accurateor we will use the creep function, which is very common for concrete structures.
2.3.2. The effect the temperature. The membrane material is a kind of plastic, whichis sensitive to temperature. According to [1], there is an analogy between the effect of temperature and the progress of time. This means that a rise in temperature speedsup the creep. We can take advantage of this behavior in the future to decrease thelength of the experiments, as a kind of extrapolation. It is important that the materialhas to be in the visco-elastic temperature range, the temperature must not reach the
limit of plasticity.During our tests the temperature was changed between 15.7˚C and 32.1˚C. The
effect of the changing temperature is well traceable in the time-strain diagrams. Theorder of magnitude of the strain corresponding to increasing temperature was equalto the order of magnitude of the viscous strain.
This means that the alteration of the temperature has a significant effect on thebehavior of membrane structures. Later it can be interesting to analyze this phenom-enon, but in the near future our aim is to make tests on constant temperature and toeliminate the effect mentioned above.
2.3.3. The effect of humidity. Humidity often influences the behavior of plastics. Wedid not take the effect of humidity into account in the case of the membrane material
because the polyester fibres are coated with PVC. In the literature we have not founddetailed information about this influence. Some papers consider the effect of humidityto be insignificant [2], some papers mention it as an important factor [3].
During the test under 900 N, the 70 % relative humidity was changed to the extremelevel of 99.9 %. The change of humidity had a similar effect on the strain to that of the rise in temperature.
Since membrane structures are often used for covering facilities with high humidity(e.g. swimming pools), it will be interesting to deal with this question in the future.However, during the following tests we would like to eliminate this effect and keephumidity at a constant level as much as possible.
By reason of the significant effect of the changing temperature and humidity, forthe following tests we have built a quasi climate chamber, where the temperature andhumidity are practically constant. The present tests are going on in this chamber.We expect more accurate results from these experiments.

7/24/2019 6 2 Hegyihinczmiktex v6n2
http://slidepdf.com/reader/full/6-2-hegyihinczmiktex-v6n2 8/17
226 D. Hegyi, K. Hincz
2.4. Other technical questions.
2.4.1. The rate of measurements. On the one hand, we need enough data to drawthe time-strain curves, on the other hand, if we have too many photos, they can notbe processed, because of the time consuming data processing (about 20 minutes perphoto).
During the test the speed of the strain changes significantly. After loading it is
very fast and after some hours it becomes much slower. Thus in the first hour of thetest we take photos every 10-15 minutes, and then every hour. From the second dayit is enough to take pictures in every second or third day. If there are other effectslike the change in humidity or temperature, it is better to keep the higher rate (onephoto per day).
2.4.2. Measurements in the direction of the bisector of the warp and fill directions.
The PVC coating plays an important role in the behavior in the direction of thebisector of the warp and weft directions. The stiffness of the matrix is very small,hence the angle deformation and the elongation are very high in this direction. Ourtest in this direction was not successful. We tried to load the textile with 300 N.The elongation and the perpendicular deformation were about 40 %. After this large
deformation, the elongation belonged to the fibre, and not to the matrix material.The material became curved, so it was not possible to make orthogonal photos.
We have to find a way to measure the long time shear deformation because it mayhave a significant effect on the stress distribution of tent structures.
3. Numerical analysis of the visco-elastic behavior of membrane
structures
The other direction of our research is the numerical analysis of the long-term be-havior of prestressed membrane structures on the basis of a visco-elastic materialmodel.
A finite element program has been developed in the previous years for the designand static analysis of prestressed membrane structures [4], [5]. The procedure is based
on the Dynamic Relaxation Method (DRM) [6].The procedure developed contains four main modules. With the aid of the first
module we can determine the theoretical shape, the equilibrium shape that corre-sponds to the boundary conditions and to a hydrostatic stress-field or to constantprincipal projected stresses. The second module prepares the cutting pattern by flat-tening the theoretical shape. The third module determines the construction shape,the equilibrium shape that corresponds to the boundary conditions, the material con-stants and the cutting pattern, taking into account the real warp and fill directions inthe material. Usually the difference between the theoretical and construction shapesis insignificant, but the corresponding stress fields are considerably different. Withthe help of the fourth module we can analyze the behavior of the structure understatic loads on the basis of the construction shape. The hyperbolic surface of the tentis approximated by a finite element network of planar, triangular, and orthotropicmembrane elements.

7/24/2019 6 2 Hegyihinczmiktex v6n2
http://slidepdf.com/reader/full/6-2-hegyihinczmiktex-v6n2 9/17
Long-term analysis of prestressed membrane structures 227
DRM is a step by step method and we use it for the determination of the differentequilibrium shapes of the membrane structures. The main idea of the DRM is that wefollow up the fictitious motion of the structure from the initial shape to the equilibriumshape in ∆ttime steps. During the determination of the construction shape and thestatical analysis, every triangular element of the finite element network is linked toa corresponding triangular (stress-free) part of the cutting pattern. The stresses andstrains in warp and weft directions are calculated in every iteration step on the basisof the current coordinates and the stress-free size of the elements. The stresses arereduced to the nodes and these forces are summed for every node. These unbalancednodal forces accelerate the fictitious masses, placed to every node of the finite elementnetwork, at the beginning of the procedure. If we use suitable damping, this fictitiousmotion converges to the equilibrium shape. We stop the iteration if the maximum of the unbalanced nodal forces (F max) is smaller than an allowed value (F p).
For the analysis of the long-term behavior of prestressed tent structures, we improvethis program on the basis of a visco-elastic material model. The first task is theanalysis of the prestress level and the stress distribution in time, leaving the externalforces out of consideration. The diminution of the prestress in time is an importantquestion because it results in a smaller stiffness of the structure and in a higher riskof fluttering.
Our task is to determine the equilibrium shapes and stress fields in tk moments onthe basis of the construction shape and the corresponding stress field (initial prestressin t = t0 moment). (This time we do not deal with the determination of the con-struction shape.) To find the equilibrium shape we use the DRM, but there is a bigdifference in the determination of the construction shape and the determination of the equilibrium shape at the tk moment. In the first case we can calculate the stressesdirectly from the strains of the triangular membrane elements; we suppose that thestrains are totally elastic. In the second case we need one more inner iteration cyclefor the calculation of the viscous and elastic parts of the strains. Since our methodfor the determination of the construction shape has been published before [4], [5], thistime we demonstrate only the inner iteration cycle (the determination of the stresses)in detail.
We use serially connected Maxwell and Kelvin-Voigt material models (Figure 5)according to the first results of the material tests. The procedure developed uses thefollowing material constants:
E 1,w, µ1,w, E 2,w, µ2,w constants in warp direction,
E 1,f , µ1,f , E 2,f , µ2,f constants in fill (weft) direction,
since we do not have measured data about the time dependence of G, ν wf , ν fwparameters for the present time, we consider them constants in time. In addition tothe material constants, we assume that the construction shape with the initial stressfield belongs also to the input.
We use the following marking for the stresses (σ) and strains (ε):
– the first upper index (k) is the time index, it means the number of past timesteps from the beginning of the analysis,

7/24/2019 6 2 Hegyihinczmiktex v6n2
http://slidepdf.com/reader/full/6-2-hegyihinczmiktex-v6n2 10/17
228 D. Hegyi, K. Hincz
– the second upper index (i) is the current number of the iteration step in theinner iteration cycle, if there is no second index, the value is accepted for thetk time step,
– the first lower index is the sign of direction, warp (w) or fill (f ),– the second lower index is for the element of the material model (E 1, µ1, E 2, µ2).
The index 2 means the equal strains of the two elements in the Kelvin-Voigtmodel, (ε
w,2 = ε
w,E 2
= εw,µ
2, ε
f,2 = ε
f,E 2
= εf,µ
2).
In the course of the determination of the equilibrium shape in time tk, the elonga-tions of the triangular elements are calculated on the basis of the current coordinatesand the stress-free sizes of the elements, in every iteration step of the DRM. Sincethe angle between the sides of the elements and the warp direction in the materialis known, the strains in warp (εkw) and fill (εkf ) directions and the shear strain (γ kwf )can be calculated.
According to the material model, the εkw, εkf strains can be divided into 3 parts:
εkw = εkw,µ1 + εkw,E 1 + εkw,2 , (3.1)
εkf = εkf,µ1 + εkf,E 1 + εkf,2 . (3.2)
At the same time the stress is equal in the three elements of the material model:
σkw = σkw,µ1 = σkw,E 1 = σkw,2 , (3.3)
σkw = ε̇kw,µ1µ1,w = εkw,E 1E 1,w = ε̇kw,2µ2,w + εkw,2E 2,w. (3.4)
We suppose that in time t0:
ε0w,µ1 = ε0w,µ2 = ε0f,µ1 = ε0f,µ2 = 0 . (3.5)
In the following we give the formulae only in warp direction. By changing index w tof in the equations, we can get the formulae for fill direction.
The viscous strains are calculated from the average value of the stresses in the(tk−1, tk) time interval:
εkw,µ1 − εk−1w,µ1
∆tvµ1,w =
σk−1w + σk
w
2 , (3.6)
εkw,2 − εk−1w,2
∆tvµ2,w +
εkw,2 + εk−1w,2
2 E 2,w =
σk−1
w + σkw
2 , (3.7)
where ∆tv is the length of the time interval between the analysed moments.
On the basis of the above-mentioned formulae, the iteration cycle for the deter-mination of the stresses in the triangular elements contains the following steps (inmoment tk, for one given shape of the DRM iteration):
– Initially (i = 1) the normal stresses in every element are given equal to thestresses in the same element in the equilibrium shape corresponding to momenttk−1
σk,iw = σk−1
w . (3.8)
– The shear stress is calculated on the basis of
τ wf = Gγ wf . (3.9)
7/24/2019 6 2 Hegyihinczmiktex v6n2
http://slidepdf.com/reader/full/6-2-hegyihinczmiktex-v6n2 11/17
Long-term analysis of prestressed membrane structures 229
c
Figure 6. Main flowchart of the DRM, the thick arrow meaning theinner iteration

7/24/2019 6 2 Hegyihinczmiktex v6n2
http://slidepdf.com/reader/full/6-2-hegyihinczmiktex-v6n2 12/17
230 D. Hegyi, K. Hincz
Figure 7. Inner iteration, determination of the stresses, strains andunbalanced nodal forces on the basis of the current coordinates

7/24/2019 6 2 Hegyihinczmiktex v6n2
http://slidepdf.com/reader/full/6-2-hegyihinczmiktex-v6n2 13/17
Long-term analysis of prestressed membrane structures 231
– According to (3.6), the strain of the piston in the Maxwell element can becalculated by
εk,iw,µ1 = εk−1w,µ1
+ ∆tv(σk−1w + σk,i
w )/(2µ1,w), (3.10)
and the strain of the Kelvin-Voight element, according to (3.7), can be de-scribed by:
εk,iw,2 = ( σk−
1w + σk,iw
2 + ε
k−1w,2 µ2,w
∆tv−
εk−1w,2 E 2,w
2 )/( µ2,w
∆tv+ E 2,w
2 ). (3.11)
With the known values of εk,iw,µ1, εk,iw,2, the elastic elongation is
εk,iw,E 1= εkw − εk,iw,µ1 −
εk,iw,2. (3.12)
– The stresses are calculated from the strains in warp and weft directions:
σ̄k,iw =
1
1 − ν wf ν fw(E 1,wεk,iw,E 1
+ ν wf E 1,f εk,if,E 1
) . (3.13)
– Comparing the
∆σk,iw =
σ̄k,iw − σk,i
w
σk,iw
(3.14)
error of the iteration for every element with an allowed value (e p), we decideon the continuation of the DRM iteration (if ∆σk,i
w < e p), or the continuationof the inner iteration cycle (if ∆σk,i
w > e p) from step (3.10) after
σk,i+1w = σ̄k,i
w (3.15)
and i=i+1.
The actual shape is accepted as an equilibrium shape, according to the DRM, if
F max < F p . (3.16)
Then
εkw,µ1 = εk,iw,µ1 , (3.17)
εkw,2 = ε
k,i
w,2 (3.18)are stored and increasing k by one the calculation is continued with the next timestep of the long term analysis.
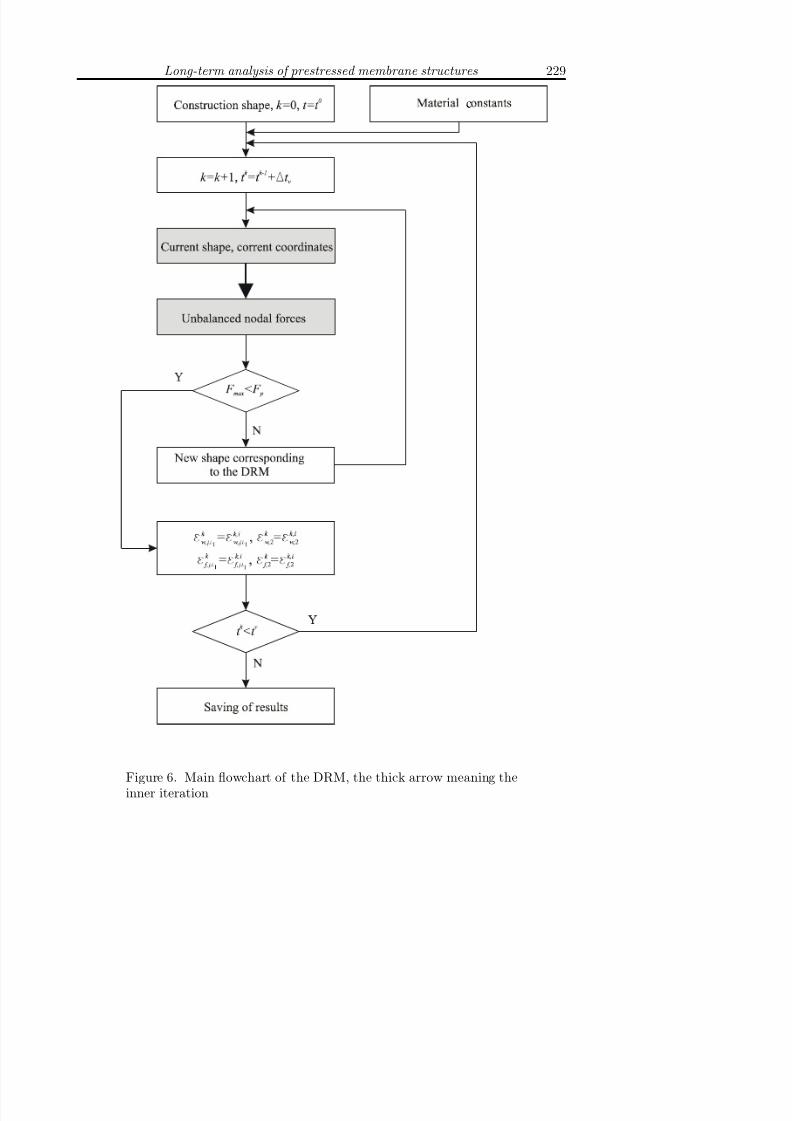
The main steps of the long term analysis are shown in Figure 6. The inner iterationloop, the calculation of the stresses and strains are demonstrated in Figure 7.
4. Results of the numerical analysis
4.1. Assumptions for the change in time. In the course of the numerical analysisof different structures, we experienced that the equilibrium shape of the tent, thedistribution of the stresses and the σmaxw /σavg
w , σmaxf /σavgf quotients do not change
significantly in time, whereσmaxw
is the maximum stress in warp direction,σavgw is the average stress in warp direction,
7/24/2019 6 2 Hegyihinczmiktex v6n2
http://slidepdf.com/reader/full/6-2-hegyihinczmiktex-v6n2 14/17
232 D. Hegyi, K. Hincz
σmaxf is the maximum stress in fill direction,
σavgf is the average stress in fill direction.
The reason for this (at first sight surprising and perhaps misleading) result is thefollowing. Since so far we have measured data only in warp direction, we used alinear visco-elastic material model with the same material constants in warp and weftdirections and did not take into account the time-dependency in the case of constants
G, ν wf and ν fw . Because the normal stresses are definitive from the aspect of theequilibrium of the structure, the same linear viscous model in warp and fill directionresults that the surface substantially remains in equilibrium while the normal stressesdecrease in time.
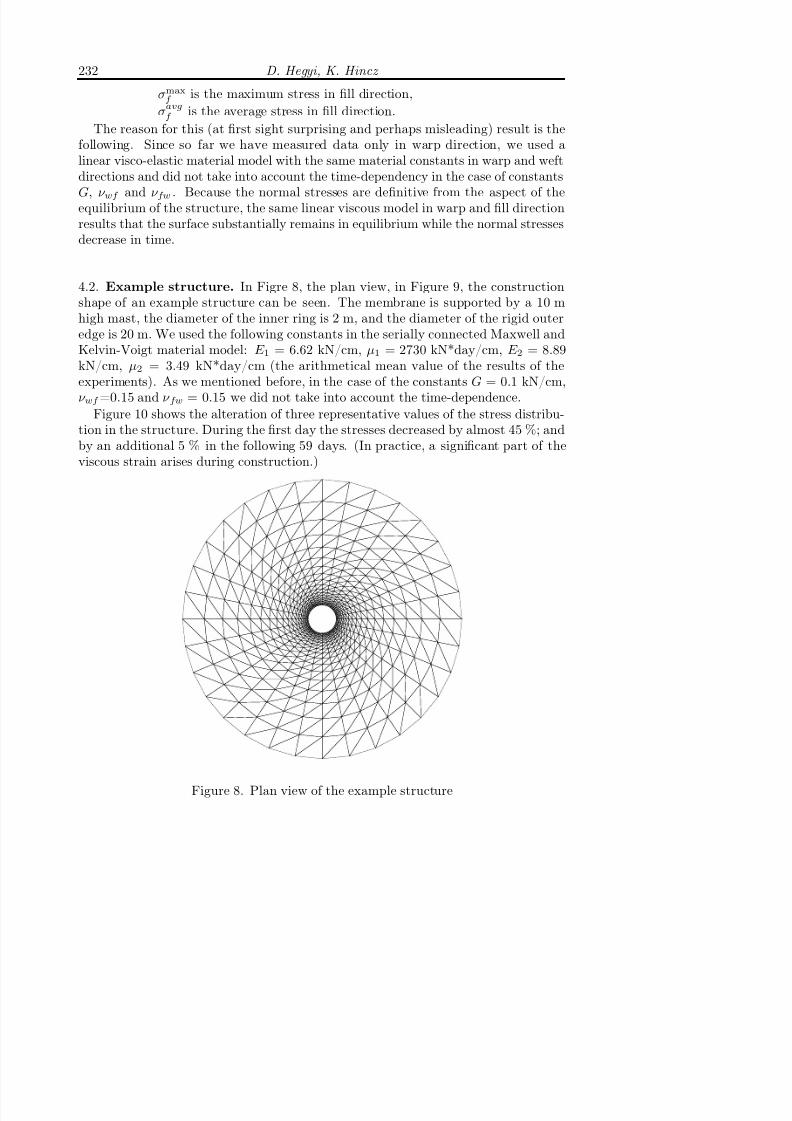
4.2. Example structure. In Figre 8, the plan view, in Figure 9, the constructionshape of an example structure can be seen. The membrane is supported by a 10 mhigh mast, the diameter of the inner ring is 2 m, and the diameter of the rigid outeredge is 20 m. We used the following constants in the serially connected Maxwell andKelvin-Voigt material model: E 1 = 6.62 kN/cm, µ1 = 2730 kN*day/cm, E 2 = 8.89kN/cm, µ2 = 3.49 kN*day/cm (the arithmetical mean value of the results of theexperiments). As we mentioned before, in the case of the constants G = 0.1 kN/cm,
ν wf =0.15 and ν fw = 0.15 we did not take into account the time-dependence.Figure 10 shows the alteration of three representative values of the stress distribu-
tion in the structure. During the first day the stresses decreased by almost 45 %; andby an additional 5 % in the following 59 days. (In practice, a significant part of theviscous strain arises during construction.)
Figure 8. Plan view of the example structure

7/24/2019 6 2 Hegyihinczmiktex v6n2
http://slidepdf.com/reader/full/6-2-hegyihinczmiktex-v6n2 15/17
Long-term analysis of prestressed membrane structures 233
Figure 9. Construction shape of the example structure
Figure 10. Decreasing of stresses in warp and fill directions in thefirst 60 days after construction
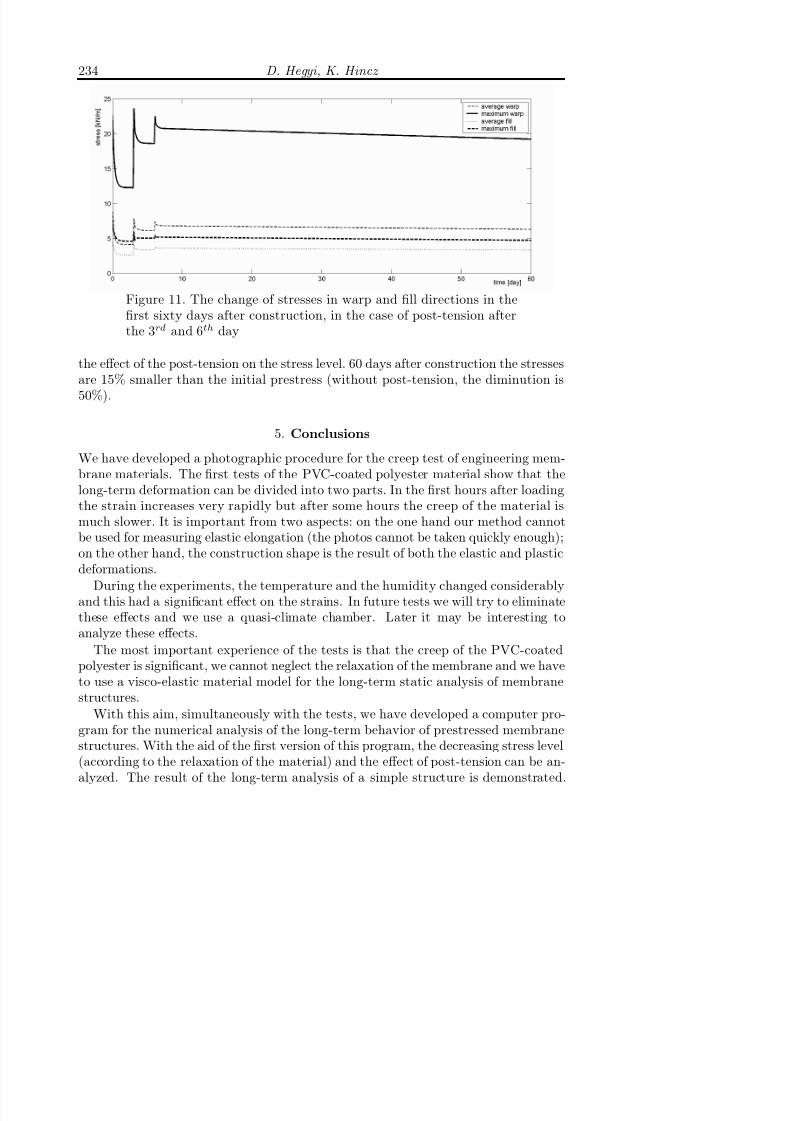
According to practice, we post-tensioned the structure by lifting the mast. Afterthree days we lifted the mast by 15 cm, after the sixth day we post-tensioned thestructure again by lifting the mast by an additional 5 cm. Figure 11 demonstrates
7/24/2019 6 2 Hegyihinczmiktex v6n2
http://slidepdf.com/reader/full/6-2-hegyihinczmiktex-v6n2 16/17
234 D. Hegyi, K. Hincz
Figure 11. The change of stresses in warp and fill directions in thefirst sixty days after construction, in the case of post-tension afterthe 3rd and 6th day
the effect of the post-tension on the stress level. 60 days after construction the stressesare 15% smaller than the initial prestress (without post-tension, the diminution is
50%).
5. Conclusions
We have developed a photographic procedure for the creep test of engineering mem-brane materials. The first tests of the PVC-coated polyester material show that thelong-term deformation can be divided into two parts. In the first hours after loadingthe strain increases very rapidly but after some hours the creep of the material ismuch slower. It is important from two aspects: on the one hand our method cannotbe used for measuring elastic elongation (the photos cannot be taken quickly enough);on the other hand, the construction shape is the result of both the elastic and plasticdeformations.
During the experiments, the temperature and the humidity changed considerablyand this had a significant effect on the strains. In future tests we will try to eliminatethese effects and we use a quasi-climate chamber. Later it may be interesting toanalyze these effects.
The most important experience of the tests is that the creep of the PVC-coatedpolyester is significant, we cannot neglect the relaxation of the membrane and we haveto use a visco-elastic material model for the long-term static analysis of membranestructures.
With this aim, simultaneously with the tests, we have developed a computer pro-gram for the numerical analysis of the long-term behavior of prestressed membranestructures. With the aid of the first version of this program, the decreasing stress level(according to the relaxation of the material) and the effect of post-tension can be an-alyzed. The result of the long-term analysis of a simple structure is demonstrated.

7/24/2019 6 2 Hegyihinczmiktex v6n2
http://slidepdf.com/reader/full/6-2-hegyihinczmiktex-v6n2 17/17
Long-term analysis of prestressed membrane structures 235
REFERENCES
1. Knudson, W. C.: Recent advances in the field of long span tension structures. Eng.
Struct. 13, (1991), 164-177.
2. Hollaway, L. C.: Polymers and polymer composites in constructions . Thomas TelfordLtd, London, 1990.
3. Leonard, J. W.: Tension Structures , McGraw-Hill Book Company, New York, 1988.
4. Gáspár, Zs. and Hincz, K.: Formfinding and Static Analysis of Tents, IASS-2001,Theory, Design and Realization of Shell and Spatial Structures . Proceedings CD, Nagoya,Japan, 2001.
5. Hincz, K.: Determination of the cutting patterns of prestressed tent structures. Revista
Portuguesa de Engenharia de Estruturas , 47, (2000) 45-49.
6. Day, A. S.: An Introduction to Dynamic Relaxation. The Engineer , 219, (1965), 218-221.