Embed Size (px)
Citation preview
ECONOMIC ANALYSIS DEPARTMENT:
al. Jana Pawła II 17, 00-854 Warszawa fax +48 22 5868340
email: [email protected] Website: skarb.bzwbk.pl
Maciej Reluga (chief economist) +48 22 534 18 88
Piotr Bielski +48 22 534 18 87
Agnieszka Decewicz +48 22 534 18 86
Marcin Luziński +48 22 534 18 85
Marcin Sulewski +48 22 534 18 84
44
46
48
50
52
54
56
58
60
Dec
12
Jun
13
Dec
13
Jun
14
Dec
14
Jun
15
Dec
15
Jun
16
Dec
16
Activity indices in manufacturing
PMI PL
PMI EMU
PMI DE
-2
-1
0
1
2
3
4
5
6
Jan
09Ju
l 09
Jan
10Ju
l 10
Jan
11Ju
l 11
Jan
12Ju
l 12
Jan
13Ju
l 13
Jan
14Ju
l 14
Jan
15Ju
l 15
Jan
16Ju
l 16
Jan
17
% NBP interest rate vs. inflation
NBP reference rate Inflation target CPI
MACROscope
It seems the manufacturing activity in the world economy is reviving. Business
climate indicators for most European countries, USA, and even China picked up
quite visibly at the end of 2016 and seem to be supporting our view that 2017 will be
the year of a gradual recovery in international production and trade. The German
export growth already picked up quite markedly, and so did the industrial output of
Poland’s biggest trading partner. As regards local data, admittedly, the industrial
production in November was better than expected, but the 3-month average
growth in the Polish manufacturing output remained in the downtrend, which,
according to our forecast, even deepened in December. It looks like the final
quarter of 2016 saw continued economic slowdown (to slightly 2%), but we
still expect this was the bottom of the cycle.
Overall GDP growth in 2017 is likely to be below the government’s budgetary
assumptions (our forecast 2.7% vs. 3.6%), but we do not see a significant risk for
the fiscal policy outlook this year. At least in terms of the central budget delivery
and the borrowing needs, which are likely to be lower than planned (amid high
central bank’s profit). Actually, the fiscal deficit for 2016 is also very likely to show a
positive reading of around 2% of GDP only.
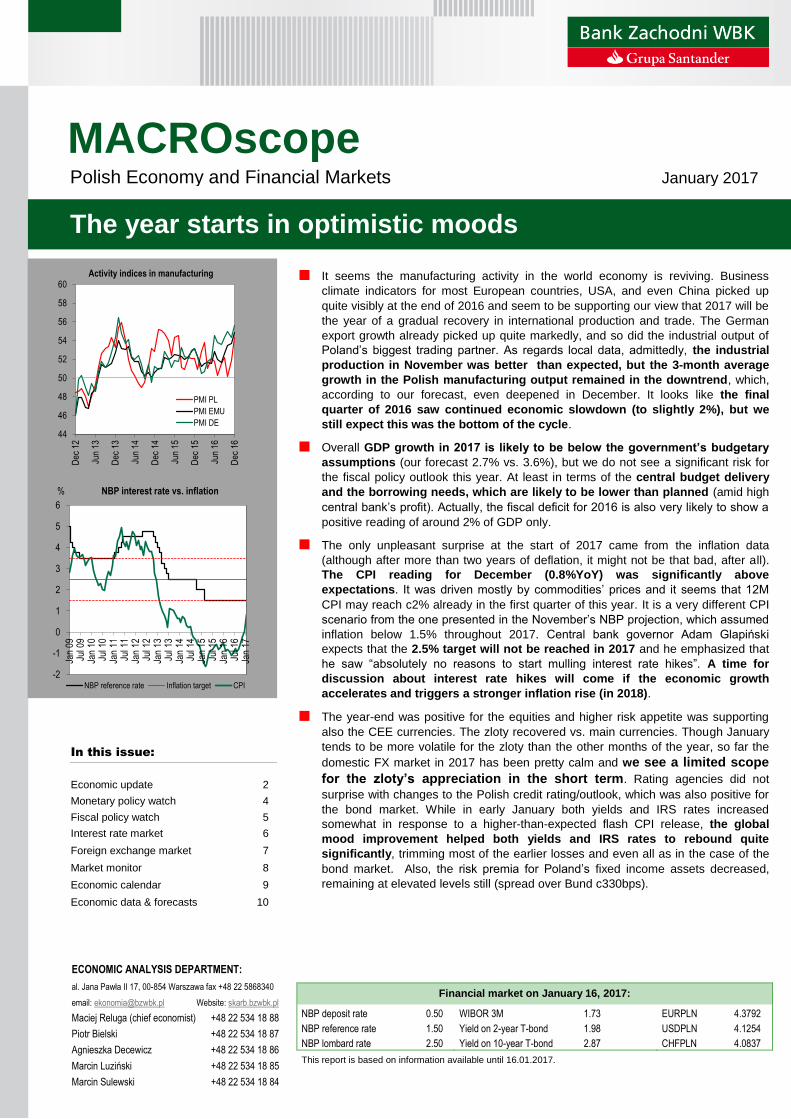
The only unpleasant surprise at the start of 2017 came from the inflation data
(although after more than two years of deflation, it might not be that bad, after all).
The CPI reading for December (0.8%YoY) was significantly above
expectations. It was driven mostly by commodities’ prices and it seems that 12M
CPI may reach c2% already in the first quarter of this year. It is a very different CPI
scenario from the one presented in the November’s NBP projection, which assumed
inflation below 1.5% throughout 2017. Central bank governor Adam Glapiński
expects that the 2.5% target will not be reached in 2017 and he emphasized that
he saw “absolutely no reasons to start mulling interest rate hikes”. A time for
discussion about interest rate hikes will come if the economic growth
accelerates and triggers a stronger inflation rise (in 2018).
The year-end was positive for the equities and higher risk appetite was supporting
also the CEE currencies. The zloty recovered vs. main currencies. Though January
tends to be more volatile for the zloty than the other months of the year, so far the
domestic FX market in 2017 has been pretty calm and we see a limited scope
for the zloty’s appreciation in the short term. Rating agencies did not
surprise with changes to the Polish credit rating/outlook, which was also positive for
the bond market. While in early January both yields and IRS rates increased
somewhat in response to a higher-than-expected flash CPI release, the global
mood improvement helped both yields and IRS rates to rebound quite
significantly, trimming most of the earlier losses and even all as in the case of the
bond market. Also, the risk premia for Poland’s fixed income assets decreased,
remaining at elevated levels still (spread over Bund c330bps).
Polish Economy and Financial Markets January 2017
The year starts in optimistic moods
In this issue:
Economic update 2
Monetary policy watch 4
Fiscal policy watch 5
Interest rate market 6
Foreign exchange market 7
Market monitor 8
Economic calendar 9
Economic data & forecasts 10
Financial market on January 16, 2017:
NBP deposit rate 0.50
NBP reference rate 1.50
NBP lombard rate 2.50
WIBOR 3M 1.73
Yield on 2-year T-bond 1.98
Yield on 10-year T-bond 2.87
EURPLN 4.3792
USDPLN 4.1254
CHFPLN 4.0837
This report is based on information available until 16.01.2017.
2 MACROscope January 2017
Economic update
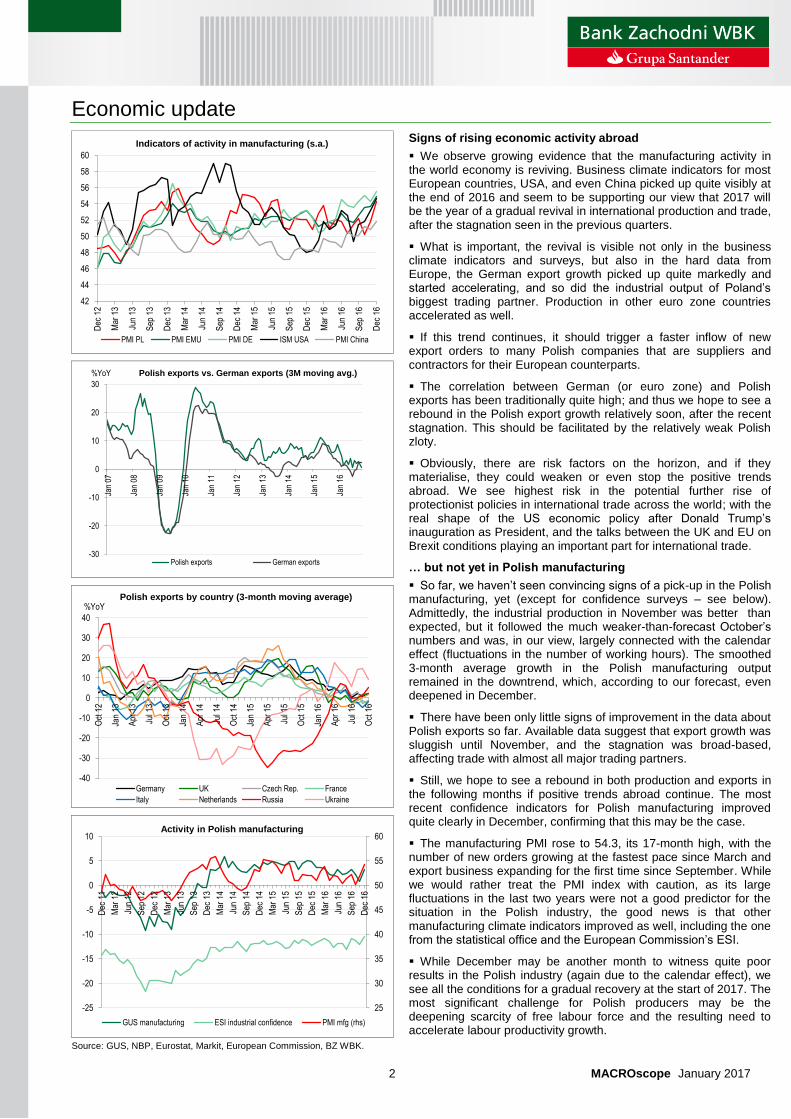
Signs of rising economic activity abroad
We observe growing evidence that the manufacturing activity in the world economy is reviving. Business climate indicators for most European countries, USA, and even China picked up quite visibly at the end of 2016 and seem to be supporting our view that 2017 will be the year of a gradual revival in international production and trade, after the stagnation seen in the previous quarters.
What is important, the revival is visible not only in the business climate indicators and surveys, but also in the hard data from Europe, the German export growth picked up quite markedly and started accelerating, and so did the industrial output of Poland’s biggest trading partner. Production in other euro zone countries accelerated as well.
If this trend continues, it should trigger a faster inflow of new export orders to many Polish companies that are suppliers and contractors for their European counterparts.
The correlation between German (or euro zone) and Polish exports has been traditionally quite high; and thus we hope to see a rebound in the Polish export growth relatively soon, after the recent stagnation. This should be facilitated by the relatively weak Polish zloty.
Obviously, there are risk factors on the horizon, and if they materialise, they could weaken or even stop the positive trends abroad. We see highest risk in the potential further rise of protectionist policies in international trade across the world; with the real shape of the US economic policy after Donald Trump’s inauguration as President, and the talks between the UK and EU on Brexit conditions playing an important part for international trade.
… but not yet in Polish manufacturing
So far, we haven’t seen convincing signs of a pick-up in the Polish manufacturing, yet (except for confidence surveys – see below). Admittedly, the industrial production in November was better than expected, but it followed the much weaker-than-forecast October’s numbers and was, in our view, largely connected with the calendar effect (fluctuations in the number of working hours). The smoothed 3-month average growth in the Polish manufacturing output remained in the downtrend, which, according to our forecast, even deepened in December.
There have been only little signs of improvement in the data about Polish exports so far. Available data suggest that export growth was sluggish until November, and the stagnation was broad-based, affecting trade with almost all major trading partners.
Still, we hope to see a rebound in both production and exports in the following months if positive trends abroad continue. The most recent confidence indicators for Polish manufacturing improved quite clearly in December, confirming that this may be the case.
The manufacturing PMI rose to 54.3, its 17-month high, with the number of new orders growing at the fastest pace since March and export business expanding for the first time since September. While we would rather treat the PMI index with caution, as its large fluctuations in the last two years were not a good predictor for the situation in the Polish industry, the good news is that other manufacturing climate indicators improved as well, including the one from the statistical office and the European Commission’s ESI.
While December may be another month to witness quite poor results in the Polish industry (again due to the calendar effect), we see all the conditions for a gradual recovery at the start of 2017. The most significant challenge for Polish producers may be the deepening scarcity of free labour force and the resulting need to accelerate labour productivity growth.
Source: GUS, NBP, Eurostat, Markit, European Commission, BZ WBK.
42
44
46
48
50
52
54
56
58
60
Dec
12
Mar
13
Jun
13
Sep
13
Dec
13
Mar
14
Jun
14
Sep
14
Dec
14
Mar
15
Jun
15
Sep
15
Dec
15
Mar
16
Jun
16
Sep
16
Dec
16
Indicators of activity in manufacturing (s.a.)
PMI PL PMI EMU PMI DE ISM USA PMI China
-30
-20
-10
0
10
20
30
Jan
07
Jan
08
Jan
09
Jan
10
Jan
11
Jan
12
Jan
13
Jan
14
Jan
15
Jan
16
%YoY Polish exports vs. German exports (3M moving avg.)
Polish exports German exports
-40
-30
-20
-10
0
10
20
30
40
Oct
12
Jan
13
Apr
13
Jul 1
3
Oct
13
Jan
14
Apr
14
Jul 1
4
Oct
14
Jan
15
Apr
15
Jul 1
5
Oct
15
Jan
16
Apr
16
Jul 1
6
Oct
16
%YoYPolish exports by country (3-month moving average)
Germany UK Czech Rep. France
Italy Netherlands Russia Ukraine
25
30
35
40
45
50
55
60
-25
-20
-15
-10
-5
0
5
10
Dec
11
Mar
12
Jun
12
Sep
12
Dec
12
Mar
13
Jun
13
Sep
13
Dec
13
Mar
14
Jun
14
Sep
14
Dec
14
Mar
15
Jun
15
Sep
15
Dec
15
Mar
16
Jun
16
Sep
16
Dec
16
Activity in Polish manufacturing
GUS manufacturing ESI industrial confidence PMI mfg (rhs)
3 MACROscope January 2017
Economic update
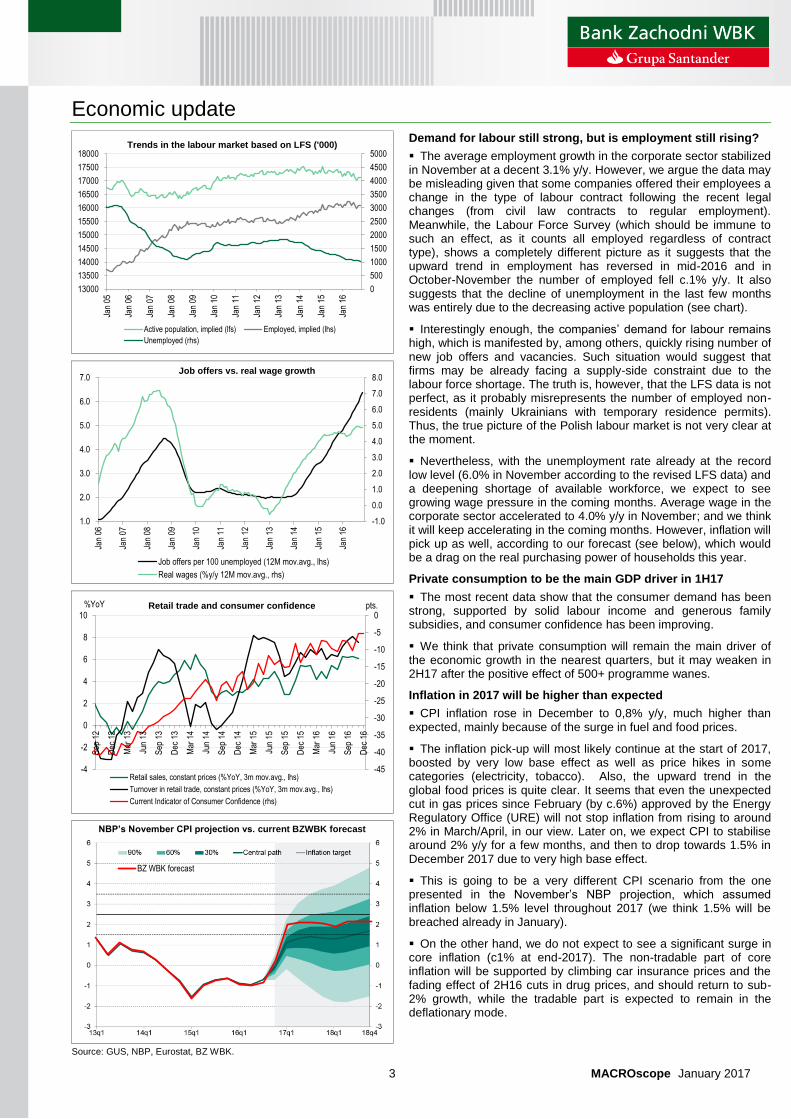
Demand for labour still strong, but is employment still rising?
The average employment growth in the corporate sector stabilized in November at a decent 3.1% y/y. However, we argue the data may be misleading given that some companies offered their employees a change in the type of labour contract following the recent legal changes (from civil law contracts to regular employment). Meanwhile, the Labour Force Survey (which should be immune to such an effect, as it counts all employed regardless of contract type), shows a completely different picture as it suggests that the upward trend in employment has reversed in mid-2016 and in October-November the number of employed fell c.1% y/y. It also suggests that the decline of unemployment in the last few months was entirely due to the decreasing active population (see chart).
Interestingly enough, the companies’ demand for labour remains high, which is manifested by, among others, quickly rising number of new job offers and vacancies. Such situation would suggest that firms may be already facing a supply-side constraint due to the labour force shortage. The truth is, however, that the LFS data is not perfect, as it probably misrepresents the number of employed non-residents (mainly Ukrainians with temporary residence permits). Thus, the true picture of the Polish labour market is not very clear at the moment.
Nevertheless, with the unemployment rate already at the record low level (6.0% in November according to the revised LFS data) and a deepening shortage of available workforce, we expect to see growing wage pressure in the coming months. Average wage in the corporate sector accelerated to 4.0% y/y in November; and we think it will keep accelerating in the coming months. However, inflation will pick up as well, according to our forecast (see below), which would be a drag on the real purchasing power of households this year.
Private consumption to be the main GDP driver in 1H17
The most recent data show that the consumer demand has been strong, supported by solid labour income and generous family subsidies, and consumer confidence has been improving.
We think that private consumption will remain the main driver of the economic growth in the nearest quarters, but it may weaken in 2H17 after the positive effect of 500+ programme wanes.
Inflation in 2017 will be higher than expected
CPI inflation rose in December to 0,8% y/y, much higher than expected, mainly because of the surge in fuel and food prices.
The inflation pick-up will most likely continue at the start of 2017, boosted by very low base effect as well as price hikes in some categories (electricity, tobacco). Also, the upward trend in the global food prices is quite clear. It seems that even the unexpected cut in gas prices since February (by c.6%) approved by the Energy Regulatory Office (URE) will not stop inflation from rising to around 2% in March/April, in our view. Later on, we expect CPI to stabilise around 2% y/y for a few months, and then to drop towards 1.5% in December 2017 due to very high base effect.
This is going to be a very different CPI scenario from the one presented in the November’s NBP projection, which assumed inflation below 1.5% level throughout 2017 (we think 1.5% will be breached already in January).
On the other hand, we do not expect to see a significant surge in core inflation (c1% at end-2017). The non-tradable part of core inflation will be supported by climbing car insurance prices and the fading effect of 2H16 cuts in drug prices, and should return to sub-2% growth, while the tradable part is expected to remain in the deflationary mode.
NBP’s November CPI projection vs. current BZWBK forecast
Source: GUS, NBP, Eurostat, BZ WBK.
0
500
1000
1500
2000
2500
3000
3500
4000
4500
5000
13000
13500
14000
14500
15000
15500
16000
16500
17000
17500
18000
Jan
05
Jan
06
Jan
07
Jan
08
Jan
09
Jan
10
Jan
11
Jan
12
Jan
13
Jan
14
Jan
15
Jan
16
Trends in the labour market based on LFS ('000)
Active population, implied (lfs) Employed, implied (lhs)
Unemployed (rhs)
-1.0
0.0
1.0
2.0
3.0
4.0
5.0
6.0
7.0
8.0
1.0
2.0
3.0
4.0
5.0
6.0
7.0
Jan
06
Jan
07
Jan
08
Jan
09
Jan
10
Jan
11
Jan
12
Jan
13
Jan
14
Jan
15
Jan
16
Job offers vs. real wage growth
Job offers per 100 unemployed (12M mov.avg., lhs)
Real wages (%y/y 12M mov.avg., rhs)
-45
-40
-35
-30
-25
-20
-15
-10
-5
0
-4
-2
0
2
4
6
8
10
Sep
12
Dec
12
Mar
13
Jun
13
Sep
13
Dec
13
Mar
14
Jun
14
Sep
14
Dec
14
Mar
15
Jun
15
Sep
15
Dec
15
Mar
16
Jun
16
Sep
16
Dec
16
pts.%YoY Retail trade and consumer confidence
Retail sales, constant prices (%YoY, 3m mov.avg., lhs)
Turnover in retail trade, constant prices (%YoY, 3m mov.avg., lhs)
Current Indicator of Consumer Confidence (rhs)
BZ WBK forecast
4 MACROscope January 2017
Monetary policy watch
Excerpts from the MPC’s official statement after its January meeting
Economic growth abroad remains moderate, with signs of recovery in global industry. In the euro area, economic growth has been stable, albeit diverse across its member states. In Germany, economic growth in 2016 Q4 probably accelerated, while in other large euro area economies it remained low. In the United States, expansion has continued, supported by improvement in the labour market reflected both in rising employment and wages. In China, there are signs of improvement in economic conditions, yet GDP growth is still lower than in previous years.
In Poland, GDP growth in 2016 Q4 was probably subdued. However, monthly data signal some improvement in economic activity over the recent past. Economic growth has been mainly driven by increasing consumer demand, supported by a rise in employment and wages, very good consumer sentiment and child benefit payments. At
the same time, GDP growth was contained by a fall in investment, caused to a large extent by temporarily lower use of EU funds after the completion of the previous EU financial perspective.
Annual growth in prices of consumer goods and services has been increasing – in line with flash estimate it was 0.8% y/y in December 2016. Growth in producer prices has also picked up. The increase in price growth has resulted mainly from energy commodity prices being higher than a year ago, i.e. factors beyond the direct impact of domestic monetary policy. At the same time, price growth has been contained by low inflationary pressure abroad and negative output gap in the domestic economy.
In the Council’s opinion, price growth will continue to increase in the coming months, yet it will remain moderate. Besides commodity prices being higher than a year ago, price growth will be supported by an expected acceleration in economic growth amid a gradual increase in the investment growth rate and a stable rise in consumption.
The Council confirms its assessment that – given the available data and forecasts – the current level of interest rates is conducive to keeping the Polish economy on the sustainable growth path and maintaining macroeconomic balance
No room for interest rate hikes in 2017
As expected, the Monetary Policy Council kept interest rates on hold in January, with the main reference rate at 1.5%. The official communique has not changed significantly as compared to the previous month. The Council still sees the slowdown of economic growth in Poland as temporary. It also expects inflation to rise further, but only gradually and moderately. The central bank governor, Adam Glapiński, said that inflation will probably touch the lower end of the allowed fluctuations band around the target (i.e. 1.5%) this year, but the 2.5% target will not be reached in 2017. Moreover, he emphasized that he saw “absolutely no reasons to start mulling interest rate hikes”. Glapiński said that if economic growth accelerates and triggers stronger inflation rise, then a time for discussion about interest rate hikes will come – it may take place in 2018, but only in a positive scenario, which does not have to materialize. Meanwhile, the central bank head sees very limited room for inflation rise in the coming months, as the upward trend in crude oil price has stalled, and the economic growth in Europe is still meagre. He also suggested that higher CPI due to fuel price hike should not be a reason for central bank action, as long as there is no broad-based underlying price pressure. Summing up, the message from the central bank was neutral or even mildly dovish – they do not see reasons to change monetary policy this year, and policy tightening in 2018 would be possible only when inflation picks up clearly due to growth acceleration.
KSF recommendations on CHF loans
On January 13, the Financial Stability Committee (KSF) issued a bunch of recommendations setting the framework for voluntary restructuring of FX mortgages in the Polish banks’ balance sheets. These new regulatory measures are aimed at pushing commercial banks towards voluntary conversion of CHF loans into zlotys. The set contains mostly directional recommendations and it delegates the preparation of detailed regulations/measures and their introduction to the Ministry of Finance, KNF (financial markets regulator) and BFG (the Bank Guarantee Fund). Also, the introduction timing is unclear as the paper imposes no deadlines; and certain laws need to be amended to implement the proposed solutions. The recommendations include among others: increasing the risk weight on FX mortgages to 150% from the current 100%, higher LGD, changes to Pillar 2 capital ratios, additional charge to the BFG and introduction of the 3pp systemic risk buffer (SRB). The SRB will not be an additional buffer but is to replace the current 4pp add-on to Total Capital Ratio (TCR) and 3pp to Tier 1 (T1). It is, however, important to stress that the paper contains relatively little ready-made solutions and therefore its potential impact on banks cannot be quantified at this stage. Moreover, the political agenda and macro background will likely be the main factors shaping the final solutions.
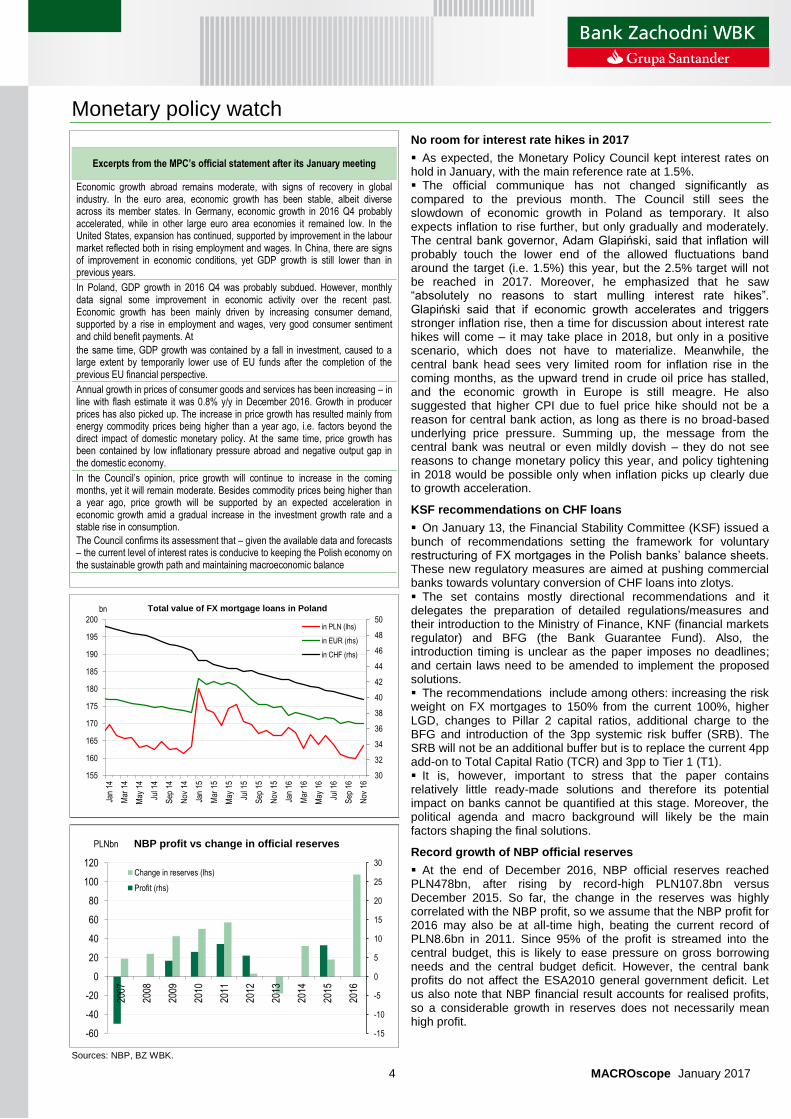
Record growth of NBP official reserves
At the end of December 2016, NBP official reserves reached PLN478bn, after rising by record-high PLN107.8bn versus December 2015. So far, the change in the reserves was highly correlated with the NBP profit, so we assume that the NBP profit for 2016 may also be at all-time high, beating the current record of PLN8.6bn in 2011. Since 95% of the profit is streamed into the central budget, this is likely to ease pressure on gross borrowing needs and the central budget deficit. However, the central bank profits do not affect the ESA2010 general government deficit. Let us also note that NBP financial result accounts for realised profits, so a considerable growth in reserves does not necessarily mean high profit.
Sources: NBP, BZ WBK.
30
32
34
36
38
40
42
44
46
48
50
155
160
165
170
175
180
185
190
195
200
Jan
14
Mar
14
May
14
Jul 1
4
Sep
14
Nov
14
Jan
15
Mar
15
May
15
Jul 1
5
Sep
15
Nov
15
Jan
16
Mar
16
May
16
Jul 1
6
Sep
16
Nov
16
bn Total value of FX mortgage loans in Poland
in PLN (lhs)
in EUR (rhs)
in CHF (rhs)
-15
-10
-5
0
5
10
15
20
25
30
-60
-40
-20
0
20
40
60
80
100
120
2007
2008
2009
2010
2011
2012
2013
2014
2015
2016
NBP profit vs change in official reserves
Change in reserves (lhs)
Profit (rhs)
PLNbn
5 MACROscope January 2017
Fiscal policy watch
Lower budget deficit, lower general government deficit
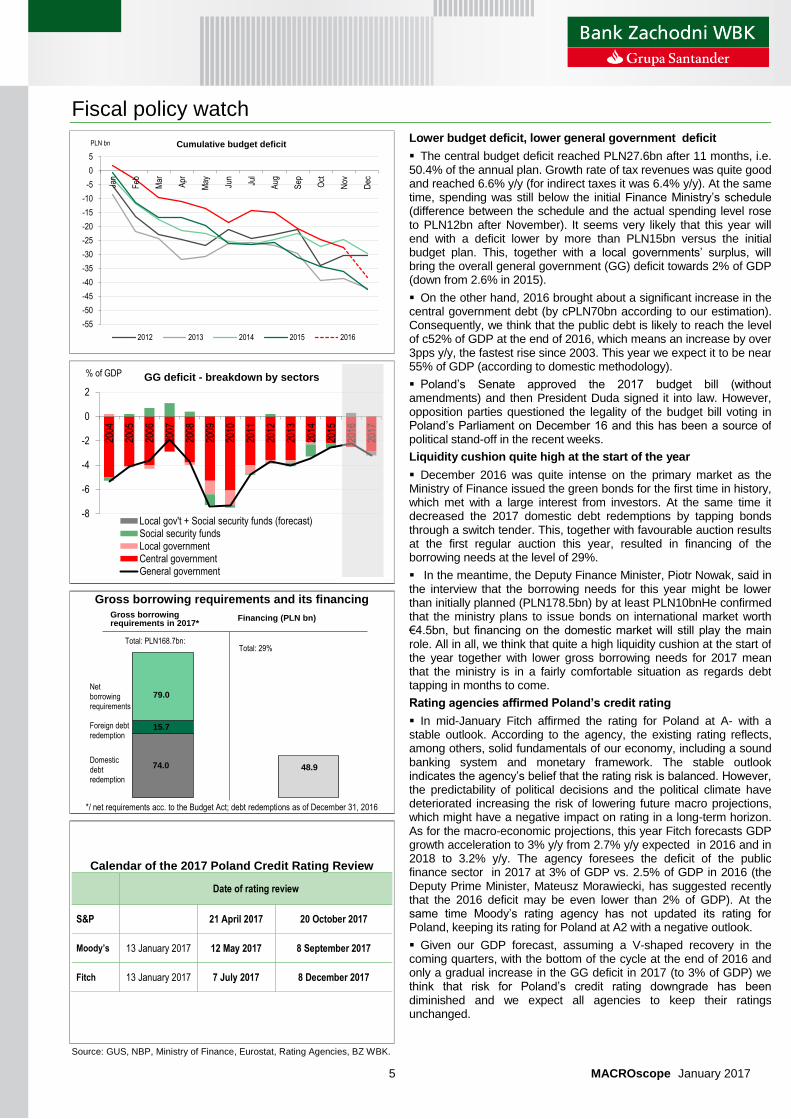
The central budget deficit reached PLN27.6bn after 11 months, i.e. 50.4% of the annual plan. Growth rate of tax revenues was quite good and reached 6.6% y/y (for indirect taxes it was 6.4% y/y). At the same time, spending was still below the initial Finance Ministry’s schedule (difference between the schedule and the actual spending level rose to PLN12bn after November). It seems very likely that this year will end with a deficit lower by more than PLN15bn versus the initial budget plan. This, together with a local governments’ surplus, will bring the overall general government (GG) deficit towards 2% of GDP (down from 2.6% in 2015).
On the other hand, 2016 brought about a significant increase in the central government debt (by cPLN70bn according to our estimation). Consequently, we think that the public debt is likely to reach the level of c52% of GDP at the end of 2016, which means an increase by over 3pps y/y, the fastest rise since 2003. This year we expect it to be near 55% of GDP (according to domestic methodology).
Poland’s Senate approved the 2017 budget bill (without amendments) and then President Duda signed it into law. However, opposition parties questioned the legality of the budget bill voting in Poland’s Parliament on December 16 and this has been a source of political stand-off in the recent weeks.
Liquidity cushion quite high at the start of the year
December 2016 was quite intense on the primary market as the Ministry of Finance issued the green bonds for the first time in history, which met with a large interest from investors. At the same time it decreased the 2017 domestic debt redemptions by tapping bonds through a switch tender. This, together with favourable auction results at the first regular auction this year, resulted in financing of the borrowing needs at the level of 29%.
In the meantime, the Deputy Finance Minister, Piotr Nowak, said in the interview that the borrowing needs for this year might be lower than initially planned (PLN178.5bn) by at least PLN10bnHe confirmed that the ministry plans to issue bonds on international market worth €4.5bn, but financing on the domestic market will still play the main role. All in all, we think that quite a high liquidity cushion at the start of the year together with lower gross borrowing needs for 2017 mean that the ministry is in a fairly comfortable situation as regards debt tapping in months to come.
Rating agencies affirmed Poland’s credit rating
In mid-January Fitch affirmed the rating for Poland at A- with a stable outlook. According to the agency, the existing rating reflects, among others, solid fundamentals of our economy, including a sound banking system and monetary framework. The stable outlook indicates the agency’s belief that the rating risk is balanced. However, the predictability of political decisions and the political climate have deteriorated increasing the risk of lowering future macro projections, which might have a negative impact on rating in a long-term horizon. As for the macro-economic projections, this year Fitch forecasts GDP growth acceleration to 3% y/y from 2.7% y/y expected in 2016 and in 2018 to 3.2% y/y. The agency foresees the deficit of the public finance sector in 2017 at 3% of GDP vs. 2.5% of GDP in 2016 (the Deputy Prime Minister, Mateusz Morawiecki, has suggested recently that the 2016 deficit may be even lower than 2% of GDP). At the same time Moody’s rating agency has not updated its rating for Poland, keeping its rating for Poland at A2 with a negative outlook.
Given our GDP forecast, assuming a V-shaped recovery in the coming quarters, with the bottom of the cycle at the end of 2016 and only a gradual increase in the GG deficit in 2017 (to 3% of GDP) we think that risk for Poland’s credit rating downgrade has been diminished and we expect all agencies to keep their ratings unchanged.
Gross borrowing requirements and its financing
*/ net requirements acc. to the Budget Act; debt redemptions as of December 31, 2016
Calendar of the 2017 Poland Credit Rating Review
Date of rating review
S&P 21 April 2017 20 October 2017
Moody’s 13 January 2017 12 May 2017 8 September 2017
Fitch 13 January 2017 7 July 2017 8 December 2017
Source: GUS, NBP, Ministry of Finance, Eurostat, Rating Agencies, BZ WBK.
-55
-50
-45
-40
-35
-30
-25
-20
-15
-10
-5
0
5
Jan
Feb
Mar
Apr
May Jun
Jul
Aug
Sep Oct
Nov
Dec
PLN bn Cumulative budget deficit
2012 2013 2014 2015 2016
-8
-6
-4
-2
0
2
2004
2005
2006
2007
2008
2009
2010
2011
2012
2013
2014
2015
2016
2017
GG deficit - breakdown by sectors
Local gov't + Social security funds (forecast)Social security fundsLocal governmentCentral governmentGeneral government
% of GDP
Net borrowing requirements
Foreign debt redemption
Domestic debt redemption
Total: PLN168.7bn:
Gross borrowing requirements in 2017*
74.0
15.7
79.0
Financing (PLN bn)
Total: 29%
48.9
6 MACROscope January 2017
Interest rate market
Start of 2017 quite favourable for interest rate market
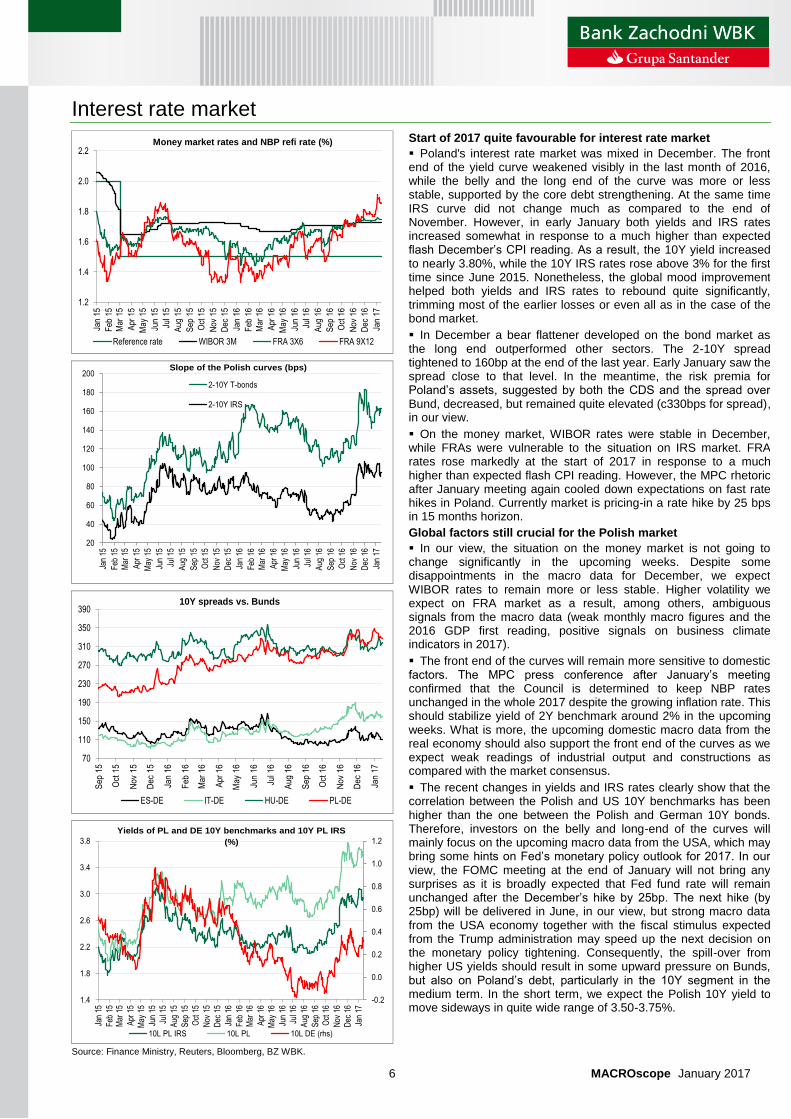
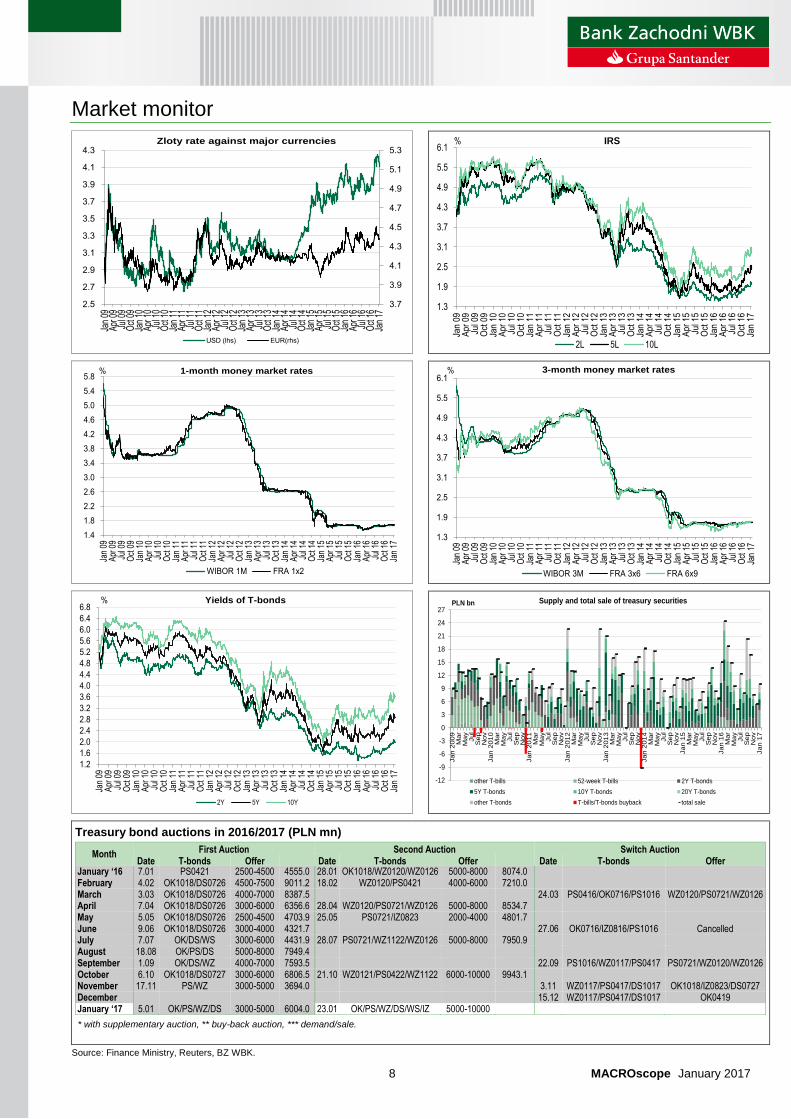
Poland's interest rate market was mixed in December. The front end of the yield curve weakened visibly in the last month of 2016, while the belly and the long end of the curve was more or less stable, supported by the core debt strengthening. At the same time IRS curve did not change much as compared to the end of November. However, in early January both yields and IRS rates increased somewhat in response to a much higher than expected flash December’s CPI reading. As a result, the 10Y yield increased to nearly 3.80%, while the 10Y IRS rates rose above 3% for the first time since June 2015. Nonetheless, the global mood improvement helped both yields and IRS rates to rebound quite significantly, trimming most of the earlier losses or even all as in the case of the bond market.
In December a bear flattener developed on the bond market as the long end outperformed other sectors. The 2-10Y spread tightened to 160bp at the end of the last year. Early January saw the spread close to that level. In the meantime, the risk premia for Poland’s assets, suggested by both the CDS and the spread over Bund, decreased, but remained quite elevated (c330bps for spread), in our view.
On the money market, WIBOR rates were stable in December, while FRAs were vulnerable to the situation on IRS market. FRA rates rose markedly at the start of 2017 in response to a much higher than expected flash CPI reading. However, the MPC rhetoric after January meeting again cooled down expectations on fast rate hikes in Poland. Currently market is pricing-in a rate hike by 25 bps in 15 months horizon.
Global factors still crucial for the Polish market
In our view, the situation on the money market is not going to change significantly in the upcoming weeks. Despite some disappointments in the macro data for December, we expect WIBOR rates to remain more or less stable. Higher volatility we expect on FRA market as a result, among others, ambiguous signals from the macro data (weak monthly macro figures and the 2016 GDP first reading, positive signals on business climate indicators in 2017).
The front end of the curves will remain more sensitive to domestic factors. The MPC press conference after January’s meeting confirmed that the Council is determined to keep NBP rates unchanged in the whole 2017 despite the growing inflation rate. This should stabilize yield of 2Y benchmark around 2% in the upcoming weeks. What is more, the upcoming domestic macro data from the real economy should also support the front end of the curves as we expect weak readings of industrial output and constructions as compared with the market consensus.
The recent changes in yields and IRS rates clearly show that the correlation between the Polish and US 10Y benchmarks has been higher than the one between the Polish and German 10Y bonds. Therefore, investors on the belly and long-end of the curves will mainly focus on the upcoming macro data from the USA, which may bring some hints on Fed’s monetary policy outlook for 2017. In our view, the FOMC meeting at the end of January will not bring any surprises as it is broadly expected that Fed fund rate will remain unchanged after the December’s hike by 25bp. The next hike (by 25bp) will be delivered in June, in our view, but strong macro data from the USA economy together with the fiscal stimulus expected from the Trump administration may speed up the next decision on the monetary policy tightening. Consequently, the spill-over from higher US yields should result in some upward pressure on Bunds, but also on Poland’s debt, particularly in the 10Y segment in the medium term. In the short term, we expect the Polish 10Y yield to move sideways in quite wide range of 3.50-3.75%.
Source: Finance Ministry, Reuters, Bloomberg, BZ WBK.
1.2
1.4
1.6
1.8
2.0
2.2
Jan
15
Feb
15
Mar
15
Apr
15
May
15
Jun
15
Jul 1
5
Aug
15
Sep
15
Oct
15
Nov
15
Dec
15
Jan
16
Feb
16
Mar
16
Apr
16
May
16
Jun
16
Jul 1
6
Aug
16
Sep
16
Oct
16
Nov
16
Dec
16
Jan
17
Money market rates and NBP refi rate (%)
Reference rate WIBOR 3M FRA 3X6 FRA 9X12
20
40
60
80
100
120
140
160
180
200
Jan
15
Feb
15
Mar
15
Apr
15
May
15
Jun
15
Jul 1
5
Aug
15
Sep
15
Oct
15
Nov
15
Dec
15
Jan
16
Feb
16
Mar
16
Apr
16
May
16
Jun
16
Jul 1
6
Aug
16
Sep
16
Oct
16
Nov
16
Dec
16
Jan
17Slope of the Polish curves (bps)
2-10Y T-bonds
2-10Y IRS
70
110
150
190
230
270
310
350
390
Se
p 1
5
Oct
15
No
v 1
5
De
c 1
5
Jan 1
6
Fe
b 1
6
Ma
r 1
6
Apr
16
Ma
y 1
6
Jun
16
Jul 1
6
Au
g 1
6
Se
p 1
6
Oct
16
No
v 1
6
De
c 1
6
Jan
17
10Y spreads vs. Bunds
ES-DE IT-DE HU-DE PL-DE
-0.2
0.0
0.2
0.4
0.6
0.8
1.0
1.2
1.4
1.8
2.2
2.6
3.0
3.4
3.8
Jan
15
Feb
15
Mar
15
Apr
15
May
15
Jun
15
Jul 1
5
Aug
15
Sep
15
Oct
15
Nov
15
Dec
15
Jan
16
Feb
16
Mar
16
Apr
16
May
16
Jun
16
Jul 1
6
Aug
16
Sep
16
Oct
16
Nov
16
Dec
16
Jan
17
Yields of PL and DE 10Y benchmarks and 10Y PL IRS
(%)
10L PL IRS 10L PL 10L DE (rhs)
7 MACROscope January 2017
Foreign exchange market EUR/PLN exchange rate
Zloty’s appreciation may stop
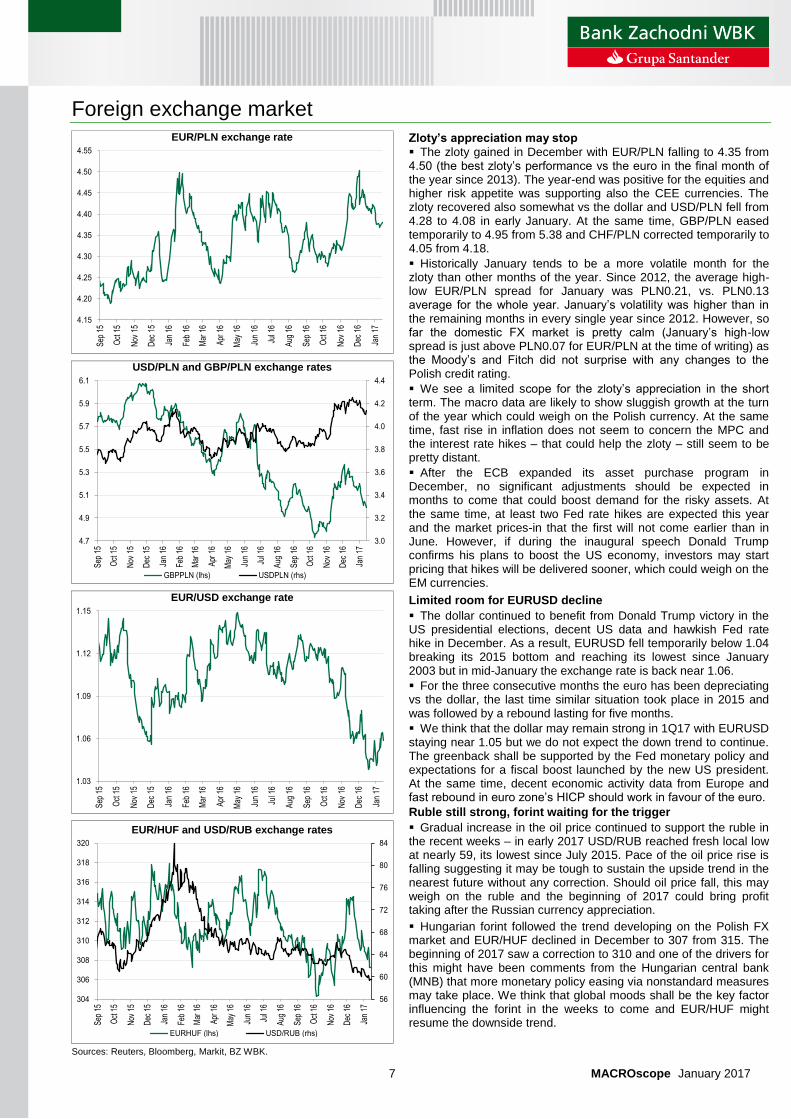
The zloty gained in December with EUR/PLN falling to 4.35 from 4.50 (the best zloty’s performance vs the euro in the final month of the year since 2013). The year-end was positive for the equities and higher risk appetite was supporting also the CEE currencies. The zloty recovered also somewhat vs the dollar and USD/PLN fell from 4.28 to 4.08 in early January. At the same time, GBP/PLN eased temporarily to 4.95 from 5.38 and CHF/PLN corrected temporarily to 4.05 from 4.18.
Historically January tends to be a more volatile month for the zloty than other months of the year. Since 2012, the average high-low EUR/PLN spread for January was PLN0.21, vs. PLN0.13 average for the whole year. January’s volatility was higher than in the remaining months in every single year since 2012. However, so far the domestic FX market is pretty calm (January’s high-low spread is just above PLN0.07 for EUR/PLN at the time of writing) as the Moody’s and Fitch did not surprise with any changes to the Polish credit rating.
We see a limited scope for the zloty’s appreciation in the short term. The macro data are likely to show sluggish growth at the turn of the year which could weigh on the Polish currency. At the same time, fast rise in inflation does not seem to concern the MPC and the interest rate hikes – that could help the zloty – still seem to be pretty distant.
After the ECB expanded its asset purchase program in December, no significant adjustments should be expected in months to come that could boost demand for the risky assets. At the same time, at least two Fed rate hikes are expected this year and the market prices-in that the first will not come earlier than in June. However, if during the inaugural speech Donald Trump confirms his plans to boost the US economy, investors may start pricing that hikes will be delivered sooner, which could weigh on the EM currencies.
Limited room for EURUSD decline
The dollar continued to benefit from Donald Trump victory in the US presidential elections, decent US data and hawkish Fed rate hike in December. As a result, EURUSD fell temporarily below 1.04 breaking its 2015 bottom and reaching its lowest since January 2003 but in mid-January the exchange rate is back near 1.06.
For the three consecutive months the euro has been depreciating vs the dollar, the last time similar situation took place in 2015 and was followed by a rebound lasting for five months.
We think that the dollar may remain strong in 1Q17 with EURUSD staying near 1.05 but we do not expect the down trend to continue. The greenback shall be supported by the Fed monetary policy and expectations for a fiscal boost launched by the new US president. At the same time, decent economic activity data from Europe and fast rebound in euro zone’s HICP should work in favour of the euro.
Ruble still strong, forint waiting for the trigger
Gradual increase in the oil price continued to support the ruble in the recent weeks – in early 2017 USD/RUB reached fresh local low at nearly 59, its lowest since July 2015. Pace of the oil price rise is falling suggesting it may be tough to sustain the upside trend in the nearest future without any correction. Should oil price fall, this may weigh on the ruble and the beginning of 2017 could bring profit taking after the Russian currency appreciation.
Hungarian forint followed the trend developing on the Polish FX market and EUR/HUF declined in December to 307 from 315. The beginning of 2017 saw a correction to 310 and one of the drivers for this might have been comments from the Hungarian central bank (MNB) that more monetary policy easing via nonstandard measures may take place. We think that global moods shall be the key factor influencing the forint in the weeks to come and EUR/HUF might resume the downside trend.
USD/PLN and GBP/PLN exchange rates
EUR/USD exchange rate
EUR/HUF and USD/RUB exchange rates
Sources: Reuters, Bloomberg, Markit, BZ WBK.
4.15
4.20
4.25
4.30
4.35
4.40
4.45
4.50
4.55
Sep
15
Oct
15
Nov
15
Dec
15
Jan
16
Feb
16
Mar
16
Apr
16
May
16
Jun
16
Jul 1
6
Aug
16
Sep
16
Oct
16
Nov
16
Dec
16
Jan
17
3.0
3.2
3.4
3.6
3.8
4.0
4.2
4.4
4.7
4.9
5.1
5.3
5.5
5.7
5.9
6.1
Sep
15
Oct
15
Nov
15
Dec
15
Jan
16
Feb
16
Mar
16
Apr
16
May
16
Jun
16
Jul 1
6
Aug
16
Sep
16
Oct
16
Nov
16
Dec
16
Jan
17
GBPPLN (lhs) USDPLN (rhs)
1.03
1.06
1.09
1.12
1.15
Sep
15
Oct
15
Nov
15
Dec
15
Jan
16
Feb
16
Mar
16
Apr
16
May
16
Jun
16
Jul 1
6
Aug
16
Sep
16
Oct
16
Nov
16
Dec
16
Jan
17
56
60
64
68
72
76
80
84
304
306
308
310
312
314
316
318
320
Sep
15
Oct
15
Nov
15
Dec
15
Jan
16
Feb
16
Mar
16
Apr
16
May
16
Jun
16
Jul 1
6
Aug
16
Sep
16
Oct
16
Nov
16
Dec
16
Jan
17
EURHUF (lhs) USD/RUB (rhs)
8 MACROscope January 2017
Market monitor
Treasury bond auctions in 2016/2017 (PLN mn)
Month First Auction Second Auction Switch Auction Date T-bonds Offer Date T-bonds Offer Date T-bonds Offer
January ‘16 7.01 PS0421 2500-4500 4555.0 28.01 OK1018/WZ0120/WZ0126 5000-8000 8074.0 February 4.02 OK1018/DS0726 4500-7500 9011.2 18.02 WZ0120/PS0421 4000-6000 7210.0 March 3.03 OK1018/DS0726 4000-7000 8387.5 24.03 PS0416/OK0716/PS1016 WZ0120/PS0721/WZ0126 April 7.04 OK1018/DS0726 3000-6000 6356.6 28.04 WZ0120/PS0721/WZ0126 5000-8000 8534.7 May 5.05 OK1018/DS0726 2500-4500 4703.9 25.05 PS0721/IZ0823 2000-4000 4801.7 June 9.06 OK1018/DS0726 3000-4000 4321.7 27.06 OK0716/IZ0816/PS1016 Cancelled July 7.07 OK/DS/WS 3000-6000 4431.9 28.07 PS0721/WZ1122/WZ0126 5000-8000 7950.9 August 18.08 OK/PS/DS 5000-8000 7949.4 September 1.09 OK/DS/WZ 4000-7000 7593.5 22.09 PS1016/WZ0117/PS0417 PS0721/WZ0120/WZ0126 October 6.10 OK1018/DS0727 3000-6000 6806.5 21.10 WZ0121/PS0422/WZ1122 6000-10000 9943.1 November 17.11 PS/WZ 3000-5000 3694.0 3.11 WZ0117/PS0417/DS1017 OK1018/IZ0823/DS0727 December 15.12 WZ0117/PS0417/DS1017 OK0419 January ‘17 5.01 OK/PS/WZ/DS 3000-5000 6004.0 23.01 OK/PS/WZ/DS/WS/IZ 5000-10000
* with supplementary auction, ** buy-back auction, *** demand/sale.
Source: Finance Ministry, Reuters, BZ WBK.
3.7
3.9
4.1
4.3
4.5
4.7
4.9
5.1
5.3
2.5
2.7
2.9
3.1
3.3
3.5
3.7
3.9
4.1
4.3
Jan
09Ap
r 09
Jul 0
9O
ct 0
9Ja
n 10
Apr 1
0Ju
l 10
Oct
10
Jan
11Ap
r 11
Jul 1
1O
ct 1
1Ja
n 12
Apr 1
2Ju
l 12
Oct
12
Jan
13Ap
r 13
Jul 1
3O
ct 1
3Ja
n 14
Apr 1
4Ju
l 14
Oct
14
Jan
15Ap
r 15
Jul 1
5O
ct 1
5Ja
n 16
Apr 1
6Ju
l 16
Oct
16
Jan
17
Zloty rate against major currencies
USD (lhs) EUR(rhs)
1.3
1.9
2.5
3.1
3.7
4.3
4.9
5.5
6.1
Jan
09
Ap
r 0
9Ju
l 09
Oct
09
Jan
10
Ap
r 1
0Ju
l 10
Oct
10
Jan
11
Ap
r 1
1Ju
l 11
Oct
11
Jan
12
Ap
r 1
2Ju
l 12
Oct
12
Jan
13
Ap
r 1
3Ju
l 13
Oct
13
Jan
14
Ap
r 1
4Ju
l 14
Oct
14
Jan
15
Ap
r 1
5Ju
l 15
Oct
15
Jan
16
Ap
r 1
6Ju
l 16
Oct
16
Jan
17
% IRS
2L 5L 10L
1.4
1.8
2.2
2.6
3.0
3.4
3.8
4.2
4.6
5.0
5.4
5.8
Jan
09A
pr 0
9Ju
l 09
Oct
09
Jan
10A
pr 1
0Ju
l 10
Oct
10
Jan
11A
pr 1
1Ju
l 11
Oct
11
Jan
12A
pr 1
2Ju
l 12
Oct
12
Jan
13A
pr 1
3Ju
l 13
Oct
13
Jan
14A
pr 1
4Ju
l 14
Oct
14
Jan
15A
pr 1
5Ju
l 15
Oct
15
Jan
16A
pr 1
6Ju
l 16
Oct
16
Jan
17
% 1-month money market rates
WIBOR 1M FRA 1x2
1.3
1.9
2.5
3.1
3.7
4.3
4.9
5.5
6.1
Jan
09A
pr 0
9Ju
l 09
Oct
09
Jan
10A
pr 1
0Ju
l 10
Oct
10
Jan
11A
pr 1
1Ju
l 11
Oct
11
Jan
12A
pr 1
2Ju
l 12
Oct
12
Jan
13A
pr 1
3Ju
l 13
Oct
13
Jan
14A
pr 1
4Ju
l 14
Oct
14
Jan
15A
pr 1
5Ju
l 15
Oct
15
Jan
16A
pr 1
6Ju
l 16
Oct
16
Jan
17
% 3-month money market rates
WIBOR 3M FRA 3x6 FRA 6x9
1.2
1.6
2.0
2.4
2.8
3.2
3.6
4.0
4.4
4.8
5.2
5.6
6.0
6.4
6.8
Jan
09A
pr 0
9Ju
l 09
Oct
09
Jan
10A
pr 1
0Ju
l 10
Oct
10
Jan
11A
pr 1
1Ju
l 11
Oct
11
Jan
12A
pr 1
2Ju
l 12
Oct
12
Jan
13A
pr 1
3Ju
l 13
Oct
13
Jan
14A
pr 1
4Ju
l 14
Oct
14
Jan
15A
pr 1
5Ju
l 15
Oct
15
Jan
16A
pr 1
6Ju
l 16
Oct
16
Jan
17
% Yields of T-bonds
2Y 5Y 10Y
-12
-9
-6
-3
0
3
6
9
12
15
18
21
24
27
Jan
20
09
Ma
rM
ay
Jul
Se
pN
ov
Jan
20
10
Ma
rM
ay
Jul
Se
pN
ov
Jan
20
11
Ma
rM
ay
Jul
Se
pN
ov
Jan
20
12
Ma
rM
ay
Jul
Se
pN
ov
Jan
20
13
Ma
rM
ay
Jul
Se
pN
ov
Jan
20
14
Ma
rM
ay
Jul
Se
pN
ov
Jan
15
Ma
rM
ay
Jul
Se
pN
ov
Jan
16
Ma
rM
ay
Jul
Se
pN
ov
Jan
17
PLN bn Supply and total sale of treasury securities
other T-bills 52-week T-bills 2Y T-bonds
5Y T-bonds 10Y T-bonds 20Y T-bonds
other T-bonds T-bills/T-bonds buyback total sale
9 MACROscope January 2017
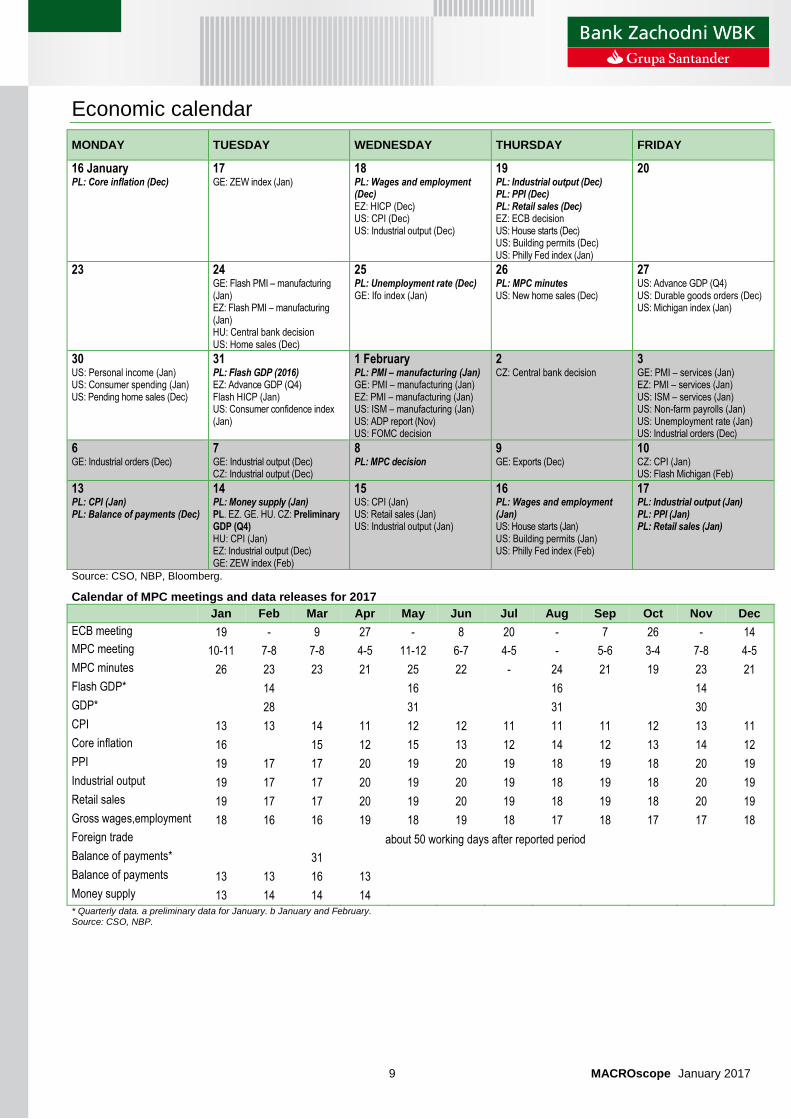
Economic calendar
MONDAY TUESDAY WEDNESDAY THURSDAY FRIDAY
16 January PL: Core inflation (Dec)
17
GE: ZEW index (Jan)
18 PL: Wages and employment (Dec) EZ: HICP (Dec) US: CPI (Dec) US: Industrial output (Dec)
19 PL: Industrial output (Dec) PL: PPI (Dec) PL: Retail sales (Dec) EZ: ECB decision US: House starts (Dec) US: Building permits (Dec) US: Philly Fed index (Jan)
20
23 24
GE: Flash PMI – manufacturing (Jan) EZ: Flash PMI – manufacturing (Jan) HU: Central bank decision US: Home sales (Dec)
25 PL: Unemployment rate (Dec) GE: Ifo index (Jan)
26 PL: MPC minutes US: New home sales (Dec)
27 US: Advance GDP (Q4) US: Durable goods orders (Dec) US: Michigan index (Jan)
30 US: Personal income (Jan) US: Consumer spending (Jan) US: Pending home sales (Dec)
31 PL: Flash GDP (2016) EZ: Advance GDP (Q4) Flash HICP (Jan) US: Consumer confidence index (Jan)
1 February PL: PMI – manufacturing (Jan) GE: PMI – manufacturing (Jan) EZ: PMI – manufacturing (Jan) US: ISM – manufacturing (Jan) US: ADP report (Nov) US: FOMC decision
2
CZ: Central bank decision
3
GE: PMI – services (Jan) EZ: PMI – services (Jan) US: ISM – services (Jan) US: Non-farm payrolls (Jan) US: Unemployment rate (Jan) US: Industrial orders (Dec)
6 GE: Industrial orders (Dec)
7 GE: Industrial output (Dec) CZ: Industrial output (Dec)
8 PL: MPC decision
9
GE: Exports (Dec)
10
CZ: CPI (Jan) US: Flash Michigan (Feb)
13 PL: CPI (Jan) PL: Balance of payments (Dec)
14
PL: Money supply (Jan) PL. EZ. GE. HU. CZ: Preliminary GDP (Q4) HU: CPI (Jan) EZ: Industrial output (Dec) GE: ZEW index (Feb)
15
US: CPI (Jan) US: Retail sales (Jan) US: Industrial output (Jan)
16 PL: Wages and employment (Jan) US: House starts (Jan) US: Building permits (Jan) US: Philly Fed index (Feb)
17
PL: Industrial output (Jan) PL: PPI (Jan) PL: Retail sales (Jan)
Source: CSO, NBP, Bloomberg.
Calendar of MPC meetings and data releases for 2017
Jan Feb Mar Apr May Jun Jul Aug Sep Oct Nov Dec
ECB meeting 19 - 9 27 - 8 20 - 7 26 - 14
MPC meeting 10-11 7-8 7-8 4-5 11-12 6-7 4-5 - 5-6 3-4 7-8 4-5
MPC minutes 26 23 23 21 25 22 - 24 21 19 23 21
Flash GDP* 14 16 16 14
GDP* 28 31 31 30
CPI 13 13 14 11 12 12 11 11 11 12 13 11
Core inflation 16 15 12 15 13 12 14 12 13 14 12
PPI 19 17 17 20 19 20 19 18 19 18 20 19
Industrial output 19 17 17 20 19 20 19 18 19 18 20 19
Retail sales 19 17 17 20 19 20 19 18 19 18 20 19
Gross wages,employment 18 16 16 19 18 19 18 17 18 17 17 18
Foreign trade about 50 working days after reported period
Balance of payments* 31
Balance of payments 13 13 16 13
Money supply 13 14 14 14 * Quarterly data. a preliminary data for January. b January and February. Source: CSO, NBP.
10 MACROscope January 2017
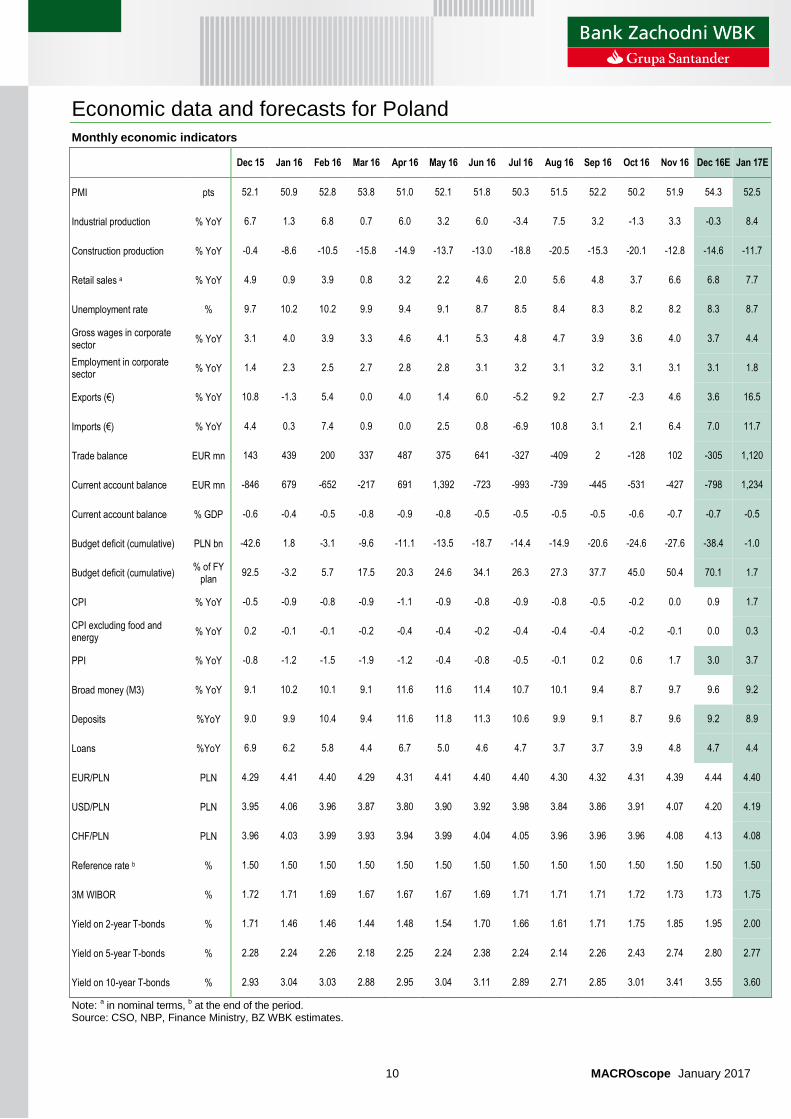
Economic data and forecasts for Poland
Monthly economic indicators
Dec 15 Jan 16 Feb 16 Mar 16 Apr 16 May 16 Jun 16 Jul 16 Aug 16 Sep 16 Oct 16 Nov 16 Dec 16E Jan 17E
PMI pts 52.1 50.9 52.8 53.8 51.0 52.1 51.8 50.3 51.5 52.2 50.2 51.9 54.3 52.5
Industrial production % YoY 6.7 1.3 6.8 0.7 6.0 3.2 6.0 -3.4 7.5 3.2 -1.3 3.3 -0.3 8.4
Construction production % YoY -0.4 -8.6 -10.5 -15.8 -14.9 -13.7 -13.0 -18.8 -20.5 -15.3 -20.1 -12.8 -14.6 -11.7
Retail sales a % YoY 4.9 0.9 3.9 0.8 3.2 2.2 4.6 2.0 5.6 4.8 3.7 6.6 6.8 7.7
Unemployment rate % 9.7 10.2 10.2 9.9 9.4 9.1 8.7 8.5 8.4 8.3 8.2 8.2 8.3 8.7
Gross wages in corporate sector
% YoY 3.1 4.0 3.9 3.3 4.6 4.1 5.3 4.8 4.7 3.9 3.6 4.0 3.7 4.4
Employment in corporate sector
% YoY 1.4 2.3 2.5 2.7 2.8 2.8 3.1 3.2 3.1 3.2 3.1 3.1 3.1 1.8
Exports (€) % YoY 10.8 -1.3 5.4 0.0 4.0 1.4 6.0 -5.2 9.2 2.7 -2.3 4.6 3.6 16.5
Imports (€) % YoY 4.4 0.3 7.4 0.9 0.0 2.5 0.8 -6.9 10.8 3.1 2.1 6.4 7.0 11.7
Trade balance EUR mn 143 439 200 337 487 375 641 -327 -409 2 -128 102 -305 1,120
Current account balance EUR mn -846 679 -652 -217 691 1,392 -723 -993 -739 -445 -531 -427 -798 1,234
Current account balance % GDP -0.6 -0.4 -0.5 -0.8 -0.9 -0.8 -0.5 -0.5 -0.5 -0.5 -0.6 -0.7 -0.7 -0.5
Budget deficit (cumulative) PLN bn -42.6 1.8 -3.1 -9.6 -11.1 -13.5 -18.7 -14.4 -14.9 -20.6 -24.6 -27.6 -38.4 -1.0
Budget deficit (cumulative) % of FY
plan 92.5 -3.2 5.7 17.5 20.3 24.6 34.1 26.3 27.3 37.7 45.0 50.4 70.1 1.7
CPI % YoY -0.5 -0.9 -0.8 -0.9 -1.1 -0.9 -0.8 -0.9 -0.8 -0.5 -0.2 0.0 0.9 1.7
CPI excluding food and energy
% YoY 0.2 -0.1 -0.1 -0.2 -0.4 -0.4 -0.2 -0.4 -0.4 -0.4 -0.2 -0.1 0.0 0.3
PPI % YoY -0.8 -1.2 -1.5 -1.9 -1.2 -0.4 -0.8 -0.5 -0.1 0.2 0.6 1.7 3.0 3.7
Broad money (M3) % YoY 9.1 10.2 10.1 9.1 11.6 11.6 11.4 10.7 10.1 9.4 8.7 9.7 9.6 9.2
Deposits %YoY 9.0 9.9 10.4 9.4 11.6 11.8 11.3 10.6 9.9 9.1 8.7 9.6 9.2 8.9
Loans %YoY 6.9 6.2 5.8 4.4 6.7 5.0 4.6 4.7 3.7 3.7 3.9 4.8 4.7 4.4
EUR/PLN PLN 4.29 4.41 4.40 4.29 4.31 4.41 4.40 4.40 4.30 4.32 4.31 4.39 4.44 4.40
USD/PLN PLN 3.95 4.06 3.96 3.87 3.80 3.90 3.92 3.98 3.84 3.86 3.91 4.07 4.20 4.19
CHF/PLN PLN 3.96 4.03 3.99 3.93 3.94 3.99 4.04 4.05 3.96 3.96 3.96 4.08 4.13 4.08
Reference rate b % 1.50 1.50 1.50 1.50 1.50 1.50 1.50 1.50 1.50 1.50 1.50 1.50 1.50 1.50
3M WIBOR % 1.72 1.71 1.69 1.67 1.67 1.67 1.69 1.71 1.71 1.71 1.72 1.73 1.73 1.75
Yield on 2-year T-bonds % 1.71 1.46 1.46 1.44 1.48 1.54 1.70 1.66 1.61 1.71 1.75 1.85 1.95 2.00
Yield on 5-year T-bonds % 2.28 2.24 2.26 2.18 2.25 2.24 2.38 2.24 2.14 2.26 2.43 2.74 2.80 2.77
Yield on 10-year T-bonds % 2.93 3.04 3.03 2.88 2.95 3.04 3.11 2.89 2.71 2.85 3.01 3.41 3.55 3.60
Note: a in nominal terms,
b at the end of the period.
Source: CSO, NBP, Finance Ministry, BZ WBK estimates.
11 MACROscope January 2017
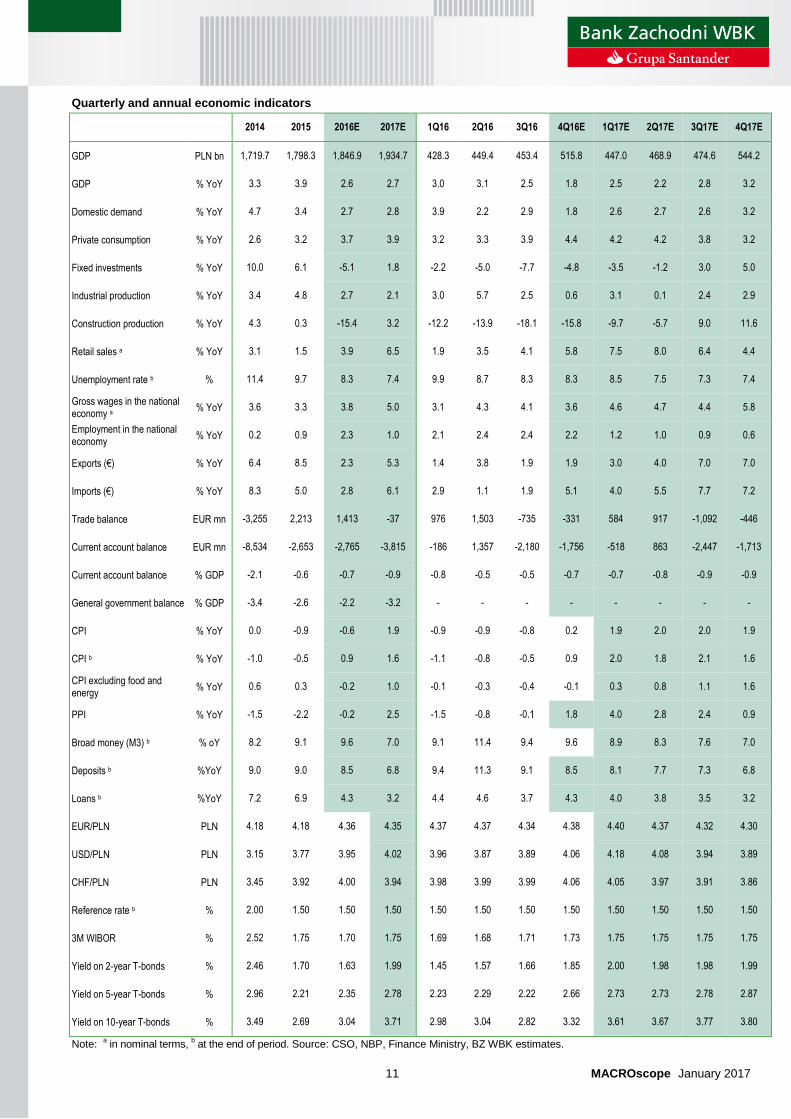
Quarterly and annual economic indicators
2014 2015 2016E 2017E 1Q16 2Q16 3Q16 4Q16E 1Q17E 2Q17E 3Q17E 4Q17E
GDP PLN bn 1,719.7 1,798.3 1,846.9 1,934.7 428.3 449.4 453.4 515.8 447.0 468.9 474.6 544.2
GDP % YoY 3.3 3.9 2.6 2.7 3.0 3.1 2.5 1.8 2.5 2.2 2.8 3.2
Domestic demand % YoY 4.7 3.4 2.7 2.8 3.9 2.2 2.9 1.8 2.6 2.7 2.6 3.2
Private consumption % YoY 2.6 3.2 3.7 3.9 3.2 3.3 3.9 4.4 4.2 4.2 3.8 3.2
Fixed investments % YoY 10.0 6.1 -5.1 1.8 -2.2 -5.0 -7.7 -4.8 -3.5 -1.2 3.0 5.0
Industrial production % YoY 3.4 4.8 2.7 2.1 3.0 5.7 2.5 0.6 3.1 0.1 2.4 2.9
Construction production % YoY 4.3 0.3 -15.4 3.2 -12.2 -13.9 -18.1 -15.8 -9.7 -5.7 9.0 11.6
Retail sales a % YoY 3.1 1.5 3.9 6.5 1.9 3.5 4.1 5.8 7.5 8.0 6.4 4.4
Unemployment rate b % 11.4 9.7 8.3 7.4 9.9 8.7 8.3 8.3 8.5 7.5 7.3 7.4
Gross wages in the national economy a
% YoY 3.6 3.3 3.8 5.0 3.1 4.3 4.1 3.6 4.6 4.7 4.4 5.8
Employment in the national economy
% YoY 0.2 0.9 2.3 1.0 2.1 2.4 2.4 2.2 1.2 1.0 0.9 0.6
Exports (€) % YoY 6.4 8.5 2.3 5.3 1.4 3.8 1.9 1.9 3.0 4.0 7.0 7.0
Imports (€) % YoY 8.3 5.0 2.8 6.1 2.9 1.1 1.9 5.1 4.0 5.5 7.7 7.2
Trade balance EUR mn -3,255 2,213 1,413 -37 976 1,503 -735 -331 584 917 -1,092 -446
Current account balance EUR mn -8,534 -2,653 -2,765 -3,815 -186 1,357 -2,180 -1,756 -518 863 -2,447 -1,713
Current account balance % GDP -2.1 -0.6 -0.7 -0.9 -0.8 -0.5 -0.5 -0.7 -0.7 -0.8 -0.9 -0.9
General government balance % GDP -3.4 -2.6 -2.2 -3.2 - - - - - - - -
CPI % YoY 0.0 -0.9 -0.6 1.9 -0.9 -0.9 -0.8 0.2 1.9 2.0 2.0 1.9
CPI b % YoY -1.0 -0.5 0.9 1.6 -1.1 -0.8 -0.5 0.9 2.0 1.8 2.1 1.6
CPI excluding food and energy
% YoY 0.6 0.3 -0.2 1.0 -0.1 -0.3 -0.4 -0.1 0.3 0.8 1.1 1.6
PPI % YoY -1.5 -2.2 -0.2 2.5 -1.5 -0.8 -0.1 1.8 4.0 2.8 2.4 0.9
Broad money (M3) b % oY 8.2 9.1 9.6 7.0 9.1 11.4 9.4 9.6 8.9 8.3 7.6 7.0
Deposits b %YoY 9.0 9.0 8.5 6.8 9.4 11.3 9.1 8.5 8.1 7.7 7.3 6.8
Loans b %YoY 7.2 6.9 4.3 3.2 4.4 4.6 3.7 4.3 4.0 3.8 3.5 3.2
EUR/PLN PLN 4.18 4.18 4.36 4.35 4.37 4.37 4.34 4.38 4.40 4.37 4.32 4.30
USD/PLN PLN 3.15 3.77 3.95 4.02 3.96 3.87 3.89 4.06 4.18 4.08 3.94 3.89
CHF/PLN PLN 3.45 3.92 4.00 3.94 3.98 3.99 3.99 4.06 4.05 3.97 3.91 3.86
Reference rate b % 2.00 1.50 1.50 1.50 1.50 1.50 1.50 1.50 1.50 1.50 1.50 1.50
3M WIBOR % 2.52 1.75 1.70 1.75 1.69 1.68 1.71 1.73 1.75 1.75 1.75 1.75
Yield on 2-year T-bonds % 2.46 1.70 1.63 1.99 1.45 1.57 1.66 1.85 2.00 1.98 1.98 1.99
Yield on 5-year T-bonds % 2.96 2.21 2.35 2.78 2.23 2.29 2.22 2.66 2.73 2.73 2.78 2.87
Yield on 10-year T-bonds % 3.49 2.69 3.04 3.71 2.98 3.04 2.82 3.32 3.61 3.67 3.77 3.80
Note: a in nominal terms,
b at the end of period. Source: CSO, NBP, Finance Ministry, BZ WBK estimates.
12 MACROscope January 2017
This analysis is based on information available until 16.01.2017 has been prepared by:
ECONOMIC ANALYSIS DEPARTMENT al. Jana Pawła II 17, 00-854 Warszawa fax (+48) 22 586 8340
Email: [email protected] Web site (including Economic Service page): http://www.skarb.bzwbk.pl
Maciej Reluga* – Chief Economist
tel. (+48) 22 534 1888. Email: [email protected]
Piotr Bielski* (+48) 22 534 1887
Agnieszka Decewicz* (+48) 22 534 1886
Marcin Luziński* (+48) 22 534 1885
Marcin Sulewski* (+48) 22 534 1884
TREASURY SERVICES DEPARTMENT
Poznań
pl. Gen. W. Andersa 5
61-894 Poznań
tel. (+48) 61 856 58 14/30
fax (+48) 61 856 4456
Warszawa
al. Jana Pawła II 17
00-854 Warszawa
tel. (+48) 22 586 83 20/38
fax (+48) 22 586 8340
Wrocław
ul. Rynek 9/11
50-950 Wrocław
tel. (+48) 71 369 9400
fax (+48) 71 370 2622
13 MACROscope January 2017
IMPORTANT DISCLOSURES
This report has been prepared by Bank Zachodni WBK S.A. and is provided for information purposes only. Bank Zachodni WBK S.A. is registered in Poland and is authorised and
regulated by The Polish Financial Supervision Authority.
This report is issued in Poland by Bank Zachodni WBK S.A. (“BZ WBK”), in Spain by Banco Santander, S.A., under the supervision of the CNMV and in the United Kingdom by Banco
Santander, S.A., London Branch (“Santander London”). Santander London is registered in the UK (with FRN 136261) and subject to limited regulation by the FCA and PRA. BZ WBK,
Banco Santander, S.A. and Santander London are members of Grupo Santander. A list of authorised legal entities within Grupo Santander is available upon request.
This material constitutes “investment research” for the purposes of the Markets in Financial Instruments Directive and as such contains an objective or independent explanation of the
matters contained in the material. Any recommendations contained in this document must not be relied upon as investment advice based on the recipient’s personal circumstances.
The information and opinions contained in this report have been obtained from, or are based on, public sources believed to be reliable, but no representation or warranty, express or
implied, is made that such information is accurate, complete or up to date and it should not be relied upon as such. Furthermore, this report does not constitute a prospectus or other
offering document or an offer or solicitation to buy or sell any securities or other investment. Information and opinions contained in the report are published for the assistance of
recipients, but are not to be relied upon as authoritative or taken in substitution for the exercise of judgement by any recipient, are subject to change without notice and not intended to
provide the sole basis of any evaluation of the instruments discussed herein.
Any reference to past performance should not be taken as an indication of future performance. This report is for the use of intended recipients only and may not be reproduced (in
whole or in part) or delivered or transmitted to any other person without the prior written consent of BZ WBK.
Investors should seek financial advice regarding the appropriateness of investing in financial instruments and implementing investment strategies discussed or recommended in this
report and should understand that statements regarding future prospects may not be realised. Any decision to purchase or subscribe for securities in any offering must be based
solely on existing public information on such security or the information in the prospectus or other offering document issued in connection with such offering, and not on this report.
The material in this research report is general information intended for recipients who understand the risks associated with investment. It does not take into account whether an
investment, course of action, or associated risks are suitable for the recipient. Furthermore, this document is intended to be used by market professionals (eligible counterparties and
professional clients but not retail clients). Retail clients must not rely on this document.
To the fullest extent permitted by law, no Santander Group company accepts any liability whatsoever (including in negligence) for any direct or consequential loss arising from any use
of or reliance on material contained in this report. All estimates and opinions included in this report are made as of the date of this report. Unless otherwise indicated in this report
there is no intention to update this report.
BZ WBK and its legal affiliates may make a market in, or may, as principal or agent, buy or sell securities of the issuers mentioned in this report or derivatives thereon. BZ WBK and
its legal affiliates may have a financial interest in the issuers mentioned in this report, including a long or short position in their securities and/or options, futures or other derivative
instruments based thereon, or vice versa.
BZ WBK and its legal affiliates may receive or intend to seek compensation for investment banking services in the next three months from or in relation to an issuer mentioned in this
report. Any issuer mentioned in this report may have been provided with sections of this report prior to its publication in order to verify its factual accuracy.
Bank Zachodni WBK S.A. (BZ WBK) and/or a company in the Santander Group is a market maker or a liquidity provider for EUR/PLN.
Bank Zachodni WBK S.A. (BZ WBK) and/or a company of the Santander Group has been lead or co-lead manager over the previous 12 months in a publicly disclosed offer of or on
financial instruments issued by the Polish Ministry of Finance or Ministry of Treasury.
Bank Zachodni WBK S.A. (BZ WBK) and/or a company in the Santander Group expects to receive or intends to seek compensation for investment banking services from the Polish
Ministry of Finance or Ministry of Treasury in the next three months.
ADDITIONAL INFORMATION
BZ WBK or any of its affiliates, salespeople, traders and other professionals may provide oral or written market commentary or trading strategies to its clients that reflect opinions that
are contrary to the opinions expressed herein. Furthermore, BZ WBK or any of its affiliates’ trading and investment businesses may make investment decisions that are inconsistent
with the recommendations expressed herein.
No part of this report may be copied, conveyed, distributed or furnished to any person or entity in any country (or persons or entities in the same) in which its distribution is prohibited
by law. Failure to comply with these restrictions may breach the laws of the relevant jurisdiction.
Investment research issued by BZ WBK is prepared in accordance with the Santander Group policies for managing conflicts of interest. In relation to the production of investment
research, BZ WBK and its affiliates have internal rules of conduct that contain, among other things, procedures to prevent conflicts of interest including Chinese Walls and, where
appropriate, establishing specific restrictions on research activity. Information concerning the management of conflicts of interest and the internal rules of conduct are available on
request from BZ WBK.
COUNTRY & REGION SPECIFIC DISCLOSURES
Poland (PL): This publication has been prepared by Bank Zachodni WBK S.A. for information purposes only and it is not an offer or solicitation for the purchase or sale of any
financial instrument. All reasonable care has been taken to ensure that the information contained herein is not untrue or misleading. But no representation is made as to its accuracy
or completeness. No reliance should be placed on it and no liability is accepted for any loss arising from reliance on it. Information presented in the publication is not an investment
advice. Resulting from the purchase or sale of financial instrument, additional costs, including taxes, that are not payable to or through Bank Zachodni WBK S.A., can arise to the
purchasing or selling party. Rates used for calculation can differ from market levels or can be inconsistent with financial calculation of any market participant. Conditions presented in
the publication are subject to change. Examples presented in the publication is for information purposes only and shall be treated only as a base for further discussion.
U.K. and European Economic Area (EEA): Unless specified to the contrary, issued and approved for distribution in the U.K. and the EEA by Banco Santander, S.A. Investment
research issued by Banco Santander, S.A. has been prepared in accordance with Grupo Santander’s policies for managing conflicts of interest arising as a result of publication and
distribution of investment research. Many European regulators require that a firm establish, implement and maintain such a policy. This report has been issued in the U.K. only to
persons of a kind described in Article 19 (5), 38, 47 and 49 of the Financial Services and Markets Act 2000 (Financial Promotion) Order 2005 (all such persons being referred to as
“relevant persons”). This document must not be acted on or relied on by persons who are not relevant persons. Any investment or investment activity to which this document relates is
only regarded as being provided to professional investors (or equivalent) in their home jurisdiction.
© Bank Zachodni WBK 2016. All Rights Reserved.