Embed Size (px)
DESCRIPTION
54b3c4bf0cf28ebe92e32806
Citation preview
Seediscussions,stats,andauthorprofilesforthispublicationat:http://www.researchgate.net/publication/267099591
NuSTARobservationsandbroadbandspectralenergydistributionmodelingofthemillisecondpulsarbinaryPSRJ1023+0038
ARTICLEinTHEASTROPHYSICALJOURNAL·OCTOBER2014
ImpactFactor:6.28·DOI:10.1088/0004-637X/797/2/111·Source:arXiv
CITATION
1
7AUTHORS,INCLUDING:
JumpeiTakata
TheUniversityofHongKong
80PUBLICATIONS605CITATIONS
SEEPROFILE
P.H.Tam
NationalTsingHuaUniversity
108PUBLICATIONS2,193CITATIONS
SEEPROFILE
C.Y.Hui
ChungnamNationalUniversity
72PUBLICATIONS376CITATIONS
SEEPROFILE
Availablefrom:C.Y.Hui
Retrievedon:27August2015
arX
iv:1
410.
4563
v1 [
astr
o-ph
.HE
] 1
6 O
ct 2
014
Accepted for publication in ApJPreprint typeset using LATEX style emulateapj v. 5/2/11
NUSTAR OBSERVATIONS AND BROADBAND SPECTRAL ENERGY DISTRIBUTION MODELING OF THEMILLISECOND PULSAR BINARY PSR J1023+0038
K. L. Li1, A. K. H. Kong1, J. Takata2, K. S. Cheng2, P. H. T. Tam1, C. Y. Hui3, Ruolan Jin1
1 Institute of Astronomy and Department of Physics, National Tsing Hua University, Hsinchu 30013, Taiwan; [email protected],[email protected]
2 Department of Physics, University of Hong Kong, Pokfulam Road, Hong Kong; [email protected] and3 Department of Astronomy and Space Science, Chungnam National University, Daejeon, Republic of Korea
Accepted for publication in ApJ
ABSTRACT
We report the first hard X-ray (3–79 keV) observations of the millisecond pulsar (MSP) binary PSRJ1023+0038 using NuSTAR. This system has been shown transiting between a low-mass X-ray binary(LMXB) state and a rotation-powered MSP state. The NuSTAR observations were taken in bothLMXB state and rotation-powered state. The source is clearly seen in both states up to ∼ 79 keV.During the LMXB state, the 3–79 keV flux is about a factor of 10 higher that in the rotation-poweredstate. The hard X-rays show clear orbital modulation during the X-ray faint rotation-powered statebut the X-ray orbital period is not detected in the X-ray bright LMXB state. In addition, the X-ray spectrum changes from a flat power-law spectrum during the rotation-powered state to a steeperpower-law spectrum in the LMXB state. We suggest that the hard X-rays are due to the intra-binaryshock from the interaction between the pulsar wind and the injected material from the low-masscompanion star. During the rotation-powered MSP state, the X-ray orbital modulation is due toDoppler boosting of the shocked pulsar wind. At the LMXB state, the evaporating matter of theaccretion disk due to the gamma-ray irradiation from the pulsar stops almost all the pulsar wind,resulting the disappearance of the X-ray orbital modulation.Subject headings: accretion, accretion disks—binaries: close—pulsars: individual (PSR
J1023+0038)—X-rays: binaries
1. INTRODUCTION
Millisecond pulsars (MSPs) are widely believed to bethe descent of low-mass X-ray binaries (LMXBs). Basedon current theoretical models, the rotating neutron starin a LMXB can be spun up to millisecond periods viaaccretion from the low-mass companion which transfersmass and angular momentum to the pulsar (e.g., Alparet al. 1982). The first evidence of this “recycling” sce-nario comes from the discovery of accreting millisecondX-ray pulsars in LMXBs (e.g., Wijnands & van der Klis1998). When the accretion stops and the accretion diskis removed, the system will become a MSP powered byrotation. It is still a puzzle how and when this processhappens. Possible models include pulsar wind ablation(Wang et al. 2009), propeller effect (Romanova et al.2009), and γ-ray heating from the MSP (Takata et al.2010).To investigate the evolutionary process of MSPs and
LMXBs, one has to look for a system that shows bothrotation-powered MSP and LMXB behaviors. The dis-covery of the MSP/X-ray binary PSR J1023+0038 (here-after J1023) is key to understanding the state transitionbetween a LMXB and a MSP. J1023 was first suggestedas a magnetic cataclysmic variable (Bond et al. 2002)and was subsequently identified as a LMXB candidate(Thorstensen & Armstrong 2005; Homer et al. 2006).Radio observations then show that J1023 is a 1.69-mspulsar in a 4.8-hr binary orbit with a ∼ 0.2M⊙ com-panion star (Archibald et al. 2009), establishing a linkbetween a MSP and a LMXB. Interestingly, the systemshows clearly accretion disk signature before 2002 (Wanget al. 2009), but the disk has disappeared since then.
This is a direct evidence for a state transition from aLMXB to a MSP. More recently, the X-ray emission ofJ1023 has increased by a factor of about 20 (Kong 2013;Patruno et al. 2014; Takata et al. 2014) since 2013 Oc-tober and the radio pulsation has disappeared after 2013mid-June (Stappers et al. 2014). Meanwhile, the UVemission has brightened by 4 magnitudes (Patruno et al.2014) and the accretion disk has reemerged based on op-tical spectroscopy (Takata et al. 2014), indicating thatJ1023 has switched from a MSP to a LMXB. It is nowclear that J1023 underwent two state transitions betweena LMXB and a MSP. It is worth noting that there are twosimilar systems, IGR J18245–2452 (Papitto et al. 2013)and XSS J12270–4859 (Bassa et al. 2014), that also showsimilar state transitions. Such state change events haveproven solidly that MSPs are evolved from LMXBs.J1023 has been observed in X-ray with Chandra,
XMM-Newton, and Swift in the past decade. In particu-lar, the XMM-Newton observations reveal the X-ray pul-sation as well as the X-ray orbital modulation (Archibaldet al. 2010; Tam et al. 2010) when the source is in theX-ray faint rotation-powered state. During the recent X-ray bright LMXB state, the X-Ray Telescope (XRT) on-board Swift detected the soft (0.3–10 keV) X-ray bright-ening (Kong 2013; Patruno et al. 2014; Takata et al.2014) while the Burst Alert Telescope (BAT) failed to de-tect the hard (15–50 keV) X-rays (Stappers et al. 2014).J1023 also has detectable γ-rays (200 MeV–20 GeV) withthe Fermi Gamma-ray Space Telescope in both rotation-powered and LMXB states (Tam et al. 2010; Takata etal. 2014).In this paper, we report the first NuSTAR hard X-
2 Li et al.
�
���
����� ��-�� ��-�
������ ��� ������� ���� ��� �������
��� ���� ����������
����
���������������� ������ ���
� ����� ��� !�� ��
"#�� ��$%& '� ��() ���
*���� !�� ��
+,��-
�.�+����/�
��0��
1�#����
�2�0���/�
,����.
) )�* �� ���* �� ���* �� ���* �3� �3* �*� �** ��� ��* �(�
������������� ���� ���� ����
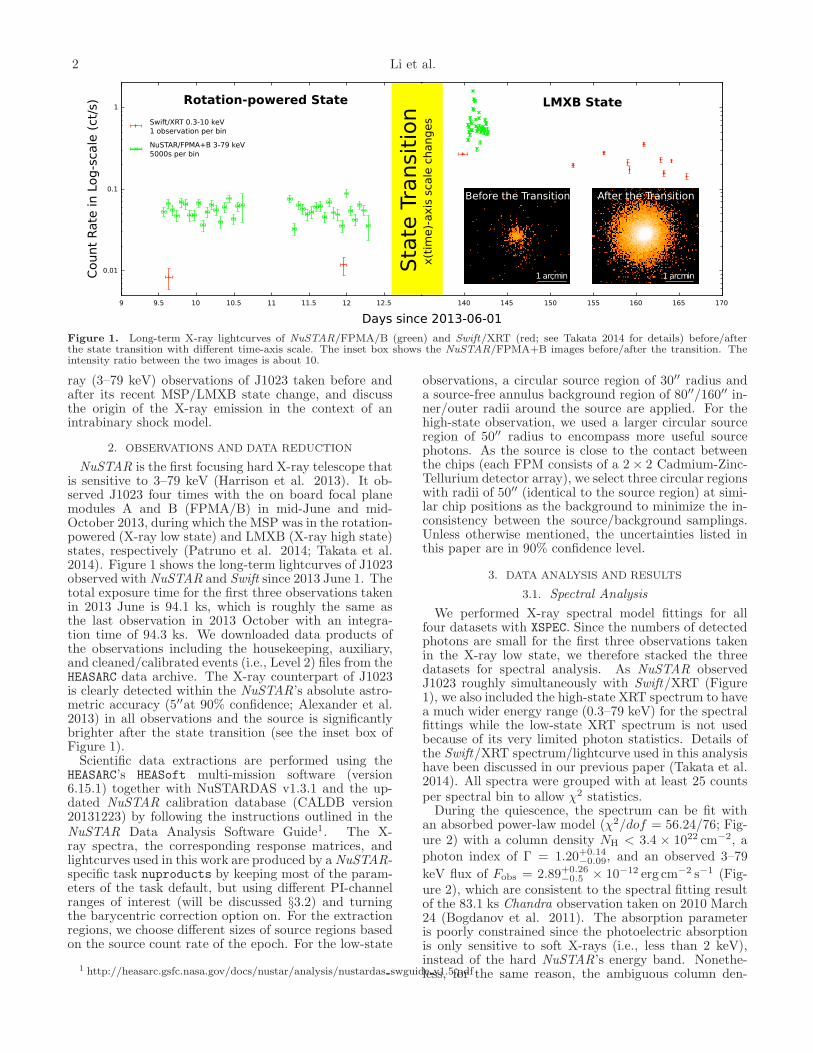
Figure 1. Long-term X-ray lightcurves of NuSTAR/FPMA/B (green) and Swift/XRT (red; see Takata 2014 for details) before/afterthe state transition with different time-axis scale. The inset box shows the NuSTAR/FPMA+B images before/after the transition. Theintensity ratio between the two images is about 10.
ray (3–79 keV) observations of J1023 taken before andafter its recent MSP/LMXB state change, and discussthe origin of the X-ray emission in the context of anintrabinary shock model.
2. OBSERVATIONS AND DATA REDUCTION
NuSTAR is the first focusing hard X-ray telescope thatis sensitive to 3–79 keV (Harrison et al. 2013). It ob-served J1023 four times with the on board focal planemodules A and B (FPMA/B) in mid-June and mid-October 2013, during which the MSP was in the rotation-powered (X-ray low state) and LMXB (X-ray high state)states, respectively (Patruno et al. 2014; Takata et al.2014). Figure 1 shows the long-term lightcurves of J1023observed with NuSTAR and Swift since 2013 June 1. Thetotal exposure time for the first three observations takenin 2013 June is 94.1 ks, which is roughly the same asthe last observation in 2013 October with an integra-tion time of 94.3 ks. We downloaded data products ofthe observations including the housekeeping, auxiliary,and cleaned/calibrated events (i.e., Level 2) files from theHEASARC data archive. The X-ray counterpart of J1023is clearly detected within the NuSTAR’s absolute astro-metric accuracy (5′′at 90% confidence; Alexander et al.2013) in all observations and the source is significantlybrighter after the state transition (see the inset box ofFigure 1).Scientific data extractions are performed using the
HEASARC’s HEASoft multi-mission software (version6.15.1) together with NuSTARDAS v1.3.1 and the up-dated NuSTAR calibration database (CALDB version20131223) by following the instructions outlined in theNuSTAR Data Analysis Software Guide1. The X-ray spectra, the corresponding response matrices, andlightcurves used in this work are produced by a NuSTAR-specific task nuproducts by keeping most of the param-eters of the task default, but using different PI-channelranges of interest (will be discussed §3.2) and turningthe barycentric correction option on. For the extractionregions, we choose different sizes of source regions basedon the source count rate of the epoch. For the low-state
1 http://heasarc.gsfc.nasa.gov/docs/nustar/analysis/nustardas swguide v1.5.pdf
observations, a circular source region of 30′′ radius anda source-free annulus background region of 80′′/160′′ in-ner/outer radii around the source are applied. For thehigh-state observation, we used a larger circular sourceregion of 50′′ radius to encompass more useful sourcephotons. As the source is close to the contact betweenthe chips (each FPM consists of a 2× 2 Cadmium-Zinc-Tellurium detector array), we select three circular regionswith radii of 50′′ (identical to the source region) at simi-lar chip positions as the background to minimize the in-consistency between the source/background samplings.Unless otherwise mentioned, the uncertainties listed inthis paper are in 90% confidence level.
3. DATA ANALYSIS AND RESULTS
3.1. Spectral Analysis
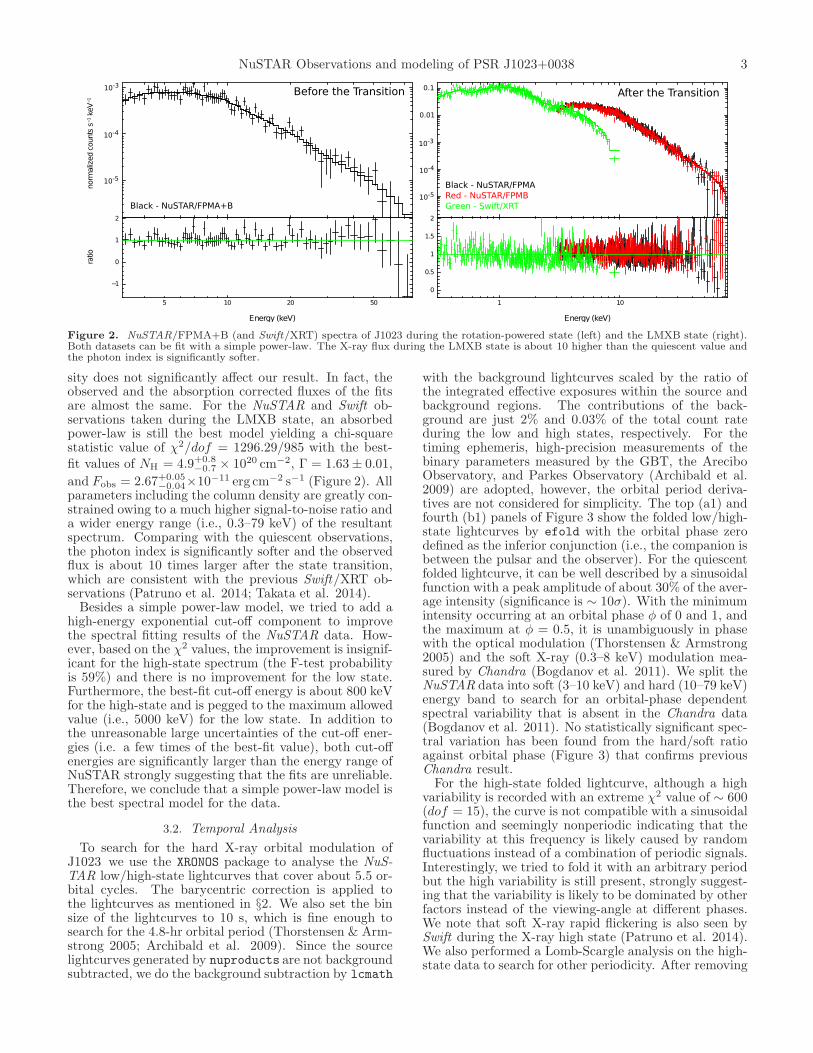
We performed X-ray spectral model fittings for allfour datasets with XSPEC. Since the numbers of detectedphotons are small for the first three observations takenin the X-ray low state, we therefore stacked the threedatasets for spectral analysis. As NuSTAR observedJ1023 roughly simultaneously with Swift/XRT (Figure1), we also included the high-state XRT spectrum to havea much wider energy range (0.3–79 keV) for the spectralfittings while the low-state XRT spectrum is not usedbecause of its very limited photon statistics. Details ofthe Swift/XRT spectrum/lightcurve used in this analysishave been discussed in our previous paper (Takata et al.2014). All spectra were grouped with at least 25 countsper spectral bin to allow χ2 statistics.During the quiescence, the spectrum can be fit with
an absorbed power-law model (χ2/dof = 56.24/76; Fig-ure 2) with a column density NH < 3.4 × 1022 cm−2, aphoton index of Γ = 1.20+0.14
−0.09, and an observed 3–79
keV flux of Fobs = 2.89+0.26−0.5 × 10⁻¹² erg cm−2 s−1 (Fig-
ure 2), which are consistent to the spectral fitting resultof the 83.1 ks Chandra observation taken on 2010 March24 (Bogdanov et al. 2011). The absorption parameteris poorly constrained since the photoelectric absorptionis only sensitive to soft X-rays (i.e., less than 2 keV),instead of the hard NuSTAR’s energy band. Nonethe-less, for the same reason, the ambiguous column den-
NuSTAR Observations and modeling of PSR J1023+0038 3
����� � ���� ����
��� � ���� ����
����� � ���� ��
������ ��� ���������
����� � ���� ������
����� ��� ���������� !
!��"
!��#
� �!
!��$
! !�
�
� #
!
! #
%
&���'( )��*+
!��$
!��"
!��#
���,
���-
��
������
�.!��*
.!
!�# %� #�
.!
�
!
%
�����
&���'( )��*+
Figure 2. NuSTAR/FPMA+B (and Swift/XRT) spectra of J1023 during the rotation-powered state (left) and the LMXB state (right).Both datasets can be fit with a simple power-law. The X-ray flux during the LMXB state is about 10 higher than the quiescent value andthe photon index is significantly softer.
sity does not significantly affect our result. In fact, theobserved and the absorption corrected fluxes of the fitsare almost the same. For the NuSTAR and Swift ob-servations taken during the LMXB state, an absorbedpower-law is still the best model yielding a chi-squarestatistic value of χ2/dof = 1296.29/985 with the best-fit values of NH = 4.9+0.8
−0.7 × 1020 cm−2, Γ = 1.63± 0.01,
and Fobs = 2.67+0.05−0.04×10⁻¹¹ erg cm−2 s−1 (Figure 2). All
parameters including the column density are greatly con-strained owing to a much higher signal-to-noise ratio anda wider energy range (i.e., 0.3–79 keV) of the resultantspectrum. Comparing with the quiescent observations,the photon index is significantly softer and the observedflux is about 10 times larger after the state transition,which are consistent with the previous Swift/XRT ob-servations (Patruno et al. 2014; Takata et al. 2014).Besides a simple power-law model, we tried to add a
high-energy exponential cut-off component to improvethe spectral fitting results of the NuSTAR data. How-ever, based on the χ2 values, the improvement is insignif-icant for the high-state spectrum (the F-test probabilityis 59%) and there is no improvement for the low state.Furthermore, the best-fit cut-off energy is about 800 keVfor the high-state and is pegged to the maximum allowedvalue (i.e., 5000 keV) for the low state. In addition tothe unreasonable large uncertainties of the cut-off ener-gies (i.e. a few times of the best-fit value), both cut-offenergies are significantly larger than the energy range ofNuSTAR strongly suggesting that the fits are unreliable.Therefore, we conclude that a simple power-law model isthe best spectral model for the data.
3.2. Temporal Analysis
To search for the hard X-ray orbital modulation ofJ1023 we use the XRONOS package to analyse the NuS-TAR low/high-state lightcurves that cover about 5.5 or-bital cycles. The barycentric correction is applied tothe lightcurves as mentioned in §2. We also set the binsize of the lightcurves to 10 s, which is fine enough tosearch for the 4.8-hr orbital period (Thorstensen & Arm-strong 2005; Archibald et al. 2009). Since the sourcelightcurves generated by nuproducts are not backgroundsubtracted, we do the background subtraction by lcmath
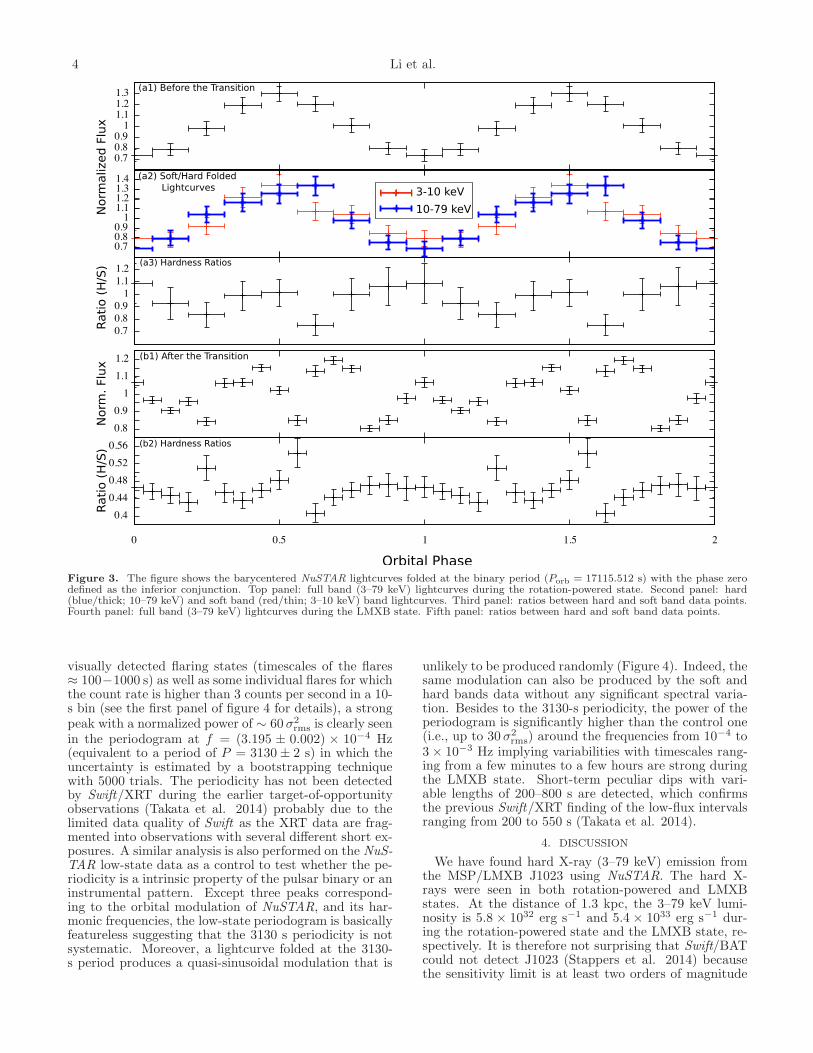
with the background lightcurves scaled by the ratio ofthe integrated effective exposures within the source andbackground regions. The contributions of the back-ground are just 2% and 0.03% of the total count rateduring the low and high states, respectively. For thetiming ephemeris, high-precision measurements of thebinary parameters measured by the GBT, the AreciboObservatory, and Parkes Observatory (Archibald et al.2009) are adopted, however, the orbital period deriva-tives are not considered for simplicity. The top (a1) andfourth (b1) panels of Figure 3 show the folded low/high-state lightcurves by efold with the orbital phase zerodefined as the inferior conjunction (i.e., the companion isbetween the pulsar and the observer). For the quiescentfolded lightcurve, it can be well described by a sinusoidalfunction with a peak amplitude of about 30% of the aver-age intensity (significance is ∼ 10σ). With the minimumintensity occurring at an orbital phase φ of 0 and 1, andthe maximum at φ = 0.5, it is unambiguously in phasewith the optical modulation (Thorstensen & Armstrong2005) and the soft X-ray (0.3–8 keV) modulation mea-sured by Chandra (Bogdanov et al. 2011). We split theNuSTAR data into soft (3–10 keV) and hard (10–79 keV)energy band to search for an orbital-phase dependentspectral variability that is absent in the Chandra data(Bogdanov et al. 2011). No statistically significant spec-tral variation has been found from the hard/soft ratioagainst orbital phase (Figure 3) that confirms previousChandra result.For the high-state folded lightcurve, although a high
variability is recorded with an extreme χ2 value of ∼ 600(dof = 15), the curve is not compatible with a sinusoidalfunction and seemingly nonperiodic indicating that thevariability at this frequency is likely caused by randomfluctuations instead of a combination of periodic signals.Interestingly, we tried to fold it with an arbitrary periodbut the high variability is still present, strongly suggest-ing that the variability is likely to be dominated by otherfactors instead of the viewing-angle at different phases.We note that soft X-ray rapid flickering is also seen bySwift during the X-ray high state (Patruno et al. 2014).We also performed a Lomb-Scargle analysis on the high-state data to search for other periodicity. After removing
4 Li et al.
$(�)�*�+��
�)(,-�*�+
�������
�
���
����������
������������������������
��� ������ ��� ����������
��� �������� ������
�!��"��#��
��$ �������� ������
���
%�����
�������
�
&�������'����
�������������������
Figure 3. The figure shows the barycentered NuSTAR lightcurves folded at the binary period (Porb = 17115.512 s) with the phase zerodefined as the inferior conjunction. Top panel: full band (3–79 keV) lightcurves during the rotation-powered state. Second panel: hard(blue/thick; 10–79 keV) and soft band (red/thin; 3–10 keV) band lightcurves. Third panel: ratios between hard and soft band data points.Fourth panel: full band (3–79 keV) lightcurves during the LMXB state. Fifth panel: ratios between hard and soft band data points.
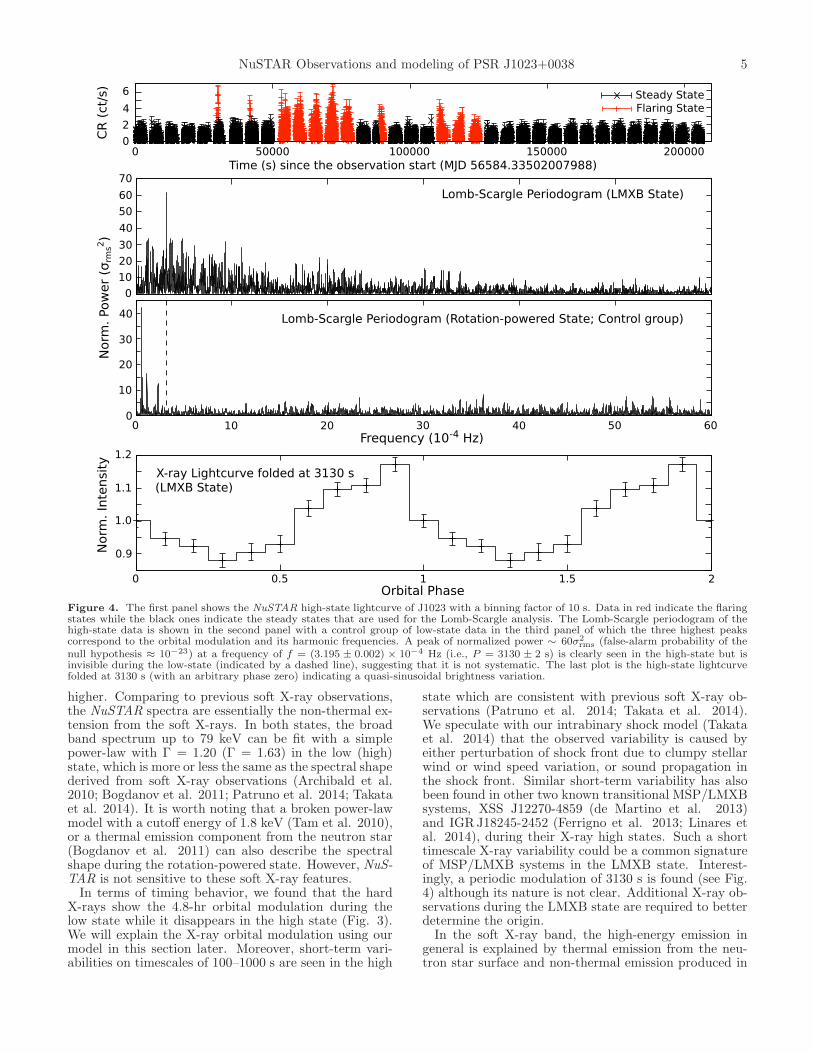
visually detected flaring states (timescales of the flares≈ 100−1000 s) as well as some individual flares for whichthe count rate is higher than 3 counts per second in a 10-s bin (see the first panel of figure 4 for details), a strongpeak with a normalized power of ∼ 60 σ2
rms is clearly seenin the periodogram at f = (3.195 ± 0.002) × 10−4 Hz(equivalent to a period of P = 3130± 2 s) in which theuncertainty is estimated by a bootstrapping techniquewith 5000 trials. The periodicity has not been detectedby Swift/XRT during the earlier target-of-opportunityobservations (Takata et al. 2014) probably due to thelimited data quality of Swift as the XRT data are frag-mented into observations with several different short ex-posures. A similar analysis is also performed on the NuS-TAR low-state data as a control to test whether the pe-riodicity is a intrinsic property of the pulsar binary or aninstrumental pattern. Except three peaks correspond-ing to the orbital modulation of NuSTAR, and its har-monic frequencies, the low-state periodogram is basicallyfeatureless suggesting that the 3130 s periodicity is notsystematic. Moreover, a lightcurve folded at the 3130-s period produces a quasi-sinusoidal modulation that is
unlikely to be produced randomly (Figure 4). Indeed, thesame modulation can also be produced by the soft andhard bands data without any significant spectral varia-tion. Besides to the 3130-s periodicity, the power of theperiodogram is significantly higher than the control one(i.e., up to 30 σ2
rms) around the frequencies from 10−4 to3× 10−3 Hz implying variabilities with timescales rang-ing from a few minutes to a few hours are strong duringthe LMXB state. Short-term peculiar dips with vari-able lengths of 200–800 s are detected, which confirmsthe previous Swift/XRT finding of the low-flux intervalsranging from 200 to 550 s (Takata et al. 2014).
4. DISCUSSION
We have found hard X-ray (3–79 keV) emission fromthe MSP/LMXB J1023 using NuSTAR. The hard X-rays were seen in both rotation-powered and LMXBstates. At the distance of 1.3 kpc, the 3–79 keV lumi-nosity is 5.8 × 1032 erg s−1 and 5.4 × 1033 erg s−1 dur-ing the rotation-powered state and the LMXB state, re-spectively. It is therefore not surprising that Swift/BATcould not detect J1023 (Stappers et al. 2014) becausethe sensitivity limit is at least two orders of magnitude
NuSTAR Observations and modeling of PSR J1023+0038 5
��������� �� ���
��
���
��
��
��
�����
������� �����
��
���
���
����
�
!����"���#�� �����$�#��� %��������&�����$ "����' (������ #���&�
)���� !�#�����*� +��$�$ �� ,,� �
� ��- �-
�
.�
/�
-�
�
,�
��
�
�
,�
��
�
�
�
��
�
��
��0
�
� �� ,� � -� /�
� -���� ����� -���� �������
�
/
1��� �� ����� ��� �����*����� ����� 234 -/-5 �,,-����.055�
(%
��6
��
������# "����
"���$� "����
!����"���#��7�����$�#���7!2)87"�����
!2)87"�����
Figure 4. The first panel shows the NuSTAR high-state lightcurve of J1023 with a binning factor of 10 s. Data in red indicate the flaringstates while the black ones indicate the steady states that are used for the Lomb-Scargle analysis. The Lomb-Scargle periodogram of thehigh-state data is shown in the second panel with a control group of low-state data in the third panel of which the three highest peakscorrespond to the orbital modulation and its harmonic frequencies. A peak of normalized power ∼ 60σ2
rms (false-alarm probability of thenull hypothesis ≈ 10−23) at a frequency of f = (3.195 ± 0.002) × 10−4 Hz (i.e., P = 3130 ± 2 s) is clearly seen in the high-state but isinvisible during the low-state (indicated by a dashed line), suggesting that it is not systematic. The last plot is the high-state lightcurvefolded at 3130 s (with an arbitrary phase zero) indicating a quasi-sinusoidal brightness variation.
higher. Comparing to previous soft X-ray observations,the NuSTAR spectra are essentially the non-thermal ex-tension from the soft X-rays. In both states, the broadband spectrum up to 79 keV can be fit with a simplepower-law with Γ = 1.20 (Γ = 1.63) in the low (high)state, which is more or less the same as the spectral shapederived from soft X-ray observations (Archibald et al.2010; Bogdanov et al. 2011; Patruno et al. 2014; Takataet al. 2014). It is worth noting that a broken power-lawmodel with a cutoff energy of 1.8 keV (Tam et al. 2010),or a thermal emission component from the neutron star(Bogdanov et al. 2011) can also describe the spectralshape during the rotation-powered state. However, NuS-TAR is not sensitive to these soft X-ray features.In terms of timing behavior, we found that the hard
X-rays show the 4.8-hr orbital modulation during thelow state while it disappears in the high state (Fig. 3).We will explain the X-ray orbital modulation using ourmodel in this section later. Moreover, short-term vari-abilities on timescales of 100–1000 s are seen in the high
state which are consistent with previous soft X-ray ob-servations (Patruno et al. 2014; Takata et al. 2014).We speculate with our intrabinary shock model (Takataet al. 2014) that the observed variability is caused byeither perturbation of shock front due to clumpy stellarwind or wind speed variation, or sound propagation inthe shock front. Similar short-term variability has alsobeen found in other two known transitional MSP/LMXBsystems, XSS J12270-4859 (de Martino et al. 2013)and IGRJ18245-2452 (Ferrigno et al. 2013; Linares etal. 2014), during their X-ray high states. Such a shorttimescale X-ray variability could be a common signatureof MSP/LMXB systems in the LMXB state. Interest-ingly, a periodic modulation of 3130 s is found (see Fig.4) although its nature is not clear. Additional X-ray ob-servations during the LMXB state are required to betterdetermine the origin.In the soft X-ray band, the high-energy emission in
general is explained by thermal emission from the neu-tron star surface and non-thermal emission produced in
6 Li et al.
10-13
10-12
10-11
10-10
102 104 106 108 1010
Flu
x (e
rg c
m-2
s-1
)
Energy (eV)
Before June 2013
Shock (Syncrotron) Outer gapThis work
Takata et al. (2014)
XMM
NuSTAR Fermi
10-13
10-12
10-11
10-10
102 104 106 108 1010
Flu
x (e
rg c
m-2
s-1
)
Energy (eV)
After June 2013
Shock (Synchrotron) P.W. (IC)This work
Takata et al. (2014)
Swift
NuSTAR Fermi
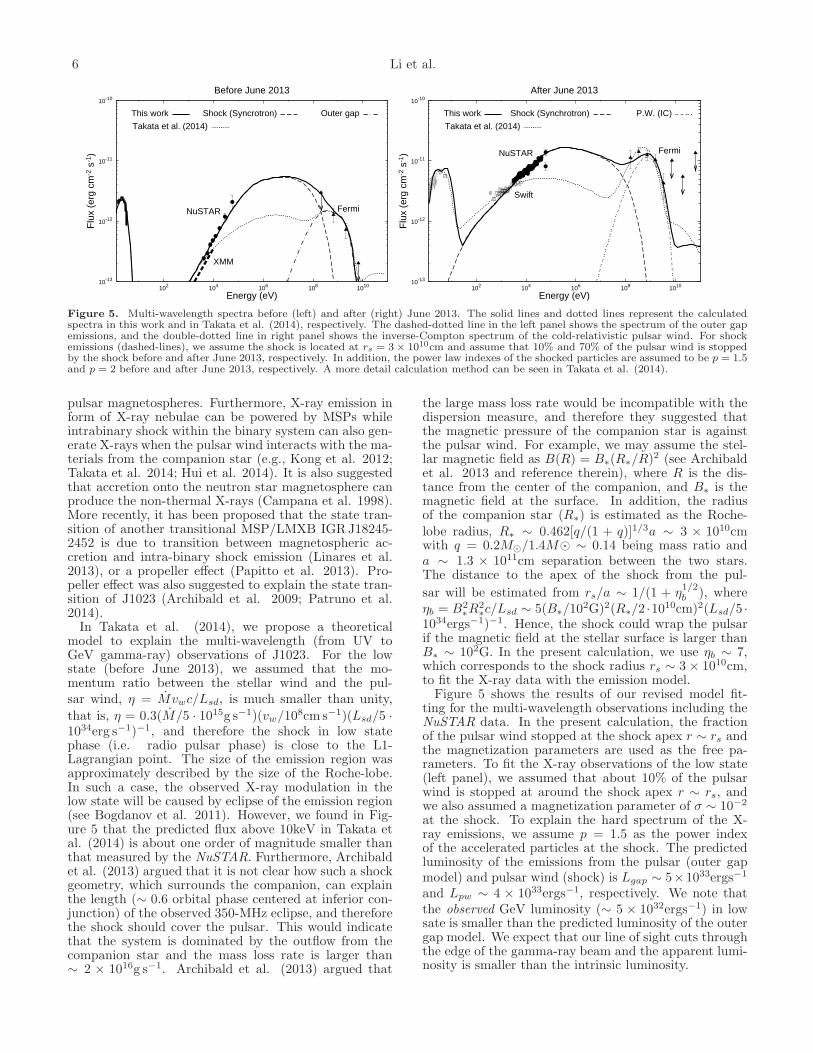
Figure 5. Multi-wavelength spectra before (left) and after (right) June 2013. The solid lines and dotted lines represent the calculatedspectra in this work and in Takata et al. (2014), respectively. The dashed-dotted line in the left panel shows the spectrum of the outer gapemissions, and the double-dotted line in right panel shows the inverse-Compton spectrum of the cold-relativistic pulsar wind. For shockemissions (dashed-lines), we assume the shock is located at rs = 3× 1010cm and assume that 10% and 70% of the pulsar wind is stoppedby the shock before and after June 2013, respectively. In addition, the power law indexes of the shocked particles are assumed to be p = 1.5and p = 2 before and after June 2013, respectively. A more detail calculation method can be seen in Takata et al. (2014).
pulsar magnetospheres. Furthermore, X-ray emission inform of X-ray nebulae can be powered by MSPs whileintrabinary shock within the binary system can also gen-erate X-rays when the pulsar wind interacts with the ma-terials from the companion star (e.g., Kong et al. 2012;Takata et al. 2014; Hui et al. 2014). It is also suggestedthat accretion onto the neutron star magnetosphere canproduce the non-thermal X-rays (Campana et al. 1998).More recently, it has been proposed that the state tran-sition of another transitional MSP/LMXB IGRJ18245-2452 is due to transition between magnetospheric ac-cretion and intra-binary shock emission (Linares et al.2013), or a propeller effect (Papitto et al. 2013). Pro-peller effect was also suggested to explain the state tran-sition of J1023 (Archibald et al. 2009; Patruno et al.2014).In Takata et al. (2014), we propose a theoretical
model to explain the multi-wavelength (from UV toGeV gamma-ray) observations of J1023. For the lowstate (before June 2013), we assumed that the mo-mentum ratio between the stellar wind and the pul-sar wind, η = Mvwc/Lsd, is much smaller than unity,
that is, η = 0.3(M/5 · 1015g s−1)(vw/108cm s−1)(Lsd/5 ·
1034erg s−1)−1, and therefore the shock in low statephase (i.e. radio pulsar phase) is close to the L1-Lagrangian point. The size of the emission region wasapproximately described by the size of the Roche-lobe.In such a case, the observed X-ray modulation in thelow state will be caused by eclipse of the emission region(see Bogdanov et al. 2011). However, we found in Fig-ure 5 that the predicted flux above 10keV in Takata etal. (2014) is about one order of magnitude smaller thanthat measured by the NuSTAR. Furthermore, Archibaldet al. (2013) argued that it is not clear how such a shockgeometry, which surrounds the companion, can explainthe length (∼ 0.6 orbital phase centered at inferior con-junction) of the observed 350-MHz eclipse, and thereforethe shock should cover the pulsar. This would indicatethat the system is dominated by the outflow from thecompanion star and the mass loss rate is larger than∼ 2 × 10¹⁶g s−1. Archibald et al. (2013) argued that
the large mass loss rate would be incompatible with thedispersion measure, and therefore they suggested thatthe magnetic pressure of the companion star is againstthe pulsar wind. For example, we may assume the stel-lar magnetic field as B(R) = B∗(R∗/R)2 (see Archibaldet al. 2013 and reference therein), where R is the dis-tance from the center of the companion, and B∗ is themagnetic field at the surface. In addition, the radiusof the companion star (R∗) is estimated as the Roche-lobe radius, R∗ ∼ 0.462[q/(1 + q)]1/3a ∼ 3 × 10¹⁰cmwith q = 0.2M⊙/1.4M⊙ ∼ 0.14 being mass ratio anda ∼ 1.3 × 1011cm separation between the two stars.The distance to the apex of the shock from the pul-
sar will be estimated from rs/a ∼ 1/(1 + η1/2b ), where
ηb = B2∗R
2∗c/Lsd ∼ 5(B∗/10
2G)2(R∗/2 ·1010cm)2(Lsd/5 ·
1034ergs−1)−1. Hence, the shock could wrap the pulsarif the magnetic field at the stellar surface is larger thanB∗ ∼ 102G. In the present calculation, we use ηb ∼ 7,which corresponds to the shock radius rs ∼ 3 × 1010cm,to fit the X-ray data with the emission model.Figure 5 shows the results of our revised model fit-
ting for the multi-wavelength observations including theNuSTAR data. In the present calculation, the fractionof the pulsar wind stopped at the shock apex r ∼ rs andthe magnetization parameters are used as the free pa-rameters. To fit the X-ray observations of the low state(left panel), we assumed that about 10% of the pulsarwind is stopped at around the shock apex r ∼ rs, andwe also assumed a magnetization parameter of σ ∼ 10−2
at the shock. To explain the hard spectrum of the X-ray emissions, we assume p = 1.5 as the power indexof the accelerated particles at the shock. The predictedluminosity of the emissions from the pulsar (outer gapmodel) and pulsar wind (shock) is Lgap ∼ 5×1033ergs−1
and Lpw ∼ 4 × 1033ergs−1, respectively. We note thatthe observed GeV luminosity (∼ 5 × 1032ergs−1) in lowsate is smaller than the predicted luminosity of the outergap model. We expect that our line of sight cuts throughthe edge of the gamma-ray beam and the apparent lumi-nosity is smaller than the intrinsic luminosity.
NuSTAR Observations and modeling of PSR J1023+0038 7
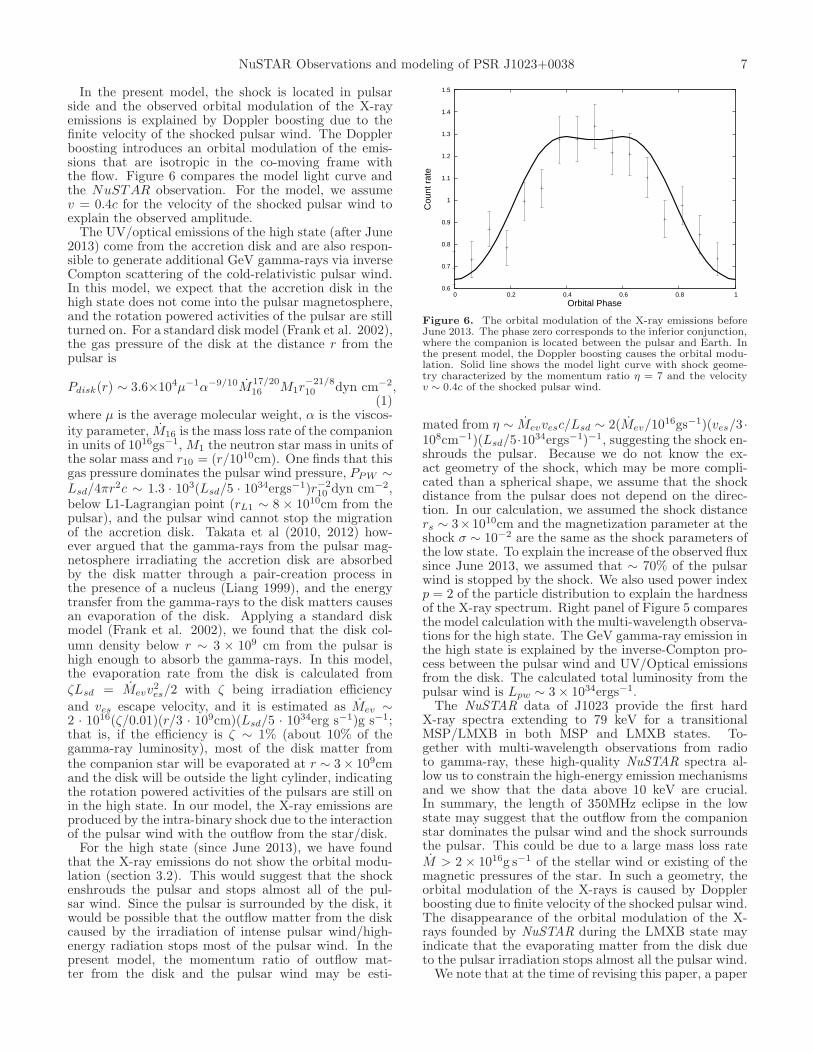
In the present model, the shock is located in pulsarside and the observed orbital modulation of the X-rayemissions is explained by Doppler boosting due to thefinite velocity of the shocked pulsar wind. The Dopplerboosting introduces an orbital modulation of the emis-sions that are isotropic in the co-moving frame withthe flow. Figure 6 compares the model light curve andthe NuSTAR observation. For the model, we assumev = 0.4c for the velocity of the shocked pulsar wind toexplain the observed amplitude.The UV/optical emissions of the high state (after June
2013) come from the accretion disk and are also respon-sible to generate additional GeV gamma-rays via inverseCompton scattering of the cold-relativistic pulsar wind.In this model, we expect that the accretion disk in thehigh state does not come into the pulsar magnetosphere,and the rotation powered activities of the pulsar are stillturned on. For a standard disk model (Frank et al. 2002),the gas pressure of the disk at the distance r from thepulsar is
Pdisk(r) ∼ 3.6×10⁴µ−1α−9/10M17/2016 M1r
−21/810 dyn cm−2,
(1)where µ is the average molecular weight, α is the viscos-ity parameter, M16 is the mass loss rate of the companionin units of 1016gs−1, M1 the neutron star mass in units ofthe solar mass and r10 = (r/1010cm). One finds that thisgas pressure dominates the pulsar wind pressure, PPW ∼
Lsd/4πr2c ∼ 1.3 · 103(Lsd/5 · 1034ergs−1)r−2
10 dyn cm−2,below L1-Lagrangian point (rL1 ∼ 8 × 1010cm from thepulsar), and the pulsar wind cannot stop the migrationof the accretion disk. Takata et al (2010, 2012) how-ever argued that the gamma-rays from the pulsar mag-netosphere irradiating the accretion disk are absorbedby the disk matter through a pair-creation process inthe presence of a nucleus (Liang 1999), and the energytransfer from the gamma-rays to the disk matters causesan evaporation of the disk. Applying a standard diskmodel (Frank et al. 2002), we found that the disk col-umn density below r ∼ 3 × 109 cm from the pulsar ishigh enough to absorb the gamma-rays. In this model,the evaporation rate from the disk is calculated fromζLsd = Mevv
2es/2 with ζ being irradiation efficiency
and ves escape velocity, and it is estimated as Mev ∼2 · 1016(ζ/0.01)(r/3 · 109cm)(Lsd/5 · 1034erg s−1)g s−1;that is, if the efficiency is ζ ∼ 1% (about 10% of thegamma-ray luminosity), most of the disk matter fromthe companion star will be evaporated at r ∼ 3× 10⁹cmand the disk will be outside the light cylinder, indicatingthe rotation powered activities of the pulsars are still onin the high state. In our model, the X-ray emissions areproduced by the intra-binary shock due to the interactionof the pulsar wind with the outflow from the star/disk.For the high state (since June 2013), we have found
that the X-ray emissions do not show the orbital modu-lation (section 3.2). This would suggest that the shockenshrouds the pulsar and stops almost all of the pul-sar wind. Since the pulsar is surrounded by the disk, itwould be possible that the outflow matter from the diskcaused by the irradiation of intense pulsar wind/high-energy radiation stops most of the pulsar wind. In thepresent model, the momentum ratio of outflow mat-ter from the disk and the pulsar wind may be esti-
0.6
0.7
0.8
0.9
1
1.1
1.2
1.3
1.4
1.5
0 0.2 0.4 0.6 0.8 1
Cou
nt r
ate
Orbital Phase
Figure 6. The orbital modulation of the X-ray emissions beforeJune 2013. The phase zero corresponds to the inferior conjunction,where the companion is located between the pulsar and Earth. Inthe present model, the Doppler boosting causes the orbital modu-lation. Solid line shows the model light curve with shock geome-try characterized by the momentum ratio η = 7 and the velocityv ∼ 0.4c of the shocked pulsar wind.
mated from η ∼ Mevvesc/Lsd ∼ 2(Mev/1016gs−1)(ves/3 ·
108cm−1)(Lsd/5·1034ergs−1)−1, suggesting the shock en-
shrouds the pulsar. Because we do not know the ex-act geometry of the shock, which may be more compli-cated than a spherical shape, we assume that the shockdistance from the pulsar does not depend on the direc-tion. In our calculation, we assumed the shock distancers ∼ 3×1010cm and the magnetization parameter at theshock σ ∼ 10−2 are the same as the shock parameters ofthe low state. To explain the increase of the observed fluxsince June 2013, we assumed that ∼ 70% of the pulsarwind is stopped by the shock. We also used power indexp = 2 of the particle distribution to explain the hardnessof the X-ray spectrum. Right panel of Figure 5 comparesthe model calculation with the multi-wavelength observa-tions for the high state. The GeV gamma-ray emission inthe high state is explained by the inverse-Compton pro-cess between the pulsar wind and UV/Optical emissionsfrom the disk. The calculated total luminosity from thepulsar wind is Lpw ∼ 3× 1034ergs−1.The NuSTAR data of J1023 provide the first hard
X-ray spectra extending to 79 keV for a transitionalMSP/LMXB in both MSP and LMXB states. To-gether with multi-wavelength observations from radioto gamma-ray, these high-quality NuSTAR spectra al-low us to constrain the high-energy emission mechanismsand we show that the data above 10 keV are crucial.In summary, the length of 350MHz eclipse in the lowstate may suggest that the outflow from the companionstar dominates the pulsar wind and the shock surroundsthe pulsar. This could be due to a large mass loss rateM > 2 × 10¹⁶g s−1 of the stellar wind or existing of themagnetic pressures of the star. In such a geometry, theorbital modulation of the X-rays is caused by Dopplerboosting due to finite velocity of the shocked pulsar wind.The disappearance of the orbital modulation of the X-rays founded by NuSTAR during the LMXB state mayindicate that the evaporating matter from the disk dueto the pulsar irradiation stops almost all the pulsar wind.We note that at the time of revising this paper, a paper
8 Li et al.
by the NuSTAR team using the same datasets has beenrecently accepted for publication (Tendulkar et al. 2014)and their results are entirely consistent with ours.KLL, AKHK, and RJ are supported by the Min-
istry of Science and Technology of the Republic ofChina (Taiwan) through grants 100-2628-M-007-002-MY3, 100-2923-M-007-001-MY3, and 101-2119-M-008-007-MY3. JT and KSC are supported by a GRF grant
of HK Government under HKU 17300814P. PHT is sup-ported by the Ministry of Science and Technology of theRepublic of China (Taiwan) through grant 101-2112-M-007-022-MY3. CYH is supported by the National Re-search Foundation of Korea through grant 2011-0023383.This research has made use of the NuSTAR Data Analy-sis Software (NuSTARDAS) jointly developed by the ASIScience Data Center (ASDC, Italy) and Caltech (USA).Facilities: NuSTAR, Swift
REFERENCES
Alexander, D. M., Stern, D., Del Moro, A., et al. 2013, ApJ, 773,125
Alpar, M.A., Cheng, A.F., Ruderman, M.A., Shaham, J. 1982,Nature, 300, 728
Archibald, Anne M., Kaspi, V.M., Hessels, J.W. T., Stappers, B.,Janssen, G., Lyne, A., 2013, ApJ, submitted (arXiv:1311.5161)
Archibald, Anne M., Kaspi, Victoria M., Bogdanov, Slavko,Hessels, Jason W. T., Stairs, Ingrid H., Ransom, Scott M.,McLaughlin, Maura A., 2010, 722, 88
Archibald, A. M. et al. 2009, Science, 324, 1411Bassa, C. G. et al. 2014, MNRAS, 441, 1825Bogdanov, S. Archibald, A.M., Hessels, J.W. T., Kaspi, V.M.,
Lorimer, D. McLaughlin, M.A., Ransom, S.M., Stairs, I.H., 2011,ApJ, 742, 97
Bond, H.E., White, R.L., Becker, R.H., O’Brien, M.S., 2002, PASP,114, 1359
Campana, S., Colpi, M., Mereghetti, S., Stella, L., Tavani, M., 1998,A&ARv, 8, 279
de Martino, D., Belloni, T., Falanga, M., Papitto, A., Motta, S.,Pellizzoni, A., Evangelista, Y., Piano, G., Masetti, N., Bonnet-Bidaud, J.-M., Mouchet, M., Mukai, K., Possenti, A. 2013, A&A,550, A89
Frank, J., King, A., & Raine, D. 2002, Accretion Power inAstrophysics (Cambridge: Cambridge Univ. Press)
Ferrigno, C., Bozzo, E., Papitto, A., Rea, N., Pavan, L., Campana,S., Wieringa, M., Filipovic, M., Falanga, M., Stella, L. 2013,A&A, in press, arXiv:1310.7784
Bogdanov, S., 2013, ATel, 5514, 1
Harrison, F. A., Craig, W. W., Christensen, F. E., et al. 2013, ApJ,770, 103
Homer, L., Szkody, P., Chen, B., Henden, A., Schmidt, G.,Anderson, S.F., Silvestri, N.M., Brinkmann, J., 2006, AJ, 131,562
Hui, C. Y., Tam, P. H. T., Takata, J., Kong, A. K. H., Cheng,K. S., Wu, J. H. K., Lin, L. C. C., Wu, E. M. H. 2014, ApJ,781, L21
Kong, A.K.H., 2013, ATel, 5515, 1Kong, S.W., Cheng, K.S., Huang, Y.F., 2012, ApJ, 753, 127Linares, M., Bahramian, A., Heinke, C., Wijnands, R., Patruno,
A., Altamirano, D., Homan, J., Bogdanov, S., Pooley, D. 2013,MNRAS, 438, 251
Papitto, A., Ferrigno, C., Bozzo, E., et al. 2013, Nature, 501, 517Papitto, A. Torres, D., Li, J. 2014, MNRAS, 438, 2106Patruno, A., Archibald, A. M., Hessels, J. W. T., Bogdanov, S.,
Stappers, B. W., Bassa, C. G., Janssen, G. H., Kaspi, V. M.,Tendulkar, S., Lyne, A. G. 2014, ApJ, 781, L3
Romanova, M. M., Ustyugova, G. V., Koldoba, A. V., & Lovelace,R. V. E. 2009, MNRAS, 399, 1802
Stappers, B.W. et al. 2014, ApJ, submitted, arXiv:1311.7506Tam, P.H.T., Hui, C.Y., Huang, R.H.H., Kong, A.K.H., Takata, J.,
Lin, L.C.C., Yang, Y.J., Cheng, K.S., Taam, R. E., 2010, ApJ,724, L207
Takata, J., Cheng, K.S., Taam, R.E., 2012, ApJ, 745, 100Takata, J., Cheng, K.S., Taam, R.E., 2010, ApJ, 723, L68Takata, J., Li, K. L., Leung, G. C. K., et al. 2014, ApJ, 785, 131Tendulkar, S.P. et al. 2014, ApJ, 791, 77Thorstensen, J.R., Armstrong, E., 2005, AJ, 130, 759Wang, Z., Archibald, A.M., Thorstensen, J.R., Kaspi, V.M.,
Lorimer, D.R., Stairs, I., Ransom, S.M., 2009, ApJ, 703, 2017


