Embed Size (px)
Citation preview
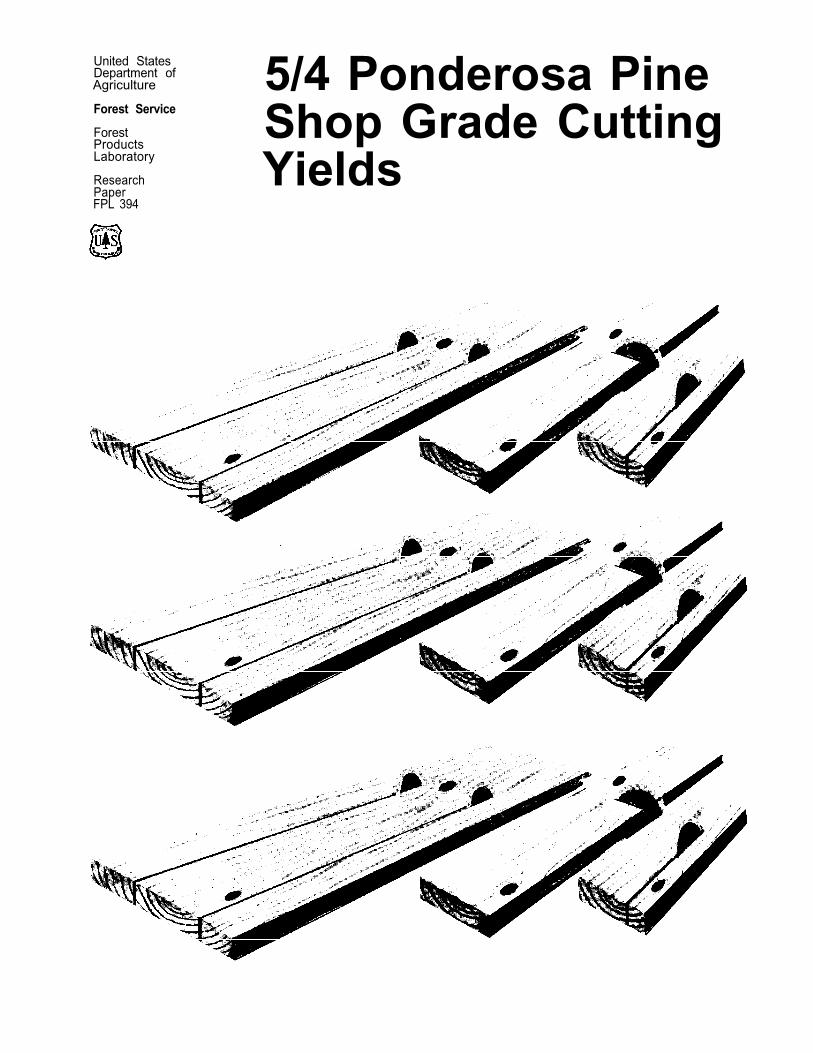
United States Department ofAgriculture 5/4 Ponderosa Pine Forest Service
Forest Shop Grade Cutting Products Laboratory
Research Yields PaperFPL 394

Abstract
Improved utilization of western lumber for factory usage is possible, using recently developed cutting yields for Shop grades of ponderosa pine. Relative value differences between lumber grades are computed from a comprehensive data base representative of the raw material consumed by the moulding and millwork industries.
Keywords: Softwood lumber, Multiple rip, Millwork yields, clear cutting yields, lumber cut-up, computer-simulated processing, utilization.
Acknowledgement
The participation, assistance, and expertise received in this study from the Timber Quality Research Project of the Pacific Northwest Forest and Range Experiment Station is respectfully acknowledged.
United States Department of Agriculture
Forest Service
ForestProductsLaboratory’
ResearchPaperFPL 394
June 1981
Introduction
5/4 Ponderosa Pine Shop Grade CuttingYieldsBy KENT A. MC DONALD, Forest Products Technologist PAMELA J. GIESE, Computer Programmer and RICHARD O. WOODFIN, Forest Products Technologist Pacific Northwest Forest and Range Experiment Station, Portland, Oreg.
The moulding and millwork industries that thrive on western lumber consume nearly 1.3 billion board feet of ponderosa pine annually. They are long-time, well-established industries that have developed traditional and time-honored practices of purchasing lumber, remanufacturing it, and marketing the resulting pro-duct. The moulding and millwork industries produce a wide range of products that include the long, clear pieces of trim used to finish off rooms in a house, and headers, jambs, and parts that make up doors, to the variety of frames, sash, and sills that go into window units. All these industries are faced with the problem (and the necessity) of achieving the maximum product utilization possible from every piece of raw material.
Over time, these industries developed their own utiliza-tion rules-of-thumb and cutting yield guidelines, and used them for making lumber purchases based on pre-dictable supplies, product markets, and acceptable pro-fit margins. As the profit margins narrowed, new pro-ducts and utilization practices were developed, such as fingerjointing, to make use of short pieces in the pro-duct line and decrease waste.
The supplying sawmills and the moulding and millwork industries became accustomed to marketing and pur-chasing Shop grade lumber in a No. 3 and Better mix. A new and major problem to these industries has come about as a result of the ponderosa pine timber supply changing to smaller, lower quality trees. The result has been larger volumes of lower grade lumber that have a lower utility, and yield shorter and/or narrower pieces. Twenty years ago the No. 3 and Better mix included
1 Maintained at Madison, Wis., in cooperation with the University of
Wisconsin.
around 5 to 10 percent No. 3 Shop. Recently, the No. 3 Shop grade represents 35 to 40 percent, with some shipments as high as 80 to 85 percent No. 3 Shop.
The problem arises with continued use of the rule-of-thumb and yield guidelines after the grade mix changes. The rules are then no longer viable tools for making adequate decisions for lumber purchasing, pro-cessing, and product marketing.
These industries need basic cutting yield information by lumber grade to make essential manufacturing deci-sions and keep pace with the constantly changing raw material supply.
Without cutting yield information by lumber grade, mill managers may resort to measuring worker productivity in a mill by estimating the amount of waste that is left over after processing. This practice, of itself, can ac-count for losing high-value cuttings and getting low yields of large cuttings, because the waste factor is lower. For example, judging an operator on his ability to utilize the full width of a board just to minimize waste causes him to favor several narrow rip widths in-stead of fewer wide rip widths.
Cutting yields are also needed by management when facing production decisions that involve alternative pro-ducts or processes where the grade of the raw material will have a controlling effect on product output. An ex-ample of this need is the prospect of installing finger-jointing and/or edge gluing equipment that can convert lower grades of raw material into a product that may be competitive with solid wood products. Cutting yields by grade were obtained by sampling the 5/4 ponderosa pine, No. 3 and Better Shop lumber resource, measur-ing and recording all defects, processing the data by a computer model designed to simulate the cutting of in-

dividual boards, and finally summarizing the cutting results by each lumber grade.
The moulding and millwork industries are typically rip first, then crosscut operations, with an additional rerip capability for salvage. Normally, all cuttings produced are less than 100 percent clear of defect. Each plant will have a different set of guidelines that permit vary-ing degrees of defect in certain locations of a cutting when the utility of the final product is not affected. To avoid this practice as a problem to this study, only clear cutting yields were calculated to provide conser-vative cutting yield information that is equally usable by everyone.
Study Procedures
SamplingThe first objective of this study was to obtain a data base representative of the 5/4, No. 3 and Better Shop ponderosa pine lumber being consumed by the moulding and millwork industry.
Sample lumber was obtained over the geographical range of ponderosa pine (fig. 1). Mill cooperators selected the study lumber from their inventories that they judged to be representative of their suppliers. No attempt was made to sample for variation of sawing methods.
figure 1.—Distribution of ponderosa pine.
The three cooperating mills were located in Oregon, California, and Arizona. At the Oregon site, study material was supplied from the states of Washington, Idaho, and Oregon. At the California and Arizona sites, samples were selected from suppliers within their respective states.
All the 5/4 Shop lumber sampled was collected in in-crements of a standard shipping unit, defined as a strapped, dry, solid-stacked pile of lumber. These units usually contain about 2,500 board feet, depending upon the length, width, and number of boards. A represen-tative mix of lengths was included in the sample selec-tion.
Approximately 53,000 board feet of No. 3 and Better Shop lumber were selected for sample material from the three subareas. The distribution of boards sampled by Shop grade is shown in table 1.
All sample material was reinspected by Quality Super-visors of the Western Wood Products Association to verify the grade and scale. Individual boards deter-mined by the inspector to be misgraded were changed to the correct grade. All boards were numbered and marked with grade, gross surface measure, and net sur-face measure. Board measure was obtained for the 5/4 stock by multiplying surface measure by 1.25.
Data CollectionA complete digital record was made of the board and all defects, including the type of defect and its location to the nearest 1/4 inch. Board data recorded include board number, grade, unit number, width, length, gross surface measure, and net surface measure.
Defects were measured to the nearest 1/4 inch on both sides of each board using measuring tables con-structed for this purpose (fig. 2). Defects were tallied by type and four coordinate points of a quadralateral (fig. 3).
All wood area was classified as either defect or clear. Any blemish not acceptable in a clear cutting was classified as defect and recorded.
Figure 2.—Board measuring procedure. (M 148 959)
2

Figure 3.—Defect measuring procedure.
(M 148 955, M 148 954)
For overlapping defects, the entire area was recorded and the predominant defect code (fig. 4) was assigned. All material sampled was purchased “oversize” in thickness so defect boundaries had to be positioned where the defect was expected to be, following final surfacing. This was particularly important when deter-mining the extent and severity of torn or chipped grain that might be “dressed out” or even reoccur following subsequent machining.
Simulated Board Processing Program (OPTYLD)
A computer program that would select the best sawing solution for each study board was developed by model-ing the board cutting procedure typical of the moulding and millwork industry.
The three basic sawing operations typically used to produce the desired products and thus modeled in the computer program are the multiple rip, the crosscut, and the rerip (fig. 5). Normally, under operator control, cutting decisions are based on the size, location, number, and quality of potential cuttings available in the piece, as well as the cuttings desired by mill management. At the multiple rip, the operator decides
what, where, and how many widths will be obtained from each board, and where the rip saws are to be set to edge and rip the board. The crosscut operators receive the ripped widths, determine the length cut to be made, and crosscut the piece. These operators decide what, if any, defect remains in the cutting and which pieces should be reripped. The operator of the rerip decides the maximum width of cutting that can be salvaged and what, if any, defect will be permitted.
The computer model combines the board and defect data of both board faces, and selects the sawing solu- tion that results in the highest value and/or yield of clear cuttings. To obtain the best sawing solution, all possible combinations of rip widths are calculated, comparing only the value or yield of the clear cuttings obtained from the ripping and crosscutting process. After the best sawing solution is selected, the remain- ing board areas are assessed for additional rerip yield.
The computer program was designed to handle several different options in order to include the entire range of potential decisions made during the three basic sawing operations. All of these can have an effect on the final cutting solution and yield. The options available in the computer model are:
— size and number of cutting widths obtainable at the multiple rip
— number of rip saws that can be set at any one time
— edging allowance to clean up and/or straighten one edge of the board
— cutting lengths specified for specific cutting sizes or random for operations with unlimited cutting length requirements or finger- jointing capabilities
— size and number of rerip cutting widths — optimization method based either on total cutting
area or on total relative value of cutting
Figure 4.—Multiple defect recording. (M 148 957)
3

Figure 5.—Basic sawing operations.
— preselection of different relative cutting value in-dexes by cutting lengths and widths
A selection of options typical of an industry would be: — five cutting widths of 1.75, 2.25, 3.25, 4.25, and
4.75 inches — five settable rip saws for up to five rips — edging allowance of 1/4 inch to straighten one
edge— random length cuttings greater than 9 inches but
not to exceed 84 inches — four rerip widths of 1.75, 2.25, 3.25, and 4.25
inches— optimize cutting value to get highest return from
each board, based on a cutting value index pro-vided.
Constraints of the computer model used to analyze the data are:
— only clear, two-face cuttings can be obtained — 1/4-inch increments used to describe board size,
defect size, saw kerf, and cutting dimensions — maximum board size of 24 inches in width and 16
feet in length.
The data for each board are processed by this com-puter model for the best solution, after which the size and location of all clear cuttings are known (fig. 6). Tabulation is then possible by board, by grade, and by size class, or collectively to represent a grade mix of No. 3 and Better Shop.
This program, OPTYLD, is written in FORTRAN V, documented and explained in another publication.2
Sample Data The 53,000 board feet of 5/4, No. 3 and Better Shop lumber sampled ranged in length from 5 feet to 16 feet. Approximately 73 percent of the sample (39,000 board feet) was 16 feet in length. Sample board widths ranged from 4 to 24 inches, with approximately one-third of the
2 Giese, P. J., and K. A. McDonald, 1981. OPTYLD—A computer program to maximize cutting yields. To be published as an FPL Research Paper.
4
(M 148 960)
total volume being less than 11 inches, one-third be-tween 11 and 14 inches, and the remaining one-third 15 to 24 inches wide (table 2). The frequency distribution by 1-inch width classes (actual dry width in whole inches) shows a tendency toward manufacturing on the 2- inch multiple when width is less than 13 inches, and random when 13 inches and wider (fig. 7). Boards shorter than 16 feet were predominantly 12 inches wide or less.
These distributions of widths and lengths of the sam-ple lumber are representative of the lumber being ship-ped to the moulding and millwork industries.
Methods and Results
Cutting Yield by Grade With the program options available and the given con-straints, the computer program determines individual yield results several different ways, depending upon the specific interest and/or intended application. The deci-sion, for this study, was made to compute the highest value yield for each board in the study using the op-tions as follows:
— five rip saws — rip to five widths — 1/4- inch edging allowance — random length cuttings of 9 to 84 inches long.
The ripping widths selected were 1.75, 2.25, 3.25, 4.25, and 4.75 inches. The value index used for cutting length and width ranges from a low value of 780 to a high of 1300 (table 3). Selection of these options and values came from industry cooperators and is assumed to be representative. Note that these values are not necessarily dollars.
After computing each board for the highest value yield, resulting board information consists of the total clear cutting area, total value, percent clear area, and the sawing solution. Each clear cutting size and value is also known.
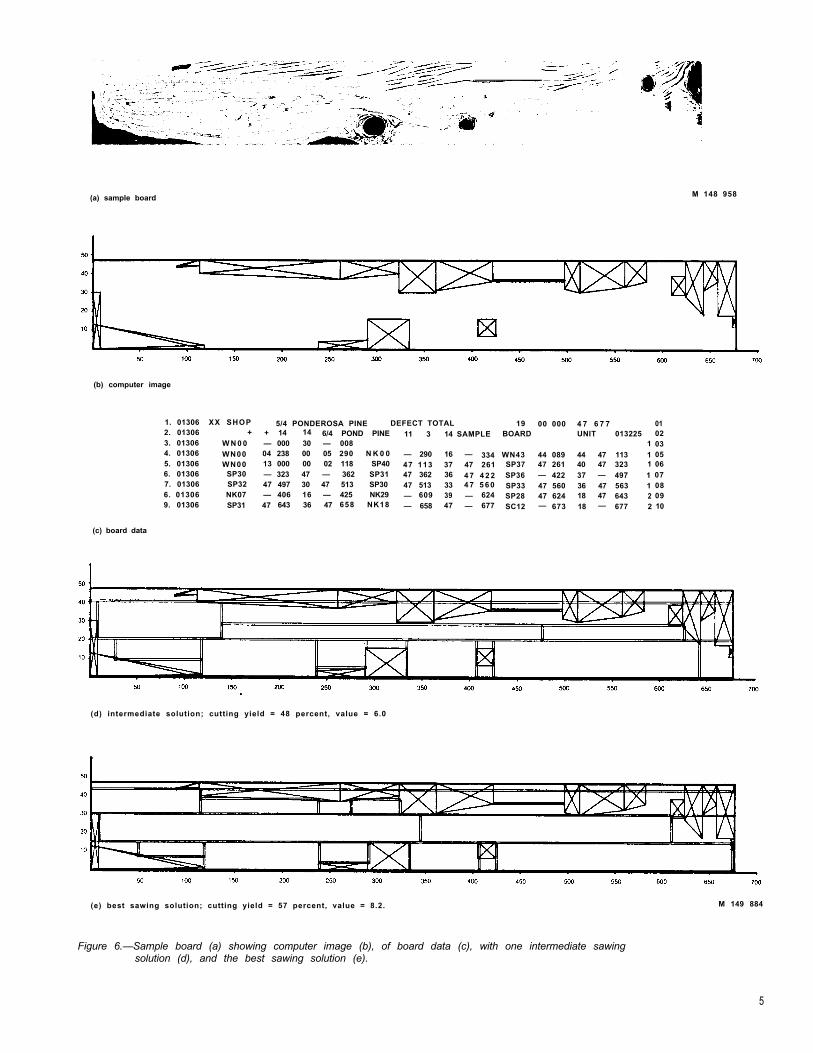
(a) sample board M 148 958
(b) computer image
1. 01306 XX SHOP 5/4 PONDEROSA PINE DEFECT TOTAL 19 00 000 4 7 6 7 7 012. 01306 + + 14 14 6/4 POND PINE 11 3 14 SAMPLE BOARD UNIT 013225 023. 01306 W N 0 0 — 000 30 — 008 1 034. 01306 WN00 04 238 00 05 290 N K 0 0 — 290 16 — 334 WN43 44 089 44 47 113 1 055. 01306 WN00 13 000 00 02 118 SP40 47 113 37 47 261 SP37 47 261 40 47 323 1 066. 01306 SP30 — 323 47 — 362 SP31 47 362 36 4 7 4 2 2 SP36 — 422 37 — 497 1 077. 01306 SP32 47 497 30 47 513 SP30 47 513 33 4 7 5 6 0 SP33 47 560 36 47 563 1 086. 01306 NK07 — 406 16 — 425 NK29 — 609 39 — 624 SP28 47 624 18 47 643 2 099. 01306 SP31 47 643 36 47 658 NK18 — 658 47 — 677 SC12 — 673 18 — 677 2 10
(c) board data
(d) intermediate solution; cutting yield = 48 percent, value = 6.0
(e) best sawing solution; cutting yield = 57 percent, value = 8.2. M 149 884
Figure 6.—Sample board (a) showing computer image (b), of board data (c), with one intermediate sawing solution (d), and the best sawing solution (e).
5
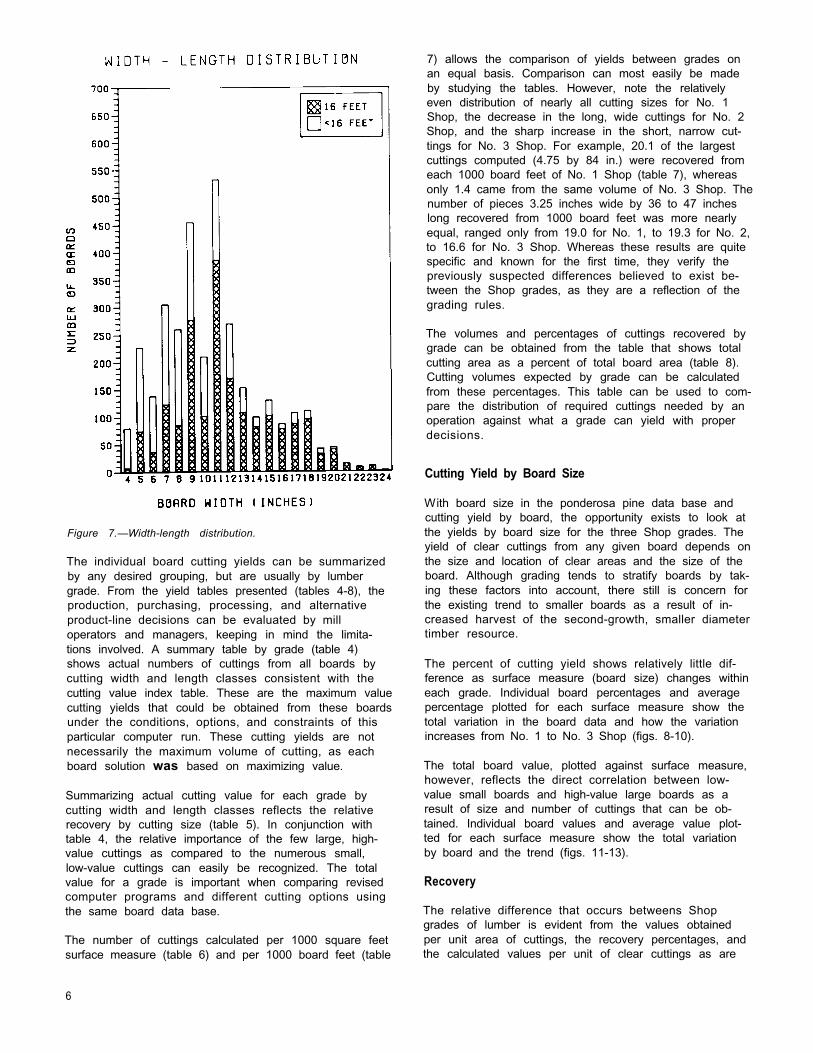
Figure 7.—Width-length distribution.
The individual board cutting yields can be summarized by any desired grouping, but are usually by lumber grade. From the yield tables presented (tables 4-8), the production, purchasing, processing, and alternative product-line decisions can be evaluated by mill operators and managers, keeping in mind the limita-tions involved. A summary table by grade (table 4) shows actual numbers of cuttings from all boards by cutting width and length classes consistent with the cutting value index table. These are the maximum value cutting yields that could be obtained from these boards under the conditions, options, and constraints of this particular computer run. These cutting yields are not necessarily the maximum volume of cutting, as each board solution was based on maximizing value.
Summarizing actual cutting value for each grade by cutting width and length classes reflects the relative recovery by cutting size (table 5). In conjunction with table 4, the relative importance of the few large, high-value cuttings as compared to the numerous small, low-value cuttings can easily be recognized. The total value for a grade is important when comparing revised computer programs and different cutting options using the same board data base.
The number of cuttings calculated per 1000 square feet surface measure (table 6) and per 1000 board feet (table
7) allows the comparison of yields between grades on an equal basis. Comparison can most easily be made by studying the tables. However, note the relatively even distribution of nearly all cutting sizes for No. 1 Shop, the decrease in the long, wide cuttings for No. 2 Shop, and the sharp increase in the short, narrow cut-tings for No. 3 Shop. For example, 20.1 of the largest cuttings computed (4.75 by 84 in.) were recovered from each 1000 board feet of No. 1 Shop (table 7), whereas only 1.4 came from the same volume of No. 3 Shop. The number of pieces 3.25 inches wide by 36 to 47 inches long recovered from 1000 board feet was more nearly equal, ranged only from 19.0 for No. 1, to 19.3 for No. 2, to 16.6 for No. 3 Shop. Whereas these results are quite specific and known for the first time, they verify the previously suspected differences believed to exist be-tween the Shop grades, as they are a reflection of the grading rules.
The volumes and percentages of cuttings recovered by grade can be obtained from the table that shows total cutting area as a percent of total board area (table 8). Cutting volumes expected by grade can be calculated from these percentages. This table can be used to com-pare the distribution of required cuttings needed by an operation against what a grade can yield with proper decisions.
Cutting Yield by Board Size
With board size in the ponderosa pine data base and cutting yield by board, the opportunity exists to look at the yields by board size for the three Shop grades. The yield of clear cuttings from any given board depends on the size and location of clear areas and the size of the board. Although grading tends to stratify boards by tak-ing these factors into account, there still is concern for the existing trend to smaller boards as a result of in-creased harvest of the second-growth, smaller diameter timber resource.
The percent of cutting yield shows relatively little dif-ference as surface measure (board size) changes within each grade. Individual board percentages and average percentage plotted for each surface measure show the total variation in the board data and how the variation increases from No. 1 to No. 3 Shop (figs. 8-10).
The total board value, plotted against surface measure, however, reflects the direct correlation between low-value small boards and high-value large boards as a result of size and number of cuttings that can be ob-tained. Individual board values and average value plot-ted for each surface measure show the total variation by board and the trend (figs. 11-13).
Recovery
The relative difference that occurs betweens Shop grades of lumber is evident from the values obtained per unit area of cuttings, the recovery percentages, and the calculated values per unit of clear cuttings as are
6
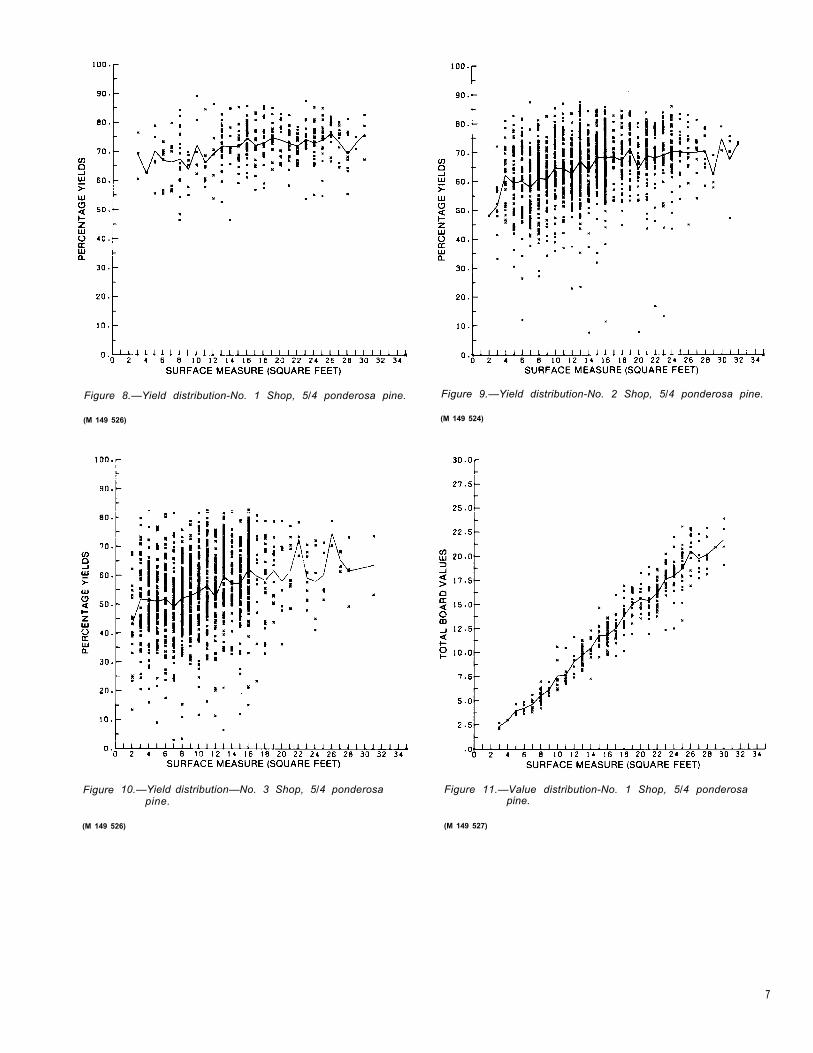
Figure 8.—Yield distribution-No. 1 Shop, 5/4 ponderosa pine. Figure 9.—Yield distribution-No. 2 Shop, 5/4 ponderosa pine.
(M 149 526) (M 149 524)
Figure 10.—Yield distribution—No. 3 Shop, 5/4 ponderosa Figure 11.—Value distribution-No. 1 Shop, 5/4 ponderosa pine. pine.
(M 149 526) (M 149 527)
7
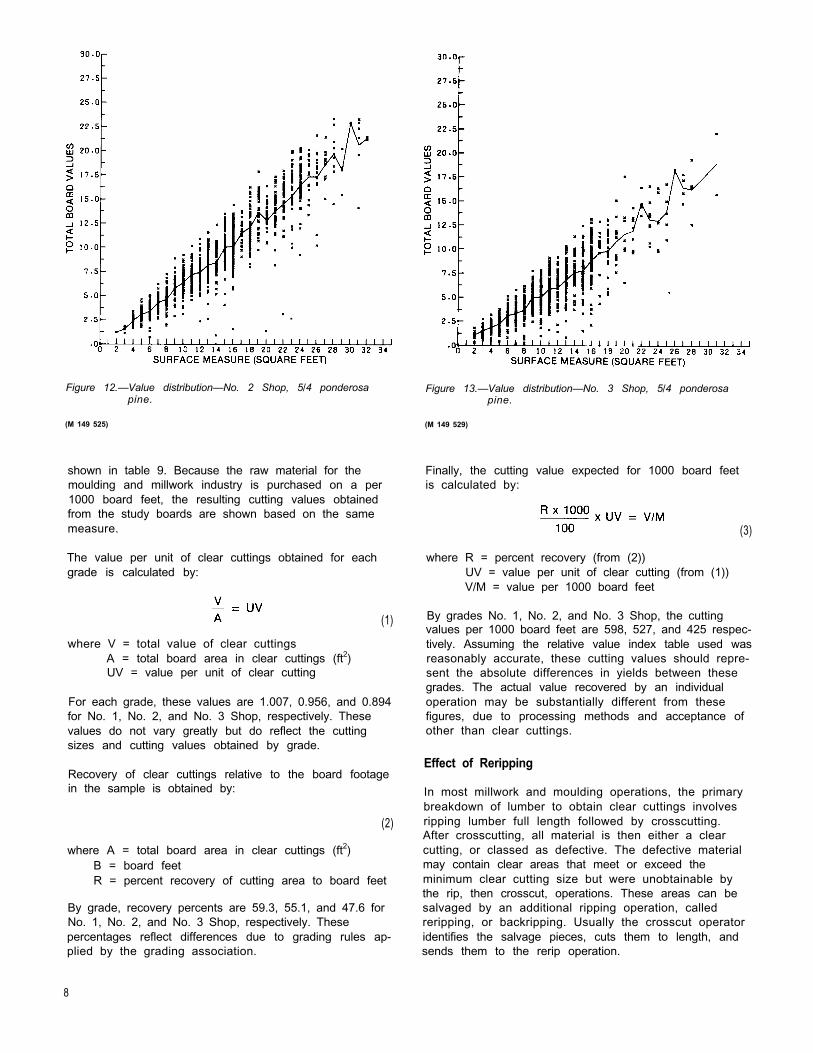
Figure 12.—Value distribution—No. 2 Shop, 5/4 ponderosa pine.
(M 149 525)
shown in table 9. Because the raw material for the moulding and millwork industry is purchased on a per 1000 board feet, the resulting cutting values obtained from the study boards are shown based on the same measure.
The value per unit of clear cuttings obtained for each grade is calculated by:
(1)
where V = total value of clear cuttings A = total board area in clear cuttings (ft2)UV = value per unit of clear cutting
For each grade, these values are 1.007, 0.956, and 0.894 for No. 1, No. 2, and No. 3 Shop, respectively. These values do not vary greatly but do reflect the cutting sizes and cutting values obtained by grade.
Recovery of clear cuttings relative to the board footage in the sample is obtained by:
(2)
where A = total board area in clear cuttings (ft2)B = board feet R = percent recovery of cutting area to board feet
By grade, recovery percents are 59.3, 55.1, and 47.6 for No. 1, No. 2, and No. 3 Shop, respectively. These percentages reflect differences due to grading rules ap-plied by the grading association.
Figure 13.—Value distribution—No. 3 Shop, 5/4 ponderosa pine.
(M 149 529)
Finally, the cutting value expected for 1000 board feet is calculated by:
(3)
where R = percent recovery (from (2)) UV = value per unit of clear cutting (from (1)) V/M = value per 1000 board feet
By grades No. 1, No. 2, and No. 3 Shop, the cutting values per 1000 board feet are 598, 527, and 425 respec-tively. Assuming the relative value index table used was reasonably accurate, these cutting values should repre-sent the absolute differences in yields between these grades. The actual value recovered by an individual operation may be substantially different from these figures, due to processing methods and acceptance of other than clear cuttings.
Effect of Reripping
In most millwork and moulding operations, the primary breakdown of lumber to obtain clear cuttings involves ripping lumber full length followed by crosscutting. After crosscutting, all material is then either a clear cutting, or classed as defective. The defective material may contain clear areas that meet or exceed the minimum clear cutting size but were unobtainable by the rip, then crosscut, operations. These areas can be salvaged by an additional ripping operation, called reripping, or backripping. Usually the crosscut operator identifies the salvage pieces, cuts them to length, and sends them to the rerip operation.
8
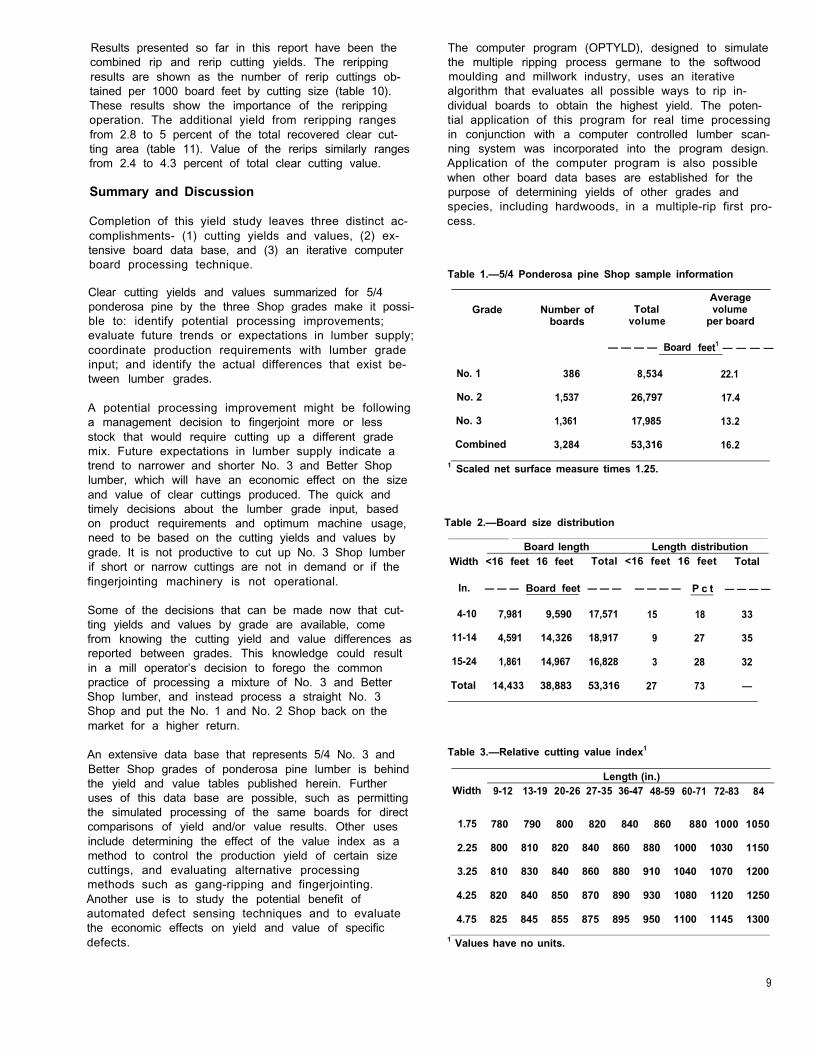
Results presented so far in this report have been the combined rip and rerip cutting yields. The reripping results are shown as the number of rerip cuttings ob-tained per 1000 board feet by cutting size (table 10). These results show the importance of the reripping operation. The additional yield from reripping ranges from 2.8 to 5 percent of the total recovered clear cut-ting area (table 11). Value of the rerips similarly ranges from 2.4 to 4.3 percent of total clear cutting value.
Summary and Discussion
Completion of this yield study leaves three distinct ac-complishments- (1) cutting yields and values, (2) ex-tensive board data base, and (3) an iterative computer board processing technique.
Clear cutting yields and values summarized for 5/4 ponderosa pine by the three Shop grades make it possi-ble to: identify potential processing improvements; evaluate future trends or expectations in lumber supply; coordinate production requirements with lumber grade input; and identify the actual differences that exist be-tween lumber grades.
A potential processing improvement might be following a management decision to fingerjoint more or less stock that would require cutting up a different grade mix. Future expectations in lumber supply indicate a trend to narrower and shorter No. 3 and Better Shop lumber, which will have an economic effect on the size and value of clear cuttings produced. The quick and timely decisions about the lumber grade input, based on product requirements and optimum machine usage, need to be based on the cutting yields and values by grade. It is not productive to cut up No. 3 Shop lumber if short or narrow cuttings are not in demand or if the fingerjointing machinery is not operational.
Some of the decisions that can be made now that cut-ting yields and values by grade are available, come from knowing the cutting yield and value differences as reported between grades. This knowledge could result in a mill operator’s decision to forego the common practice of processing a mixture of No. 3 and Better Shop lumber, and instead process a straight No. 3 Shop and put the No. 1 and No. 2 Shop back on the market for a higher return.
An extensive data base that represents 5/4 No. 3 and Better Shop grades of ponderosa pine lumber is behind the yield and value tables published herein. Further uses of this data base are possible, such as permitting the simulated processing of the same boards for direct comparisons of yield and/or value results. Other uses include determining the effect of the value index as a method to control the production yield of certain size cuttings, and evaluating alternative processing methods such as gang-ripping and fingerjointing. Another use is to study the potential benefit of automated defect sensing techniques and to evaluate the economic effects on yield and value of specific defects.
The computer program (OPTYLD), designed to simulate the multiple ripping process germane to the softwood moulding and millwork industry, uses an iterative algorithm that evaluates all possible ways to rip in-dividual boards to obtain the highest yield. The poten-tial application of this program for real time processing in conjunction with a computer controlled lumber scan-ning system was incorporated into the program design. Application of the computer program is also possible when other board data bases are established for the purpose of determining yields of other grades and species, including hardwoods, in a multiple-rip first pro-cess.
Table 1.—5/4 Ponderosa pine Shop sample information
AverageGrade Number of Total volume
boards
No. 1 386
No. 2 1,537
No. 3 1,361
Combined 3,284
volume per board
— — — — Board feet1 — — — —
8,534 22.1
26,797 17.4
17,985 13.2
53,316 16.2
1 Scaled net surface measure times 1.25.
Table 2.—Board size distribution
Board length Length distribution Width <16 feet 16 feet Total <16 feet 16 feet Total
In. — — — Board feet — — — — — — — P c t — — — —
4-10 7,981 9,590 17,571 15 18 33
11-14 4,591 14,326 18,917 9 27 35
15-24 1,861 14,967 16,828 3 28 32
Total 14,433 38,883 53,316 27 73 —
Table 3.—Relative cutting value index1
Length (in.) Width 9-12 13-19 20-26 27-35 36-47 48-59 60-71 72-83 84
1.75 780 790 800 820 840 860 880 1000 1050
2.25 800 810 820 840 860 880 1000 1030 1150
3.25 810 830 840 860 880 910 1040 1070 1200
4.25 820 840 850 870 890 930 1080 1120 1250
4.75 825 845 855 875 895 950 1100 1145 1300
1 Values have no units.
9
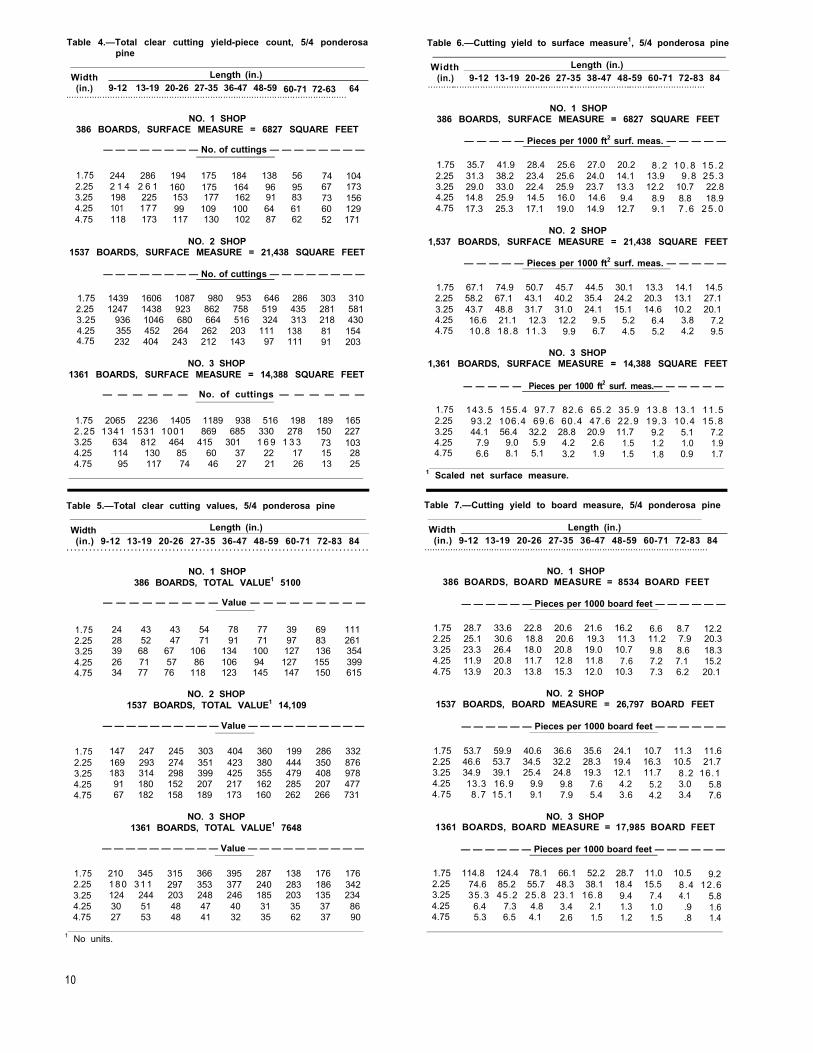
Table 4.—Total clear cutting yield-piece count, 5/4 ponderosa pine
Width Length (in.) (in.) 9-12 13-19 20-26 27-35 36-47 48-59 60-71 72-63 64
. . . . . . . . . . . . . . . . . . . . . . . . . . . . . . . . . . . . . . . . . . . . . . . . . . . . . . . . . . . . . . . . . . . . . . . . . . . . . . . . . . . . . . . . . . . . . . . . . . . . . . . . . . . . .
NO. 1 SHOP 386 BOARDS, SURFACE MEASURE = 6827 SQUARE FEET
— — — — — — — — No. of cuttings — — — — — — — —
1.75 244 286 194 175 184 138 56 74 104 2.25 2 1 4 2 6 1 160 175 164 96 95 67 173 3.25 198 225 153 177 162 91 83 73 156 4.25 101 177 99 109 100 64 61 60 129 4.75 118 173 117 130 102 87 62 52 171
NO. 2 SHOP 1537 BOARDS, SURFACE MEASURE = 21,438 SQUARE FEET
— — — — — — — — No. of cuttings — — — — — — — —
1.75 1439 1606 1087 980 953 646 286 303 310 2.25 1247 1438 923 862 758 519 435 281 581 3.25 936 1046 680 664 516 324 313 218 430 4.25 355 452 264 262 203 111 138 81 154 4.75 232 404 243 212 143 97 111 91 203
NO. 3 SHOP 1361 BOARDS, SURFACE MEASURE = 14,388 SQUARE FEET
— — — — — — No. of cuttings — — — — — —
1.75 2065 2236 1405 1189 938 516 198 189 165 2.25 1341 1531 1001 869 685 330 278 150 227 3.25 634 812 464 415 301 1 6 9 1 3 3 73 103 4.25 114 130 85 60 37 22 17 15 28 4.75 95 117 74 46 27 21 26 13 25
Table 5.—Total clear cutting values, 5/4 ponderosa pine
Width Length (in.) (in.) 9-12 13-19 20-26 27-35 36-47 48-59 60-71 72-83 84
. . . . . . . . . . . . . . . . . . . . . . . . . . . . . . . . . . . . . . . . . . . . . . . . . . . . . . . . . . . . . . . . . . . . . . . . . . . . . . . .
NO. 1 SHOP 386 BOARDS, TOTAL VALUE1 5100
— — — — — — — — — Value — — — — — — — — —
1.75 24 43 43 54 78 77 39 69 1112.25 28 52 47 71 91 71 97 83 2613.25 39 68 67 106 134 100 127 136 3544.25 26 71 57 86 106 94 127 155 3994.75 34 77 76 118 123 145 147 150 615
NO. 2 SHOP 1537 BOARDS, TOTAL VALUE1 14,109
— — — — — — — — — — Value — — — — — — — — — —
1.75 147 247 245 303 404 360 199 286 332 2.25 169 293 274 351 423 380 444 350 876 3.25 183 314 298 399 425 355 479 408 978 4.25 91 180 152 207 217 162 285 207 477 4.75 67 182 158 189 173 160 262 266 731
NO. 3 SHOP 1361 BOARDS, TOTAL VALUE1 7648
— — — — — — — — — — Value — — — — — — — — — —
1.75 210 345 315 366 395 287 138 176 176 2.25 180 311 297 353 377 240 283 186 342 3.25 124 244 203 248 246 185 203 135 234 4.25 30 51 48 47 40 31 35 37 86 4.75 27 53 48 41 32 35 62 37 90
1 No units.
10
Table 6.—Cutting yield to surface measure1, 5/4 ponderosa pine
Width Length (in.) (in.) 9-12 13-19 20-26 27-35 38-47 48-59 60-71 72-83 84
. . . . . . . . . ... . . . . . . . . . . . . . . . . . . . . . . . . . . . . . . . . . . . . . . . . . . . ... . . . . . . . . . . . . . . . . . . . . ... . . . . . . ... . . . . . . . . . . . . . . . . . . . .
NO. 1 SHOP 386 BOARDS, SURFACE MEASURE = 6827 SQUARE FEET
— — — — — Pieces per 1000 ft2 surf. meas. — — — — —
1.75 35.7 41.9 28.4 25.6 27.0 20.2 8 .2 10 .8 15 .2 2.25 31.3 38.2 23.4 25.6 24.0 14.1 13.9 9.8 25.3 3.25 29.0 33.0 22.4 25.9 23.7 13.3 12.2 10.7 22.84.25 14.8 25.9 14.5 16.0 14.6 9.4 8.9 8.8 18.94.75 17.3 25.3 17.1 19.0 14.9 12.7 9.1 7 .6 25 .0
NO. 2 SHOP 1,537 BOARDS, SURFACE MEASURE = 21,438 SQUARE FEET
— — — — — Pieces per 1000 ft2 surf. meas. — — — — —
1.75 67.1 74.9 50.7 45.7 44.5 30.1 13.3 14.1 14.52.25 58.2 67.1 43.1 40.2 35.4 24.2 20.3 13.1 27.13.25 43.7 48.8 31.7 31.0 24.1 15.1 14.6 10.2 20.14.25 16.6 21.1 12.3 12.2 9.5 5.2 6.4 3.8 7.24.75 10.8 18.8 11.3 9.9 6.7 4.5 5.2 4.2 9.5
NO. 3 SHOP 1,361 BOARDS, SURFACE MEASURE = 14,388 SQUARE FEET
— — — — — Pieces per 1000 ft2 surf. meas.— — — — — —
1.75 143.5 155.4 97.7 82.6 65.2 35.9 13.8 13.1 11.5 2.25 93.2 106.4 69.6 60.4 47.6 22.9 19.3 10.4 15.8 3.25 44.1 56.4 32.2 28.8 20.9 11.7 9.2 5.1 7.24.25 7.9 9.0 5.9 4.2 2.6 1.5 1.2 1.0 1.94.75 6.6 8.1 5.1 3.2 1.9 1.5 1.8 0.9 1.7
1 Scaled net surface measure.
Table 7.—Cutting yield to board measure, 5/4 ponderosa pine
Width Length (in.) (in.) 9-12 13-19 20-26 27-35 36-47 48-59 60-71 72-83 84
. . . . . . . . . . . . . . . . . . . . . . . . . . . . . . . . . . . . . . . . . . . . . . . . . . . . . . . . . . . . . . . . . . . . . . . . . . . . . . . . . . . . . . . . . . . . . . . . . . . . . . . . . . . . . .
NO. 1 SHOP 386 BOARDS, BOARD MEASURE = 8534 BOARD FEET
— — — — — — Pieces per 1000 board feet — — — — — —
1.75 28.7 33.6 22.8 20.6 21.6 16.2 6.6 8.7 12.22.25 25.1 30.6 18.8 20.6 19.3 11.3 11.2 7.9 20.33.25 23.3 26.4 18.0 20.8 19.0 10.7 9.8 8.6 18.34.25 11.9 20.8 11.7 12.8 11.8 7.6 7.2 7.1 15.24.75 13.9 20.3 13.8 15.3 12.0 10.3 7.3 6.2 20.1
NO. 2 SHOP 1537 BOARDS, BOARD MEASURE = 26,797 BOARD FEET
— — — — — — Pieces per 1000 board feet — — — — — —
1.75 53.7 59.9 40.6 36.6 35.6 24.1 10.7 11.3 11.62.25 46.6 53.7 34.5 32.2 28.3 19.4 16.3 10.5 21.73.25 34.9 39.1 25.4 24.8 19.3 12.1 11.7 8.2 16.1 4.25 13.3 16.9 9.9 9.8 7.6 4.2 5.2 3.0 5.84.75 8.7 15.1 9.1 7.9 5.4 3.6 4.2 3.4 7.6
NO. 3 SHOP 1361 BOARDS, BOARD MEASURE = 17,985 BOARD FEET
— — — — — — Pieces per 1000 board feet — — — — — —
1.75 114.8 124.4 78.1 66.1 52.2 28.7 11.0 10.5 9.22.25 74.6 85.2 55.7 48.3 38.1 18.4 15.5 8.4 12.6 3.25 35.3 45.2 25.8 23.1 16.8 9.4 7.4 4.1 5.84.25 6.4 7.3 4.8 3.4 2.1 1.3 1.0 .9 1.64.75 5.3 6.5 4.1 2.6 1.5 1.2 1.5 .8 1.4

Table 8.—Cutting size distribution, 5/4 ponderosa pine
Width Length (in.) (in.) 9-12 13-19 20-26 27-35 36-47 48-59 60-71 72-83 84
. . .. . . . . . . . . . . . . . . . . . . . . . . . . . . . . . . . . . . . . . . . . . . . . . . . . . . . . . . . . . . . . . . . . . . . . . . . . . . . . . . . . . . . . . . . . . . .. . . . . . . . . . . . . . . . . .
NO. 1 SHOP 386 BOARDS, TOTAL BOARD AREA = 6,981 SQUARE FEET1
— — — — — Pct cutting area to board area — — — — —
1.75 0.45 0.80 0.78 0.95 1.33 1.29 0.64 1.00 1.522.25 .51 .94 .83 1.22 1.52 1.16 1.40 1.16 3.253.25 .70 1.18 1.15 1.77 2.19 1.58 1.76 1.83 4.244.25 .46 1.22 .97 1.42 1.72 1.45 1.69 1.99 4.584.75 .59 1.31 1.28 1.94 1.98 2.20 1.92 1.88 6.79
NO. 2 SHOP 1,537 BOARDS, TOTAL BOARD AREA = 22,137 SQUARE FEET1
— — — — — Pct cutting area to board area — — — — —
1.75 .85 1.42 1.39 1.67 2.18 1.89 1.02 1.29 1.432.25 .95 1.63 1.51 1.89 2.23 1.95 2.01 1.54 3.443.25 1.02 1.71 1.61 2.10 2.18 1.76 2.08 1.72 3.684.25 .51 .97 .81 1.08 2.10 .79 1.19 .84 1.72 4.75 .37 .97 .84 .98 .87 .76 1.08 1.05 2.54
NO. 3 SHOP 1,361 BOARDS, TOTAL BOARD AREA = 15,122 SQUARE FEET1
— — — — — Pct cutting area to board area — — — — —
1.75 1.78 2.89 2.61 2.95 3.11 2.21 1.04 1.17 1.11 2.25 1.49 2.55 2.40 2.79 2.90 1.81 1.87 1.20 1.97 3.25 1.02 1.95 1.60 1.91 1.85 1.34 1.29 .83 1.29 4.25 .24 .41 .38 .36 .30 .22 .21 .22 .46 4.75 .22 .42 .38 .31 .24 .24 .37 .21 .46
1 Board area determined from board coordinates and is not the same as scaled surface measure.
Table 9.—Cutting value by Shop lumber grade
R V/MB V A UV Recovery Cutting
Shop Total Total Total Value1 cutting value1
grade board value of area of per unit area to per 1,000 measure cuttings cuttings cutting board board
measure feet . . . . . . . . . . . . . . . . . . . . . . . . . . . . . . . . . . . . . . . . . . . . . . . . . . . . . . . . . . . . . . . . . . . . . . . . . . . . . . . . . . . . . . . . . . . . . . . . . . . . . . . . . . . . . .
Board V1 Ft2 V/ft2 Pctfeet
1 8,534 5,100 5,064 1.007 59.3 598
2 26,797 14,109 14,757 .956 55.1 527
3 17,985 7,648 8,559 .894 47.6 425
1 Value has no units.
Table 10.—Rerip yield to board measure, 5/4 ponderosa pine
Width Length (in.) (in.) 9-12 13-19 20-26 27-35 36-47 48-59 60-71 72-83 84
. . . . . . . . . . . . . . . . . . . . . . . . . . . . . . . . . . . . . . . . . . . . . . . . . . . . . . . . . . . . . . . . . . . . . . . . . . . . . . . . . . . . . . . . . . . . . . . . . . . . . . . . . . . . . .
NO. 1 SHOP 386 BOARDS, BOARD MEASURE = 8534 BOARD FEET
— — — — — Rerip pieces per 1000 board feet — — — — —
1.75 14.9 10.7 4.2 2.6 2.3 0.8 0.3 0.3 0.62.25 12.1 6.5 2.5 2.1 1.8 1.6 1.0 1.0 1.13.25 5.9 2.2 1.9 1.3 1.3 .5 .6 .3 .24.25 1.5 .9 .5 .3 .4 .1 .1 .2 .14.75 — — — — — — — — —
NO. 2 SHOP 1537 BOARDS, BOARD MEASURE = 26,797 BOARD FEET
— — — — — Rerip pieces per 1000 board feet — — — — —
1.75 18.2 12.0 4.3 1.8 .8 .2 .1 .1 .12.25 12.7 6.9 1.8 1.1 .4 .1 .1 .0 .13.254.25
4.21.0
2.1.2
.7
.1.3.1
.1
.0.0.0
.0
.0.0.0
.0
.04.75 — — — — — — — — —
NO. 3 SHOP 1361 BOARDS, BOARD MEASURE = 14,388 BOARD FEET
— — — — — Rerip pieces per 1000 board feet — — — — —
1.75 27.9 15.8 4.6 2.5 .6 .2 .0 .0 .02.25 11.9 7.3 1.6 .6 .3 .1 .1 .0 .03.25 2.3 1.2 .1 .0 .1 .0 .0 .0 .04.25 .3 .2 .0 .0 .0 .0 .0 .0 .04.75 — — — — — — — — —
Table 11.— Rip and rerip yield summary
Shop Cutting yield Valuegrade Rip Rerip Rerip Rip Rerip Rerip
. . . . . . . . . . . . . . . . . . . . . . . . . . . . . . . . . . . . . . . . . . . . . . . . . . . . . . . . . . . . . . . . . . . . . . . . . . . . . . . . . . . . . . . . . . . . . . . . . . . . . . . . . . . . . . 1 1 Ft2 Ft2 Pct Pct
No. 1 4,813 251 5.0 4,879 221 4.3
No. 2 14,346 411 2.8 13,775 334 2.4
No. 3 8,286 273 3.2 7,429 219 2.9
1 Value has no units.
11
References
1. Anonymous. 1975. From tree to trim. Wood Moulding and Millwork Prod., 96 p., illus., Portland, Oreg.
2. Anonymous. 1978. Standard grading rules for western lumber. West. Wood Prod. Assoc., Portland, Oreg. March.
3. Benson, Robert E. 1971. Wood for millwork. USDA For. Serv. Res. Pap. INT-89, 10 p., illus., Ogden, Utah.
4. Erickson, Bernard J., and Donald C. Markstrom. 1972. Predicting softwood cutting yield by com-puter. USDA For. Serv. Res. Pap. RM-98, 15 p., Rocky Mt. For. and Range Exp. Stn., Fort Collins, Colo.
5. Petro, F. J., and F. M. Lamb. 1968. Yield of clear cutting from lower grades of eastern white pine. Can. Dep. of For. and Rural Dev. Publ. No. 1227, 14 p., illus., Ottawa, Ont., Can.
6. Stern, A. R., and K. A. McDonald. 1978. Computer optimization of cutting yield from multiple-ripped boards. USDA For. Serv. Res. Pap. FPL 318, 12 p., For. Prod. Lab., Madison, Wis.
7. Wise, Harold F. 1964. Lumber recovery from old growth ponderosa pine and sugar pine on the Stanislaus National Forest-California. USDA For. Serv. Calif. Reg. 26 p., illus., San Francisco, California.
2.5 -13-7 /81
U.S. GOVERNMENT PRINTING OFFICE: 1981/75-027/8
12