Embed Size (px)
Citation preview
International Journal of Mechanical Engineering and Technology (IJMET), ISSN 0976 – 6340(Print), ISSN
0976 – 6359(Online) Volume 3, Issue 2, May-August (2012), © IAEME
494
SIMULATION AND OPTIMIZATION OF HSDI DIESEL ENGINE FOR
SUV TO MEET BHARAT 4 EMISSION NORMS IN INDIA
Pundlik R. Ghodke1 , Dr. J. G. Suryawanshi
2
*(Research Scholar, VNIT Nagpur / DGM Mahindra Research Valley, Chennai, India)
Email: [email protected]/[email protected]) **(Associate Professor, Mechanical Engineering Department, VNIT, Nagpur, India)
Email: [email protected] ):
ABSTRACT
Direct injection diesel engine offers Performance and fuel economy benefit. Use of performance
prediction software helps to reduce engine optimization time, reduces effort and cost of
development.
In the present work, base engine performance prediction was done by use AVL Boost software.
This Model was validated by actual engine test results. This model is used for parametric study
for further performance prediction. AVL Cruise software was used to predict 14 modes steady
state speed-load point’s engine of Bharat stage 4 emission test cycle. These 14 modes were used
for emission optimization on engine test bed. Design of experiment technique was used for
emission optimization. INCA base CAMEO software is used for optimizing combustion
parameters. Xcel base program was developed for comparing engine out hot emissions to chassis
dynamometer vehicle hot emissions. This technique of emission development reduces
engine and vehicle emission development time.
Keywards : BSFC, BMEP, CO, DOC, EGR, SUV
I. INTRODUCTION
Diesel engine performance and emission development is need in current automobile industry due
to future stringent emission norms, noise and CO2 norms. India has adapted partially European
norms with emission limit same but modified test cycle with limited maximum speed from 120
kilometer per hour to 90 kilometer per hour. Bharat stage emission norms based on Indian road
conditions.
In present work, engine performance development and vehicle emission development were done
for Bharat stage 4 norms which were introduced in metros and major cities of India from April
2010 onward .Rest of India still follows Bharat stage3 norms. To reduce emission development
INTERNATIONAL JOURNAL OF MECHANICAL ENGINEERING AND
TECHNOLOGY (IJMET)
ISSN 0976 – 6340 (Print)
ISSN 0976 – 6359 (Online)
Volume 3, Issue 2, May-August (2012), pp. 494-510
© IAEME: www.iaeme.com/ijmet.html
Journal Impact Factor (2012): 3.8071 (Calculated by GISI)
www.jifactor.com
IJMET
© I A E M E

International Journal of Mechanical Engineering and Technology (IJMET), ISSN 0976 – 6340(Print), ISSN
0976 – 6359(Online) Volume 3, Issue 2, May-August (2012), © IAEME
495
time, [3] AVL BOOST simulation software was used to predict the engine performance before
prototype was built. To reduce emission development time on chassis dynamometer, AVL Cruise
software [4] were used for generating 14 steady mode points of engine speed and load condition
which represents actual emission test cycle when vehicle was tested on chassis dynamometer for
emission.
After engine was optimized for emissions at 14 mode point’s further test work was done on
vehicle tested in chassis dynamometer.
This methodology of test reduces major emission development time of chassis dynamometer.
In emission test cycle, engine operates at different speed and load points based on transmission
ratio and axle ratio, tyre radius and reference mass of vehicle. It became more complex to
optimize engine as whole on vehicle and meet emission. Hence a systematic approach was
developed to convert emission cycle in to 14 steady state key points with time weightage factor
by use of AVL Cruise software.
Engine performance was predicted by use of AVL Boost software before engine in existence.
Boost Model engine gives fair confidence of reaching desired engine performance before actual
testing of engine on dynamometer. With this engine Boost model parametric study was done to
access the desired engine full load performance.
Major performance development work was done on test bed by optimizing injection parameters
of common rail and selection of suitable hardware like piston bowl shape, turbocharger and EGR
with cooler.
Engine part load optimization, 14 mode points and smoothening of injection parameters were
done on test bed. Major parameters like EGR rate, injection timing pilot injection and were done
on steady state test bench.
Once base is established engine was fitted on vehicle and further work started on vehicle on
chassis dynamometer. During chassis dynamometer test EGR rate and oxidation catalytic
convertor loading was optimized to reach to desired emissions.
With this method it is possible to reduce the engine emission development time and reduce the
cost of testing.
II. ENGINE AND VEHICLE SPECIFICATION USED FOR
EXPERIMENETATION
Table 1 shows base engine and vehicle specification. Full load performance targets for power
upgrade to 103 kW rating and Bharat stage 4 emission targets were kept for development.
Table1: Engine and vehicle specification for experimental setup.
Engine Type
Base Engine specifications Upgraded Engine
specifications
2.2L, Inline, 4 cylinders, DOHC,
HSDI Diesel
2.2L, Inline, 4 cylinders,
DOHC, HSDI Diesel
Compression
Ratio 18.5 : 1 16.5: 1

International Journal of Mechanical Engineering and Technology (IJMET), ISSN 0976 – 6340(Print), ISSN
0976 – 6359(Online) Volume 3, Issue 2, May-August (2012), © IAEME
496
Rated Power 88 kW 103 kW
Rated Speed 4000 rpm 3750 rpm
Injection System Common Rail, Bosch Gen 2 Common Rail, Bosch Gen 2
Air System VGT Gen 2 Turbocharger Gen 3.5 ‘S’ vane VGT
Turbocharger
Emission Bharat stage 3 Bharat stage 4
Vehicle
specifications SUV SUV
Gearbox Manual Transmission with 5
forward+ 1 backward
Manual transmission with 5
speed + 1backward
Axle ratio 4.1 4.1
Rolling radius 0.331 m 0.331 m
III. METHODOLOGY
Following methodology was followed during performance and emission upgrade of engine and
vehicle to meet Bharat stage 4 emission norms.
3.1 Thermodynamic Engine model by use of AVL Boost software for simulation and
validating it with base engine.
3.2 Parametric study on Engine model by use of AVL Boost software to predict engine full
load performance
3.3 Generation of steady state 14 mode speed- load points and its weightage factor by using
AVL Cruise simulation software
3.4 Full load Performance development and testing of engine on steady state test bench
3.5 Hot emission development on engine for steady state test bench as per 14 mode speed
load- points.
3.6 Optimizing vehicle for hot emission on chassis dynamometer and verification with
engine dynamometer 14 mode point results.
After successful correlation of hot emission on engine and vehicle, cold correction were applied
and best practice in industry was followed for further vehicle calibration work. Like summer,
winter calibration and drivability and comfort functions etc which were not taken in the present
work scope of this paper.
3.1 Thermodynamic Engine simulation model by use of AVL BOOST software

International Journal of Mechanical Engineering and Technology (IJMET), ISSN 0976
0976 – 6359(Online) Volume 3, Issue 2, May
Base engine simulation model was
Performance output of the model was compared and
This validated Boost model was
performance target of 103kW.
parametric study and full load performance prediction
Fig. 1: AVL Boost model for experimental engine
During developments of boost model,
to design and thermal boundary condition
155 bar. Maximum exhaust gas
material constraint. Engine Oil temperature
speed was allowed up to 2,10,0000 rpm.
Engine noise target were kept to
speed was constrained to 4750 rpm based on design and operating limit of engine valve train.
3.2 Parametric study on AVL Boost
Engine full load performance was
4000 rpm keeping boundary condition of cylinder pressure of 155 bar maximum.
Full load comparison of Boost simulated results with actual
0
20
40
60
80
100
120
1000
Po
wer,
kW
International Journal of Mechanical Engineering and Technology (IJMET), ISSN 0976 –
6359(Online) Volume 3, Issue 2, May-August (2012), © IAEME
497
was generated on computer by use of AVL Boost software
of the model was compared and validated with base engine performance.
used for parametric study to predict the desired
Figure 1 shows AVL Boost model of Engine model used for
parametric study and full load performance prediction.
AVL Boost model for experimental engine
developments of boost model, following practical boundary conditions were imposed
boundary conditions of engine. Engine cylinder pressure was
as temperature was limited to 760 deg C based on turbocharger
. Engine Oil temperature was allowed up to 130 deg C. Max
,0000 rpm. Pressure before turbocharger was limited
kept to 97 dBA at full load and full speed. Maximum
4750 rpm based on design and operating limit of engine valve train.
AVL Boost Engine Model
was predicted for entire speed- load condition from 1000 rpm to
keeping boundary condition of cylinder pressure of 155 bar maximum.
comparison of Boost simulated results with actual engine tested result of engine.
1500 2000 2500 3000 3500 4000
Engine speed, rpm
Actual
Tested
Simulated
– 6340(Print), ISSN
ter by use of AVL Boost software [3].
ine performance.
the desired engine full load
Figure 1 shows AVL Boost model of Engine model used for
following practical boundary conditions were imposed due
was limited up to
760 deg C based on turbocharger
to 130 deg C. Maximum Turbine
was limited 2300 mbar.
allowable engine
4750 rpm based on design and operating limit of engine valve train.
from 1000 rpm to
keeping boundary condition of cylinder pressure of 155 bar maximum. Figure 2 shows
tested result of engine.

International Journal of Mechanical Engineering and Technology (IJMET), ISSN 0976 – 6340(Print), ISSN
0976 – 6359(Online) Volume 3, Issue 2, May-August (2012), © IAEME
498
Fig. 2: Engine Full load performance comparison of simulated and actual tested results.
.
Figure 3 shows Predicted engine torque and actual engine tested results which were matching
96% to actual tested results. Actual test results are slightly lower to the fact that turbocharger air
flow was observed lower in actual engine.
Fig. 3: Engine Torque comparison of Actual tested and simulated results.
Figure 4 shows Brake specific fuel consumption of actual tested engine and simulated results
from AVL Boost model. Simulated results were matching with actual test results. In all speed
actual results are slightly higher that predicted result due to simplified assumption made in boost
model.
Fig. 4: Engine power and BSFC Vs engine speed of actual tested and simulated results.
Figure 5 shows simulated results and actual tested results of engine at different engine full load
operating speed. Simulated results showing higher temperature than actual except at 4000 rpm.
This is possible due to fact that simplified assumptions done in boost combustion model. Hence
results were not closer to actual test results.
0
50
100
150
200
250
300
350
400
1000 1500 2000 2500 3000 3500 4000
Engine speed, Rpm
TO
RQ
UE
Actual Tested
By Simulation
150
170
190
210
230
250
270
290
1000 1500 2000 2500 3000 3500 4000
Engine speed,rmp
BSFC
g/k
wh
r
Actual
testedSimulated,
BSFC

International Journal of Mechanical Engineering and Technology (IJMET), ISSN 0976 – 6340(Print), ISSN
0976 – 6359(Online) Volume 3, Issue 2, May-August (2012), © IAEME
499
Fig. 5: Exhaust temperature Vs engine speed comparison of actual tested and simulated results
Figure 6 shows the combustion noise comparison of boost simulated results and actual tested
engine. Boost result were matching and lower engine speed and at higher speed above 2000 rpm
actual engine combustion noise was lower than boost simulated results by around 3 dBA.
Fig. 6: Combustion Noise comparison of actual tested engine and Boost simulated results.
Predicted cylinder pressure was compared with actual testing and is close agreement with actual
tested result based on optimized combustion parameters
Fig. 7: Combustion Noise comparison of actual tested engine and Boost simulated results.
3.3 Generation of 14 mode steady state points for hot emission development on Engine
dynamometer by use of AVL Cruise software
400
450
500
550
600
650
700
750
800
850
900
1000 1500 2000 2500 3000 3500 4000Engine speed,rpm
Exh
uast
TEM
P ,
De
g C
Actual Tested
By simulation
50
55
60
65
70
75
80
85
90
95
100
1000 1250 1500 1750 2000 2250 2500 2750 3000 3250 3500 3750
NO
ISE
DB
A
ENGINE SPEED
COMBUSTION NOISE ACTUAL VS SIMULATED
NOISE ACTUAL NOISE SIMULATED
100
110
120
130
140
150
160
170
180
1000 1500 2000 2500 3000 3500 4000
Engine speed, rpm
Cyl
ind
er
Pre
ssu
re,B
ar
Actual Tested
By Simulation

International Journal of Mechanical Engineering and Technology (IJMET), ISSN 0976
0976 – 6359(Online) Volume 3, Issue 2, May
New approach was suggested in this work .T
mode steady state speed-points with time
Excel base program was developed for conver
kilometer. Table 2 and figure 8
points generated by use of AVL cruise software.
Fig. 8: AVL Cruise prediction for
Table 2: Steady state 14 mode points
3.4. Full load Performance development of engine on test bed
Experiments were conducted on
equipped with Horiba 7100 D emission analyzers, Smart sampler, Cameo and INCA interface
International Journal of Mechanical Engineering and Technology (IJMET), ISSN 0976 –
6359(Online) Volume 3, Issue 2, May-August (2012), © IAEME
500
in this work .Transient emission cycle was converted in
points with time weightage factor by use of AVL Cruise software
developed for conversion of engine out raw emission
shows engine speed, BMEP, percentage weightage of 14 mode
points generated by use of AVL cruise software.
prediction for 14 steady state mode speed-load points.
Table 2: Steady state 14 mode points for engine testing on test bed
l load Performance development of engine on test bed
Experiments were conducted on engine mounted on AVL make Hi Dynamic Test
equipped with Horiba 7100 D emission analyzers, Smart sampler, Cameo and INCA interface
– 6340(Print), ISSN
converted in to 14
weightage factor by use of AVL Cruise software [4].
PPM to gram per
age weightage of 14 mode
points.
for engine testing on test bed
Dynamic Test Bench
equipped with Horiba 7100 D emission analyzers, Smart sampler, Cameo and INCA interface
International Journal of Mechanical Engineering and Technology (IJMET), ISSN 0976 – 6340(Print), ISSN
0976 – 6359(Online) Volume 3, Issue 2, May-August (2012), © IAEME
501
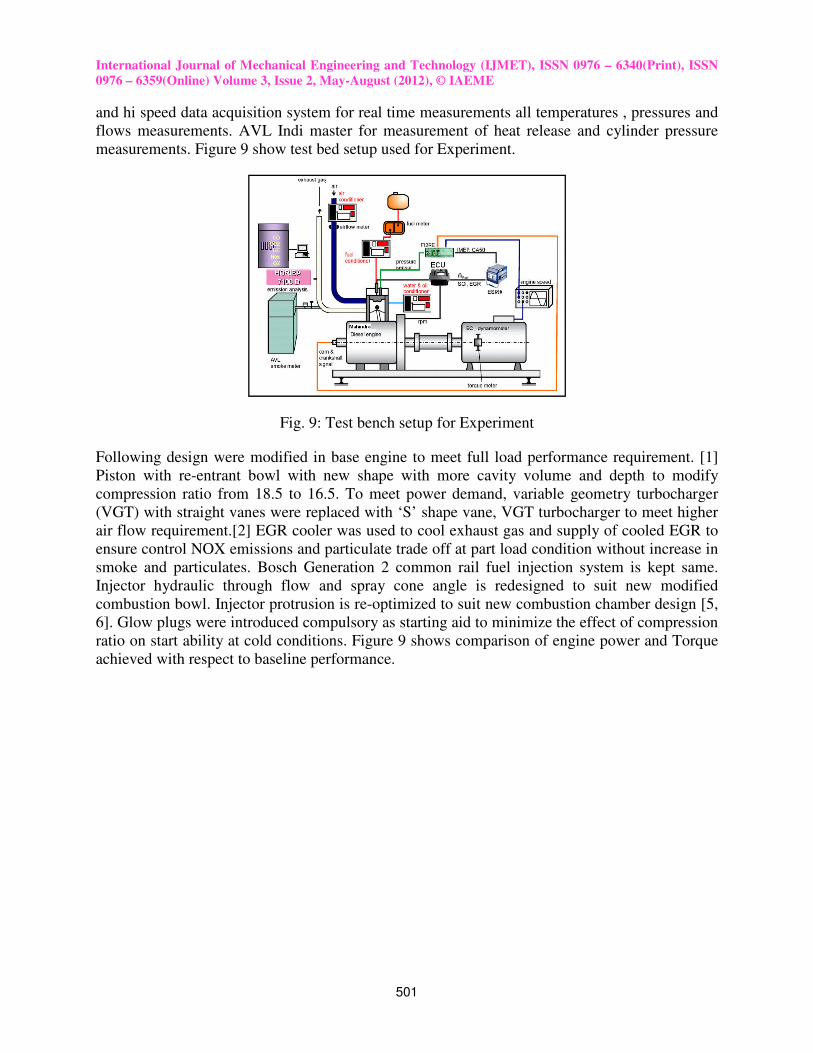
and hi speed data acquisition system for real time measurements all temperatures , pressures and
flows measurements. AVL Indi master for measurement of heat release and cylinder pressure
measurements. Figure 9 show test bed setup used for Experiment.
Fig. 9: Test bench setup for Experiment
Following design were modified in base engine to meet full load performance requirement. [1]
Piston with re-entrant bowl with new shape with more cavity volume and depth to modify
compression ratio from 18.5 to 16.5. To meet power demand, variable geometry turbocharger
(VGT) with straight vanes were replaced with ‘S’ shape vane, VGT turbocharger to meet higher
air flow requirement.[2] EGR cooler was used to cool exhaust gas and supply of cooled EGR to
ensure control NOX emissions and particulate trade off at part load condition without increase in
smoke and particulates. Bosch Generation 2 common rail fuel injection system is kept same.
Injector hydraulic through flow and spray cone angle is redesigned to suit new modified
combustion bowl. Injector protrusion is re-optimized to suit new combustion chamber design [5,
6]. Glow plugs were introduced compulsory as starting aid to minimize the effect of compression
ratio on start ability at cold conditions. Figure 9 shows comparison of engine power and Torque
achieved with respect to baseline performance.

International Journal of Mechanical Engineering and Technology (IJMET), ISSN 0976 – 6340(Print), ISSN
0976 – 6359(Online) Volume 3, Issue 2, May-August (2012), © IAEME
502
Fig. 9: Full load power and torque curve comparison of base engine and upgraded engine
Figure 10 shows the pilot injection strategies used in optimization of full load performance of
engine at various speeds. Advantages of using pilot injection help in engine NVH characteristic
of engine and increase in power output of engine due to premixed combustion.
Fig.: 10: Main injection and Two pilot injection strategies for full load performance and emission
optimization.
3.5 Hot Emission development on Engine dynamometer
Engine was run-in and oil temperature was stabilized to 90 Deg C and coolant temperature to
97dec C. Engine is operated at each speed and load and row engine out emission were recorded.
These emissions were fed to excel sheet where program is developed to convert engine out
emission from ppm or g/hr to g/km and compared with the limit value of Bharat stage 4 emission
regulations. Design of experiments were conducted to optimize each point by varying the
0
50
100
150
200
250
300
350
10
00
11
00
12
50
15
00
16
00
17
50
20
00
22
50
25
00
27
50
30
00
32
50
35
00
36
00
37
50
40
00
Engine speed, rpm
En
gin
e T
orq
ue
, N
m
20
35
50
65
80
95
110
125
140
155
170
Po
we
r,k
W
Upgraded toruebase torqueupgraded powerbase power
Torque
power

International Journal of Mechanical Engineering and Technology (IJMET), ISSN 0976 – 6340(Print), ISSN
0976 – 6359(Online) Volume 3, Issue 2, May-August (2012), © IAEME
503
injection parameters like injection timing, injection pressure, pilot quantity, EGR rate, pilot
separation and different boost pressures to get optimized NOx-smoke trade-off and CO , HC
emission in control. AVL Cameo interfaced with common rail INCA software was used to run
engine with different operating points and optimum parameters were selected at each key points.
All optimized key points data was analyzed through excel base
program to check weather optimized results were close to legislation limits or not. By increasing
EGR rate PPM level of NOx was optimized. It was observed that smoke levels were drastically
increases when engine was optimized for Bharat stage 4 emission norms without EGR cooler.
EGR cooler was used with cooled EGR rate to control NOx and Smoke values to reach Bharat
stage 4 emission limits. Figure 10, 11, 12 and 13 shows engine out NOx, CO, HC and smoke at
14 mode points optimized from BS3 to BS4 emissions. Although CO and HC emissions were
more compared to BS3 were controlled by use of closed coupled DOC with higher platinum
loading and brought within the legislation limits.
Fig 10: Engine out NOx emission at 14 mode points
Fig 11: Engine out CO emissions at 14 mode points
0
200
400
600
800
1000
1 2 3 4 5 6 7 8 9 10 11 12 13 14
Mode
No
x,p
pm
NOx,BSIII
NOx,BSIV
0
100
200
300400
500
600
700
800
1 2 3 4 5 6 7 8 9 10 11 12 13 14
Mode
CO
,ppm
CO, BSIII
CO,BSIV
International Journal of Mechanical Engineering and Technology (IJMET), ISSN 0976 – 6340(Print), ISSN
0976 – 6359(Online) Volume 3, Issue 2, May-August (2012), © IAEME
504
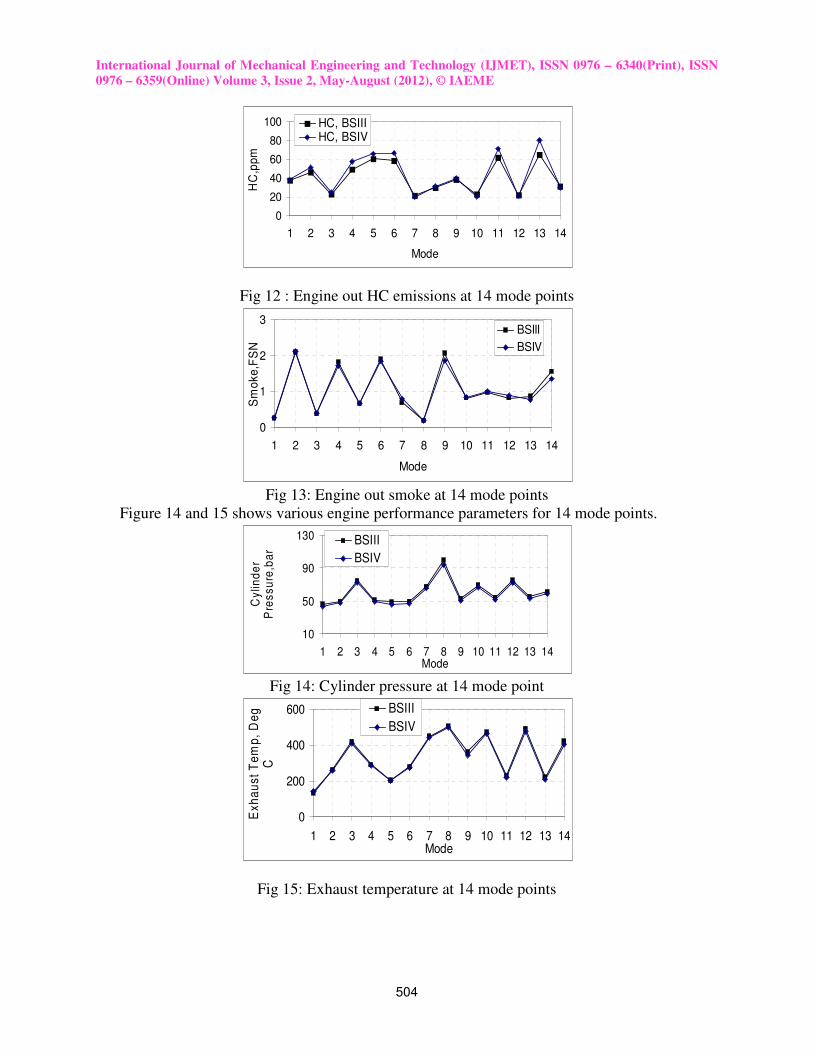
Fig 12 : Engine out HC emissions at 14 mode points
Fig 13: Engine out smoke at 14 mode points
Figure 14 and 15 shows various engine performance parameters for 14 mode points.
Fig 14: Cylinder pressure at 14 mode point
Fig 15: Exhaust temperature at 14 mode points
0
20
40
60
80
100
1 2 3 4 5 6 7 8 9 10 11 12 13 14
ModeH
C,p
pm
HC, BSIIIHC, BSIV
0
1
2
3
1 2 3 4 5 6 7 8 9 10 11 12 13 14
Mode
Sm
oke
,FS
N
BSIII
BSIV
10
50
90
130
1 2 3 4 5 6 7 8 9 10 11 12 13 14Mode
Cy
lind
er
Pre
ss
ure
,ba
r
BSIII
BSIV
0
200
400
600
1 2 3 4 5 6 7 8 9 10 11 12 13 14Mode
Ex
ha
us
t T
em
p,
De
g
C
BSIII
BSIV

International Journal of Mechanical Engineering and Technology (IJMET), ISSN 0976 – 6340(Print), ISSN
0976 – 6359(Online) Volume 3, Issue 2, May-August (2012), © IAEME
505
Figure 16, 17, 18 and 19 shows main combustion and injection parameters.
Fig 16: Engine fueling at 14 mode points
Fig. 17: Pilot 1 and 2 quality at 14 mode points
Fig.18: Pilot 1 and 2 separation at 14 mode points
0
10
20
30
40
50
1 2 3 4 5 6 7 8 9 10 11 12 13 14
Mode
Fu
elin
g,
mm
3/s
tr BSIIIBSIV
0
1
2
3
4
1 2 3 4 5 6 7 8 9 10 11 12 13 14Mode
pilo
t q
ua
nti
ty,
mg
/str
ok
e
Pilot 1-BSIII
Pilot 1-BSIV
pilot 2 BSIII
Pilot 2 BSIV
500
2000
3500
5000
6500
1 2 3 4 5 6 7 8 9 10 11 12 13 14Mode
Pilo
t se
pe
ratio
n,
u s
ec Pilot 1-BSIII
Pilot 1-BSIV
pilot 2 BSIII
Pilot 2 BSIV
International Journal of Mechanical Engineering and Technology (IJMET), ISSN 0976
0976 – 6359(Online) Volume 3, Issue 2, May
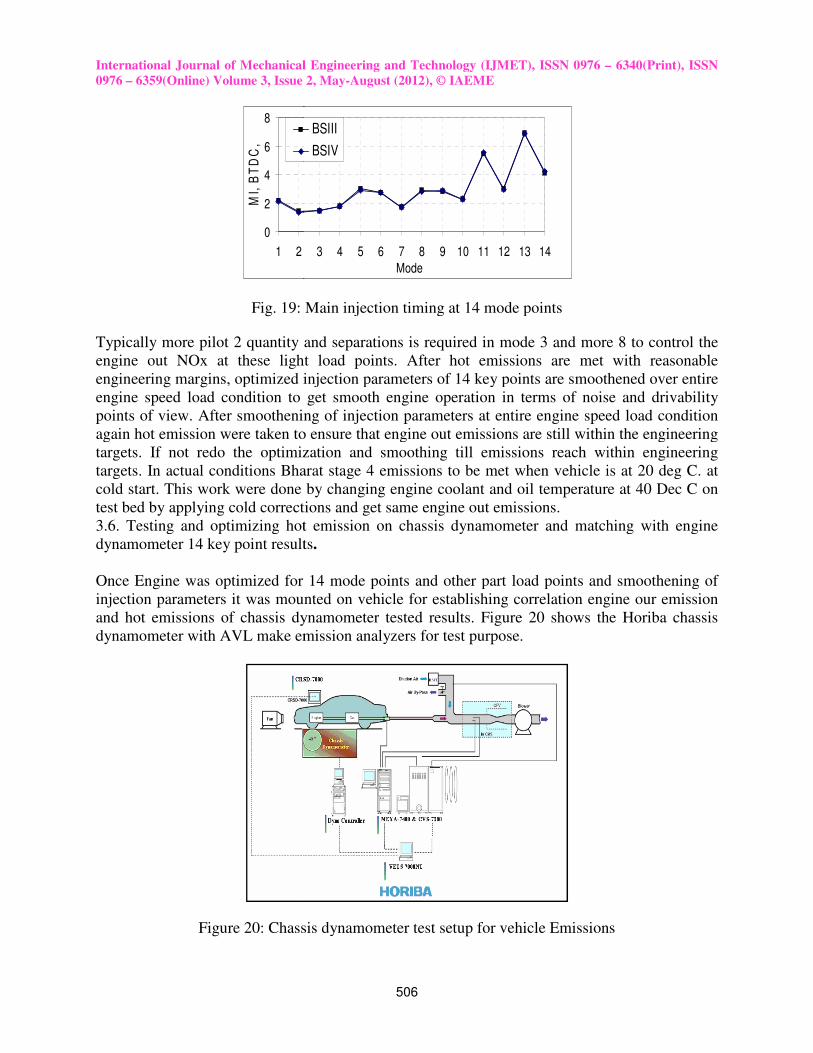
Fig. 19: Main injection timing at 14 mode points
Typically more pilot 2 quantity and separations
engine out NOx at these light load
engineering margins, optimized injection parameters of 14 key points are smoothened over entire
engine speed load condition to get smooth engine operation in terms of
points of view. After smoothening of injection parameters at entire engine speed load
again hot emission were taken to ensure that engine out emissions are still
targets. If not redo the optimization and smoothing till emissions reach within
targets. In actual conditions Bharat stage 4 emissions
cold start. This work were done by changing engine coolant and oil temperature at 40 Dec C on
test bed by applying cold corrections
3.6. Testing and optimizing hot emission on cha
dynamometer 14 key point results
Once Engine was optimized for 14 mode points and other part load points and smoothening of
injection parameters it was mounted on vehicle for
and hot emissions of chassis dynamometer
dynamometer with AVL make emission analyzers
Figure 20: Chassis dynamometer test
0
2
4
6
8
1 2M
I, B
TD
C,
International Journal of Mechanical Engineering and Technology (IJMET), ISSN 0976 –
6359(Online) Volume 3, Issue 2, May-August (2012), © IAEME
506
: Main injection timing at 14 mode points
and separations is required in mode 3 and more 8 to control the
light load points. After hot emissions are met with reasonable
, optimized injection parameters of 14 key points are smoothened over entire
engine speed load condition to get smooth engine operation in terms of noise and
After smoothening of injection parameters at entire engine speed load
again hot emission were taken to ensure that engine out emissions are still within the engineering
targets. If not redo the optimization and smoothing till emissions reach within
In actual conditions Bharat stage 4 emissions to be met when vehicle is at 20 deg C. at
cold start. This work were done by changing engine coolant and oil temperature at 40 Dec C on
test bed by applying cold corrections and get same engine out emissions.
. Testing and optimizing hot emission on chassis dynamometer and matching with engine
dynamometer 14 key point results.
optimized for 14 mode points and other part load points and smoothening of
injection parameters it was mounted on vehicle for establishing correlation engine our e
dynamometer tested results. Figure 20 shows the
make emission analyzers for test purpose.
Chassis dynamometer test setup for vehicle Emissions
3 4 5 6 7 8 9 10 11 12 13 14
Mode
BSIII
BSIV
– 6340(Print), ISSN
is required in mode 3 and more 8 to control the
emissions are met with reasonable
, optimized injection parameters of 14 key points are smoothened over entire
noise and drivability
After smoothening of injection parameters at entire engine speed load condition
within the engineering
targets. If not redo the optimization and smoothing till emissions reach within engineering
to be met when vehicle is at 20 deg C. at
cold start. This work were done by changing engine coolant and oil temperature at 40 Dec C on
ssis dynamometer and matching with engine
optimized for 14 mode points and other part load points and smoothening of
engine our emission
shows the Horiba chassis
Emissions
International Journal of Mechanical Engineering and Technology (IJMET), ISSN 0976 – 6340(Print), ISSN
0976 – 6359(Online) Volume 3, Issue 2, May-August (2012), © IAEME
507
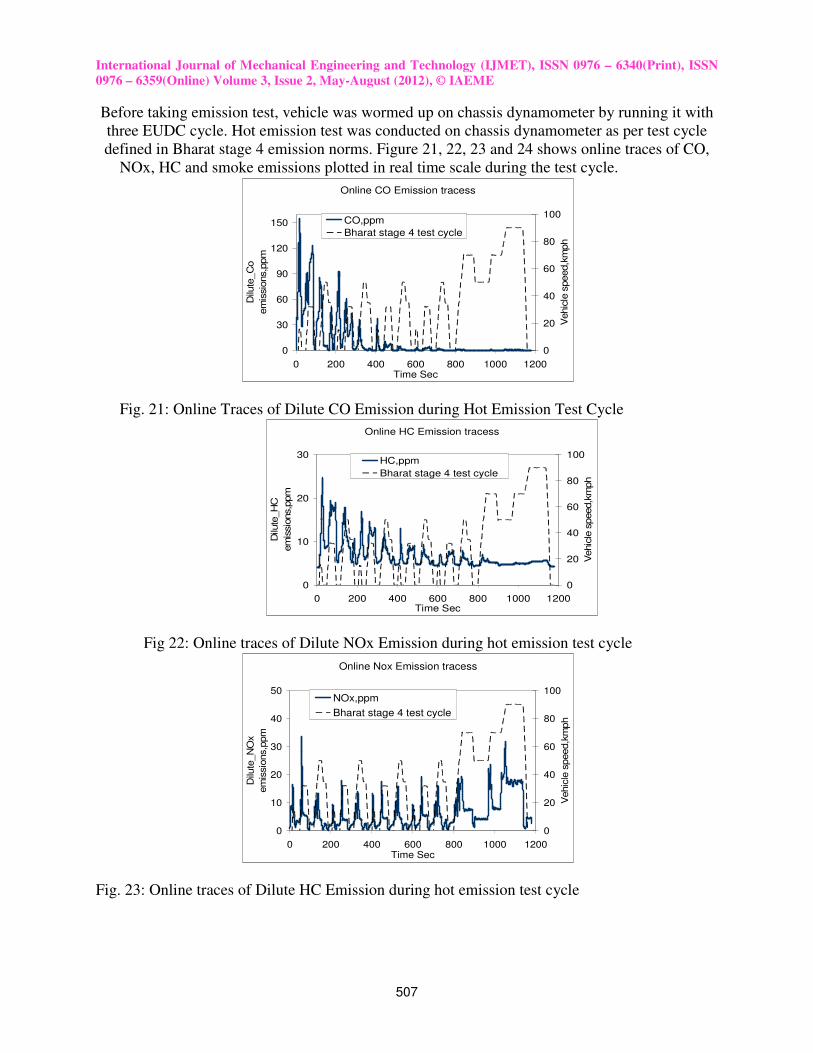
Before taking emission test, vehicle was wormed up on chassis dynamometer by running it with
three EUDC cycle. Hot emission test was conducted on chassis dynamometer as per test cycle
defined in Bharat stage 4 emission norms. Figure 21, 22, 23 and 24 shows online traces of CO,
NOx, HC and smoke emissions plotted in real time scale during the test cycle.
Fig. 21: Online Traces of Dilute CO Emission during Hot Emission Test Cycle
Fig 22: Online traces of Dilute NOx Emission during hot emission test cycle
Fig. 23: Online traces of Dilute HC Emission during hot emission test cycle
Online CO Emission tracess
0
30
60
90
120
150
0 200 400 600 800 1000 1200Time Sec
Dilu
te_C
o
em
issio
ns,p
pm
0
20
40
60
80
100
Vehic
le s
peed,k
mph
CO,ppm
Bharat stage 4 test cycle
Online HC Emission tracess
0
10
20
30
0 200 400 600 800 1000 1200Time Sec
Dilu
te_H
C
em
issio
ns,p
pm
0
20
40
60
80
100
Vehic
le s
peed,k
mph
HC,ppm
Bharat stage 4 test cycle
Online Nox Emission tracess
0
10
20
30
40
50
0 200 400 600 800 1000 1200Time Sec
Dilu
te_N
Ox
em
issio
ns,p
pm
0
20
40
60
80
100
Vehic
le s
peed,k
mph
NOx,ppm
Bharat stage 4 test cycle

International Journal of Mechanical Engineering and Technology (IJMET), ISSN 0976 – 6340(Print), ISSN
0976 – 6359(Online) Volume 3, Issue 2, May-August (2012), © IAEME
508
Fig. 24: Online Traces of Dilute Smoke Emission during Hot Emission Test Cycle
IV RESULTS AND DISCUSSSIONS
4.1 Co-relation of AVL Boost simulation and actual test results
Boost simulation was done and parametric study showed that to lower compression ratio from
18.5 to 16.5 is necessary maintain peak firing cylinder pressure of 155 bar . Actual engine test
results were matching with simulation results .Figure 25 and 26 shows the comparison of
simulation boost pressure and actual test results at full load 3750 rpm and 1500 rpm.
Fig 25: Cylinder Pressure comparison at Full load @ 3750 rpm for actual and simulated results
Figure 26: Cylinder Pressure comparison at Full load @ 1500 rpm for actual and simulated
results
Online Smoke Emission tracess
0
2
4
6
8
10
12
14
16
18
20
0 200 400 600 800 1000 1200Time Sec
Dilu
te_S
moke in %
0
20
40
60
80
100
Vehic
le s
peed,k
mph
Smoke %Bharat stage 4 test cycle
Combustion pressure 100 % Load @1500 rpm
0
20
40
60
80
100
120
140
160
0 90 180 270 360 450 540 630 720Crank angle
Cylin
der Pre
ssure
,Bar
Actual Tested
Simulated
Combustion Pressure 100% Full load@ 3750 rpm
0 200 400 600
Crank angle,Degree
Pre
ssure
,bar
0
20
40
60
80
100
120
140
160
180Actual Tested
Simulated
International Journal of Mechanical Engineering and Technology (IJMET), ISSN 0976 – 6340(Print), ISSN
0976 – 6359(Online) Volume 3, Issue 2, May-August (2012), © IAEME
509
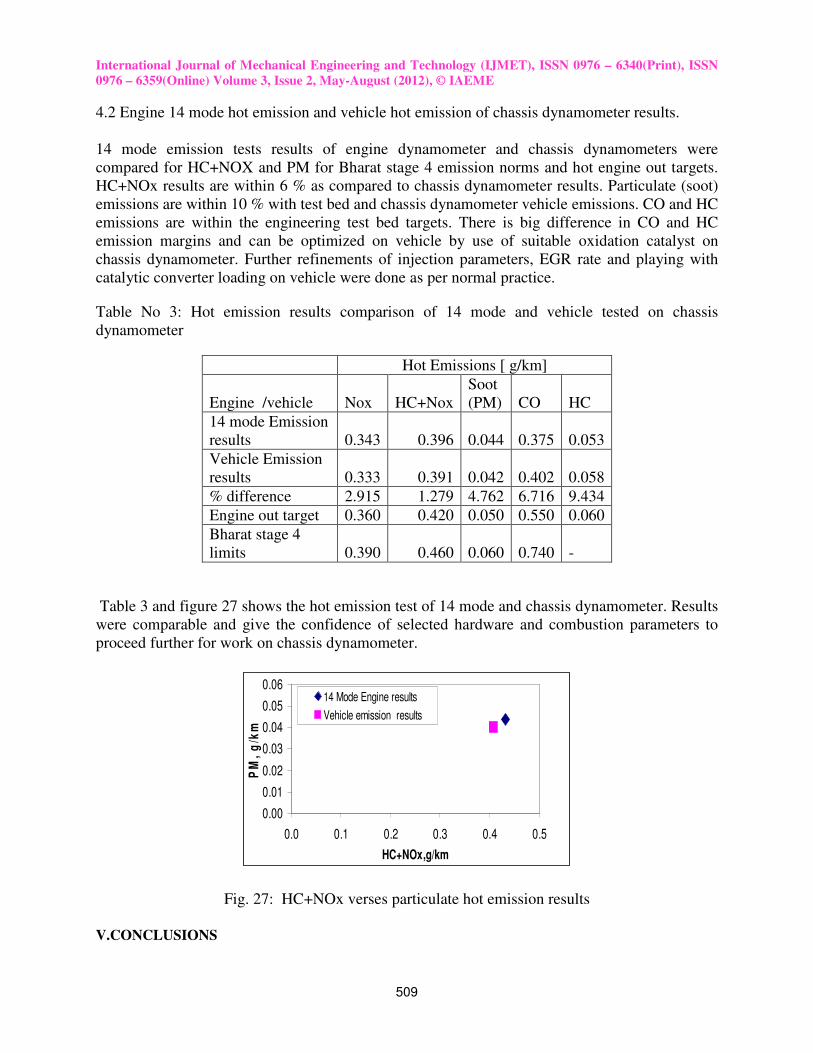
4.2 Engine 14 mode hot emission and vehicle hot emission of chassis dynamometer results.
14 mode emission tests results of engine dynamometer and chassis dynamometers were
compared for HC+NOX and PM for Bharat stage 4 emission norms and hot engine out targets.
HC+NOx results are within 6 % as compared to chassis dynamometer results. Particulate (soot)
emissions are within 10 % with test bed and chassis dynamometer vehicle emissions. CO and HC
emissions are within the engineering test bed targets. There is big difference in CO and HC
emission margins and can be optimized on vehicle by use of suitable oxidation catalyst on
chassis dynamometer. Further refinements of injection parameters, EGR rate and playing with
catalytic converter loading on vehicle were done as per normal practice.
Table No 3: Hot emission results comparison of 14 mode and vehicle tested on chassis
dynamometer
Hot Emissions [ g/km]
Engine /vehicle Nox HC+Nox
Soot
(PM) CO HC
14 mode Emission
results 0.343 0.396 0.044 0.375 0.053
Vehicle Emission
results 0.333 0.391 0.042 0.402 0.058
% difference 2.915 1.279 4.762 6.716 9.434
Engine out target 0.360 0.420 0.050 0.550 0.060
Bharat stage 4
limits 0.390 0.460 0.060 0.740 -
Table 3 and figure 27 shows the hot emission test of 14 mode and chassis dynamometer. Results
were comparable and give the confidence of selected hardware and combustion parameters to
proceed further for work on chassis dynamometer.
Fig. 27: HC+NOx verses particulate hot emission results
V.CONCLUSIONS
0.00
0.01
0.02
0.03
0.04
0.05
0.06
0.0 0.1 0.2 0.3 0.4 0.5
HC+NOx,g/km
PM
, g
/km
14 Mode Engine results
Vehicle emission results
International Journal of Mechanical Engineering and Technology (IJMET), ISSN 0976 – 6340(Print), ISSN
0976 – 6359(Online) Volume 3, Issue 2, May-August (2012), © IAEME
510
Engine design and developments is complex process. There is no short cut in development to meet future
ultra low emission norms due to complexity of engine features like common rail, EGR cooler, new
generation boosting system, etc.
Based on this developments following are conclusions.
5.1 Use of simulation tool helps early prediction of engine performance and selection of critical engine
hardware’s before engine goes in test bed.
5.2 Considerable development time of vehicle emission development time on chassis dynamometers can
be reduced by optimizing engine on steady points on test bench.
5.3 This method is very useful if one engine goes on different vehicles or having more vehicle variant to
meet same emission legislation.
5.4 Considerable development cost saving and crunch on overloading on infrastructure can be avoided.
5.5 Possible to do single engine development and use it on many vehicle variants with same emission
norms.
5.6 Very good correlation was seen for NOx and soot emissions between steady state and hot chassis
dynamometer.
5.7 For HC and CO correlations are not seen. This is mainly due to conversion efficiency and light of
temperature of catalyst.
5.8 Detection of wrong hardware at final stage of vehicle emission development testing becomes costly
affair in terms of time and cost.
VI. ACKNOWELGMENTS
Author would like to thank to Mr. Rajan Wadhera, Chief of TPDS (Technology production Development
and Sourcing), Mahindra and Mahindra Ltd for use of test facility at R&D Center Nasik, India and Mr. R
Velusamy, Sr. General Manager, R&D for his valuable suggestions and guidance
VII. REFERENCES [1] HEYWOOD,J.B,Internal combustion Engines Fundamentals,Mc Graw-Hill,Inc.,1988
[2] WATSON,N.and JANOTA,M.S,Turbocharging the internal combustion engine-wiley-interscience,
1982
[3] AVL Boost V5.5 User Manual
[4] AVL CRUISE V 5.4 User Manual
[5] JUNMIN,WANG and et.al.:2008-01-1198: Development of High Performance Diesel Engine
Compliant with Euro V Norms, 2008 World Congress, Detroit ,Michigan April 2008
[6] Ramdasi SS and Etal : 2011-26-0033, SIAT2011, ‘Design and Development of 3 Cylinder 75
kW/Litre High Power Density Engine for Passenger Car Application to Meet EIV /E V Norms
DEFINITIONS, ACRONYMS, ABREVIATIONS BMEP : Brake Mean Effective pressure
EGR : Exhaust Gas Recirculation
FSN : Filter Smoke Number
BSFC : Brake specific fuel consumption
NVH : Noise vibration and harshness
DOC : Diesel oxidation catayst
CO : Carbon Monoxide
HC : Hydrocarbon
NOx : Oxides of Nitrogen
SUV : Sport Utility Vehicle


![University of Bath · The analysis was based on a previously validated [12] Ricardo WAVE engine model of a 2.0 litre in line 4 cylinder high speed direct injection (HSDI) diesel engine,](https://img.pdfslide.us/doc/110x75/5e9137ef12303b235f22e682/university-of-bath-the-analysis-was-based-on-a-previously-validated-12-ricardo.jpg)


![Untitled-13 [] · O'E-SEL DIESEL WORLD DIESEL DIESEL DIESEL WC)ALD DIESEL WORLD DIESEL WORLD DIESEL want-a The Perfect Combo To sum up nearly every new truck review on a 3/4-ton or](https://img.pdfslide.us/doc/110x75/5f7a5b1de1247a6a345bc3bf/untitled-13-oe-sel-diesel-world-diesel-diesel-diesel-wcald-diesel-world-diesel.jpg)