Embed Size (px)
DESCRIPTION
.
Citation preview

China in Focus:Lessons and Challenges
2012

This work is published under the responsibility of the Secretary-General of the OECD. The
opinions expressed and arguments employed herein do not necessarily refl ect the offi cial views
of the Organisation or of the governments of its member and partner countries.
This document and any map included herein are without prejudice to the status of or sovereignty
over any territory, to the delimitation of international frontiers and boundaries and to the name
of any territory, city or area.
Please cite this publication as:OECD (2012), China in Focus: Lessons and Challenges, OECD, Paris.
http://www.oecd.org/china, htttp://www.oecdchina.org
Photo credits: © CD – Fotolia.com
© OECD 2012
You can copy, download or print OECD content for your own use, and you can include excerpts from OECD publications, databases and multimedia products in your own documents, presentations, blogs, websites and teaching materials, provided that suitable acknowledgement of OECD as source and copyright owner is given. All requests for public or commercial use and translation rights should be submitted to [email protected]. Requests for permission to photocopy portions of this material for public or commercial use shall be addressed directly to the Copyright Clearance Centre (CCC) at [email protected] or the Centre français d’exploitation du droit de copie (CFC) at [email protected].
i CHINA IN FOCUS: LESSONS AND CHALLENGES © OECD 2012
FOREWORD
The OECD’s mission is to help governments develop, adopt and implement “better policies for
better lives”. To do so, the Organisation brings together the collective expertise and accumulated
experience of a range of policy communities from all around the world. The main challenges
faced by our economies are indeed global and addressing them requires the OECD to work ever
more closely with its partners to design better policy options and truly global solutions. China’s
experience and development path are thus of critical interest to the OECD.
The collaboration between China and the OECD is a two-way process. The OECD is
increasingly incorporating China’s perspectives into its policy analysis and recommendations
in order to provide its Members with smarter, innovative policy choices. In turn, as China
becomes a more prosperous country, the challenges it faces in its economic development are also
increasingly similar to those of many OECD countries, in particular regarding how to foster and
sustain more inclusive and greener growth. The experiences of OECD countries are thus more and
more relevant for China’s own policy choices. This is evidenced by the fact that the OECD works
on many policy issues identifi ed as priorities in the Chinese 12th Five Year Plan, including energy
effi ciency, public service delivery, social protection, education and health care, just to cite a few.
This publication “China in Focus: Lessons and Challenges” has a two-fold objective. First,
it provides a snapshot of the current cooperation between China and the OECD by gathering
analyses conducted by the OECD on China in 2011, including in the areas of poverty reduction,
inequality, health care and foreign trade. Second, it shares with China the policy experience of
OECD Members on issues of particular relevance for China, such as green growth and skills.
Our intention is to make this publication a regular feature of the OECD-China policy dialogue
to help shape and deepen our cooperation further. This cooperation dates back to the mid-90s
and has since then been intensifi ed and extended to new policy areas. We consider this policy
dialogue as strategic for the future of the OECD and to build together a stronger, cleaner and
fairer world economy.
Angel Gurría �������������������������������������������������������������������������������������OECD Secretary-General
FOREWORD

ii CHINA IN FOCUS: LESSONS AND CHALLENGES © OECD 2012
ACKNOWLEDGEMENTS
This volume is the product of a collaborative project of different directorates of the OECD.
The authors are Irène Hors (Introduction), Richard Herd (Chapters 1, 2, 3), Samuel Hill (Chapter
1), Alessandro Goglio and Theodora Xenogiani (Chapter 2), Nathalie Girouard and Eugene Mazure
(Chapter 3), Przemyslaw Kowalski and Hildegunn Nordås (Chapter 4), Dirk Pilat, Norihiko Yamano
and Naomitsu Yashiro (Chapter 5), Kathrin Hoeckel and Andreas Schleicher (Chapter 6), Michael
Borowitz and Valérie Paris (Chapter 7), Serge Gas (Chapter 8), Richard Carey and Li Xiaoyun (Senior
Advisor to the International Poverty Reduction Centre in China) (Chapter 9). The project was
initiated and managed by Irène Hors, Senior Adviser in Beijing, under the direction of Richard
Boucher, Deputy Secretary-General and Marcos Bonturi, Deputy Director of the Council and Global
Relations Secretariat. Richard Herd, Sam Hill, Irène Hors and Vincent Koen provided extensive
comments and editing on all chapters. Lynn Robertson and Lian Liu also provided comments on
different chapters. The publication was fi nalised in mid-February 2012.
ACKNOWLEDGEMENTS
iii CHINA IN FOCUS: LESSONS AND CHALLENGES © OECD 2012
TABLE OF CONTENTS
TABLE OF CONTENTS
Introduction .......................................................................................................................................... vii
Chapter 1: Macroeconomic Overview .........................................................................................1Recent performance and near-term prospects ...................................................................1The framework for monetary and exchange rate policy needs improvement ...................... 8The fi scal framework needs to be strengthened to meet economic and social objectives ................................................................................................................... 11Medium-term challenges ............................................................................................................ 12
Chapter 2: Inequality: Recent Trends in China and Experience in the OECD Area ................ 16Introduction .................................................................................................................................. 16Trends in inequality ..................................................................................................................... 17The causes of inequality in China ............................................................................................. 20The social protection system has been widened but is far from universal ......................... 20The impact of taxes and cash transfers policies on inequality in the OECD area .............. 23Complementarities between policies to reduce inequality and boost growth ................... 25Taxing in a way that allows equitable and inclusive growth ................................................. 26Dealing with the distributional consequences of short-term output fl uctuations of macroeconomic shocks .......................................................................................................... 28The infl uence of institutions on the distributional implications of shocks ........................ 29Reforms in product markets can also improve the income distribution ............................ 30Financial reforms as well can have redistributive effects ..................................................... 31Conclusions .................................................................................................................................. 31
Chapter 3: Key Lessons from OECD Work on Greening Growth ................................................. 35What are the benefi ts of green growth? ................................................................................... 36A framework for green growth .................................................................................................. 37What are the essentials of green growth policies? .................................................................. 39Institutions and multi-level governance ................................................................................... 43Employment and distributional aspects ................................................................................... 44The international dimension ..................................................................................................... 46Measuring progress towards green growth .............................................................................. 47
Chapter 4: China’s 10 Years in the WTO: Sustaining Openness-based Growth into the Future..50Introduction .................................................................................................................................. 50China’s accession to the WTO as the cornerstone of its re-emergence as an economic power ............................................................................................................................................. 50
iv CHINA IN FOCUS: LESSONS AND CHALLENGES © OECD 2012
TABLE OF CONTENTS
Global trade networks, global value chains and FDI ............................................................... 54Trade specialisation patterns .................................................................................................... 55Moving up the income ladder and sustaining openness-based growth ............................. 58Summary and conclusions ........................................................................................................ 69
Chapter 5: Moving up the Value Chain: China’s Experience and Future Prospects ................ 72Introduction .................................................................................................................................. 72China’s involvement in global value chains ............................................................................. 73Strategies for China’s upgrading within global value chains ................................................. 80The shift in global markets and opportunities for China ...................................................... 84
Chapter 6: Measuring Skills to Support Economic Transformation ........................................... 89Introduction .................................................................................................................................. 89Measuring skills through PISA .................................................................................................. 89A framework for the measurement of skills ............................................................................ 90Current and emerging measures of skills for economic transformation: skills supply ..... 92Measuring skills demand ............................................................................................................ 93Matching of skills demand and supply and outcomes ........................................................... 96Contextual factors having an impact on skills development ............................................... 98Implementing a strategic approach to skills policies based on sound evidence ................ 99
Chapter 7: Health Care in China: Recent Trends and Policy Challenges ................................. 102Introduction ................................................................................................................................ 102The challenge of non-communicable diseases ...................................................................... 104Health insurance coverage has expanded, but fragmentation remains ............................ 108Further reform of the public hospital system is required .................................................... 109A national pharmaceuticals scheme is being implemented to improve access to affordable medicines ............................................................................................................. 112
Chapter 8: Nuclear Energy in China: Views and Prospects from the OECD Nuclear Energy Agency’s Perspective ................................................................................................... 115
Introduction ................................................................................................................................ 115The fl eet of reactors and the impact of the Fukushima-Daiichi accident ........................ 115The fuel cycle ............................................................................................................................. 116China and the OECD Nuclear Energy Agency ......................................................................... 117Increased co-operation between China and the NEA: mutual benefi ts ............................ 118Concluding remarks .................................................................................................................. 120
Chapter 9: Economic Transformation and Poverty Reduction: How it Happened in China, Helping it Happen in Africa ...................................................................................................... 121
Introduction ................................................................................................................................ 121Economic transformation and poverty reduction ................................................................. 123Key elements of China’s experience ........................................................................................ 124Applying the lessons of China to Africa .................................................................................. 126

v CHINA IN FOCUS: LESSONS AND CHALLENGES © OECD 2012
TABLE OF CONTENTS
Lessons for development cooperation .................................................................................... 129
TablesTable 2.1 The impact of tax reforms on growth and equality ............................................... 27Table 2.2 Synthesis of empirical fi ndings on the distributional impact ............................ 28Table 3.1 Overview of proposed OECD green growth indicator groups and topics covered ...................................................................................................... 47Table 4.1 China’s tariffs on agricultural and industrial products ........................................ 53Table 5.1 Technology expenditures by Chinese industrial enterprises ............................... 83Table 7.1 Hospitals and hospital beds in China .................................................................... 110
Figures
Figure 1.1 Consumer and producer prices, year-on-year change ........................................... 2Figure 1.2 Bank lending growth and interest rates ................................................................... 3Figure 1.3 Contributions to GDP growth ..................................................................................... 4Figure 1.4 Housing sales and property under construction .................................................... 5Figure 1.5 The trade balance and terms of trade ...................................................................... 5Figure 1.6 Cyclical developments: the OECD leading indicator and the national PMI ........ 6Figure 1.7 Borrowing by non-fi nancial companies by source .................................................. 9Figure 1.8 Offshore renminbi deposits and trade settlement in renminbi ......................... 10Figure 1.9 Nominal and effective exchange rate of the renminbi ........................................ 11Figure 1.10 Government expenditure and the budget balance ............................................. 12Figure 1.11 Energy production and energy intensity, 1990-2010 ........................................... 14Figure 2.1 Change in real household income by quintile between the early 1990s and the late 2000s ..................................................................................................... 17Figure 2.2 Change in inequality levels, early 1990s versus late 2000s ................................. 18Figure 2.3 Inequality drops in urban and rural areas ............................................................ 19Figure 2.4 The gap between rural and urban incomes narrows............................................ 19Figure 2.5 Low-income provinces have grown faster than high-income provinces between 2005 and 2010 .............................................................................................. 20Figure 2.6 Public social expenditure in China and selected emerging economies............. 21Figure 2.7 The coverage of contributory social schemes has risen substantially ............... 22Figure 2.8 Unemployment and severance pay benefi ts ......................................................... 23Figure 2.9 Inequality and income levels across OECD countries .......................................... 23Figure 2.10 Redistribution tends to be higher when incomes are more unequal .............. 24Figure 3.1 Composition of environmentally related tax revenues in selected G-20countries ............................................................................................................. 40Figure 3.2 Decoupling trends: production based CO2 and GHG emissions - CO2 and GHG emissions versus GDP and real income, OECD, BRIICS, 1990-2008 .... 48Figure 4.1 Real GDP growth in China, other large emerging economies and the OECD .... 51Figure 4.2 Share of FIE exports and imports in total exports and imports ......................... 55Figure 4.3 Share of products with RCA index above 1 by factor intensity ........................... 57

vi CHINA IN FOCUS: LESSONS AND CHALLENGES © OECD 2012
TABLE OF CONTENTS
Figure 4.4 Average services trade costs relative to domestic transaction costs, total services 2005 ..................................................................................................... 65Figure 5.1 China’s processing trade and ordinary exports ................................................... 73Figure 5.2 The share of FIEs in ordinary exports and exports based on the processing trade regime ................................................................................... 74Figure 5.3 Growth in the unit value of China’s exports and the role of imported intermediates ............................................................................................................. 75Figure 5.4 Import contents of exports and origin of imported inputs (2005) ..................... 76Figure 5.5 Import contents of exports for China and selected countries (mid 2000) ......... 77Figure 5.6 The ratio of value added to production for ICT manufacturing (2005) .............. 78Figure 5.7 The composition of China’s manufacturing exports (2010) ................................. 79Figure 5.8 Processing trade exports by indigenous Chinese fi rms ....................................... 80Figure 5.9 Share of State-owned enterprises and State-controlled enterprises in technology expenditure (2009) ................................................................................ 84Figure 5.10 The composition of China’s FDI by enterprise type (2010) ............................... 85Figure 5.11 Domestic sales and market share by FIEs and Hong Kong,China, Macau,China and Chinese Taipei fi rms (2009) .................................................... 86Figure 6.1 Conceptual framework for the measurement of skills ........................................ 91Figure 6.2 Reading engagement and foundation skills ......................................................... 95Figure 6.3 Match-mismatch between skill profi ciency and skill use ................................... 97Figure 6.4 Foundation skills and economic disadvantage ..................................................... 98Figure 7.1 Total health expenditure per capita and GDP per capita, 2009 ......................... 103Figure 7.2 Life expectancy and GDP per-capita ..................................................................... 104Figure 7.3 Projected cases of Non-Communicable Diseases in China ............................... 105Figure 7.4 Annual cost of a preventive package to tackle important risk factors for chronic diseases ................................................................................................ 106Figure 7.5 An example of quality indicators collected in the OECD Health Care Quality Indicators Project: Asthma hospital admission rates, population aged 15 and over, 2009 (or nearest year) .............................................................. 108Figure 7.6 Average length of stays for acute care in hospitals, 2008 (or nearest year available) ...................................................................................... 111Figure 9.1 Chinese imports from selected groupings of African countries as percentage of those countries’ GDP ................................................................. 127
BoxesBox 1.1. The OECD Composite Leading Indicator for China .................................................... 7Box 3.1 The National 12th Five-Year Plan for Environmental Protection (2011-2015) ...... 38Box 3.2 Green growth objectives and national development planning ............................... 44Box 3.3 Promoting National Coherence of Environmental Enforcement in China ............ 45Box 5.1 Policy recommendations on the framework conditions ......................................... 82Box 6.1 The OECD’s Programme for International Student Assessment (PISA) .................. 91Box 6.2 The OECD’s Programme for the International Assessment of Adult Competencies (PIAAC) ...................................................................................... 94

vii CHINA IN FOCUS: LESSONS AND CHALLENGES © OECD 2012
TABLE OF CONTENTS
Box 6.3 Using sound skills measures to design effective skills policies in Australia ....... 100Box 9.1. What is the OECD’s Development Assistance Committee? .................................. 122Box 9.2 Economic transformation in Africa and the role of China and other emerging countries ........................................................................................... 127Box 9.3 The Fourth High Level Forum on Aid Effectiveness ................................................ 130


ix CHINA IN FOCUS: LESSONS AND CHALLENGES © OECD 2012
INTRODUCTION
Introduction
China’s economic rise has drawn growing attention across OECD countries and beyond,
while many of its key policy challenges are increasingly in alignment with OECD priorities.
China in Focus: Lessons and Challenges gathers analyses conducted by the OECD on China
in 2011, together with a selection of more general pieces of work of particular pertinence to
China. The objective is twofold: fi rst, to facilitate access for Chinese policy makers and experts
to relevant OECD reports, which provide an international perspective on China’s situation and
challenges; and second, to enhance the understanding of China’s experience in the broader policy
community, in developed as well as developing countries.
Today, China and OECD countries face a number of common challenges. Some, like improving
international trade and investment regimes, or curbing climate change, have a global dimension
and require co-ordinated action, which in turns requires a mutual understanding through policy
dialogue. Others refl ect China’s progress towards its goal of becoming a well-off society in an all-
around way. China now ranks as an upper middle income country with a GDP per-capita closing
in on some OECD member countries. The experience of advanced countries, their failures and
successes, has thus become even more relevant for China.
Following a macroeconomic overview (Chapter 1), the report provides an international
perspective on two key challenges addressed in the 12th Five-Year Plan for National Economic
and Social Development (Chapters 2 and 3): how to ensure development is people-centred,
and how to tackle the adverse environmental consequences of rapid economic development.
These objectives echo two OECD priorities: how to make growth more inclusive and greener.
Chapters 4 and 5 consider how further structural reforms can boost competitiveness, thereby
sustaining continued strong growth. Refl ecting the importance the Chinese government attaches
to education and skills, Chapter 6 discusses ways to strengthen skills to support China’s long-
term growth and ongoing transformation, including in rural areas. Chapter 7 then examines
another dimension of human capital and wellbeing, documenting China’s progress in improving
health and, looking ahead, discusses how, like many OECD and other emerging countries, it must
address the rise of non-communicable diseases. Chapter 8 reviews China’s strategy for the use
of nuclear energy and discusses the possible gains from increased co-operation with the OECD’s
sister organisation, the Nuclear Energy Agency. Finally, Chapter 9 takes a step back on the Chinese
economic transformation and experience with poverty reduction and draws conclusions for aid
policies.
The OECD’s Economics Department China Desk closely monitors economic developments
in China, and forecasts of China are included in the twice yearly OECD Economic Outlook. The
macroeconomic overview contained in this volume notes the continued strong performance
of the economy against the backdrop of continued weakness in many other parts of the global
x CHINA IN FOCUS: LESSONS AND CHALLENGES © OECD 2012
INTRODUCTION
economy. Rebalancing of the economy is underway, as demonstrated by the substantial reduction
in the current account surplus. It discusses the government’s responses to the global economic
slowdown and identifies the property sector as a considerable source of risk. It also discusses
how reforms towards a more market-oriented monetary policy, and a more fl exible exchange rate
regime could help the economy better absorb shocks, thereby promoting greater macroeconomic
and fi nancial stability. This overview chapter also points to the importance of fi scal policy reform
to support the ambitious social objectives of the 12th Five-Year Plan.
China and OECD countries are similarly concerned by inequality and the need for the benefi ts
of economic development to be widely shared by the population. How to respond to the problem
of inequality is an important theme of the 12th Five-Year Plan, and the recently issued Plan
for the Development of Human Resources and Social Security poses the objective of reaching a
“reasonable income distribution”. Inequality has been rising in many countries and remains a
key concern to governments. Moreover, there appears to be little relation between the level of
economic development and the extent of inequality. How to address inequality and promote
inclusive growth has become a priority for the OECD. Chapter 2 analyses inequality trends in
China and discusses how an effective tax and transfer system, appropriate labour and product
market regulations as well as sound education and fi nancial sector policies, can all help reduce
inequality. It shows the strong complementarities between a number of policies that can directly
reduce inequality and strengthen growth.
Another shared priority among China and OECD countries is to shift towards greener modes
of consumption and production. Across the OECD awareness of the need to tackle a variety of
environmental challenges is rising while the recent economic crisis provided many countries
with the opportunity to consider reforms to promote a different economic growth model. Many
governments are therefore putting in place measures aimed at a green recovery, focussing on
innovation and investing in renewable energy and improved effi ciency in the use of energy and
materials. Chapter 3 draws on the OECD’s work on green growth, and discusses how countries
can design a green growth strategy adapted to the local context. In China, as in many other
developing countries, environmental pollution has been sometimes seen by local actors as
the price to pay for development. But the rising pollution is generating mounting costs, not
least for human health, and social tensions. The government has taken a number of important
steps to improve the environment. The green growth path provides an opportunity for China
to leapfrog unsustainable and wasteful production and consumption patterns. Moreover, as
argued in Chapter 1, there are complementarities to be exploited between reforms that will
aid environmental and broader economic rebalancing, notably through the shift away from
construction and manufacturing towards the service sector.
Chapters 4 and 5 focus on China’s integration in the world economy, and analyses how the
government’s commitment to pursue an opening up strategy and further liberalise trade and
investment barriers can help sustain high growth. Chapter 4 looks back at the wide-ranging
structural reforms implemented since China’s accession to the WTO 10 years ago, and recalls
how the participation in global trade networks and global value chains (GVCs) has been pivotal
to China’s economic success. It shows that China could gain further additional benefits from
further opening up by removing remaining pockets of border and behind-the-border protection,
continued reforms of the state-owned entreprises sector and of the agriculture sector, as well as
rethinking its approach to trade of raw materials. Regulatory reform and increased competition in
services sectors can also contribute to the development of the services sector and help lift overall
productivity.

xi CHINA IN FOCUS: LESSONS AND CHALLENGES © OECD 2012
INTRODUCTION
Chapter 5 takes a closer look at China’s role within GVCs as the “World’s Factory”, examining
the importance of “processing trade”, and exploring the role played by imported intermediate
inputs in China’s relatively sophisticated exports. It pays special attention to China’s value-added
GVC activity by presenting some of the latest findings by the OECD on the mapping of GVCs.
The chapter also emphasises the necessity of strong technological capabilities in developing
high quality, innovative products, and the accumulation of other strengths such as intellectual
property, human capital and organisational assets, often summarised as intangible assets. It fi nds
that, as with physical assets, China’s intangible assets are disproportionally concentrated in state
controlled enterprises. Considering the highly dynamic and entrepreneurial nature of innovation,
China’s upgrading within GVCs will increasingly need to be led by profi t-oriented enterprises. The
internationalization of private fi rms in particular could be a way to strengthen their innovation
capabilities and foster their role in GVC upgrading.
Shanghai has been the fi rst Chinese province to take part in the Programme for International
Student Assessment (PISA) and its results have stunned policy makers around the world. Fifteen-
year-olds in Shanghai reached the highest performance standards in every subject assessed,
outperforming students from the 73 other participating economies. While the Shanghai results
illustrate what China can achieve in terms of educational performance, skills-related challenges
elsewhere remain, in particular in rural areas. Chapter 6 presents the results from OECD work to
support countries in their effort to formulate sound skills policies. It provides guidelines not only
regarding which kind of information is needed to evaluate current supply and demand of skills,
skills match and outcomes in investment in skills, but also discusses how to design policies that
will make the most of existing skills to foster development.
Chapter 7 recalls the considerable progress in improving health outcomes and health care
coverage and access, with the life expectancy today being similar to the one observed for several
OECD countries. Today, China is setting the bases for tomorrow’s healthcare and insurance
systems, and can, in this process, benefit from the dialogue with OECD countries and OECD’s
systematic data collection and analysis of health systems. With the decline in infectious diseases,
chronic diseases have become the major health challenge in China. The experience of OECD
countries, which have been confronted with this challenge for a longer period of time, shows
the importance of prevention, screening and treatment in primary care. Better aligning China’s
health and insurance systems towards interventions in primary care settings, such as screening
for hypertension and diabetes and effective treatment, would improve cost-effectiveness,
and provide more flexible treatment options. In addition, while China has been successful in
expanding hard infrastructure in the health system, many aspects of soft infrastructure, such as
hospital management and fi nancing as well as training of medical staff, need further reform.
Refl ecting its strong economic growth, China’s demand for energy has increased rapidly over
the years. Both to limit the environmental impact of its energy consumption, and to develop
domestic alternatives to coal, China has adopted a very ambitious plan for the development of
its nuclear energy capacity. As in other countries, the Fukushima-Daiichi accident has raised
concerns regarding the safety of nuclear plants, leading to a revision of safety regulations and
a focus on deploying advanced technology reactors, which offer improved safety features.
Chapter 8 provides a description of China’s nuclear energy program and outlines the possible
benefi ts China could gain from increased co-operation with the Nuclear Energy Agency. Across
a variety of issues, including nuclear safety and regulation, radioactive waste management and
decommissioning, radiological protection and emergency preparedness as well as the economic,
scientifi c and legal aspects of nuclear energy, participation in this agency can provide access to

xii CHINA IN FOCUS: LESSONS AND CHALLENGES © OECD 2012
INTRODUCTION
international best practices to help support the safe and sustainable development of China’s
nuclear energy.
Finally, Chapter 9 looks at China’s exceptional record in addressing poverty, through a rapid
economic transformation from a poor, rural-based country to a middle income one. It summarises
the work conducted by the China-DAC Study Group, established by the Development Assistance
Committee (DAC), OECD’s network of donors, and by the International Poverty Reduction Centre
in China (IPRCC), and with the active participation of several African countries. It highlights the
important role played by the Chinese government in guiding economic and social development,
through planning and budgeting, performance-based public management, policy research and
innovative experiments. It also emphasises how China was able to make the most of foreign
investment and aid, by incorporating these with its own development strategies. China’s
experience is an important reference for other developing and emerging countries, and its active
participation in the recently signed Busan Partnership for Effective Development Co-operation is
an important asset both for other donors and developing countries.

1 CHINA IN FOCUS: LESSONS AND CHALLENGES © OECD 2012
CHAPTER 1: MACROECONOMIC OVERVIEW
Chapter 1:
Macroeconomic Overview
Recent performance and near-term prospects
The economy has slowed and price pressures receded...
In 2011, the Chinese economy slowed markedly and it recorded one of its slowest expansions
in a decade. Nonetheless, by world standards, the growth rate of 9.2% was exceptional and was
achieved against the backdrop of a weak and uncertain global economic environment. This
marked the tenth consecutive year the economy has notched up annual growth above 9%, almost
tripling the size of Chinese GDP in a decade. It marked another step towards China’s goal of
becoming a well-off society in an all-around way and consolidating its position as a key engine
of the global economy. Indeed, while the major advanced economies continued to post anaemic
and uneven growth, and grapple with other serious economic challenges – notably stubbornly
high unemployment, a heavy public debt burden and falling asset prices – China is estimated
to have contributed around one third of global growth in PPP terms. The economy’s momentum
weakened over the course of 2011 and by end-year it was growing at only just over 8%, well below
its trend pace.
The slowing reflected a concerted effort to cool the economy and reduce inflation, which
began to rise steadily from the end of 2010 with consumer prices up over 6% in year-on-year
terms by mid-2011 (Figure 1.1). Pricing pressures were widespread, reflecting broader capacity
constraints which emerged following an earlier, very strong, growth rebound that in turn help
push up many international commodity prices. For much of the year producer prices rose at over
6% year-on-year, more than double the long-term average. Decisions to raise support prices for
cereals and longer-term supply constraints plus bad weather, resulted in food prices rising at
close to 15% year-on-year at the peak of the cycle. By the end of 2011, infl ation had declined to
around 4% year-on-year, aided by slowing activity and an easing of capacity constraints, as well
as a moderation in food and raw material prices.

2 CHINA IN FOCUS: LESSONS AND CHALLENGES © OECD 2012
CHAPTER 1: MACROECONOMIC OVERVIEW
Figure 1.1 Consumer and producer prices, year-on-year change
Source: CEIC.
... As the policy stance tightened
In response to inflationary pressures, monetary policy was tightened and both regulated
interest rates and the reserve ratios for commercial banks were raised. Though the increase in
benchmark interest rates was relatively modest, the reduction in liquidity ensured that borrowing
costs for the banks moved up substantially more. By mid-2011 the 3-month interbank rate had
risen to over 6%, more than 400 basis points higher than early 2010 (Figure 1.2). Lending to local
government investment vehicles, some of which had borrowed heavily during 2009, was also
reined in as signs of mounting bad debts began to emerge. The banking regulator ordered a halt
to new lending for some new local government infrastructure projects, required signifi cant loans
to be transferred back on to the balance sheets of the banks and intensifi ed the monitoring of
their existing loan portfolios.
As a result of these measures, as well as the general monetary policy tightening, the growth
of money and bank lending slowed appreciably and for 2011 as a whole the authorities were
successful in hitting their target for money growth of 16%, a marked slowdown from the more
than 20% expansion in the previous year. With clear signs that inflationary pressures were
abating, growth moderating and the outlook in some advanced economies deteriorating, the
authorities commenced monetary policy easing towards the end of the year, reducing the
required reserve ratio by 50 basis points. This move helped to ease pressure in money markets
somewhat, thereby marginally lowering fi nancing costs for the banks. The reserve ratio was cut a
further 50 basis points in February 2012 though benchmark interest rates were left unchanged, at
relatively high levels.
The authorities implemented measures to cool the property market, which continued to post
strong price rises early in the year, especially in the largest cities. These measures built on earlier
initiatives and included a further rise in the minimum deposit for purchases of a second property,
from 50% to 60%, as well as an extension of the list of cities imposing other restrictions on the
purchase of real estate. In addition, property taxes were introduced for the fi rst time, in Shanghai
and Chongqing.

3 CHINA IN FOCUS: LESSONS AND CHALLENGES © OECD 2012
CHAPTER 1: MACROECONOMIC OVERVIEW
Figure 1.2 Bank lending growth and interest rates
Source: CEIC.
Fiscal policy also added to the headwinds for the economy. Tax revenues were extremely
buoyant during 2011. The national government defi cit (the sum of central and local governments)
decreased significantly, almost reaching balance. At the same time, the social security system
(whose budget is separate from the government and is managed locally) ran a surplus suffi ciently
large to ensure that the combined accounts of the national government and social security moved
into a surplus of around 0.5% of GDP, despite below-par growth. With nominal GDP rising rapidly
and a small deficit, national government debt declined to 15% of GDP by end-2011. Moreover,
government cash balances rose signifi cantly, leaving the government with little net debt.
However, there are a range of off-budget borrowings that could eventually add to government
debt. At end-2010, these fell into four components: the debt of the Ministry of Railways; the debt
of asset management companies and, most importantly the debt of local government fi nancing
platforms and unauthorised borrowing by local government. According to the National Audit
Offi ce the total of these debts amounted to 35% of GDP at end-2010. This fi gure is the maximum
amount for which the government might eventually be liable in the event that all the investment
projects financed by the debt failed to produce sufficient revenues to repay the borrowing. A
signifi cant proportion of the investment projects, especially those located in richer provinces is
likely to generated suffi cient funds for repayment or are backed by adequate collateral.
The rebalancing of the economy has started
Despite the tightening in monetary and fi scal policy, domestic demand held up in 2011 thanks
to a marked rebalancing in favour of consumption, which accelerated (Figure 1.3). For the fi rst
time in a decade, the share of overall consumption in real GDP rose, albeit very modestly. Retail
sales rose nearly 12% in real terms, bolstered by strong increases in household income. For the
year, real household incomes rose by an estimated average of slightly above 10%, with even larger
gains in rural areas. Labour incomes rose strongly, especially for rural migrants whose income
was boosted by large minimum wage hikes, including in key export provinces such as Guangdong
and Jiangsu, which saw nominal increases of around 19% and 15% respectively.

4 CHINA IN FOCUS: LESSONS AND CHALLENGES © OECD 2012
CHAPTER 1: MACROECONOMIC OVERVIEW
Figure 1.3 Contributions to GDP growth
Source: CEIC.
The tightening in monetary policy did have a signifi cant impact on capital formation whose
growth slackened to 10½ per cent. The property sector was a weak spot, refl ecting the measures
undertaken to cool prices. Sales were stagnant for much of the year before declining sharply in
December. The supply of properties on the market continued to accelerate though and as a result
the stock of unsold properties rose through the year. Developers reacted by cutting the growth
of new construction (Figure 1.4). Property prices levelled off around mid-year though while
sharp falls were seen in some market segments, nationally prices did not decline markedly. The
weakness of the commercial market was, however, partially offset by the rollout of a government
social housing scheme involving the construction of 36 million new dwellings over five years
which, at the time of the announcement, amounted to around 20% of the country’s urban stock of
housing. The government aimed to commence around 10 million dwellings in 2011 and a further
7 million in 2012.
Chinese exports grew well below their trend rate in 2011, registering a gain of under 10% for
the year as a whole. In part this stemmed from domestic infl ationary pressures which pushed up
export prices substantially faster than prices of other countries’ exports. It also refl ected weak
demand from abroad. In Europe, a tentative recovery stalled, as renewed concerns surrounding
sovereign debt sustainability and broader fi nancial sector instability hit confi dence, while fi scal
consolidation sapped demand and imports fell at an annual rate of nearly 10% in the six months
to November 2011. In the United States, growth was stronger but labour markets remained
relatively weak, with unemployment moderating only gradually from high levels. In Japan,
the economy suffered a major setback on account of disruptions associated with the March
earthquake and the ensuing nuclear accident.
Exports also slowed in other large emerging economies, notably in India and Brazil, where
growth slipped below trend rates in the second half of the year. As the global slowdown
intensified in the second half of the year, Chinese exports were hit hard, barely showing any
increase. Indeed, by the fourth quarter of 2011, the level of exports was lower than in the second
quarter.

5 CHINA IN FOCUS: LESSONS AND CHALLENGES © OECD 2012
CHAPTER 1: MACROECONOMIC OVERVIEW
Figure 1.4 Housing sales and property under construction
12 month change of a three-month moving average
Source: CEIC.
Overall, the foreign sector contributed little to growth in 2011. The growth of imports was
slightly faster than that of exports. Moreover, with the terms of trade worsening, the trade surplus
fell to 2.2% of GDP (Figure 1.5). Accordingly, the current account surplus shrank, to 2¾ per cent of
GDP in 2011 and in absolute terms is estimated to have fallen by one quarter from its 2010 level.
In the final quarter of the year, the diminishing surplus, together with an appreciation of the
euro, led to a small decline in the dollar value of the foreign exchange reserves, the fi rst quarterly
decline in over a decade.
Figure 1.5 The trade balance and terms of trade
Three-month moving average
Source: CEIC and OECD estimates.

6 CHINA IN FOCUS: LESSONS AND CHALLENGES © OECD 2012
CHAPTER 1: MACROECONOMIC OVERVIEW
Growth will remain sub-par
Real GDP growth is expected to remain below 9% in 2012, but to pick up later in the year and
into 2013 as conditions in the global economy gradually improve. There are some indications that
the production cycle may have bottomed out, with the purchasing managers’ index and industrial
production recently posting modest improvements. However, the OECD’s Composite Leading
Indicator is still suggesting that growth will remain sub-par in the fi rst half of 2012 (Figure 1.6 and
Box 1.1). Indeed, prospects for external demand are poor. As detailed in the OECD’s latest Economic
Outlook (OECD, 2011), the weakness in the global economy is likely to persist, particularly in
Europe. This will continue to weigh on Chinese growth, which is expected to remain below trend
through the fi rst half of this year. The loss in momentum in the property sector will hold back
construction, as well as key supply sectors such as cement and steel. Property sector weakness
will also impact on demand through weaker revenues to local governments, which rely heavily
on the proceeds of land sales. With less demand from developers, local authorities have reduced
sales of land development rights and, rather than reduce prices, have often cancelled auctions
when offers have failed to reach their reserve price. Lower revenues are likely to feed through into
a mix of reduced public sector infrastructure investment and increased borrowing in 2012.
The government has already announced a number of measures to stimulate the economy. It
raised tax thresholds and tax brackets in September 2011, lowering the number of taxpayers to
24 million from 84 million previously, at a cost of 0.3% of GDP. In January 2012, it also announced
a 10% increase in all social security and government pensions at a cost of 0.4% of GDP. If fully
spent, these measures could raise private consumption by over 2%. In addition, construction work
on the affordable housing scheme will rise, following the start of a 10 million apartments in 2011.
In order to fi nance this construction, the government is urging banks to lend to local authorities
on concessional terms. It is also considering using some of the dividends from state-owned
companies to support social housing.
With demand in China remaining strong compared to other major economies, and with
competitiveness expected to deteriorate mildly on account of relatively high infl ation, the current
account surplus should remain low.
Figure 1.6 Cyclical developments: the OECD leading indicator and the national PMI
Source: OECD Main Economic Indicators Database and CEIC.

7 CHINA IN FOCUS: LESSONS AND CHALLENGES © OECD 2012
CHAPTER 1: MACROECONOMIC OVERVIEW
The near-term priority for the authorities will be to ensure growth starts to recover during
2012. This will require macroeconomic policies that counter heightened external uncertainty
and weakness. Monetary policy should be eased by lowering reserve ratios and reducing
regulated interest rates which would help bolster demand later this year. The stance of fiscal
policy also needs to be reversed. The apparent objective of returning the national government
budget to balance, and running a general government surplus, should be changed. Indeed, given
the medium-term trajectory for continued rapid economic growth, and the low cost of public
borrowing, the national government could run a defi cit of 2% of GDP with little, if any, increase in
the debt-to-GDP ratio.
Box 1.1. The OECD Composite Leading Indicator for China
The OECD Composite Leading Indicators (CLIs) are designed to provide early signals of turning points in the fl uctuations of economic activity around its long term trend, commonly referred to as the “business cycle”. The approach, which focuses on turning points (peaks and troughs), results in CLIs that provide qualitative rather than quantitative information on short-term economic movements. They measure early stages of production, respond rapidly to changes in economic activity, are sensitive to expectations of future activity or are control variables that measure policy stance.
The CLI for China has performed well in providing early signals of turning points in the fl uctuations of economic activity as measured by the Index of Industrial Production (see Figure 1.6).
The CLI for China is constructed from a small number of economic time series that display similar cyclical fluctuations to those of the business cycle, yet have a tendency to turn earlier. Seven are used for China: the production of chemical fertilizer; a monetary aggregate (M2); the production of crude steel; the overseas orders as captured in a business tendency survey; the construction of buildings; the production of motor vehicles; and the Shanghai Stock Exchange turnover. All are from the National Bureau of Statistics (NBS), except for the overseas orders (People’s Bank of China data) and the stock exchange turnover (Shanghai Stock Exchange data).
In the area of macro-economic data, the OECD has cooperated with the NBS since 1996. Workshops have been held to assist China in using accepted international standards and defi nitions as defi ned by the System of National Accounts. The NBS now publishes internationally-comparable, annual national accounts data, including some historical series dating from 1970. The NBS has also worked with the OECD to develop Quarterly National Accounts. Initial estimates are under review and should be publicly released in the near future, thus providing China with more timely indicators for reliable measurement of its economic progress.
The economy faces risks form the property sector and the external environment
The economy faces considerable risks stemming from the property sector. The moderation
in property prices is to be welcomed. However, buyers are continuing to hold back from making
purchases and an overhang of unsold stock is creating pressures for developers. In turn, rising
losses could lead to fi nancial sector stress. Although the exit of small developers is unlikely to
pose a problem, the failure of larger operators would put some bank lending at risk, which could
trigger negative spillovers. These would be accentuated by the popularity of advance purchases
amongst buyers who could be exposed to signifi cant paper losses in the event of price falls and
might fi nd buildings were not completed in the event of a developer failing. In addition, although
rapid urbanisation and rising incomes should ensure a prompt return to market equilibrium, a
8 CHINA IN FOCUS: LESSONS AND CHALLENGES © OECD 2012
CHAPTER 1: MACROECONOMIC OVERVIEW
persistent excess stock would lead construction activity to continue to slow, further weakening
demand. So far the balance sheets of the major commercial banks remain strong, with the stock
of non-performing loans low. However, as unprofi table investments are exposed this may change.
At the recent National Financial Work Conference, the authorities emphasised the need to step
up financial sector reforms while minimising systemic risks, including addressing bad debts
accumulated by local authorities and strengthening fi nancial sector regulation.
A significant additional risk facing the Chinese economy is that external demand would
weaken further if growth prospects elsewhere continue to deteriorate. Across advanced
economies the situation in Europe remains a key concern, with the euro area likely to have
entered a mild recession. If measures to contain sovereign debt and broader financial sector
problems fail to succeed, the feedback to the real economy could result in severely impaired
growth. In the United States, fiscal policy remains highly uncertain, as are the effects on the
broader economy as stimulus is withdrawn. In Japan, the risk of a rise in long-term borrowing
costs for the government is being compounded by delayed fi scal consolidation. In addition, delays
in re-opening power plants could constrain growth.
The framework for monetary and exchange rate policy needs improvement
Monetary policy would be more effective if the government took further steps to promote
a more market-oriented monetary policy framework (OECD, 2010). The current quantity-based
approach that targets money growth and imposes loan quotas has several disadvantages, notably
higher volatility in interbank interest rates and a reduction in competition. Greater reliance on
market mechanisms would promote smoother and improved monetary policy transmission. The
ability of the central bank to rely on quantitative methods of controlling the growth of money
and credit is becoming progressively weaker because capital markets are an increasing source of
fi nance.
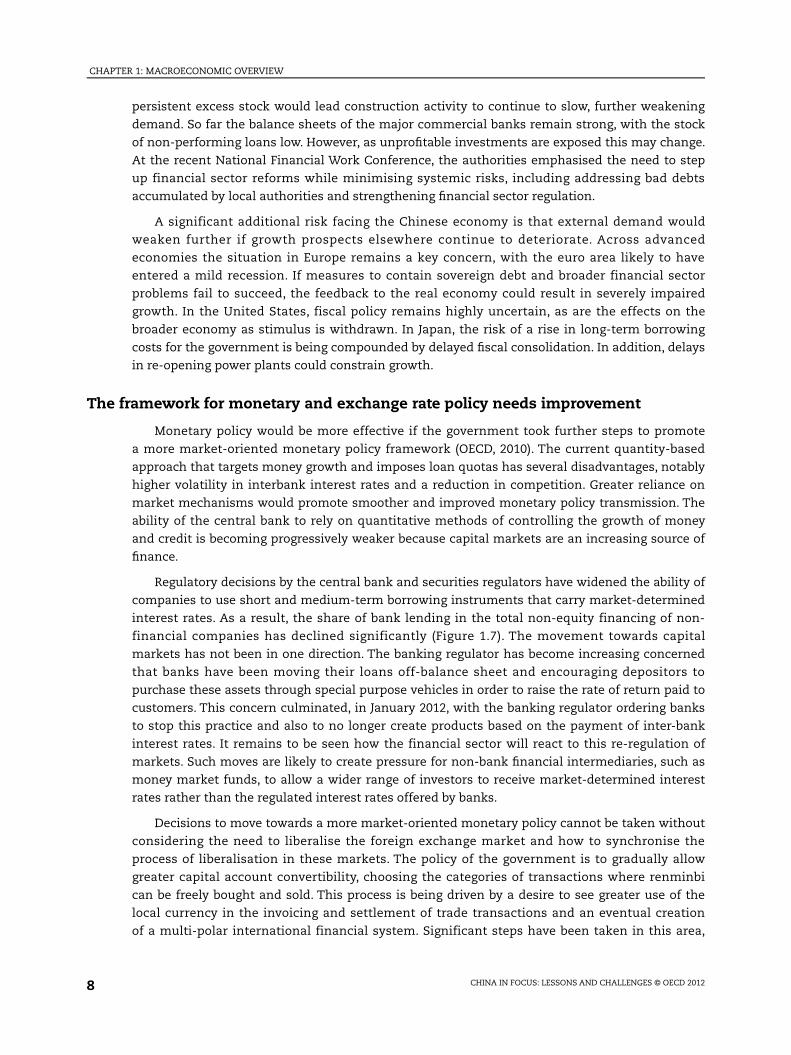
Regulatory decisions by the central bank and securities regulators have widened the ability of
companies to use short and medium-term borrowing instruments that carry market-determined
interest rates. As a result, the share of bank lending in the total non-equity financing of non-
financial companies has declined significantly (Figure 1.7). The movement towards capital
markets has not been in one direction. The banking regulator has become increasing concerned
that banks have been moving their loans off-balance sheet and encouraging depositors to
purchase these assets through special purpose vehicles in order to raise the rate of return paid to
customers. This concern culminated, in January 2012, with the banking regulator ordering banks
to stop this practice and also to no longer create products based on the payment of inter-bank
interest rates. It remains to be seen how the financial sector will react to this re-regulation of
markets. Such moves are likely to create pressure for non-bank fi nancial intermediaries, such as
money market funds, to allow a wider range of investors to receive market-determined interest
rates rather than the regulated interest rates offered by banks.
Decisions to move towards a more market-oriented monetary policy cannot be taken without
considering the need to liberalise the foreign exchange market and how to synchronise the
process of liberalisation in these markets. The policy of the government is to gradually allow
greater capital account convertibility, choosing the categories of transactions where renminbi
can be freely bought and sold. This process is being driven by a desire to see greater use of the
local currency in the invoicing and settlement of trade transactions and an eventual creation
of a multi-polar international financial system. Significant steps have been taken in this area,
9 CHINA IN FOCUS: LESSONS AND CHALLENGES © OECD 2012
CHAPTER 1: MACROECONOMIC OVERVIEW
notably by the greater willingness of the authorities to allow an active market for the renminbi in
Hong Kong, China. From the second half of 2010 onwards, a series of measures were taken by the
People’s Bank of China and Hong Kong Monetary Authority to facilitate the growth in this market.
Figure 1.7 Borrowing by non-fi nancial companies by source
% of total
Source: CEIC.
The size of the offshore market rose very rapidly following these joint moves. By December
2011, 18 months after the liberalisation, almost one-eighth of Chinese foreign trade was settled
in renminbi (Figure 1.8). This generated strong growth in outstanding renminbi deposits in Hong
Kong, China, though they still amount to less than 1¼ per cent of Chinese GDP. Recently, the
growth of the offshore banking system moderated perhaps due to the levelling-off of the share
of trade settled in renminbi and the diffi culty in fi nding assets in which to invest the deposits.
It is effectively constrained to place most of its funds with the Chinese central bank at a penalty
rate. China has maintained strict inward investment controls, despite easing outward controls.
However, in order to develop the offshore market, the Chinese authorities allowed mainland
borrowers to issue a greater amount of renminbi-denominated bonds and, in principle, permitted
the fi nancing of inward FDI with offshore renminbi loans. The authorities are unlikely to allow
unconstrained lending to mainland enterprises by offshore banks as this would put downward
pressure on regulated lending rates on the mainland. Such confl icts suggest that an integrated
approach to capital account and interest rate liberalisation is needed. Instead, the government is
leaving interest rate deregulation to the end of the process. An incremental approach to reform
could focus first on deregulating bank interest rates at a one-year maturity and longer, which
would also allow higher returns for savers.
The need to reform exchange rate arrangements also remains. The authorities have stated
that their exchange rate policy is guided by the value of the currency against a basket of
currencies. Nevertheless, it moves much more smoothly against the dollar than in effective

10 CHINA IN FOCUS: LESSONS AND CHALLENGES © OECD 2012
CHAPTER 1: MACROECONOMIC OVERVIEW
terms (Figure 1.9). Tying the value of the currency to the dollar means that fl uctuations in that
currency’s value directly impact the Chinese economy, even though the cyclical positions of the
US and Chinese economies may differ substantially. By linking the renminbi strongly to the dollar,
the authorities lose the ability to control the overall value of their own currency. This may lead to
policy confl icts. A period of dollar weakness (and hence renminbi weakness) may coincide with
the need to tighten monetary policy due to rising infl ation. In this situation, a policy to linking
to the dollar would run against domestic needs, cutting off a powerful instrument for reducing
infl ation.
Figure 1.8 Offshore renminbi deposits and trade settlement in renminbi
Source: Hong Kong Monetary Authority and CEIC.
The shortcomings of the existing policy approach were highlighted during the past 18
months. The renminbi appreciated steadily against the US dollar from mid-2010 to mid-2011.
However, its effective exchange rate declined, which added to domestic infl ationary pressures.
The authorities appear to have responded by reducing the pace at which the renminbi was
allowed to appreciate against the dollar, from an annual rate of around 5% to just 2% by the
beginning of 2012. Indeed, at one point, the offshore market was pricing a future depreciation
of the renminbi against the dollar. As a result, from the mid-2011 onwards, though, the effective
exchange started to appreciate, rising by nearly 9% in the six months to December 2011. The
apparent greater attention to the movement of the effective exchange rate is a step in the right
direction of greater fl exibility. However, it needs to be applied symmetrically and not just when
the effective rate is appreciating.
Going forward, improved exchange rate flexibility will help the economy better absorb
shocks, thereby promoting greater macroeconomic and fi nancial stability. Until recently, greater
fl exibility of the exchange rate would have been synonymous with a sharp rise in the exchange
rate which would have been disruptive in the short term. However, the upward pressure on the
exchange is easing to some extent. The current account surplus is declining and Chinese state-
controlled enterprises are increasingly investing abroad, offsetting FDI inflows, while earnings
on accumulated foreign investments are being limited by low interest rates worldwide. The

11 CHINA IN FOCUS: LESSONS AND CHALLENGES © OECD 2012
CHAPTER 1: MACROECONOMIC OVERVIEW
easing of upward pressures gives the authorities the chance to pursue an integrated policy of
capital account liberalisation, reduced intervention in exchange rate markets and interest rate
deregulation. Such a policy would be line with the goals of the 12th Five-Year Plan (FYP).
Figure 1.9 Nominal and effective exchange rate of the renminbi
Source: CEIC, Bank for International Settlements.
The fi scal framework needs to be strengthened to meet economic and social objectives
Over the past few years the role of fiscal policy has come under the spotlight. There is
however little information in the public domain as to how fiscal policy is implemented. The
budget is presented to the National People’s Congress three months into the fiscal year, in
marked contrast to many OECD countries where the budget is discussed in advance of the fi scal
year. There is no line-by-line disclosure of spending, with only broad expenditure headings being
made public and even less information being disclosed at the local level. The budget for the social
security system is not made public at the same time as the national budget, despite its revenues
representing one-sixth of total government receipts. Finally, the existence of over 10,000 local
corporations, often largely fi nanced by off-budget transfer of land-use rights and subsidies, is not
acknowledged in the government accounts as occurs in some OECD countries.
Improving the fiscal policy framework would strengthen credibility and effectiveness. As a
fi rst step, the scope of the budget presented to the National People’s Congress should be widened
to cover all areas, including social security and outlays by local government infrastructure
companies. For off-budget borrowing at the local level, a clear strategy needs to be implemented
setting out how this debt will be financed and which institutions will bear the cost of any
eventual default. The challenge of managing this burden, while fi nancing much of the affordable
housing scheme and having limited avenues for boosting revenue, will restrict the ability of local
governments to provide additional fi scal stimulus.
Local governments are responsible for funding many essential services but face limited
avenues for raising revenue and have recently experienced financial pressures owing to the

12 CHINA IN FOCUS: LESSONS AND CHALLENGES © OECD 2012
CHAPTER 1: MACROECONOMIC OVERVIEW
downturn in the property market. At the same time, the central government has a relatively
light debt burden and enjoys buoyant tax revenues, suggesting that reforms in revenue-
sharing between central and local governments are needed. Looking ahead, reforms need to be
implemented to ensure that fi scal policy can more effectively serve the twin objectives of aiding
macroeconomic stabilisation and providing adequate resources to fund a wide range of social
expenditures. As underscored in the 12th FYP there is a vast demand for increased spending on
education, health and retirement incomes as well as on further upgrading and expansion of
physical infrastructure.
Medium-term challenges
Rebalancing is occurring gradually
Considerable progress has been made in rebalancing the economy in the past fi ve years. The
current account surplus has shrunk from a peak of over 10% of GDP in 2007 to around 3% in 2011,
and growth has become less dependent on external demand. Indeed, over the past five years,
net exports have made a negligible contribution to growth, which has been driven by domestic
demand. Thus far, the adjustment towards domestic demand has almost entirely refl ected strong
public infrastructure investment that has been financed off-budget and has not been reined
back once the recovery was in place. Since the start of the world financial crisis, the share of
investment in GDP has risen by over fi ve percentage points, while the share of consumption has
fallen by two percentage points. On budget public expenditure has been increased also, notably in
social areas since 2008 but this contribution to rebalancing has been partially offset by a marked
reduction in the budget balance that has been reduced and turned to a surplus in 2011 (Figure 1.10).
Figure 1.10 Government expenditure and the budget balance
Source: CEIC.
As noted above, there are signs that the fall in the share of consumption in demand has
been stopped. Its marginal increase in 2011 can be partly attributed to improvements in social
safety nets reducing the need for household precautionary savings. In particular, the widening
coverage of public medical insurance has reduced the private share of spending on healthcare,

13 CHINA IN FOCUS: LESSONS AND CHALLENGES © OECD 2012
CHAPTER 1: MACROECONOMIC OVERVIEW
while pension schemes have been boosted and broadened, notably in rural areas (see Chapter
7 in this volum e). Going forward, reforms to further expand the provision of social services will
continue to promote rebalancing towards domestic demand and consumption, as well as other
government objectives including lowering inequality (Kerdrain et al., 2010). Continued strong
gains in labour earnings will also help to boost consumption growth. So would improved access
to consumer credit. Financial sector reform also has a key role to play in reducing high corporate
savings. As access to bank lending can be uncertain, firms often choose to retain earnings in
order to fi nance their investments directly.
In the 12th FYP the government is aiming to expand the share in the economy of a number
of priority sectors. Many of these focus on high-end, technologically advanced manufacturing.
In addition, the FYP aims to encourage the growth of business services and to boost the overall
share of the tertiary sector in GDP by four percentage points. The growth of a number of service
sectors, particularly retail and finance, can play an important role in aiding rebalancing by
supporting consumption. To support the growth of these sectors the government should focus
on further building human capital, as well as implementing structural reforms to encourage the
emergence of dynamic new fi rms.
Growth needs to become greener
An additional priority is to rebalance the economy towards greener modes of consumption
and production. As in other fast-growing emerging economies, China is experiencing rising
pollution and environmental degradation, which is generating mounting costs, not least for
human health. Large sections of major river systems suffer from high levels of pollution, as
does the air in many of China’s largest cities. Given the tendency for many types of pollution
to spill across national boundaries, tackling environmental issues also has important global
ramifi cations, particularly with respect to climate change as China has been the leading producer
of greenhouse gases since 2005, emitting 40% more than the United States in 2008 (IEA, 2011).
The challenge for the authorities is to decouple environmental degradation from economic
development, allowing continued economic progress and a drive towards greater prosperity while
reducing the environmental impact. In this regard, the work undertaken at the OECD to develop
green growth strategies may prove of help to the Chinese authorities (see Chapter 3 of this
volume).
Recognising this challenge, the government has taken a number of important steps to
tackle pollution and promote a more environmentally sustainable development path. New laws
have been introduced to encourage cleaner production, strengthen the role of environmental
impact assessments and promote the circular economy, including recycling (McElwee, 2011).
Key environmental protection legislation has also been modernised and amended, and new
regulations implemented to refl ect evolving needs. Governments at all levels have invested vast
sums in key environmental related infrastructure to reduce immediate sources of pollution,
notably the expansion of water and waste treatment facilities, as well as public transport
systems. As a result of these efforts, during the 11th FYP, from 2005 to 2010, signifi cant progress
was made in reducing emissions of key pollutants, including sulphur dioxide and chemical
oxygen demand (CCICED, 2011).
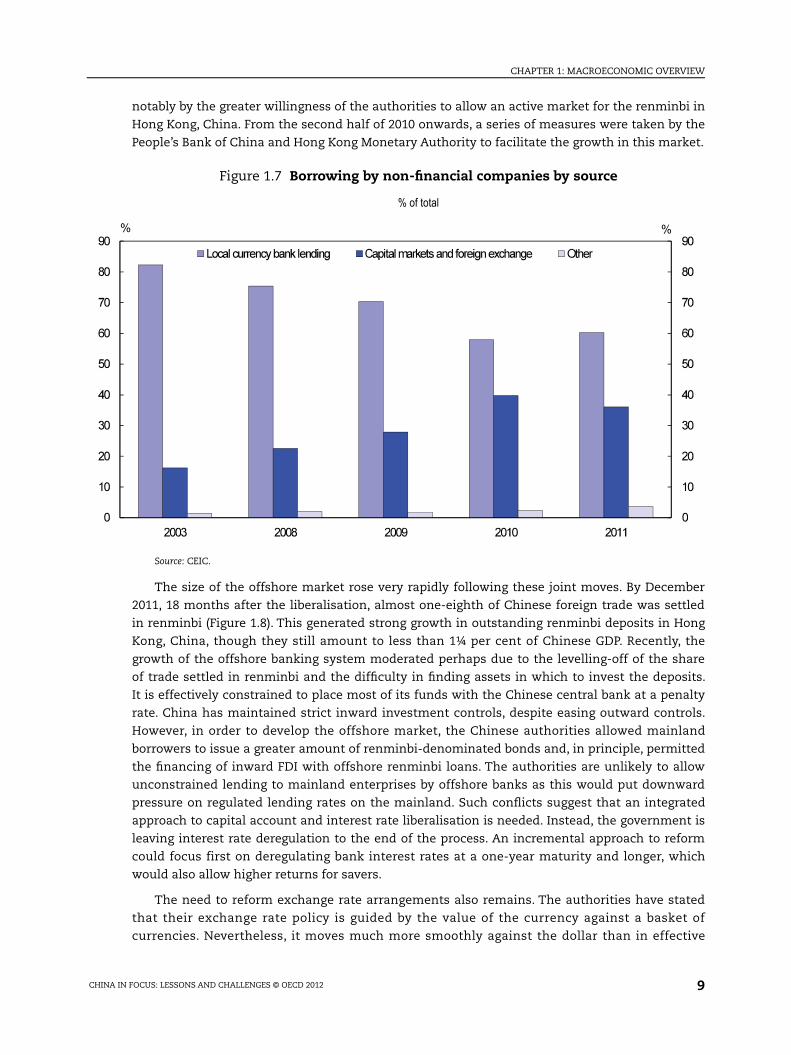
China relies heavily on fossil fuels for its energy needs, especially coal which accounts for
around three quarters of total energy production (Figure 1.11). China is expanding its nuclear
energy capacity (see Chapter 8) and the government has taken a number of steps to promote
14 CHINA IN FOCUS: LESSONS AND CHALLENGES © OECD 2012
CHAPTER 1: MACROECONOMIC OVERVIEW
renewable energy, especially solar and wind power. Fossil fuel prices have also been deregulated
so that they now refl ect prevailing international oil prices, and hence provide better signals to end
users. A number of command-and-control initiatives were also launched in the second half of the
2000s to curb energy consumption growth focussing on promoting improved energy conservation
amongst the leading industrial energy consuming fi rms, closing down outdated and ineffi cient
industrial production capacity and lifting energy standards for buildings and consumer durables
(Yuan et al., 2011). These measures ensured that after a slight rise during the 10th FYP period,
energy intensity resumed a downward trend in the second half of the 2000s.
Figure 1.11 Energy production and energy intensity, 1990-2010
Note: Energy intensity defi ned as total energy consumption divided by real GDP.
Source: China Statistical Yearbook and CEIC.
However, signifi cant challenges remain, and the government has committed to a variety of
environmental targets in the 12th FYP which will require broad-based reforms. Though per-capita
carbon emissions in China remain below the levels of advanced economies, the Chinese economy
is relatively carbon and energy intensive. The government is implementing pilot CO2 emissions
trading schemes in selected provinces that could eventually be used as the basis of a nationwide
scheme that would have the potential to control emissions in a cost-effective manner. Better
price signals could also be used to conserve resources. Electricity prices remain tightly regulated
and have been kept low despite rising generation costs, while water charges also need to be
reformed. Efforts to better regulate key pollutants, including through better enforcement, also
need to be stepped up. Finally, over the medium and longer run there are complementarities to be
exploited between reforms that will aid environmental and broader economic rebalancing. Most
notably, a shift away from construction and manufacturing towards less energy intensive and
polluting service sectors will help meet environmental goals.
BIBLIOGRAPHY
CCICED (2011), Assessment Report on Pollution Reduction in the 11th Five-Year Plan, CCICED Task Force

15 CHINA IN FOCUS: LESSONS AND CHALLENGES © OECD 2012
CHAPTER 1: MACROECONOMIC OVERVIEW
Report, Beijing.
IEA (2011), Emissions of CO2, CH4, N2O, HFC, PFC and SF6, 2009 Edition, accessed through OECD.Stat
Kerdrain, C., I. Koske and I. Wanner (2010), “The Impact of Structural Policies on Saving, Investment and Current Accounts”, OECD
Economics Department Working Papers, No. 815, OECD.
McElwee, C. (2011), Environmental Law in China, Oxford University Press, New York.
OECD (2010), OECD Economic Survey of China, OECD, Paris.
OECD (2011), OECD Economic Outlook, Vol. 2011/2, OECD, Paris.
Yuan, J., J. Kang, C. Yu and Z. Hu (2011), “Energy Conservation and Emissions Reduction in China - Progress and
Prospective”, Renewable and Sustainable Energy Reviews, Vol. 15, Issue 9.

16 CHINA IN FOCUS: LESSONS AND CHALLENGES © OECD 2012
CHAPTER 2: INEQUALITY: RECENT TRENDS IN CHINA AND EXPERIENCE IN THE OECD AREA
Chapter 2:
Inequality: Recent Trends in China and Experience in the OECD Area
Introduction
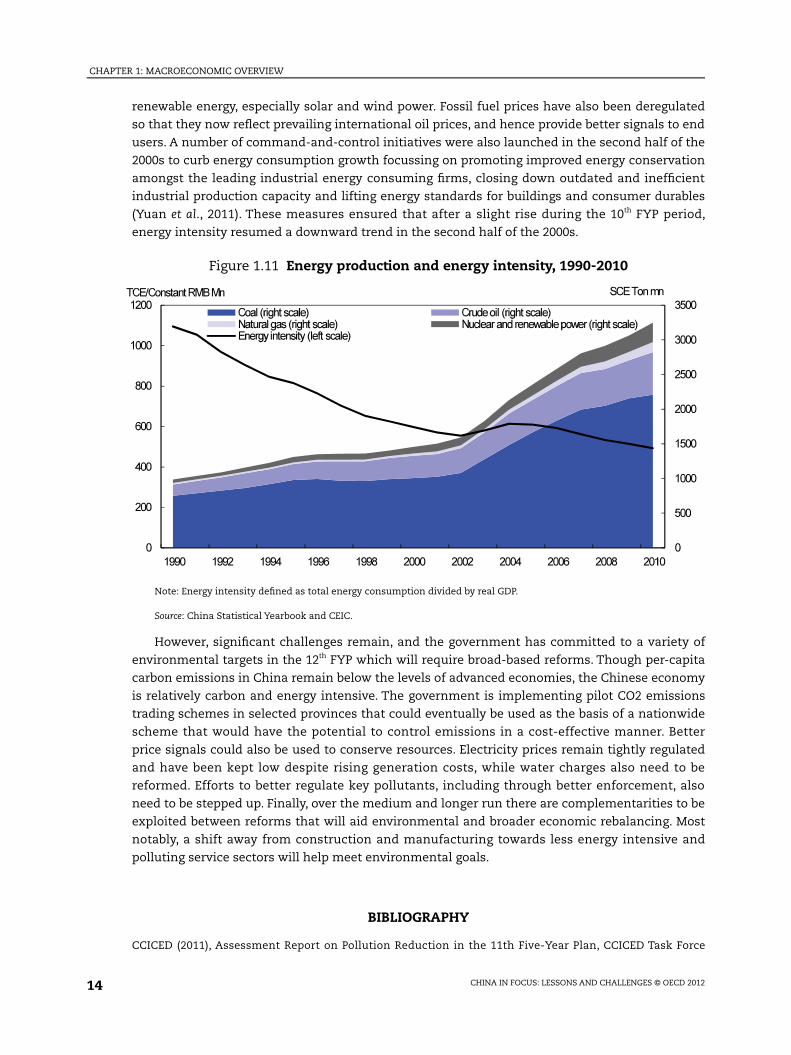
Over the past two decades, China has moved towards a market-oriented economy. Such
a transformation initially entailed a marked rise in inequality, which was an inevitable
consequence of the transformation of the economy that has delivered a higher and more
sustained growth in incomes than observed in any other major economy. Since around 2005, the
government has increasingly focused on the creation of a more harmonious society. The new
emphasis in government policy was implemented during the 11th Five Year Plan (2006-10) and
has resulted in a reduction in inequality across a number of dimensions. By 2010, the number
of people below the poverty line of $1.25 per day (converted at purchasing power parities) had
fallen by more than 150 million from ten years previously, leaving just 6% of the rural population
with incomes below this level. In addition during the period of the Plan, income inequality in the
urban and rural population has fallen, the urban-rural income gap has narrowed and the lower-
income provinces have started to grow more rapidly than higher-income regions. At the same
time, the coverage of social protection systems has been widened and total spending on social
protection has soared.
As Chinese incomes rise, the emphasis on social policy may shift towards reducing inequality
by redistributing income. Indeed, by 2010, income levels in major Chinese cities, which house
around one-quarter of the population, approached $12,000 per person when evaluated at
purchasing power parities – an income level not far from that in a number of OECD member
countries. Consequently, the experiences of policies designed to reduce inequality in the OECD
area could become increasingly relevant for designing policies in China. Given that the level of
inequality may not fall automatically as the economy grows, policymakers may thus be interested
in the approaches to reducing inequality that have been adopted within the OECD area and the
consequences that these policies may have had on inequality and overall economic growth.
The remainder of this chapter first documents the movement in inequality in China over
the period since reform and opening up gained momentum, focusing on developments since
2005. It then compares the extent of social protection and the social expenditure in relation to
other emerging economies. Finally, the chapter considers the lessons with respect to growth
and inequality that can be drawn from the experience of OECD members, focussing on the areas
17 CHINA IN FOCUS: LESSONS AND CHALLENGES © OECD 2012
CHAPTER 2: INEQUALITY: RECENT TRENDS IN CHINA AND EXPERIENCE IN THE OECD AREA
where it is possible to both reduce inequality and improve growth. This chapter draws on the
results in two recent OECD publications Going for Growth and Divided We Stand and the related
background papers.
Trends in inequality
As a result of the pace of transformation of the economy, the distribution of incomes changed
much more rapidly in China than in other emerging economies. The extent to which the incomes
of the higher quintile grew faster than the lower quintile was particularly marked in the urban
areas of China, where they grew twice as fast (Figure 2.1). Nonetheless, the growth in the real
incomes of the lowest quintile in China was more rapid than that of any quintile in the other
emerging economies considered here, generating a very rapid decline in poverty.
Figure 2.1 Change in real household income by quintile between the early 1990s and the late 2000s1
Average annual percentage change
1. Figures for the early 1990s generally refer to either 1992vor 1993, while fi gures for the late 2000s refer to the period around 2008.
Source: OECD (2011a) -EU Database on EEs and World Bank Development Indicators Database.
In the early 1990s, China’s income distribution was much more equal than that of other
emerging economies. Although income disparities rose rapidly in China, by the end of the past
decade the overall level of inequality in China was still lower than in nearly all the emerging
countries, with only Turkey showing a marginally lower level. Inequality was higher, however,
than that in the more advanced OECD countries (Figure 2.2).
In China, as the move towards a market economy became more complete, the rise in
inequality eased. In fact, it appears to have stopped around 2005 and may have even been
reversed in recent years, not least thanks to tax reform and improvements in the social safety net
(Herd, 2010).

18 CHINA IN FOCUS: LESSONS AND CHALLENGES © OECD 2012
CHAPTER 2: INEQUALITY: RECENT TRENDS IN CHINA AND EXPERIENCE IN THE OECD AREA
Figure 2.2 Change in inequality levels, early 1990s versus late 2000s1
Gini coeffi cient of household income
1. Figures for the early 1990s generally refer to 1993, whereas fi gures for the late 2000s generally refer to 2008.
Source: OECD-EU Database on Emerging Economies, World Bank Development Indicators Database.
In the period of the 11th Plan, the poorer groups in the urban areas experienced more rapid
growth in income that the better-off groups, with the real incomes of the lowest decile rising by
10.6% annually against an increase of 9.3% for the highest decile. Such movements have resulted
in a fall in the Gini coefficient in urban areas (Figure 2.3), though this movement may have
been overstated by the increasing diffi culty in sampling high-income households and obtaining
accurate data about their disposable income. Inequalities in rural areas have also diminished,
thanks to a number of government policies such as the removal of agricultural taxes and fees in
2006. More recently in 2010, government cash transfers to the lowest income quintile rose 30%
from the previous year.
The difference between average incomes in rural and urban areas is an important
determinant of overall national inequality in China and has fallen recently. The extent of this
difference is particularly high in China and had been rising steadily until recently. By 2009, the
ratio had reached 3.3, which is much higher than in other emerging economies such as India,
where the ratio of consumption between urban and rural households was just under 2 in 2009.
Since then, however, the rural-urban income gap in China has started to fall and by 2011 had
dropped back to its level of 2003. The fall has been helped by a rapid increase in the number of
migrants whose income is counted as being rural income, even if they are working in urban areas
provided that their families remain in the countryside. There has also been a major increase
in the extent of government transfers to the less well-off in rural areas. In addition to income
discrepancies, there are great disparities in access to basic services, such as education, between
rural and urban populations (OECD, 2010b).

19 CHINA IN FOCUS: LESSONS AND CHALLENGES © OECD 2012
CHAPTER 2: INEQUALITY: RECENT TRENDS IN CHINA AND EXPERIENCE IN THE OECD AREA
Figure 2.3 Inequality drops in urban and rural areas
Gini coeffi cient of disposable income per capita
Source: National Bureau of Statistics and National Development and Reform Commission, except for urban incomes from 2008 to 2010 which have been estimated by the OECD.
Figure 2.4 The gap between rural and urban incomes narrows
Ratio of urban to rural disposable income
Source: ChinaDataOnline from National Bureau of Statistics.
Regional inequality has been declining in the past fi ve years. The forces underlying regional
inequality are diffi cult to disentangle and often overlap. They typically involve the interplay of
geographic, historical and institutional factors such as weak resource endowments and distance
from markets, which

20 CHINA IN FOCUS: LESSONS AND CHALLENGES © OECD 2012
CHAPTER 2: INEQUALITY: RECENT TRENDS IN CHINA AND EXPERIENCE IN THE OECD AREA
Figure 2.5 Low-income provinces have grown faster than high-income provinces between 2005 and 2010
Source: GDP: CEIC; provincial population: National Bureau of Statistics.
constrain development in lagging regions. Nonetheless, in the fi ve years to 2010, the extent
of regional inequality has been declining in China. In part this development reflects rapidly
increasing wages in coastal provinces which has incited companies to relocate factories away
from coastal areas, as well as the emphasis on infrastructure spending in inland areas during the
past fi ve years (OECD, 2010c).
The causes of inequality in China
The key sources of inequality in China, as in other emerging economies, include geographical
factors, a large and persistent informal sector, gaps in access to education, and barriers to
employment and career progression for specific groups, particularly rural migrants. The
inequality between rural and urban areas are linked with disparities in access to basic services
– such as medical insurance and education (Herd, 2010) – and institutional factors – notably, the
hukou system which prevents rural and urban migrants from acquiring the same rights as people
with the local urban registration status in the area in which they live (Herd et al., 2010). The
incidence of informal employment is also an important parameter of inequality and is related to
the segmentation of labour markets.
The social protection system has been widened but is far from universal
Social policy has helped raise the incomes of the poorest groups in society during the past
fi ve years. Government social expenditure spending in China has been rising rapidly since 2006
refl ecting the change in emphasis that started during the period of the 11th Plan. In the fi ve years
to 2011, social outlays have almost tripled in real terms, rising to nearly 8% of GDP. Such growth
has pushed outlays above those in many emerging economies (Figure 2.6).

21 CHINA IN FOCUS: LESSONS AND CHALLENGES © OECD 2012
CHAPTER 2: INEQUALITY: RECENT TRENDS IN CHINA AND EXPERIENCE IN THE OECD AREA
Figure 2.6 Public social expenditure in China and selected emerging economies1
Total public social expenditure as % of GDP
1. Policy areas covered include old-age and survivors pensions, incapacity-related benefi ts, family, health, active labour market policies, unemployment and in some cases (but not China) housing.
Source: OECD countries the SOCX database; for non-OECD countries other than China see Chapter 2 of OECD (2011a) and http://www.oecd.org/dataoecd/45/62/48654927.pdf ; for China: China Statistical Yearbook and CEIC.
On the other hand, social expenditure is much lower than in Brazil and Russia, where outlays
on social programmes reach levels typical of countries with much higher incomes.
The bulk of the increase in expenditure in this period has gone towards extending the
coverage of social programmes. Notable reforms include the generalisation of the minimum
subsistence allowance to the countryside; new medical insurance schemes for people with rural
registration status, for dependants of registered urban employees and students; the introduction
of a new pension system for people living in the countryside and one for migrant workers. The
result of the new policies has been a marked rise in coverage for the principal forms of social
protection (Figure 2.7). During the 12th Plan period (2011-2015), the government expects to
complete the roll-out of the pension system for people living in the countryside and to further
extend social protection. The first actions during the 12th Plan included the introduction of a
pension system for people in urban areas who are economically inactive and a 10% increase in
benefi t levels for those already retired at a cost of around 0.4% of GDP. Key challenges remain to
be overcome. The average level of benefi ts under many of the rural social protection schemes is
low and within urban areas many fi rms do not pay contributions for their staff as enforcement is
poor and penalties for non-compliance are almost non-existent, so employees of these fi rms are
not eligible for social benefi ts.
The system of unemployment insurance in China rests to a very large extent on severance
payments determined by the labour contract of the employee. For those workers with labour
contracts the severance payments are quite high. Indeed, if the severance pay for a worker with
four years seniority is added to the total unemployment benefi ts payable in the fi rst 12 months
of unemployment, the total unemployment package is above the average of the OECD areas

22 CHINA IN FOCUS: LESSONS AND CHALLENGES © OECD 2012
CHAPTER 2: INEQUALITY: RECENT TRENDS IN CHINA AND EXPERIENCE IN THE OECD AREA
(Figure 2.8). However, in 2010, only 4% of migrant workers were affi liated to the unemployment
insurance system and less than half had a labour contract despite the new labour law. As a result,
the proportion of the unemployed receiving benefits is under 10%, slightly below the average
in emerging economies. The extent of informal or semi-informal employment limits the ability
of unemployment insurance systems to prevent unemployment-related poverty and inequality
and increases the importance of informal insurance mechanisms. It may also impose higher
adjustment costs on people who return to work and may represent an ineffi cient use of resources
when individuals are credit-constrained.
Figure 2.7 The coverage of contributory social schemes has risen substantially
Affi liation to social security
The year of reference varies slightly from country to country.
Source: OECD calculations based on various sources for non-member countries (same as Figure 2.6) and National Bureau of Statistics (2011) for China.
There is evidence that persistent informal economic relations lead to greater income
inequality (Jütting and de Laiglesia, 2009). In China, this outcome refl ects the interplay of several
forces. First, informal jobs typically carry a wage penalty. Migrants’ pay was two-thirds that of
registered urban employees in 2010, though half of all migrant workers had free accommodation.
The gap in hourly earnings was even larger as migrants worked far more hours, though part
is accounted for by the lower human capital of migrants. Second, informal jobs are much less
stable than formal ones. Third, employers do not register migrants for social security. Fourth,
informal jobs considerably limit opportunities for human capital accumulation and career
progression. Furthermore, employment in the informal sector can also be detrimental to a
worker’s subsequent prospects for formal employment, thereby entrapping the low-skilled and
contributing to the persistence of income inequality.

23 CHINA IN FOCUS: LESSONS AND CHALLENGES © OECD 2012
CHAPTER 2: INEQUALITY: RECENT TRENDS IN CHINA AND EXPERIENCE IN THE OECD AREA
Figure 2.8 Unemployment and severance pay benefi ts
Source: OECD (2011b).
The impact of �taxes and cash transfers policies on inequality in the OECD area
Across the OECD area, there appears to be little relation between the level of economic
development and the extent of inequality. Countries with as diverse levels of economic
development as Poland and Switzerland have similar levels of inequality. Such a result has also
been found across countries with lower income levels than China (Deininger and Squire, 1998).
Figure 2.9 Inequality and income levels across OECD countries
Source: Hoeller et al., (2012)

24 CHINA IN FOCUS: LESSONS AND CHALLENGES © OECD 2012
CHAPTER 2: INEQUALITY: RECENT TRENDS IN CHINA AND EXPERIENCE IN THE OECD AREA
These results suggest that policymakers should not rely on any automatic tendency for
inequality to decline as their economy develops. Rather specifi c policies to boost the incomes of
poorer households may be needed.
Within the OECD area, the redistributive impact of taxes and transfers varies: countries
with a more unequal distribution of market income tend to redistribute more, though there are
exceptions (Joumard et al., 2012). Cash transfers reduce income dispersion more than taxes in
most OECD countries. On average, three quarters of the reduction in inequality is due to transfers,
the rest to taxes.
Figure 2.10 Redistribution tends to be higher when incomes are more unequal
0.00
0.02
0.04
0.06
0.08
0.10
0.12
0.14
0.16
0.18
0.32 0.34 0.36 0.38 0.40 0.42 0.44 0.46 0.48Gini coeffeicent of market income
Reduction in inequality from taxes and transfers
Note: The best fi t line is given y = -0.032 + 0.342x. The t statistic on the x variable is 3.0
Source: OECD Income and Poverty database
There is no single redistributive strategy favoured by OECD member governments. Countries
have adopted a wide range of policies. In some, cash transfers redistribute income mainly over
the life-cycle rather than across individuals and often account for a large share of household
disposable income. Old-age pensions often fall into this category – and their progressivity is low
in many countries, as the distribution of pensions reflects the initial distribution of incomes.
Countries with lower outlays on cash transfers tend to rely more on targeted benefi ts. A few rely
to a very limited extent on cash transfers to reduce income inequality. In most countries, the
most progressive benefits are family and housing benefits, though their redistributive impact
is limited as they are often small in size. Disability and unemployment benefi ts reduce income
inequality although their progressivity largely depends on their design.
The cross-country variation in the redistributive impact of household taxes is more limited
than that of transfers, despite large differences in tax-to-GDP ratios. High-tax countries tend to
have less progressive household taxes. The progressivity of labour taxes (including social security
contributions) has increased in the majority of OECD countries but mainly at lower income levels.

25 CHINA IN FOCUS: LESSONS AND CHALLENGES © OECD 2012
CHAPTER 2: INEQUALITY: RECENT TRENDS IN CHINA AND EXPERIENCE IN THE OECD AREA
Personal income rate schedules have often become flatter reflecting the steep decline in top
marginal tax rates, but working against this social security contributions for low-income earners
have been cut and earned income tax relief has been introduced in attempts to reduce the
adverse impact of high labour taxation and dual labour markets on young workers. On the other
hand, the redistributive impact of tax systems has been reduced by the reduction of the taxation
of capital income and wealth. The most progressive tax is that on personal income, though
there are significant cross-country variations. The most regressive taxes are social security
contributions, consumption taxes and real estate taxes.
Complementarities between policies to reduce inequality and boost growth
In a number of areas, there is clear evidence that policies designed to reduce inequality
can also boost growth. The clearest example is education policy. Human capital formation
should be facilitated in order to boost growth but the key for reducing inequality is to ensure
that the educational potential of an individual should be made less dependent on her/his
personal, social and geographic background. There is clear evidence in OECD countries that
the completion of secondary and tertiary education boosts income and this holds in China too
(OECD, 2010c). Equally, all forms of discrimination should be avoided so that the labour market
participation of women and elderly people is raised, as gender differences in working hours
and choice of occupation and sector account for a sizable part of the earnings gap. Policies
to reduce these differences (e.g. improvements in the access to childcare) could thus lead to
more equal labour market outcomes among men and women while boosting long-run growth.
Addressing inequalities in both access to, and quality of, education can be expected to help
lower inequality in labour income. This is especially the case in China, where education is seen
to play a major role in shaping household income differences between urban and rural areas,
mainly because the education levels are different but also because the related returns are higher
in cities with education helping rural people to move to cities. In addition, education needs to
be complemented by policies to ensure a smooth transition from school to work especially for
disadvantaged youth (mainly from poor households) so as to ultimately achieve a more equal
distribution of income for the future generations.
Chinese policymakers should also note that there is evidence from OECD countries that long-
run growth can be boosted and inequality reduced by integrating migrants into the labour force
and avoiding labour market dualism. This is particularly important for China. While international
migration is not sizeable, there is a need to integrate internal migrant workers into the local
population, both with respect to eligibility to existing social safety nets and with respect to
education, where OECD experience is that inequality can be reduced by ensuring that access to
all levels of education is independent of the family background of individuals.
Policymakers in China also need to guard against entrenched labour market dualism, which
places much of the adjustment burden on those in the informal part of the economy. In part
this already occurs in China, where employment protection legislation of permanent workers
is particularly stringent compared with other emerging economies and many OECD countries,
but has a limited reach among vulnerable groups such as workers in the informal sector and
rural migrants because of weak enforcement (Herd et al., 2010), so that employment protection
legislation may possibly worsen the income distribution. Reducing labour market dualism by
narrowing the gap between the protection of permanent and temporary employees should help
reduce income inequality through both a lower wage dispersion and lower unemployment.
Evidence from the OECD area suggests that lowering the protection of permanent employees

26 CHINA IN FOCUS: LESSONS AND CHALLENGES © OECD 2012
CHAPTER 2: INEQUALITY: RECENT TRENDS IN CHINA AND EXPERIENCE IN THE OECD AREA
reduces inequality. In China, there are also regulations that limit the use of temporary and fi xed-
term contracts. Relaxing restrictions on the use of such contracts and reducing fi ring costs for
young or inexperienced workers may improve incentives for fi rms to hire workers on a formal
basis. In some cases in the OECD area, partial reforms of employment protection laws may have
resulted in “two-tier” systems with high unemployment turnover for certain categories of workers
but still high overall unemployment. In the Chinese context, the dual labour market is evidenced
both by the exclusion of many workers from the social security system and by the markedly
higher wages paid by the state-owned enterprises where they are operating non-competitively.
Given that strict employment protection legislation reduces outfl ows from unemployment,
OECD experience suggests that there is a case for easing strict regulation on regular contracts,
especially where unemployment benefits are high and extended, or where unemployment
persistence is a problem. Furthermore, a dual labour market amplifi es shocks. Hence, narrowing
the differences in the degree of employment protection between different types of workers,
for instance by unifying contract types with protection rising with seniority, could boost hiring
during the recovery while at the same time improving labour market resilience to future shocks
and lowering the unemployment rate in the longer term.
Taxing in a way that allows equitable and inclusive growth
OECD experience suggests that there are a number of areas where there is a tension between
the desire to reduce inequality and the objective to promote economic growth.
The clearest example from within the OECD area is that inequality can be reduced by policies
that set high marginal tax rates on top incomes, wealth, inheritance and transfers of capital
between living individuals. However, there is evidence from within the OECD area that high
marginal tax rates could undermine incentives to work, save and invest, which can adversely
impact long-run growth (OECD, 2012). So far, tax policy is oriented to raising growth rather than
reducing inequality by keeping marginal income tax rates low. For example, the highest marginal
tax rate (45%) only applies to incomes more than 34 times the average wage, with the marginal
income tax rate for the bulk of the population is zero since September 2011 when marginal
income tax rates were reduced to zero for 60 million taxpayers, leaving only 24 million people
(3% of the working population) paying income tax on labour income. Income from investment in
bank deposits and many bonds is not taxed at all while other forms of property income, including
capital gains, are taxed at 20%. A low income tax burden also has positive effects on economic
growth as it enhances entrepreneurship and encourages foreign direct investment and education.
However, OECD experience also suggests that there are policy options that could yield a
double dividend by promoting growth and reducing inequality at the same time (Table 2.1).
Cutting back tax expenditures that benefi t mainly high-income groups (e.g. tax relief on mortgage
interest) is likely to be beneficial both for long-term growth, allowing a reduction in marginal
taxes, and for a more equitable distribution of income. Other possible options are aligning the
taxation of owner-occupied residential property more closely with actual values and returns and
a closer alignment between the tax treatment of capital gains and ordinary income.
Equally, OECD experience suggests that growth can be boosted by shifting the tax mix to less-
distorting taxes – in particular away from labour and corporate taxes to consumption taxes (OECD,
2011d). Model simulations in Table 2.1 suggest that shifting the tax burden away from direct taxes
towards consumption taxes reduces unemployment relatively quickly, particularly so for youth
and women (Ahrend et al., 2011). After a few years, such reforms also appear to trigger stronger

27 CHINA IN FOCUS: LESSONS AND CHALLENGES © OECD 2012
CHAPTER 2: INEQUALITY: RECENT TRENDS IN CHINA AND EXPERIENCE IN THE OECD AREA
female and youth participation. This indicates that improving the tax structure can have positive
labour supply and labour demand effects (OECD, 2011e). Moreover, empirical results suggest
that such reforms also boost private investment. The Chinese tax system is already based on
indirect taxation, with only one-third of total tax revenues coming from income tax and social
contributions. At the same time, taxes on consumption are associated with a widening gap
between the rich and poor. However, other changes in the tax or benefi t system could be used
to offset some of these effects on inequality such as applying a reduced VAT to necessities and
providing targeted benefi ts to those most in need. All in all, under current conditions, the role
of taxes in income redistribution remains limited. Changing this situation is likely to take time.
In China then, for the time being, reducing inequality is better addressed through well-targeted
social welfare programmes. In-work tax credits that targeted the low-income groups, for instance,
can narrow the income distribution and raise incentives to work.
Table 2.1 The impact of tax reforms on growth and equality
+ means more and - means less equality or GDP per capita; ~ denotes an ambiguous effect
Tax policies Income equality GDP per capita Comments
Increasing total tax revenues + (in general)
- • The impact of taxes on income distribution depends on the level of taxation, the tax mix and the use of tax revenues, but if tax systems are progressive overall, equality is enhanced.
• Taxes dampen incentives to work, save and invest and are thus detrimental to growth. But some taxes have a less adverse effect than others.
Changing the tax mix while keeping total tax revenues constant
Moving from personal income tax to consumption taxes
- + • Personal income tax tends to be progressive while consump-tion tax is regressive.
• Personal income tax reduces work and saving incentives. A shift from direct to indirect taxes would raise GDP per capita.
Moving from labour income to property and capital taxes:
• Wealth and inheritance taxes tend to be progressive.• The distributive impact depends on the relative progressivity of
income versus wealth and inheritance taxes.• Real estate taxes are often less progressive than the personal
income tax and can even be regressive.• Property taxes are among the least harmful for growth. Moving
from income to property taxes tends to improve incentives to work and invest, and thus to raise output, at least in the short and medium term.
• to wealth, inheritance and capital income taxes, such as capital gains taxes
~ +
• to real estate taxes - +
Cutting tax expenditures and marginal rates
+(in most cases)
-(for in-work tax credits)
+ • Most tax expenditures benefi t high-income groups (in-work tax credits and other tax expenditures targeted at low-income groups are the exception). Cutting tax expenditure would nar-row the distribution of disposable income.
• Cutting marginal rates improves incentives to work, save and invest, and thus lifts GDP per capita.
Increasing the progressivity of taxes (revenue-neutral)
• In-work tax credits narrow the income distribution and raise incentives to work.
• On the other hand, higher top rates may reduce working hours and productivity by undermining incentives to learn, invest and innovate.
• The GDP per capita impact is thus ambiguous.
Personal income tax: + ~
• increase in top rates• above measure combined with
expanded EITC schemes or tax free allowances
Source: Joumard et al. (2012).

28 CHINA IN FOCUS: LESSONS AND CHALLENGES © OECD 2012
CHAPTER 2: INEQUALITY: RECENT TRENDS IN CHINA AND EXPERIENCE IN THE OECD AREA
Dealing with the distributional consequences of short-term output fl uctuations
While long-run movements in inequality are of concern, OECD policymakers have also been
concerned with the short-term consequences of output fluctuations for income distribution.
In general, individuals on lower incomes are found to have been more strongly affected by
fl uctuations in economic activity than other income groups, suffering more from adverse shocks,
but at the same time often benefi ting more from positive ones (Table 2.2).
Table 2.2 Synthesis of empirical fi ndings on the distributional impact of macroeconomic shocks
Financial crises
increase the income share of the 3rd and 4th quintile
reduce the income share of the 5th quintile
increase poverty
worsen the relative labour market outcomes for
youths (unemployment , employment),
seniors (unemployment)
women (employment)
improve the relative employment performance of those with tertiary education
Fiscal consolidations
reduce the income share of the fi rst 1st and 2nd quintile
increase inequality (Gini coeffi cient)
increase poverty
worsen relative labour market outcomes for
youths (unemployment, employment)
seniors (employment)
Fiscal expansions
increase the income share of the 1st and 2nd quintiles
reduce the income share of the 5th quintile
reduce inequality
reduce poverty
increase income share of youth
increase income share of pensioners
enhance relative labour market performance of
youths (unemployment)
seniors (unemployment, employment)
Source: Ahrend et al. (2011).
As China has become more open and interlinked with the economies of the rest of the world,
it has become more vulnerable to external shocks in addition to the disturbances that can arise
from within its own economy. The labour market in China has proved quite resilient to external
shocks, especially those stemming from the 2008 financial crisis when there was neither an
increase in the unemployment rate nor a increase in the extent to which people withdrew from
the labour force and became economically inactive. Within the OECD area, countries rely on

29 CHINA IN FOCUS: LESSONS AND CHALLENGES © OECD 2012
CHAPTER 2: INEQUALITY: RECENT TRENDS IN CHINA AND EXPERIENCE IN THE OECD AREA
different types of institutions to cope with shocks:
• Some provide income risk sharing mainly via social-protection institutions: most
continental-European and (possibly to a lesser degree) eastern-European countries are likely
to offer a higher degree of income protection to lower-income households in the wake of
negative shocks, at the risk of generating poor labour-market performance of youth and
labour market outsiders.
• Some rely mainly on reallocation-facilitating institutions: English-speaking and Asian OECD
countries would typically fall in this second group and provide less redistribution.
• Some rely strongly on both of them: these are mainly Nordic countries, which typically
combine strong reallocation-facilitating institutions, including active labour market policies,
with well-developed social insurance. However, there are effi ciency losses associated with
the high marginal tax rates necessary to fi nance this model.
The institutional structure in China corresponds most to that seen in the second group of
OECD countries. Unemployment benefi ts are relatively low and the response of the authorities to
the labour market problems of 2009 was mostly through measures to facilitate the re-insertion of
workers that had lost their jobs (OECD / ILO, 2011).
The infl uence of institutions on the distributional implications of shocks
Analysis of the above sets of policies suggests that there is no one best set of policies
designed to reduce the distributional impact of a downturn in the economy. Some policies
that work in the short term may have undesirable consequences in the long term while other
policies may have differing impacts on effi ciency. Nearly always, it is a case of balancing equity
and effi ciency and the short and long term. The weights that different countries attach to these
elements differ. However, an analysis of the policies in place in the OECD area may be of interest
to Chinese policymakers as they continue to reform their social safety net.
The balance between a short-term gain in equity against longer-term loss in effi ciency can
be seen clearly in the experience of countries with high levels of unemployment benefit. The
negative impact of macroeconomic shocks on poorer segments of society can been dampened
by generous unemployment benefi ts, especially for the initial period of unemployment, but such
transfer payments generate a risk of adverse employment effects for certain groups, raising
both the level and duration of unemployment, unless effective activation strategies for the
unemployed are also in place.
A common fi nding across countries is that other policies designed to dampen the impact of
the macro-economic fluctuations have an adverse impact on youths. Stricter job protection is
found to have provided some income protection for lower and middle-income classes in the wake
of negative shocks but at the expense of youth employment. Equally minimum wages are found
to have benefi cial effects on inequality in the wake of certain shocks, but again often with the
opposite effect on youths.
On the other hand, a number of policies can help mitigate the impact of downturns on
youths. China already has one of the best-performing youth labour markets amongst G20
countries in terms of integrating young people into the labour market, with their unemployment
rate being twice that of the adult population (OECD / ILO, 2011). In the OECD area, lower tax
wedges on labour income are one example of a policy that can help youth employment. In
China, many young workers effectively face a tax wedge of zero. There is a range of evidence

30 CHINA IN FOCUS: LESSONS AND CHALLENGES © OECD 2012
CHAPTER 2: INEQUALITY: RECENT TRENDS IN CHINA AND EXPERIENCE IN THE OECD AREA
suggesting that high-quality vocational education pathways in upper secondary education can
help engage youth who have become disaffected with academic education and thereby improve
graduation rates and ensure smoother transitions from school to work. Countries with a long
tradition of apprenticeship systems, such as Germany, have a good performance in terms of
low youth unemployment. Indeed Germany is one of only two other countries in the G20 that
match the performance of the Chinese youth labour market. Important steps have been made in
China to enhance the employment prospects of youth and migrants through vocational training
and incentives provided to employers to retain or hire among vulnerable groups. In addition,
complementary career guidance can help youth make better informed decisions during their
school-to-work transitions and about their future, provided that it is effectively designed and
implemented. Notably it requires: i) early action in lower secondary education; ii) highly qualifi ed
guidance personnel; and iii) timely and high-quality data on local labour market needs and
employment prospects by occupation (OECD, 2010a; and OECD, 2011b). Such programmes are
urgently needed in higher-education institutions where there is evidence that many graduates
are unable to fi nd jobs that match their expectations, following the massive expansion of higher
education in the past fi ve years.
The orientation that Chinese policymakers would want to give to policies designed to improve
the social safety net will depend on the balance that is struck between equity and effi ciency. One
key aspect of improving the social safety net will be widening the coverage of unemployment
benefits and the minimum living allowance to all people who have lived and worked in a
given area. Currently unemployment benefi t levels are set locally. They vary between the level
of the minimum wage and the guaranteed minimum living income, which is also set locally.
Although its coverage increased substantially in recent years, a majority of poor households
remained uncovered. Fiscal constraints enter into the determination of local poverty lines by
local governments, with the implication that entitlements cover only part of the poverty gap. In
2011, the government announced an 80% hike in the poverty line and set a goal of meeting the
food, clothing, education, basic health and housing requirements of the poorest people by 2020.
Extension of benefi ts to the migrant population could have a signifi cant impact on equity and
increase the share of the lower incomes in the value of output. OECD experience shows that such
an extension should be accompanied by strategies for ensuring a swift return to work through
improving information fl ows in the labour market. The experiences of Brazil with Bolsa Familia
and Mexico with Oportunidades may offer useful insights to the Chinese authorities, including on
the introduction of conditionalities. By combining income support to those mostly in need with
investments in health and education they can play a major role in reducing poverty and enhance
the future (labour market) opportunities of poor households.
To ensure social stability, policies designed to protect one group in the labour market
should not have a marked adverse impact on other groups. In China, this would point to careful
evaluation of policies designed to increase minimum wages. Minimum wages can improve
inequality outcomes in downturns but can also result in fewer employment opportunities for
the marginal workers, which in China would be the poorer migrant workers from the central and
western provinces.
Reforms in product markets can also improve the income distribution
The extent of regulation of product markets has been found to be a driver of long-term
growth. This has been confirmed by analysis of the changes in the regulation in network
industries. Such structural reform has also lowered inequality. Cross-country time-series evidence

31 CHINA IN FOCUS: LESSONS AND CHALLENGES © OECD 2012
CHAPTER 2: INEQUALITY: RECENT TRENDS IN CHINA AND EXPERIENCE IN THE OECD AREA
on product market reforms in transport, energy and communication industries in the OECD area
suggests that they increase employment (Fiori et al., 2012). Inequality is reduced by this type of
structural reform through the boost given to labour force participation and employment.
While it is diffi cult to document that structural reform in network industries raises labour
force participation in China, there is clear evidence that reducing the extent of regulation in non-
manufacturing network industries brings productivity gains, even in the short term (Bas and
Causa, 2012). It also appears that trade liberalisation spurs manufacturing productivity growth,
especially for domestically-owned fi rms. Within the OECD area, better product-market regulation
is found to have a particularly positive effect for youths and the poorer segments of society in the
wake of macroeconomic shocks.
In the Chinese context, this work suggests that there is scope for increasing productivity and
employment by introducing more competition into network, energy and transport industries that
are largely controlled by state-owned monopolies or oligopolies. If the effects on labour force
participation are similar to those observed in the OECD area, then reform of these sectors where
competition is restricted would have benefi cial impacts on labour force participation, thought the
impact on inequality is ambiguous. In addition, while lifetime employment has been ended in
state-owned enterprises, there appears to be a signifi cant discrimination against migrant workers
in the employment policies of these companies.
Financial reforms as well can have redistributive effects
Financial market reforms that make it easier for firms to rely on external finance are also
tentatively found to bring productivity gains relatively quickly in catching-up economies. Firm-
level evidence for China also shows that such reforms are more beneficial to firms that are
relatively far from the technological frontier, implying that they help speed up the catch-up
process within industries (Bas and Causa, 2012).
However, fi nancial reforms may amplify the redistributive effects of various shocks insofar as
fi nancial market sophistication makes for more pronounced credit cycles. Financial crises have
tended to affect the incomes of the low and high-income households most strongly, while the
middle class has tended to improve its relative income position. The effect of macroeconomic
shocks varies also across age groups. Labour-market performance of youths has been particularly
poor in the wake of almost any negative macroeconomic shock. Older households have been
disproportionately affected by large changes in the fiscal stance. Financial crises have often
been associated with house price declines. Highly-leveraged households and those whose asset
portfolios primarily consist of housing assets, i.e. households in the 26-35 year old group, are
most vulnerable in such cases. Such consequences fl owing from fi nancial reform strengthen the
case for strong macro-prudential regulation which should amongst other factors limit excessive
leverage - including for house purchases.
Conclusions
The extensive analysis of inequality and inclusive growth, dealing with both the economic
ramifi cations and the social effects produced in publications and seminars by the OECD over the
past year points to the strong complementarities between a number of policies that can serve
to improve growth over the longer term and which at the same time can reduce inequalities.
Improving access to education and removing barriers that give rise to discrimination between
people of similar qualifications and abilities in the labour market are examples. Reducing
32 CHINA IN FOCUS: LESSONS AND CHALLENGES © OECD 2012
CHAPTER 2: INEQUALITY: RECENT TRENDS IN CHINA AND EXPERIENCE IN THE OECD AREA
such constraints boosts the average level of incomes but also tends to draw more people into
employment and can reduce the extent of rent-sharing between employees and employers in
the protected sectors. In the context of China, such analysis confi rms to the urgency of reducing
discrimination against the quarter of a billion of migrant workers and their families. It also
shows that introducing more competition into sectors where a few state-owned enterprises
hold dominant market shares would both contribute to reduce inequalities and boost long term
growth.
The analysis produced over the past year has also suggested that there are policies that can
promote growth and reduce inequality. Improving tax compliance and abolishing tax breaks that
benefi t high-income recipients, for instance, are effi cient ways to achieve both. Tax systems based
on indirect taxation are more growth-friendly than those based on direct taxation. At the same
time, to contain inequality, China should continue to improve its social safety nets, but in doing
so it needs to guard against potential work disincentives. The efforts and successes of China
will become increasingly relevant to informing the continuing work of the OECD in its work on
inequality and inclusive growth.
BIBLIOGRAPHY
Ahrend, A., C. Moeser and T. Monacelli (2011), “How Institutions Shape the Distributive Impact of
Macroeconomic Shocks: A DSGE Analysis”, OECD Economics Department Working Paper No. 884.
Ahrend R., J. Arnold and C. Moeser (2011), “The sharing of macroeconomic risk: who loses (and gains) from macroeconomic
shocks”, OECD Economics Department Working Paper No. 877.
Bas, M. and O. Causa O. (2012), “Trade and Product Market Deregulation in Upstream Sectors and Productivity in Downstream
Sectors: Firm-Level Evidence from China”, OECD Economics Department Working Paper, forthcoming.
Deininger, K. and L. Squire (1998), “New Ways of Looking at Old Issues: Inequality and Growth”, Journal of Development Economics,
Vol. 57, No. 2.
Fiori, G., G. Nicoletti, S. Scarpetta and F. Schiantarelli (2012), “Employment Effects of Product and Labour Market Reforms: Are
There Synergies?”, Vol. 122, Issue 558.
Fredriksen, K.B. (2012), “Less Income Inequality and More Growth – Are They Compatible? Part 6. The Distribution of Wealth”, OECD
Economics Department Working Paper No. 929.
Herd, R. (2010), “A Pause in the Growth of Inequality in China?”, OECD Economics Department Working Paper No. 748.
Herd, R., V. Koen and A. Reutersward (2010), “China’s Labour Market in Transition: Job Creation, Migration and Regulation”, OECD
Economics Department Working Paper No. 749.
Hoeller, P., I. Joumard, M. Pisu and D. Bloch (2012), “Less Income Inequality and More Growth – Are They Compatible? Part 1.
Mapping Income Inequality Across the OECD”, OECD Economics Department Working Paper No. 924.
Joumard, I., M. Pisu and D. Bloch (2012), “Less Income Inequality and More Growth – Are They Compatible? Part 3. Income
redistribution via taxes and transfers across OECD countries”, OECD Economics Department Working Paper No. 926.
Jütting, J. and J. R. de Laiglesia (2009), Is Informal Normal? Towards More and Better Jobs in Developing Countries, OECD
Development Centre, OECD Publishing, Paris.
OECD (2004), Career Guidance and Public Policy: Bridging the Gap, OECD Publishing, Paris.

33 CHINA IN FOCUS: LESSONS AND CHALLENGES © OECD 2012
CHAPTER 2: INEQUALITY: RECENT TRENDS IN CHINA AND EXPERIENCE IN THE OECD AREA
OECD (2010a), Employment Outlook, OECD Publishing, Paris.
OECD (2010c), Economic Survey of China, OECD Publishing, Paris.
OECD (2011a), Divided We Stand. Why Inequality Keeps Rising, OECD Publishing, Paris.
OECD (2011b), Employment Outlook, OECD Publishing, Paris.
OECD (2011c), “Choosing a Broad Base – The Low Rate Approach to Taxation”, OECD Centre for Tax Policy and Administration, Tax
Policy Study No. 19.
OECD (2011d), “Tax Reform and Economic Growth”, OECD Centre for Tax Policy and Administration, Tax Policy Study, No. 20.
OECD (2011e), “Taxation and Employment”, OECD Centre for Tax Policy and Administration, Tax Policy Study No. 21.
OECD (2012), Going for Growth, OECD Publishing, Paris.
OECD / ILO (2011), Giving Youth a Better Start, Policy note for the G20 Meeting of Labour and Employment Ministers Paris, 26–27
September.
BACKGROUND DOCUMENTS
Cai, F., Y. Du and M. Wang (2010), “Income Inequality in China: What Role for Labour Market and Social
Policies?”, OECD Social, Employment and Migration Working Paper.
Chen, J. and A. Barriento (2006), “Extending Social Assistance in China: Lessons from the Minimum Living Standard Scheme”, CPRC
Working Paper, No. 67, Chronic Poverty Research Centre, Manchester, November.
Fournier, J.-M. and I. Koske (2012), “Less Income Inequality and More Growth – Are They Compatible? Part 7. The Drivers of Labour
Earnings Inequality – An Analysis Based on Conditional and Unconditional Quantile Regressions”, OECD Economics
Department Working Paper No. 930.
Gustafsson, B., L. Shi and L. Nivorozhkina, (2011) “Why are Household Incomes More Unequally Distributed in China than in
Russia?”, Cambridge Journal of Economics, Vol. 35, pp. 897-920.
Hoeller, P. (2012), “Less Income Inequality and More Growth – Are They Compatible? Part 4. Top Incomes”, OECD Economics
Department Working Paper No. 927.
Immervoll, H. and M. Pearson (2009), “A Good Time for Making Work Pay? Taking Stock of In-Work Benefits and Related Measures
across the OECD”, OECD Social, Employment and Migration Working Paper No. 81.
Koske, I., J.M. Fournier and I. Wanner (2012), “Less Income Inequality and More Growth – Are They Compatible? Part 2. The
Distribution of Labour Income”, OECD Economics Department Working Paper No. 925.
MOHRSS (2011) “Carry out Employment-fi rst Strategy to Promote Youth Employment and Entrepreneurship”.
OECD (2010), Off to a Good Start? Jobs for Youth, OECD Publishing, Paris.
OECD / ILO (2011) , “China: Generating employment in the post-crisis period”, G20 Country Policy Briefs, Geneva, Joint report with
the OECD.
Pisu, M. (2012), “Less Income Inequality and More Growth – Are They Compatible? Part 5. Poverty in OECD Countries”, OECD
Economics Department Working Paper No. 928.
34 CHINA IN FOCUS: LESSONS AND CHALLENGES © OECD 2012
CHAPTER 2: INEQUALITY: RECENT TRENDS IN CHINA AND EXPERIENCE IN THE OECD AREA
Piketty, T. and N. Qian (2009), “Income Inequality and Progressive Income Taxation in China and India, 19862015”, American
Economic Journal: Applied Economics, Vol. 1, No. 2.
Quintini, G. and T. Manfredi (2009), “Going Separate Ways? School-to-Work Transitions in the United States and Europe”, OECD
Social, Employment and Migration Working Paper No. 90.
Sicular T., X. Yue, B. Gustafsson and S. Li (2007), “The Urban-Rural Income Gap and Inequality in China”, Review of Income and
Wealth, Vol. 53, No. 1.
Silveira Neto, R. and C. Azzoni (2008), “Non-Spatial Govern Policies and Regional Inequality in Brazil”, Annals of the 5th Meeting of
the Brazilian Regional Association of Regional and Urban Studies, Recife.
Solinger, D. (2008), “The Dibao Recipients: Mollified Anti-Emblem of Urban Modernization”, China Perspectives, Vol. 2008/4.
State Administration of Taxation (2011), “The Decision on Amending the Individual Income Tax Law Passed by the NPC Standing
Committee”, Government of People’s Republic of China.

35 CHINA IN FOCUS: LESSONS AND CHALLENGES © OECD 2012
CHAPTER 3: KEY LESSONS FROM OECD WORK ON GREENING GROWTH
Chapter 3:
Key Lessons from OECD Work on Greening Growth
With a population of 7 billion, the world in 2012 faces highly complex economic and social
challenges. While protecting the environment and conserving natural resources remain key
policy priorities, many countries are also struggling with slow economic growth, stretched public
fi nances and high levels of unemployment. Tackling these pressing challenges requires a deep
cultural shift towards “greener” and more innovative sources of growth, and more sustainable
consumption patterns.
By 2050, the world economy will look rather different than today (OECD, 2012). The OECD’s
share is projected to decline from 54% in 2010 to less than 32%, while the share of Brazil, Russia,
India, Indonesia, China and South Africa (the BRIICS) is expected to grow to more than 40%. The
Chinese economy in terms of GDP in purchasing power parity exchange rates (PPPs) is projected
to overtake the US economy around 2012. India’s GDP is projected to surpass that of the US before
2040. Today’s global “engines of growth” – China and India – could see their average GDP growth
rates slow down to 2050. Meanwhile, Africa will experience high economic growth rates between
2030 and 2050, but will remain the poorest continent. Overall, by 2050 the world GDP is projected
to nearly quadruple, raising living standards around the world.
Without green growth policies, this new world will demand 80% more energy and the
global energy mix in 2050 will still rely 85% on fossil energy, leading to a further 50% increase in
greenhouse gas (GHG) emissions. Global water demand is projected to increase by some 55% to
2050, due to rapid increase from manufacturing (+400%), electricity (+140%) and domestic use
(+130%). Competition for water would intensify, threatening supply for irrigated agriculture and
leading to 2.3 billion more people than today – or over 40% of world population – living in severely
water-stressed river basins (OECD, 2012).
By 2050 global terrestrial biodiversity is projected to decline by a further 10% and mature
forests to shrink in area by 13%. The main pressures driving biodiversity loss include land-use
change (e.g. agriculture), the expansion of commercial forestry, infrastructure development,
human encroachment and fragmentation of natural habitats, as well as pollution and climate
change. Urban air pollution is set to become the top environmental cause of premature mortality
globally by 2050. The total number of premature deaths from exposure to particulate matter (PM)1
1 The Outlook modelled a composite of PM10 and PM2.5, based on assumed relationships between PM10 and PM2.5.

36 CHINA IN FOCUS: LESSONS AND CHALLENGES © OECD 2012
CHAPTER 3: KEY LESSONS FROM OECD WORK ON GREENING GROWTH
could double from current levels to 3.6 million per year, with most deaths occurring in China and
India. China is projected to have by far the highest rate of PM-related premature deaths at over
900 per million inhabitants in 2050 (OECD, 2012).
The costs and consequences of inaction on these environmental challenges are colossal, both
in economic and human terms. These projections highlight the urgent need for new thinking, an
urgent call for green growth policy reforms.
What are the benefi ts of green growth?
Green growth is about fostering economic growth and development while ensuring that
natural assets continue to provide the ecosystem services on which our well-being relies. It is also
about fostering investment, competition and innovation which will underpin sustained growth
and give rise to new economic opportunities.
The overarching challenge of addressing pressing environmental risks while ensuring
continued improvements in the living standards of a rapidly growing population is equally
applicable to advanced, emerging and developing economies. In fact, green growth presents
opportunities for emerging and developing countries to leapfrog unsustainable production and
consumption patterns. Where developed economies are constrained by the path dependency
of sunk capital, developing economies have, given access to adequate financing and capacity,
the opportunity to lay down infrastructure and networks that can reduce costs and increase
productivity, while easing environmental pressure.
There are two broad reasons why a green growth strategy (GGS) will contribute to sustainable
growth. First, it could open up new sources of growth through several channels:
• Better management of natural assets can generate improvements in the use of resources
and enhance productivity throughout the economy, for instance by eliminating waste.
• Innovation, spurred by improved policies and framework conditions aimed at addressing
environmental problems, can promote growth.
• A clear strategy provides certainty about how governments are going to deal with major
environmental issues. This would boost confi dence to invest in green technologies, goods,
and services, and encourage environmentally-friendly consumption and the creation of new
“green markets”.
• Increased revenues from the pricing of pollution can be used to fund goods and services to
support long-term growth.
Second, green growth can prevent downward bends in growth trajectories caused by
unresolved tensions between economic activity and the environment:
1. In the absence of a GGS, the value of natural capital eroded by economic activity can exceed
the economic value that such erosion generates, undermining the ability to sustain future
growth. This can occur due to increasingly costly substitution between natural capital
and other inputs into production. For example, more costly investment in irrigation and
drinking water supply has been necessary in the face of increasingly scarce water resources.
The absence of a GGS may also lead to growth-choking bottlenecks, or to the failure to
adequately measure the benefi ts of natural capital, for instance on human health.
2. A GGS can also help minimise the risk that further environmental deterioration affects

37 CHINA IN FOCUS: LESSONS AND CHALLENGES © OECD 2012
CHAPTER 3: KEY LESSONS FROM OECD WORK ON GREENING GROWTH
growth negatively due to the crossing of critical thresholds. Change in environmental
systems doesn’t necessarily follow a smooth, foreseeable trajectory. Things can shift
suddenly and catastrophically (as has happened to some fi sh stocks and as could happen
with climate change or damage to biodiversity), leading to potentially highly damaging and
irreversible effects on growth.
An issue that policy makers need to address is that these different dimensions are closely
related. For example, uncertainty which delays investment in greener growth will raise the cost of
avoiding environmental thresholds.
A framework for green growth
Over the last few years, national efforts to foster greener growth have been gaining
momentum in both OECD and emerging economies, albeit to varying degrees. Most countries
have introduced discrete policy measures that, if extended could form part of the green growth
policy mix. In these cases, there is scope to build on ongoing initiatives and to scale-up and join
policy action under well-defined strategies. Some countries such as Korea, Germany, Norway,
and the United Kingdom, have gone further and introduced comprehensive strategies that
mainstream green growth objectives in broader government policies, including the budgetary
process. In China, the National 12th Five-Year Plan for Environmental Protection (2011-2015),
promulgated by the State Council in December 2011, testifies the government commitment to
building a more “resources-effi cient and environment-friendly society” (Box 3.1).
But there is no ‘one-size-fi ts-all’ green growth strategy. The optimal path to a greener economy
depends on policies and institutional settings, levels of development, resource endowments and
particular environmental pressures. There are, however, common considerations that need to
be applied in all settings and an effective strategy requires looking across a very wide range of
policies, not just traditionally ‘green’ policies.
A GGS should be centred on mutually reinforcing aspects of economic and environmental
policy, recognising natural capital as a factor of production and its role in growth. It should focus
on cost-effective ways of attenuating environmental pressures to affect a transition towards
new patterns of growth that will avoid crossing critical environmental thresholds. The strategy
should also recognise that minor policy adjustments can only produce positive outcomes up to a
point. Beyond this, trade-offs between environmental and economic outcomes become binding,
with negative consequences for longterm growth and development. Innovation can break path
dependence and help to reconcile growth and environmental objectives. Innovation, therefore, is
an essential element of an effective GGS.
A GGS also recognises that focusing on GDP as a measure of economic progress generally
overlooks the contribution of natural assets to well-being. Policy makers will therefore have to
target a range of measures of progress, encompassing the quality and composition of growth,
and how this affects the environment and people’s welfare. They will also need to promote
policies that require more efficient use of resources to minimise environmental pressures.
Effi cient resource use is a core goal of economic policy and a GGS, and many fi scal and regulatory
interventions that aren’t normally associated with a ‘green’ agenda will be involved. A fl exible,
dynamic economy promotes high growth, as well as the transition to greener production and
consumption.

38 CHINA IN FOCUS: LESSONS AND CHALLENGES © OECD 2012
CHAPTER 3: KEY LESSONS FROM OECD WORK ON GREENING GROWTH
Box 3.1 The National 12th Five-Year Plan for Environmental Protection (2011-2015)
The Plan presents seven major targets that the government aims to achieve by 2015: “(1) significant reduction of major pollutants emission; (2) improved environmental safety of urban and rural drinking water source areas, with major improvement in water quality; (3) effective control in the pollution caused by heavy metals, Persistent Organic Pollutants, hazardous chemicals and dangerous wastes; (4) improved urban environmental infrastructure operations; (5) reversal of ecological deterioration; (6) improved regulatory ability in nuclear safety; (7) enhanced environmental regulatory institution”.
The Plan elaborates concrete and detailed actions that primarily concentrate on four areas: (1) improve quality of water environment (this includes protection of the drinking water source areas, treatment of water pollution in major rivers, prevention and control of marine environment pollution); (2) implement comprehensive control of air pollutants; (3) enhance protection of soil environment; (4) strengthen ecological protection and supervision.
A notable feature about the Plan is that the government has, for the fi rst time, announced its intention to “strengthen prevention and control of environmental risks in key areas” and “improve the system of environmental public services” as strategic tasks for environment protection. In order to ensure an equalization of environment public services, the Plan states clearly that the government should “appropriately defi ne the scope and standard of basic environmental public services, with attention to the integration of urban and rural areas in service access (…) The central government will provide increased fi nancial support, through measures as general fi scal transfers and ecological compensation, to improve environmental public services in western regions, areas prohibited or restricted for development and other disadvantaged areas. Local governments at all levels should guarantee expenditure on environmental public services…”
With regard to economic policies to support environmental protection, the Plan calls for advancement of environmental tax reform and improvement in waste disposal fee system. Besides, the Plan states that the government will establish a credit rating system for enterprises’ environmental behaviours and will step up credit support for those enterprises and projects that operate in line with environmental requirements and credit principles. The government will also build a green rating system in banks, linking green credit performance with other elements including work evaluation of banking staff, admission of institutions and business development. Meanwhile, the government will explore mechanisms for earmarked funds for national ecological compensation.
According to the Plan, China is calling for around RMB 3.4 trillion of investments for environmental protection.
Finally, the Plan requires that local governments should integrate the objectives, tasks, measures and key environmental protection projects outlined in the Plan into local plan of economic and social development and that the performance in implementation will serve as a key indicator in the overall evaluation of local government offi cials. “By the end of 2013 and end of 2015, mid-term evaluation report and fi nal evaluation report on implementation shall be submitted to the State Council, with evaluation results open to the public”.
Beyond that, specific environmental interventions are likely to deliver economic benefits.
The economic costs arising from the emission of some pollutants and the over-exploitation of
some resources are relatively well-known, and clear benefi ts will arise once corrective policies
are implemented. In such cases, positive environmental and economic results can be obtained
in a relatively short time horizon. However, where ecosystem services – and their relationship to
39 CHINA IN FOCUS: LESSONS AND CHALLENGES © OECD 2012
CHAPTER 3: KEY LESSONS FROM OECD WORK ON GREENING GROWTH
natural assets and the economy are less defi ned, as with climate change or global biodiversity,
the size and timing of payoffs are subject to considerable complexity and uncertainty. In
these cases, economic policy decisions taken today need to incorporate a longer time horizon.
Growth and technological change tend to create path dependency and technological lock-in.
Environmental impacts are also cumulative and often irreversible. Action taken now to insure
against unfavourable or even catastrophic outcomes can avoid very signifi cant economic costs in
the future.
What are the essentials of green growth policies?
Green growth policies need to (i) encourage greener behaviour by firms and consumers,
(ii) facilitate smooth reallocation of jobs, capital and technology towards greener activities and
(iii) provide adequate incentives and support to green innovation. Policies should focus on ways
to close the gap between private returns and overall social benefi ts of economic activities, due
to misguided government policies or constraints and distortions arising from failure of markets
to resolve tensions between the economy and the environment. Policies should also take into
account any distributional effects that may result, and include ways to mitigate them.
Two broad sets of policies are essential elements of any GGS: (i) framework policies that
mutually reinforce economic growth and the conservation of natural capital, and (ii) policies
specifi cally aimed at greening growth. Among the fi rst are:
• Sound innovation policies (such as those expounded in the OECD Innovation Strategy).
• Policies that ensure the smooth functioning of labour and product markets (which are
periodically reviewed in the OECD Going for Growth exercise).
• Fiscal structures which encourage both economic growth and environmental protection.
The second set includes a mix of pricebased and nonmarket instruments. Ultimately, it is not
the precise choice of these instruments that matters for the success of a GGS but the need to stick
to a well-defi ned set of economic and policy criteria. These crucially include cost effectiveness
and the ability to spur innovation, but also to what extent policies are likely to be adopted and
enforced (De Serres et al, 2010).
The balance between market and non-market instruments
Putting a price on a pollution source or on the over-exploitation of a scarce resource
through mechanisms such as taxes or tradable permit systems should be a central element
of a policy mix. Pricing mechanisms tend to minimise the costs of achieving a given objective
and provide incentives for further efficiency gains and innovation. Importantly, increased use
of environmentally related taxes can play a role in growth-oriented tax reform; by helping to
shifting (part of) the tax burden away from more distortive corporate and personal income taxes
and social contributions.
The use of environmentally related taxes and emission trading systems has widened over
recent decades with a growing number of countries using taxes and charges in areas like waste
disposal and on specific pollutants, such as emissions to air of NOx and SOx. Meanwhile, the
revenue from taxes on energy, which are the most widespread form of environmentally-related
tax (Figure 3.1), has tended to decline as a share of GDP, partly because growing global energy
demand has pushed up pretax prices and encouraged increased fuel effi ciency – an illustration of
the impact of economic incentives.

40 CHINA IN FOCUS: LESSONS AND CHALLENGES © OECD 2012
CHAPTER 3: KEY LESSONS FROM OECD WORK ON GREENING GROWTH
Figure 3.1 Composition of environmentally related tax revenues in selected G-20countries
As a percentage of GDP in 2009
Source: OECD/EEA database on instruments for environmental policy.
Not every situation lends itself to market instruments. In certain cases, well-designed
regulation, active technology-support policies and voluntary approaches may be more
appropriate or an important complement to market instruments. In addition, the responsiveness
of businesses and consumers to price signals can, in many situations, be strengthened through
information-based measures that highlight the consequences of environmental damage caused
by specifi c activities and the availability of cleaner alternatives.
The use of non-market instruments such as command-and-control regulation, active
technology-support policies and voluntary approaches is appropriate when pollution emissions
cannot be adequately monitored at source and that there are no obvious input or output that
could serve as a proxy and be subjected to taxation. They may also work best when insuffi cient
information or misaligned incentives results in a weak response of agents to price signals.
In assessing the best policy strategy to foster greener growth, the environmental side-effects
of existing sectoral policies should also be examined, notably in the areas of energy, agriculture
and trade, to establish whether regulation and/or subsidies result in both economic ineffi ciency
and environmental damage.
Seizing the opportunities for green innovation
A GGS should address the specifi cities of innovation in the environmental area. The problems
for innovators in this area are fourfold:

41 CHINA IN FOCUS: LESSONS AND CHALLENGES © OECD 2012
CHAPTER 3: KEY LESSONS FROM OECD WORK ON GREENING GROWTH
1. The environmental externalities are not priced – for example a carbon price can address
this, but current levels of carbon prices still leave a considerable gap.
2. Path dependency and dominance of existing technologies and systems can make it very
difficult for some new technologies to compete and scale up, which is why temporary
support may be needed in certain cases. Innovation support instruments must be carefully
designed to foster the emergence and uptake of effi cient technologies while minimising the
risk of technology lockin.
3. Reducing barriers to trade and investment is important to diffuse green technologies
globally. The effective protection and enforcement of intellectual property rights (IPRs)
provides a key framework for the diffusion of technologies, including by facilitating foreign
direct investment and licensing.
4. To accelerate the diffusion of green innovation, new mechanisms that enhance technology
transfer to developing countries, e.g. voluntary patent pools and other collaborative
mechanisms, need to be scaled up. Multilateral action is also needed to reduce the cost of
green technologies for the least developed countries, e.g. by covering licensing fees. Such
approaches need to ensure strong incentives to invest in follow-up innovation.
While developed countries still lead in green innovations at the frontier (OECD, 2011a; Dutz
and Sharma, 2011), emerging and developing countries have their own green innovations and
business models, refl ecting their own needs and building on their own strengths.
Innovation provides opportunities for developing and emerging economies to avoid the
growth path of developed economies and leapfrog to a greener economy. For example, as many
developing and emerging economies are still in the process of developing their infrastructure,
there are opportunities to integrate greener and smarter solutions from the outset, e.g. by
integrating ICT in energy systems (e.g. smart grids) and transport systems, or by building green
cities. However, if such solutions are to be viable in the context of developing countries, they need
to be cheap.
There are also market opportunities from green innovation for emerging and developing
economies. Brazil, China and India have all become important drivers of green innovation in
recent years and the technologies from such countries may be more suited to the needs and
conditions of developing countries than those from advanced economies. South-South fl ows of
technology are therefore increasing, although from low levels. The United States is collaborating
with China and Russia in a number of energy fi elds, as are Belgium and South Africa.
Key areas for a green innovation policy
Business is the driver of innovation, including green innovation. However, government
action is essential to shape the environment for green innovation. Several well-known market
failures provide the rationale for policy actions to foster green innovation. The first are the
negative externalities associated with environmental challenges. If fi rms and households do not
have to pay for the environmental damage they infl ict, there will be little incentive to invest in
green innovation. These externalities need to be removed. Second, there are important market
failures specifi c to the market for innovation, notably the diffi culty for fi rms to fully appropriate
the returns from their investments, which typically results in under-investment in innovation.
Third, the market for green innovation is affected by specifi c barriers, notably the prevalence of
dominant designs, technologies and systems in energy and transport markets. This can create
42 CHINA IN FOCUS: LESSONS AND CHALLENGES © OECD 2012
CHAPTER 3: KEY LESSONS FROM OECD WORK ON GREENING GROWTH
entry barriers for new technologies and competitors due to, for example, the high fi xed costs of
developing new infrastructures.
Key elements of a policy framework for green innovation include:
• Providing predictable policy signals to ensure that potential innovators and adopters of
climatefriendly technologies are not dissuaded from undertaking the necessary longterm
investments. Increasing policy stability is good for innovation and growth and also for the
environment.
• Improving the overall climate for business and innovation, as this is equally important for
green innovation as for innovation more generally. A good environment for innovation will
allow entrepreneurship to flourish and innovative firms to grow and provide new green
solutions.
• Wider application of price signals to refl ect the true value of natural resources and the costs
of pollution. This will enhance effi ciency in allocating resources by strengthening markets
for green innovation, and will lower the costs of addressing environmental challenges.
Price signals are also important as they indicate the commitment of governments to move
towards greener growth.
Governments can also implement policies that strengthen the innovation effort itself and
target it more directly towards supporting green growth. The scope for such policies will differ
across countries, depending heavily on local capabilities.
A fi rst area for policy action involves focusing the national innovation effort more on fostering
green research, notably on addressing local needs, e.g. water scarcity, biodiversity loss, support
for ecosystems. Investment in such public research will only help if that it is translated into
innovation, which requires good links between science and business.
A second area of possible policy action is to foster green innovation more broadly, e.g. by
encouraging fi rms and households to adopt green technologies and products. Four areas of policy
are particularly important:
• Support for private investment in green innovation, including the commercialisation and
diffusion of green innovations. Such support may be required as green innovation faces
additional barriers in some markets, e.g. barriers to entry in the electricity sector. Provision
of targeted support by government can be risky because of the lack of information. Good
policy designs need to ensure competitive selection processes, focus on performance
rather than specific technologies, avoid favouring incumbents or providing opportunities
for lobbying, ensure a rigorous evaluation of policy impact, and contain costs. Support for
commercialisation should be temporary and accompanied by clear sunset clauses and
transparent phase-out schedules.
• Strengthening the market for green innovation. In many cases, the main problem for the
commercialisation of green innovations is the immaturity of the market. This makes it
difficult for innovators to obtain finance and to scale them up to a commercial size, and
it makes it difficult for firms to invest in technologies that have uncertain returns. In
specific market segments, demand-side policies, such as public procurement, standards
and regulation can also help to strengthen and improve the markets for green products,
fostering innovation in the process.
43 CHINA IN FOCUS: LESSONS AND CHALLENGES © OECD 2012
CHAPTER 3: KEY LESSONS FROM OECD WORK ON GREENING GROWTH
• Change consumer behaviour. Consumers also have an important role to play in fostering
and taking up green innovation. Consumers often focus on short-term costs, without fully
considering longer-term factors. This suggests that efforts should be made to highlight cost
implications of consumer choices over the life of a consumer durable through consumer
education, as well as green labelling and certifi cation.
• Fostering the greening of SMEs: A specific challenge for innovation involves small and
medium-sized enterprises (SMEs). These fi rms face additional problems in adopting green
innovations, as they often have weak innovation capabilities. Policy can help to improve
access to fi nance, enable small and medium-sized enterprises to participate in knowledge
networks, support the formation of the skills that can lead to innovation.
Drawing on global knowledge
Governments can do much at the national level to strengthen green innovation but should
also look to benefi t from knowledge and technologies being developed abroad. Openness to trade
and investment is important and numerous barriers to trade in green technologies remain in place
which inhibit their free flow. In some economies, high import tariffs on energyconsuming goods
combine with subsidised electricity prices to encourage consumers to favour appliances that are
cheap to buy but ineffi cient to operate.
Lowering barriers to trade in services is also important. Deployment of climate-change
mitigation and adaptation technologies often depends on the availability of specialised services.
Moreover, free movement of people is important. Indeed the growth of China’s photovoltaic
industry owes much to skilled executives returning from the Chinese diaspora (de la Tour, et al.,
2011).
Tension can arise between technology diffusion and maintaining appropriate incentives for
investment in innovation. Intellectual property rights provide an important incentive to invest
in innovation by allowing fi rms to recover their investment costs but they may make adoption
of the technology too expensive. To accelerate the diffusion of innovation, new mechanisms that
enhance international technology transfer are currently being developed, including voluntary
patent pools and other collaborative mechanisms.
Institutions and multi-level governance
Institutional and governance capacity to implement wide-ranging policy reform is an
essential condition for greening growth. Governments need to be able to integrate green growth
objectives into broader economic policymaking and development planning (Box 3.2). Developing
such capacity is a key structural issue and applies as much to many OECD countries as it does to
developing countries. This issue is not restricted to formal national level planning processes, but
extends to public financial management (especially the budget process), developing strategies
for key economic sectors as well as how these feed through into sub-national development.
It concerns not only policy priorities but also the choice and design of programmes, public
investments and regulation of economic activity.

44 CHINA IN FOCUS: LESSONS AND CHALLENGES © OECD 2012
CHAPTER 3: KEY LESSONS FROM OECD WORK ON GREENING GROWTH
Box 3.2 Green growth objectives and national development planning
The National Strategy for Green Growth and the Five-year Plan (2009-2013) of Korea provide a comprehensive policy framework for green growth. The Strategy aims to: (1) promote eco-friendly new growth engines, (2) enhance peoples’ quality of life, and (3) contribute to the international efforts to fight climate change. To facilitate the realisation of the new vision, the Presidential Commission on Green Growth was established in 2009 and ‘the Framework Act on Low Carbon Green Growth’ was enacted in January 2010. Drawing on the planning practice that was discontinued in the early 1990s, the Five-Year Plan (2009-2013) provides a blueprint for government actions for implementation of the Strategy; containing specifi c budget earmarks and detailed tasks for line ministries and local governing entities. Under the plan, the government will spend about 2% of the annual GDP on green growth programs and projects (e.g. on green infrastructures and R&D of green technologies).
The National Development Plan of Ireland (2007-2013) sets out indicative fi nancial allocations for the investment priorities aimed at enhancing economic competitiveness and at providing a better quality of life. It brings together different sectoral investment policies into one overall framework, in order to promote co-ordination and alignment between sectoral policies, providing a fi nancial framework within which government departments and agencies can plan and deliver the implementation of public investment. The Plan emphasises the importance attached to several horizontal themes, including environmental sustainability. The environment chapter covers transport, waste management, climate change, environmental research, and sustainable energy. The NDP set out a strong fi nancial framework to enable Ireland to tackle environmental challenges over the period 2007-2013. In 2007, investment programmes with a direct impact on promoting environmental sustainability exceeded EUR 1.3 billion.
Source: Government of Ireland (2008), “Ireland National Development Plan 2007-2013. Transforming Ireland A Better Quality of Life for All”.
The implementation of green growth reforms will require ongoing coordination across
ministries, public agencies but also between levels of government involved in policymaking.
Urban initiatives both affect and are affected by economy-wide fiscal policies and national
sectoral policies (particularly transportation, building, labour, innovation and education policy).
There are cases in which national-level policies can undermine regional level green growth
policies due to the lack of information on conflicting rules or practices. Similarly, regional
initiatives that focus on stand-alone or “fl agship” projects without regard to where these projects
fi t within national policy frameworks risk falling short of their promise. Multi-level governance
is of considerable practical importance for guiding investment and innovation in a number of
key areas such as water and sanitation systems. At the same time, addressing issues of uneven
stringency of enforcement of environmental policies and laws at the provincial and local levels
will be important for achieving more effective and equitable implementation (Box 3.3).
Employment and distributional aspects
In the transition to green growth new jobs will be created, including skilled jobs in emerging
green innovative activities. But some jobs will be at risk and others would have to be reallocated
from grey to green sectors that either replace polluting activities with cleaner alternatives or
provide environmental services. This turnover will create challenges for some and opportunities
for others. While many of the existing skills will remain appropriate, skill mismatches may
emerge, especially in relation to innovation activities, as the experience in some countries already
suggests. New skills will be needed and this will require appropriate education policies, while
training and retraining programmes will be needed for workers with existing skills.

45 CHINA IN FOCUS: LESSONS AND CHALLENGES © OECD 2012
CHAPTER 3: KEY LESSONS FROM OECD WORK ON GREENING GROWTH
Box 3.3 Promoting National Coherence of Environmental Enforcement in China
Ensuring compliance with environmental standards poses a particular challenge to the promotion of green growth in China. Local environmental quality is mainly the responsibility of local governments, whose environmental protection bureaus (EPBs) only receive guidance from the Ministry of Environmental Protection (MEP). Due to the limited number of inspectors and the lack of enforcement capacity, local EPBs can usually inspect key large polluting facilities only, while the majority of smaller enterprises, especially in rural areas, are not inspected systematically or only when there are complaints about pollution incidents. The MEP, in co operation with local EPBs, conducts country-wide inspection campaigns to follow-up on specific environmental problems but many polluting facilities reopen after. Furthermore, fi nes imposed due to non-compliance are often too low to provide an effective deterrent. Parties directly responsible for signifi cant pollution incidents face criminal charges. However, this avenue has not been used very often due to the difficulty in establishing causal relationships between pollution and harm, uncertainty over the legal responsibilities, and long judicial procedures.
EPBs often rely on developing mutual understanding with polluters, providing technical and financial assistance, and negotiating reasonable compliance deadlines, softening their approach to key local industries, especially at the municipal level and in poorer areas. The Ministry of Environmental Protection set up in 2008 six regional environmental protection supervision centres, to oversee local EPBs. But concerns remain about the lack of national consistency of enforcement due to unbalanced economic development levels and enforcement capacity, leading to an uneven playing fi eld and compromising the achievement of China’s ambitious environmental goals.
The government hopes to improve compliance through performance reviews of local governments and offi cials. In 2011, the State Council stressed the need to improve the enforcement of environmental policies and develop new indicators to monitor the performance of local government offi cials.
Companies are also incentivised to improve their environmental performance through the linkage of the interest rate on bank loans to compliance records and the refusal of bank credit to serious environmental violators. In addition, companies issuing new shares on the stock market can only do so if their environmental performance is cleared by the MEP and may be banned from exporting for up to three years if their environmental performance is poor.
Public disclosure is being used to complement traditional compliance assurance instruments. Since 2008, EPBs are required to disclose lists of enterprises violating discharge standards, causing major pollution accidents, or refusing to comply with compliance orders. A number of awards are in place but seem to have had a limited impact. The government offers subsidies to encourage companies to obtain certifi cation of their environmental management systems (EMS) based on the ISO 14000 standards.
Source: OECD (2010), National Consistency of Environmental Enforcement in OECD Countries and China: Principal Issues, Issues Paper prepared for the stakeholder workshop “Promoting National Coherence of Environmental Enforcement in China”, Beijing, 9-10 December 2010
Labour market and skill policies can play an important role in facilitating the structural
adjustments associated with green growth, while at the same time minimising any associated
costs. Labour market policies should focus on preserving employment, not jobs. They need
to ensure that workers and firms are able to adjust quickly to changes brought about by the
greening of the economy, including by seizing new opportunities. By helping workers to move
from jobs in contracting sectors to jobs in expanding sectors, they can also help to assure a just
sharing of adjustment costs occasioned by the transition.

46 CHINA IN FOCUS: LESSONS AND CHALLENGES © OECD 2012
CHAPTER 3: KEY LESSONS FROM OECD WORK ON GREENING GROWTH
Green growth may also entail distributional impacts that need to be taken into account.
There is a widespread perception that distributional effects may be regressive but this may not
necessarily be the case in China. Indeed some policies, such as carbon taxes, raise public revenue
which can be used to strengthen social protection systems and compensate those negatively
affected. Similarly, phasing out energy subsidies would have positive impacts on the environment
and free up additional government resources.
Governments also need to find satisfactory compromises not only among the conflicting
objectives of different strands of society, but also within government itself. GGS cannot be
implemented through a single type of policy, but getting the mix right requires a high degree of
coordination among ministries and levels of government.
The international dimension
Global challenges require cooperation on a global scale in order to deliver public goods (climate
change mitigation, biodiversity) or protect the global commons (the environment, fisheries).
International co-operation is necessary because: a) no single country can successfully address
the problems alone; b) the costs and benefits of action may accrue to different countries, and
individual countries may not be willing to bear the costs of addressing global challenges if they
cannot appropriate the benefi ts; and c) uncoordinated efforts of many countries to address global
challenges are likely to be more costly and less successful than coordinated, cooperative efforts.
Creating a global architecture which is conducive to green growth will require further
strengthening of arrangements for managing access to the global commons, increased co
operation in the field of science and technology, provision of finance to support action by
developing countries, and facilitating the diffusion of clean technologies. Increased effort to boost
global trade and investment fl ows would also help to underpin sustained growth and access to
clean technologies. At the same time, there is a need for increasing vigilance around the potential
spill-over effects of domestic policy measures on trade and investment and the potential for
incoherent policy which undermines development prospects in low income countries.
A stronger international collective effort related to the environment has been seen recently.
The Cancun agreements in particular have renewed confi dence in multilateral action to address
climate change. International coordinated action will be needed to facilitate transfer of green
technologies and to deal with competitiveness concerns as fi rms in countries pricing externalities
feel more pressure. International technology collaboration is an important vehicle through which
countries can share costs, increase knowledge spillovers and realise the benefits of greener
energy systems. This requires more concerted approaches to accelerate technology development
and diffusion. The use of new innovative fi nancing mechanisms (e.g. securitisation, risk sharing
and forward commitments) is particularly important.
Establishing global coalitions to deal with global issues will be diffi cult as preferences and
priorities may differ across countries. Side-payments, for example in the form of development or
adaptation assistance, will have a role to play in helping align incentives across countries with
different initial conditions.
Many countries have expressed concern that the green-growth policy agenda could be
captured by protectionist interests. The OECD-hosted Freedom of Investment Roundtable
has addressed this concern and recently issued a communication on “Harnessing Freedom
of Investment for Green Growth” which aims at making governments’ environmental and
investment policy goals mutually supportive. However, none of the 42 countries that report

47 CHINA IN FOCUS: LESSONS AND CHALLENGES © OECD 2012
CHAPTER 3: KEY LESSONS FROM OECD WORK ON GREENING GROWTH
regularly to the Roundtable about investment measures have reported overt discrimination
against non-resident or foreign investors in relation to environmental policy. Neither have
participating countries reported serious concerns about such measures by other countries.
Nonetheless, continued vigilance is encouraged, and the Roundtable will continue to monitor
investment measures to ensure that they are not used as disguised protectionism. Environmental
policy measures that appear to be neutral may potentially involve de facto discrimination or
create barriers to trade which constrain development. Some environment-related state aids (such
as grants, loan guarantees or capital injections for individual fi rms), may potentially pose risks to
competition. Global dialogue can play a major role to increase transparency, foster cooperation
and prevent these negative outcomes.
Measuring progress towards green growth
A key issue for policy makers is that the integration of economic and environmental policies
requires a matching framework of comparable data to measure progress towards green growth.
The diagnosis of key constraints will require country-specific information, encompassing a
range of environmental and economic indicators compatible with assessing global economic and
environmental trends. The preliminary set of indicators developed in the context of OECD’s work
Towards Green Growth: Measuring Progress – OECD Indicators (OECD, 2011b) provides measures which
can be used to inform a diagnosis of constraints to green growth (Table 3.1).
The measurement framework explores four inter-related groups of indicators:
1. Indicators refl ecting the productivity of environmental assets and natural resources.
2. Indicators of the natural asset base.
3. Indicators monitoring the environmental quality of life.
4. Indicators describing policy responses and economic opportunities.
Table 3.1 Overview of proposed OECD green growth indicator groups and topics covered
Main indicator groups Topics covered
The socio-economic context and characteristics of growth
Economic growth, productivity and competitiveness
Economic growth and structure
Productivity and tradeInfl ation and commodity prices
Labour markets, education and income Labour markets(employment / unemployment)
Socio-demographic patternsIncome and education
Environmental and resource productivity
Carbon and energy productivity 1. CO2 productivity (demand-based, production-based)
2. Energy productivity
Resource productivity 3. Material productivity (demand-based, production-based)
Non-energy materials, waste materials, nutrients)
4. Water productivity
Multi-factor productivity 5. Multi-factor productivity including environmental services

48 CHINA IN FOCUS: LESSONS AND CHALLENGES © OECD 2012
CHAPTER 3: KEY LESSONS FROM OECD WORK ON GREENING GROWTH
Main indicator groups Topics covered
Natural asset base
Renewable stocks 6. Freshwater resources7. Forest resources8. Fish resources
Non-renewable stocks 9. Mineral resourcesBiodiversity and ecosystems 10. Land resources
11. Soil resources 12. Wildlife resources
Environmental quality of life
Environmental health and risks 13. Environmentally induced health problems and related costs 14. Exposure to natural or industrial risks and related economic losses
Environmental servicesand amenities 15. Access to sewage treatment and drinking water
Economic opportunities and policy responses
Technology and innovation 16. R&D of importance to GG17. Patents of importance to GG18. Environment related innovation
Environmental goods and services 19. Production of environmental goods and servicesInternational fi nancial fl ows 20. International fi nancial fl ows of importance to GGPrices and transfers 21. Environmentally related taxation
22. Energy pricing23. Water pricing and cost recovery
Training & skill developmentRegulations & management approaches
Indicators to be developed:
The data gathered for the preliminary set of indicators suggests that across most countries
the growth rates of GDP and other measures of output tend to outstrip the growth rates of
environmental inputs into the production system. This has been refl ected in falling energy and
carbon intensity of production in China and other countries but not in an absolute decrease in
emissions or energy use (Figure 3.2). This exercise also showed that the sectors directly producing
environmental goods and services accounted for less than 0.9% of total employment. However,
green activities also occur in other industries, so it is not possible to measure the full size of the
green economy.
Figure 3.2 Decoupling trends: production based CO2 and GHG emissions - CO2 and GHG emissions versus GDP and real income, OECD, BRIICS, 1990-2008

49 CHINA IN FOCUS: LESSONS AND CHALLENGES © OECD 2012
CHAPTER 3: KEY LESSONS FROM OECD WORK ON GREENING GROWTH
BIBLIOGRAPHY
Beard, A. and R. Hornik (2011), “It’s Hard to be Good”, Harvard Business Review, November.
De Serres, A, F. Murtin and G. Nicoletti (2010), “A Framework for Assessing Green Growth Policies”, OECD Economics Department
Working Papers, No. 774, OECD, Paris.
Dutz, M. and S. Sharma (2011), “Green growth, technology and innovation”, World Bank, mimeo, December.
Gault, F. (2010), Innovation Strategies for a Global Economy: Development, Implementation, Measurement and Management,
Edward Elgar, Cheltenham, and Northampton, MA.
OECD (2006), Environmental Compliance and Enforcement in China: An Assessment of Current Practices and Ways Forward,
Organisation for Economic Co-operation and Development, Paris.
OECD (2009), Ensuring Environmental Compliance: Trends and Good Practices, Organisation for Economic Co-operation and
Development, Paris.
OECD (2010), National Consistency of Environmental Enforcement in OECD Countries and China: Principal Issues, Issues Paper
prepared for the stakeholder workshop “Promoting National Coherence of Environmental Enforcement in China”, Beijing,
9-10 December 2010.
OECD (2011a), Fostering Innovation for Green Growth, OECD, Paris.
OECD (2011b), Towards Green Growth: Measuring Progress – OECD Indicators, OECD, Paris.
OECD (2011c), Towards Green Growth – Tools for Delivering Green Growth, OECD, Paris.
OECD (2012), Environmental Outlook to 2050: The Consequences of Inaction, OECD, Paris.
Tour, A. de la, M. Glachant and Y. Méniere (2011), “Innovation and international technology transfer: The case of the Chinese
photovoltaic industry”, Energy Policy, Vol. 39, 761-770.

50 CHINA IN FOCUS: LESSONS AND CHALLENGES © OECD 2012
CHAPTER 4: CHINA’S 10 YEARS IN THE WTO: SUSTAINING OPENNESS-BASED GROWTH INTO THE FUTURE
Chapter 4:
China’s 10 Years in the WTO: Sustaining Openness-based Growth into the Future1
Introduction
China’s WTO accession led to deep structural changes that are at the core of its
transformation towards a modern market-based economy. In order to sustain high growth and
its position in the global economy, China needs to continue with—and in some areas accelerate—
structural reforms. This includes removing remaining pockets of border and behind-the-border
protection, progressive reforms of the state-owned enterprise sector and agriculture, as well as
rethinking of its strategy with respect to raw materials markets. Reforms of services sectors, in
particular, will be key to avoid the pitfalls of middle-income transition. If China is to achieve in
services trade what it has accomplished in manufacturing then it needs to reform its services
sector in the same spirit as it has done with its manufacturing sector. Liberalised business
services will facilitate and accelerate the process of moving up the value chain; reforms of
telecommunications will foster the information economy; and, access to better and more effi cient
fi nancial services will support the development process in general.
China’s accession to the WTO as the cornerstone of its re-emergence as an economic power
The performance of the Chinese economy since its entry into the WTO in 2001 has been
spectacular, with GDP growth averaging double-digit rates, the fastest of any large economy and
well above the average growth rates of OECD countries (Figure 4.1). This achievement follows
sustained high growth through the 1980s and 1990s, making for one of the most rapid and
profound economic transformations in history. Indeed, in just three decades, measured on a
purchasing power parity (PPP) basis, China has increased its share in world output from a mere 2%
to over 13% by 2010, and now ranks as the second largest economy behind the United States.
Sustained growth has been underpinned by deep structural reforms. They have helped pave
the way for the rise of a vibrant export sector which now accounts for around a tenth of global
1 The chapter is a result of cross-directorate team effort co-ordinated by Przemyslaw Kowalski and Hildegunn Nordås under the supervision of Michael Plummer and Raed Safadi. Other OECD contributors in alphabetical order are: Max Buge, Koen De Backer, Andrea Goldstein, Richard Herd, Samuel Hill, Robert T. Klein, Vincent Koen, Andrzej Kwiecinski, Dirk Pilat, Susan F. Stone, Frank Van Tongeren and Naomitsu Yashiro. Statistical assistance of Clarisse Legendre is gratefully acknowledged.

51 CHINA IN FOCUS: LESSONS AND CHALLENGES © OECD 2012
CHAPTER 4: CHINA’S 10 YEARS IN THE WTO: SUSTAINING OPENNESS-BASED GROWTH INTO THE FUTURE
exports. This i ncreased international integration together with sustained vigorous growth has
made China an important engine of growth for the world economy. Between 2009 and 2011, the
absolute increase in Chinese GDP constituted almost 40% of the absolute increase in output in the
rest of the world. The dynamism of Chinese domestic demand has been particularly important
during the recent period of severe and protracted weakness in many advanced economies, with
the increase in world exports to China accounting for 10% of the increase in GDP in the rest of the
world in 2011.
Figure 4.1 Real GDP growth in China, other large emerging economies and the OECD
Annual average 2000-10, per cent
0
2
4
6
8
10
12
China India Indonesia Russia Brazil South Africa OECD
Source: OECD.
China’s extraordinary growth performance, and the broader transformation of the economy,
has been underpinned by a commitment to steady, incremental reforms (OECD, 2005; OECD,
2010). The main liberalisation thrust was domestic (Sally, 2009), though in part it reflected
China’s response to meet the requirements of major parties in the WTO accession negotiations
(OECD, 2005). In short, the WTO accession negotiations served as a strategic lever to consolidate,
accelerate and, fi nally, lock in the reforms that had started already in the late 1970s and accelerated
markedly after 1994 (Sally, 2009).
Simultaneously, China has signed more than 300 regional trade agreements (RTAs) (Mattoo
and Subramanian, 2011). These agreements can lead to trade diversion from non-participating
countries. China has concluded agreements with ASEAN, Peru, Chile and New Zealand, Costa
Rica, Singapore, Pakistan, and with the separate customs areas of Hong Kong, China, Macau,
China and Chinese Taipei. It is also party to the Asia-Pacifi c Trade Agreement, which includes a
number of states not covered in its other agreements, including Bangladesh, Brunei, India, Korea,
and Sri Lanka. RTA negotiations are currently underway with Australia, the Gulf Cooperation
Council, Iceland, Norway and the Southern African Customs Union. More recently, China has
engaged in negotiating a trilateral deal with Korea and Japan.2
2 MOFCOM FTA website: http://fta.mofcom.gov.cn/english/fta_qianshu.shtml

52 CHINA IN FOCUS: LESSONS AND CHALLENGES © OECD 2012
CHAPTER 4: CHINA’S 10 YEARS IN THE WTO: SUSTAINING OPENNESS-BASED GROWTH INTO THE FUTURE
China’s outstanding growth and poverty reduction record (see Chapter 9) is commensurate
with the ambition of trade and FDI liberalisation reforms undertaken both before and after its
WTO accession. Its WTO commitments are more ambitious and comprehensive than those of
other developing countries. As part of the WTO accession process, China undertook a set of
sweeping reforms that required it to lower trade barriers in almost all sectors of its economy,
provide national treatment and improved market access for goods and services and increase
protection of intellectual property rights (IPRs), improve transparency and eliminate non-tariff
barriers. China also agreed to special rules regarding subsidies and the operation of state-owned
enterprises (SOEs), in light of the state’s large role in the Chinese economy (Greene et al., 2006). On
the other hand, China is not part of the Agreement on Government Procurement but is currently
negotiating accession.
While tariffs on imports of goods had already been approximately halved in the decade
preceding China’s WTO accession, the implementation of accession commitments resulted
in a further approximate halving of tariffs during 2001-10 (Table 4.1). Importantly, upon
accession to the WTO China bound all its import tariffs in goods, giving businesses, both in
China and abroad, a clearer view of their future opportunities. China also committed to a
further phased reduction and removal of non-tariff barriers by 2010. Today Chinese tariffs
on most products are just below or at the level of bindings which are, on average, at 15.9%
for agricultural products and 9.1% for non-agricultural products (Table 4.1). In agriculture,
the highest tariffs are charged on imports of grains, sugar, tobacco and beverages, while in
manufacturing this is the case for transport equipment, textiles and clothing and leather
products. The maximum MFN tariff in agriculture in 2010 was 65% and in manufacturing
50%.3
Upon accession, China also committed to convert planned quotas on sensitive agricultural
products to less distortive tariff rate quotas (TRQs) and to allocating parts of the quotas to non-
state trading enterprises. In addition, it agreed to eliminate export subsidies, to phase out licence
controls on traded commodities, to abide by the WTO rules governing technical barriers to trade
and to limit its subsidies for agricultural production to 8.5% of the value of farm output. It is
estimated that implementation of these reforms has resulted in significant improvement in
market access for imported farm products (OECD, 2005; OECD, 2011b).4
Trade in services was a key area in the negotiations and China committed to open a broad
range of services sectors through the elimination of many existing limitations on market access.
This was particularly important since at the time of accession reforms in the goods sector were
much more advanced than those in services. For instance, as a result of WTO accession, foreign
services suppliers were to be allowed to engage in the retailing of all products and all fi rms would
have the right to import and export all goods except those subject to state trading monopolies.
Gradually, depending on specifically agreed implementation dates extending to 2008, foreign
financial institutions were to be permitted to provide services without client restrictions for
foreign currency business, local currency services to Chinese companies and, fi nally, services to
all Chinese clients. Critical sectors such as telecoms, banking and insurance were to be opened
up through the elimination of most restrictions on foreign entry and ownership, as well as
removal of a number of discriminatory practices against foreign firms. It has been estimated
that the full implementation of China’s GATS commitments would mean signifi cant reforms and
3 These maximum rates refer to HS 6-digit classifi cation.
4 Albeit to a lesser extent, China’s access to export markets improved as well, as evidenced by a signifi cant increase in agro-food exports.
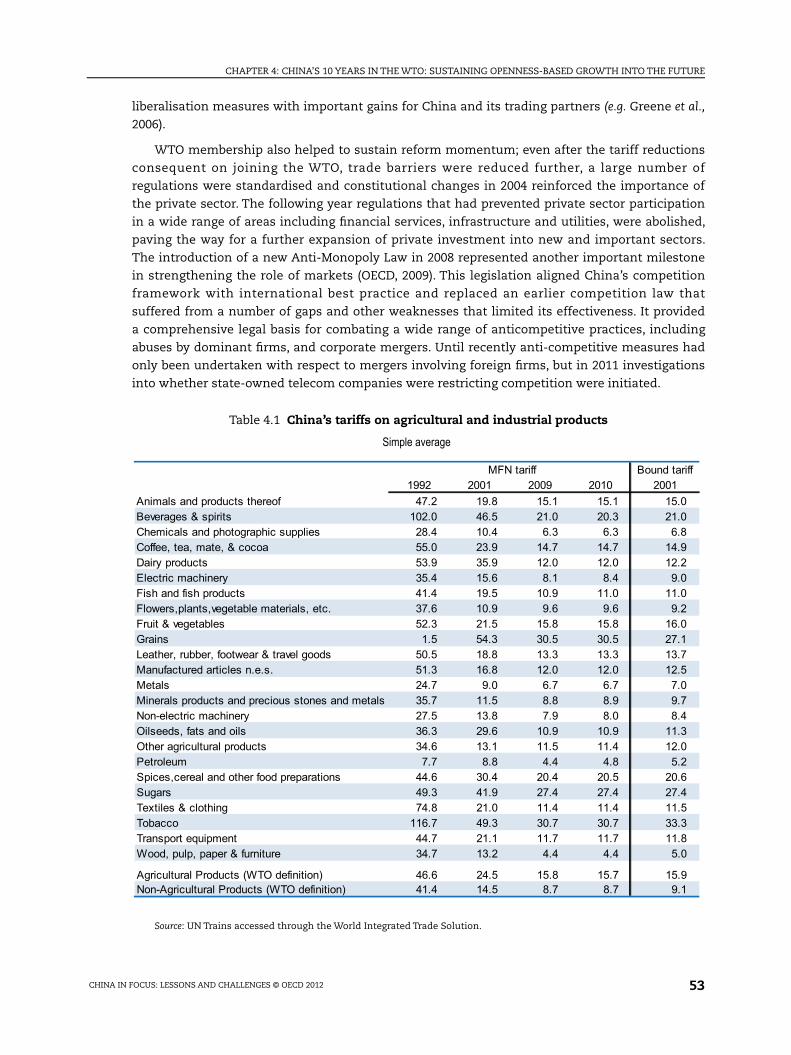
53 CHINA IN FOCUS: LESSONS AND CHALLENGES © OECD 2012
CHAPTER 4: CHINA’S 10 YEARS IN THE WTO: SUSTAINING OPENNESS-BASED GROWTH INTO THE FUTURE
liberalisation measures with important gains for China and its trading partners (e.g. Greene et al.,
2006).
WTO membership also helped to sustain reform momentum; even after the tariff reductions
consequent on joining the WTO, trade barriers were reduced further, a large number of
regulations were standardised and constitutional changes in 2004 reinforced the importance of
the private sector. The following year regulations that had prevented private sector participation
in a wide range of areas including fi nancial services, infrastructure and utilities, were abolished,
paving the way for a further expansion of private investment into new and important sectors.
The introduction of a new Anti-Monopoly Law in 2008 represented another important milestone
in strengthening the role of markets (OECD, 2009). This legislation aligned China’s competition
framework with international best practice and replaced an earlier competition law that
suffered from a number of gaps and other weaknesses that limited its effectiveness. It provided
a comprehensive legal basis for combating a wide range of anticompetitive practices, including
abuses by dominant fi rms, and corporate mergers. Until recently anti-competitive measures had
only been undertaken with respect to mergers involving foreign fi rms, but in 2011 investigations
into whether state-owned telecom companies were restricting competition were initiated.
Table 4.1 China’s tariffs on agricultural and industrial products
Simple average
Bound tariff1992 2001 2009 2010 2001
Animals and products thereof 47.2 19.8 15.1 15.1 15.0Beverages & spirits 102.0 46.5 21.0 20.3 21.0Chemicals and photographic supplies 28.4 10.4 6.3 6.3 6.8Coffee, tea, mate, & cocoa 55.0 23.9 14.7 14.7 14.9Dairy products 53.9 35.9 12.0 12.0 12.2Electric machinery 35.4 15.6 8.1 8.4 9.0Fish and fish products 41.4 19.5 10.9 11.0 11.0Flowers,plants,vegetable materials, etc. 37.6 10.9 9.6 9.6 9.2Fruit & vegetables 52.3 21.5 15.8 15.8 16.0Grains 1.5 54.3 30.5 30.5 27.1Leather, rubber, footwear & travel goods 50.5 18.8 13.3 13.3 13.7Manufactured articles n.e.s. 51.3 16.8 12.0 12.0 12.5Metals 24.7 9.0 6.7 6.7 7.0Minerals products and precious stones and metals 35.7 11.5 8.8 8.9 9.7Non-electric machinery 27.5 13.8 7.9 8.0 8.4Oilseeds, fats and oils 36.3 29.6 10.9 10.9 11.3Other agricultural products 34.6 13.1 11.5 11.4 12.0Petroleum 7.7 8.8 4.4 4.8 5.2Spices,cereal and other food preparations 44.6 30.4 20.4 20.5 20.6Sugars 49.3 41.9 27.4 27.4 27.4Textiles & clothing 74.8 21.0 11.4 11.4 11.5Tobacco 116.7 49.3 30.7 30.7 33.3Transport equipment 44.7 21.1 11.7 11.7 11.8Wood, pulp, paper & furniture 34.7 13.2 4.4 4.4 5.0
Agricultural Products (WTO definition) 46.6 24.5 15.8 15.7 15.9Non-Agricultural Products (WTO definition) 41.4 14.5 8.7 8.7 9.1
MFN tariff
Source: UN Trains accessed through the World Integrated Trade Solution.

54 CHINA IN FOCUS: LESSONS AND CHALLENGES © OECD 2012
CHAPTER 4: CHINA’S 10 YEARS IN THE WTO: SUSTAINING OPENNESS-BASED GROWTH INTO THE FUTURE
Global trade networks, global value chains and FDI
China’s economic take-off since the late 1970s owes much to its integration in global trade
networks and global value chains (GVCs). The extent of the former has been recently quantifi ed
by Reyes et al. (2009), using a centrality index. The index, measuring the likelihood that a
given country is involved in a randomly selected trade chain in the network of 217 countries,
demonstrates a truly impressive trade performance that has moved China from an isolationist
position to the core of the trade network in the space of 25 years. China is thus at the core of
many GVCs, on a par with the G3 countries (US, Japan, Germany).
China’s involvement in GVCs refl ects its increasing dependence on imported raw materials,
parts and components and services to meet the export demand for a wide range of final
capital and consumer goods. China has developed strong (manufacturing) links with East Asian
countries, particularly for the sourcing of intermediate inputs. Almost 80% of China’s processing
imports5 originate from other East Asian economies, including high technology intermediates
like parts and components (Ma et al., 2009). On the export side, the picture is more diversified
with 45% of the fi nal products assembled in processing zones exported to Europe and the United
States. This has given rise to a triangular pattern of trade in Asia, where intermediates are largely
exported from more developed countries (e.g. Korea and Japan) to China for assembly into fi nal
products, which are then exported back to developed countries.
Multinational companies (mainly from OECD countries), as the main actors in processing
trade, played a major role in integrating China into GVCs and thereby contributing to
China’s strong trade performance (OECD, 2012). In 2010, foreign-invested enterprises (FIEs,
not including firms originating from Hong Kong, China, Macau, China and Chinese Taipei)
were responsible for 55% of China’s exports and 53% of imports.6 This refl ects the impressive
progress China has made in developing a regulatory framework to attract and promote FDI
over the past three decades. Such progress has been rewarded: despite increasing competition
from other investment destinations in recent years, China continues to be cited as a favourite FDI
destination in surveys of investor sentiment.7 As well, China’s accumulated FDI stock of USD 473
billion dwarfs that of other large developing and transition economies. From 2000 to 2009, China
received larger FDI infl ows than any other developing or transition economy. During the recent
global economic crisis, the fall in FDI to China was small compared to the global FDI contraction,8
suggesting that as risks in the global economy mount China is seen as a safe destination.
While FDI inflows remain strong in absolute terms, other indicators suggest that the
contribution of FDI to China’s economy reached a plateau in the second half of the 2000s. While
still important, FDI is no longer an increasing contributor to China’s industrial output, fixed
investment and tax revenues. The share of FIEs in China’s foreign trade, having soared from
nothing at the beginning of the reform period to a peak of 58.5% in 2005, eased back to 53.8% by
2010 and continued to decline in early 2011 (Figure 4.2). This may be a cause for concern for the
government, given FIEs’ importance in China’s export-led growth so far. Up to 1997, FIE imports
exceeded their exports each year. From 1998 FIEs produced a trade surplus which rose from
USD 14 billion in 2004 to a peak of USD 171 billion in 2008 before falling to USD 127 billion in 2009
and USD 124 billion in 2010.
5 This refers to imports classifi ed as processing trade by the Chinese customs authorities.
6 Based on Chinese customs data. This share has dropped slightly during the economic crisis.
7 For example, China has been in fi rst position from 2002 to 2011 in the A.T. Kearney FDI Confi dence Index (A.T. Kearney, 2011).
8 According to UNCTAD FDI to China fell by only 2.6%, from USD 92.4 billion to USD 90 billion, while global FDI flows contracted by around 40% at the same time.

55 CHINA IN FOCUS: LESSONS AND CHALLENGES © OECD 2012
CHAPTER 4: CHINA’S 10 YEARS IN THE WTO: SUSTAINING OPENNESS-BASED GROWTH INTO THE FUTURE
There have also been important changes in sectoral composition (OECD, 2012). In 2000, the
year before China committed to opening services sectors to FDI over a fi ve-year period under the
terms of WTO accession, FDI in manufacturing accounted for 63.5% of realised FDI infl ows (OECD,
2003); by 2008, the share of manufacturing had fallen to 46.1%. From 2000 to 2008, the share of
tertiary-sector FDI grew from 30.5% to 52.3% (Davies, 2010). During that time, fi nancial-sector FDI
rose from 0.2% (banking and insurance) to 15.2% (fi nance), while FDI in real estate increased from
11.4% to 17.2% (OECD, 2003; and OECD, 2012).
Figure 4.2 Share of FIE exports and imports in total exports and imports
Percentages
0
10
20
30
40
50
60
70Exports Imports Two-way trade
Source: MOFCOM website: www.fdi.gov.cn.
China is not only an increasingly important destination of FDI fl ows, but also a source.
China (including Hong Kong, China) ranks as the fourth largest source of international
mergers and acquisitions (M&A) in 2011, with 7% of the world total (OECD 2011e).9 In just
two years China has emerged as one of the main sources of international investment in Latin
America and the Caribbean (LAC). Its share of LAC cross-border M&A jumped from only 1% in
2001-09 to 15% in 2010. In Sub-Saharan Africa, Chinese outward FDI fl ows totalled only USD
64 million between 1979 and 2000. By contrast, in 2007 alone FDI fl ows exceeded USD 1 billion,
representing more than 10% of total infl ows and contributing to half a percentage point or
above of GDP growth in some of these countries (Weisbrod and Whalley, 2011).
Trade specialisation patterns
As shown in OECD (2011a), China is a prominent example of a country that has allowed
structural change and trade in response to the forces of comparative advantage. Despite its
9 In 2010 it ranked second with 10%. The 2011 fi gures are based on linear projection based on data through 21 October 2011.

56 CHINA IN FOCUS: LESSONS AND CHALLENGES © OECD 2012
CHAPTER 4: CHINA’S 10 YEARS IN THE WTO: SUSTAINING OPENNESS-BASED GROWTH INTO THE FUTURE
fast growth and rapid accumulation of physical and human capital, China’s endowments are
still dominated by unskilled labour, as refl ected in its trade patterns. An analysis of these trade
patterns by Stone et al. (2011) using relative values for factor abundance for 1997, 2001 and
2004, showed that unskilled labour was the factor used most intensively in China’s net trade.
Accounting for the factors embodied in its imported intermediate inputs, Stone et al. (2011)
confi rmed that China’s factor content of trade refl ects its relative abundance in unskilled labour
along with the gradual emergence of a capital-intensive export sector.
Indeed, in recent decades China has been expanding revealed comparative advantage (RCA)
in unskilled labour-intensive, but also in human capital-intensive and technology-intensive,
products (Kowalski and Bottini, 2011). Many OECD countries such as the United States and
Germany, for example, have been expanding RCA in human capital-intensive and technology-
intensive products but progressively losing it in unskilled-labour intensive products. This
suggests that most of the structural adjustment associated with the integration of selected
emerging market (SEM) economies, including China, with the world economy may have been
borne by unskilled labour-intensive sectors. Moreover, data suggests that these trends are not
easing. China had a RCA in over 70% of unskilled labour-intensive products in the early 1990s and
this share has been climbing steadily over 1988-2008, while in Germany for instance, this share
has been gradually declining (Figure 4.3).
That China’s integration in world markets has been predominantly based on exports of
labour-intensive products is also reflected in the importance of processing trade which has
shaped China’s trade performance. Such trade allows fi rms to import intermediate inputs without
paying custom duties, provided that these inputs are solely used for the production of fi nal goods
destined for third markets. This trade regime prompted multinationals to move some of their
manufacturing to China’s SEZs and elsewhere after WTO accession, enabling them to benefit
from China’s comparative advantage in labour intensive assembly processes. The success of this
approach and the export processing zones is refl ected in the increasing share of processing trade
in China’s total exports (see Chapter 5).
Overall, China’s trade patterns have not been changing as rapidly as in other emerging
economies. Mobility of export specialisation patterns is generally higher in SEMs as compared
to some more advanced OECD economies suggesting that their export structures evolved more
(Kowalski and Bottini, 2011). This mobility correlates with the extent of expansion of world
market shares. Yet, China stands out as one of the exceptions to this fi nding, with a relatively low
mobility of export specialisation compared to some more advanced OECD economies and much
lower mobility than other SEMs (e.g. Indonesia, India or Brazil); at the same time, China recorded
the largest increase in world market share (600% in the period 1990-2007) in the whole 56-country
sample use in the study.
Accordingly, China’s record trade expansion has likely been driven less by changes in
specialisation patterns than by a general increase in exported volumes across many products.
This might reflect the size effect, whereby structural changes triggered by opening up by a
very large country are not as profound as would be the case for a small country, but it does
suggest relatively modest relative price changes. Gilbert (2012) arrived at a similar conclusion
by studying trade performance of a number of Asian countries with the use of constant market
shares analysis which decomposes changes in world trade fl ows into: (i) world growth effects;
(ii) commodity effects; (iii) market effects; and (iv) competitiveness effects. The study found that
China’s trade expansion has been driven predominantly by the competitiveness effect. These
results may illustrate the effects of broad factors underpinning trade competitiveness in China.
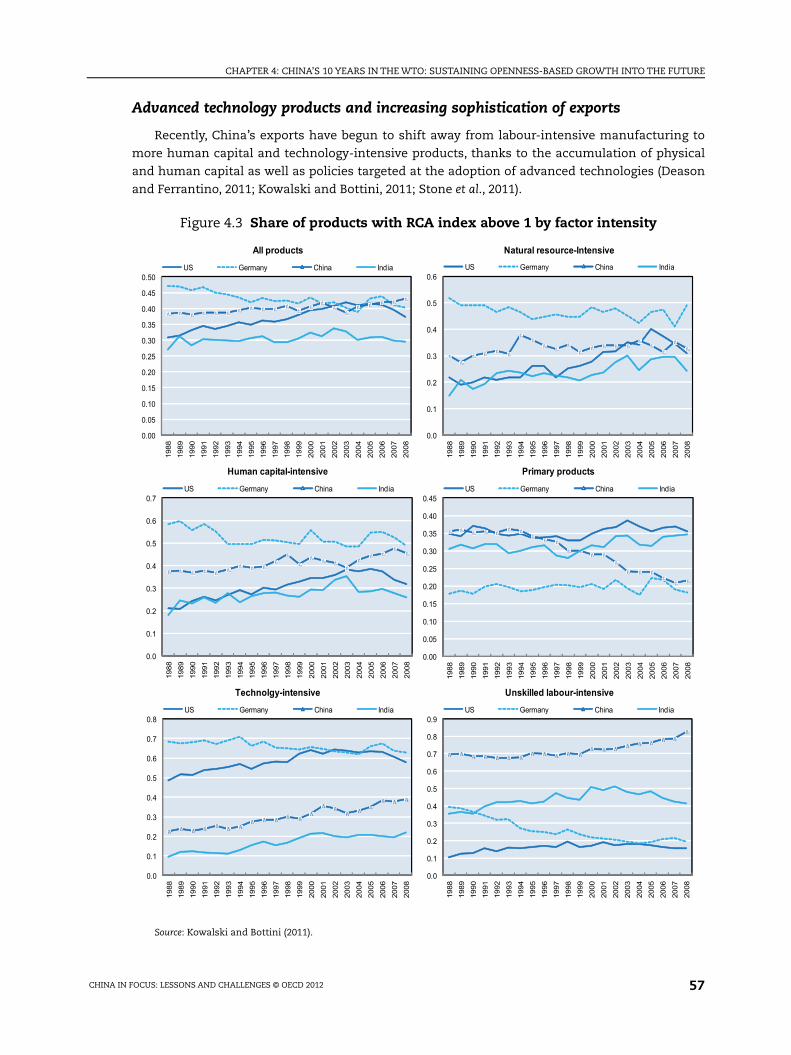
57 CHINA IN FOCUS: LESSONS AND CHALLENGES © OECD 2012
CHAPTER 4: CHINA’S 10 YEARS IN THE WTO: SUSTAINING OPENNESS-BASED GROWTH INTO THE FUTURE
Advanced technology products and increasing sophistication of exports
Recently, China’s exports have begun to shift away from labour-intensive manufacturing to
more human capital and technology-intensive products, thanks to the accumulation of physical
and human capital as well as policies targeted at the adoption of advanced technologies (Deason
and Ferrantino, 2011; Kowalski and Bottini, 2011; Stone et al., 2011).
Figure 4.3 Share of products with RCA index above 1 by factor intensity
Unskilled labour-intensive
All products Natural resource-Intensive
Primary products Human capital-intensive
Technolgy-intensive
0.0
0.1
0.2
0.3
0.4
0.5
0.6
1988
1989
1990
1991
1992
1993
1994
1995
1996
1997
1998
1999
2000
2001
2002
2003
2004
2005
2006
2007
2008
US Germany China India
0.00
0.05
0.10
0.15
0.20
0.25
0.30
0.35
0.40
0.45
1988
1989
1990
1991
1992
1993
1994
1995
1996
1997
1998
1999
2000
2001
2002
2003
2004
2005
2006
2007
2008
US Germany China India
0.0
0.1
0.2
0.3
0.4
0.5
0.6
0.7
1988
1989
1990
1991
1992
1993
1994
1995
1996
1997
1998
1999
2000
2001
2002
2003
2004
2005
2006
2007
2008
US Germany China India
0.0
0.1
0.2
0.3
0.4
0.5
0.6
0.7
0.8
1988
1989
1990
1991
1992
1993
1994
1995
1996
1997
1998
1999
2000
2001
2002
2003
2004
2005
2006
2007
2008
US Germany China India
0.0
0.1
0.2
0.3
0.4
0.5
0.6
0.7
0.8
0.9
1988
1989
1990
1991
1992
1993
1994
1995
1996
1997
1998
1999
2000
2001
2002
2003
2004
2005
2006
2007
2008
US Germany China India
0.00
0.05
0.10
0.15
0.20
0.25
0.30
0.35
0.40
0.45
0.50
1988
1989
1990
1991
1992
1993
1994
1995
1996
1997
1998
1999
2000
2001
2002
2003
2004
2005
2006
2007
2008
US Germany China India
Source: Kowalski and Bottini (2011).

58 CHINA IN FOCUS: LESSONS AND CHALLENGES © OECD 2012
CHAPTER 4: CHINA’S 10 YEARS IN THE WTO: SUSTAINING OPENNESS-BASED GROWTH INTO THE FUTURE
While the OECD countries continue to hold larger stocks of capital and skilled labour, their
rates of accumulation of these factors fall well behind the SEMs, indicating signifi cant changes
in relative factor abundance over time. This is especially true for China and India. For example,
while the capital-to-labour ratio is estimated to have increased by respectively 84% in the United
States and 61% and Germany in 1990-2005, in China it shot up by 314%. Still, in 2005 the Chinese
ratio was only about one tenth of the United States (Stone et al., 2011). Kowalski (2011) showed
the importance of capital-to-labour ratios and human capital indicators in explaining volumes
and patterns of trade, noting the still relatively low ranking of the BRIIC (Brazil, Russia, India,
Indonesia, China and South Africa) countries with respect to these indicators. The high rates of
income growth and investment in physical and human capital in recent decades suggests that
important changes in trade structures, such as an expansion of these countries’ shares in exports
of capital-intensive and human capital-intensive products, are likely to continue.
Deason and Ferrantino (2011) argue that China’s rapid growth featuring above-average
accumulation of both physical and human capital by global standards was a precondition for the
attraction of certain kinds of goods and the movement of comparative advantage on Heckscher-
Ohlin grounds. However, China’s recent exports of advanced technology (ATP) products have
been associated with the encouragement of FDI and processing trade, and the development of
a variety of government policy zones associated with further incentives. Each of these factors is
associated with a high share of ATP exports. However, Deason and Ferrantino (2011) argue that
it would not have been possible to predict which goods would be subject to rapid product cycles
in advance of the adoption of such policies. They argue that “when the personal computer came,
it would eventually come to China, as well as to other countries with similar patterns of factor
accumulation that adopted policies designed to attract fi nal assembly. China’s size, along with
the encouragement of regional agglomerations by policy, may also have led to nation-specific,
sector-specifi c economies of scale and learning-by-doing, making it more likely that once having
moved to China, the products would be likely to stay there.”
Yet, the increasing sophistication of China’s exports has also been helped by high levels
and growth rates of R&D investment making China one of the major players in the global R&D
landscape. In 2010, China became the largest R&D investor in purchasing power parity terms,
ahead of Japan (OECD, 2011f). While all R&D performing sectors have contributed to this growing
R&D investment, it was especially the enterprise sector that has increased its R&D efforts,
accounting for 73% of total R&D expenditure in 2009. Foreign fi rms played an important role in
this process, as China has become an attractive location for R&D investment due to the size of
its domestic market, the availability of high-quality human resources, and a growing domestic
capability for science and innovation (OECD, 2008; 2011d; see also Chapter 5).
Moving up the income ladder and sustaining openness-based growth
Since 1960 many countries have successfully climbed the development ladder from low to
middle-income status, while only few have made the second leap to high-income status. Japan
and Korea are two notable examples of countries that have previously been poor and have
managed to join the ranks of high-income countries. In contrast, for decades now, many countries
in Latin America and the Middle East have failed to move from middle to high-income status,
though this situation is now changing as growth in Latin America accelerates. As recently pointed
out by Eichengreen et al. (2011), there is a possibility that China’s growth may start to slow when
the country’s per capita income reaches around USD 17,000 in year-2005 constant international

59 CHINA IN FOCUS: LESSONS AND CHALLENGES © OECD 2012
CHAPTER 4: CHINA’S 10 YEARS IN THE WTO: SUSTAINING OPENNESS-BASED GROWTH INTO THE FUTURE
prices. 10 If indeed China’s growth were to be maintained until incomes reached this level, it
would still be a very positive outcome. GDP per capita would then be 40% above the average
income levels in Chile, Mexico and Turkey in 2011 and on a par with those in Hungary and Poland.
The point at which this slowdown might occur is far from certain as there is little consensus on
the current level of GDP measured in purchasing-power parity terms, but it seems likely to occur
between 2015 and 2020. Even using nominal incomes and market exchange rates, China is rapidly
reaching the high-income threshold as defined by the World Bank. For example, in 2013 Gross
National Income per capita is projected by the OECD to reach over half the high-income boundary
and may reach two-thirds of that level by the end of the 12th Five Year Plan.
After that point, China may be entering a phase where opportunities for catch-up growth
are beginning to diminish and growth may gradually slow. The 12th Five Year plan recognises the
need to adapt polices in order to minimise the scale of this slowdown. The 2010 OECD Economic
Survey of China (OECD, 2010) gives recommendations for reform in the areas of the product,
labour and fi nancial markets, as well as highlighting the reforms necessary to achieve socially-
inclusive growth. The remainder of this paper showcases other recent and current OECD work
focusing on trade and investment-related growth bottlenecks, those related to structural change
and accumulation of resources, as well as those related to productivity enhancement.
Reforms of the agriculture sector
Despite being the world’s largest exporter of manufacturing products, China still relies to
a large extent on its agricultural sector both economically and socially. The sector accounts for
38.1% of total employment but only 10.3% of GDP (as of 2009); agriculture labour productivity
is less than one sixth of that in manufacturing and less than one fourth of that in services.
Interestingly, these productivity gaps have increased over the period 1990-2008 when China’s
share of agriculture in GDP has been falling more rapidly than the sector’s share in total
employment (OECD, 2011b). Hence, there remains a considerable potential for productivity gains
associated with shifting employment from agriculture to other sectors. Such an adjustment
is already been underway and is estimated to have contributed significantly to China’s overall
productivity growth in recent decades (OECD, 2010). Yet, the high share of agriculture in
employment also points to major labour market adjustment challenges that China needs to
overcome as it seeks to transit towards a high-income economy status.
Raising incomes in the countryside remains a policy priority (see also Chapter 2). The major
objectives are: doubling rural household incomes by 2020; increasing grain production capacity
by 50 million tonnes by 2020 to sustain 95% self-sufficiency in grain production; improving
food safety; environmental protection; agricultural competitiveness; and improving social and
technical infrastructure in rural areas (OECD, 2011b). To meet this first goal China has been
making commendable efforts to improve rural infrastructure and to improve access to basic
public services such as education, health care and social security for the rural population (OECD,
2010). A recent OECD evaluation of agricultural policy developments (OECD, 2011b) suggests that
overall China has been making good progress in this area. In particular, support to agricultural
producers – as measured by the OECD Producer Support Estimate (PSE) – has increasingly been
taking the form of direct income support payments, which are less distortive for production and
more effi cient at enhancing farmers’ incomes. However, a signifi cant part of budgetary transfers
is still allocated to lower prices of agricultural inputs such as e.g. chemical fertilisers, distorting
production and harming the environment (OECD, 2011b).
10 The income defi nition used by Eichengreen et al. (2011) is GDP per capita, PPP (constant 2005 international $).

60 CHINA IN FOCUS: LESSONS AND CHALLENGES © OECD 2012
CHAPTER 4: CHINA’S 10 YEARS IN THE WTO: SUSTAINING OPENNESS-BASED GROWTH INTO THE FUTURE
China is likely to continue to face important policy questions with respect to the role
of international agro-food markets in the pursuit of its objectives of supporting farmers’
incomes, ensuring food security, as well as facilitating broader structural changes that
will take place with economic development. In recent years China has become a large net
importer of agro-food products which is one of the basic signs that the country’s productive
factors are more effi ciently employed in other sectors of the economy.11 Still, the agricultural
sector is much less integrated with global markets than the rest of the economy, as shown by
its 2.4% share in China’s total exports and 4.7% share in imports. In part this refl ects the tiny
size of Chinese farms (0.6 hectare on average), but also refl ects the trade distortions related to
the market price support provided through tariffs, tariff rate quotas (TRQ) and state trading,
combined with minimum guaranteed prices for rice and wheat, ad hoc interventions on a
growing number of agricultural commodity markets, as well as distortions related to the use
of export taxes and export quotas. While China’s support to agriculture as measured by the
percentage PSE is just above half of the OECD average, the level of support between 1995-
97 and 2008-10 quadrupled, mainly due to a signifi cantly larger gap between domestic and
border prices, and this likely had an impact on China’s competitiveness in agro-food markets.
Raw materials
It is also clear that China’s future growth will depend on its access to raw materials. The rise
of the BRICs in general, and China in particular, has been associated with large shifts on both the
demand and the supply side of global markets for raw materials. For example, during 2000-08, the
BRICs’ consumption of iron ore increased threefold while their production doubled. While world
imports of iron ore rose 83%, the imports by the BRICs increased almost six times faster during
the same period (OECD, 2011c). This has led to increasing prices (e.g. Humphreys, 2009) and efforts
to ensure a stable supply of raw materials through increased FDI. Indeed, during 2007-10 vertical
investment by steel and other raw material processing companies accounted for 37.5% of global
outward FDI and in China 63% of its outward FDI transactions concentrated on iron ore, of which
the country is a net importer since 2003.
The challenge of access to foreign raw materials has been made more difficult by the
Chinese decision to apply export quotas on sales of a number of raw materials. China chose
to apply export restrictions on some rare earths as well as on coking coal. These restrictions
are part of a diverse set of policies whose declared aim is to protect the environment (OECD,
2011c), restructuring fragmented and ineffi cient mining fi rms in order to increase the domestic
absorption of those raw materials (Price and Nance, 2010) and improving mining safety (OECD,
2011c). Export restrictions are not the most effective instrument as they are incapable of targeting
the specific market failures and have widespread negative side effects. They divert exports to
domestic markets, raise prices for foreign consumers and importers while increasing global
uncertainty and negatively affecting investment in extraction and production (Van Tongeren,
2011). Additionally, a policy-driven diversion of raw materials to domestic downstream industries
goes against the economy’s comparative advantage. Such a diversion will be diffi cult to sustain
in the long run as it reduces (increases) the profi tability of the domestic (foreign) raw materials
sector and hence has long-run effects on investment and production capacity.
A recent OECD study of export restrictions and domestic policies on steel-related raw
materials discusses the role of selected emerging economies, including China, as major
consumers and major producers of steel and steel-related raw materials, and main users of
11 However, China is deemed to have comparative advantage in several fruits and vegetables (OECD, 2011b).

61 CHINA IN FOCUS: LESSONS AND CHALLENGES © OECD 2012
CHAPTER 4: CHINA’S 10 YEARS IN THE WTO: SUSTAINING OPENNESS-BASED GROWTH INTO THE FUTURE
export restrictions (OECD, 2011c). In particular, it examines mine safety performance-linked
export licenses and export taxes in the coke coal sector. It concludes that, although in general
export licensing can be applied as a supplementary border-monitoring method, the effectiveness
of export restrictions as a measure to improve mine safety is questionable since exports of coke
accounted for only 7.3% of domestic production in 2004 and export taxes have not been related to
the management of the licensing scheme for monitoring purposes.
The impact associated with export restrictions is global in nature and can generate
retaliation, increasing the extent of global market distortions and uncertainty for prospective
investors. Timely and accurate information about various government policies affecting
exports of raw materials is a necessary condition for predictability of supply and risk
management in production. An ongoing OECD initiative attempts to contribute to improved
transparency by constructing an inventory of export restrictions on critical raw materials.12
Remaining border and behind-the-border protection
As discussed, China is already relatively open to international trade in goods. Remaining
import tariffs are not exorbitant (see Table 4.1), but in some sectors they are significantly
higher than in the OECD countries. For example, ad valorem tariffs rates on motor vehicles
exceed 20%. Other sectors with high tariffs are grains, sugar, tobacco, beverages, oil, coal and
petrochemicals, and chemicals (e.g. Kowalski and Lesher, 2011; OECD, 2011b). This suggests
that a reduction of the remaining tariff barriers would further benefit China by reducing
trade-related distortions, which hurt households by driving up prices and lead to ineffi cient
production and consumption choices.
Also, such reforms may facilitate the process of rebalancing and indeed increase the
credibility of China — one of the economies with the largest trade surpluses in the world— in the
global rebalancing debate (Kowalski and Lesher, 2011). The study fi nds that tariff liberalisation
by China and ASEAN countries could deliver an increase in these regions’ GDP of approximately
0.2% while reducing these regions’ trade surpluses by up to 1 percentage point of GDP, relative
to the baseline. A scenario combining unilateral tariff reductions with a decrease in the cost of
delivering services to these markets further magnifies the scale of rebalancing. Thus, overall,
China could alone make a significant contribution to rebalancing and, as illustrated by the
positive role openness played in these regions’ recent economic growth, this would also benefi t
fi rms and consumers in these economies.
On the FDI front, major challenges remain.13 As noted earlier, FIEs account for a declining
share of economic activity. While this is largely due to the internal dynamism of China’s
domestic economy, in particular the development of successful large enterprises whose
own contribution to the economy is growing faster than that of FIEs, it may be accentuated
by the more selective FDI policy regime that appears to have been developing in China in
12 See http://www.oecd.org/document/4/0,3746,en_2649_37431_47021508_1_1_1_37431,00.html
13 OECD (2003, 2006 and 2008). For instance, in the 2008 OECD Investment Policy Review of China, it was suggested to reconsider the discriminatory merger notifi cation procedures in the 2003 Interim Provisions on the Acquisition of Domestic Enterprises by Foreign Investors that had been retained in the 2006 Regulations on the Acquisition of Domestic Enterprises by Foreign Investors. The Ministry of Commerce has since replaced the original Chapter 5 on anti-monopoly review in the 2006 Regulations with a new article (Article 51 in the Supplementary Provisions) which states that “According to the provisions of the Anti-Monopoly Law, where M&A of a domestic enterprise by a foreign investor meets the thresholds for declaration of the Provisions of the State Council on Thresholds for Declaration of Concentrations of Undertakings, the foreign investor shall make a declaration with MOFCOM and shall not carry out the transaction without a declaration.”

62 CHINA IN FOCUS: LESSONS AND CHALLENGES © OECD 2012
CHAPTER 4: CHINA’S 10 YEARS IN THE WTO: SUSTAINING OPENNESS-BASED GROWTH INTO THE FUTURE
recent years.14 Besides, concerns about intellectual property rights (IPR) protection and
WTO accession commitments have been raised recently. The 2011 Japanese White Paper,
in particular, reiterates demands for stronger enforcement and points out that the risk of
“leaking technology and know-how from a business partner” may inhibit Japanese companies
from promoting R&D activities or transferring technologies to China (Japanese Chamber of
Commerce and Industry in China, 2011).
The OECD FDI Regulatory Restrictiveness Index (which does not include State ownership)
captures statutory restrictions on both the establishment and operations of firms that
discriminate against foreign investors. While China has been the biggest reformer since 1997,
based on a sample of 42 countries, it still maintains more restrictions than any other G20 country.
FDI infl ows are continuing to increase, yet it appears that the above-mentioned perceptions are
beginning to have a discouraging effect, initially at the margin but potentially much larger.
Reform of the state-owned sector
Outward international investment and trade by large Chinese firms, most of which remain
subject to government ownership, adds a new dimension to the challenge of sustained growth.
Recent estimates point to a reduction in the share of state ownership in the Chinese economy from
approximately 70% of total industrial assets in the late 1990s to roughly half in 2008 (Gao, 2010), still
a high share of state-ownership compared to China’s trading partners. SOE reforms in the late 1990s
resulted in privatisation, bankruptcy and consolidation of smaller SOEs, leaving remaining fi rms in a
strong market position relative to their private counterparts. The average SOE was three times larger
than an average non-state sector fi rm in late 1990s, but 15 times as large in 2008 (Gao, 2010). Despite
these reforms, there were still large numbers of loss-making state-owned enterprises and their
productivity was well below that of private sector fi rms (OECD, 2010).
In 2010, the State-owned Assets Supervision and Administration Commission (SASAC) owned
some 120 state-owned firms, with assets equalling over 60% of the country’s GDP, and the sectors
dominated by SOEs accounted for 80% of the capitalisation of domestic stock exchanges by the end
of the same year (Scissor, 2011; Szamosszegi and Kyle, 2011). Each of these 120 holding companies
has a myriad of subsidiaries. In addition, every province and city has its own SASAC supervising
locally-owned SOEs. Moreover, there are many companies where state authorities are important
shareholders such as the technology company Lenovo and the appliance multinational Haier, a legacy
of their emergence as major players before China’s private-sector reforms (Woetzel, 2008).
Although SOEs represent a small share of the country’s firms that engage in outward
activities, they carried out 81% of China’s overseas investment in 2006. However, SOEs play a
much smaller role in foreign trade, accounting for less than 10% of exports in 2007 (OECD, 2010).
The importance of state ownership for China’s role in international markets is reflected in its
WTO Accession Protocol which contains several strong “WTO-plus” commitments, with direct
implications for SOEs in the context of subsidies, including: non-discrimination with respect to
downstream customers and upstream suppliers, non-discriminatory pricing based on market
forces, and avoidance of confl ict of interest between regulatory agencies and fi rms under their
purview. These commitments provide an ambitious framework for the reform of the Chinese
14 The share of EU investors surveyed who thought policies discriminate against FIEs increased from 33% to 43% since a similar survey was conducted in 2010, while similar perceptions regarding the outlook for the next two years also increased from 36% to 46%. The fi ve most signifi cant regulatory obstacles cited by European investors were discretionary enforcement of broadly drafted laws and regulations (42%); lack of co-ordination of different regulators (40%); lack of harmonisation with global standards (39%); registration procedures for companies or for products (38%); and local implementation of Chinese standards (35%). See European Chamber of Commerce in China (2011).

63 CHINA IN FOCUS: LESSONS AND CHALLENGES © OECD 2012
CHAPTER 4: CHINA’S 10 YEARS IN THE WTO: SUSTAINING OPENNESS-BASED GROWTH INTO THE FUTURE
state-owned sector, with signifi cant potential benefi ts to both Chinese economic welfare and that
of China’s trading partners by limiting uncompetitive, market-distorting behaviour.
While these reform obligations are binding and failure to implement them is subject to
challenge at the Dispute Settlement Body (DSB), there are challenges associated with this
potential discipline, including concerns of reprisals in the fast-growing Chinese market and of the
DSB’s ability to handle structural reform issues, even those with signifi cant trade effects. Other
major problems include a relative lack of transparency about the management of SOEs, their
regulators and their upstream suppliers, most notably the fi nancial services which are key to SOE
operations and the economy overall, such as banking and insurance. For instance, recent analysis
suggests that SOEs benefi t from preferential access to fi nancing at below-market costs, without
which existing profi ts would be signifi cantly reduced (Ferri and Liu, 2010).
The sustainability of China’s growth and its commercial relationships will, therefore, depend
on its ability to develop a stronger and more transparent rules-based framework regardless of
ownership structure, particularly in key upstream sectors to the economy as a whole, such as
network industries and banking and insurance where implementation of China’s strong WTO
commitments would bring effi ciency gains in these sectors and the economy as a whole.
Ensuring such competitive neutrality and extending it to the operations of Chinese SOEs
involved in international goods and services markets are also key to China’s ambitions in
the “going outward” policy. Such initiative will help to address concerns that large Chinese
companies benefit from preferential treatment, both through favourable market access and
regulatory treatment in the home market, concessionary financing and subsidies. It may also
alleviate concerns that Chinese outbound investment could be prejudicial to recipient country
national security and operate on non-market principles. The latter could be a major barrier to
outward investment by Chinese SOEs given that market-oriented actors are key to the regulatory
apparatus in OECD countries, particularly in services. Such concerns limit the potential benefi ts
from increased international investment and trade, while also hindering the unwinding of global
imbalances.
OECD initiatives, including the Freedom of Investment Roundtable (and its Guidelines for
Recipient Country Investment Policies Relating to National Security), Due Diligence Guidance for
Responsible Supply Chains of Minerals from Confl ict-Affected and High-Risk Areas, and ongoing
work on competitive neutrality (Capobianco and Christiansen, OECD, 2011) are particularly
relevant areas where China could benefi t from deeper participation.
Services sectors reforms
The services share of GDP tends to increase over time for all countries and to rise with per
capita income. Demand for services rises as societies and individuals become richer, typically
outpacing demand for manufacturing or agricultural products. However, there are exceptions to
this rule and China is one of them. While the services share of GDP in middle-income countries
was about 56% on average in 2008, the latest year for which comparable data is available, the
share was only 42% in China. This is also below the average for low-income countries, which
stood at 50% in 2008 (based on the World Development Indicators database). Finally, while the
share of services in world trade is around 20% on average, services account for only 12% of
China’s foreign trade.
The low services share in GDP and trade in China is mirrored by a high share of goods-
producing sectors. China’s 12th Five Year Plan aims at raising the services share of GDP to 47% by

64 CHINA IN FOCUS: LESSONS AND CHALLENGES © OECD 2012
CHAPTER 4: CHINA’S 10 YEARS IN THE WTO: SUSTAINING OPENNESS-BASED GROWTH INTO THE FUTURE
2015. In fact, improving the performance of the services sectors is important because services
play an essential role in relation to many of the objectives set out in the Plan.
As discussed, after a long period of export-led growth based on comparative advantage in
labour-intensive industries, China has started to diversify production as well as exports towards
more capital and skills-intensive industries. The role of services during such a development is
multi-faceted. First, moving up the value chain is associated with rising labour productivity and
thus slower job creation in goods-producing sectors. The services sectors therefore need to take
over as the major engine of job creation in order for manufacturing to move into higher-end
products in a socially harmonious manner.
Second, although services are increasingly tradable, domestic demand is the main driver of
job creation in services. Furthermore there is a two-way relationship between services sector
developments and expansion of domestic demand. Not only do the services sectors depend on
domestic demand, but growth in private consumption also requires better developed services.
Consumer credit is for example needed to stimulate demand for big-ticket items, and access to
competitive insurance services as well as a social security network would reduce the need for
precautionary savings. Finally, a competitive retail sector offering a broad variety of consumer
goods would help further boost consumer demand.
Third, services play a crucial role for industrial upgrading to higher value added products.
While investment in physical and human capital has taken centre stage hitherto with China
already boasting one of the highest investment-share of GDP in the world, there is limited scope
for profitably raising the rate of investment further. Thus, the attention now needs to shift
towards organisational innovations and there is ample room for them both within firms and
across production networks and value chains. By allocating activities to where they contribute the
most to the competitiveness of the supply chain and trimming slack and waste, organisational
innovations can create leaner and more effective (and energy-effi cient) supply chains. They can
also help improve timeliness, reliability, quality and low fault-rates, which take on increasing
importance as products become more sophisticated or time-sensitive (Geloso-Grosso et al., 2007).
Reforms of services sectors will thus be key to avoid the pitfalls of middle-income transition
given their documented positive impact on organisational innovation and overall productivity,
including in manufacturing. Liberalisation of business services and retail services could be a fi rst
step towards a more effi cient and competitive services sector. More competitive business services
would be an important source of growth and job creation in their own right and would foster
competition in higher value added manufacturing industries. More competitive retail services
would also help stimulate domestic consumer demand. Liberalisation of network services and
fi nancial services on the other hand requires a strong institutional framework. In these sectors
foreign suppliers face relatively high barriers to entry and there is ample scope for liberalisation
to go hand in hand with institutional development such as establishing independent regulators
and a transparent regulatory framework.
Infl uence of services on export performance in manufacturing
Internal and external connectivity is key to advancing towards the technology frontier as far
as organisational innovations are concerned. Open and competitive markets in transport, logistics
and fi nance would facilitate international trade in manufactured goods. Business services including
computer services, consultancy, professional services and advertising also play a role for export
performance in manufacturing. Such services contribute to matching products to consumer tastes

65 CHINA IN FOCUS: LESSONS AND CHALLENGES © OECD 2012
CHAPTER 4: CHINA’S 10 YEARS IN THE WTO: SUSTAINING OPENNESS-BASED GROWTH INTO THE FUTURE
and to complying with local standards and regulations in the export markets. Local services suppliers
in the export markets as well as global fi rms with a local presence are often best placed to provide
such services. Multinational companies typically have their own in-house or global services suppliers
that support their trade and production activities. Local fi rms would benefi t from having access to a
similar services supplier base, and would be the major benefi ciaries of service trade and investment
liberalisation. If China’s openness towards FDI in fi nancial services and business services approached
the OECD average, the export share of manufacturing output of local fi rms could go up by 10.5 and 7.5
percentage points respectively (Nordås, 2008).
The role of business services in moving up the value chain
China is the world’s largest exporter of clothing and apparel, and hitherto its trade has been
dominated by exports with intra-industry trade way below the global average for the industry.15
China’s global market share has, however, peaked as the most labour-intensive segments of the
industry have moved on to some of the fastest growing exporters of clothing such as Bangladesh
and Vietnam. In order to remain competitive in the textiles and clothing industry, while
supporting earnings that attract young people with middle class aspirations, China needs to
move up-market. A more developed business services sector would facilitate such a process.
Figure 4.4 Average services trade costs relative to domestic transaction costs, total services 2005
0.0
0.1
0.2
0.3
0.4
0.5
0.6
0.7
0.8
0.9
1.0
DE
UC
HE
GB
RN
LDU
SA
DN
KFR
AS
WE
IRL
BE
LIT
ALU
XE
SP
AU
TN
OR
GR
CH
UN
CA
NJP
NC
ZE FIN
PO
LLV
AC
HN
AU
SP
RT
ES
TS
VN
KO
RLT
US
VK
ME
XN
ZL IDN
Note: The services trade costs are calculated as suggested by Jacks et al. (2011): bilateral trade cost are calculated on the basis of information of exports, imports, output and local sales of services. The calculated trade costs have been normalised using min-max. The country with the lowest trade costs is thereby assigned a value of zero and the country with the highest trade costs a value of unity.
The Chinese motor vehicle industry has grown rapidly from mainly supplying parts and
15 In 2008 the Grubel-Lloyd intra-industry trade index was estimated to 0.05 for HS category 61 and 0.06 for HS category 62, compared to international average of about 0.25 for both sectors. These are averages estimated for 6-digit categories. For motor vehicles the index was 0.32, as compared to an international average of 0.20.

66 CHINA IN FOCUS: LESSONS AND CHALLENGES © OECD 2012
CHAPTER 4: CHINA’S 10 YEARS IN THE WTO: SUSTAINING OPENNESS-BASED GROWTH INTO THE FUTURE
components to FIEs to developing local brands that are taking an increasing share of the local
low-end market. So far, exports of fi nal products in this sector are low, but intra-industry trade
is relatively high, though dominated by FIEs. In the same way as the presence of the major car
manufacturers helped local car manufacturers enter the market, the presence of supporting
business services may help local producers develop their brands, distribution and after sales
services in export markets.
As discussed, many countries before China have faced the middle-income transition problem.
This can be attributed inter alia to the diffi culty of transition to the services economy after the
manufacturing share of employment has peaked. OECD work shows that regulatory reform as
well as openness to trade and investment improves performance both in the liberalised services
sector and their downstream customers not least in manufacturing. In sum, competitive services
industries are essential for achieving China’s objectives of moving up the value chain, a larger role
for domestic consumption as a driver of future growth, improved energy effi ciency, the creation
of jobs attractive for the growing number of young, skilled people who aspire to the middle class,
and, of course, raising the share of services in GDP.
The importance of telecommunications in fostering the information economy
Telecommunications play an important role in economic development. Telecoms
infrastructure provides the information highway in the information economy, and early evidence
found a causal link between investment in telecommunications and economic growth in OECD
countries where telecommunications accounted for about a third of observed growth during
1970-90 (Röller and Waverman, 2001). In the past, telecommunications were provided by state-
owned monopolies in virtually all countries. During that period the sector was static with similar
market structure and features as utilities. However, the technical revolution in the sector in
the past three decades both facilitated and was driven by reforms such as commercialisation,
privatisation and eventually trade liberalisation. At the same time, due to signifi cant economies
of scale and network effects, the sector remains regulated whenever a supplier with signifi cant
market power is identified. Best practice includes a regulator independent both of the major
telecoms providers and the state.
In China the state still owns virtually all telecoms providers. Furthermore, regulation is
scattered around several institutions where the Ministry of Industry and Information Technology
(MIIT) is the lead agency for the industry responsible for licensing and other regulations. Price
regulation is carried out in concert with the National Development and Reform Commission
(NDRC) and the Ministry of Finance (MOF). NDRC’s price supervision and anti-monopoly
department also is charged with enforcing China’s anti-monopoly law, while SASAC administers
the state’s ownership in the sector and its decisions also have the force of regulation. For issues
involving internet video and music, the State Administration of Radio, Film, and Television (SARFT)
also has regulatory authority, in cooperation with MIIT.
China’s draft telecommunications law has been 12 years in the making. The last draft was
made available to the public in 2009. To date, the law has yet to be promulgated and the telecom
regulation fi rst issued in 2000 by the State Council, last updated in 2009, remains in force.
The 2011 NDRC-MOFCOM Catalogue for the Guidance of Foreign Investment in Industry notes
that telecommunications services are a “restricted” sector for foreign investment (in contrast to
“prohibited” or “encouraged”). Value-added telecom services are limited to a 50% foreign equity
share, while domestic and international basic telecommunications services, including mobile

67 CHINA IN FOCUS: LESSONS AND CHALLENGES © OECD 2012
CHAPTER 4: CHINA’S 10 YEARS IN THE WTO: SUSTAINING OPENNESS-BASED GROWTH INTO THE FUTURE
voice and data services, as well as domestic and international services, are limited to a 49%
foreign equity share. These limits are also refl ected in China’s GATS schedule. However, foreign
firms’ access to the Chinese market may be further restricted by the licensing regime, where
there appears to be uncertainty regarding the extent to which foreign fi rms may obtain a license
to operate, particularly in basic telecommunications (Voon and Mitchell, 2010).
The telecommunications sector has developed rapidly in China and infrastructure
development has outpaced middle income countries as well as other developing countries in
East Asia and Pacifi c. In addition, broadband penetration has picked up relatively more quickly
than mobile. Thus, it appears so far that the policy regime has served China well. However, as the
technology becomes more complex and the market matures, both local companies and consumer
access to state of the art telecommunications services may be limited by concerns over the
uncertainty facing foreign investors.
The role of fi nancial services in the development process
Financial development is not only a robust determinant of economic growth, it is also a good
predictor of future growth (Levine, 1998; Sala-i-Martin, 1997). Financial development, in turn is
determined by institutional factors such as creditors’ rights, the rule of law in enforcing contracts
(Levine et al., 2000) and openness to trade and investment in fi nancial services (Claessens et al.,
2001). Using standard measures of financial development such as interest rate spreads, credit
to the private sector as share of GDP and the ratio of commercial banks assets to central bank
assets, credit appears to be readily available in China. The interest rate spread, however, is much
lower than in other middle income countries or the regional average, and it has been fairly
constant over time, reflecting government regulation. China has, nevertheless, committed to
move towards market-driven interest rates in its fi nancial industry following the entry into the
WTO.
In accordance with China� WTO commitments in financial services including banking,
insurance, financial leasing, �inance corporations, trusts and investment corporations,
currency and insurance brokers, foreign investment is limited to a 49% share in investment
fund management companies, and 33% for firms that underwrite and trade government and
corporate bonds, domestic shares and Hong Kong-listed mainland companies. Chinese investors
must hold a controlling stake of futures companies (NDRC-MOFCOM guidelines). In order to
establish a wholly-owned foreign bank or a branch of a foreign bank it must have established a
representative offi ce in China for at least two years. Furthermore, wholly-owned foreign banks
must have assets of at least USD 10 billion, while USD 20 billion is required to establish a branch
of a foreign bank. Banks that seek to establish a joint-venture with a Chinese bank are not subject
to the two-year wait, however. Finally, foreign-invested banks must have operated for three years,
with two consecutive years of profit before they may provide services in local currency. After
receiving a permit for local currency, branches of foreign banks must have a minimum of 300
million yuan in registered capital, and are still not permitted to issue bank cards, and can only
take yuan deposits of at least 1 million from Chinese citizens.
Additional restrictions apply to foreign equity investment in existing financial institutions.
These include regulatory approval by the China Banking Regulatory Commission (CBRC). Inbound
investment by a single foreign fi nancial institution is limited to a 20% minority stake, and only the
Chinese-invested fi nancial institution that would receive the investment can request approval from
CBRC. If the total number of foreign investors exceeds 25% in a non-listed financial institution, it

68 CHINA IN FOCUS: LESSONS AND CHALLENGES © OECD 2012
CHAPTER 4: CHINA’S 10 YEARS IN THE WTO: SUSTAINING OPENNESS-BASED GROWTH INTO THE FUTURE
becomes subject to rules applied to foreign-invested fi nancial institutions. In addition to the ceiling
on foreign investment in existing fi nancial institutions, investors in Chinese commercial banks must
have assets of at least USD 10 billion, while investors in urban and rural credit unions or non-bank
fi nancial institutions must have assets of at least USD 1 billion.
According to China’s WTO commitments, the foreign suppliers are also subject to certain
regulations. All foreign investment in the insurance sector is subject to regulations that include
30 years of business history, a minimum of USD 5 billion in assets, a representative office in
China for at least two years before applying, and a minimum registered/operating capital of 200
million yuan or foreign currency equivalent. Foreign investment is limited to a 50% share of life
insurance joint-ventures.
Summary and conclusions
The performance of the Chinese economy since its entry into the WTO has been spectacular
and has been underpinned by a commitment to steady incremental reforms since the beginning
of reforms in late 1970s. China’s WTO commitments were ambitious and comprehensive and
led to deep structural changes that are at the core of China’s transformation towards a modern
market-based economy.
Participation in global trade networks and global value chains has been pivotal to China’s
economic success, as was FDI. Overall, China’s opening, specialisation and growth were built
very much on the principles of comparative advantage, as indicated by its relative abundance in
labour, its factor content of trade, the importance of processing trade and positioning of China in
global value chains. As a result of accumulation of physical and human capital, encouragement of
FDI and processing trade, and development of a variety of government SEZs, China has gradually
begun to develop strengths in human capital and technology-intensive products.
Yet, there are signs that China may be entering the difficult middle-income transition
period. Recent OECD research indicates that sustained growth, and China’s position in the global
economy, depends on continuation of structural reforms. This includes removing remaining
pockets of border and behind-the-border protection, continued reforms of the SOE sector and
agriculture, as well as rethinking of strategy with respect to raw materials markets.
Reforms of services sectors will be key to escaping the middle-income trap given their
documented positive impact on organisational innovation and overall productivity, including in the
manufacturing sector. This is evidenced by the important role that business services play in moving
up the value chain, the role of telecommunications services in fostering the information economy,
and the role financial services in the development process in general. The current level of state
involvement in both planning and production is likely to get in the way of innovation-led growth,
particularly in the services sector where process and organisational innovations are relatively more
important. Competition in the services sectors is therefore important for continued growth and trade
liberalisation and domestic reforms go hand in hand in creating more competitive and innovative
services markets supporting growth and the creation of good jobs.
BIBLIOGRAPHY
A.T. Kearney (2011), Foreign Direct Investment Confi dence Index.
Capobianco, A. and H. Christiansen (2011), “Competitive Neutrality and State-Owned Enterprises: Challenges

69 CHINA IN FOCUS: LESSONS AND CHALLENGES © OECD 2012
CHAPTER 4: CHINA’S 10 YEARS IN THE WTO: SUSTAINING OPENNESS-BASED GROWTH INTO THE FUTURE
and Policy Options”, OECD Corporate Governance Working Papers, No. 1.
Claessens, S., A. Dermirgüç-Kunt and H. Huizinga (2001), “How Does Foreign Entry Affect Domestic Banking
Markets?”, Journal of Banking and Finance, Vol. 25, pp. 891-911.
Davies, K. (2010), Inward FDI from China and its policy context, Columbia FDI Profi les, Vale Columbia Center
on Sustainable International Investment, New York.
Deason, L. and M. Ferrantino (2011), “Determinants of Diffusion and Downstreaming of Technology-Intensive
Products in International Trade”, in Globalisation, Comparative Advantage and the Changing Dynamics
of Trade, OECD Publishing.
European Chamber of Commerce in China (2011), European Chamber Business Confidence Survey 2011,
Beijing.
Eichengreen, B., D. Park and K. Shin (2011), “When Fast Growing Economies Slow Down: International Evidence
and Implications for China”, NBER Working Paper No. 16919.
Ferri, G. and Li-Gang Liu (2010), “Honor Thy Creditors Beforean Thy Shareholders: Are the Profi ts of Chinese
State-Owned Enterprises Real?”, Asian Economic Papers, Vol. 9, No. 3.
Gao, X. (2010), “State-owned enterprises in China: How big are they?” , available at: http://blogs.worldbank.
org/eastasiapacifi c/state-owned-enterprises-in-china-how-big-are-they
Geloso-Grosso, M., E. Pinali and H.K. Nordås (2007), “Logistics and Time as a Trade Barrier”, OECD Trade Policy
Working Papers, No 35.
Gilbert, J. (2012), “Employment and Structural Changes in Asia in Times of Rebalancing and Adjustment”,
Asian Development Bank Working Papers, forthcoming.
Greene, M., Dihel, N., Kowalski, P. and D. C. Lippoldt (2006), “China’s Trade and Growth: Impact on Selected
OECD Countries”, OECD Trade Policy Working Papers, No. 44, OECD Publishing.
Humphreys, D. (2009), “The Great Metals Boom: A Retrospective”, Resources Policy, Vol. 35, No. 1.
Jacks, D.S., C.M. Meissner and D. Novy (2011), “Trade Booms, Trade Busts and Trade Costs”, Journal of
International Economics, Vol. 83, pp. 185-201.
Japanese Chamber of Commerce and Industry in China (2011), 2011 White Paper on the Chinese Economy and
Japanese Companies, Beijing.
Kowalski, P. (2011), “Comparative Advantage and Trade Performance: Policy Implications”, OECD Trade Policy
Working Papers, No. 121, OECD Publishing.
Kowalski, P. and N. Bottini (2011), “Comparative Advantage and Exports Specialisation Mobility”, in
Globalisation, Comparative Advantage and the Changing Dynamics of Trade, OECD Publishing.
Kowalski, P. and M. Lesher (2011), “Global Imbalances: Trade Effects and Policy Challenges”, OECD Trade Policy
Working Papers, No. 120, OECD Publishing.
Levine, R. (1998), “The Legal Environment, Banks and Long-Run Economic Growth”, Journal of Money, Credit
and Banking, Vol. 30, pp. 596-620.
Levine, R., N. Loayza and T. Beck (2000), “Financial Intermediation and Growth: Causality and Causes”, Journal
of Monetary Economics, Vol. 44, pp. 31-77.
Nordås, H.K. (2008), “The Impact of Services Trade Liberalisation on Trade in Non-Agricultural Goods”, OECD
Trade Policy Working Paper No. 81.
Ma, A., A. Van Assche and H. Chang (2009), “Global Production Networks and China’s Processing Trade”, Journal
70 CHINA IN FOCUS: LESSONS AND CHALLENGES © OECD 2012
CHAPTER 4: CHINA’S 10 YEARS IN THE WTO: SUSTAINING OPENNESS-BASED GROWTH INTO THE FUTURE
of Asian Economics, Vol. 20, No. 6.
Mattoo, A. and A. Subramanian (2011), “China and the World Trading System”, World Bank Policy Research
Papers, No. 5897.
National Bureau of Statistics (2011), China Statistical Yearbook 2011, China Statistics Press.
OECD (2000), “Main Determinants and Impacts of Foreign Direct Investment on China’s Economy”, Working
Papers on International Investment, Number 2000/4.
OECD (2003), Investment Policy Review of China, OECD, Paris.
OECD (2005), OECD Economic Surveys: China, OECD, Paris.
OECD (2006), Investment Policy Review of China, OECD, Paris.
OECD (2008), OECD Reviews of Innovation Policy – China, OECD, Paris.
OECD (2009), OECD Reviews of Regulatory Reform – China: Defi ning the Boundary Between the Market and the
State, OECD, Paris.
OECD (2010), OECD Economic Surveys: China, OECD Publishing.
OECD (2011a), Globalisation, Comparative Advantage and the Changing Dynamics of Trade, OECD Publishing.
OECD (2011b), Agricultural Policy Monitoring and Evaluation 2011, OECD, Paris.
OECD (2011c), “Exports Restrictions and Domestic Policies on Steel related Raw Materials”, OECD Trade Policy
Working Papers, forthcoming.
OECD (2011d), Attractiveness for Innovation – Location Factors for International Investment, OECD, Publishing.
OECD (2011e), Investment News, No. 16.
OECD (2011f), Science, Technology and Industry Scoreboard 2011, www.oecd.org/sti/scoreboard
OECD (2012), “China Investment Policy Review Update”, mimeo.
Price, A. and D. S. Nance (2010), “Export Barriers and the Steel Industry”, in The Economic Impact of Export
Restrictions on Raw Materials, OECD, Paris.
Röller, L.H and L. Waverman (2001), “Telecommunications Infrastructure and Economic Development: A
Simultaneous Approach”, The American Economic Review, Vol. 91, pp.909-923.
Reyes, J., M., Garcia and R. Lattimore (2009), “The International Economic Order and Trade Architecture”, in
Globalisation and Emerging Economies: Brazil, Russia, India, Indonesia, China and South Africa, OECD
Publishing.
Sala-i-Martin, X. (1997), “I Just Ran a Million Regressions”, The American Economic Review, Vol. 87 pp.178-183.
Sally, R. (2009), “Globalisation and the Political Economy of Trade Liberalisation in the BRIICS”, in Globalisation
and Emerging Economies: Brazil, Russia, India, Indonesia, China and South Africa, OECD Publishing.
Scissor, D. (2011), “Chinese State-Owned Enterprises and U.S.-China Economic Relations, Testimony before the
U.S.-China Economic and Security Review Commission”, March 30th.
Szamosszegi, A. and C. Kyle (2011), “An Analysis of State-owned Enterprises and State Capitalism in China”,
U.S.-China Economic and Security Review Commission, Washington DC.
Stone, S. F., R. H. Cavazos Cepeda and A. Jankowska (2011), “Have Changes in Factor Endowments Been
Refl ected in Trade Patterns?”, in Globalisation, Comparative Advantage and the Changing Dynamics of
Trade, OECD Publishing.

71 CHINA IN FOCUS: LESSONS AND CHALLENGES © OECD 2012
CHAPTER 4: CHINA’S 10 YEARS IN THE WTO: SUSTAINING OPENNESS-BASED GROWTH INTO THE FUTURE
Van Tongeren, F. (2011), “The Impact of Export Restrictions on Raw Materials on Trade and Global Supply”, in
Globalisation, Comparative Advantage and the Changing Dynamics of Trade, OECD Publishing.
Voon, T. and A. Mitchell (2010), “Open for Business? China’s Telecommunications Services Market and the
WTO”, Journal of International Economic Law, Vol. 13, pp. 321-378.
Weisbrod, A. and J. Whalley (2011), “The Contribution of Chinese FDI to Africa’s Pre Crisis Growth Surge”, NBER
Working Papers, No. 17544.
Woetzel, J. (2008), “Reassessing China’s State-Owned Enterprises”, The McKinsey Quarterly (July).
World Trade Organization (2001), Accession of the People’s Republic of China, WT/L/432, 23 November 2001,
WTO, Geneva.

72 CHINA IN FOCUS: LESSONS AND CHALLENGES © OECD 2012
CHAPTER 5: MOVING UP THE VALUE CHAIN: CHINA’S EXPERIENCE AND FUTURE PROSPECTS
Chapter 5:
Moving up the Value Chain: China’s Experience and Future Prospects
Introduction
The past decades have witnessed a trend towards the international dispersion of value
chain activities such as design, production, marketing, and distribution. Different stages in
the production process are increasingly located across different economies according to their
comparative advantage. This chapter discusses China’s role in the rise of Global Value Chains
(GVCs) and some key issues for China in upgrading its role in GVCs.
Multinational enterprises (MNEs) are major actors in GVCs as they seek to optimise their task
allocation to maximize value added and cost competitiveness. With an abundant labour force
as its main asset, China has attracted large infl ows of FDI to establish manufacturing facilities
engaging in labour intensive processes such as fi nal assembly.
This chapter fi rst discusses China’s role within GVCs as the “World’s Factory” by describing
the large volume of so called “processing trade” and MNEs’ contribution to it, and explores the
role played by imported intermediate inputs in China’s relatively sophisticated exports. It pays
special attention to the value-added that China earns from its current GVC activity by presenting
some of the latest fi ndings by the OECD on the mapping of GVCs.
The section that follows describes the strategy for China’s upgrading within GVCs.1
It emphasizes the necessity of strong technological capabilities in developing high
quality, innovative products, and the accumulation of other strengths such as intellectual
property, human capital and organisational assets, often summarized as intangible assets.
It finds that China’s intangible assets, in line with distribution of physical assets, are
disproportionally concentrated in state controlled enterprises. Considering the highly
dynamic and entrepreneurial nature of innovation, China’s upgrading within GVC will
increasingly need to be led by enterprises that have a strong business and profi t orientation.
The internationalization of private firms in particular could be a way to strengthen their
innovation capabilities and foster their role in GVC upgrading.
1 The term “Upgrading” refers to the increased creation of value added in a GVC, not necessarily to whether a firm is engaged in upstream or downstream activities in the production process. For example, activities with high value added might also be found downstream in the value chain, e.g. in distribution, marketing or after-sales service.

73 CHINA IN FOCUS: LESSONS AND CHALLENGES © OECD 2012
CHAPTER 5: MOVING UP THE VALUE CHAIN: CHINA’S EXPERIENCE AND FUTURE PROSPECTS
A final section concludes by offering a perspective on China’s new role in GVC as global
demand shifts to emerging economies, China being the most prominent.
China’s involvement in global value chains
In the past thirty years the share of China in world exports has risen from less than one
percent to 10% (see also Chapter 4). China’s rapid integration into GVCs has been most apparent
in processing trade which contributed heavily to the rapid growth of China’s exports. The share
of processing trade in China’s exports increased rapidly in the late 1980s to mid 1990s and has
remained near to 50% while its volume grew by an average annual rate of 17% between 1991 and
2010 (Figure 5.1). The processing trade regime allows firms to import intermediate inputs free
of custom duties, provided that these inputs are solely used for the production of final goods
destined for third markets. This trade regime has been extremely successful in attracting the
assembly activities of MNEs that seek to apply China’s comparative advantage in labour-intensive
activities to enhance their cost competitiveness.
Figure 5.1 China’s processing trade and ordinary exports
8%
32%
48%
56% 55% 50%
0
10
20
30
40
50
60
0
10,000
20,000
30,000
40,000
50,000
60,000
70,000
1981-1985 1986-1990 1991-1995 1996-2000 2001-2005 2006-2010
Other types of Special Exports
Processing Trade Exports
Ordinary Exports
Share of Processing Exports (%; Right Axis)
Expo
rts
(10
0 m
illio
n U
SD)
Source: 2010 China Statistical Yearbook, China Custom.
Processing trade constitutes an important part of the “triangle trade” in which parts and
components are produced by more developed Asian countries, as well as other advanced
countries, and then exported to China where the assembly of the different intermediates into
fi nished products takes place. The assembled fi nal products are either exported back those Asian
countries or exported to other developed countries/regions such as the United States and Europe
where they may undergo some additional processing (packaging, marketing, etc.).
The share of foreign invested enterprises (FIEs; mostly affi liates of OECD MNEs) in processing

74 CHINA IN FOCUS: LESSONS AND CHALLENGES © OECD 2012
CHAPTER 5: MOVING UP THE VALUE CHAIN: CHINA’S EXPERIENCE AND FUTURE PROSPECTS
trade rose rapidly during the expansion of processing trade as a share of China’s exports,
indicating that FIEs are the main driver of processing trade (Figure 5.2). While FIEs conducted only
39% of processing trade in 1992 their weight has increased over time, to nearly 70 % at the end
of 1990s, and to 85% in 2008. The scope of FIEs involvement in GVCs is not limited to processing
trade. Their share in ordinary exports has also risen, from only 5% in 1992 to 29% in 2008 (Figure
5.3). This suggests that the activities of FIEs in China, as well as China’s involvement in GVCs, are
increasingly not just assembly of imported inputs but also include local procurement and other
interactions with Chinese industries that go beyond the processing trade regime.
Figure 5.2 The share of FIEs in ordinary exports and exports based on the processing trade regime
5%
9%7% 6%
12% 13% 14%16%
19%22% 23% 24%
26% 27% 28% 29% 29% 29% 29%
39%
48%
54%57%
63% 64%66% 67%
71% 72%75%
79%81%
83% 84% 84% 85% 84% 84%
0%
10%
20%
30%
40%
50%
60%
70%
80%
90%
1992 1993 1994 1995 1996 1997 1998 1999 2000 2001 2002 2003 2004 2005 2006 2007 2008 2009 2010
The
Shar
e of
FIE
s in
Exp
orts
Ordinary Exports
Processing Trade Exports
Source: Feenstra and Wei (2010), China Custom.
Integration into GVC has played an essential role in China’s industrial development. China
hosts the assembly of goods embodying sophisticated technology and high quality intermediate
goods, which allows it to tap into the cutting edge technology that was not available in the
domestic market (Breznitz and Murphree, 2011). Processing trade has not only contributed to
China’s export-led growth, but also to improvements in quality. China’s exports are considerably
more sophisticated than those of other emerging economies (Rodrik, 2006). Empirical studies
report that processing trade has been the major factor driving the high skill-intensity of China’s
exports and also explain its similarity to exports of OECD countries (Amiti and Freund, 2010;
Xu and Lu, 2009). Participation in GVCs enabled China to upgrade its industrial production and
exports through the use of sophisticated imported intermediate goods.
Over the past decades, China has increased its share of world exports in high technology
industries such as computer equipment as well as mid to low technology industries like textiles.

75 CHINA IN FOCUS: LESSONS AND CHALLENGES © OECD 2012
CHAPTER 5: MOVING UP THE VALUE CHAIN: CHINA’S EXPERIENCE AND FUTURE PROSPECTS
Furthermore, within high-technology industries, China has increased its share in high quality
products (products with a high unit value – or average price – of exports) although its expansion
was most pronounced in low to medium quality products (OECD, 2011b). The unit values of
China’s exported products have grown strongest in industries importing intermediate goods
with high unit values. Figure 5.3 plots the growth of the unit values of China’s exports relative
to growth of world average unit values between 1995-2007 (vertical axis) against the unit values
of China’s imported intermediates goods compared to the world average (horizontal axis). The
size of the circle corresponds to the import value of intermediate inputs. The positive relation
suggests that imports of higher quality intermediate goods played a signifi cant role in enabling
China to upgrade the quality of its export goods, especially in industries like Radio, TV and
Communication equipment or Electronic Components.
Figure 5.3 Growth in the unit value of China’s exports and the role of imported intermediates
Source: OECD (2011c) “Export Competition: Price or Quality?” STI Working Paper, forthcoming.
However, the large role of imported inputs in China’s sophisticated exports raises a question
on how much of China’s exports are actually made in China? What does China’s dependency on
imported intermediate inputs imply about China’s indigenous technological capabilities and the
nature of its contribution to GVCs?
The extent of a country’s specialization within GVC can be inferred by observing the share
of imported inputs in the total inputs used to produce its exports (Hummels et al, 2001). The
OECD STAN Input-Output Database describes the sale and purchase relationships between
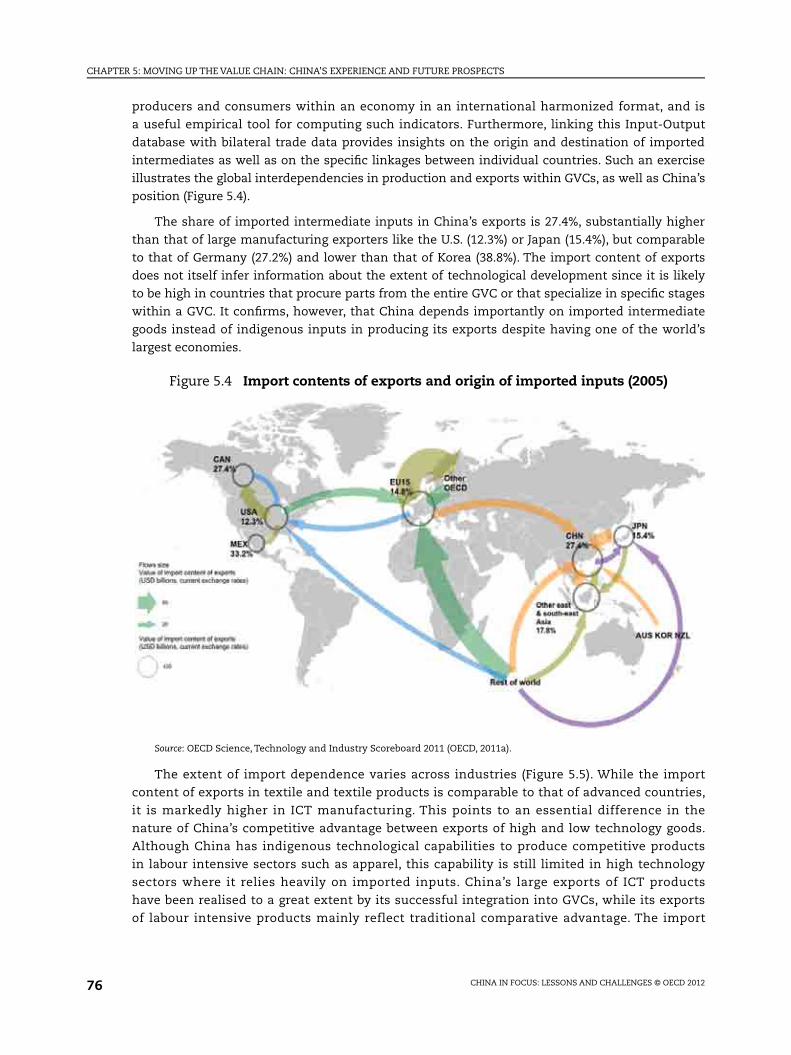
76 CHINA IN FOCUS: LESSONS AND CHALLENGES © OECD 2012
CHAPTER 5: MOVING UP THE VALUE CHAIN: CHINA’S EXPERIENCE AND FUTURE PROSPECTS
producers and consumers within an economy in an international harmonized format, and is
a useful empirical tool for computing such indicators. Furthermore, linking this Input-Output
database with bilateral trade data provides insights on the origin and destination of imported
intermediates as well as on the specifi c linkages between individual countries. Such an exercise
illustrates the global interdependencies in production and exports within GVCs, as well as China’s
position (Figure 5.4).
The share of imported intermediate inputs in China’s exports is 27.4%, substantially higher
than that of large manufacturing exporters like the U.S. (12.3%) or Japan (15.4%), but comparable
to that of Germany (27.2%) and lower than that of Korea (38.8%). The import content of exports
does not itself infer information about the extent of technological development since it is likely
to be high in countries that procure parts from the entire GVC or that specialize in specifi c stages
within a GVC. It confi rms, however, that China depends importantly on imported intermediate
goods instead of indigenous inputs in producing its exports despite having one of the world’s
largest economies.
Figure 5.4 Import contents of exports and origin of imported inputs (2005)
Source: OECD Science, Technology and Industry Scoreboard 2011 (OECD, 2011a).
The extent of import dependence varies across industries (Figure 5.5). While the import
content of exports in textile and textile products is comparable to that of advanced countries,
it is markedly higher in ICT manufacturing. This points to an essential difference in the
nature of China’s competitive advantage between exports of high and low technology goods.
Although China has indigenous technological capabilities to produce competitive products
in labour intensive sectors such as apparel, this capability is still limited in high technology
sectors where it relies heavily on imported inputs. China’s large exports of ICT products
have been realised to a great extent by its successful integration into GVCs, while its exports
of labour intensive products mainly reflect traditional comparative advantage. The import

77 CHINA IN FOCUS: LESSONS AND CHALLENGES © OECD 2012
CHAPTER 5: MOVING UP THE VALUE CHAIN: CHINA’S EXPERIENCE AND FUTURE PROSPECTS
content of exports of China is also relatively low in the motor vehicle industry, which may be
due to the co-location of many global parts suppliers in China.2
Figure 5.5 Import contents of exports for China and selected countries (mid 2000)
16% 16%
32%
14%
22%21%
27%30%
10%
24%
45%
16%
25%
19%
42%
0
0.1
0.2
0.3
0.4
0.5
0.6
0.7
0.8
China United States Germany Japan Korea
Textiles, textile products, leather and footwear
Motor vehicles, trailers and semi-trailers
ICT Manufacturing (Computer, Communication Machinery, Precision Machinery etc.)
Source: OECD STAN Input-Output Database.
The high import content of China’s exports - especially in ICT manufacturing – suggests that
China’s competitiveness within GVCs is still concentrated in processing and assembling activities.
However, its role as the world’s assembler allows China to generate only limited value added
compared to other countries engaging in more technology and knowledge intensive activities
within GVCs. This can be observed from the ratio of value added to industrial output in three
major ICT manufacturing industries (Figure 5.6). China retains less value added from production
of ICT manufacturing compared to other large manufacturing exporters, especially in office,
accounting and computing machinery. While the import content of exports in ICT manufacturing
is high for Korea as well (Figure 5.5), its higher ratio of value added to production suggests that it
is specializing in higher value added activities within the GVC for ICT manufacturing.
Based on an alternative computation method, Koopman et al. (2008) estimated that the share
of domestic value-added created from processing trade exports is less than 20%. A more accurate
2 The GVC of the auto industry is often highly regionalized due to explicit or implicit requirements to locate assembly in the fi nal market as well as pressure from auto makers on their suppliers to co-locate with the car factory in foreign markets for technical necessities and operational reasons such as just-in-time production (Van Biesebroeck and Sturgeon, 2010).

78 CHINA IN FOCUS: LESSONS AND CHALLENGES © OECD 2012
CHAPTER 5: MOVING UP THE VALUE CHAIN: CHINA’S EXPERIENCE AND FUTURE PROSPECTS
picture comes from a case study of the Apple I-Phone4. China exports the I-Phone4 at a unit price
of just over USD 194, but generates only about USD 6.5 of value added. The largest portion of
value added from the production of the I-phone is accounted for by imported intermediate inputs
from countries providing key components, such as Korea.3
Figure 5.6 The ratio of value added to production for ICT manufacturing (2005)
12%
31%
28%
24%
19%22%
36%34%
25% 25%27%
38%
50%
39%
28%
0%
10%
20%
30%
40%
50%
60%
Chin
a
Uni
ted
Stat
es
Ger
man
y
Japa
n
Kore
a
Chin
a
Uni
ted
Stat
es
Ger
man
y
Japa
n
Kore
a
Chin
a
Uni
ted
Stat
es
Ger
man
y
Japa
n
Kore
a
Office, Accounting and Computing Machinery
Radio, TV and Communication Equipment
Medical, Precision and Optical Equipment
Source: OECD STAN Input-Output Database.
However, there is growing evidence that China’s upgrading within GVC is on its way. First,
China’s ordinary exports have increased drastically and amounted to USD 721 billion in 2010,
almost the same as Japan’s total exports. Unlike processing trade, ordinary exports involve
high domestic value-added and are mainly due to indigenous Chinese fi rms (Figure 5.6). While
ordinary trade is concentrated in relatively labour intensive sectors (Koopman et al., 2008), it
involves activities that create higher value added than fi nal assembly, such as the production of
intermediate inputs or the governance of China’s own GVCs.
Secondly, China’s share in world exports has increased not only in fi nal products, but also
in parts and components. Between 1995 and 2007, China’s share in world’s export of parts
and components increased by 9.2% while that by the U.S. and Japan dropped by 6.3% and 7.1%
respectively. The structure of Chinese exports has been changing and a substantial portion
3 Based on iSuppli for materials and Ali-Yrrkö et al. (2010) for distribution margins.

79 CHINA IN FOCUS: LESSONS AND CHALLENGES © OECD 2012
CHAPTER 5: MOVING UP THE VALUE CHAIN: CHINA’S EXPERIENCE AND FUTURE PROSPECTS
of China’s exports in radio, television and communication equipment, electronic machinery
and offi ce, accounting and computing machinery involve intermediate goods, suggesting that
China has become a key supplier of parts and components (Figure 5.7).4
Figure 5.7 The composition of China’s manufacturing exports (2010)
Note: Percentage values indicate the share in total exports.
Source: OECD STAN Database Bilateral Trade Database by Industry and End , as described in Zhu et al. (2011)
Lastly, while processing trade is mostly due to FIEs, the part due to Chinese firms is
shifting from simple contract assembly to “full-package” manufacturing where Chinese
firms control all stages from material procurement to product design. Until recently the
majority of processing trade by Chinese firms consisted of simple assembly contracts
where material, equipments or product blue prints were transferred by foreign firms
(Figure 5.8), Chinese firms now import parts and components themselves and decide
on the quantity, price and specification of products to be exported to foreign firms to a
certain extent 5 This upgrading of processing exporters is analogous to the emergence of
OEM (Original Equipment Manufacturing) observed in some other Asian countries, as an
important early stage of GVC upgrading.
4 However, such intermediate goods may also be processed and assembled from imported parts and components. For example, Japanese SMEs that supply inputs to large electronics companies often relocate their assembly plants to China in order to respond to pressures to reduce costs. These SMEs exports key components to their Chinese plants and re-import the fi nished products.
5 Perhaps not surprising, 90% of processing trade by FIEs has been “full-package” given the role of FIEs as assembling and exporting branches of MNEs.

80 CHINA IN FOCUS: LESSONS AND CHALLENGES © OECD 2012
CHAPTER 5: MOVING UP THE VALUE CHAIN: CHINA’S EXPERIENCE AND FUTURE PROSPECTS
Figure 5.8 Processing trade exports by indigenous Chinese fi rms
42%
47% 49%51%
55%
62%
0%
10%
20%
30%
40%
50%
60%
70%
0
100
200
300
400
500
600
700
800
2005 2006 2007 2008 2009 2010
Proc
essi
ng T
rade
(100
mill
ion
USD
)Pure Assembly (来料加工装配贸易)
Full-Package(进料加工贸易)
Ratio of Full-Package PT(Right Axis:%)
Source: China Custom.
Strategies for China’s upgrading within global value chains
As China aims for further upgrading within GVCs, an important focus will need to be on
strengthening its indigenous technological capability, which will be essential for China to supply
parts and components that embody higher value added and contribute to the competitiveness of
the whole value chain. The necessary innovation requires also that Chinese fi rms develop their
own intangible assets, e.g. high-quality intellectual property, supported by an effective IPR regime,
or a stronger ability to perform more complex tasks in GVCs. Such assets are increasingly the
key to earning sustained profits in a context of fierce global competition. Indeed, investments
in intangible assets have intensifi ed in the past decades in many OECD economies and are now
sometimes larger than investments in tangible assets, e.g. in the United States (Corrado et al.,
2010). The scope of intangible assets as suggested by Corrado et al. (2005) includes:
• Computerized Information: knowledge embedded in computer programs (software) or
databases.
• Innovative property: scientific and engineering R&D and non-R&D innovation investments
such as expenditure to develop copyrights, designs and trademarks, as well as new products.
• Economic competency: brand equity, fi rm specifi c human capital, investments in organizational
change and development.
Although upgrading in GVCs is often described as a vertical concept such as moving up from
assembly to product design, the most fundamental stage of upgrading starts from horizontal
process where a firm or a country realizes substantially higher efficiency or sophisticated
product development within the same stage in a GVC by deepening of technological capability

81 CHINA IN FOCUS: LESSONS AND CHALLENGES © OECD 2012
CHAPTER 5: MOVING UP THE VALUE CHAIN: CHINA’S EXPERIENCE AND FUTURE PROSPECTS
(Morrison et al. 2008). Such upgrading involves the realization of significantly higher process
management abilities (higher productivity, lower defect rates or the ability to process complex
orders), or the substantial deepening of technology and skill intensity of products (Kaplinski and
Morris, 2002). This kind of horizontal upgrading is considered a pre-requisite for more advanced
ways of upgrading. The case study of the apparel GVC by Gereffi (1999) provides a good example.
East Asian firms first upgraded from simple contract assemblers to OEM (Original Equipment
Manufacturing) where they controlled the whole production process including quality control,
aimed at meeting international standards. This process upgrading was followed by a transition
to ODM (Original Design Manufacturing) where these firms acquired the ability to develop
new products on their own. Intensified cost competition with other emerging or developing
economies prompted some firms to further upgrade into OBM (Original Brand Manufacturing)
which integrates their manufacturing expertise with design and sales of their own branded
merchandise.6
Strengthening China’s performance in process and product innovation is thus the important
fi rst step toward GVC upgrading. Strengthening indigenous capabilities, e.g. through investment
in research and development (R&D) also shapes the ability of fi rms to absorb external knowledge
(Cohen and Levinthal, 1990). For instance, technology spillovers from FIEs have been found to
benefit only the domestic firms engaging in R&D (for example, Girma et al., 2008, Blalock and
Gertler, 2009).
Climbing up the technology ladder is an essential part of China’s GVC upgrading, but is
clearly not the whole picture. The value generated from innovation by some parties can be
extracted by other parties that hold assets that are vital to the while operation of a GVC (Teece,
1986). By leveraging their ownership of key intangible assets (such as product brands or key
designs) that defi nes the competitiveness of the whole value chain, lead fi rms will try to establish
a monopolistic position within a specifi c stage of a GVC. Becoming a “bottleneck” in a GVC allows
those firms to appropriate a large portion of the total value added created by a value chain
(Jacobides et al., 2006). For example, by providing key design and acting as the “guarantor of
quality” of products processed through its GVC, Apple Inc. captures about 45% of the total value
of the I-Phone4. Chinese fi rms will also need to focus on developing such assets – again often
intangible in nature – and make the necessary strategic investments.
The focus on investment in intangible assets raises challenges for the management of
intangible assets, which is more complex than for tangible assets as the value and return from
such investments are often harder to infer (Lev, 2001). China also needs to strengthen awareness
on the value of intangibles assets and build up experience in managing intangibles. Recent
improvements in IPR protection and legal enforcement, for example, may encourage Chinese
enterprises to value intangible assets as an important driver of profits and a strategic tool for
business growth (Waldmeir, 2011).
Policies to support China’s upgrading in GVCs are generally consistent with policies fostering
enterprise-led innovation, improvements in framework conditions often being the key. The 2008
OECD Review of Innovation policy provides an extensive review of China’s innovation policies,
including the framework conditions for innovation (Box 5.1; OECD, 2008a). The remainder of this
section highlights the importance of enhancing the role of profi t driven enterprises in China’s
upgrading.
6 It is recognized that participation in GVCs per se does not guarantee upgrading. While MNEs governing the GVC often assist quality upgrading by their suppliers, they do not help suppliers’ upgrading if this may erode their core competencies or weaken their position within a GVC (Humphrey, 2004).

82 CHINA IN FOCUS: LESSONS AND CHALLENGES © OECD 2012
CHAPTER 5: MOVING UP THE VALUE CHAIN: CHINA’S EXPERIENCE AND FUTURE PROSPECTS
Box 5.1 Policy recommendations on the framework conditions for innovation in China
• Improve the enforcement of intellectual property rights protection, as a condition both for attracting knowledge-intensive FDI and for increasing the propensity of domestic fi rms to innovate.
• Foster competition, notably through the adoption of modern and effective antitrust legislation to encourage fi rms to put innovation more at the centre of their business strategies.
• Continue to improve corporate governance, with a view to improving incentives for business to invest in R&D and innovation.
• Foster open and effi cient capital markets to support the founding of new and innovative ventures, entry into new markets and the development of innovative products and services.
• Implement innovation-oriented public procurement policy with care to avoid hampering China’s prospects for joining the World Trade Organization’s (WTO) Government Procurement Agreement (GPA), which will open public procurement markets abroad to Chinese fi rms, and those in China to foreign fi rms.
• Use technology standards to foster innovation following international best practices, in line with WTO regulations, avoiding distortions of national and international competition which may eventually stifl e innovation.
Source: OECD (2008a), OECD Innovation Policy Reviews – China.
China has invested heavily in strengthening its technology capabilities over the past
decade. In absolute (PPP) terms, China became the world second largest spender on R&D in
2009, overtaking Japan and lagging only the United States (OECD, 2011a). The growth in R&D
expenditure has mainly been driven by the enterprise sector which increased in-house R&D
expenditure at an annual average rate of 25% between 2000 and 2009. The enterprise sector’s R&D
investments accounted for 73% of China’s R&D in 2009.
Expenditure on R&D is, however, only part of the investment in technology capabilities
that Chinese fi rms have been engaging in over the past decade (Table 5.1). Chinese enterprises
invest more resources in new product development and also in technology renovation (defi ned
as the application of the latest technology to existing products, technology and equipment to
improve production effi ciency and quality) than on in-house R&D. Between 2000 and 2009, such
investments have grown at an annual average rate of 27% and 14% respectively. The amount of
technology renovation expenditure was much larger than R&D in 2000, supporting the view that
incremental efforts in adapting the latest technologies have been an important driver of China’s
industrial development (Breznitz and Murphree, 2011).
However, a notable feature of investments in innovation in China’s enterprise sector is the
concentration of such activities in state-owned enterprises (SOEs) or state-controlled enterprises
(Figure 5.9) 7. These companies account for about 45% of R&D expenditure, 44% of expenditure
on new product development and 70% of expenditure on technology renovation. Moreover,
expenditures on the absorption and adaptation of externally acquired technology are dominated
by SOEs. However, their innovation output is much less pronounced. For example, their weight
in the application of inventive and other patents (utility and design) is only 35.3% and 28.9%
respectively, and SOEs account for a low share of overall exports.
7 Large and medium enterprises are firms with sales over 30 million Yuan, employment of more than 300 persons and assets over 40 million Yuan. As seen from Table 5.1, those enterprises conduct the majority of in-house R&D.

83 CHINA IN FOCUS: LESSONS AND CHALLENGES © OECD 2012
CHAPTER 5: MOVING UP THE VALUE CHAIN: CHINA’S EXPERIENCE AND FUTURE PROSPECTS
Upgrading is a competitive process which requires rigorous and successful innovation relative
to rival firms (Kaplinski and Morris, 2002). It requires firms to focus on their core competence,
and to identify and exploit new processes, products or markets (Teece, 2007). This “Dynamic
Capability” for market selection is most likely to be strongest in Chinese fi rms that have a strong
business and profit orientation. It is therefore essential that profit-driven enterprises such as
private enterprises play an important role in China’s upgrading. Moreover, as noted in recent
OECD work, young and entrepreneurial firms play a critical role in innovation, in particular in
driving more radical forms of innovation (OECD, 2010a; 2011a). Increasing the weight of profit
seeking entrepreneurs in China’s innovation drive is therefore essential to achieving sustainable
economic growth based on productivity improvements (OECD, 2010b).
Table 5.1 Technology expenditures by Chinese industrial enterprises
Source: 2010 China Statistical Yearbook on Science and Technology.
While private enterprises account for 71% of the total number of domestic enterprises, only
4% of these fi rms conduct R&D. This is partly due to the fact that 96% of private enterprises are
small fi rms.8 Those fi rms are also often young, sometimes managed by relatively inexperienced
personnel and lack the capability to absorb, adapt and create new technology (Zhang et al, 2009).
Shortage of funds and knowledge in managing successful innovation processes can prevent
private enterprises from investments in innovation and intangible assets. It is thus essential
to support the technological capability building of private enterprises and expand their role in
China’s GVC upgrading.
One promising approach is to promote the internationalization of private enterprises.
Internationalization such as exports or FDI rewards fi rms with larger and more stable cash fl ow,
which allows them to make continuous investments (Shaver, 2011). It also motivates efforts to
upgrade quality and technology because the expected returns from such investments can be
reaped from foreign markets in addition to the domestic market. Trade liberalisation, which
facilitates export entry, is often seen to promote innovation activities as well (Lileeva and Trefl er,
2010, Bustos, 2011). Internationalisation also provides important opportunities for fi rms to acquire
new knowledge from foreign markets. It allows fi rms to learn about the world’s latest innovation
and business strategies of foreign competitors, as well as to acquire ideas for innovation from
foreign customers (Salomon, 2006).
8 Due to high uncertainty and large initial cost, small enterprises generally face barriers in conducting R&D activity and engaging in other innovation investments. In 2009, while 62% of China’s large enterprises conducted R&D, this share was 28% for medium sized enterprises and less than 10% for small enterprises.
(100 Million yuan) 2000 2009 Annual Average Growth rate
In-House Expenditure on R&D 489.7 3775.7 25%
of which by Medium and Large Enterprises 353.4 3210.2 28%
Expenditure on New Products Development 529.5 4482.0 27%
Expenditure for Acquisition of Foreign Technology 304.9 422.2 4%
Expenditure for Assimilation of Foreign Technology 22.8 182.0 26%
Expenditure for Purchase of Domestic Technology 34.5 203.4 22%
Expenditure for Technical Renovation 1291.5 4344.7 14%

84 CHINA IN FOCUS: LESSONS AND CHALLENGES © OECD 2012
CHAPTER 5: MOVING UP THE VALUE CHAIN: CHINA’S EXPERIENCE AND FUTURE PROSPECTS
Figure 5.9 Share of State-owned enterprises and State-controlled enterprises in technology expenditure (2009)
44.6% 44.1%51.2%
73.7% 68.7% 69.7%
44.1%35.3%
28.9%
Intramural R&D expenditure
Expenditure on New Product Development
Expenditure for Acquisition of
Foreign Technology
Expenditure for Assimilation of
Foreign Technology
Expenditure for Purchase of Domestic
Technology
Expenditure on Technology Renovation
New Product Sales
Patent Application (Inventive)
Patent Application
(Utility, Design)
State Owned and State Controlled Enterprises Others
Source: 2010 Statistics on Science and Technology Activities of Industrial Enterprises
FDI is especially an important mode of internationalization where Chinese enterprises absorb
spillovers from foreign knowledge clusters and acquire intangible assets. For example, globalized
enterprises like Haier, Huawei and Lenovo have undertaken extensive FDI in OECD countries
to establish production and R&D bases (Bonaglia et al., 2007). Such FDI is not only motivated in
bypassing non-tariff barriers but also in acquiring innovative property such as advanced R&D,
design and technology in which OECD countries hold a comparative advantage, as well as to
establish global brand recognition through operations in advanced markets (Deng, 2007).
Most Chinese FDI providers are owned or controlled by the state. A full analysis of the
ownership of foreign assets is not possible as offi cial statistics do not breakdown corporations
into those that are state-controlled and those that are privately controlled. However, at least
two-thirds of the stock of non-fi nancial FDI belonged to SOEs in 2010. The ten largest Chinese
multinational enterprises by FDI stock are all SOEs and more than half are operating in the
natural resources sector (OECD 2008b).Companies registered as private enterprises account for
only slightly over 1% of foreign investment. More profi t oriented FDI, motivated by the strategic
acquisition of intangible assets and the need for GVC upgrading, would be benefi cial.
The shift in global markets and opportunities for China
As the weight of the world economy shifts from OECD countries to emerging countries,
it is likely that the end markets served by GVCs will shift as well, with China being the most
prominent future end market. This shift will bring substantial structural change to existing GVCs
and provides both opportunities and challenges for China’s upgrading.
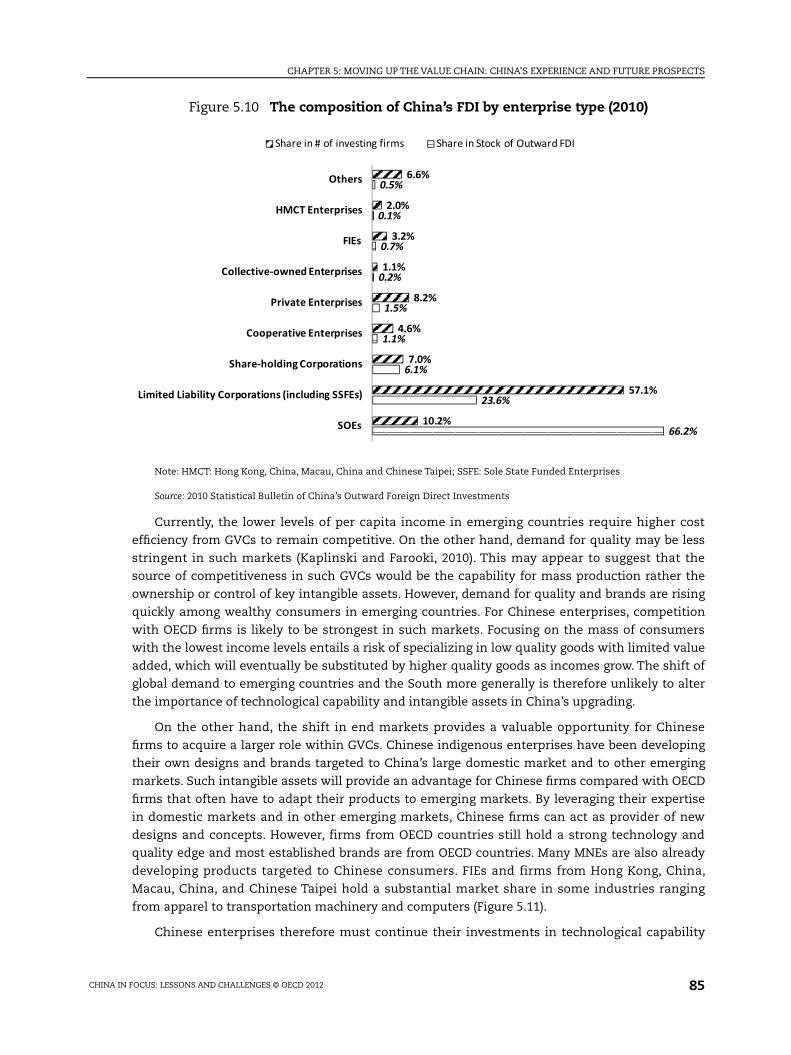
85 CHINA IN FOCUS: LESSONS AND CHALLENGES © OECD 2012
CHAPTER 5: MOVING UP THE VALUE CHAIN: CHINA’S EXPERIENCE AND FUTURE PROSPECTS
Figure 5.10 The composition of China’s FDI by enterprise type (2010)
66.2%
23.6%
6.1%
1.1%
1.5%
0.2%
0.7%
0.1%
0.5%
10.2%
57.1%
7.0%
4.6%
8.2%
1.1%
3.2%
2.0%
6.6%
SOEs
Limited Liability Corporations (including SSFEs)
Share-holding Corporations
Cooperative Enterprises
Private Enterprises
Collective-owned Enterprises
FIEs
HMCT Enterprises
Others
Share in # of investing firms Share in Stock of Outward FDI
Note: HMCT: Hong Kong, China, Macau, China and Chinese Taipei; SSFE: Sole State Funded Enterprises
Source: 2010 Statistical Bulletin of China’s Outward Foreign Direct Investments
Currently, the lower levels of per capita income in emerging countries require higher cost
effi ciency from GVCs to remain competitive. On the other hand, demand for quality may be less
stringent in such markets (Kaplinski and Farooki, 2010). This may appear to suggest that the
source of competitiveness in such GVCs would be the capability for mass production rather the
ownership or control of key intangible assets. However, demand for quality and brands are rising
quickly among wealthy consumers in emerging countries. For Chinese enterprises, competition
with OECD fi rms is likely to be strongest in such markets. Focusing on the mass of consumers
with the lowest income levels entails a risk of specializing in low quality goods with limited value
added, which will eventually be substituted by higher quality goods as incomes grow. The shift of
global demand to emerging countries and the South more generally is therefore unlikely to alter
the importance of technological capability and intangible assets in China’s upgrading.
On the other hand, the shift in end markets provides a valuable opportunity for Chinese
fi rms to acquire a larger role within GVCs. Chinese indigenous enterprises have been developing
their own designs and brands targeted to China’s large domestic market and to other emerging
markets. Such intangible assets will provide an advantage for Chinese fi rms compared with OECD
fi rms that often have to adapt their products to emerging markets. By leveraging their expertise
in domestic markets and in other emerging markets, Chinese fi rms can act as provider of new
designs and concepts. However, firms from OECD countries still hold a strong technology and
quality edge and most established brands are from OECD countries. Many MNEs are also already
developing products targeted to Chinese consumers. FIEs and firms from Hong Kong, China,
Macau, China, and Chinese Taipei hold a substantial market share in some industries ranging
from apparel to transportation machinery and computers (Figure 5.11).
Chinese enterprises therefore must continue their investments in technological capability

86 CHINA IN FOCUS: LESSONS AND CHALLENGES © OECD 2012
CHAPTER 5: MOVING UP THE VALUE CHAIN: CHINA’S EXPERIENCE AND FUTURE PROSPECTS
and intangible assets. The nature and extent of upgrading within new GVCs will be based on
their ability to propose high quality but yet affordable products that capture the fast changing
preferences of Chinese consumers. This again points to the importance of profit-driven
enterprises for China’s future. Such enterprises are likely to respond more quickly to emerging
needs and tend to be more effi cient in translating ideas into commercial products.
Figure 5.11 Domestic sales and market share by FIEs and Hong Kong,China, Macau,China and Chinese Taipei fi rms (2009)
22.8%
16.4%
31.0%33.9%
24.1%
26.1%25.3%
12.9% 13.4%13.6%
20.1%19.5%
20.8%
44.1%
24.3%
57.0%
0%
10%
20%
30%
40%
50%
60%
0
2,000
4,000
6,000
8,000
10,000
12,000
14,000
16,000
18,000
Processing of Food
Textile
Textile Wearing Apparel,
Footware and Caps
Leather, Fur, Featherand Related Products
Raw Chem
ical Materials
and Chemical Products
Medicines
Plastics
Non-m
etallic Mineral Products
Ferrous Metals
Non-ferrous M
etals
Metal Products
General Purpose M
achinery
Special Purpose Machinery
Transport Equipment
Electrical Machinery and Equipm
ent
Comm
unication Equipment
(Computers and O
ther Electronic)
Domestic Sales by FIE and HMCT firms (100million Yuan: Left Axis)
Domestic Market share by FIE and HMCT firms (%: Right Axis)
Source: 2010 China Industry Economy Statistical Yearbook
BIBLIOGRAPHY
Ali-Yrkkö, J., P. Rouvinen, T. Seppälä and P. Ylä-Anttila (2010), “Who Captures Value in Global Supply Chains? Case
Nokia N95 Smart Phone”, ETLA Discussion papers, No. 1240.
Amiti, M. and C. Freund (2010), “The Anatomy of China’s Export growth”, Chapter 1 in Feenstra, R. C. and Wei, S.
J. (eds.), China’s Growing Role in World Trade, The University of Chicago Press.
Blalock, G., and P.J. Gertler (2009), “How Firm Capabilities Affect Who Benefits from Foreign Technology” Journal of Development
Economics, 90, pp.192-199.
Bonaglia, F., A. Goldstein, and J.A. Mathews (2007), “Accelerated internationalization by emerging markets’
multinationals: The case of the white goods sector”, Journal of World Business 42(4), pp. 369–383.
Bustos, P. (2011), “Trade Liberalization, Exports and Technology Upgrading: Evidence on the Impact of

87 CHINA IN FOCUS: LESSONS AND CHALLENGES © OECD 2012
CHAPTER 5: MOVING UP THE VALUE CHAIN: CHINA’S EXPERIENCE AND FUTURE PROSPECTS
MERCOSUR on Argentinean Firms”, American Economic Review 101(1), pp. 304-340
Breznitz, D. and M. Murphree (2011), Run of the Red Queen, Yale University Press.
Corrado, C.A. and C.R. Hulten (2010), “How Do You Measure a ‘Technological Revolution’?”, American Economic Review: Papers &
Proceedings 100, pp. 99–104.
Corrado, C.A., C.R. Hulten and D.E. Sichel (2005), “Measuring Capital and Technology: An Expanded Framework”, in Corrado, C., J.
Haltiwanger and D. Sichel (eds.), Measuring Capital in the New Economy, pp. 11-45, The University of Chicago Press.
Deng, P. (2007),�“Investing for Strategic Resources and its Rationale: The Case of Outward FDI from Chinese Companies”, Business
Horizons, 50(1), pp.71–81.
Feenstra, R. C. and S.J. Wei (2010b), “Introduction”, in Feenstra, R. C. and Wei, S. J. (eds), China’s Growing Role in World Trade, The
University of Chicago Press.
Gerrefi, G. (1999), “International Trade and Industrial Upgrading in the Apparel Commodity Chain”, Journal of International
Economics 48 (1), pp. 37-70.
Girma, S., Y. Gong and H. Görg (2008), “Foreign Direct Investment, Access to Finance, and Innovation Activity in Chinese
Enterprises”, The World Bank Economic Review, 22 (2), pp. 367-382.
Hervas-Oliver, J.-L., J.A. Garrigos and I. Gil-Pechuan (2011), “Making Sense of Innovation by R&D and Non-R&D Innovators in Low
Technology Contexts: A Forgotten Lesson for Policy Makers”, Technovation 31 pp. 427-446.
Hummels, D., J. Ishii and K.M. Yi (2001) “The nature and growth of vertical specialization in world Trade” Journal of International
Economics 54 (1), pp. 75-96
Humphrey, J. (2004), “Upgrading in Global Value Chains”, International Labor Organization Working Paper, Number 28.
Jacobides, M.G., T. Knudsen and M. Augier (2006), “Benefiting from Innovation: Value Creation, Value Appropriation and the Role of
Industry Architectures”, Research Policy, Vol. 35 (8), pp. 1200-1221.
Kaplinski, R. and M. Farooki (2010), “Global Value Chain, the Crisis and the Shift of Markets from North to South”, in Cattaneo, O., G.
Gereffi and C. Staritz (eds.), Global Value Chain in a Postcrisis World, The World Bank.
Kaplinski, R. and M. Morris (2002), A Handbook for Value Chain Research, International Development Research Center (IDRC).
Koopman, R., Z. Wang. and S.J. Wei (2008), “How Much of Chinese Exports is Really Made in China? Domestic Value Added when
Processing Trade is Pervasive”, NBER Working Papers, No. 14109.
Lev, B. (2001), Intangibles, Brookings Institution Press.
Lileeva, A. and D. Trefler (2010), “Improved Access to Foreign Markets Raises Plant-Level Productivity…For some plants”, Quarterly
Journal of Economics, 125(3), pp.1051-1099.
Morrison, A., C. Pietrobelli and R. Rabellotti (2008), “Global Value Chain and Technological Capability: A Framework to Study
Learning and Innovation in Developing Countries”, Oxford Development Studies, 36(1), pp. 39-58.
OECD (2008a), OECD Reviews of Innovation Policy - China, OECD, Paris.
OECD (2008b), OECD Investment Policy Reviews: China 2008, OECD, Paris.
OECD (2010a), The OECD Innovation Strategy-Getting a Head Start on Tomorrow, OECD, Paris.
OECD (2010b), OECD Economic Surveys - China, OECD, Paris.

88 CHINA IN FOCUS: LESSONS AND CHALLENGES © OECD 2012
CHAPTER 5: MOVING UP THE VALUE CHAIN: CHINA’S EXPERIENCE AND FUTURE PROSPECTS
OECD (2011a), OECD Science, Technology and Industry Scoreboard 2011, OECD, Paris.
OECD (2011b), “What Explains Countries’ Export Performance and Integration into Global Value Chains?”, DSTI Working Paper,
forthcoming.
OECD (2011c), “Export Competition: Price or Quality?”, DSTI Working Paper, forthcoming.
Rodrik, D. (2006), “What’s So Special About China’s Exports?”, China & World Economy, 14(5), pp.1-19.
Salomon, R. M. (2006), Learning from Exporting: New Insights, New Perspectives, Edward Elgar Publishing.
Santamaríaa, L., M.J. Nietob and A. Barge-Gil (2009), “Beyond Formal R&D: Taking Advantage of Other Sources of Innovation in
Low- and Medium-Technology Industries”, Research Policy 38, pp. 507517.
Shaver, M. J. (2011), “The Benefits of Geographic Sales Diversification: How Exporting Facilitates Capital
Investment”, Strategic Management Journal, 32: 1046–1060.
Teece, D. (1986), “Profiting from Technological Innovation: Implications for Integration, Collaboration,
Licensing and Public Policy”, Research Policy, Vol. 15(6), pp. 285-305.
Teece, D. (2007), “Explaining Dynamic Capability: The Nature and Microfoundations of (Sustainable)
Enterprises Performance”, Strategic Management Journal 28, pp. 1319–1350.
Van Biesenbroeck, J. and T.J. Sturgeon (2010), “Effect of the 2008-09 Crisis on the Automotive Industry in
Developing Countries: A global Value Chain Perspective”, in Cattaneo, O., G. Gereffi and C. Staritz (eds.),
Global Value Chain in a Postcrisis World, The World Bank.
Waldmir, P. (2011), “Beijing Makes a Subtle Shift Towards the Rule of Law”, Financial Times, December 14th.
World Trade Organization, International Trade Statistics 2011.
Xing, Y. and N. Detert (2010), “How the iPhone Widens the United States Trade Deficit with the People’s Republic of
China”, ADBI Working Paper Series, No. 257.
Xu, B. and J. Lu (2009), “Foreign Direct Investment, Processing Trade, and the Sophistication of China’s Exports”,
China Economic Review, 20(3), pp.425-439.
Yi, K-M. (2003), “Can Vertical Specialization Explain the Growth of World Trade?”, Journal of Political Economy, vol. 111(1), pp. 52-
102.
Zhang, C., D.Z. Zeng, W.P. Mako and J. Seward (2009), Promoting Enterprise-Led Innovation in China, The World Bank.
Zhu, S., N. Yamano and A. Cimper (2011), “Compilation of Bilateral Trade Database by Industry and End-Use Category”, STI Working
Paper 2011/06, December.

89 CHINA IN FOCUS: LESSONS AND CHALLENGES © OECD 2012
CHAPTER 6: MEASURING SKILLS TO SUPPORT ECONOMIC TRANSFORMATION
Chapter 6:
Measuring Skills to Support Economic Transformation
Introduction
China has made remarkable progress in raising access, quality and equity in education.
Shanghai now leads the world in student performance as measured by the OECD’s Programme for
International Student Assessment (PISA) (Box 6.1). However, China also faces daunting challenges
to provide high quality education and training for its large rural population.
Strengthening skills will be vital for China’s long-term growth, employment and competitive
edge. Similarly, effective skills policies are an indispensible part of addressing inequality. At the
same time, there is growing recognition in China that skills do not automatically translate into
higher incomes and productivity. To successfully convert better skills into jobs and growth China,
like other countries, needs to develop a solid understanding of those skills that drive strong and
sustainable economic and social outcomes; ensure that the right mix of skills is being taught
and learned in effective, equitable and effi cient ways; provide guidance for its labour market to
fully utilise available skill potential; and build strong governance arrangements with sustainable
approaches to who should pay for what, when and where.
To meet these objectives, effective skills policies critically hinge on relevant and reliable
measures which are still scarce for China. Following a brief summary of key outcomes from
PISA for Shanghai, this chapter sets out a framework for the measurement of skills where such
measures are most critically needed in China, namely to support people in rural transformation,
and then lays out how to implement such measures to support the design of policies. It describes
both the traditional measurement instruments presently available, and a new tool for the direct
assessment of skills currently being developed by the OECD. It concludes by discussing the need
for a strategic, evidenced based approach to skills policy.
Measuring skills through PISA
OECD’s PISA provides an instrument for countries to assess quality, equity and effi ciency in
school education. PISA focuses on the ability of 15-year-olds to use their knowledge and skills
to meet real-life challenges. This orientation reflects a change in the goals and objectives of
curricula in many countries, which are increasingly concerned with what students can do with

90 CHINA IN FOCUS: LESSONS AND CHALLENGES © OECD 2012
CHAPTER 6: MEASURING SKILLS TO SUPPORT ECONOMIC TRANSFORMATION
what they learn at school and not merely with whether they have mastered specifi c curricular
content. PISA reveals what is possible in school education, in terms of the achievements
demonstrated in the best performing and/or most rapidly improving education systems and thus
provides opportunities for peer learning on the development and implementation of education
policies. In many countries, PISA is also used to set policy targets in terms of measurable goals
achieved by other systems, and to identify policy levers and establish trajectories for educational
reform. Last but not least, PISA can assist with gauging the pace of educational progress, through
assessing to what extent achievement gains observed nationally are in line with achievement
gains observed elsewhere.
Shanghai has been the first Chinese province to fully take part in PISA. The results from
this exercise show that 15-year-olds in Shanghai reached the highest performance standards in
every subject assessed. In mathematics, the proportion of students reaching the highest level
of profi ciency was, at 27%, almost ten times the corresponding proportion at the OECD average
level. At the very same time, Shanghai was also one of the education systems most successful in
moderating the impact which social background has on student performance.
These statistics refl ect a consistent trajectory of educational reforms. Shanghai was among
the first cities to achieve universal primary and junior secondary education and was also
among the fi rst to achieve almost universal senior secondary education. Enrolment at the age of
compulsory education is now practically universal, and 97% of the relevant age cohort attends
senior secondary school (general and vocational). It is notable that enrolment for preschool
programmes was 98%, a rate which surpasses the new national preschool education goal for
2020. OECD data also show that over 80% of the city’s higher education age cohort are admitted
into higher education in one way or another (compared to the national figure of 24%). Indeed,
Shanghai has always been a preferred place to pursue higher education, perhaps second only to
Beijing, and has attracted the best students from the national pool of elite candidates.
While Shanghai has been successful in financing a programme to offer free education to
migrant children, there are still problems in the provision of upper secondary education to
migrant children due especially to the need for children to take university education entrance
examinations in the place of their registration rather than the place where they live. Elsewhere in
the country, the education of migrant children still poses a considerable problem.
Nine other provinces in China have since carried out their own PISA assessments.
A framework for the measurement of skills
While educational performance in Shanghai illustrates what China can achieve, skills-related
challenges elsewhere, particularly in the rural areas, are still monumental. As noted above,
building a robust evidence base and framework for measurement will be an essential step to
address these.
Measurement to guide skills policies needs to go beyond a simple estimation of the stock
of skills expressed in terms of educational attainment and it is essential to think of skills as
involving both the supply and the demand side perspective. A conceptual framework for the
measurement of skills therefore needs to cover several dimensions as illustrated in Figure 6.1.
There are various sources for the supply of skills comprising the education and training system
as well as migration of skilled workers and participation in the labour market. The demand
for skills on the other hand is affected by a number of factors. Skills measures also need to
consider the match of skills demand and supply which in turn will have an impact on economic

91 CHINA IN FOCUS: LESSONS AND CHALLENGES © OECD 2012
CHAPTER 6: MEASURING SKILLS TO SUPPORT ECONOMIC TRANSFORMATION
performance as well as on individual economic and social outcomes. Finally, there are a number
of contextual factors underpinning skills development which vary from one country to the other
and need to be taken into consideration in the design of skills measures.
Box 6.1 The OECD’s Programme for International Student Assessment (PISA)
The OECD’s Programme for International Student Assessment (PISA) launched in 2000 is a triennial survey of 15-years-old students in OECD member and partner countries that measures the extent to which students near the end of compulsory education have acquired some of the knowledge and skills that are essential for full participation in modern societies.
In total 74 economies participated in the PISA 2009 cycle. Between 4 500 and 10 000 students are tested in each cycle. Students are selected from a random sample of schools (public and private) and are selected according to their age (from 15 years and 3 months to 16 years and 2 months at the beginning of the assessment) as opposed to which grade they belong to.
Focusing on reading, mathematics and science, PISA assesses not merely whether students can reproduce knowledge, but also how well they can extrapolate from what they have learned and apply it to unfamiliar situations, both in and outside of school.
Factors infl uencing their performance and potential for lifelong learning are also explored in the background questionnaire in which they are asked about their approaches to learning and their social background. The organisation of schools is also taken into account through a questionnaire fi lled out by school principals.
Figure 6.1 Conceptual framework for the measurement of skills
Contextual factorsEconomic level & structure TechnologyDemographics Work organisationMaternal & child health Institutional settings
Skill supplyEducational attainmentLevel of cognitive skillsMigration & participation Matching
Education mismatchSkills & informal workHard-to-fill vacancies
Skill gaps
OutcomesGrowth & productivityLabour force statusEarningsIncome inequality & health
Skill demandEmployment by educationEmployment by occupationJob-task measures of skill

92 CHINA IN FOCUS: LESSONS AND CHALLENGES © OECD 2012
CHAPTER 6: MEASURING SKILLS TO SUPPORT ECONOMIC TRANSFORMATION
Current and emerging measures of skills for economic transformation: skills supply
The domain of skills supply has several dimensions. The first dimension covers the stock
of human capital in the economy which has been acquired through past investments in skills
through education and training as well as the future supply of skills derived from ongoing
investments in skill formation. Not all of this investment in education and training takes place
through formal channels. In many developing and emerging economies, skills are often acquired
informally, on the job and through experience. This has to be taken into consideration when
assessing the skills supply. In addition, other factors affecting skills supply in rural areas, in
particular, immigration and emigration, movements of population between regions and the level
of labour force participation should equally be considered in a comprehensive framework.
Skills development through education and training
The traditional measure to assess the stock of skills available to the economy is educational
attainment in the population. In most countries, including developing and emerging economies,
labour force and other household surveys provide basic information on the proportion of
population by gender and age group at each level of education. To be meaningful for the purpose
of developing skills for rural transformation, data needs to be disaggregated by region because
typically, the gap between rural and urban educational attainment is high and a national average
hides important local variation.
In addition, measures of current enrolment in education and training at different levels,
including primary, secondary, post-secondary or tertiary education as well as participation in
adult education and training provides information on the kind of skills which will be available to
the economy in the near future. More comprehensive data sets provide additional levels of detail,
for instance data which distinguishes between the different orientations of post-compulsory
education and training programmes (general vs. vocational) and the fi eld of study (e.g. science
and technology).
Quality of education and training provision
The Millennium Development Goals for developing countries refer, amongst other things,
to increase participation in education. Many countries, have made considerable and successful
efforts to reach this goal as refl ected in the substantial increase in enrolment in schools over the
last decade, nowhere more so than in China. However, assessing the quantity of education is not
enough: more years of education or higher levels of education qualifi cations attained, does not
necessarily mean more skills have been acquired. The quality of education may vary, especially in
the poorer areas of countries. Measures that focus on inputs to education such as student-teacher
ratios, teacher absenteeism, school infrastructure and the availability of learning materials add
important information on the quality of education provision. Ultimately only a direct assessment
of skills can provide a meaningful measure for the quality of education output.
Towards a direct measure of skills
Measures of skills presently available and used in OECD countries as well as developing and
emerging economies focus primarily on quantitative proxy for skills such as years of education
or the level of qualification attained. However, these quantitative measures are based on the
assumption that each additional year of education adds the same amount of skills in all countries
and that qualifi cations acquired in different countries equip people with exactly the same skills.

93 CHINA IN FOCUS: LESSONS AND CHALLENGES © OECD 2012
CHAPTER 6: MEASURING SKILLS TO SUPPORT ECONOMIC TRANSFORMATION
They also ignore the fact that skills can be acquired informally and outside the education and
training system through work experience and that skills decline over time if they are not used.
Recognising the limitations of these approaches, methods have been developed to assess
skills directly. School level direct assessments have been used to test performance of pupils at
different ages in foundation skills, in particular literacy, numeracy and sciences. OECD’s PISA (Box
6.1) is the most comprehensive of these studies. It has been carried out every three years over
the past decade and covers now more than seventy economies, including a number of emerging
economies. The results of these studies give an indication of the skills of new entrants to the
labour force in many economies where progression beyond school is low.
The OECD has also developed methods to assess skills in the adult population through
the Programme for International Assessment of Adult Competencies (PIAAC) to contribute to
the understanding of how skills are acquired, used and translated into economic and social
outcomes. While the methods involved in PIAAC are complex and resource intensive, they
increase our knowledge on skills considerably and can set standards for future development
of skills measures (Box 6.2) in ways that complement existing evidence as described above to
support the development of effective skills policies.
Assessing foundation skills on a continuum
For older cohorts, PIAAC allows the examination and analysis of the processes of skills loss
and maintenance and the effectiveness of education and skill formation systems in supporting
skills development over the lifecycle. Findings from previous data on adult skills have helped
to reveal a consistently negative relationship between foundation skills and age. However, the
data also shows that the depreciation of skills may be offset by what people do at work and in
their daily lives. For example, evidence from previous data on adult skills suggests that frequent
engagement in reading at work and at home may help to mitigate the proficiency declines
associated with ageing, though this curve may also refl ect cohort effects (Figure 6.2).
Other sources of skills supply: migration and labour force participation
Skills development comprises more than just the education and training system. To get a
comprehensive picture of the supply of skills it is necessary to consider also data on migration
and on participation in the labour market. Investments in skills which take place locally
are not necessarily available to the local labour market later because individuals migrate. In
many developing countries, people migrate to urban centres to continue their education and
training or to find a job. Or they leave the country altogether to seek opportunities abroad.
Therefore, a measure of migration between localities and international migration can provide
valuable information on the skills supply. Similarly, skilled workers might become inactive for
various reasons so that their skills are not available to the labour market at all, neither locally
or elsewhere. A measure of the share of inactivity in the local population complements the
information on skills supply.
Measuring skills demand
Increased access to good quality education and training does not automatically lead to better
economic outcomes. Skills development above all has to be relevant to the current and future
needs of the economy. The reason why participation in education and training is weak in the fi rst
place might have to do with the (perceived) lack of relevance of the education provision for the

94 CHINA IN FOCUS: LESSONS AND CHALLENGES © OECD 2012
CHAPTER 6: MEASURING SKILLS TO SUPPORT ECONOMIC TRANSFORMATION
population. Lack of relevance of educational programmes and curricula can range from a focus on
occupations which are not in demand to the language of instruction which is not the one spoken
by the local population. In order for education and training provision to be relevant, and hence to
be taken up, it is important to assess the specifi c demand for skills.
Box 6.2 The OECD’s Programme for the International Assessment of Adult Competencies (PIAAC)
PIAAC is the OECD’s international assessment of adult foundation skills. The survey is based on interviews with a sample of adults aged 16-65 years in their homes to assess their literacy and numeracy skills and their ability to solve problems in technology-rich environments. It also collects a broad range of information on the antecedents, outcomes and contexts of skill development and use. In addition, as part of the assessment of literacy, an assessment of the mastery of the basic building blocks of reading is administered to respondents with low literacy in order to provide detailed information about this important group.
PIAAC focuses on a limited set of general skills, not including an assessment of a broad range of occupation specifi c skills necessary for rural transformation. However, the survey is based on a broad conception of literacy as a foundation skill which can add complementary value to a simple binary measure of literacy or illiteracy. First, literacy - defi ned in PIAAC as ‘the ability to understand and use information from written texts in a variety of contexts to achieve goals and further develop knowledge and potential’ - is a skill, along with numeracy and problem solving, which provides a foundation for the development of other higher order cognitive skills as well as constituting a pre-condition for gaining access to and understanding of specific domains of knowledge. Second, it provides a foundation for acting in an extremely broad range of contexts, from education through work to everyday life. Literacy is also viewed in PIAAC as an enabling skill. Literacy is valuable and valued because it enables people to do things. In other words, literacy is not seen as an end in itself but as a means by which people realize goals and achieve their aims in the various contexts (i.e. home, education, civil society and work) in which they act. PIAAC thus does not seek so much to measure knowledge as the ability to appropriately use information in context.
Moreover, PIAAC conceives literacy (as well as numeracy and problem solving) as a continuum of profi ciency involving the mastery of increasingly diffi cult cognitive operations as well as the ability to respond appropriately to texts containing increasingly complex features. In other words, PIAAC treats literacy as a skill that one can have more or less of and does not try to defi ne a threshold which distinguishes literacy from illiteracy. The downside of such a binary defi nition is that a share of 100% literacy is easily reached when people have acquired basic literacy skills. However, this does not tell much about how well these people are equipped to operate in more complex situations. A continuous scale in contrast allows the assessment of the level of skills on a scale and to track developments from a low skills equilibrium towards a higher skills equilibrium which is what rural transformation aims to achieve.
PIAAC also contributes to the knowledge about the factors that facilitate the acquisition and maintenance of foundation skills recognising that skills can be gained both inside and outside the formal education system and decline again over time. PIAAC will enhance the understanding of the effectiveness of education and training systems in developing basic cognitive skills and key generic work skills. In particular, it will be possible to examine the extent to which the formal education system has been effective in developing broad based cognitive skills. PIAAC will also allow exploring the sources of skills acquisition and maintenance beyond formal education which is relevant in particular in developing countries and rural areas where much of the skills acquisition happens informally.

95 CHINA IN FOCUS: LESSONS AND CHALLENGES © OECD 2012
CHAPTER 6: MEASURING SKILLS TO SUPPORT ECONOMIC TRANSFORMATION
Figure 6.2 Reading engagement and foundation skills1
1. Average profi ciency in foundation skills on a scale ranging from 0 to 500 points for adults aged 16 to 65, by reading engagement at work and in daily life, adjusted for years of schooling and foreign-born status.
Source: International Adult Literacy Survey, 1994-98.
In order to make skills supply relevant for the economy, information needs to be acquired
about the demand for skills in the first place. Two key indicators might be used to assess the
demand of skills in rural areas: employment shares by education background and by occupation.
Typically, census, labour force and other household surveys provide this kind of information. In
addition, it might be considered to measure the importance of self-employment, as this form
of employment is very common in many developing countries and requires its own set of skills,
particularly entrepreneurial skills.
One important challenge for measuring the demand for skills in developing and emerging
economies arises from the fact that big shares of the economy are in the informal sector. Hence,
the demand for skills is equally informal and, due to its very nature, diffi cult to measure or to
include in offi cial statistics. This should be taken into consideration when estimating the relative
demand for different skills and developing skills policies based on these estimates.
Responding to radical changes in skills demand
Skills demand can change radically when an economy experiences rapid economic growth
and industrial transformation like in China. New sectors emerge requiring new skills, while
traditional sectors, especially the agriculture sector, shrink, making some previously needed skills
obsolete. This can lead to problems of skills shortages which if they are genuine and persist can
put a brake on economic growth, primarily through their negative effect on labour productivity.
Therefore it is important to monitor the changing demand for skills and to feed this information
into the education and training system so that the supply of skills can be adapted to the changing
demand.

96 CHINA IN FOCUS: LESSONS AND CHALLENGES © OECD 2012
CHAPTER 6: MEASURING SKILLS TO SUPPORT ECONOMIC TRANSFORMATION
To tackle problems of unmet skills demand quickly and efficiently some countries have
designed local approaches to skills policies which help to support economic growth leading to
major transitions and requiring a strong skills support to be sustainable.
Matching of skills demand and supply and outcomes
An important issue in all countries is to ensure that on the one hand the education and
training system produces skills that are relevant for the labour market and on the other hand
that there is effective matching of workers and jobs to ensure that the skills that exist are
productively used. In principle, a good match of the skills required in the labour market and
skills supplied supports productivity. Higher productivity in turn leads to better outcomes and
returns to education both for the individual and the economy as a whole. Rural areas, however,
might be stuck in a low-skills equilibrium where demand and supply of skills do match but at a
very low level, preventing further development. In such a situation, only an over-supply of skills
can trigger a change in the economy towards a higher value-added production and an adaption
of the demand for skills to the higher level skills available locally. Moreover, even if the demand
for skills in the economy does not follow the supply leading to a higher skills equilibrium,
equipping people with minimum foundation skills is desirable as it enables people to acquire the
knowledge, skills and values which allow them to improve the quality of their present and future
lives.
Measures are therefore also required to assess the match of skills that have been obtained
through education and training with those required by employers including those in self-
employment. Indicators of over- and under-qualification from census, labour force and other
household surveys can be used as one way to measure this, although a more direct measure
of skills rather than qualification levels can add complementary value (see below). Two other,
more indirect, measures of the matching process might be considered. These are changes in
unemployment rates and earnings differentials by educational attainment. All else equal, a rise
in the returns to higher education or a drop in the unemployment rate associated with this level
would suggest that the demand for workers with these qualifications is outstripping supply.
Ideally, it would be useful to supplement these measures with information based on employer
surveys of skill gaps and shortages.
Assessing the match of skills and job tasks directly
Traditional measures of mismatch rely on quantitative measures of education (years of
education or qualifi cations attained) as proxies for skills or on the self-assessment of individuals
which might introduce substantial measurement error. Data from PIAAC allows examination of
the extent to which individuals are in jobs which refl ect their level of profi ciency in literacy by
using direct measures of the skills individuals possess and direct measures of the use of these
skills at work.
Data from previous surveys of adult skills presented in Figure 6.3, show how PIAAC (which
will provide very similar kinds of data for a larger number of countries) can be used in the future
to identify high and low skills match as well as mismatch situations whereby individuals possess
high levels of literacy profi ciency but are in jobs which do not require them to read or write at a
high level or on the contrary individuals which possess only low levels of literacy but work in jobs
which require them to read and write at an advanced level.

97 CHINA IN FOCUS: LESSONS AND CHALLENGES © OECD 2012
CHAPTER 6: MEASURING SKILLS TO SUPPORT ECONOMIC TRANSFORMATION
Figure 6.3 Match-mismatch between skill profi ciency and skill use1
1. Percent of workers aged 16 to 65 in each category refl ecting match or mismatch between literacy profi ciency skills and the use of those skills at work
Source: Adult Literacy and Lifeskills survey, 2003-2007.
Ultimately, policy makers need to understand the impact of skills on economic and social
outcomes. Skills contribute to rural transformation and economic growth both directly, through
increased productivity, allowing regions to develop their production beyond subsistence, and
indirectly, by creating greater capacity of individuals e.g. to identify business opportunities and
to adopt new technologies and ways of working. Skills also improve the economic and social
outcomes of individuals as foundation skills are linked to empowerment, better employment and
earning chances and hence poverty alleviation but also with strong positive impact on health and
other social outcomes.
A number of indicators of economic performance and labour market and health outcomes
can provide information on the links between skills and outcomes. In terms of economic
performance, indicators could focus on production growth and the level and growth of labour
productivity. Labour market outcomes are represented by employment rates, unemployment and
underemployment rates, and earnings. Health outcomes could be assessed using a wide range of
indicators, including general health status as well as the prevalence of specifi c diseases.
As with all other indicators, to be meaningful for the purpose of assessing the role of skills,
it is essential that these statistics are gathered at a local level which might be a challenge even
for more advanced countries where the local statistical infrastructure is not available and
information is accessible only in form of aggregated fi gures which obscure local details.
Foundation skills and economic outcomes
Traditionally, indirect quantitative measures of skills such as years of education or
qualifi cations attained have mostly served as proxies to assess the impact of skills on economic
and social outcomes. In the future, direct measures of skills from PIAAC for a broad range of

98 CHINA IN FOCUS: LESSONS AND CHALLENGES © OECD 2012
CHAPTER 6: MEASURING SKILLS TO SUPPORT ECONOMIC TRANSFORMATION
countries will provide policy makers with a better understanding of the role of proficiency
in foundation skills in improving the labour market prospects of individuals as well as of its
relationship with other outcomes such as participation in training, use of information technology
and health.
As an example, Figure 6.4 presents data from a previous study on adult skills demonstrating
the strong positive relationship between foundation skills (including literacy) and economic
advantage. As the number of foundation skill domains with low levels of profi ciency increases,
the likelihood of disadvantage increases too. Similar analyses can be undertaken with respect to
other outcomes.
Figure 6.4 Foundation skills and economic disadvantage1
1. Adjusted odds ratios showing the likelihood of experiencing economic disadvantage, by foundation skill level, adults aged 16 to 65. Odds ratios refl ect the relative likelihood of an event occurring for a particular group compared to a reference group. An odds ratio of 1 represents equal chances of an event occurring for a particular group vis-à-vis the reference group. Coeffi cients with a value below 1 indicate that there is less chance of the event occurring for a particular group compared to the reference group, and coeffi cients greater than 1 represent increased chances.
Source: Literacy and Lifeskills survey, 2003-2007.
Contextual factors having an impact on skills development
A set of contextual indicators is required to capture the main drivers of skill supply and demand
as well as the key factors affecting the efficiency of the matching process between them. Many
of these factors will also affect the outcomes of skill use. Accordingly, a range of measures can be
considered including demographics, early childhood development and health, aggregate economic
conditions, technology and work conditions, and education and labour-market institutions and policy
settings in rural areas. Moreover, it has to be stressed that skills policies are only one of many factors
supporting productivity and growth, along with other policy measures aimed at rural transformation,
technological change and innovation and more effi cient markets.
The supply of skills from education and training is infl uenced by the quality and relevance
of the education offered. In addition, a range of contextual factors can have an impact on skills
acquisition, particularly in poorer rural areas. These factors include the cost of education and

99 CHINA IN FOCUS: LESSONS AND CHALLENGES © OECD 2012
CHAPTER 6: MEASURING SKILLS TO SUPPORT ECONOMIC TRANSFORMATION
the access in terms of availability of transportation or density of education institutions. Other
impediments to skills development, in particular in rural parts of developing and emerging
economies, are health related. Therefore, data on the health status of mothers and children at
different ages are required.
Demographic transformations can have a profound impact on the demand and supply of
skills. In China, the combined effects of people living longer and low fertility rates is leading to a
rise in the proportion of those aged 65 and over. As a result, the demand for skills is expanding in
the health sector. More broadly, in an aging society policies need to support people’s continued
participation in the labour market.
There are also a number of context factors that need to be taken into consideration when it comes to
assessing the demand for skills to support economic development and well-being. These include the structure
of the economy, employment patterns, and the share of informal employment. Furthermore, developing ICT
skills is only useful if there is demand for such skills and access to ICT related infrastructure is ensured. Likewise,
entrepreneurship is unlikely to develop even if entrepreneurial skills are fostered if conditions are not conducive to
business. Therefore, indicators on the ease of doing business are helpful to supporting skills development.
Implementing a strategic approach to skills policies dased on sound evidence
Developing realistic and targeted skills measures
Only a comprehensive approach to skills policies taking into account all elements of the
framework outlined in this chapter will ensure effective skills policies and steer complex systems
of skills development and use. Ideally, measures of skills should comprise all dimensions set
out in the conceptual framework. However, the capacity to collect and analyse skills data varies
across countries. The challenge for many developing and emerging countries is to establish a
statistical infrastructure that can ensure that the range of statistics needed for policy purposes
are collected on a regular and timely basis and gradually move to the collection of more complex
data that are comparable internationally.
In addition, one of the serious obstacles to the analysis of rural-urban differences regarding skills relates to
the lack of disaggregated data. Therefore, in order to make measures of skills meaningful for the purpose of rural
transformation, it is essential that data collection is designed not only to guide policies at the national level but also
to provide reliable disaggregated data and estimates specifi cally in rural areas.
Using evidence to design effective policies
Developing sound measures of skills demand, supply, match and outcomes as well as
contextual factors having an impact on skills is only a fi rst step. Data and evidence need to be
used and applied strategically to support a structured approach to skills policy-making for rural
transformation. And measures of skills need to be analysed and operationalised to support the
development of sound skills policies leading to rural transformation.
Some countries already successfully measure skills and use this data to inform policy design.
For example, Sweden took part in the International Adult Literacy Survey (IALS) in 1995 to assess
the level and distribution of literacy skills in the population. Based on the results, the government
started an adult education initiative (Kunskapslyftet) to boost the level of foundation skills in the
population (Veeman et al., 2003). This included study grants and study leave with priority given
to the least educated in addition to the existing nation-wide system of adult education provided
by every municipality in the country. Other countries have made similar experiences. Box 6.3

100 CHINA IN FOCUS: LESSONS AND CHALLENGES © OECD 2012
CHAPTER 6: MEASURING SKILLS TO SUPPORT ECONOMIC TRANSFORMATION
describes the case of Australia which has developed a strategic and evidence-based approach to
skills policy making that can serve as a model for other countries.
Box 6.3 Using sound skills measures to design effective skills policies in Australia
The 2006 Adult Literacy and Life Skills Survey (ALLS) revealed that Australian language, literacy and numeracy levels have shown little improvement in the decade since the 1996 International Adult Literacy Survey (IALS). It found that:
• Approximately seven million Australians (46 per cent) had literacy scores below the minimum level needed to function fully in life and work; and
• Approximately 7.9 million (53 per cent) had numeracy scores below the needed minimum.
Based on these results, Skills Australia published a National Workforce Development Strategy with recommendations to the government that included upscaling already successful approaches such as the Workplace English Language and Literacy Program for existing workers and the Language Literacy and Numeracy Program for jobseekers. It also recommended developing and implementing a national adult literacy and numeracy strategy to drive improvement and decisively lift Australia’s performance for adult language, literacy and numeracy levels. Concrete recommendations included:
• Reframing language, literacy and numeracy as central to participation and productivity;
• Reviewing and building on the extensive work underway through schooling;
• Outlining the total national effort in adult language, literacy and numeracy training and identify gaps and needs;
• Setting clear and achievable targets for success;
• Providing strategies to enhance the language, literacy and numeracy training of the workforce, including a wide range of alternative approaches appropriate to both low and high skilled workers and varied workplace and community settings;
• Providing best-practice models for engaging those who would benefi t from language, literacy and numeracy training;
• Including measures to develop the adult language, literacy and numeracy training workforce, including considering the identification and addressing of language, literacy and numeracy issues as a core — rather than elective — component of the Certifi cate IV in Training and Assessment.
• Evaluating the integration of language, literacy and numeracy skills in training package qualifi cations; and
• Recognising the shared responsibility of governments, employers and workers as contributors to the development of these skills.
Source: Skills Australia (2010).
A strategic approach to skills policies
Skills policies are complex and involve a broad range of stakeholders. They concern on the
one hand a number of supply side actors, typically including the ministries of education, science
and technology, but also education providers as well as actors concerned with migration and
labour market policies. On the other hand they concern those actors dealing with skills demand.

101 CHINA IN FOCUS: LESSONS AND CHALLENGES © OECD 2012
CHAPTER 6: MEASURING SKILLS TO SUPPORT ECONOMIC TRANSFORMATION
This includes ministries of labour and industry but also the private sector as well as institutions
having as their mission the linking of the two such as employment offices responsible for
assisting the unemployed fi nd work. In rural areas, where health status can have an important
impact on whether individuals participate and succeed in education, and where, conversely,
education can have a strong influence on health outcomes of individuals, it is important to
consider actors dealing with issues of welfare and health in conjunction with skills policies.
Given the range of actors involved in skills policies and the linkages between different
policy fi elds, a systematic approach is needed to avoid duplication of effort and take advantage
of possibilities for synergies. Similarly, to optimise the efficiency of investments in skills from
private and public sources and maximise the returns to such investment, a strategic and
coordinated funding approach based on sound principles helps to avoid underinvestment and
ineffi ciencies. Finally, the evidence on skills, which is often collected and managed by different
institutions and not always available to all relevant actors, needs to be drawn together and used
to support a strategic approach to skills policy-making.
Recognising this, the OECD has embarked on the task to develop a global Skills Strategy,
a systematic, evidence-based approach to skills policies aiming to support countries in their
effort to formulate sound skills policies on the ground.1 This strategic approach to skills policies
integrates the available evidence on the supply, demand, match and outcomes of skills under a
common framework and suggests policy measures on all these areas as well as the fi nancing of
skills development and steering of skills systems derived from international best practice.
This blueprint provides guidelines for countries or localities not only regarding which kind
of information they would need in order to evaluate their current supply and demand of skills,
skills match and outcomes of investment in skills, but also on how to deploy this information to
support policies that make the most of each country’s or region’s human capital by nurturing,
and using, the skills of its citizens to foster development.
BIBLIOGRAPHY
OECD/LEED (2009), Designing Local Skills Strategies, OECD.
OECD (2011), Towards an OECD Skills Strategy (http://www.oecd.org/dataoecd/58/27/47769000.pdf).
Skills Australia (2010), Australian Workforce Futures. A National Workforce Development Strategy, Commonwealth of Australia.
Veeman, N., Ward, A., and K. Walker (2003), “Learning for Work or Learning through Work?”, The Changing Face of Work and
Learning Conference, University of Alberta, Edmonton (http://www.usask.ca/education/alcs/papers/veeman2.pdf).
1 A first issues paper has been published in 2011: OECD (2011), Towards an OECD Skills Strategy (http://www.oecd.org/dataoecd/58/27/47769000.pdf). The complete OECD Skills Strategy is scheduled to be launched in May 2012.

102 CHINA IN FOCUS: LESSONS AND CHALLENGES © OECD 2012
CHAPTER 7: HEALTH CARE IN CHINA: RECENT TRENDS AND POLICY CHALLENGES
Chapter 7:
Health Care in China: Recent Trends and Policy Challenges
Introduction
Recognising the importance of the health of the Chinese people for future economic growth
and well-being, the Chinese government launched a series of ambitious reforms to improve the
health of its citizens by achieving universal access to health insurance coverage. Health insurance
entitlements and benefi ts have been reformed to improve access to medical care in all parts of
the country. Policies have been introduced to provide affordable access to essential medicines and
to align provider payment incentives with general objectives of the health systems. Over time
these reforms will further boost the health of the Chinese population, building on earlier major
reforms, including those which led to a sharp decline in the prevalence of infectious diseases.
This chapter reviews recent reforms and future challenges for China. Looking ahead, like
many OECD and emerging countries, China must address the rise of non-communicable diseases.
The growing burden of chronic diseases requires a new approach that can tackle the high level of
risk factors and ensure provision of a primary care system that can better detect and treat such
diseases. The growth of health insurance has been remarkable, but there are future challenges in
coordinating the different schemes. There are also considerable problems in the organisation and
fi nancing of the growing hospital sector. Currently, hospitals depend heavily on revenues from
selling pharmaceuticals and the current fee-for-service system fuels ineffi cient use of hospital
services. Finally, there is the challenge of improving access to essential pharmaceuticals at
affordable prices.
Sustained growth in health spending has accompanied China’s economic growth over
the past decade. Total health expenditures are now over 5% of GDP, in line with international
standards given China’s national income. Most of the population is now covered by health
insurance and progress has also been made in reducing the share of privately fi nanced health
spending including out-of-pocket payments. However, those covered by health insurance are not
always protected against catastrophic health expenditure, defined as out-of-pocket payments
greater than or equal to 40% of household’s non-subsistence income, and many families still fall
into poverty due to health care expenditures.

103 CHINA IN FOCUS: LESSONS AND CHALLENGES © OECD 2012
CHAPTER 7: HEALTH CARE IN CHINA: RECENT TRENDS AND POLICY CHALLENGES
Figure 7.1 Total health expenditure per capita and GDP per capita, 2009
Source: OECD (2011)
China made considerable progress in improving health outcomes at a relatively early stage of
development, with life expectancy reaching 67 years by 1980. Since then progress has continued
to be made, but at a slower pace, with life expectancy reaching over 73 years by 2009. As a result,
whereas life expectancy in China was once high relative to its income level, it is now close to its
expected level (as shown on Figure 7.1). Progress in China has been slower than in the poorest
OECD countries, as well as in several middle income countries. Moreover, there has been no
convergence in Chinese life expectancy relative to the leading OECD countries, despite sustained
high economic growth and rising healthcare expenditures.
Improved life expectancy in China is due primarily to dramatic reductions in the incidence
of infectious diseases. There has also been rapid progress on the Millennium Development Goals,
with substantial reductions in infant and child mortality. China’s success in reducing maternal
mortality is a model which other countries could emulate, especially concerning expanded access
to emergency obstetrics. However, the control of some infectious diseases remains a concern.
China has become a global hotspot for multi-drug resistant tuberculosis (TB) with a 100 000 new
cases per year (WHO, 2010a). The latter is a man-made phenomenon caused by poor compliance
with treatment for TB and is a marker for other health system problems such as weak primary
care and the heavy fi nancial burden assumed by individuals for drugs and physician visits. China
AUS
AUTBEL
BRA
CAN
CHL
CHN
CZE
DNK
EST
FIN
FRADEU
GRC
HUN
IDNIND
ISLIRE
ISR
ITAJPN
KOR
LUX
MEX
NLD
NZL
NOR
POL
PRT
RUS
SVK
SVN
ZAF
ESP
SWE
CHE
TUR
GBR
USA
0
1000
2000
3000
4000
5000
6000
7000
8000
0 15000 30000 45000 60000 75000 90000
GDP per capita (USD PPP)
Health spending per capita (USD PPP)

104 CHINA IN FOCUS: LESSONS AND CHALLENGES © OECD 2012
CHAPTER 7: HEALTH CARE IN CHINA: RECENT TRENDS AND POLICY CHALLENGES
also faces an emerging HIV/AIDS epidemic estimated by UNAIDS, WHO and the Ministry of Health
at 780,000 people in 2009. Although the prevalence of HIV/AIDS grew rapidly in the last decades,
there have been signs that it might have slowed down in the recent years. However in order to
scale-up prevention especially among high risk groups and OECD countries have good experience
that China could learn from.
Figure 7.2 Life expectancy and GDP per-capita
Source: World Development Indicators.
The challenge of non-communicable diseases
The decline in infectious diseases has given way to non-communicable diseases as the
major health challenge. Like OECD countries, with older populations and longer life expectancy,
China now faces a growing burden of non-communicable diseases: cancer, heart attacks, strokes,
asthma, chronic obstructive pulmonary disease, and mental health. Death rates from cancer
and cardiovascular disease (strokes, heart attacks, diabetes) have soared since 1990. Non-
communicable diseases now account for over 80% of China’s 10.3 million annual deaths. Although
the change in the disease pattern is partially due to the success of China in reducing infectious
diseases, it also refl ects the high rate of risk factors for non-communicable diseases.
The most dramatic risk factor is smoking. Chinese men have one of the highest smoking
rates in the world. About one third of the population over 15 smokes, and the rate for men
in 2008 was 57% (70% for those aged 30 to 60) (OECD, 2010c). This is a time-bomb for China
and the consequences will have important implications for the future, leading to high rates
of lung cancer and cardiovascular diseases. The health effects of smoking are compounded
by dietary factors, particularly the high rate of salt consumption, and rising rates of obesity.
Chinese salt consumption is 12 grams per day per capita, more than double the WHO
recommended level, and in some areas it is as high as 20 grams (World Bank, 2010a). This is
refl ected in very high and rising prevalence and mortality rates for hypertension and stroke.
In 2006, the Ministry of Health reported mortality rates for stroke of about 111 per 100 000 in

105 CHINA IN FOCUS: LESSONS AND CHALLENGES © OECD 2012
CHAPTER 7: HEALTH CARE IN CHINA: RECENT TRENDS AND POLICY CHALLENGES
urban areas (Ministry of Health, 2006), while the OECD average is 42 per 100 000 for women
and 54 per 100 000 for men (OECD, 2011a).
As in OECD countries, the percentage of the population that is obese or overweight has
been rising rapidly over recent decades. During the last 15 years in China, overweight rates
have doubled and obesity rates tripled. Now, 1 in 3 men and 1 in 4 women are overweight. The
increase in obesity has important implications for the health system, since there are high costs
for treating obesity and related morbidities (diabetes, cardiovascular diseases, etc.) In the case
of China, it is estimated that, when the production losses are added to health care costs, obesity
could account for 3.6% of GDP (OECD, 2010b).
China’s non-communicable disease burden is higher than other G-20 countries and outcomes
are worse. Non-communicable diseases are also projected by the World Bank (World Bank, 2010a)
to double over the next decade (Figure 7.3).
Figure 7.3 Projected cases of non-communicable diseases in China
Source: UN population projections and World Bank (2010a).
Many of the non-communicable diseases in China are avoidable. Most of cardiovascular
disease, diabetes, cancer, and lung disease are preventable using good population-based public
health interventions, coupled with screening and treatment in primary care. The OECD, in
collaboration with the WHO, analysed a range of interventions to prevent chronic disease by
reducing smoking rates, improving diet and increasing physical activity. The purpose of this
research was to help governments choose the portfolio of interventions that would make the best
use of the resources available.
For instance, the high costs of smoking in terms of premature deaths from cancer and
cardiovascular diseases have led most OECD countries to introduce a wide range of interventions
to decrease smoking. These interventions were followed by a decline in smoking rates in
most OECD countries. Therefore, there might be a scope for reducing high smoking rates in
China through broad interventions as outlined in the WHO Framework Convention on Tobacco
Control (FCTC). These interventions include increased taxes on tobacco products, enforcement

106 CHINA IN FOCUS: LESSONS AND CHALLENGES © OECD 2012
CHAPTER 7: HEALTH CARE IN CHINA: RECENT TRENDS AND POLICY CHALLENGES
of smoke-free workplaces, requirements for FCTC-compliant packaging, labelling of tobacco
products combined with public awareness campaigns about the health risks of smoking, and
a comprehensive ban on tobacco. According to Cecchini et al. (2010), the cost of such a package
would amount to $0.14 per capita per year, much lower than in other large middle income
countries (Figure 7.4.)
Figure 7.4 Annual cost of a preventive package to tackle important risk factors for chronic diseases
India China BrazilSouth Africa
Russian Federati
onMexico
Unhealthy diet and physical inactivity
$0.35 $0.43 $0.48 $0.99 $1.18 $0.79
Tobacco use $0.16 $0.14 $0.25 $0.60 $0.49 $0.54
$-
$0.20
$0.40
$0.60
$0.80
$1.00
$1.20
$1.40
$1.60
$1.80
Source: Cecchini et al. (2010)
Mass media campaign, food taxes and subsidies, nutritional labelling and marketing
restrictions are all cost-effective interventions (WHO, 2011). OECD and WHO (Cecchini et al.,
2010) assessed the potential impact of a prevention package that encouraged people to have a
healthy diet and practice physical activity using all these four intervention channels. In the case
of China, they expected a yearly gain of up to 975000 life years. Figure 7.4 shows that the cost of
this package in China would amount to $0.43 per capita per year, again much cheaper than in the
other large middle income countries except for India. Such an investment would be completely
offset in the medium term (e.g. 30 years) by the savings from avoided health care episodes for
major non-communicable diseases (Cecchini et al., 2010).
The analysis of cost-effectiveness of the intervention packages for obesity and in the context
of middle income countries showed that:
— A strategy of several interventions would generate substantially larger health gains than
would individual interventions. In the case of China, the suggested prevention package
becomes cost-saving in approximately 30 years.
— Price interventions (such as a tax on fatty foods) and regulation (on food labelling) can
produce the largest health gains in the short-run.
— Interventions in primary care (such as physician counselling on diet) can be very e�ective in
scenarios with less capacity constraints.
— Health gains from interventions targeting children occur in the long term—over 50 years.

107 CHINA IN FOCUS: LESSONS AND CHALLENGES © OECD 2012
CHAPTER 7: HEALTH CARE IN CHINA: RECENT TRENDS AND POLICY CHALLENGES
Regulation of food advertising to children can be more e�ective and e�cient than can school-
based health promotion.
— Cost-e�ective interventions aimed at tackling obesity by improving diets and increasing
physical activity could usefully be added to a wider package of measures designed to deal
with chronic diseases.
— Private-sector initiatives might contribute to tackling some risk factors while alleviating the
burden on public-sector budgets, but more evidence of their e�ectiveness is needed.
That said, preventing the rise in chronic diseases is beyond the power of the health sector
alone: tackling the social determinants of these diseases requires concerted government action
across different policy areas.
There are also important implications for the health system in tackling chronic diseases. The
current health system is tilted towards the provision of complex hospital care. The result is that
chronic diseases are addressed very late in their course, leading to preventable complications
such as stroke due to untreated hypertension. Instead, the focus should be on providing cost-
effective interventions in primary care settings, including screening for hypertension and
diabetes and effective treatment as well as increased public education. Unfortunately, the health
insurance system provides greater subsidies for the treatment of conditions in hospitals rather
than ensuring access to screening and essential drugs in primary care.
In 2011, the government released guidelines for the establishment of a general practitioner
scheme which will be developed over the coming years. Following the approach used by a
number of OECD countries, the scheme will see general practitioners play a key role in the
provision of primary healthcare, and become gatekeepers of the health system. A cornerstone
of the new scheme is the introduction of a standardised accreditation and training system, built
upon a fi ve year undergraduate degree programme plus a further three years of clinical training.
Importance is also given to maintaining and upgrading skills of doctors through retraining, as
well as professional evaluations. The system will give patients enough fl exibility to choose their
own general practitioner within a specifi ed geographic area, such as a city or district, and fees
will be regulated by the government. To ensure an adequate supply of doctors across the country
allowances and other fi nancial incentives will be provided to those working in remote areas.
Mental health also needs to be supported through prevention, concerted action and effective
delivery of health care services. Although declining, suicide rates are especially high for patients
with depression and anxiety disorders, particularly among women and migrant workers (Phillips,
2002). While OECD countries have moved towards deinstitutionalization, China is still responding
to the rise in mental illness by building more and larger mental institutions. Although all
countries require some mental health beds for those dangerous to the community, most people
with mental illness pose no danger and can be treated in the community. The trend in many
OECD countries has been a decrease in mental health beds and greater care in the community.
Also, the largest burden of mental illness is for less severe conditions, e.g., depression and anxiety
disorders, which can be treated in primary care. These conditions may be neglected in China. For
example, the treatment of depression is not included in the essential drug list for primary care,
despite being highly cost-effective (OECD, 2012, WHO, 2010b).
A critical question for China is to assess and monitor the quality of care for people with
non-communicable diseases. The OECD Health Care Quality Indicators Project was set up to
allow countries to benchmark their performance especially for non-communicable diseases.

108 CHINA IN FOCUS: LESSONS AND CHALLENGES © OECD 2012
CHAPTER 7: HEALTH CARE IN CHINA: RECENT TRENDS AND POLICY CHALLENGES
The project began in 2002 and now covers all OECD countries in the following areas: Health
Promotion; Prevention and Primary Care; Mental Health Care; Cancer Care; Patient Safety; and
Patient Experience. Quality Indicators are approved by national and international experts.
Figure 7.5 An example of quality indicators collected in the OECD Health Care Quality Indicators Project: Asthma hospital admission rates, population aged 15 and over,
2009 (or nearest year)
Information on data for Israel: http://dx.doi.org/10.1787/888932315602Note: Rates are age-sex standardised to 2005 OECD population. 95% confidence intervals are represented by H.
Slovak RepublicUnited States
KoreaNew Zealand
FinlandUnited Kingdom
PolandIsrael
AustraliaAustriaOECD
BelgiumNorw aySpainIrelandFrance
SloveniaCzech Republic
DenmarkHungaryIceland
Sw itzerlandNetherlands
GermanySw eden
ItalyMexicoCanadaPortugal 20
2127
242526
3838
42434847
4354586164
6066
5993
8985
10095
112110
164216
109111413151723232624263332282327353646
3845514654
4893
73116
0 60 120 180 240Rates per 100 000 population
Female Male15.115.7
19.019.219.320.8
27.530.9
33.335.036.537.038.1
43.443.543.9
47.648.4
51.852.8
66.668.468.9
73.775.9
80.7101.5
120.6166.8
050100150200Rates per 100 000 population
Source: OECD Health Data 2011.
China could consider collecting systematic Health Care Quality Indicators for non-
communicable diseases, such as asthma (illustrated in Figure 7.5), myocardial infarction, stroke,
diabetes and cancer. Currently, there are only a few cancer registries in China, covering a small
proportion of the country. There is also virtually no information available on hospital mortality or
re-admissions rates and data on primary care are scant. The growth of the new insurance system
will provide an opportunity to begin collecting information on the quality of medical care.
Health insurance coverage has expanded, but fragmentation remains
As mentioned, health insurance coverage has been expanding rapidly in China and the
government has made progress in unifying different schemes. In 2008, the co-existence of three
health insurance schemes with different features and local variants made for a fragmented
system, which did not guarantee access to basic medical services to the whole population.
Reforms announced in 2009 by the State Council established priorities to overcome these
diffi culties.

109 CHINA IN FOCUS: LESSONS AND CHALLENGES © OECD 2012
CHAPTER 7: HEALTH CARE IN CHINA: RECENT TRENDS AND POLICY CHALLENGES
The three schemes target different populations and are administered by different levels
of governments, with different eligibility rules, approaches to financing and benefit coverage.
The longest standing scheme, the Urban Employee Basic Medical Insurance scheme (UE-BMI),
is mandatory for all employees and retirees in urban areas and covers over 230 million people,
though in reality far from all employers declare their employees to the insurance funds. It is
administered at municipal level and financed through employer and employee contributions
(respectively 6% and 2% of payroll). Two newer schemes have been introduced. The Urban Residents
Basic Medical Insurance scheme targets non-working urban residents, such as children, students,
elderly and the disabled. It covers about 195 million people. The scheme is also administrated
at municipal levels, with variations across cities in eligibility, financing and benefit packages.
Subscription to the scheme is voluntary and co-fi nanced by government subsidies (Barber and
Yao, 2010). The biggest extension of insurance came with the progressive introduction of the New
Rural Cooperative Scheme (NRCMS), which targets rural populations, and covered 836 million
people by 2010, over 95% of the targeted population (NBS, 2011). The scheme, administered at
the county level, is voluntary and financed through individual fixed premiums and subsidies
from central and local governments. Benefit levels are low, with the average annual payment
per benefi ciary being USD 16. These health insurance schemes are complemented by a Medical
Financial Assistance Programme (MFA), funded by all levels of government, to ensure access
to care for the poorest part of the population and prevent further impoverishment for medical
reasons. The MFA covered a little over 93 million people in 2009.
The progressive implementation of these schemes has ensured that the proportion of
the population covered by basic insurance has increased sharply, to around 95% by 2011.
Concomitantly, the private share of health expenditures has fallen considerably, from 60% in
2001 to around 35% in 2010. High direct payments by households include high cost-sharing
requirements - for instance, reimbursement for inpatient care in the NRCMS only accounted
for 41% of costs in 2009. The government is pursuing efforts to expand coverage and limit out-
of-pocket payments. More specifi cally, it intends to provide safe, affordable and effective health
care to all citizens by 2020 by further raising health insurance coverage, establishing a national
essential drug programme, introducing gate keeping to reduce the hospital burden, improving
basic medical services for screening and prevention, and experimenting with reforms of public
hospitals to improve their management (Herd et al. 2010).
However, there remain considerable challenges in coordinating the wide range of insurance
schemes that cover different populations with different benefit packages. In particular, the
fragmentation of insurance schemes has particularly affected the effective coverage of migrant
workers. Typically enrolled in the NRCMS, migrant workers usually pay high out-of-pocket
expenses and have to claim reimbursement of fees in their home county with much lower
reimbursement rates and long time lags (Qiu et al., 2011). Also, the method of payment used by
the insurance funds is fuelling the growth of the hospital sector as discussed below.
Further reform of the public hospital system is required
Hospital reform ranks high on China’s policy agenda, in particular, tackling the increasing
problems with financing and managing public hospitals. To date, however, progress has been
limited. The combination of rising incomes and expectations and greater fi nancial coverage of
health costs has driven a rapid expansion of the hospital sector especially in urban areas (Table
7.1).

110 CHINA IN FOCUS: LESSONS AND CHALLENGES © OECD 2012
CHAPTER 7: HEALTH CARE IN CHINA: RECENT TRENDS AND POLICY CHALLENGES
Table 7.1 Hospitals and hospital beds in China
Number of hospitals Number of beds
Total Per 1000 residents
1990 14377 1868900 1.6
1995 15663 2063300 1.7
2000 16318 2166700 1.7
2005 18703 2445000 1.9
2010 20918 3387400 2.5
Source: NBS (2011).
The increase in hospital capacity is not, however, uniform across China, with wide differences
between provinces, as well as between urban and rural areas. Beijing has almost three times
more hospitals per capita (around 27 per million residents) than Guangxi (around 10 per million
residents). Hospitals have mostly expanded in urban areas, especially large university-based
hospitals providing high-technology services. Although there are many smaller hospitals, they
have low occupancy rates and make up a diminishing proportion of total hospital beds.
The number of hospital beds is still low, with around only 2.5 beds per thousand residents
compared to the OECD average of 4.9. However, OECD countries are now beginning to reduce the
size of the hospital sector in response to the rise in chronic diseases; it is expensive and often
ineffective to concentrate care for these diseases in hospitals rather than in the community.
There has been a steady decline in hospital beds in OECD countries, whose experience suggests
that hospitals should focus more on new modes of integrated care to prevent and treat chronic
diseases which require fewer beds and stronger primary care.
Both the number and skill level of doctors have also increased in the past fi ve years. After
a decade of stagnation, the number of doctors rose by over 20%. In hospitals, the proportion of
doctors with at least a university degree in medicine has risen by 14 percentage points in fi ve
years, to reach 62%. However in lower level institutions, the proportion of doctors with this level
of qualifi cation is still below 10% (MOH, 2011).
Currently, most hospitals are publicly owned and highly regulated, with restrictions on prices
of hospital services and management of health personnel. However, although ownership remains
public, most of the financing of hospitals comes directly from patients. It is estimated that
government funds make up only 10-25% of the operating revenues of hospitals, the remaining
part being mainly fi nanced through charging patients for drugs- and high-technology procedures.
Revenues from the insurance system have been increasing recently, thus creating an opportunity
for change.
The current payment system for hospitals distorts the provision of services. Regulated
hospital prices are structured in such a way as to give incentives to oversupply high-technology
services and medications, since this is where more revenues are generated (see below). The
government has attempted to deal with the problem by restricting the mark-up that can be
charged on pharmaceuticals, but to date this is only at the primary care level. Yet, this approach
does not address the underlying problem, which is that government is providing inadequate
financing to fund the operating costs of hospitals and hospitals are required to make up the
difference by charging patients.
There is widespread evidence that the Chinese hospital system is relatively ineffi cient. The
best illustration of the ineffi ciency is the long lengths of stay compared to OECD countries. China
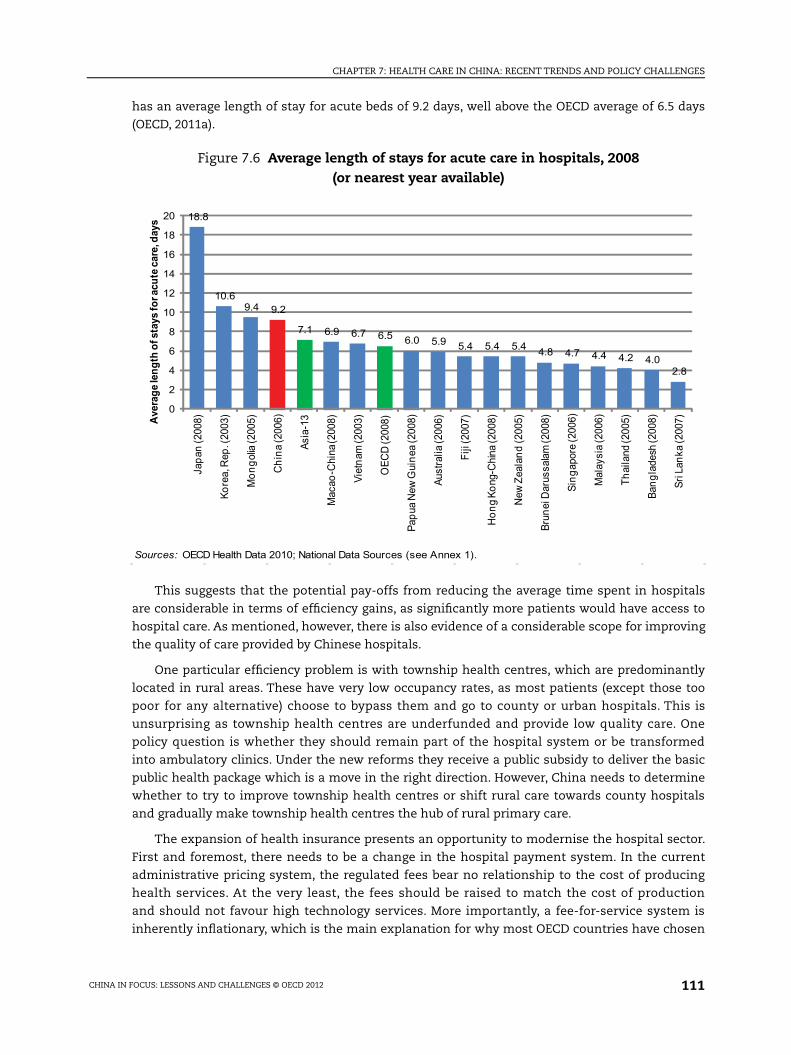
111 CHINA IN FOCUS: LESSONS AND CHALLENGES © OECD 2012
CHAPTER 7: HEALTH CARE IN CHINA: RECENT TRENDS AND POLICY CHALLENGES
has an average length of stay for acute beds of 9.2 days, well above the OECD average of 6.5 days
(OECD, 2011a).
Figure 7.6 Average length of stays for acute care in hospitals, 2008 (or nearest year available)
Sources: OECD Health Data 2010; National Data Sources (see Annex 1).
2.8 4.0 4.2 4.4 4.7 4.8 5.4 5.4 5.4 5.9 6.0 6.5 6.7 6.9 7.1
9.2 9.4 10.6
18.8
0
2
4
6
8
10
12
14
16
18
20
Sri L
anka
(200
7)
Bang
lade
sh (2
008)
Thai
land
(200
5)
Mal
aysi
a (2
006)
Sing
apor
e (2
006)
Brun
ei D
arus
sala
m (2
008)
New
Zea
land
(200
5)
Hon
g Ko
ng-C
hina
(200
8)
Fiji
(200
7)
Aust
ralia
(200
6)
Papu
a N
ew G
uine
a (2
008)
OEC
D (2
008)
Viet
nam
(200
3)
Mac
ao-C
hina
(200
8)
Asia
-13
Chi
na (2
006)
Mon
golia
(200
5)
Kore
a, R
ep. (
2003
)
Japa
n (2
008)Av
erag
e len
gth
of st
ays f
or ac
ute c
are,
day
s
This suggests that the potential pay-offs from reducing the average time spent in hospitals
are considerable in terms of effi ciency gains, as signifi cantly more patients would have access to
hospital care. As mentioned, however, there is also evidence of a considerable scope for improving
the quality of care provided by Chinese hospitals.
One particular effi ciency problem is with township health centres, which are predominantly
located in rural areas. These have very low occupancy rates, as most patients (except those too
poor for any alternative) choose to bypass them and go to county or urban hospitals. This is
unsurprising as township health centres are underfunded and provide low quality care. One
policy question is whether they should remain part of the hospital system or be transformed
into ambulatory clinics. Under the new reforms they receive a public subsidy to deliver the basic
public health package which is a move in the right direction. However, China needs to determine
whether to try to improve township health centres or shift rural care towards county hospitals
and gradually make township health centres the hub of rural primary care.
The expansion of health insurance presents an opportunity to modernise the hospital sector.
First and foremost, there needs to be a change in the hospital payment system. In the current
administrative pricing system, the regulated fees bear no relationship to the cost of producing
health services. At the very least, the fees should be raised to match the cost of production
and should not favour high technology services. More importantly, a fee-for-service system is
inherently infl ationary, which is the main explanation for why most OECD countries have chosen
112 CHINA IN FOCUS: LESSONS AND CHALLENGES © OECD 2012
CHAPTER 7: HEALTH CARE IN CHINA: RECENT TRENDS AND POLICY CHALLENGES
to abandon it. Notably, they have moved towards a case-based payment system, using diagnostic
related groups, often combined with a global budget. Even though a case-based payment system
is appropriate for China insofar as it helps to reduce the average length of stays, it does not
control admissions, which have been increasing over the past decade. For China to move towards
a mixed diagnostic related groups budgeting system for hospitals, considerable changes in the
currently fragmented health insurance system would be required.
Given the large-scale reforms underway, China has the chance to re-think the role of the
expanding hospital sector, taking into account that many countries are reducing their reliance
on hospital care. Expanding primary care and care in the community while moving away from
hospitals is a policy objective in many OECD countries, witness the de-institutionalisation of the
mentally ill and care in the community for mental illness. For other diseases like diabetes and
hypertension, early diagnosis and treatment should be improved, as well as public awareness
campaigns. The health system needs to support patients to ensure that they understand their
chronic conditions and follow the recommended treatment regimens which often require taking
medications for the rest of their lives. This requires a strong system of primary care and patient
support that is lacking in China. There is also a need for much greater information on hospital
performance in China, for both quality and cost. China would benefit from more systematic
reporting of health care quality indicators. Finally, China should give more consideration to
solving the governance problems of Chinese public hospitals by giving them greater latitude
to control their own personnel to adapt to rapidly changing circumstances. The rise of chronic
disease will be the key future challenge for China and the health system will need to be adapted
to move toward greater reliance on primary care that is well coordinated with specialist hospital
care.
A national pharmaceuticals scheme is being implemented to improve access to affordable medicines
The National Essential Drug Programme, a recent reform priority of the State Council, aims to
provide affordable access to essential medicines and promote the rational use of pharmaceuticals
(Barber and Huang, 2010). The operational goals are to: ensure that “essential medicines” will
be available in all public primary care facilities at no or low cost for patients; remove providers’
incentives to overprescribe medicines; and improve tendering processes to obtain inexpensive
quality medicines.
The Essential Medicine List is defi ned according to a two-stage approach. First, a national list
is defi ned at the central level by a committee of scientifi c experts and government representatives
for all essential drugs expected to be available in primary care facilities. Provincial authorities
then undertake another selection process to amend (within limits) and complement the national
list, adapting it to local health needs and fi nancial resources. Health insurance schemes defi ne
their own formularies with a similar process.
In order to secure access to inexpensive quality medicines, centralised procurement
procedures are to be put in place, launched at provincial level. In this framework, provincial
authorities have been piloting various tendering processes, whose assessment should help
determine the most efficient ways to get low prices and high quality essential medicines.
Centralised purchasing is also expected to improve the availability of drugs in health care
facilities.
To promote the rational use of medicines, evidence-based guidelines have been disseminated

113 CHINA IN FOCUS: LESSONS AND CHALLENGES © OECD 2012
CHAPTER 7: HEALTH CARE IN CHINA: RECENT TRENDS AND POLICY CHALLENGES
in the medical community, and efforts are underway to remove the financial incentives that
encourage irrational prescribing. As noted above, community health centres and hospitals
(in which people too often seek primary care services) have long earned a profit from selling
medicines prescribed by their staff to patients. Indeed pharmaceutical mark-ups represent a large
share of providers’ institutions revenues: for instance, in 2007, community-based primary care
centres drew 70 to 80% of their revenues from these mark-ups (Wang et al., 2011). This naturally
provides an incentive to prescribe more and more expensive drugs. Under the new system, local
governments have been increasing their funding to health care institutions – mainly publicly-run
community health care centres – in exchange for the implementation of a “zero mark-up policy”.
These reforms represent a significant step forward and will help control future healthcare
costs. In 2008, pharmaceutical spending accounted for 2.1% of GDP, or 49% of total health
expenditures, which is high by international standards (Barber and Huang, 2010; OECD, 2010a).
Pharmaceutical consumption is only expected to increase, driven by the shift in morbidity,
population ageing, expansion of health insurance, and growing attention of pharmaceutical
companies to one of the fastest growing markets in the world. As such, the adoption of a sound
system to ensure effi cient use of pharmaceutical spending is a priority.
BIBLIOGRAPHY
Barber S. and B. Huang (2010), “Background Paper on the Essential Medicines System”, WHO China,
Unpublished.
Barber S. and L. Yao (2010), “Health Insurance Systems in China: A Briefing Note”, Background paper No. 37,
World Health Organisation.
Cecchini M, Sassi F, Lauer JA, et al. (2010), Tackling of unhealthy diets, physical inactivity, and obesity: health effects and cost-
effectiveness. Lancet, Issue 376, 1775–84
Herd R., Y.-W. Hu and V. Koen (2010), “Improving China’s Health Care System”, OECD Economics Department
Working Papers, No. 571.
Ministry of Health (2006), Chinese Health Statistical Digest 2006, Ministry of Health, issue 45 People’s Republic of China
Ministry of Health (2011), Health Statistics 2011
NSB (2011), China Statistical Yearbook 2011, China Statistics Press, Beijing.
OECD (2010a), Improving Value in Health Care: Measuring Quality, OECD, Paris.
OECD (2010b), Obesity and the Economics of Prevention: Fit not Fat, OECD, Paris
OECD (2010c), Health at a Glance: Asia/Pacifi c, OECD, Paris
OECD (2011a), Health at a Glance 2011, OECD, Paris.
OECD (2012), Mental health Assessment Profi le (MhAP) China, internal working document, OECD, Paris.
Phillips M. (2002), Suicide rates in China, 1995 – 99, The Lancet, Vol. 359, Issue 9309
Qiu P.Y., Yang Y., Zhang J.Y. and Ma X. (2011), Rural-to-urban migration and its implication for new cooperative medical scheme
coverage and utilization in China, BMC Public Health , Vol.11

114 CHINA IN FOCUS: LESSONS AND CHALLENGES © OECD 2012
CHAPTER 7: HEALTH CARE IN CHINA: RECENT TRENDS AND POLICY CHALLENGES
Wang H., M.K. Gusmano and Q. Cao (2011), “An Evaluation of the Policy on Community Health Organizations
in China: Will the Priority of New Healthcare Reform in China be a Success?”, Health Policy, No. 99, pp.
37–43.
World Health Organization (2010a), Multidrug and extensively drug resistant TB (M/XDR TB): 2010 Global
Report on Surveillance and Response,
World Health Organization (2010b), Mental Health Gap (MhGAP) Intervention Guide for Mental, Neurological, and Substance
Abuse Disorders in non-specialised health settings.
World Health Organization (2011), Discussion paper prepared on “prevention and control of NCDs: priorities for investment, paper
presented at the occasion of the First Global Ministerial Conference on Healthy Lifestyles and Noncommunicable Disease
Control, held in Moscow, 28-29 April 2011
World Bank (2010a), Towards a Healthy and Harmonious Life in China: Stemming the Rising Tide of Non-Communicable
Diseases, World Bank, Washington DC.

115 CHINA IN FOCUS: LESSONS AND CHALLENGES © OECD 2012
CHAPTER 8: NUCLEAR ENERGY IN CHINA: VIEWS AND PROSPECTS FROM THE OECD NUCLEAR ENERGY AGENCY’S PERSPECTIVE
Chapter 8:
Nuclear Energy in China: Views and Prospects from the OECD Nuclear Energy Agency’s
Perspective
Introduction
As a result of strong economic growth, China’s demand for energy has increased rapidly
in recent years. China’s biggest energy source is coal (over 71%), creating a significant impact
on the environment. As reflected in recent Five-Year Plans for National Economic and Social
Development, China has aimed to increase the use of non-fossil fuels. The 10th Five Year Plan
(2001-2005) called for the construction of eight nuclear reactors, while the 11th Plan (2006-2010)
included more ambitious environmental goals. The 12th Plan (2011-2015) specifi es an increase in
the number of reactors. From 40 Gigawatts electrical (GWe) today, the nuclear installed capacity
would reach 60 GWe by 2020, 200 GWe by 2030, and 400 GWe by 2050. However, even by 2050, this
is expected to represent only around 10% of China’s electricity generation capacity.
According to the March 2005 Medium and Long Term Plan for Science and Technology
(2006-2020) China aims to rely on self-design and innovation while making use of international
advanced technology and experience. Above all, the government insists on putting safety and
quality first. Its industry will provide an integrated capability for building advanced nuclear
power plants in batches and will be able to build, operate and manage nuclear plants in a way
that conforms to international advanced standards During the period of the plan the government
aims to establish a nuclear power industry with a complete set of regulations and standards.
The fl eet of reactors and the impact of the Fukushima-Daiichi accident
China has currently 15 power reactors in operation and leads the world in terms of nuclear
power plant new builds, with 26 reactors under construction and 51 planned. At the end of
2010, China’s nuclear power generation was 87 400 GWe, amounting to less than 2% of the
country’s total electrical power production. Several major state-owned companies dominate the
nuclear power industry, both as operators and owners, including the China Guangdong Nuclear
Power Corporation, the China National Nuclear Corporation, and the China Power Investment
Corporation.

116 CHINA IN FOCUS: LESSONS AND CHALLENGES © OECD 2012
CHAPTER 8: NUCLEAR ENERGY IN CHINA: VIEWS AND PROSPECTS FROM THE OECD NUCLEAR ENERGY AGENCY’S PERSPECTIVE
Reactors in operation and under construction are from different generations and technologies,
mainly from France and the US, but also from Canada and Russia. Historically, China’s approach
has been to import technologies to learn from world top nuclear players, then adapt, change, and
fi nally build their own. China fulfi lled its goal to develop domestically designed reactors mainly
with the CNP1-1000 and the CPR2-1000.
The Generation II+ domestic technology was intended to become the backbone of China’s
nuclear power plans until the Fukushima accident occurred. At present, China focuses its efforts
on building Generation III+ reactors, given their improved safety features. A recent Chinese-
French project of designing an improved CPR was announced in January 2012, while a Chinese-US
Generation III+ design has been under development since 2008.
Generation III+ reactors under construction include US/Japan Westinghouse’s AP-1000
(four units in Sanmen and Haiyang sites) and two EPR3 units from Frances’s Areva (Taishan,
Guangdong province). Specifically, EPR construction schedules have turned to be quicker than
similar design reactors being built in Europe.
China has also completed construction of a fast neutron reactor, the Chinese Experimental
Fast Reactor, which was connected to the grid in 2011. China, along with other countries, is
conducting research on new reactor designs, Generation IV technology. Presently they are
supporting two distinct concepts, the Very High Temperature Reactor and the Sodium-cooled Fast
Reactor. The US has also chosen the same concepts.
There are 15 research reactors operating in China. One in particular, the Chinese Advanced
Research Reactor, has the most advanced technology among all neutron beam research reactors
in the world. It can be used for research in many fields such as nuclear physics and nuclear
chemistry, neutron scattering experiments, testing of reactor materials and atomic fuels, neutron
activation analysis and the production of radioactive species and neutron-doped silicon.
China is in the process of revising its safety regulations in the light of the Fukushima-
Daiichi accident. On 16 March 2011, just 5 days after the Fukushima accident, the State Council
announced the temporary suspension of the approval procedure for all new nuclear power
projects, including those in the preliminary stages of development, and the safety assessment
of all nuclear power plants under construction. A month later, a national inspection group,
composed of the National Energy Administration, the National Nuclear Safety Administration
and the China Earthquake Administration, began checking the safety of nuclear plants under
construction and in operation.
The fuel cycle
China intends to become self-suffi cient in most aspects of the fuel cycle. At present however,
the country largely relies on foreign suppliers for all stages of the fuel cycle from imported
uranium, conversion, enrichment to fuel fabrication services. Current domestic uranium mining
supplies less than 50% of China’s needs. Currently identifi ed resources of 170,000 tonnes Uranium
(tU) are inadequate for the country’s long-term needs, although ongoing exploration efforts have
led to discoveries in sandstones in the north and northwest China, and deep hydrothermal vein
type deposits in southeast China.
1 Comprehensive Nuclear Power
2 Chinese Pressurized Reactor
3 European Pressurised Reactor

117 CHINA IN FOCUS: LESSONS AND CHALLENGES © OECD 2012
CHAPTER 8: NUCLEAR ENERGY IN CHINA: VIEWS AND PROSPECTS FROM THE OECD NUCLEAR ENERGY AGENCY’S PERSPECTIVE
The China National Nuclear Corporation (CNNC) has established a subsidiary, the China
Nuclear International Uranium Corporation, to secure uranium resources abroad. China has made
several joint ventures and other types of contracts with countries such as Kazakhstan, Namibia,
Niger and Australia, while other sources are progressively being added.
Increasing investment in exploration projects outside of China to secure the supply of
uranium and, hence, to support the planned nuclear generating capacity expansion is a likely
evolution. Also, with the vast amount of land available in China, additional efforts to increase
uranium exploration within the country may be considered, as well as increasing investments in
mining technologies to improve the effi ciency of existing operations.
China has plans to re-use spent fuel with reprocessing technology and mixed-oxide (MOX)
fuel production. A pilot reprocessing plant using the Purex process with a capacity of 50 tonnes
per year was commissioned in 2010 at Lanzhou Nuclear Fuel Complex. In November 2007, Areva
and the CNNC signed an agreement to assess the feasibility of setting up a reprocessing plant for
used fuel and a MOX fuel fabrication plant in China. In 2010, a subsidiary of GDF Suez, Tractebel,
signed an agreement with CNNC to build a MOX fuel fabrication plant.
Regarding waste management, China is committed to dispose in a national centralised
geologic repository high-level and other radioactive waste that is not suitable for near surface
disposal. While operation of a geologic repository is not expected before 2050, a R&D programme
has been set up and an underground geological laboratory should be established by 2020. Siting
studies and a site characterisation programme have been started on a granite formation in the
northern mountains region in northwest China at Beishan, near the Gobi Desert. Currently, the
Beijing Research Institute of Uranium Geology is exploring the site and several boreholes have
been drilled to determine the suitability of the site for long-term disposal.
China and the OECD Nuclear Energy Agency
Currently, China is a member of the Multinational Design Evaluation Programme (MDEP). This
international initiative, for which the OECD Nuclear Energy Agency (NEA) acts as the technical
secretariat, aims to develop innovative approaches to leverage the resources and knowledge of
the national regulatory authorities that will be tasked with the review of new reactor power plant
designs. Within the MDEP, China participates in all working groups, including on the EPR and
the AP1000 designs, vendor inspections, codes and standards and digital instrumentation and
controls.
China participates in the Generation IV International Forum (GIF), where the NEA also acts as
the technical secretariat. GIF is a co-operative international endeavour organised to carry out the
research and development needed to establish the feasibility and performance capabilities of the
next generation of nuclear energy systems.
China contributes to the Information System on Occupational Exposure project. This is a joint
effort between the NEA and the International Atomic Energy Agency (IAEA) to collect data on the
amount of radiation a worker receives in the workplace. Chinese experts also participate in an
NEA project evaluating best practices in the management of radioactive effl uents from nuclear
power plants.
China also participates in the NEA-IAEA Uranium Group, an international committee that
assesses global uranium resources, mine production and future demand every two years,
publishing results in a series titled “Uranium Resources, Production and Demand” (commonly
known as “the Red Book”).

118 CHINA IN FOCUS: LESSONS AND CHALLENGES © OECD 2012
CHAPTER 8: NUCLEAR ENERGY IN CHINA: VIEWS AND PROSPECTS FROM THE OECD NUCLEAR ENERGY AGENCY’S PERSPECTIVE
China took part in the International Conference on Access to Civil Nuclear Energy held in
Paris in March 2010. French President Nicolas Sarkozy opened the conference attended by 40
ministers, and around 1200 participants from 63 countries. The conference was co-organised by
the NEA. The objectives of the Conference was to respond to the needs of States wanting access
to civil nuclear energy with regard to training, fi nancing, support to the implementation of the
highest safety and security standards as well as assistance for the setting up of the technical/
regulatory frameworks and infrastructures.
Increased co-operation between China and the NEA: mutual benefi ts
Nuclear safety and regulation
The NEA nuclear safety activities provide participating members with policy and technical
analyses that can be directly used in their day-to-day work of safety authorities. The activities
may be grouped into four categories, policy and regulatory activities, technical activities, safety
research activities and design review activities for new builds. Participating in NEA’s activities has
been considered benefi cial by nuclear states as it allows them to:
• Have access to regulatory policies based on best practices resulting from NEA safety
activities.
• Benchmark their own national regulatory practices against other NEA members’ and the
consensus derived from NEA safety activities.
• Compare their approach to regulatory inspection with the ones based on other members’
practices.
• Use a reliable network of experienced regulators to interact easily and effi ciently with other
safety authorities.
• Share knowhow regarding technical safety of nuclear plants: the participation in NEA
working groups on nuclear safety ensures that good practices and technical responses
common to countries representing 85% of the world’s installed capacity are shared among
member countries’ regulators and utilities.
Radioactive waste management and decommissioning
Though an operating repository is not expected before 2050, China has probably an interest,
much like other nuclear countries, to develop a deep geological disposal location for high
level waste. An NEA Collective Statement (September 2008) states that geological disposal
affords unparalleled protection, is technically feasible and widely adaptable to diverse geology.
Worldwide, increasing involvement of stakeholders has been noted and societal requirements
are taken into account in developing geological repositories. Cultural, societal and geographical
specifi cities have resulted in a variety of paths, yet with common underlying safety and security
objectives; moving forward now with implementation of geological disposal is desirable from the
point of view of both ethics and safety.
China could certainly build on NEA countries’ experience in this area, as they have developed
a common understanding of the strategic and policy issues associated with long-term waste
management, developing a modern concept for the safety case for geologic disposal and ensuring
stakeholder confi dence.
119 CHINA IN FOCUS: LESSONS AND CHALLENGES © OECD 2012
CHAPTER 8: NUCLEAR ENERGY IN CHINA: VIEWS AND PROSPECTS FROM THE OECD NUCLEAR ENERGY AGENCY’S PERSPECTIVE
The NEA also provides a focus for the analysis of decommissioning policy, strategy and
regulation, including the related issues of management of materials, release of buildings and
sites from regulatory control and associated cost estimation and funding. Beyond policy and
strategy considerations, the NEA also reviews practical considerations such as techniques for
characterisation of materials, decontamination and dismantling.
Radiological protection and emergency preparedness
The NEA has interacted actively in developing the new recommendations of the International
Commission on Radiation Protection and with the IAEA to develop the International Basic Safety
Standards. The NEA has for some time concerned itself with monitoring progress in science,
in particular biology, genetics and new data from epidemiological research that could affect
the way in which radiological protection is understood and implemented. To this end, the NEA
summarised the state-of-the-art, either broadly, or more specifi cally with studies of such things
as epidemiology, dosimetry and monitoring of radon, plutonium and tritium.
Currently, the Information System on Occupational Exposure (ISOE) has received data for 5 of
the 15 power reactors in China. In addition, there is only one regulatory institution participating
in the project, the Nuclear and Radiation Safety Centre (NRSC). An increased participation in
ISOE would allow China to join other countries’ efforts to develop international radiation safety
standards and implement them. Finally, NEA has focused signifi cant efforts on the management
of nuclear emergencies. In particular, participating countries have organised via the NEA
international nuclear emergency exercises, which might also be of interest to Chinese operators.
Economic, strategic and policy-relevant analysis
The NEA provides economic, strategic and policy relevant analyses for governments seeking
to respond to the challenges of ensuring sustainable energy policies and effective new nuclear
build processes. The strengths of the NEA derive from its specifi c expertise in economics, scenario
modelling, technology assessment and uranium resources, the ability to quickly put together
state-of-the-art thematic reports (technology, medical isotopes, education and training etc.), the
involvement of experts from member countries in discussing best practices.
The NEA produces important studies to understand the cost of electricity, the role of nuclear
power in combating climate change, the security of energy supply and trends in the nuclear fuel
cycle. In the near future, the NEA plans to study or issue reports on, inter alia, education and
training, system costs of energy technologies (including grid costs back-up power supply and
siting costs), the impact of load following with nuclear plants and, of particular interest after
Fukushima, the cost of nuclear accidents. Understanding the challenges to new build has been,
and continues to be assessed in a number of NEA studies.
China would be much welcome to participate in NEA’s High-Level Group on the Security of
Supply of Medical Radioisotopes, after the recent disruption in the global supply chain and the
international community’s commitment to move world’s facilities from highly enriched uranium
to low enriched uranium targets.
Scientifi c cooperation
As the nuclear power reactor fleet grows, research reactors will certainly benefit the
development of China’s nuclear power program, as it has been the case for other nuclear states.

120 CHINA IN FOCUS: LESSONS AND CHALLENGES © OECD 2012
CHAPTER 8: NUCLEAR ENERGY IN CHINA: VIEWS AND PROSPECTS FROM THE OECD NUCLEAR ENERGY AGENCY’S PERSPECTIVE
The Chinese Advanced Research Reactor reactor is of particular interest to the NEA because of
the advanced neutron capabilities it possesses.
Participating countries benefi t from NEA’s activities in the fi eld of science and its expertise
in reactor systems, fuel performance, criticality safety, fuel cycle & waste management issues,
multi-scale materials modelling, nuclear data, and integral experiments. The Agency has the
ability to bring together internationally recognised experts to identify and analyse key technical
issues and challenges, and to pass the knowledge gained on to the ‘user community’ through
reports, discussion groups, workshops, training courses or conferences.
Legal expertise
The NEA constitutes a unique forum to meet and network with senior legal representatives
from governments and nuclear regulatory authorities, and discuss the advantages and
disadvantages of the various international nuclear liability conventions that exist today.
The NEA has two schools of nuclear law in Paris and Montpellier which have trained
worldwide managers and legal experts (including some Chinese nationals) who want to learn and
understand international and national regulations of the nuclear sector.
Concluding remarks
China’s nuclear program is growing fast, as the rest of its economy. Post-Fukushima, it is
expected to rely essentially on Generation III+ technologies with a clear intention to develop and
use self-designs. In any case, the fast growth of China’s reactor fl eet raises policy issues that other
advanced nuclear countries have encountered and for which international dialogue co-operation
could play a very useful role.
The NEA could play a positive role in fostering and facilitating the development of China’s
fully integrated programme and looks forward to enhance its collaboration with the Chinese
nuclear authorities.

121 CHINA IN FOCUS: LESSONS AND CHALLENGES © OECD 2012
CHAPTER 9: ECONOMIC TRANSFORMATION AND POVERTY REDUCTION: HOW IT HAPPENED IN CHINA, HELPING IT HAPPEN IN AFRICA
Chapter 9:
Economic Transformation and Poverty Reduction: How it Happened in China, Helping
it Happen in Africa
Introduction
Over the last 30 years, China has undergone a profound economic transformation lifting
hundreds of millions of people out of poverty. This process reshaped the global economy and
changed the economic context for nations and people all around the world. China’s development
experience shows what can be achieved when growth is broadbased and inclusive.
This chapter sets out how the lessons from China’s growth and success in reducing poverty can be generalised
to Africa. It summarises work by the ChinaDAC Study Group (hereafter the Group) established by the International
Poverty Reduction Center in China (IPRCC) and the OECD’s Development Assistance Committee (DAC).
The Group included representatives from a number of OECD countries, leading Chinese development
research institutions and a number of African experts and institutions. More than 500 people, including
academics, researchers, officials and development practitioners, from China, Africa and OECD member countries
participated in these events, which were held alternately in China and Africa. From 2009 to 2011, the Study Group
organised several international events on development partnerships; agriculture; infrastructure; and the enabling
environment for enterprise development.
Peer learning processes can generate the ideas and evidence for promoting reforms. The Study Group
identifi ed two main points that merit highlighting:
• The extent to which China’s economic transformation has contributed to its poverty reduction. The process of
reform and opening up was based on experimentation, monitoring and the scaling up of successful models. It
is this continual process of policy learning and innovation, including the explicit effort to draw from advanced
international practice, that has driven China’s transformation. This transformation involved re-positioning the
roles of government and market, and absorbing lessons by promoting learning institutions and incentivising
human talent. China continually identifies and confronts emerging new challenges, such as the need to
rebalance its economy, boost domestic demand, upgrade skills, deal with environmental issues and find new
sources of growth through innovation. China’s 12th fiveyear plan makes these weaknesses and new challenges
key reference points for public policy.

122 CHINA IN FOCUS: LESSONS AND CHALLENGES © OECD 2012
CHAPTER 9: ECONOMIC TRANSFORMATION AND POVERTY REDUCTION: HOW IT HAPPENED IN CHINA, HELPING IT HAPPEN IN AFRICA
• There is a common interest among Africans, Chinese and OECD countries in the emergence
of wellfunctioning economies and states throughout the world that encourage the
participation of people in the development process. Rapid poverty reduction and rising
human capital would furnish the basis for a rising middle class to sustain development in
the 21st century, a goal shared by African nations and people, through the African Union and
a whole range of other institutions and processes. The policies for economic transformation
in many countries are being increasingly set by the evolution of accountable governments.
Box 9.1. What is the OECD’s Development Assistance Committee?
The Development Assistance Committee (DAC) of the OECD has grouped the world’s main donors, defi ning and monitoring global standards in key areas of development for over 50 years. The DAC is a unique forum for sharing views and exchanging lessons and has gained a reputation for neutrality and highquality work. One of the OECD’s oldest and principal committees, it has ready access to a diverse array of policy communities. Increasingly, the DAC looks beyond the traditional aid arena to address pressing development challenges such as climate change, confl ict and fragility, and more open and fair trade.
The DAC’s overarching objective for 20112015 is to promote development cooperation and other policies so as to contribute to sustainable development, including propoor economic growth, poverty reduction, improvement of living standards in developing countries, and to a future in which no country will depend on aid. It pursues this objective by: i) collecting and analysing data and information on official development assistance (ODA) and other official and private flows; ii) reviewing the development cooperation policies and practices of its members and promoting mutual learning; and iii) providing analysis, guidance and good practice to assist its members to enhance the quality and effectiveness of development assistance.
The DAC currently has 24 members: Australia, Austria, Belgium, Canada, Denmark, Finland, France, Germany, Greece, Ireland, Italy, Japan, Korea, Luxembourg, the Netherlands, New Zealand, Norway, Portugal, Spain, Sweden, Switzerland, the United Kingdom, the United States and the European Union. The World Bank, IMF, UNDP and the regional development banks participate in the DAC as observers. OECD countries that are not members of the DAC are entitled to participate in all meetings of the DAC and its subsidiary bodies in areas of mutual interest. As set out in its Global Relations Strategy, other providers of development cooperation may participate in its work as full participants or as a regular or ad hoc observer.
The DAC welcomes the contribution of China and other providers of development cooperation resources and expertise to the common goal of reducing global poverty and increasing sustainable and inclusive economic growth. The DAC is forging relationships with China and other countries beyond its membership with a view to enriching dialogue and sharing knowledge on development and development cooperation. The DAC believes that development cooperation from the North or the South, from public or private sources would gain from collaboration among all actors, irrespective of their economic status or development tradition. This will serve the interests of poor people in developing countries.
For further information on the DAC and its activities, see: www.oecd.org/dac

123 CHINA IN FOCUS: LESSONS AND CHALLENGES © OECD 2012
CHAPTER 9: ECONOMIC TRANSFORMATION AND POVERTY REDUCTION: HOW IT HAPPENED IN CHINA, HELPING IT HAPPEN IN AFRICA
The remainder of this chapter presents the main fi ndings that the Group’s members distilled
from its events in recent years. Producing such a set of fi ndings is itself an achievement, given the
range of perspectives among members of the Study Group and the complexity and sensitivity of
some issues. The next section describes the process of economic transformation and its relevance
for poverty reduction. The third section provides the elements identifi ed as being key to China’s
success in massively reducing poverty and creating a middleincome country. The fourth section
presents messages relevant for Africa’s economic transformation drawing heavily on the views
expressed by African participants. Finally, the conclusion puts forward a number of lessons for
development cooperation for consideration by China, OECD/DAC members and African counties.
Economic transformation and poverty reduction
Economic transformation can change poor developing countries into prosperous countries,
with a dramatic fall in poverty rates. China stands out as a notable example. The transformation
occurs when a poor, ruralbased country becomes a middleincome country with the growth of
industry and services sectors. Productivity and income per capita as well as job creation grow
fast. Agricultural productivity rises, while labour moves from farms to towns and cities, and there
is a demographic transition as birth rates fall. The economy becomes involved in global supply
chains in ways that generate continuous learningbydoing and upgrading of enterpriselevel
capacities (otherwise known as “dynamic capacity development”). A supportive environment
includes a state that provides vision and coordination. Infrastructure investment and institutional
development are also dynamic elements of economic transformation.
China’s growth and poverty reduction process over the last thirty years
The reform process started gradually with the liberalisation of the agricultural sector
thirty four years ago. Collective farms were closed. Individual farmers were empowered to sell
surplus products to the market which generated a major increase in food supplies and incomes.
Emboldened by this success, many state-owned enterprises were closed and the remainder were
turned into commercial enterprises, with the resource-oriented companies developing worldwide
links. Extensive privatisation created a highly competitive enterprisebased economy with wide-
spread regional and national transport linkages. At the same time, a series of special economic
zones based on strong direct investment from abroad opened the way for a supply chainbased
model of industrial learning, creating numerous industrial clusters and networks. Finally, the
state reduced tariffs significantly when joining the WTO a process that facilitated China’s
engagement in the global economy. The private sector has developed substantially and is now the
dominant source of employment (over 90%) and income (over 70%).
The Chinese authorities sought international aid and investment to supplement national
resources, not as a major ongoing financing stream. They used foreign aid and investment to
acquire knowhow and management skills to speed up the modernisation of Chinese agriculture,
industry and infrastructure. Bilateral and multilateral donors have provided considerable
expertise, knowledge and training, bringing in worldclass analytical methods for public
management and economic development, including poverty reduction.
The state, provincial, and city authorities actively supported enterprise development by providing
infrastructure, often on a costrecovery basis, and by expanding the science and technology base. The
institutional infrastructures for higher education, including management training, were developed
rapidly with students and their families paying a high proportion of total costs. The enterprise sector

124 CHINA IN FOCUS: LESSONS AND CHALLENGES © OECD 2012
CHAPTER 9: ECONOMIC TRANSFORMATION AND POVERTY REDUCTION: HOW IT HAPPENED IN CHINA, HELPING IT HAPPEN IN AFRICA
has flourished with fast learning processes from engagement in international supply chains and
joint ventures with foreign investors. The sector benefitted from major programmes for Chinese
graduate scholarships abroad and schemes to attract back Chinese expatriates and engage eminent
international experts. An integral part of the growth model has been the close and forwardlooking
interaction between state authorities and enterprises.
The immense transformation process over the last 30 years has not been accomplished
without serious economic, social and environmental costs: structural economic imbalances,
a ruralurban divide, land rights issues, stresses linked to internal migration, natural resource
degradation associated with intensive farming and social disparities across China. However,
income inequality has been kept below that in most emerging economies. Poverty in rural
areas has been reduced to just 6% of the rural population when measured at the $1.25 per day
benchmark for incomes. As described below, these challenges are now the focus of attention of
the Chinese authorities.
Dynamic capacity development
China’s experience shows that rapid economic and social development in poor countries
can happen, when strong development–oriented leadership emerges focused on development
performance rather than on entrenched policies and interests. The articulation of a national
project to achieve economic transformation within a generation can activate a new national
consensus. The Group, with strong involvement of African officials and experts, has been
assessing how economic transformation in Africa can happen, against the background of the
Chinese experience, and how collective aid efforts can help in the wider transformation process.
Key elements of China’s experience
The Group identifi ed the following fundamental elements in China’s success in substantially
reducing poverty and creating a middleincome country. These elements are expected to continue
to underlie China’s ongoing efforts to address the challenges that China now faces in its
development, adjustment and social wellbeing.
The role of the state
Making economic transformation the central guiding objective of government, as China has
done since the late 1970s, with its reform and opening up policies:
i) Provided a basis for wide consensus and participation across society in a national project.
ii) Drove pragmatic, evidencebased policy making and close ongoing review of performance.
iii) Made performance in terms of growth and poverty reduction the test for policies and
resource allocation.
iv) Strengthened learning and innovation.
v) Exercised discipline on the effi ciency and effectiveness of both government and enterprises.
vi) Put a high priority on policymaking capacity and investment in research and extension
capacities in universities and institutes, including by linking them to ministries and the
decision and implementation processes.
vii) Encouraged the emergence of a welleducated professional middle class and attracted

125 CHINA IN FOCUS: LESSONS AND CHALLENGES © OECD 2012
CHAPTER 9: ECONOMIC TRANSFORMATION AND POVERTY REDUCTION: HOW IT HAPPENED IN CHINA, HELPING IT HAPPEN IN AFRICA
talented people to return home to work for their country.
Self-reliance and ownership
Selfreliance is a fundamental principle of Chinese strategy. This principle is imbedded deeply
in China’s strong ownership of its own development path while it absorbs knowledge from a
wide range of external actors, including investors and experts, and engaging with bilateral and
multilateral policy processes. More specifi cally:
i) China develops its medium and longterm development strategies in relation to ongoing
changes in the national and global context and uses its FiveYear Plan instrument to
implement those strategies with adjusted policy interventions.
ii) External support, such as foreign investment and aid, is incorporated within these strategies
and policies, rendering this external support more effective.
iii) Policy development and technical capacities have always been central policy concerns,
providing a basis for monitoring and accountability systems at both the central and local
government levels.
Performance based public management and decentralisation
Developmentoriented leadership requires a high quality public management corps for policy
formation and implementation at central and local levels. Several approaches were taken to
support this:
i) Selection procedures for civil service and political office were reformed to require
educational attainment, handson experience and proven individual performance.
ii) The central planning system was replaced by a marketoriented planning system.
iii) Significant decentralisation generated bottomup initiatives that were widely replicated
when successful.
iv) Competition between cities and towns fostered increased growth and poverty reduction.
Policy research capacities and innovation systems
The transformation process includes intensive ongoing policy testing and adaptation
based on evidence. China has created an extensive set of institutional capacities in the
“hard” and “soft” sciences to enable the analysis of performance, problems and solutions. The
“experimentevaluatescale up success” principle is widely applied and rapidly implemented. This
has demanded the expansion of higher education and the development of research institutions
linked to policy decision making and implementation. World expertise has been sought and
attracted through incentive schemes, international partnerships and often via aid programmes.
Feedback mechanisms for identifying and addressing challenges
China’s impressive transformation has generated stresses and imbalances both internally
and externally. These major challenges are identified and addressed in the new FiveYear Plan
which includes policy actions aimed at:
i) Focussing more on the quality of growth and improving the functioning of accountability
126 CHINA IN FOCUS: LESSONS AND CHALLENGES © OECD 2012
CHAPTER 9: ECONOMIC TRANSFORMATION AND POVERTY REDUCTION: HOW IT HAPPENED IN CHINA, HELPING IT HAPPEN IN AFRICA
systems.
ii) Tackling income and regional disparities, including rural/urban income and equity issues.
iii) Raising domestic consumption and reducing reliance on external demand.
iv) Repairing environmental damage, including farmland degradation, and managing
urbanisation.
v) Eliminating extreme poverty through targeted measures for the still large numbers of very
poor people.
Responsible developmentoriented government remains essential in a more diverse and
complex economy and society. With the challenges of becoming a highincome country and an
active part of the global governance system, China’s policy review and adjustment processes,
informed by feedback mechanisms and global change, are more important than ever, both
domestically and internationally.
Applying the lessons of China to Africa
Using China’s success in reducing poverty as a background, the Group identifi ed a range of
messages relevant for Africa’s economic transformation, drawing heavily on the views expressed
by Africans themselves. The key orientations for African states and organisations and their
development partners to share include:
i) Make a green economic transformation within a generation to flourishing middleincome
modern economies with low poverty rates, the key framework for thinking about Africa’s
future.
ii) Support the emergence of responsible developmentoriented states and address risks of
state capture, conflict and breakdown, by ensuring, through transparency and national
and international accountability systems, that income and natural wealth is harnessed for
national projects of economic transformation.
iii) Exploit the opportunities at hand now for agricultural modernisation, both small and large
scale, to generate a widespread growth dynamic with supply chains and economic linkages
that integrates the national and regional economies and joins up with global markets. Small
farmers, men and women, take on the character of entrepreneurs in this modern sector,
generating incomes and helping to correct high malnutrition rates.
iv)Support the development of African regional knowledge platforms and centres of excellence
as a means of speeding up the acquisition of technology in agriculture and in other areas.
v) Think and work in terms of increasing the momentum on regional integration and the
creation of regional and continental economic dynamics and infrastructure.
vi) Adopt the dynamic capacity development approach to enterprise development, starting
with current strengths/advantages, with ongoing adaptation and interaction between the
state and enterprises to promote fast learning and capacity building in both the public and
private sectors.
vii) Take trade, investment and aid as opportunities to speed up learning processes, acquire
technologies and management models and skills that can be adapted to the African context.

127 CHINA IN FOCUS: LESSONS AND CHALLENGES © OECD 2012
CHAPTER 9: ECONOMIC TRANSFORMATION AND POVERTY REDUCTION: HOW IT HAPPENED IN CHINA, HELPING IT HAPPEN IN AFRICA
viii) Support the emergence of a creative middle class through upward mobility and attracting
expatriate talent to return home in the context of the national economic project for
economic transformation, to provide the entrepreneurial skills and the welleducated human
resources needed to manage a more complex, more organised economy that engages in
regional and global markets.
Dynamics of development cooperation in Africa
China’s rapidly evolving role in African development was welcomed at the Group’s events.
China provides new scope and diversity to Africa’s external economic relations and has
transformed the economic outlook for many countries in Africa (Box 9.2)
Box 9.2 Economic transformation in Africa and the role of China and other emerging countries
Relations between Africa and its emerging partners, such as China, need to be understood in the context of the global “shift in wealth”, (African Economic Outlook, 2011). This change in the distribution of incomes in the world economy has accelerated over the past decade. Building on improved policies, the continent has benefi ted from extra investment, trade and aid. The expanded palette of partners African countries are able to play on is also yielding considerable political and strategic advantages. China and others’ high growth has had a signifi cant impact on growth and poverty in other poor countries, including Africa. Its trade and investment have benefited oil- and mineralrich countries disproportionately, but this “growth engine effect” has sustained world demand for goods that poor countries export. The scale of the increase of China’s imports from Africa, especially sub-Saharan Africa, has been exceptional over the past decade (Figure 9.1).
Figure 9.1 Chinese imports from selected groupings of African countries as percentage of those countries’ GDP
Source: Chinese bilateral trade data, CEIC; GDP for country groupings, World Development Indicators and IMF World Economic Outlook database.
128 CHINA IN FOCUS: LESSONS AND CHALLENGES © OECD 2012
CHAPTER 9: ECONOMIC TRANSFORMATION AND POVERTY REDUCTION: HOW IT HAPPENED IN CHINA, HELPING IT HAPPEN IN AFRICA
(Box 9.2 continue)
Africa’s business relations with emerging partners are often complementary to those with traditional partners. Because of their diversity, emerging partners offer African countries new opportunities to exchange goods, technology and development models. They make mass consumption goods affordable to the nascent African middle-class and supply production goods adapted to the productive conditions of developing countries. These goods have the potential to help African firms increase their productivity and move up global value chains. Indeed, while still small as a share of African output, exports of manufactured goods have actually doubled in nominal term over the last ten years.
The co-operation activities of emerging partners are also typically complementary to those of traditional partners. The latter have focused their assistance, mostly through ODA, on poverty reduction, health, education and governance. China and other emerging partners are more focused on removing infrastructural bottlenecks. Fears that the intensifying co-operation with emerging partners is boosting Africa´s indebtedness are not supported by available evidence. However, a risk of re-emergence of over-indebtedness persists, particularly for the weakest African states. Similarly, existing aggregate governance indicators show no sign of a worsening of corruption. Policy autonomy is affected differently for different groups of African countries: the resource-abundant ones stand to widen their policy space more than others.
Source: AfDB, OECD, UNDP and UNECA (2011).
Although in the past, OECD countries have accounted for the major share of trade, investment
and aid fl ows with Africa, Chinese trade and investment and aid policies are now making it a key
driver in African development. The Chinese government’s “Going Out” policy encourages Chinese
enterprises to invest abroad, partly to help diversify China’s large reserves of foreign exchange.
Many Chinese aid projects are being structured on an enterprise basis to generate sustainability.
China, along with OECD and other countries, is investing to expand oil and mineral resource
supplies. There is major scope for China to increase further the scale of its trade, investment and
aid to Africa depending upon the effectiveness and the sustainability of the growth trajectories of
its African partners. It will also involve working with the larger agendas for regional integration
and on achieving and maintaining peace and stability in Africa.
China’s institutions for planning and delivering aid and other offi cial fi nancial resources have
evolved signifi cantly since the mid1990s, with the creation of special fi nancial institutions and
the development of coordination systems among Ministries. The fi nancial institutions are capable
of putting together large packages of fi nancial support for infrastructure.
China has shown readiness to be involved in transformative investment and infrastructure
packages within countries and inter-regionally. It was felt however that China could make a more
signifi cant contribution to African enterprise development by providing more opportunities for
local companies.
There are questions on sustainability and transparency, which are important for the full
ownership and accountability of the developing countries concerned. In order for African
countries to be fully able to drive their relations with development partners, it will be important
for them to have more complete information about levels and conditions of assistance as well as
on the terms of various commercial deals that partners bring to the table.
China and OECD countries share a basic objective: assist African countries to have

129 CHINA IN FOCUS: LESSONS AND CHALLENGES © OECD 2012
CHAPTER 9: ECONOMIC TRANSFORMATION AND POVERTY REDUCTION: HOW IT HAPPENED IN CHINA, HELPING IT HAPPEN IN AFRICA
independent development capacities. Current developments in Chinese and DAC cooperation
policies which promise to improve the coherence and quality of the support for African
development include:
i) The publication by China of two government “White Papers”.
ii) The agreement that the African Union will now be a full member of the Forum on
ChinaAfrica Cooperation (FOCAC).
iii) A public statement by the DAC welcoming the increasing role of emerging countries as
providers of development assistance (OECD Development Assistance Committee, 2011).
iv) Implementation of the agreements reached at the Busan HighLevel Forum on Aid
Effectiveness (see Box 9.3)
Transparency and corporate social responsibilities
African and foreign enterprises have key roles in shaping the future development path
for African countries. A dedicated African platform on corporate social responsibility which
brings together Chinese and African employers, enterprises and experts to address issues
and challenges related to, amongst other subjects, green growth, labour standards and supply
chain management could facilitate co-operation among all development partners and so
contribute actively to the development of African economic governance arrangements in
these areas.
Lessons for development cooperation
China, DAC members and African countries all aim to achieving the United Nations
Millennium Development Goals (MDGs). As is the case of China, international assistance
that is coherent with promoting economic transformation can support and speed up Africa’s
growth and poverty reduction process. Drawing on the experiences shared at its events, the
Group offers a number of lessons for development cooperation.
How China can enhance its contribution to African development
China has devoted much highlevel attention to African development in the past decade,
with regular visits by top leaders. It has created the Forum on ChinaAfrica Cooperation (FOCAC)
and associated processes to define and implement its assistance to Africa. A new ChinaAfrica
Research Centre was set up in 2010. China participates in UN peacekeeping missions in Africa.
It has also created financial institutions and instruments for official development financing.
African countries appreciate the low cost rapidity with which Chinese aid is deployed, especially
in infrastructure and construction, as well as its responsiveness to local requests. As mentioned
previously, China also recently published two signifi cant “White Papers”:
• On trade and economic cooperation with Africa which expressed China’s desire to work with
others to jointly promote peace, development and progress in Africa.
• On foreign aid, which provided an overview of China’s aid efforts and policies over the past
decades and announced a new interministerial coordination system for managing its foreign
aid and plans to increase aid quality and to work and learn with international development
partners in this respect.

130 CHINA IN FOCUS: LESSONS AND CHALLENGES © OECD 2012
CHAPTER 9: ECONOMIC TRANSFORMATION AND POVERTY REDUCTION: HOW IT HAPPENED IN CHINA, HELPING IT HAPPEN IN AFRICA
Box 9.3 The Fourth High Level Forum on Aid Effectiveness
The Fourth High Level Forum on Aid Effectiveness-held in Busan, Korea, at the end of 2011-marked a turning point in international discussions on aid and development. The conference, co- organised by the OECD, delivered a number of important outcomes, the most important of these being the Busan Partnership for Effective Development Co-operation- an international agreement endorsed by all major stakeholder groups, including China and other emerging economies that continue to confront poverty but which are engaging increasingly in co-operation. Some of the key principles, including on ownership, results, transparency and accountability, were agreed as reference points for South-South co-operation on a voluntary basis. A commitment was also made to “examine the interdependence and coherence of all public policies — not just development policies — to enable countries to make full use of the opportunities presented by international investment, trade and to expand their domestic markets.” The following summarises the main achievements:
1.The Busan Partnership for Effective Development Cooperation is the most inclusive agreement on global co-operation for development: donors, South South co-operation partners, developing countries, civil society organizations (CSOs), private sector representatives and others participated in its formulation and lent their support to the fi nal product. This agreement was underpinned by an inclusive and transparent negotiation process, in which China participated actively.
2.Developing countries were at the centre of the deliberations in Busan, as they were in the process leading up to the Forum through the Working Party on Aid Effectiveness. They drove the negotiations on the outcome document: the Busan Partnership for Effective Development Co-operation. And they fuelled — and led — the discussions on the unmet commitments from the Paris Declaration on Aid Effectiveness: 78 countries participated in the 2011 survey, managed by the Working Party on Aid Effectiveness, to monitor the implementation of the Paris Declaration.
3.A number of forward-looking agreements — on results, transparency, fragmentation, fragile states, climate change, South South co-operation, effective institutions and the private sector —which laid the groundwork to enable countries, fi rms and CSOs to begin to implement the Busan commitments immediately.
4.A commitment to work together under a new Global Partnership for Effective Development Co-operation, supported by the OECD and the United Nations Development Programme, to implement the commitments reached at Busan.
A number of voluntary international agreements on core development challenges were agreed at Busan including:
• The New Deal for International Engagement in Fragile States
• The Busan Joint Action Plan on Gender Equality and Development
• The Busan Action Plan for Statistics
• A New Consensus on Effective Institutions and Policies
• A joint Statement on public private co-operation for broad based, inclusive and sustainable growth
131 CHINA IN FOCUS: LESSONS AND CHALLENGES © OECD 2012
CHAPTER 9: ECONOMIC TRANSFORMATION AND POVERTY REDUCTION: HOW IT HAPPENED IN CHINA, HELPING IT HAPPEN IN AFRICA
The Group found that China could contribute further to African development by:
i) Bringing more of its transformational thinking into its policy dialogue with Africa.
ii) Helping to show how the learning model of development can work to build the capacity for
diversifi ed participation in the global economy, including through learning from foreign aid
and investment.
iii) Supporting African Union structures and policy frameworks and working more at the
regional and sub-regional levels, including to develop interregional infrastructure and
knowledge platforms.
iv) Helping African countries to learn from the ways China successfully managed aid and
foreign investment, particularly through integration of aid project management into regular
ministry structures.
v) Being more transparent in its aid programming and the terms of its fi nancing, and assisting
African countries in the assessment of fi nancial sustainability issues.
vi) Helping to implement African and international codes on corruption, resource revenues and
corporate social responsibility.
vii) Strengthening knowledge about African conditions among aid staff working on and in
Africa.
viii) Working on its aid quality agenda and introducing a systematic approach to its aid
management systems, including planning, monitoring and evaluation systems.
How can OECD members can learn from the Chinese efforts to develop Africa
OECD/DAC members provide a wide range of support to African countries, including project,
sector and budget support. Aid to Africa has grown significantly over recent years, though
remaining some distance from the announced target of doubling aid by 2015.
The Group found that OECD/DAC members could contribute further to African development
by:
i) Framing their cooperation in terms of the economic transformation process, going beyond
aid effectiveness to a wider development effectiveness concept applied to Africa.
ii) Doing more to help build science and technology capacities, higher education systems and
knowledge platforms, with the potential for creating regional and continental networks
kept in view, drawing on their experience in these fields with China and other emerging
countries.
iii) Supporting African Union structures and policy frameworks.
iv) Helping to implement African and international codes on corruption, resource revenues and
corporate social responsibility.
v) Maintaining the recent momentum of support for agriculture and infrastructure
development, working in relevant forums with emerging countries with special knowledge
and expertise.
vi) Examining how aid reporting can better capture the technical cooperation activities of
emerging countries in terms their impact, and not just their monetary cost.

132 CHINA IN FOCUS: LESSONS AND CHALLENGES © OECD 2012
CHAPTER 9: ECONOMIC TRANSFORMATION AND POVERTY REDUCTION: HOW IT HAPPENED IN CHINA, HELPING IT HAPPEN IN AFRICA
vii) Reviewing how comparative advantage, cost structures and complementarities may be
shifting among assistance providers as emerging partners build up their aid activities.
viii) Exploring how trade, investment and aid linkages and financing packages can mobilise
additional actors and capital for economic transformation processes in Africa.
What African countries can learn from the Chinese development process
African participants in the Group’s events were determined that their countries should
defi ne their own futures. Progress has been made, but much remains to be done. They stressed
that regional integration is essential to overcome political and economic fragmentation. African
leaders must take up the task of creating a responsible developmentoriented state able to
bring together ethnically complex societies. Leaders need to ensure peace and progress in their
neighbourhoods. In fact, African institutions, policy analysis and review processes have been
getting stronger over the last decade. Policy frameworks and economic management are clearly
improving. New initiatives are helping to address complex and overlapping regional economic
communities and the lack linkages. Agricultural development has become a high priority with
an active, continental agenda. Communication technologies and business models have been
found that work with great success in Africa. However, competitive elites and ethnicities are still
a major problem in a number of countries. The African Union has the diffi cult task of facilitating
solutions to such problems. It has to be recalled, however, that many emerging economies of
today began their success stories from situations of confl ict and turmoil, which transformational
leadership was able to resolve. There are clear examples of this in Africa which can serve as an
inspiration for sustainable political settlements in the remaining troubled parts of the continent.
The Group found that African countries can contribute further to development at home by:
i) Fostering the emergence of a responsible, developmentoriented state with a political
consensus that reaches across competitive elites and ethnicities.
ii) Taking the economic transformation paradigm, working through dynamic capacity
processes as the framework for development strategies, nationally and regionally. Bringing
development partners to think in these terms also, and presenting strategies and operational
programmes and projects in this context.
iii) Pushing ahead with the regional integration agenda and finding creative solutions to the
development of interregional infrastructure.
iv) Reinforcing the priority for agricultural modernisation and its role in creating a broadly
based growth dynamic, nationally and regionally.
v) Leveraging the communications revolution in Africa to exploit its potential for leapfrogging
in knowledge acquisition and enterprise creation and global economic linkages.
vi) Developing further the policy analysis and review capacities and processes now in place in
Africa for pragmatic policy making and performance review. Ensuring that the civil service is
performance oriented.
vii) Creating close interactions between the state and market enterprises in a forwardlooking
performancebased mode and promoting learning and technology acquisition capacities.
viii) Taking inspiration from successful emerging countries, including securing the maximum
benefit from international assistance by strengthening ownership, capacity development
and mutual learning.

133 CHINA IN FOCUS: LESSONS AND CHALLENGES © OECD 2012
CHAPTER 9: ECONOMIC TRANSFORMATION AND POVERTY REDUCTION: HOW IT HAPPENED IN CHINA, HELPING IT HAPPEN IN AFRICA
BIBLIOGRAPHY
AfDB, OECD, UNDP and UNECA (2011), African Economic Outlook – Africa and its Emerging Partners, OECD,
Paris.
ChinaDAC Study Group (2011), Economic Transformation and Poverty Reduction: How it happened in China, helping it happen in
Africa, CFEPH, Beijing.
Dahman-Saidi M. and C. Wolf (2011) “Recalibrating Development Co-operation: How Can African Countries Benefit From Emerging
Partners?” Working Paper No. 302, OECD Development Centre, Paris.
Garroway, C., B. Hacibedel, H. Reisen and E. Turkisch (2010), “The Renminbi and Poor-Country Growth”, Working Paper No.
292, OECD Development Centre, Paris.
Goldstein, A., N. Pinaud, H. Reisen and X. Chen (2006), The Rise of China and India - what’s in it for Africa?, OECD Development
Centre Studies, OECD Development Centre, Paris.
OECD (2007), Promoting Pro-Poor Growth: Policy Guidance for Donors, DAC Guidelines and Reference Series, OECD, Paris.
OECD (2010), Perspectives on Global Development 2010 - Shifting Wealth, OECD Development Centre, Paris.
OECD Development Assistance Committee (2011), Welcoming New Partnerships in International Development Co-operation,
available at www.oecd.org/dac.
Reisen, H. (2008), “From Old-Donor Debt Relief to Emerging Lenders in Africa”, Policy Insights No. 57, OECD Development Centre,
Paris.
Reisen, H. and S. Ndoye (2008), “Prudent versus Imprudent Lending to Africa: From Debt Relief to Emerging Lenders”, Working
Paper No. 268, OECD Development Centre, Paris.

134 CHINA IN FOCUS: LESSONS AND CHALLENGES © OECD 2012
Organisation for Economic Co-operation and Development
The OECD is a unique forum where governments work together to address the economic,
social and environmental challenges of globalisation. The OECD is also at the forefront of efforts
to understand and to help governments respond to new developments and concerns, such as
corporate governance, the information economy and the challenges of an ageing population.
The Organisation provides a setting where governments can compare policy experiences, seek
answers to common problems, identify good practices and work to co-ordinate domestic and
international policies.
The OECD member countries are: Australia, Austria, Belgium, Canada, Chile, theCzech
Republic, Denmark, Estonia, Finland, France, Germany, Greece, Hungary, Iceland, Ireland, Israel,
Italy, Japan, Korea, Luxembourg, Mexico, the Netherlands, New Zealand, Norway, Poland, Portugal,
the Slovak Republic, Slovenia, Spain, Sweden, Switzerland, Turkey, the United Kingdom and the
United States. The European Commission takes part in the work of the OECD.


