Embed Size (px)
Citation preview
Payable Year 2009
April 2010
50-State Property TaxComparison Study

50-State Property Tax Comparison Study, Copyright © April 2010 Lincoln Institute of Land Policy and Minnesota Taxpayers Association This book may not be reproduced in whole or in part without written permission from Lincoln Institute of Land Policy and Minnesota Taxpayers Association For information contact: Lincoln Institute of Land Policy Department of Valuation and Taxation 113 Brattle Street Cambridge, MA 02138 617-661-3016 Minnesota Taxpayers Association 85 East 7th Place, Suite 250 Saint Paul, Minnesota 55101 651-224-7477

iii
Acknowledgements This report would not have been possible without the cooperation and assistance of many individuals. Aaron Twait, MTA Research Director, did most of the research, calculations, and writing. Mark Haveman, MTA Executive Director, assisted with the final editing for publication.
About the Minnesota Taxpayers Association The Minnesota Taxpayers Association did most of the research and analysis for this study in cooperation with other members of the NTC (see below). MTA was founded in 1926 for the purpose of disseminating factual information to educate and inform all Minnesotans about Minnesota tax and spending policies. For over eighty years, the Association has advocated for the adoption of sound fiscal policies through its research efforts, publications, and meetings. The Association is a non-profit, non-partisan group supported by membership dues. For information about membership, call (651) 224-7477, or visit our web site at www.mntax.org.
iv
Table of Contents
I. Executive Summary__________________________________________________________ vii
Introduction ________________________________________________________________ vii
Findings – Property Tax Rankings and Burdens __________________________________ vii
Findings – Subsidization of Homeowners _________________________________________ix
Findings – Regional Competitiveness_____________________________________________xi II. Frequently Asked Questions ___________________________________________________ xv III. Introduction _________________________________________________________________ 1 IV. Findings_____________________________________________________________________ 3
Residential Homestead Property Tax Rankings and Burdens ________________________ 3
Commercial Property Tax Rankings and Burdens _________________________________ 4
Industrial Property Tax Rankings and Burdens ___________________________________ 5
Apartment Property Tax Rankings and Burdens___________________________________ 7
Findings – Subsidization of Homeowners _________________________________________ 8
Findings – Regional Competitiveness____________________________________________ 12 V. Rankings Tables – Urban _____________________________________________________ 15 VI. Rankings Tables – Largest 50 U.S. Cities ________________________________________ 27 VII. Rankings Tables – Rural______________________________________________________ 39 VIII. Appendix: Methodology and Assumptions_______________________________________ 51
Data Collection______________________________________________________________ 51
Selection of Additional Urban Cities ____________________________________________ 51
Selection of Rural Cities ______________________________________________________ 51
Components of the Property Tax Calculation_____________________________________ 51 True Market Value (TMV) _____________________________________________ 52
Sales Ratios (SR) ______________________________________________________ 52
Classification Rates (CR) _______________________________________________ 53
Total Local Tax Rate (TR)______________________________________________ 53
Credits (C) ___________________________________________________________ 53
Property Classes and True Market Values _______________________________________ 54 Real and Personal Property_____________________________________________ 54
Real Property ________________________________________________________ 54
Personal Property – Machinery and Equipment ____________________________ 54
Personal Property – Inventories _________________________________________ 55
Personal Property – Fixtures ____________________________________________ 55
Property Classes and True Market Values _______________________________________ 55
Effective Tax Rates (ETRs)____________________________________________________ 55
Special Property Tax Provisions________________________________________________ 55
What Do Rankings Mean? ____________________________________________________ 55
v
List of Tables
Table 1: Minneapolis and Glencoe Homestead Property Tax Burdens, Rankings, Effective Tax Rates (ETR), and Burdens Compared to Study Averages, Taxes Payable 2009 ............................................................viii
Table 2: Minneapolis and Glencoe Commercial Property Tax Burdens, Rankings, Effective Tax Rates (ETR), and Burdens Compared to Study Averages, Taxes Payable 2009 ..............................................................ix
Table 3: Minneapolis and Glencoe Industrial Property Tax Burdens, Rankings, Effective Tax Rates (ETR), and Burdens Compared to Study Averages, Taxes Payable 2009 ..............................................................ix
Table 4: Minneapolis and Glencoe Apartment Property Tax Burdens, Rankings, Effective Tax Rates (ETR), and Burdens Compared to Study Averages, Taxes Payable 2009 ...............................................................x
Table 5: Property Tax Collections, FY 1998 and FY 2007, for States with Classification Ratios Above and Below 1.050................................................................................................................................................xi
Table 6: Payable 2009 Commercial Property Tax Burdens: Minnesota and Other Upper Midwestern States..xii Table 7: Payable 2009 Industrial Property Tax Burdens: Minnesota and Other Upper Midwestern States ......xii Table 8: Payable 2009 Commercial and Industrial Property Tax Burdens: Minnesota and Other Upper
Midwestern States, $1,000,000 Real Property, 25% Increase in Minnesota Statewide Property Tax......xiii Table 9: Summary of Selected Previous Comparison Studies by Property Type and Year..............................xiv Table 10: Minneapolis Homestead Property Tax Burdens and Rankings, Taxes Payable 2009 .........................3 Table 11: How Minneapolis Homestead Property Taxes Rise with Value, Payable 2009 ..................................3 Table 12: Glencoe Homestead Property Tax Burdens and Rankings, Taxes Payable 2009 ................................4 Table 13: Minneapolis Commercial Property Tax Burdens and Rankings, Taxes Payable 2009........................4 Table 14: Glencoe Commercial Property Tax Burdens and Rankings, Taxes Payable 2009 ..............................5 Table 15: Minneapolis Industrial Tax Burdens and Rankings, Taxes Payable 2009...........................................6 Table 16: Glencoe Industrial Tax Burdens and Rankings, Taxes Payable 2009 .................................................7 Table 17: Minneapolis Apartment Tax Burdens and Rankings, Taxes Payable 2009 .........................................7 Table 18: Glencoe Apartment Tax Burdens and Rankings, Taxes Payable 2009................................................7 Table 19: Commercial-Homestead Classification Ratios for Payable 2009, Urban Cities..................................8 Table 20: Ratio of Apartment Effective Tax Rates (ETRs) to Homestead Rates, Urban Cities, Payable 2009 10 Table 21: Property Tax Collections, FY 1998 and FY 2007, for States with Classification Ratios Above and
Below 1.050...............................................................................................................................................12 Table 22: Property Tax Collections, FY 1998 and FY 2007, for Areas with Classification Ratios Above and
Below 1.050 (Where California’s Assumed Classification Ratio is > 1.050) ...........................................12 Table 23: Payable 2009 Commercial Property Tax Burdens: Minnesota and Other Upper Midwestern States 13 Table 24: Payable 2009 Industrial Property Tax Burdens: Minnesota and Other Upper Midwestern States ....13 Table 25: Payable 2009 Commercial and Industrial Property Tax Burdens: Minnesota and Other Upper
Midwestern States, $1,000,000 Real Property, 25% Increase in Minnesota Statewide Property Tax.......14 Table 26: Urban Homestead Property Taxes .....................................................................................................15 Table 27: Urban Homestead Property Taxes for a Median-Value Home – Listed by Net Tax Payable 2009...16 Table 28: Urban Commercial Property Taxes ...................................................................................................17 Table 29: Urban Industrial Property Taxes (50% Personal Property) ...............................................................19 Table 30: Urban Industrial Property Taxes (60% Personal Property) ...............................................................21 Table 31: Urban Industrial Property Taxes (State-Specific Personal Property Shares/Values).........................23 Table 32: Urban Apartment Property Taxes ......................................................................................................26 Table 33: Top 50 Homestead Property Taxes....................................................................................................27 Table 34: Top 50 Homestead Property Taxes for a Median-Value Home – Listed by Net Tax Payable 2009 .28 Table 35: Top 50 Commercial Property Taxes..................................................................................................29 Table 36: Top 50 Industrial Property Taxes (50% Personal Property) ...............................................................31 Table 37: Top 50 Industrial Property Taxes (60% Personal Property) ..............................................................33 Table 38: Top 50 Industrial Property Taxes (State-Specific Personal Property Shares/Values) .......................35 Table 39: Top 50 Apartment Property Taxes.....................................................................................................38 Table 40: Rural Homestead Property Taxes ......................................................................................................39 Table 41: Rural Commercial Property Taxes ....................................................................................................41
vi
Table 42: Rural Industrial Property Taxes (50% Personal Property).................................................................43 Table 43: Rural Industrial Property Taxes (60% Personal Property).................................................................45 Table 44: Rural Industrial Property Taxes (State-Specific Personal Property Shares/Values)..........................47 Table 45: Rural Apartment Property Taxes .......................................................................................................50
List of Figures
Figure 1: Various Ratios of Urban Commercial-to-Median Homestead ETRs, 1998 – 2009 .............................xi Figure 2: Commercial-Homestead Classification Ratio, Minnesota Local-Only and Total and All State
Average, 1998 – 2009..................................................................................................................................9 Figure 3: Apartment-Homestead Classification Ratio, Minnesota Local-Only and Total and All State Average,
1998 – 2009 ...............................................................................................................................................11
Minnesota Taxpayers Association 50-State Property Tax Study 2009
vii
I. Executive Summary
Introduction
This is MTA’s tenth national property tax comparison study. Some valuation assumptions have been dropped and others added over the course of time, so not all property types or values can be compared through the entire series. Data for property tax calculations was collected through various government websites or by using a contact-verification approach in which we asked state and local experts to provide information.
This study assumes that the “true market value” of each of several parcels of property is the same in all 124 locations studied. Because the "assessed value" of property varies from state to state, our tax calculations account for the effects of local assessment practices, as well as statutory tax provisions. Each hypothetical property includes assumptions about personal property and real property. Effective property tax rates (ETRs) – that is, total tax divided by total value – are presented in rank order.
We include three sets of examples for industrial (manufacturing) properties, which reflect three different assumptions regarding personal property1: personal property comprises 50% of the total parcel value; personal property comprises 60% of the total parcel value; and total personal property varies among states based on different industrial profiles. Our Frequently Asked Questions section has much more on this topic.
This study is most useful when used in connection with other information about state and local tax structures. Some locations have relatively high property taxes because their local governments are more “own-source” revenue dependent. Other states have higher income and sales taxes in part to finance a greater share of the cost of local government. Likewise, the property tax on a selected class of property may be relatively high or low due to policies designed to redistribute the property tax burdens across the classes of property through exemptions, differential assessment rates, or other classification schemes.
Readers of this study often have questions about our use of the “sales ratio” statistic – the comparison of actual sales prices to assessed values. Since this statistic can significantly impact year-to-year changes in property tax burdens and rankings, we encourage readers to turn to page 52 to better understand how this statistic works, why we include it in our calculations, and what implications it can have for our results.
Minnesota’s property tax system is complex and changes in tax burdens are a function of many moving parts. Readers of this study are also strongly encouraged to familiarize themselves with the design and structure of the Minnesota property tax system to assist in understanding and interpreting findings. Our primer Understanding Your Property Taxes can be found on the MTA website at http://mntax.org/cpfr/uypt.php.
Findings – Property Tax Rankings and Burdens
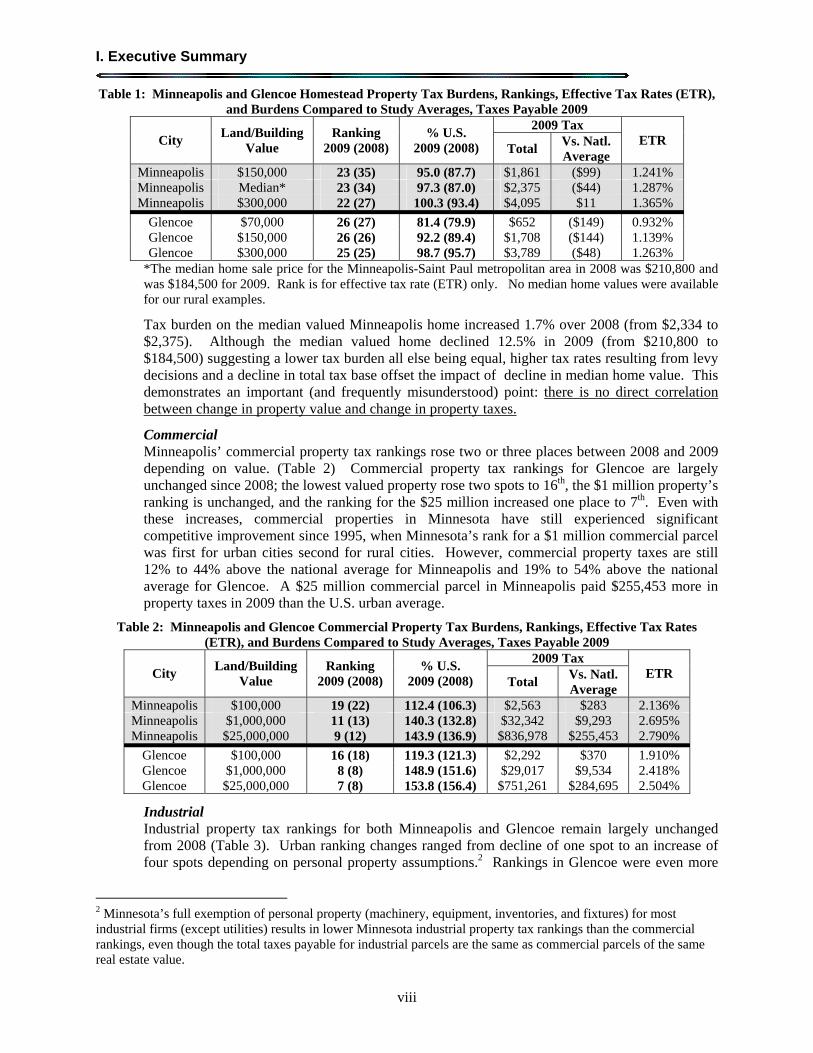
Homesteads Minneapolis’ homestead rankings rose substantially for payable 2009, with both the total burden and the effective tax rate rising in all three examples. Glencoe’s rural homestead rankings are mostly unchanged from 2008 – only the $70,000-valued home changed rank, moving up one spot from 27th to 26th. Property tax burdens as a share of the national average increased in both Glencoe and Minneapolis, indicating that residential property taxes rose more rapidly than did taxes overall for this set of cities. However, property taxes are still average to below-average in Minneapolis and Glencoe than in other areas of the U.S (Table 1).
1 Machinery and equipment, inventories, and fixtures.
I. Executive Summary
viii
Table 1: Minneapolis and Glencoe Homestead Property Tax Burdens, Rankings, Effective Tax Rates (ETR), and Burdens Compared to Study Averages, Taxes Payable 2009
2009 Tax City
Land/Building Value
Ranking 2009 (2008)
% U.S. 2009 (2008) Total
Vs. Natl. Average
ETR
Minneapolis $150,000 23 (35) 95.0 (87.7) $1,861 ($99) 1.241% Minneapolis Median* 23 (34) 97.3 (87.0) $2,375 ($44) 1.287% Minneapolis $300,000 22 (27) 100.3 (93.4) $4,095 $11 1.365%
Glencoe $70,000 26 (27) 81.4 (79.9) $652 ($149) 0.932% Glencoe $150,000 26 (26) 92.2 (89.4) $1,708 ($144) 1.139% Glencoe $300,000 25 (25) 98.7 (95.7) $3,789 ($48) 1.263%
*The median home sale price for the Minneapolis-Saint Paul metropolitan area in 2008 was $210,800 and was $184,500 for 2009. Rank is for effective tax rate (ETR) only. No median home values were available for our rural examples.
Tax burden on the median valued Minneapolis home increased 1.7% over 2008 (from $2,334 to $2,375). Although the median valued home declined 12.5% in 2009 (from $210,800 to $184,500) suggesting a lower tax burden all else being equal, higher tax rates resulting from levy decisions and a decline in total tax base offset the impact of decline in median home value. This demonstrates an important (and frequently misunderstood) point: there is no direct correlation between change in property value and change in property taxes.
Commercial Minneapolis’ commercial property tax rankings rose two or three places between 2008 and 2009 depending on value. (Table 2) Commercial property tax rankings for Glencoe are largely unchanged since 2008; the lowest valued property rose two spots to 16th, the $1 million property’s ranking is unchanged, and the ranking for the $25 million increased one place to 7th. Even with these increases, commercial properties in Minnesota have still experienced significant competitive improvement since 1995, when Minnesota’s rank for a $1 million commercial parcel was first for urban cities second for rural cities. However, commercial property taxes are still 12% to 44% above the national average for Minneapolis and 19% to 54% above the national average for Glencoe. A $25 million commercial parcel in Minneapolis paid $255,453 more in property taxes in 2009 than the U.S. urban average.
Table 2: Minneapolis and Glencoe Commercial Property Tax Burdens, Rankings, Effective Tax Rates (ETR), and Burdens Compared to Study Averages, Taxes Payable 2009
2009 Tax City
Land/Building Value
Ranking 2009 (2008)
% U.S. 2009 (2008) Total
Vs. Natl. Average
ETR
Minneapolis $100,000 19 (22) 112.4 (106.3) $2,563 $283 2.136% Minneapolis $1,000,000 11 (13) 140.3 (132.8) $32,342 $9,293 2.695% Minneapolis $25,000,000 9 (12) 143.9 (136.9) $836,978 $255,453 2.790%
Glencoe $100,000 16 (18) 119.3 (121.3) $2,292 $370 1.910% Glencoe $1,000,000 8 (8) 148.9 (151.6) $29,017 $9,534 2.418% Glencoe $25,000,000 7 (8) 153.8 (156.4) $751,261 $284,695 2.504%
Industrial Industrial property tax rankings for both Minneapolis and Glencoe remain largely unchanged from 2008 (Table 3). Urban ranking changes ranged from decline of one spot to an increase of four spots depending on personal property assumptions.2 Rankings in Glencoe were even more
2 Minnesota’s full exemption of personal property (machinery, equipment, inventories, and fixtures) for most industrial firms (except utilities) results in lower Minnesota industrial property tax rankings than the commercial rankings, even though the total taxes payable for industrial parcels are the same as commercial parcels of the same real estate value.
Minnesota Taxpayers Association 50-State Property Tax Study 2009
ix
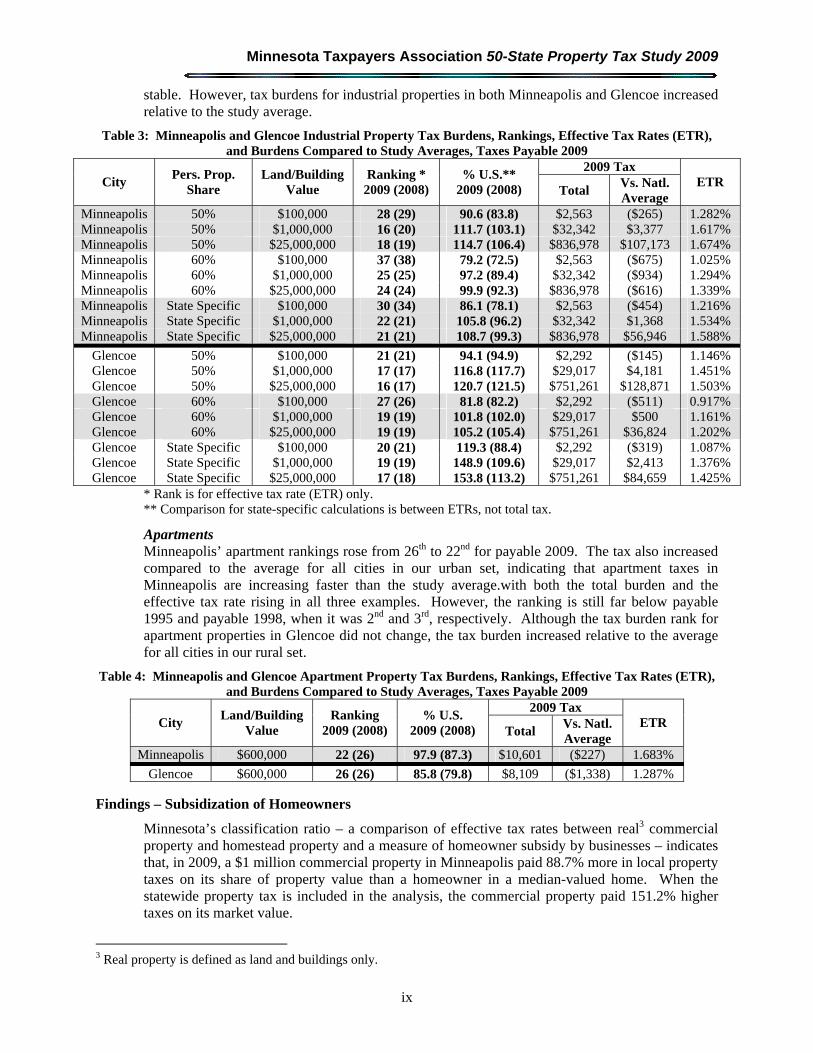
stable. However, tax burdens for industrial properties in both Minneapolis and Glencoe increased relative to the study average.
Table 3: Minneapolis and Glencoe Industrial Property Tax Burdens, Rankings, Effective Tax Rates (ETR), and Burdens Compared to Study Averages, Taxes Payable 2009
2009 Tax City
Pers. Prop. Share
Land/Building Value
Ranking * 2009 (2008)
% U.S.** 2009 (2008) Total
Vs. Natl. Average
ETR
Minneapolis 50% $100,000 28 (29) 90.6 (83.8) $2,563 ($265) 1.282% Minneapolis 50% $1,000,000 16 (20) 111.7 (103.1) $32,342 $3,377 1.617% Minneapolis 50% $25,000,000 18 (19) 114.7 (106.4) $836,978 $107,173 1.674% Minneapolis 60% $100,000 37 (38) 79.2 (72.5) $2,563 ($675) 1.025% Minneapolis 60% $1,000,000 25 (25) 97.2 (89.4) $32,342 ($934) 1.294% Minneapolis 60% $25,000,000 24 (24) 99.9 (92.3) $836,978 ($616) 1.339% Minneapolis State Specific $100,000 30 (34) 86.1 (78.1) $2,563 ($454) 1.216% Minneapolis State Specific $1,000,000 22 (21) 105.8 (96.2) $32,342 $1,368 1.534% Minneapolis State Specific $25,000,000 21 (21) 108.7 (99.3) $836,978 $56,946 1.588%
Glencoe 50% $100,000 21 (21) 94.1 (94.9) $2,292 ($145) 1.146% Glencoe 50% $1,000,000 17 (17) 116.8 (117.7) $29,017 $4,181 1.451% Glencoe 50% $25,000,000 16 (17) 120.7 (121.5) $751,261 $128,871 1.503% Glencoe 60% $100,000 27 (26) 81.8 (82.2) $2,292 ($511) 0.917% Glencoe 60% $1,000,000 19 (19) 101.8 (102.0) $29,017 $500 1.161% Glencoe 60% $25,000,000 19 (19) 105.2 (105.4) $751,261 $36,824 1.202% Glencoe State Specific $100,000 20 (21) 119.3 (88.4) $2,292 ($319) 1.087% Glencoe State Specific $1,000,000 19 (19) 148.9 (109.6) $29,017 $2,413 1.376% Glencoe State Specific $25,000,000 17 (18) 153.8 (113.2) $751,261 $84,659 1.425%
* Rank is for effective tax rate (ETR) only. ** Comparison for state-specific calculations is between ETRs, not total tax.
Apartments Minneapolis’ apartment rankings rose from 26th to 22nd for payable 2009. The tax also increased compared to the average for all cities in our urban set, indicating that apartment taxes in Minneapolis are increasing faster than the study average.with both the total burden and the effective tax rate rising in all three examples. However, the ranking is still far below payable 1995 and payable 1998, when it was 2nd and 3rd, respectively. Although the tax burden rank for apartment properties in Glencoe did not change, the tax burden increased relative to the average for all cities in our rural set.
Table 4: Minneapolis and Glencoe Apartment Property Tax Burdens, Rankings, Effective Tax Rates (ETR), and Burdens Compared to Study Averages, Taxes Payable 2009
2009 Tax City
Land/Building Value
Ranking 2009 (2008)
% U.S. 2009 (2008) Total
Vs. Natl. Average
ETR
Minneapolis $600,000 22 (26) 97.9 (87.3) $10,601 ($227) 1.683%
Glencoe $600,000 26 (26) 85.8 (79.8) $8,109 ($1,338) 1.287%
Findings – Subsidization of Homeowners
Minnesota’s classification ratio – a comparison of effective tax rates between real3 commercial property and homestead property and a measure of homeowner subsidy by businesses – indicates that, in 2009, a $1 million commercial property in Minneapolis paid 88.7% more in local property taxes on its share of property value than a homeowner in a median-valued home. When the statewide property tax is included in the analysis, the commercial property paid 151.2% higher taxes on its market value.
3 Real property is defined as land and buildings only.
I. Executive Summary
x
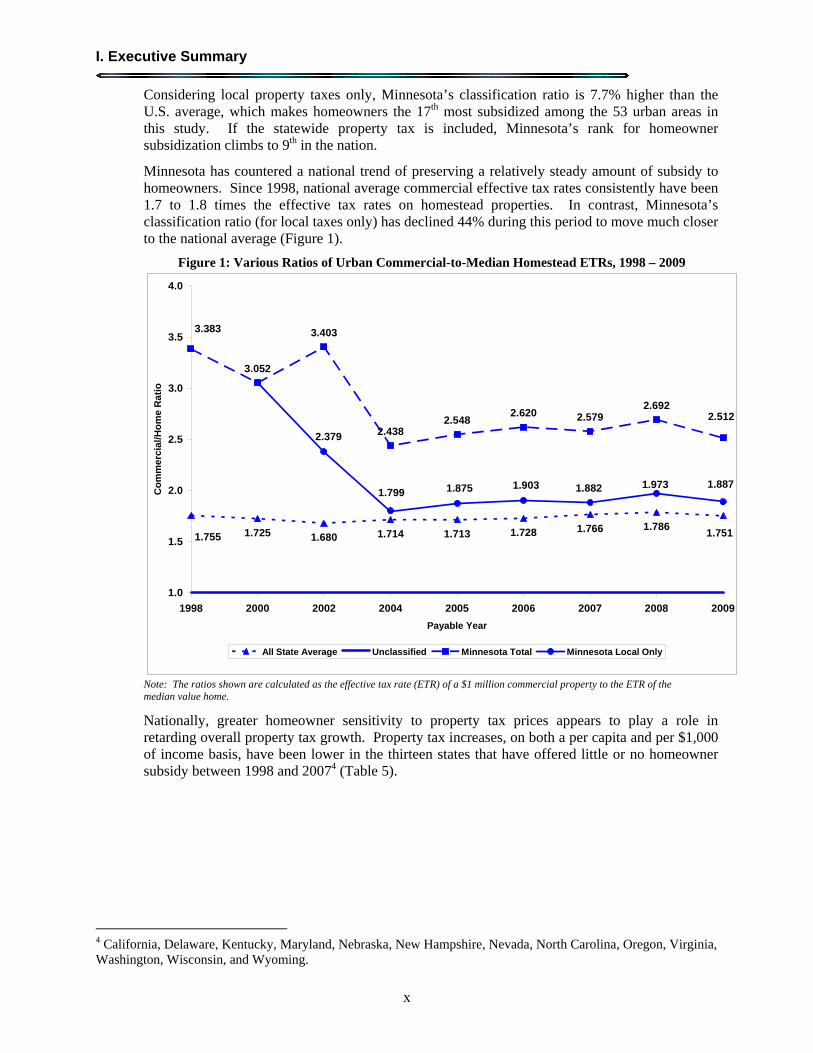
Considering local property taxes only, Minnesota’s classification ratio is 7.7% higher than the U.S. average, which makes homeowners the 17th most subsidized among the 53 urban areas in this study. If the statewide property tax is included, Minnesota’s rank for homeowner subsidization climbs to 9th in the nation.
Minnesota has countered a national trend of preserving a relatively steady amount of subsidy to homeowners. Since 1998, national average commercial effective tax rates consistently have been 1.7 to 1.8 times the effective tax rates on homestead properties. In contrast, Minnesota’s classification ratio (for local taxes only) has declined 44% during this period to move much closer to the national average (Figure 1).
Figure 1: Various Ratios of Urban Commercial-to-Median Homestead ETRs, 1998 – 2009
1.725 1.680 1.713 1.728 1.766 1.786
3.052
3.403
2.4382.548
2.620 2.5792.692
1.7511.7141.755
2.512
3.383
1.8871.9731.882
2.379
1.799 1.875 1.903
1.0
1.5
2.0
2.5
3.0
3.5
4.0
1998 2000 2002 2004 2005 2006 2007 2008 2009
Payable Year
Co
mm
erc
ial/
Ho
me
Ra
tio
All State Average Unclassified Minnesota Total Minnesota Local Only
Note: The ratios shown are calculated as the effective tax rate (ETR) of a $1 million commercial property to the ETR of the median value home.
Nationally, greater homeowner sensitivity to property tax prices appears to play a role in retarding overall property tax growth. Property tax increases, on both a per capita and per $1,000 of income basis, have been lower in the thirteen states that have offered little or no homeowner subsidy between 1998 and 20074 (Table 5).
4 California, Delaware, Kentucky, Maryland, Nebraska, New Hampshire, Nevada, North Carolina, Oregon, Virginia, Washington, Wisconsin, and Wyoming.

Minnesota Taxpayers Association 50-State Property Tax Study 2009
xi
Table 5: Property Tax Collections, FY 1998 and FY 2007, for States with Classification Ratios Above and Below 1.050
Classification Ratio < 1.050 (n = 13) Classification Ratio > 1.050 (n = 40) Fiscal Year Prop Tax
Per Capita Prop Tax per
$1,000 of Income Prop Tax
Per Capita Prop Tax per
$1,000 of Income FY 1998 $773.25 $29.94 $882.12 $34.52 FY 2007 $1120.26 $30.26 $1312.70 $36.84 Pct Chg 45.9% 1.1% 48.8% 6.7%
Property tax and population data from Department of the Census; income data from Bureau of Economic Analysis. Calculations by MTA.
Findings – Regional Competitiveness
Commercial Minnesota’s commercial property tax competitiveness within the upper Midwest varies depending on property value and location. Higher value commercial properties are at the greatest disadvantage – a trend which has existed for many years. Minnesota’s commercial tax burden ranges from 11.8% below the regional average for the $100,000 urban property to 12.8% above the regional average for the $25 million urban property; and from 15.8% below the regional average for the $100,000 rural property to 6.3% above the regional average for the $25 million rural property. Minnesota is at the greatest disadvantage with South Dakota: the tax burden is 75% to 129% higher in Minneapolis than in Sioux Falls on properties of equal value; and the tax burden is 16% to 52% higher in Glencoe than in Sisseton on properties of equal value (Table 6).
Table 6: Payable 2009 Commercial Property Tax Burdens: Minnesota and Other Upper Midwestern States Commercial Properties
VALUE: $100,000 $1 Million $25 Million States Urban Rural Urban Rural Urban Rural
Minnesota $2,563 $2,292 $32,342 $29,017 $836,978 $751,261Illinois – Chicago5 2,436 -- 24,358 -- 608,943 -- Illinois – Remainder 2,891 2,481 28,910 24,812 722,758 620,300Iowa 4,350 4,075 43,505 40,745 1,087,622 1,018,635Michigan 4,833 3,449 48,333 34,490 1,208,315 862,258North Dakota 2,027 2,346 20,270 23,430 506,751 586,493South Dakota 1,462 1,981 14,620 19,805 365,500 495,125Wisconsin 2,683 2,420 27,173 24,480 680,227 612,746Upper Midwest Avg. $2,906 $2,721 $29,939 $28,116 $752,137 $706,688
Industrial Minnesota’s regional industrial property tax competitiveness also varies depending on property value and location, with higher value properties again at the greatest disadvantage. Minnesota’s industrial tax burden ranges from 19.6% below the regional average for the $100,000 urban property to 1.7% above the regional average for the $25 million urban property; and from 20.0% below the regional average for the $100,000 rural property to 1.1% above the regional average for the $25 million rural property. As with commercial properties, industrial properties in rural Minnesota are also at the greatest disadvantage with South Dakota: the tax burden is 75% to 129% higher in Minneapolis than in Sioux Falls on properties of equal value; and the tax burden is 16% to 52% higher in Glencoe than in Sisseton on properties of equal value (Table 7).
5 In most cases, property tax structures are uniform across states. However, the property tax structure is significantly different in Cook County (Chicago) and in New York City than in the remainder of Illinois and New York. We include the second-largest cities in those states (Buffalo and Aurora) to represent the property tax structure in the remainder of those states. In essence, our urban analysis is a comparison of 53 different property tax structures, not 50 states and D.C. with over-representation in two states.
I. Executive Summary
xii
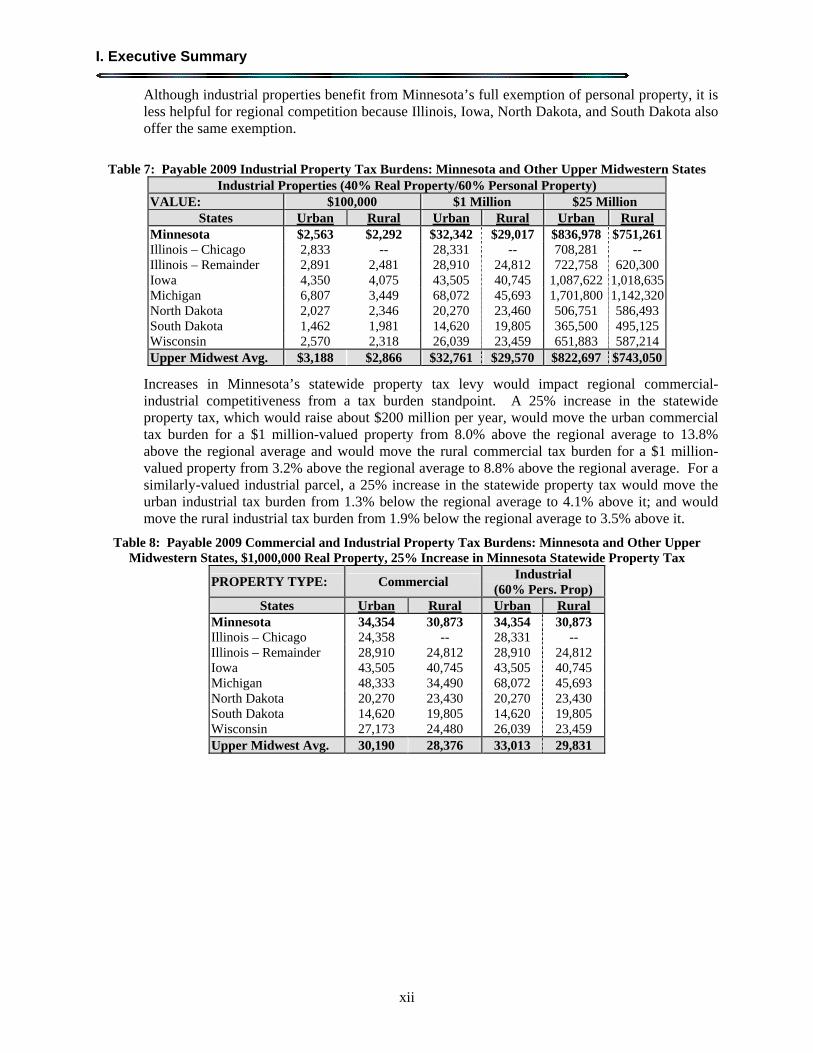
Although industrial properties benefit from Minnesota’s full exemption of personal property, it is less helpful for regional competition because Illinois, Iowa, North Dakota, and South Dakota also offer the same exemption.
Table 7: Payable 2009 Industrial Property Tax Burdens: Minnesota and Other Upper Midwestern States Industrial Properties (40% Real Property/60% Personal Property)
VALUE: $100,000 $1 Million $25 Million States Urban Rural Urban Rural Urban Rural
Minnesota $2,563 $2,292 $32,342 $29,017 $836,978 $751,261Illinois – Chicago 2,833 -- 28,331 -- 708,281 -- Illinois – Remainder 2,891 2,481 28,910 24,812 722,758 620,300Iowa 4,350 4,075 43,505 40,745 1,087,622 1,018,635Michigan 6,807 3,449 68,072 45,693 1,701,800 1,142,320North Dakota 2,027 2,346 20,270 23,460 506,751 586,493South Dakota 1,462 1,981 14,620 19,805 365,500 495,125Wisconsin 2,570 2,318 26,039 23,459 651,883 587,214Upper Midwest Avg. $3,188 $2,866 $32,761 $29,570 $822,697 $743,050
Increases in Minnesota’s statewide property tax levy would impact regional commercial-industrial competitiveness from a tax burden standpoint. A 25% increase in the statewide property tax, which would raise about $200 million per year, would move the urban commercial tax burden for a $1 million-valued property from 8.0% above the regional average to 13.8% above the regional average and would move the rural commercial tax burden for a $1 million-valued property from 3.2% above the regional average to 8.8% above the regional average. For a similarly-valued industrial parcel, a 25% increase in the statewide property tax would move the urban industrial tax burden from 1.3% below the regional average to 4.1% above it; and would move the rural industrial tax burden from 1.9% below the regional average to 3.5% above it.
Table 8: Payable 2009 Commercial and Industrial Property Tax Burdens: Minnesota and Other Upper Midwestern States, $1,000,000 Real Property, 25% Increase in Minnesota Statewide Property Tax
PROPERTY TYPE: Commercial Industrial
(60% Pers. Prop) States Urban Rural Urban Rural
Minnesota 34,354 30,873 34,354 30,873 Illinois – Chicago 24,358 -- 28,331 -- Illinois – Remainder 28,910 24,812 28,910 24,812 Iowa 43,505 40,745 43,505 40,745 Michigan 48,333 34,490 68,072 45,693 North Dakota 20,270 23,430 20,270 23,430 South Dakota 14,620 19,805 14,620 19,805 Wisconsin 27,173 24,480 26,039 23,459 Upper Midwest Avg. 30,190 28,376 33,013 29,831
Minnesota Taxpayers Association 50-State Property Tax Study 2009
xiii
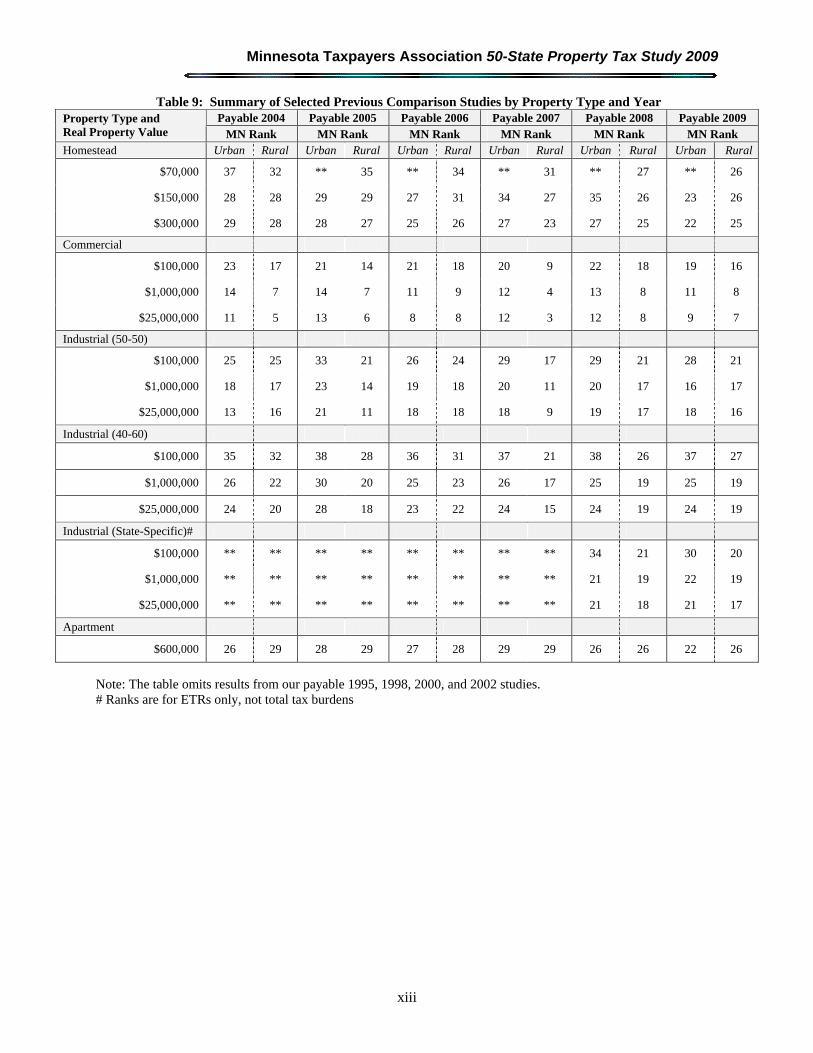
Table 9: Summary of Selected Previous Comparison Studies by Property Type and Year Payable 2004 Payable 2005 Payable 2006 Payable 2007 Payable 2008 Payable 2009 Property Type and
Real Property Value MN Rank MN Rank MN Rank MN Rank MN Rank MN Rank Homestead Urban Rural Urban Rural Urban Rural Urban Rural Urban Rural Urban Rural
$70,000 37 32 ** 35 ** 34 ** 31 ** 27 ** 26
$150,000 28 28 29 29 27 31 34 27 35 26 23 26
$300,000 29 28 28 27 25 26 27 23 27 25 22 25
Commercial
$100,000 23 17 21 14 21 18 20 9 22 18 19 16
$1,000,000 14 7 14 7 11 9 12 4 13 8 11 8
$25,000,000 11 5 13 6 8 8 12 3 12 8 9 7
Industrial (50-50)
$100,000 25 25 33 21 26 24 29 17 29 21 28 21
$1,000,000 18 17 23 14 19 18 20 11 20 17 16 17
$25,000,000 13 16 21 11 18 18 18 9 19 17 18 16
Industrial (40-60)
$100,000 35 32 38 28 36 31 37 21 38 26 37 27
$1,000,000 26 22 30 20 25 23 26 17 25 19 25 19
$25,000,000 24 20 28 18 23 22 24 15 24 19 24 19
Industrial (State-Specific)#
$100,000 ** ** ** ** ** ** ** ** 34 21 30 20
$1,000,000 ** ** ** ** ** ** ** ** 21 19 22 19
$25,000,000 ** ** ** ** ** ** ** ** 21 18 21 17
Apartment
$600,000 26 29 28 29 27 28 29 29 26 26 22 26
Note: The table omits results from our payable 1995, 1998, 2000, and 2002 studies. # Ranks are for ETRs only, not total tax burdens

I. Executive Summary
xiv
This Page Intentionally Blank
Minnesota Taxpayers Association 50-State Property Tax Study 2009
xv
II. Frequently Asked Questions
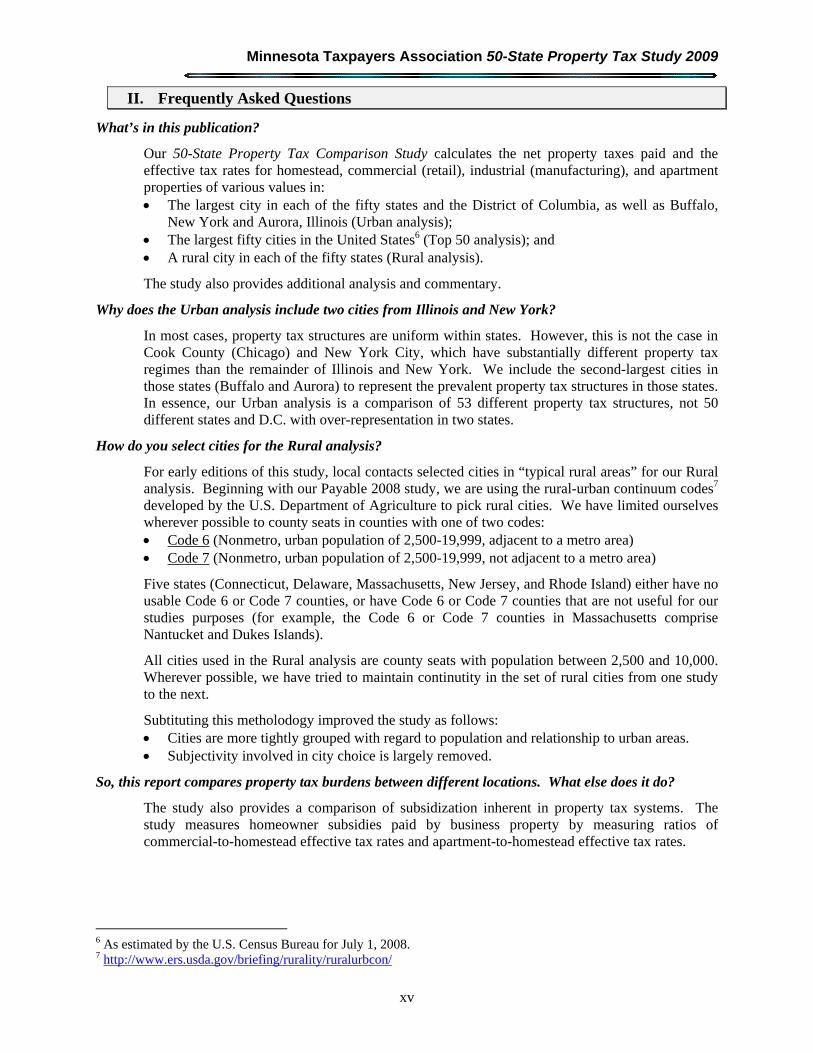
What’s in this publication?
Our 50-State Property Tax Comparison Study calculates the net property taxes paid and the effective tax rates for homestead, commercial (retail), industrial (manufacturing), and apartment properties of various values in: The largest city in each of the fifty states and the District of Columbia, as well as Buffalo,
New York and Aurora, Illinois (Urban analysis); The largest fifty cities in the United States6 (Top 50 analysis); and A rural city in each of the fifty states (Rural analysis).
The study also provides additional analysis and commentary.
Why does the Urban analysis include two cities from Illinois and New York?
In most cases, property tax structures are uniform within states. However, this is not the case in Cook County (Chicago) and New York City, which have substantially different property tax regimes than the remainder of Illinois and New York. We include the second-largest cities in those states (Buffalo and Aurora) to represent the prevalent property tax structures in those states. In essence, our Urban analysis is a comparison of 53 different property tax structures, not 50 different states and D.C. with over-representation in two states.
How do you select cities for the Rural analysis?
For early editions of this study, local contacts selected cities in “typical rural areas” for our Rural analysis. Beginning with our Payable 2008 study, we are using the rural-urban continuum codes7 developed by the U.S. Department of Agriculture to pick rural cities. We have limited ourselves wherever possible to county seats in counties with one of two codes: Code 6 (Nonmetro, urban population of 2,500-19,999, adjacent to a metro area) Code 7 (Nonmetro, urban population of 2,500-19,999, not adjacent to a metro area)
Five states (Connecticut, Delaware, Massachusetts, New Jersey, and Rhode Island) either have no usable Code 6 or Code 7 counties, or have Code 6 or Code 7 counties that are not useful for our studies purposes (for example, the Code 6 or Code 7 counties in Massachusetts comprise Nantucket and Dukes Islands).
All cities used in the Rural analysis are county seats with population between 2,500 and 10,000. Wherever possible, we have tried to maintain continutity in the set of rural cities from one study to the next.
Subtituting this metholodogy improved the study as follows: Cities are more tightly grouped with regard to population and relationship to urban areas. Subjectivity involved in city choice is largely removed.
So, this report compares property tax burdens between different locations. What else does it do?
The study also provides a comparison of subsidization inherent in property tax systems. The study measures homeowner subsidies paid by business property by measuring ratios of commercial-to-homestead effective tax rates and apartment-to-homestead effective tax rates.
6 As estimated by the U.S. Census Bureau for July 1, 2008. 7 http://www.ers.usda.gov/briefing/rurality/ruralurbcon/
II. Frequently Asked Questions
xvi
What are the study’s limitations?
It’s important to recognize that property taxes are just one piece of the total state and local tax system. Some states have higher property tax levies because their local governments are more dependent on “own-source” revenues. Certain states place more responsibility for public service delivery with local government or which often translates into relatively higher property tax burdens. In other cases, the property tax on a selected class of property may be relatively high or low because of policies designed to redistribute property tax burdens between classes through exemptions, differential assessment rates, or other classification schemes. As a result, the study is most useful when used in connection with other information about state and local tax structures.
Making year-to-year comparisons of effective tax rates or net taxes paid is also problematic. If the study attempted to track the effective tax burden on an actual parcel over time, we would need to adjust property values annually based on changes in local real estate markets. Since we hold one piece of the property tax calculation (the value) constant over time but let another piece (the rate) vary from year to year, we prevent useful time-trend analysis of effective tax rates and net taxes paid. Consider that the average tax on a $100,000-valued urban commercial property in this study is $2,280, 15.6% lower than the average tax on a $100,000 urban commercial property in our payable 1995 study ($2,701). It does not stand to reason that the owner of a commercial property worth $100,000 in payable 1995 is paying 15.6% less in taxes on the same piece of property in 2009.
Year-to-year comparisons are most useful for: Rankings, Effective tax rates and net taxes paid for median-valued homesteads, since those values do
change with each study; and, The commercial-to-homestead and apartment-to-homestead ratios.
Other limitations involve property tax relief programs. In practice, residential property tax burdens are often influenced by policies that either limit year-to-year growth in assessments or taxes through a cap or a freeze mechanism, or else provide a refund, rebate, or credit. Two types of property tax relief programs excluded from our analysis: Policies freezing or capping increases in home value or residential taxes provide relief are
largely based on the length of homeowner tenure. To accurately measure the effect of the relief on an average basis, we would need various data on ownership tenure and/or the average home value exempt under the relief. Since this data is not universally available, we are not able to analyze this type of relief. Thus, our residential rankings assume a brand new homeowner who has purchased a home at the indicated value.
Many property tax relief programs are income-sensitive. This study does not incorporate those relief programs; however, this is an area we are investigating for possible future inclusion.
This study does includes relief programs that are broadly applicable (i.e. those not aimed at certain classes of homeowners, such as the elderly), where the value of the relief is not based on homeowner tenure or income.
How do you compute the net tax on a property?
We use the following calculation to calculate the net property taxes on our hypothetical properties:
Net Property Tax = ((TMV x SR) - EX) x CR x TR - C
True Market Value (TMV) is the value a parcel of property would fetch in an arms-length transaction between willing buyers and sellers. For some locations, the assumed true market value may not be typical (a $150,000 home in Boston, for example). However, having constant
Minnesota Taxpayers Association 50-State Property Tax Study 2009
xvii
market values from location to location allows us to observe the isolated effects of tax structures – effectively comparing property taxes, not local real estate markets.
Sales Ratio (SR) data measures the effects of assessment practices on relative tax burdens. This is a unique aspect of our study. Most simply, sales ratios measure the accuracy of assessments. The sales ratio figure is determined by comparing assessments to actual sales. Ideally, that figure will be close to 100%. There are three main reasons why assessed values differ from actual sales: Changes in the real estate market since the assessment date change the value of the property, Some sort of assessment error or bias has been introduced; or, Assessors are by law prevented from assessing a property at its full market value.
We adjust the assumed true market values for each of the sample properties in our study based on the sales ratio data provided for each location. Since our fixed reference point for all calculations is an assumed true market value, it is important to adjust for the fact that a $150,000 residential homestead may be “on the books” at $155,000 in one location, and $140,000 in another; and that the actual tax on the property will be based on these estimates of market value. Applying the sales ratio allows us to treat properties consistently, regardless of assessment differences between locations.
Certain states or localities will Exempt (EX) a certain portion of a property’s value from taxation. Generally, these exemptions are for residential property, but some states or localities also provide exemptions for business properties. Since the exemption is applied to the assessed value of a property, we apply it after generating the sales-ratio-adjusted property value.
The Classification Rate (CR) indicates the portion of a property’s total value subject to the property tax, based on the “class” a property is grouped into. For example, the classification rate for homes in Alabama is 10%; so a home with a true market value of $150,000 is valued at $15,000 for tax purposes. Many states that have classification rates have different rates for different classes of properties. This is designed to affect the distribution of property tax levies, by favoring certain classes at the expense of others.
The Total Local Tax Rate is the combination of state and local tax rates for payable 2009 that apply to the largest number of properties in each of our study locations. We defined “payable 2009 property taxes” as those taxes where the lien affixes to the property in 2009, regardless of when the taxes are actually due.
Note that the study does not include special assessments, since they can be thought of as user charges, may not affect a majority of parcels, and are usually not sources of general revenue.
Finally, we subtract Credits or Refunds (C) that are offered to the majority of homeowners. We do not include credits, refunds, or other special provisions offered to senior or disabled homeowners, because they do not make up a majority of homeowners, and so do not represent the typical experience.
Note that the study does not include special assessments, since they can be thought of as user charges, may not affect a majority of parcels, and are usually not sources of general revenue.
How do you determine the property values you use for your sample properties?
This report analyzes two different kinds of property: real property (land and buildings), and personal property (movable property). The study examines commercial and industrial properties with “low”, “medium”, and “high” real property values. Apartment property consists of only one value. Rural homes have “low”, “medium”, and “high” real property values; the “low” valued-home is eliminated for our Urban and Top 50 analyzes as being too unrealistic for most urban areas in the study.
II. Frequently Asked Questions
xviii
Why don’t you look at other types of property, like farms or cabins?
Ideally, this study would include every type of property. However, time and resource constraints limit us to the four types of property already discussed. It would be difficult to set true market values for farms or utility properties, given their complexities. Cabins are problematic because of their limited geographic scope. However, apartment, commercial, industrial, and residential homesteads comprised over 80% of total market value in Minnesota, so we believe that this report covers a wide majority of properties across the nation.
Tell me more about “personal property” – for starters, what is it?
“Personal property” includes those things that businesses own that are not land or buildings (individuals also own personal property, but it is almost always exempt from tax). This study assumes three kinds of personal property: Machinery and Equipment (found in industrial/manufacturing properties only) Inventories (found in industrial/manufacturing properties only; commercial inventories are
generally exempt); and, Fixtures (furniture, office equipment, et cetera; found in all types of business property)
Why does personal property matter?
The amount of assumed personal property is important, because for states that fully exempt personal property (such as Minnesota), effective tax rates and rankings fall as that share of property value attributable to personal property rises, since a larger share of the total property is exempt from taxation.
How do you know how much personal property a parcel has?
This study assumes that 1/6th of total commercial property value is attributable to personal property. For industrial properties, the study presented two different assumptions: that personal property comprised 50% of total property value, and that personal property comprised 60% of total property value. We arrived at these assumptions after consulting with our sister NTC organizations and by studying data provided by an actual company with property holdings in multiple states.
With the permission of the Minnesota Department of Revenue’s Research Division, we have borrowed the methodology they use to determine shares of real and personal business property in their biennial Tax Incidence Study. Using that methodology, we have calculated state-specific real property, machinery and equipment, fixtures, and inventory shares for industrial parcels. Essentially, this analysis indicates how each state-specific industry mixes affect the property tax burden on industrial parcels of equal real property value.
This model indicated that our assumptions regarding industrial personal property are very reasonable; according to the model, the property owned by Minnesota industry is 47.4% land and buildings (real property) and 52.6% personal property. Overall, the shares of personal property range from 48.5% (Wyoming) to 57.8% (North Dakota).
Because the model offers the opportunity to create state-specific industrial property shares, we are introducing a new measure and rankings for industrial parcels where we allow the shares of personal property to vary from state to state. This analysis provides a sense of property tax rankings based on the actual mix of industries located in each state. Note that for purposes of evaluating how identical parcels are treated in different locations the traditional 50% and 60% assumptions should be used.
Minnesota Taxpayers Association 50-State Property Tax Study 2009
1
III. Introduction
This study reports on relative property tax burdens across the United States, and updates our payable 2008 study. We compare effective property tax rates for four classes of property located in the largest city of each state8 (plus an additional city for Illinois and New York9) and the District of Columbia, the largest fifty cities in the United States, and a rural area for each state. Rural cities are selected using the rural-urban classification continuum developed by the U.S. Department of Agriculture, and must be county seats with population of 2,500 to 10,000. This methodology to creates more measurable eligibility criteria, removes subjectivity in city choice, and creates a more heterogeneous set of cities with regard to population and geographic relationship to urban areas. See Appendix A for more information on this methodology.
This study is most useful when used in connection with other information about state and local tax structures. Some states have relatively high property tax levies because their local governments are more dependent on “own-source” revenue (revenue they raise themselves) or have limited non-property tax options available to them (such as in Minnesota). Other states have higher income and sales taxes in part to finance a greater share of the cost of local government. Also, the property tax on a selected class of property may be relatively high or low due to state or local policies designed to redistribute property tax burdens across the classes of property through exemptions, differential assessment rates, or other classification schemes.
We continue to use fixed-value examples to facilitate comparisons with earlier studies10. We recognize that our lowest-valued properties are not typical values in many urban areas. We deliberately use fixed values because one goal of this study is to compare the tax burden resulting from each state's tax structure, unaffected by local real estate markets. Businesses desiring to expand operations by building a new manufacturing facility or opening a new retail location perform this sort of analysis regularly when determining where to locate the expansion (we note for the record that such decisions are not based entirely on property tax burdens).
To provide additional perspective, the study deviates from fixed-value examples in two instances. The study offers rankings for homestead properties based on the median value of homes in the various metropolitan areas11. For industrial properties, we have borrowed the methodology the Minnesota Department of Revenue’s Research Division uses to determine shares of real and personal property for their biennial Tax Incidence Study. Using that methodology, we have calculated state-specific real property, machinery and equipment, fixtures, and inventory shares for industrial parcels. Essentially, this analysis indicates how each state-specific industry mixes affect the property tax burden on industrial parcels of equal value. This differs from the intent of our other analyses – to compare property tax burdens on identical parcels in various locations.
Note that the shares of personal property range from 48.5% (Wyoming) to 57.8% (North Dakota). These findings are consistent with our earlier research, which indicated that the two sets of assumptions we used in calculating the burden on industrial parcels (one where personal property equals 50% of the total parcel value, and one where personal property equals 60% of the total parcel value) were reasonable.
8 Based on the U.S. Census Bureau’s estimated July 1, 2008 populations for U.S. cities. 9 In most cases, property tax structures are uniform across states. However, the property tax structure is significantly different in Cook County (Chicago) and in New York City than in the remainder of Illinois and New York. We include the second-largest cities in those states (Aurora and Buffalo) to represent the propery tax structure in the remainder of those states. In essence, our urban analysis is a comparison of 53 different property tax structures, rather than 50 states and D.C. with over-representation in two states. 10 Previous studies are available for taxes payable 1995, 1998, 2000, 2002, 2004, 2005, 2006, 2007, and 2008. 11 Data from the National Association of Realtors, except where noted otherwise.

III. Introduction
2
Data for property tax calculations were collected in one of two ways. Where possible, property tax data was collected directly from various state and local websites. Where such data was not available, we calculated property taxes using a contact-verification approach in which state or local tax experts were asked to provide information and provided verification when necessary.
Some cities have changed from the payable 2008 edition of this study. That study omitted Indianapolis because tax rate data was not available by the writing deadline. Rate data for Indianapolis is again available on a timely basis, and so we have substituted Indianapolis for Fort Wayne, Indiana in our urban analysis and for Wichita, Kansas in our set of the nation’s fifty largest cities. Our set of rural cities has changed as follows:
State Pay 08 Study Pay 09 Study State Pay 08 Study Pay 09 Study IL Hillsboro Clinton PA Brookville Ridgway KS Fredonia Iola WI Viroqua Rice Lake
This study assumes that the “true market value” of each of several parcels of property is the same in all 124 locations studied. Because the "assessed value" of property varies from state to state, sometimes significantly, our tax calculations necessarily account for the effects of local assessment practices as well as statutory tax provisions. Appendix A reviews the methodology used in determining the property tax liabilities of the four sample property types and the important assumptions necessary to standardize the calculations and make the numbers comparable across the states.
Section IV reviews the property tax rankings for Minneapolis (Minnesota’s largest city) and Glencoe (Minnesota’s rural representative in this study). This section also includes an analysis of several key features such as classification systems, disparities between homestead and non-homestead properties (particularly business property), and personal property assumptions.
Sections V, VI and VII contain the complete set of comparison tables referenced in this report.
Section VIII is an appendix detailing our methodology and assumptions.
Minnesota Taxpayers Association 50-State Property Tax Study 2009
3
IV. Findings
Residential Homestead Property Tax Rankings and Burdens
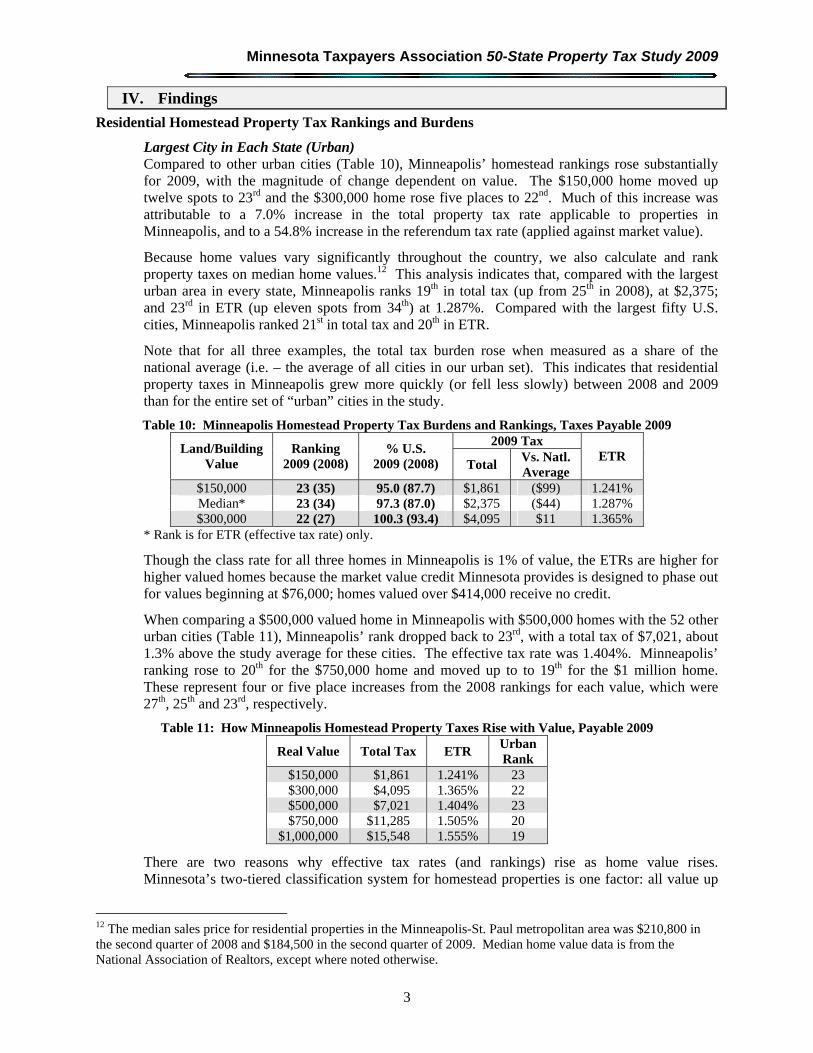
Largest City in Each State (Urban) Compared to other urban cities (Table 10), Minneapolis’ homestead rankings rose substantially for 2009, with the magnitude of change dependent on value. The $150,000 home moved up twelve spots to 23rd and the $300,000 home rose five places to 22nd. Much of this increase was attributable to a 7.0% increase in the total property tax rate applicable to properties in Minneapolis, and to a 54.8% increase in the referendum tax rate (applied against market value).
Because home values vary significantly throughout the country, we also calculate and rank property taxes on median home values.12 This analysis indicates that, compared with the largest urban area in every state, Minneapolis ranks 19th in total tax (up from 25th in 2008), at $2,375; and 23rd in ETR (up eleven spots from 34th) at 1.287%. Compared with the largest fifty U.S. cities, Minneapolis ranked 21st in total tax and 20th in ETR.
Note that for all three examples, the total tax burden rose when measured as a share of the national average (i.e. – the average of all cities in our urban set). This indicates that residential property taxes in Minneapolis grew more quickly (or fell less slowly) between 2008 and 2009 than for the entire set of “urban” cities in the study.
Table 10: Minneapolis Homestead Property Tax Burdens and Rankings, Taxes Payable 2009 2009 Tax
Land/Building Value
Ranking 2009 (2008)
% U.S. 2009 (2008) Total
Vs. Natl. Average
ETR
$150,000 23 (35) 95.0 (87.7) $1,861 ($99) 1.241% Median* 23 (34) 97.3 (87.0) $2,375 ($44) 1.287% $300,000 22 (27) 100.3 (93.4) $4,095 $11 1.365%
* Rank is for ETR (effective tax rate) only.
Though the class rate for all three homes in Minneapolis is 1% of value, the ETRs are higher for higher valued homes because the market value credit Minnesota provides is designed to phase out for values beginning at $76,000; homes valued over $414,000 receive no credit.
When comparing a $500,000 valued home in Minneapolis with $500,000 homes with the 52 other urban cities (Table 11), Minneapolis’ rank dropped back to 23rd, with a total tax of $7,021, about 1.3% above the study average for these cities. The effective tax rate was 1.404%. Minneapolis’ ranking rose to 20th for the $750,000 home and moved up to to 19th for the $1 million home. These represent four or five place increases from the 2008 rankings for each value, which were 27th, 25th and 23rd, respectively.
Table 11: How Minneapolis Homestead Property Taxes Rise with Value, Payable 2009
Real Value Total Tax ETR Urban Rank
$150,000 $1,861 1.241% 23 $300,000 $4,095 1.365% 22 $500,000 $7,021 1.404% 23 $750,000 $11,285 1.505% 20 $1,000,000 $15,548 1.555% 19
There are two reasons why effective tax rates (and rankings) rise as home value rises. Minnesota’s two-tiered classification system for homestead properties is one factor: all value up
12 The median sales price for residential properties in the Minneapolis-St. Paul metropolitan area was $210,800 in the second quarter of 2008 and $184,500 in the second quarter of 2009. Median home value data is from the National Association of Realtors, except where noted otherwise.
IV. Findings
4
to $500,000 is taxed at 1.0% of appraised value, while value in excess of $500,000 is taxed at 1.25% of appraised value. An additional factor is the phase-out of Minnesota’s market value credit, as previously discussed.
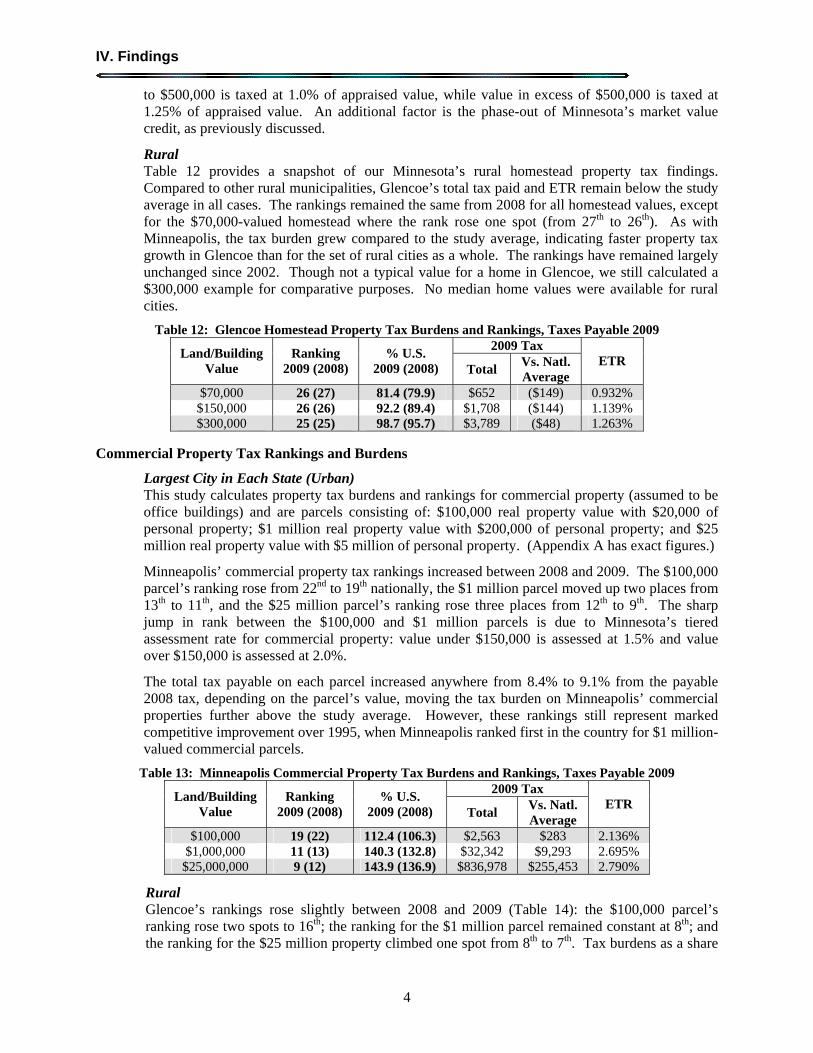
Rural Table 12 provides a snapshot of our Minnesota’s rural homestead property tax findings. Compared to other rural municipalities, Glencoe’s total tax paid and ETR remain below the study average in all cases. The rankings remained the same from 2008 for all homestead values, except for the $70,000-valued homestead where the rank rose one spot (from 27th to 26th). As with Minneapolis, the tax burden grew compared to the study average, indicating faster property tax growth in Glencoe than for the set of rural cities as a whole. The rankings have remained largely unchanged since 2002. Though not a typical value for a home in Glencoe, we still calculated a $300,000 example for comparative purposes. No median home values were available for rural cities.
Table 12: Glencoe Homestead Property Tax Burdens and Rankings, Taxes Payable 2009 2009 Tax
Land/Building Value
Ranking 2009 (2008)
% U.S. 2009 (2008) Total
Vs. Natl. Average
ETR
$70,000 26 (27) 81.4 (79.9) $652 ($149) 0.932% $150,000 26 (26) 92.2 (89.4) $1,708 ($144) 1.139% $300,000 25 (25) 98.7 (95.7) $3,789 ($48) 1.263%
Commercial Property Tax Rankings and Burdens
Largest City in Each State (Urban) This study calculates property tax burdens and rankings for commercial property (assumed to be office buildings) and are parcels consisting of: $100,000 real property value with $20,000 of personal property; $1 million real property value with $200,000 of personal property; and $25 million real property value with $5 million of personal property. (Appendix A has exact figures.)
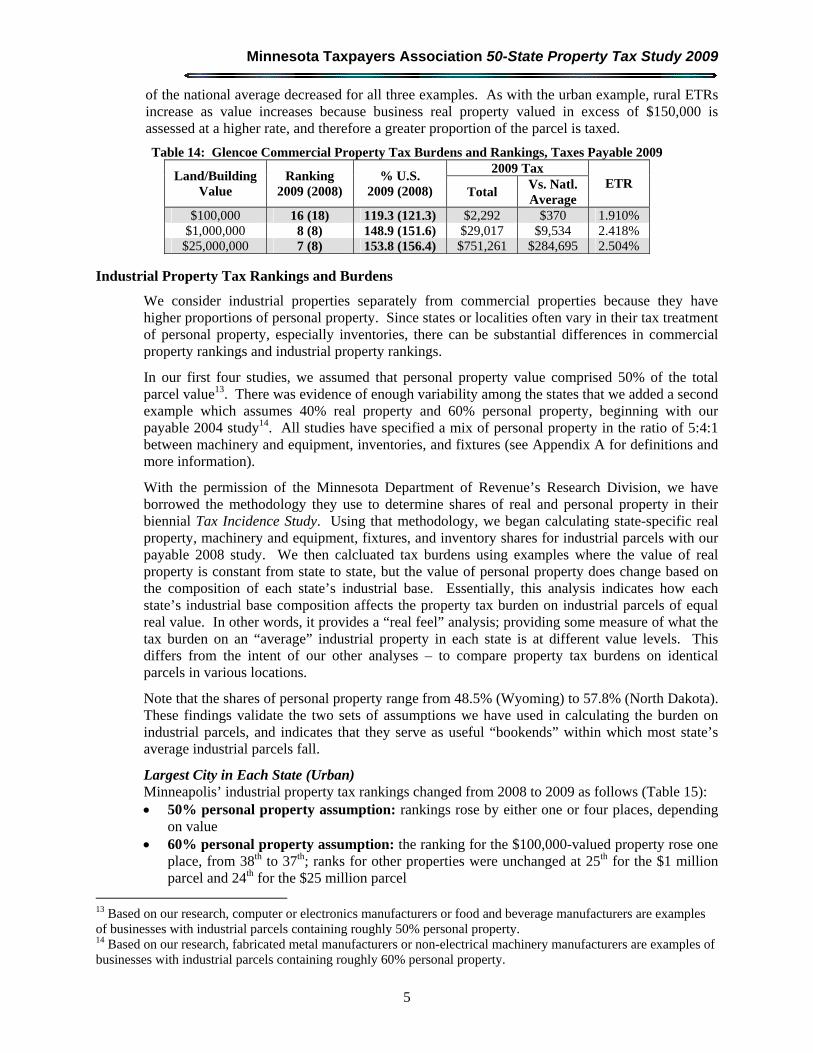
Minneapolis’ commercial property tax rankings increased between 2008 and 2009. The $100,000 parcel’s ranking rose from 22nd to 19th nationally, the $1 million parcel moved up two places from 13th to 11th, and the $25 million parcel’s ranking rose three places from 12th to 9th. The sharp jump in rank between the $100,000 and $1 million parcels is due to Minnesota’s tiered assessment rate for commercial property: value under $150,000 is assessed at 1.5% and value over $150,000 is assessed at 2.0%.
The total tax payable on each parcel increased anywhere from 8.4% to 9.1% from the payable 2008 tax, depending on the parcel’s value, moving the tax burden on Minneapolis’ commercial properties further above the study average. However, these rankings still represent marked competitive improvement over 1995, when Minneapolis ranked first in the country for $1 million-valued commercial parcels.
Table 13: Minneapolis Commercial Property Tax Burdens and Rankings, Taxes Payable 2009 2009 Tax
Land/Building Value
Ranking 2009 (2008)
% U.S. 2009 (2008) Total
Vs. Natl. Average
ETR
$100,000 19 (22) 112.4 (106.3) $2,563 $283 2.136% $1,000,000 11 (13) 140.3 (132.8) $32,342 $9,293 2.695% $25,000,000 9 (12) 143.9 (136.9) $836,978 $255,453 2.790%
Rural Glencoe’s rankings rose slightly between 2008 and 2009 (Table 14): the $100,000 parcel’s ranking rose two spots to 16th; the ranking for the $1 million parcel remained constant at 8th; and the ranking for the $25 million property climbed one spot from 8th to 7th. Tax burdens as a share
Minnesota Taxpayers Association 50-State Property Tax Study 2009
5
of the national average decreased for all three examples. As with the urban example, rural ETRs increase as value increases because business real property valued in excess of $150,000 is assessed at a higher rate, and therefore a greater proportion of the parcel is taxed.
Table 14: Glencoe Commercial Property Tax Burdens and Rankings, Taxes Payable 2009 2009 Tax
Land/Building Value
Ranking 2009 (2008)
% U.S. 2009 (2008) Total
Vs. Natl. Average
ETR
$100,000 16 (18) 119.3 (121.3) $2,292 $370 1.910% $1,000,000 8 (8) 148.9 (151.6) $29,017 $9,534 2.418% $25,000,000 7 (8) 153.8 (156.4) $751,261 $284,695 2.504%
Industrial Property Tax Rankings and Burdens
We consider industrial properties separately from commercial properties because they have higher proportions of personal property. Since states or localities often vary in their tax treatment of personal property, especially inventories, there can be substantial differences in commercial property rankings and industrial property rankings.
In our first four studies, we assumed that personal property value comprised 50% of the total parcel value13. There was evidence of enough variability among the states that we added a second example which assumes 40% real property and 60% personal property, beginning with our payable 2004 study14. All studies have specified a mix of personal property in the ratio of 5:4:1 between machinery and equipment, inventories, and fixtures (see Appendix A for definitions and more information).
With the permission of the Minnesota Department of Revenue’s Research Division, we have borrowed the methodology they use to determine shares of real and personal property in their biennial Tax Incidence Study. Using that methodology, we began calculating state-specific real property, machinery and equipment, fixtures, and inventory shares for industrial parcels with our payable 2008 study. We then calcluated tax burdens using examples where the value of real property is constant from state to state, but the value of personal property does change based on the composition of each state’s industrial base. Essentially, this analysis indicates how each state’s industrial base composition affects the property tax burden on industrial parcels of equal real value. In other words, it provides a “real feel” analysis; providing some measure of what the tax burden on an “average” industrial property in each state is at different value levels. This differs from the intent of our other analyses – to compare property tax burdens on identical parcels in various locations.
Note that the shares of personal property range from 48.5% (Wyoming) to 57.8% (North Dakota). These findings validate the two sets of assumptions we have used in calculating the burden on industrial parcels, and indicates that they serve as useful “bookends” within which most state’s average industrial parcels fall.
Largest City in Each State (Urban)
Minneapolis’ industrial property tax rankings changed from 2008 to 2009 as follows (Table 15): 50% personal property assumption: rankings rose by either one or four places, depending
on value 60% personal property assumption: the ranking for the $100,000-valued property rose one
place, from 38th to 37th; ranks for other properties were unchanged at 25th for the $1 million parcel and 24th for the $25 million parcel
13 Based on our research, computer or electronics manufacturers or food and beverage manufacturers are examples of businesses with industrial parcels containing roughly 50% personal property. 14 Based on our research, fabricated metal manufacturers or non-electrical machinery manufacturers are examples of businesses with industrial parcels containing roughly 60% personal property.
IV. Findings
6
State-specific personal property assumptions: the $100,000-valued property rose four places from 34th to 30th; the $1 million property fell one spot from 21st to 22nd; and the $25 million property’s rank was unchanged at 21st
Compared to other urban cities, Minneapolis’ industrial property taxes are above-average for $1 million and $25 million-valued properties under the 50% and state-specific personal property assumptions. The owner of an industrial property in Minneapolis with real value of $25 million with 50% total personal property is paying $107,173 more in taxes than competitors nationwide, on average. However, relative burdens remain lower than in payable 2004, when the $1 million property was 21.0% higher than the average and the $25 million property 24.7% higher than the average15.
Astute readers may notice that Minnesota’s industrial property tax rankings are lower than the commercial rankings, even though commercial and industrial property taxes are the same for each jurisdiction. Minnesota’s full exemption of personal property for most industrial firms (except utilities) is the reason for this – since industrial properties have larger proportions of personal property they receive a greater benefit and have a lower effective tax rate, making them more competitive on a tax burden basis than commercial properties.
Table 15: Minneapolis Industrial Tax Burdens and Rankings, Taxes Payable 2009 2009 Tax
Pers. Prop. Share
Land/Building Value
Ranking * 2009 (2008)
% U.S.** 2009 (2008) Total
Vs. Natl. Average
ETR
50% $100,000 28 (29) 90.6 (83.8) $2,563 ($265) 1.282% 50% $1,000,000 16 (20) 111.7 (103.1) $32,342 $3,377 1.617% 50% $25,000,000 18 (19) 114.7 (106.4) $836,978 $107,173 1.674% 60% $100,000 37 (38) 79.2 (72.5) $2,563 ($675) 1.025% 60% $1,000,000 25 (25) 97.2 (89.4) $32,342 ($934) 1.294% 60% $25,000,000 24 (24) 99.9 (92.3) $836,978 ($616) 1.339%
State Specific $100,000 30 (34) 86.1 (78.1) $2,563 ($454) 1.216% State Specific $1,000,000 22 (21) 105.8 (96.2) $32,342 $1,368 1.534% State Specific $25,000,000 21 (21) 108.7 (99.3) $836,978 $56,946 1.588%
* Rank is for effective tax rate (ETR) only. ** Comparison for state-specific calculations is between ETRs, not total tax.
These examples indicate the importance of the personal property assumptions: as the personal property share increases, the effective tax rates and rankings for Minneapolis’ industrial properties decline.
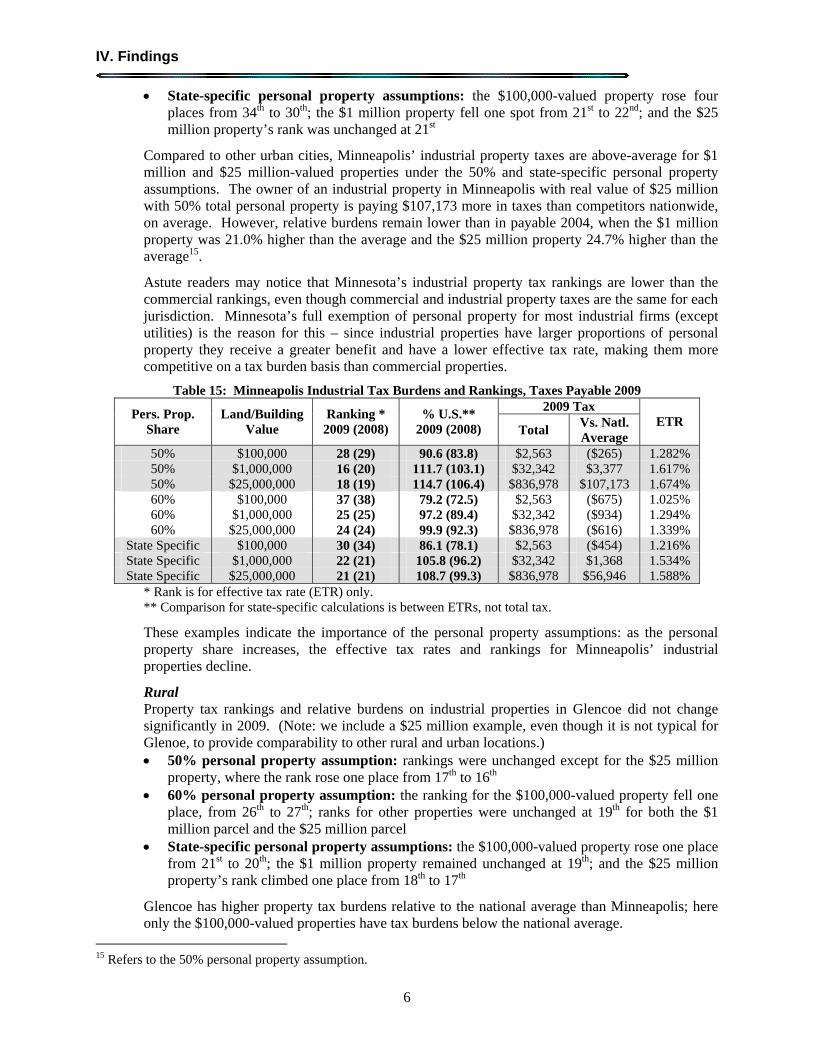
Rural Property tax rankings and relative burdens on industrial properties in Glencoe did not change significantly in 2009. (Note: we include a $25 million example, even though it is not typical for Glenoe, to provide comparability to other rural and urban locations.) 50% personal property assumption: rankings were unchanged except for the $25 million
property, where the rank rose one place from 17th to 16th 60% personal property assumption: the ranking for the $100,000-valued property fell one
place, from 26th to 27th; ranks for other properties were unchanged at 19th for both the $1 million parcel and the $25 million parcel
State-specific personal property assumptions: the $100,000-valued property rose one place from 21st to 20th; the $1 million property remained unchanged at 19th; and the $25 million property’s rank climbed one place from 18th to 17th
Glencoe has higher property tax burdens relative to the national average than Minneapolis; here only the $100,000-valued properties have tax burdens below the national average.
15 Refers to the 50% personal property assumption.
Minnesota Taxpayers Association 50-State Property Tax Study 2009
7
Table 16: Glencoe Industrial Tax Burdens and Rankings, Taxes Payable 2009 2009 Tax
Pers. Prop. Share
Land/Building Value
Ranking * 2009 (2008)
% U.S.** 2009 (2008) Total
Vs. Natl. Average
ETR
50% $100,000 21 (21) 94.1 (94.9) $2,292 ($145) 1.146% 50% $1,000,000 17 (17) 116.8 (117.7) $29,017 $4,181 1.451% 50% $25,000,000 16 (17) 120.7 (121.5) $751,261 $128,871 1.503% 60% $100,000 27 (26) 81.8 (82.2) $2,292 ($511) 0.917% 60% $1,000,000 19 (19) 101.8 (102.0) $29,017 $500 1.161% 60% $25,000,000 19 (19) 105.2 (105.4) $751,261 $36,824 1.202%
State Specific $100,000 20 (21) 87.8 (88.4) $2,292 ($319) 1.087% State Specific $1,000,000 19 (19) 109.1 (109.6) $29,017 $2,413 1.376% State Specific $25,000,000 17 (18) 112.7 (113.2) $751,261 $84,659 1.425%
* Rank is for effective tax rate (ETR) only. ** Comparison for state-specific calculations is between ETRs, not total tax.
Apartment Property Tax Rankings and Burdens
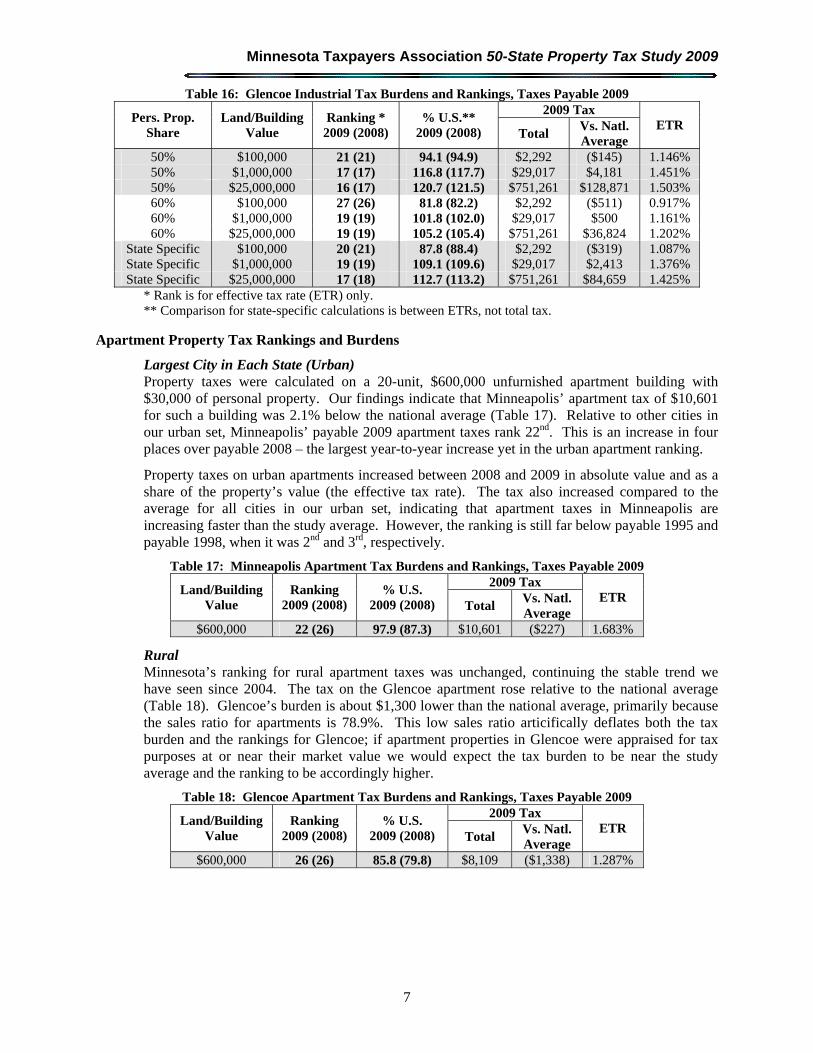
Largest City in Each State (Urban) Property taxes were calculated on a 20-unit, $600,000 unfurnished apartment building with $30,000 of personal property. Our findings indicate that Minneapolis’ apartment tax of $10,601 for such a building was 2.1% below the national average (Table 17). Relative to other cities in our urban set, Minneapolis’ payable 2009 apartment taxes rank 22nd. This is an increase in four places over payable 2008 – the largest year-to-year increase yet in the urban apartment ranking.
Property taxes on urban apartments increased between 2008 and 2009 in absolute value and as a share of the property’s value (the effective tax rate). The tax also increased compared to the average for all cities in our urban set, indicating that apartment taxes in Minneapolis are increasing faster than the study average. However, the ranking is still far below payable 1995 and payable 1998, when it was 2nd and 3rd, respectively.
Table 17: Minneapolis Apartment Tax Burdens and Rankings, Taxes Payable 2009 2009 Tax
Land/Building Value
Ranking 2009 (2008)
% U.S. 2009 (2008) Total
Vs. Natl. Average
ETR
$600,000 22 (26) 97.9 (87.3) $10,601 ($227) 1.683%
Rural Minnesota’s ranking for rural apartment taxes was unchanged, continuing the stable trend we have seen since 2004. The tax on the Glencoe apartment rose relative to the national average (Table 18). Glencoe’s burden is about $1,300 lower than the national average, primarily because the sales ratio for apartments is 78.9%. This low sales ratio articifically deflates both the tax burden and the rankings for Glencoe; if apartment properties in Glencoe were appraised for tax purposes at or near their market value we would expect the tax burden to be near the study average and the ranking to be accordingly higher.
Table 18: Glencoe Apartment Tax Burdens and Rankings, Taxes Payable 2009 2009 Tax
Land/Building Value
Ranking 2009 (2008)
% U.S. 2009 (2008) Total
Vs. Natl. Average
ETR
$600,000 26 (26) 85.8 (79.8) $8,109 ($1,338) 1.287%
IV. Findings
8
Findings – Subsidization of Homeowners
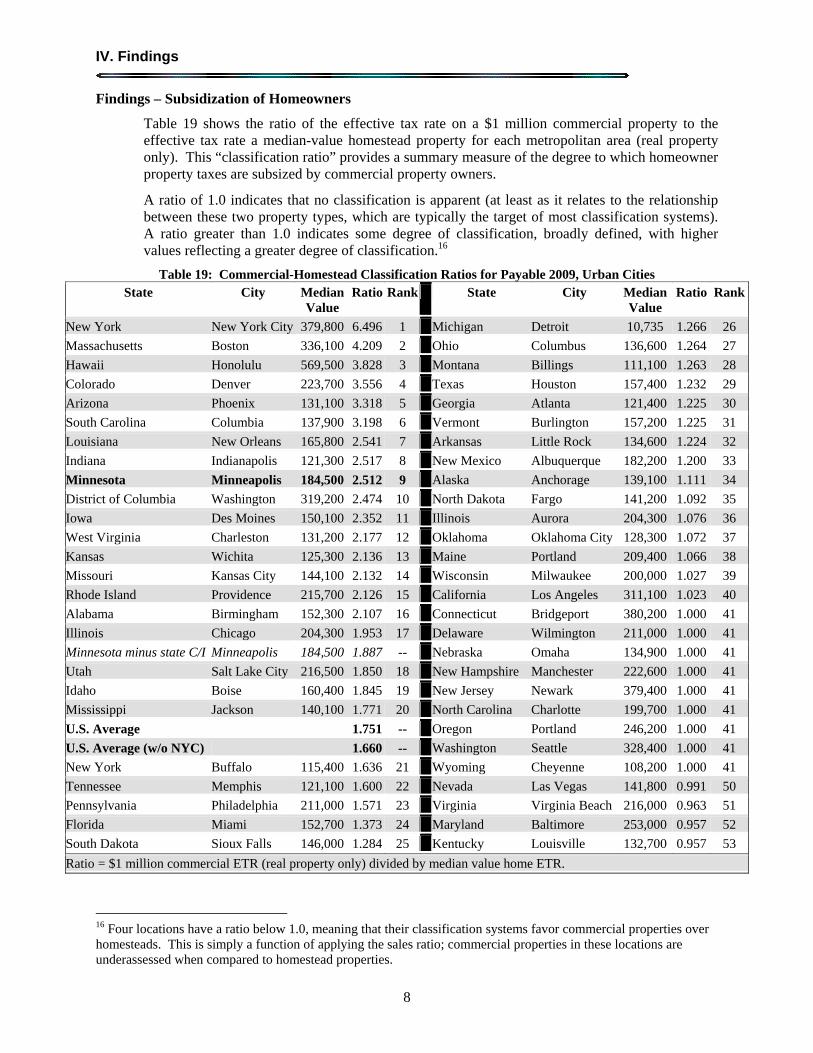
Table 19 shows the ratio of the effective tax rate on a $1 million commercial property to the effective tax rate a median-value homestead property for each metropolitan area (real property only). This “classification ratio” provides a summary measure of the degree to which homeowner property taxes are subsized by commercial property owners.
A ratio of 1.0 indicates that no classification is apparent (at least as it relates to the relationship between these two property types, which are typically the target of most classification systems). A ratio greater than 1.0 indicates some degree of classification, broadly defined, with higher values reflecting a greater degree of classification.16
Table 19: Commercial-Homestead Classification Ratios for Payable 2009, Urban Cities State City Median
Value Ratio Rank State City Median
Value Ratio Rank
New York New York City 379,800 6.496 1 Michigan Detroit 10,735 1.266 26
Massachusetts Boston 336,100 4.209 2 Ohio Columbus 136,600 1.264 27
Hawaii Honolulu 569,500 3.828 3 Montana Billings 111,100 1.263 28
Colorado Denver 223,700 3.556 4 Texas Houston 157,400 1.232 29
Arizona Phoenix 131,100 3.318 5 Georgia Atlanta 121,400 1.225 30
South Carolina Columbia 137,900 3.198 6 Vermont Burlington 157,200 1.225 31
Louisiana New Orleans 165,800 2.541 7 Arkansas Little Rock 134,600 1.224 32
Indiana Indianapolis 121,300 2.517 8 New Mexico Albuquerque 182,200 1.200 33
Minnesota Minneapolis 184,500 2.512 9 Alaska Anchorage 139,100 1.111 34
District of Columbia Washington 319,200 2.474 10 North Dakota Fargo 141,200 1.092 35
Iowa Des Moines 150,100 2.352 11 Illinois Aurora 204,300 1.076 36
West Virginia Charleston 131,200 2.177 12 Oklahoma Oklahoma City 128,300 1.072 37
Kansas Wichita 125,300 2.136 13 Maine Portland 209,400 1.066 38
Missouri Kansas City 144,100 2.132 14 Wisconsin Milwaukee 200,000 1.027 39
Rhode Island Providence 215,700 2.126 15 California Los Angeles 311,100 1.023 40
Alabama Birmingham 152,300 2.107 16 Connecticut Bridgeport 380,200 1.000 41
Illinois Chicago 204,300 1.953 17 Delaware Wilmington 211,000 1.000 41
Minnesota minus state C/I Minneapolis 184,500 1.887 -- Nebraska Omaha 134,900 1.000 41
Utah Salt Lake City 216,500 1.850 18 New Hampshire Manchester 222,600 1.000 41
Idaho Boise 160,400 1.845 19 New Jersey Newark 379,400 1.000 41
Mississippi Jackson 140,100 1.771 20 North Carolina Charlotte 199,700 1.000 41
U.S. Average 1.751 -- Oregon Portland 246,200 1.000 41
U.S. Average (w/o NYC) 1.660 -- Washington Seattle 328,400 1.000 41
New York Buffalo 115,400 1.636 21 Wyoming Cheyenne 108,200 1.000 41
Tennessee Memphis 121,100 1.600 22 Nevada Las Vegas 141,800 0.991 50
Pennsylvania Philadelphia 211,000 1.571 23 Virginia Virginia Beach 216,000 0.963 51
Florida Miami 152,700 1.373 24 Maryland Baltimore 253,000 0.957 52
South Dakota Sioux Falls 146,000 1.284 25 Kentucky Louisville 132,700 0.957 53
Ratio = $1 million commercial ETR (real property only) divided by median value home ETR.
16 Four locations have a ratio below 1.0, meaning that their classification systems favor commercial properties over homesteads. This is simply a function of applying the sales ratio; commercial properties in these locations are underassessed when compared to homestead properties.
Minnesota Taxpayers Association 50-State Property Tax Study 2009
9
The ratios were calculated for real property only, after adjusting for differences in assessment practices. Differences in the quality of assessments among various classes of property can produce a de facto classification system even in the absence of statutory classification schemes.
States that rank near the top of this list do so because of extreme differences in classification ratios between these two types of property. For instance, in New York City, residential property is assessed at 6% of value while commercial property is assessed at 45% of value. In other cases differences in tax rates and/or homestead exemptions or credits account for the differences, such as in Boston; where roughly 38% of the value of the median home is excluded from taxation, and the homestead tax rate is some 39% that of commercial and industrial properties.
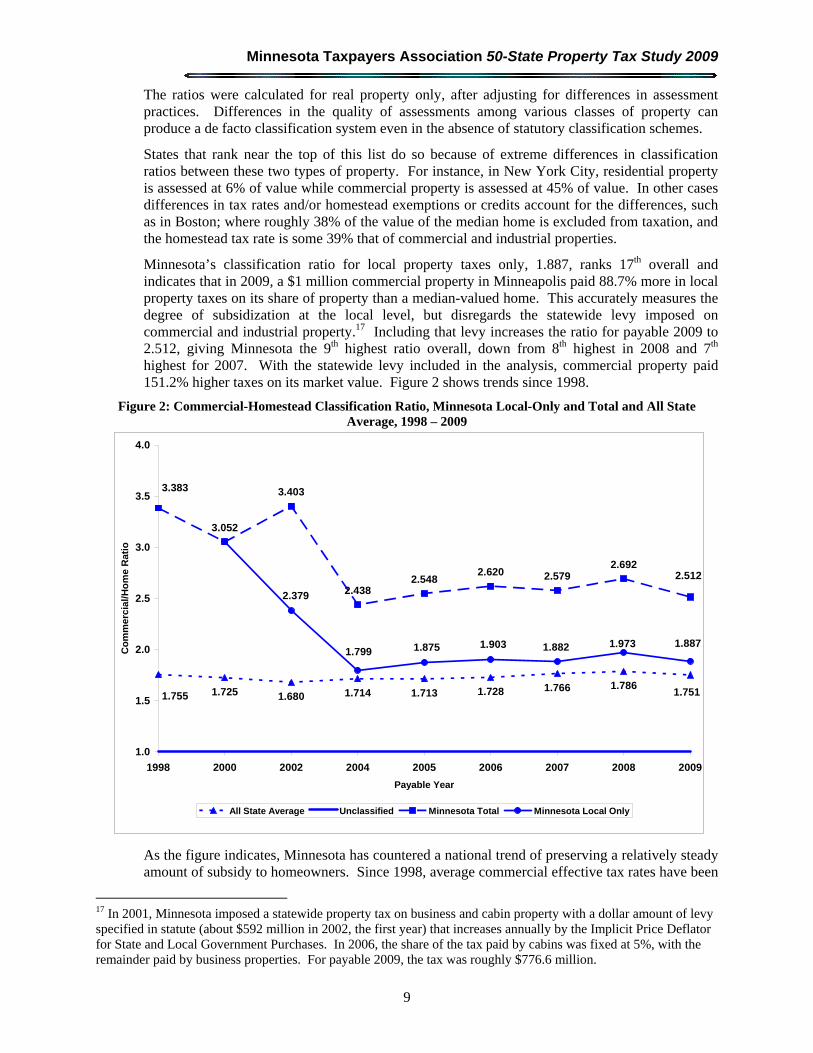
Minnesota’s classification ratio for local property taxes only, 1.887, ranks 17th overall and indicates that in 2009, a $1 million commercial property in Minneapolis paid 88.7% more in local property taxes on its share of property than a median-valued home. This accurately measures the degree of subsidization at the local level, but disregards the statewide levy imposed on commercial and industrial property.17 Including that levy increases the ratio for payable 2009 to 2.512, giving Minnesota the 9th highest ratio overall, down from 8th highest in 2008 and 7th highest for 2007. With the statewide levy included in the analysis, commercial property paid 151.2% higher taxes on its market value. Figure 2 shows trends since 1998.
Figure 2: Commercial-Homestead Classification Ratio, Minnesota Local-Only and Total and All State Average, 1998 – 2009
1.725 1.680 1.713 1.728 1.766 1.786
3.052
3.403
2.4382.548
2.620 2.5792.692
1.7511.7141.755
2.512
3.383
1.8871.9731.882
2.379
1.799 1.875 1.903
1.0
1.5
2.0
2.5
3.0
3.5
4.0
1998 2000 2002 2004 2005 2006 2007 2008 2009
Payable Year
Co
mm
erci
al/
Ho
me
Rat
io
All State Average Unclassified Minnesota Total Minnesota Local Only
As the figure indicates, Minnesota has countered a national trend of preserving a relatively steady amount of subsidy to homeowners. Since 1998, average commercial effective tax rates have been
17 In 2001, Minnesota imposed a statewide property tax on business and cabin property with a dollar amount of levy specified in statute (about $592 million in 2002, the first year) that increases annually by the Implicit Price Deflator for State and Local Government Purchases. In 2006, the share of the tax paid by cabins was fixed at 5%, with the remainder paid by business properties. For payable 2009, the tax was roughly $776.6 million.

IV. Findings
10
nationally 1.7 to 1.8 times the effective tax rates on homestead properties. In contrast, Minnesota’s classification ratio (for local taxes only) has declined 44% during thie period to move much closer to the national average.
Of course, similar analysis can be performed for other property types. While industrial land and buildings are not treated all that differently from commercial land and buildings (personal property is another matter, but is not important for these purposes), it is useful to know the degree of subsidy provided to homeowners at the expense of renters. Table 20 shows the classification ratio for apartments versus homes.
Table 20: Ratio of Apartment Effective Tax Rates (ETRs) to Homestead Rates, Urban Cities, Payable 2009 State City Median
Value Ratio Rank State City Median
Value Ratio Rank
New York New York City 379,800 6.423 1 Alaska Anchorage 139,100 1.111 27
South Carolina Columbia 137,900 3.198 2 North Dakota Fargo 141,200 1.092 28
Indiana Indianapolis 121,300 2.517 3 Illinois Aurora 204,300 1.076 29
Iowa Des Moines 150,100 2.352 4 Oklahoma Oklahoma City 128,300 1.072 30
West Virginia Charleston 131,200 2.141 5 Maine Portland 209,400 1.066 31
Alabama Birmingham 152,300 2.107 6 New Mexico Albuquerque 182,200 1.037 32
Rhode Island Providence 215,700 2.000 7 Wisconsin Milwaukee 200,000 1.026 33
Idaho Boise 160,400 1.845 8 California Los Angeles 311,100 1.023 34
Louisiana New Orleans 165,800 1.826 9 Kansas Wichita 125,300 1.022 35
Mississippi Jackson 140,100 1.771 10 Utah Salt Lake City 216,500 1.018 36
Massachusetts Boston 336,100 1.747 11 Connecticut Bridgeport 380,200 1.000 37
New York Buffalo 115,400 1.636 12 Delaware Wilmington 211,000 1.000 37
Tennessee Memphis 121,100 1.600 13 Missouri Kansas City 144,100 1.000 37
Arizona Phoenix 131,100 1.436 14 Montana Billings 111,100 1.000 37
U.S. Average 1.413 Nebraska Omaha 134,900 1.000 37
Florida Jacksonville 152,700 1.373 15 New Hampshire Manchester 222,600 1.000 37
Minnesota Minneapolis 184,500 1.373 16 New Jersey Newark 379,400 1.000 37
Vermont Burlington 157,200 1.365 17 North Carolina Charlotte 199,700 1.000 37
U.S. Average w/o NYC 1.317 Oregon Portland 246,200 1.000 37
South Dakota Sioux Falls 146,000 1.284 18 Pennsylvania Philadelphia 211,000 1.000 37
District of Columbia Washington 319,200 1.274 19 Washington Seattle 328,400 1.000 37
Michigan Detroit 10,735 1.274 20 Wyoming Cheyenne 108,200 1.000 37
Ohio Columbus 136,600 1.264 21 Nevada Las Vegas 141,800 0.997 49
Georgia Atlanta 121,400 1.225 22 Colorado Denver 223,700 0.983 50
Arkansas Little Rock 134,600 1.224 23 Maryland Baltimore 253,000 0.957 51
Texas Houston 157,400 1.184 24 Kentucky Louisville 132,700 0.957 52
Illinois Chicago 204,300 1.127 25 Virginia Virginia Beach 216,000 0.814 53
Hawaii Honolulu 569,500 1.115 26
Ratio = $600,000 apartment ETR (real property ony) divided by median value home ETR.
The subsidy for homeowners versus renters (of 4+ unit apartments) in Minnesota takes two forms: the market value credit available only to owner-occupied property, and a class rate of 1% for the first $500,000 of home value, compared to a class rate of 1.25% for apartments.
Minneapolis’ apartment-to-home ratio fell negligibly in 2009, from 1.378 to 1.373, and the rank fell two spots from 14th to 16th. The ratio was 2.8% below the U.S. average (1.373 versus 1.413),
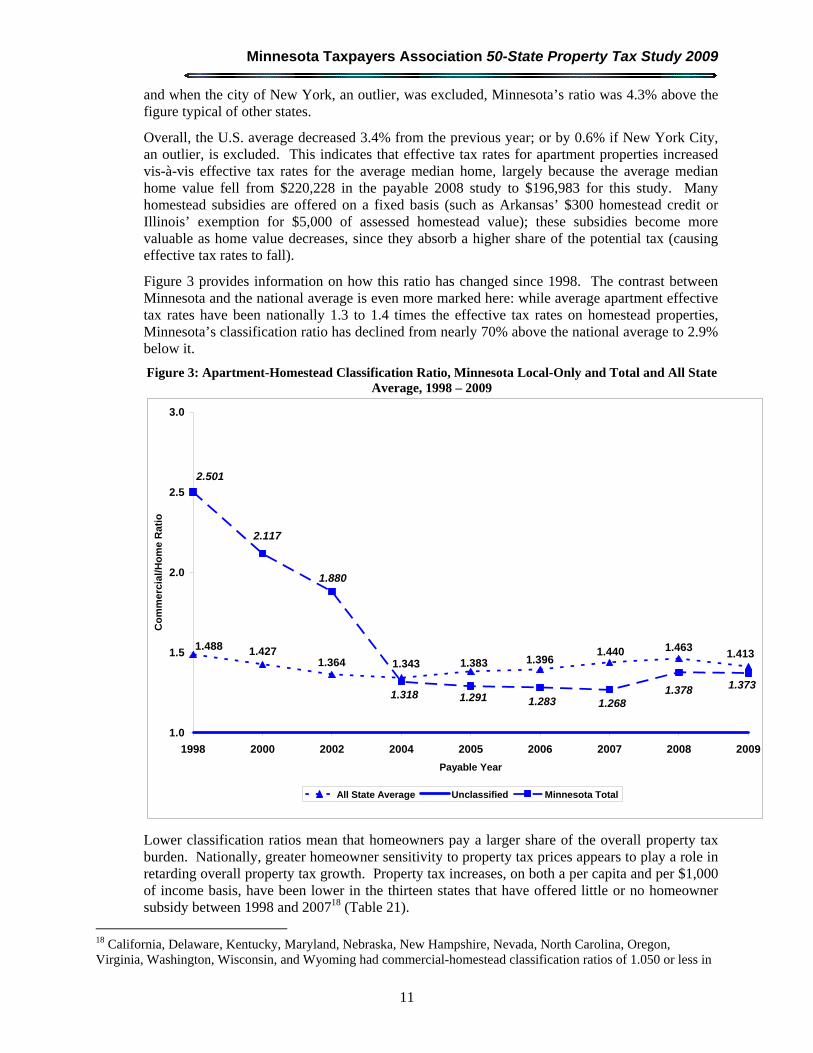
Minnesota Taxpayers Association 50-State Property Tax Study 2009
11
and when the city of New York, an outlier, was excluded, Minnesota’s ratio was 4.3% above the figure typical of other states.
Overall, the U.S. average decreased 3.4% from the previous year; or by 0.6% if New York City, an outlier, is excluded. This indicates that effective tax rates for apartment properties increased vis-à-vis effective tax rates for the average median home, largely because the average median home value fell from $220,228 in the payable 2008 study to $196,983 for this study. Many homestead subsidies are offered on a fixed basis (such as Arkansas’ $300 homestead credit or Illinois’ exemption for $5,000 of assessed homestead value); these subsidies become more valuable as home value decreases, since they absorb a higher share of the potential tax (causing effective tax rates to fall).
Figure 3 provides information on how this ratio has changed since 1998. The contrast between Minnesota and the national average is even more marked here: while average apartment effective tax rates have been nationally 1.3 to 1.4 times the effective tax rates on homestead properties, Minnesota’s classification ratio has declined from nearly 70% above the national average to 2.9% below it.
Figure 3: Apartment-Homestead Classification Ratio, Minnesota Local-Only and Total and All State Average, 1998 – 2009
1.3641.4271.488
1.4131.4631.440
1.3961.3831.343
1.880
1.3731.3781.2681.2831.2911.318
2.117
2.501
1.0
1.5
2.0
2.5
3.0
1998 2000 2002 2004 2005 2006 2007 2008 2009
Payable Year
Co
mm
erci
al/H
om
e R
atio
All State Average Unclassified Minnesota Total
Lower classification ratios mean that homeowners pay a larger share of the overall property tax burden. Nationally, greater homeowner sensitivity to property tax prices appears to play a role in retarding overall property tax growth. Property tax increases, on both a per capita and per $1,000 of income basis, have been lower in the thirteen states that have offered little or no homeowner subsidy between 1998 and 200718 (Table 21).
18 California, Delaware, Kentucky, Maryland, Nebraska, New Hampshire, Nevada, North Carolina, Oregon, Virginia, Washington, Wisconsin, and Wyoming had commercial-homestead classification ratios of 1.050 or less in
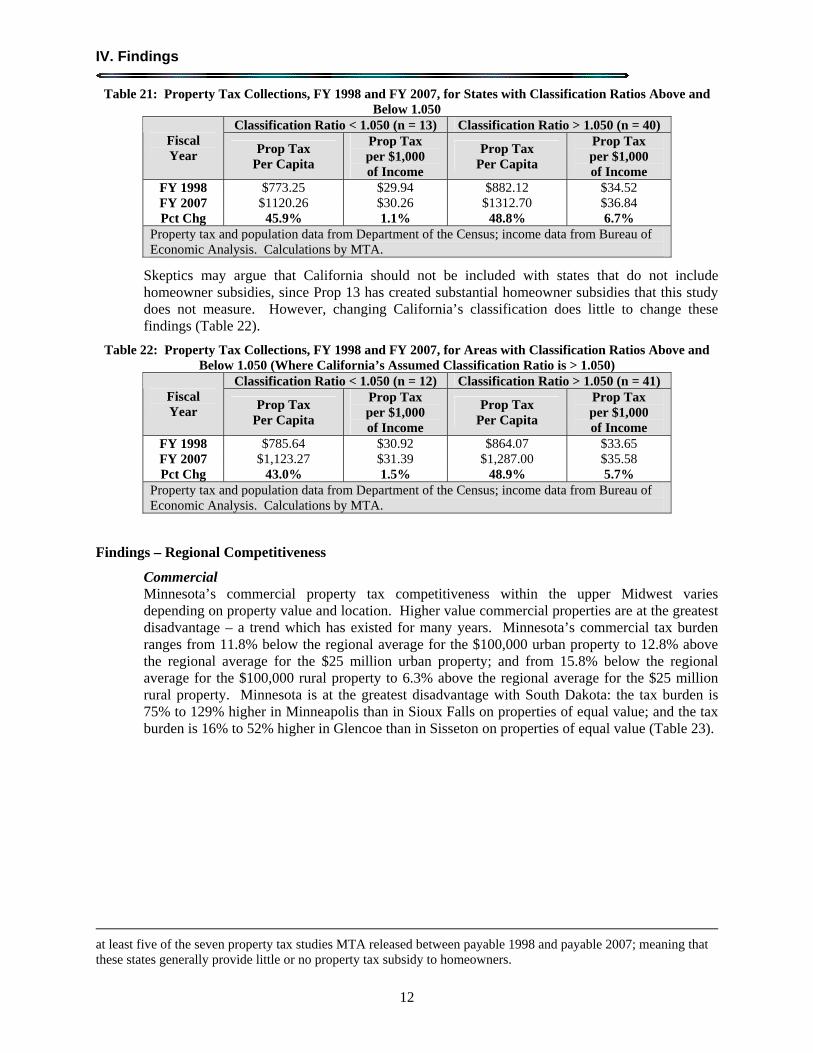
IV. Findings
12
Table 21: Property Tax Collections, FY 1998 and FY 2007, for States with Classification Ratios Above and Below 1.050
Classification Ratio < 1.050 (n = 13) Classification Ratio > 1.050 (n = 40) Fiscal Year Prop Tax
Per Capita
Prop Tax per $1,000 of Income
Prop Tax Per Capita
Prop Tax per $1,000 of Income
FY 1998 $773.25 $29.94 $882.12 $34.52 FY 2007 $1120.26 $30.26 $1312.70 $36.84 Pct Chg 45.9% 1.1% 48.8% 6.7%
Property tax and population data from Department of the Census; income data from Bureau of Economic Analysis. Calculations by MTA.
Skeptics may argue that California should not be included with states that do not include homeowner subsidies, since Prop 13 has created substantial homeowner subsidies that this study does not measure. However, changing California’s classification does little to change these findings (Table 22).
Table 22: Property Tax Collections, FY 1998 and FY 2007, for Areas with Classification Ratios Above and Below 1.050 (Where California’s Assumed Classification Ratio is > 1.050)
Classification Ratio < 1.050 (n = 12) Classification Ratio > 1.050 (n = 41) Fiscal Year Prop Tax
Per Capita
Prop Tax per $1,000 of Income
Prop Tax Per Capita
Prop Tax per $1,000 of Income
FY 1998 $785.64 $30.92 $864.07 $33.65 FY 2007 $1,123.27 $31.39 $1,287.00 $35.58 Pct Chg 43.0% 1.5% 48.9% 5.7%
Property tax and population data from Department of the Census; income data from Bureau of Economic Analysis. Calculations by MTA.
Findings – Regional Competitiveness
Commercial Minnesota’s commercial property tax competitiveness within the upper Midwest varies depending on property value and location. Higher value commercial properties are at the greatest disadvantage – a trend which has existed for many years. Minnesota’s commercial tax burden ranges from 11.8% below the regional average for the $100,000 urban property to 12.8% above the regional average for the $25 million urban property; and from 15.8% below the regional average for the $100,000 rural property to 6.3% above the regional average for the $25 million rural property. Minnesota is at the greatest disadvantage with South Dakota: the tax burden is 75% to 129% higher in Minneapolis than in Sioux Falls on properties of equal value; and the tax burden is 16% to 52% higher in Glencoe than in Sisseton on properties of equal value (Table 23).
at least five of the seven property tax studies MTA released between payable 1998 and payable 2007; meaning that these states generally provide little or no property tax subsidy to homeowners.
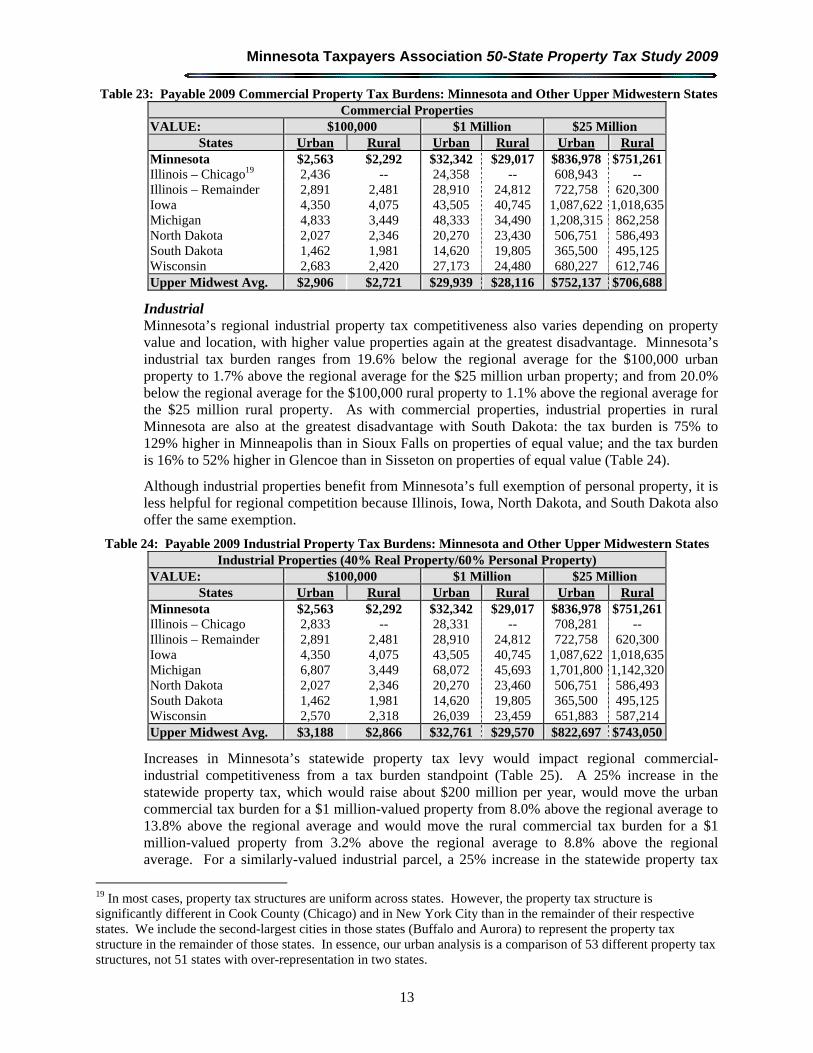
Minnesota Taxpayers Association 50-State Property Tax Study 2009
13
Table 23: Payable 2009 Commercial Property Tax Burdens: Minnesota and Other Upper Midwestern States Commercial Properties
VALUE: $100,000 $1 Million $25 Million States Urban Rural Urban Rural Urban Rural
Minnesota $2,563 $2,292 $32,342 $29,017 $836,978 $751,261Illinois – Chicago19 2,436 -- 24,358 -- 608,943 -- Illinois – Remainder 2,891 2,481 28,910 24,812 722,758 620,300Iowa 4,350 4,075 43,505 40,745 1,087,622 1,018,635Michigan 4,833 3,449 48,333 34,490 1,208,315 862,258North Dakota 2,027 2,346 20,270 23,430 506,751 586,493South Dakota 1,462 1,981 14,620 19,805 365,500 495,125Wisconsin 2,683 2,420 27,173 24,480 680,227 612,746Upper Midwest Avg. $2,906 $2,721 $29,939 $28,116 $752,137 $706,688
Industrial Minnesota’s regional industrial property tax competitiveness also varies depending on property value and location, with higher value properties again at the greatest disadvantage. Minnesota’s industrial tax burden ranges from 19.6% below the regional average for the $100,000 urban property to 1.7% above the regional average for the $25 million urban property; and from 20.0% below the regional average for the $100,000 rural property to 1.1% above the regional average for the $25 million rural property. As with commercial properties, industrial properties in rural Minnesota are also at the greatest disadvantage with South Dakota: the tax burden is 75% to 129% higher in Minneapolis than in Sioux Falls on properties of equal value; and the tax burden is 16% to 52% higher in Glencoe than in Sisseton on properties of equal value (Table 24).
Although industrial properties benefit from Minnesota’s full exemption of personal property, it is less helpful for regional competition because Illinois, Iowa, North Dakota, and South Dakota also offer the same exemption.
Table 24: Payable 2009 Industrial Property Tax Burdens: Minnesota and Other Upper Midwestern States Industrial Properties (40% Real Property/60% Personal Property)
VALUE: $100,000 $1 Million $25 Million States Urban Rural Urban Rural Urban Rural
Minnesota $2,563 $2,292 $32,342 $29,017 $836,978 $751,261Illinois – Chicago 2,833 -- 28,331 -- 708,281 -- Illinois – Remainder 2,891 2,481 28,910 24,812 722,758 620,300Iowa 4,350 4,075 43,505 40,745 1,087,622 1,018,635Michigan 6,807 3,449 68,072 45,693 1,701,800 1,142,320North Dakota 2,027 2,346 20,270 23,460 506,751 586,493South Dakota 1,462 1,981 14,620 19,805 365,500 495,125Wisconsin 2,570 2,318 26,039 23,459 651,883 587,214Upper Midwest Avg. $3,188 $2,866 $32,761 $29,570 $822,697 $743,050
Increases in Minnesota’s statewide property tax levy would impact regional commercial-industrial competitiveness from a tax burden standpoint (Table 25). A 25% increase in the statewide property tax, which would raise about $200 million per year, would move the urban commercial tax burden for a $1 million-valued property from 8.0% above the regional average to 13.8% above the regional average and would move the rural commercial tax burden for a $1 million-valued property from 3.2% above the regional average to 8.8% above the regional average. For a similarly-valued industrial parcel, a 25% increase in the statewide property tax
19 In most cases, property tax structures are uniform across states. However, the property tax structure is significantly different in Cook County (Chicago) and in New York City than in the remainder of their respective states. We include the second-largest cities in those states (Buffalo and Aurora) to represent the property tax structure in the remainder of those states. In essence, our urban analysis is a comparison of 53 different property tax structures, not 51 states with over-representation in two states.
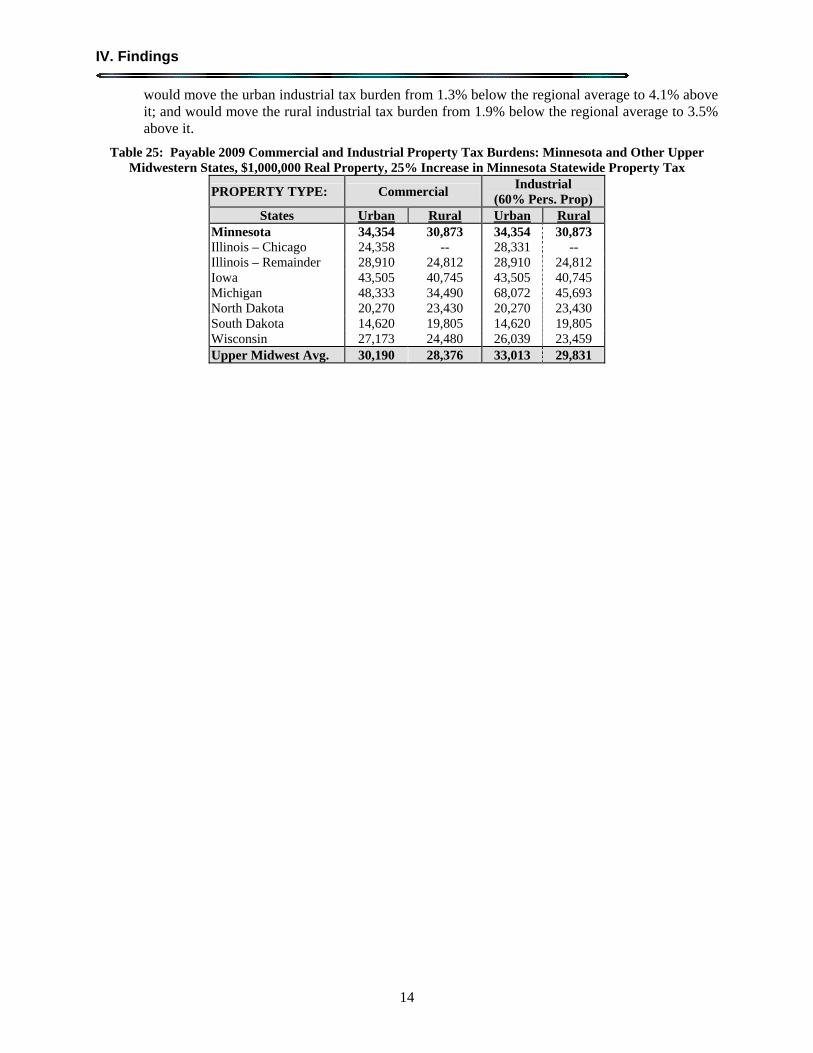
IV. Findings
14
would move the urban industrial tax burden from 1.3% below the regional average to 4.1% above it; and would move the rural industrial tax burden from 1.9% below the regional average to 3.5% above it.
Table 25: Payable 2009 Commercial and Industrial Property Tax Burdens: Minnesota and Other Upper Midwestern States, $1,000,000 Real Property, 25% Increase in Minnesota Statewide Property Tax
PROPERTY TYPE: Commercial Industrial
(60% Pers. Prop) States Urban Rural Urban Rural
Minnesota 34,354 30,873 34,354 30,873 Illinois – Chicago 24,358 -- 28,331 -- Illinois – Remainder 28,910 24,812 28,910 24,812 Iowa 43,505 40,745 43,505 40,745 Michigan 48,333 34,490 68,072 45,693 North Dakota 20,270 23,430 20,270 23,430 South Dakota 14,620 19,805 14,620 19,805 Wisconsin 27,173 24,480 26,039 23,459 Upper Midwest Avg. 30,190 28,376 33,013 29,831
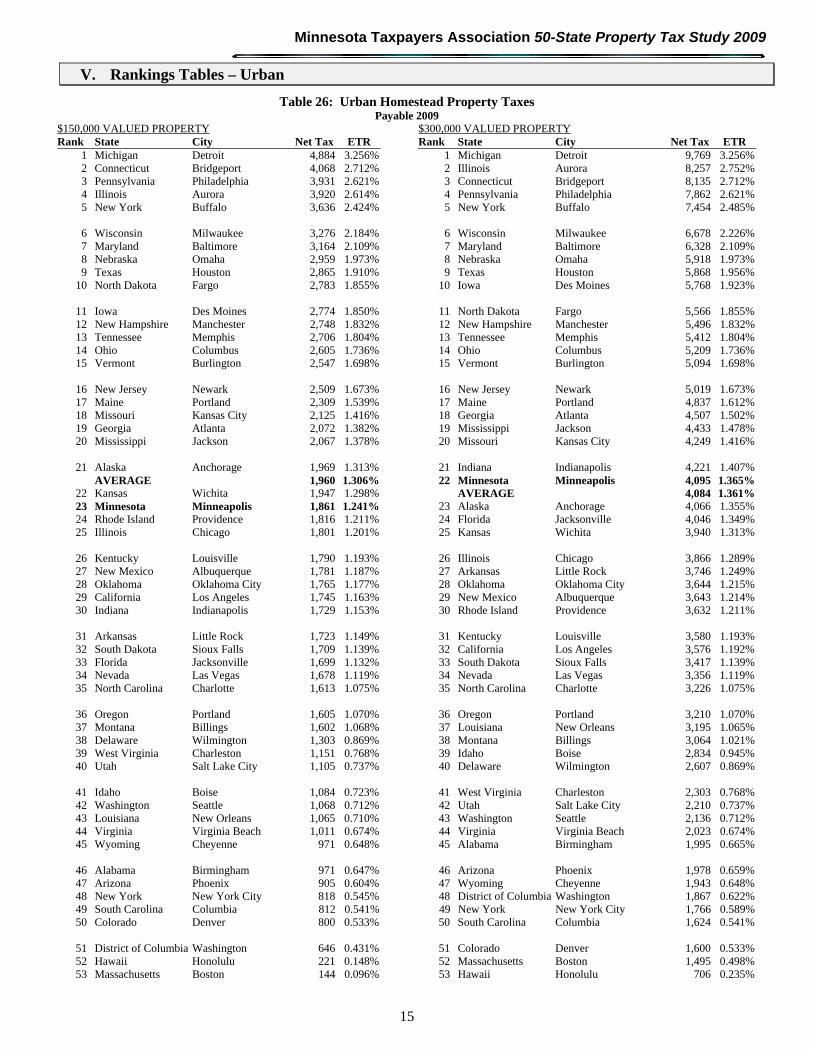
Minnesota Taxpayers Association 50-State Property Tax Study 2009
15
V. Rankings Tables – Urban
Table 26: Urban Homestead Property Taxes Payable 2009
$150,000 VALUED PROPERTY $300,000 VALUED PROPERTY Rank State City Net Tax ETR Rank State City Net Tax ETR
1 Michigan Detroit 4,884 3.256% 1 Michigan Detroit 9,769 3.256%2 Connecticut Bridgeport 4,068 2.712% 2 Illinois Aurora 8,257 2.752%3 Pennsylvania Philadelphia 3,931 2.621% 3 Connecticut Bridgeport 8,135 2.712%4 Illinois Aurora 3,920 2.614% 4 Pennsylvania Philadelphia 7,862 2.621%5 New York Buffalo 3,636 2.424% 5 New York Buffalo 7,454 2.485%
6 Wisconsin Milwaukee 3,276 2.184% 6 Wisconsin Milwaukee 6,678 2.226%7 Maryland Baltimore 3,164 2.109% 7 Maryland Baltimore 6,328 2.109%8 Nebraska Omaha 2,959 1.973% 8 Nebraska Omaha 5,918 1.973%9 Texas Houston 2,865 1.910% 9 Texas Houston 5,868 1.956%
10 North Dakota Fargo 2,783 1.855% 10 Iowa Des Moines 5,768 1.923%
11 Iowa Des Moines 2,774 1.850% 11 North Dakota Fargo 5,566 1.855%12 New Hampshire Manchester 2,748 1.832% 12 New Hampshire Manchester 5,496 1.832%13 Tennessee Memphis 2,706 1.804% 13 Tennessee Memphis 5,412 1.804%14 Ohio Columbus 2,605 1.736% 14 Ohio Columbus 5,209 1.736%15 Vermont Burlington 2,547 1.698% 15 Vermont Burlington 5,094 1.698%
16 New Jersey Newark 2,509 1.673% 16 New Jersey Newark 5,019 1.673%17 Maine Portland 2,309 1.539% 17 Maine Portland 4,837 1.612%18 Missouri Kansas City 2,125 1.416% 18 Georgia Atlanta 4,507 1.502%19 Georgia Atlanta 2,072 1.382% 19 Mississippi Jackson 4,433 1.478%20 Mississippi Jackson 2,067 1.378% 20 Missouri Kansas City 4,249 1.416%
21 Alaska Anchorage 1,969 1.313% 21 Indiana Indianapolis 4,221 1.407%
AVERAGE 1,960 1.306% 22 Minnesota Minneapolis 4,095 1.365%22 Kansas Wichita 1,947 1.298% AVERAGE 4,084 1.361%23 Minnesota Minneapolis 1,861 1.241% 23 Alaska Anchorage 4,066 1.355%24 Rhode Island Providence 1,816 1.211% 24 Florida Jacksonville 4,046 1.349%25 Illinois Chicago 1,801 1.201% 25 Kansas Wichita 3,940 1.313%
26 Kentucky Louisville 1,790 1.193% 26 Illinois Chicago 3,866 1.289%27 New Mexico Albuquerque 1,781 1.187% 27 Arkansas Little Rock 3,746 1.249%28 Oklahoma Oklahoma City 1,765 1.177% 28 Oklahoma Oklahoma City 3,644 1.215%29 California Los Angeles 1,745 1.163% 29 New Mexico Albuquerque 3,643 1.214%30 Indiana Indianapolis 1,729 1.153% 30 Rhode Island Providence 3,632 1.211%
31 Arkansas Little Rock 1,723 1.149% 31 Kentucky Louisville 3,580 1.193%32 South Dakota Sioux Falls 1,709 1.139% 32 California Los Angeles 3,576 1.192%33 Florida Jacksonville 1,699 1.132% 33 South Dakota Sioux Falls 3,417 1.139%34 Nevada Las Vegas 1,678 1.119% 34 Nevada Las Vegas 3,356 1.119%35 North Carolina Charlotte 1,613 1.075% 35 North Carolina Charlotte 3,226 1.075%
36 Oregon Portland 1,605 1.070% 36 Oregon Portland 3,210 1.070%37 Montana Billings 1,602 1.068% 37 Louisiana New Orleans 3,195 1.065%38 Delaware Wilmington 1,303 0.869% 38 Montana Billings 3,064 1.021%39 West Virginia Charleston 1,151 0.768% 39 Idaho Boise 2,834 0.945%40 Utah Salt Lake City 1,105 0.737% 40 Delaware Wilmington 2,607 0.869%
41 Idaho Boise 1,084 0.723% 41 West Virginia Charleston 2,303 0.768%42 Washington Seattle 1,068 0.712% 42 Utah Salt Lake City 2,210 0.737%43 Louisiana New Orleans 1,065 0.710% 43 Washington Seattle 2,136 0.712%44 Virginia Virginia Beach 1,011 0.674% 44 Virginia Virginia Beach 2,023 0.674%45 Wyoming Cheyenne 971 0.648% 45 Alabama Birmingham 1,995 0.665%
46 Alabama Birmingham 971 0.647% 46 Arizona Phoenix 1,978 0.659%47 Arizona Phoenix 905 0.604% 47 Wyoming Cheyenne 1,943 0.648%48 New York New York City 818 0.545% 48 District of Columbia Washington 1,867 0.622%49 South Carolina Columbia 812 0.541% 49 New York New York City 1,766 0.589%50 Colorado Denver 800 0.533% 50 South Carolina Columbia 1,624 0.541%
51 District of Columbia Washington 646 0.431% 51 Colorado Denver 1,600 0.533%52 Hawaii Honolulu 221 0.148% 52 Massachusetts Boston 1,495 0.498%53 Massachusetts Boston 144 0.096% 53 Hawaii Honolulu 706 0.235%
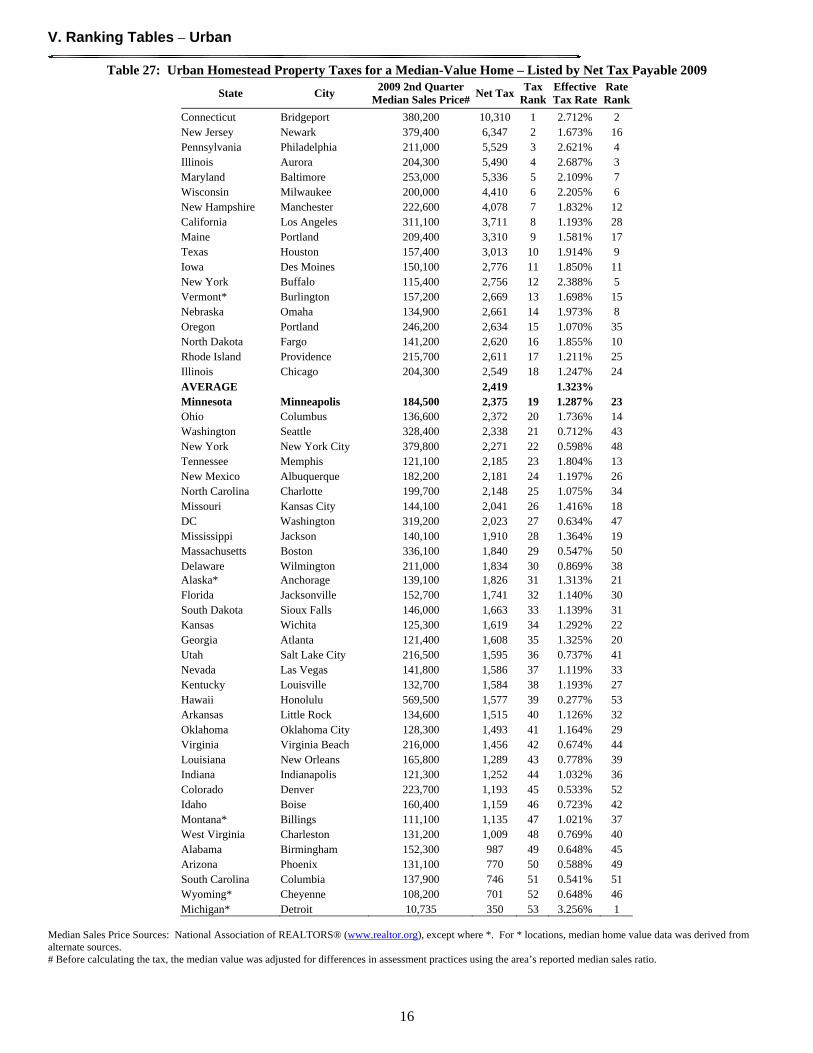
V. Ranking Tables – Urban
16
Table 27: Urban Homestead Property Taxes for a Median-Value Home – Listed by Net Tax Payable 2009
State City 2009 2nd Quarter
Median Sales Price#Net Tax
Tax Rank
Effective Tax Rate
Rate Rank
Connecticut Bridgeport 380,200 10,310 1 2.712% 2 New Jersey Newark 379,400 6,347 2 1.673% 16 Pennsylvania Philadelphia 211,000 5,529 3 2.621% 4 Illinois Aurora 204,300 5,490 4 2.687% 3 Maryland Baltimore 253,000 5,336 5 2.109% 7 Wisconsin Milwaukee 200,000 4,410 6 2.205% 6 New Hampshire Manchester 222,600 4,078 7 1.832% 12 California Los Angeles 311,100 3,711 8 1.193% 28 Maine Portland 209,400 3,310 9 1.581% 17 Texas Houston 157,400 3,013 10 1.914% 9 Iowa Des Moines 150,100 2,776 11 1.850% 11 New York Buffalo 115,400 2,756 12 2.388% 5 Vermont* Burlington 157,200 2,669 13 1.698% 15 Nebraska Omaha 134,900 2,661 14 1.973% 8 Oregon Portland 246,200 2,634 15 1.070% 35 North Dakota Fargo 141,200 2,620 16 1.855% 10 Rhode Island Providence 215,700 2,611 17 1.211% 25 Illinois Chicago 204,300 2,549 18 1.247% 24 AVERAGE 2,419 1.323% Minnesota Minneapolis 184,500 2,375 19 1.287% 23 Ohio Columbus 136,600 2,372 20 1.736% 14 Washington Seattle 328,400 2,338 21 0.712% 43 New York New York City 379,800 2,271 22 0.598% 48 Tennessee Memphis 121,100 2,185 23 1.804% 13 New Mexico Albuquerque 182,200 2,181 24 1.197% 26 North Carolina Charlotte 199,700 2,148 25 1.075% 34 Missouri Kansas City 144,100 2,041 26 1.416% 18 DC Washington 319,200 2,023 27 0.634% 47 Mississippi Jackson 140,100 1,910 28 1.364% 19 Massachusetts Boston 336,100 1,840 29 0.547% 50 Delaware Wilmington 211,000 1,834 30 0.869% 38 Alaska* Anchorage 139,100 1,826 31 1.313% 21 Florida Jacksonville 152,700 1,741 32 1.140% 30 South Dakota Sioux Falls 146,000 1,663 33 1.139% 31 Kansas Wichita 125,300 1,619 34 1.292% 22 Georgia Atlanta 121,400 1,608 35 1.325% 20 Utah Salt Lake City 216,500 1,595 36 0.737% 41 Nevada Las Vegas 141,800 1,586 37 1.119% 33 Kentucky Louisville 132,700 1,584 38 1.193% 27 Hawaii Honolulu 569,500 1,577 39 0.277% 53 Arkansas Little Rock 134,600 1,515 40 1.126% 32 Oklahoma Oklahoma City 128,300 1,493 41 1.164% 29 Virginia Virginia Beach 216,000 1,456 42 0.674% 44 Louisiana New Orleans 165,800 1,289 43 0.778% 39 Indiana Indianapolis 121,300 1,252 44 1.032% 36 Colorado Denver 223,700 1,193 45 0.533% 52 Idaho Boise 160,400 1,159 46 0.723% 42 Montana* Billings 111,100 1,135 47 1.021% 37 West Virginia Charleston 131,200 1,009 48 0.769% 40 Alabama Birmingham 152,300 987 49 0.648% 45 Arizona Phoenix 131,100 770 50 0.588% 49 South Carolina Columbia 137,900 746 51 0.541% 51 Wyoming* Cheyenne 108,200 701 52 0.648% 46 Michigan* Detroit 10,735 350 53 3.256% 1
Median Sales Price Sources: National Association of REALTORS® (www.realtor.org), except where *. For * locations, median home value data was derived from alternate sources. # Before calculating the tax, the median value was adjusted for differences in assessment practices using the area’s reported median sales ratio.
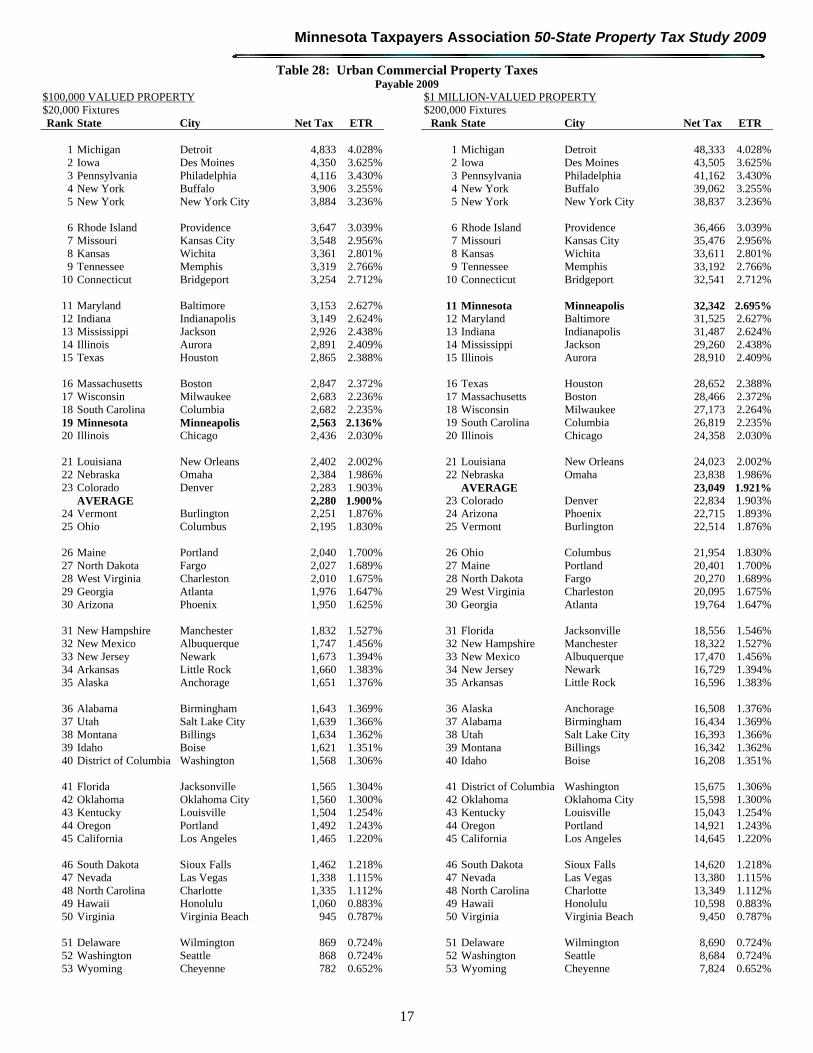
Minnesota Taxpayers Association 50-State Property Tax Study 2009
17
Table 28: Urban Commercial Property Taxes Payable 2009
$100,000 VALUED PROPERTY $1 MILLION-VALUED PROPERTY $20,000 Fixtures $200,000 Fixtures Rank State City Net Tax ETR Rank State City Net Tax ETR
1 Michigan Detroit 4,833 4.028% 1 Michigan Detroit 48,333 4.028%2 Iowa Des Moines 4,350 3.625% 2 Iowa Des Moines 43,505 3.625%3 Pennsylvania Philadelphia 4,116 3.430% 3 Pennsylvania Philadelphia 41,162 3.430%4 New York Buffalo 3,906 3.255% 4 New York Buffalo 39,062 3.255%5 New York New York City 3,884 3.236% 5 New York New York City 38,837 3.236%
6 Rhode Island Providence 3,647 3.039% 6 Rhode Island Providence 36,466 3.039%7 Missouri Kansas City 3,548 2.956% 7 Missouri Kansas City 35,476 2.956%8 Kansas Wichita 3,361 2.801% 8 Kansas Wichita 33,611 2.801%9 Tennessee Memphis 3,319 2.766% 9 Tennessee Memphis 33,192 2.766%
10 Connecticut Bridgeport 3,254 2.712% 10 Connecticut Bridgeport 32,541 2.712%
11 Maryland Baltimore 3,153 2.627% 11 Minnesota Minneapolis 32,342 2.695%12 Indiana Indianapolis 3,149 2.624% 12 Maryland Baltimore 31,525 2.627%13 Mississippi Jackson 2,926 2.438% 13 Indiana Indianapolis 31,487 2.624%14 Illinois Aurora 2,891 2.409% 14 Mississippi Jackson 29,260 2.438%15 Texas Houston 2,865 2.388% 15 Illinois Aurora 28,910 2.409%
16 Massachusetts Boston 2,847 2.372% 16 Texas Houston 28,652 2.388%17 Wisconsin Milwaukee 2,683 2.236% 17 Massachusetts Boston 28,466 2.372%18 South Carolina Columbia 2,682 2.235% 18 Wisconsin Milwaukee 27,173 2.264%19 Minnesota Minneapolis 2,563 2.136% 19 South Carolina Columbia 26,819 2.235%20 Illinois Chicago 2,436 2.030% 20 Illinois Chicago 24,358 2.030%
21 Louisiana New Orleans 2,402 2.002% 21 Louisiana New Orleans 24,023 2.002%22 Nebraska Omaha 2,384 1.986% 22 Nebraska Omaha 23,838 1.986%23 Colorado Denver 2,283 1.903% AVERAGE 23,049 1.921%
AVERAGE 2,280 1.900% 23 Colorado Denver 22,834 1.903%24 Vermont Burlington 2,251 1.876% 24 Arizona Phoenix 22,715 1.893%25 Ohio Columbus 2,195 1.830% 25 Vermont Burlington 22,514 1.876%
26 Maine Portland 2,040 1.700% 26 Ohio Columbus 21,954 1.830%27 North Dakota Fargo 2,027 1.689% 27 Maine Portland 20,401 1.700%28 West Virginia Charleston 2,010 1.675% 28 North Dakota Fargo 20,270 1.689%29 Georgia Atlanta 1,976 1.647% 29 West Virginia Charleston 20,095 1.675%30 Arizona Phoenix 1,950 1.625% 30 Georgia Atlanta 19,764 1.647%
31 New Hampshire Manchester 1,832 1.527% 31 Florida Jacksonville 18,556 1.546%32 New Mexico Albuquerque 1,747 1.456% 32 New Hampshire Manchester 18,322 1.527%33 New Jersey Newark 1,673 1.394% 33 New Mexico Albuquerque 17,470 1.456%34 Arkansas Little Rock 1,660 1.383% 34 New Jersey Newark 16,729 1.394%35 Alaska Anchorage 1,651 1.376% 35 Arkansas Little Rock 16,596 1.383%
36 Alabama Birmingham 1,643 1.369% 36 Alaska Anchorage 16,508 1.376%37 Utah Salt Lake City 1,639 1.366% 37 Alabama Birmingham 16,434 1.369%38 Montana Billings 1,634 1.362% 38 Utah Salt Lake City 16,393 1.366%39 Idaho Boise 1,621 1.351% 39 Montana Billings 16,342 1.362%40 District of Columbia Washington 1,568 1.306% 40 Idaho Boise 16,208 1.351%
41 Florida Jacksonville 1,565 1.304% 41 District of Columbia Washington 15,675 1.306%42 Oklahoma Oklahoma City 1,560 1.300% 42 Oklahoma Oklahoma City 15,598 1.300%43 Kentucky Louisville 1,504 1.254% 43 Kentucky Louisville 15,043 1.254%44 Oregon Portland 1,492 1.243% 44 Oregon Portland 14,921 1.243%45 California Los Angeles 1,465 1.220% 45 California Los Angeles 14,645 1.220%
46 South Dakota Sioux Falls 1,462 1.218% 46 South Dakota Sioux Falls 14,620 1.218%47 Nevada Las Vegas 1,338 1.115% 47 Nevada Las Vegas 13,380 1.115%48 North Carolina Charlotte 1,335 1.112% 48 North Carolina Charlotte 13,349 1.112%49 Hawaii Honolulu 1,060 0.883% 49 Hawaii Honolulu 10,598 0.883%50 Virginia Virginia Beach 945 0.787% 50 Virginia Virginia Beach 9,450 0.787%
51 Delaware Wilmington 869 0.724% 51 Delaware Wilmington 8,690 0.724%52 Washington Seattle 868 0.724% 52 Washington Seattle 8,684 0.724%53 Wyoming Cheyenne 782 0.652% 53 Wyoming Cheyenne 7,824 0.652%
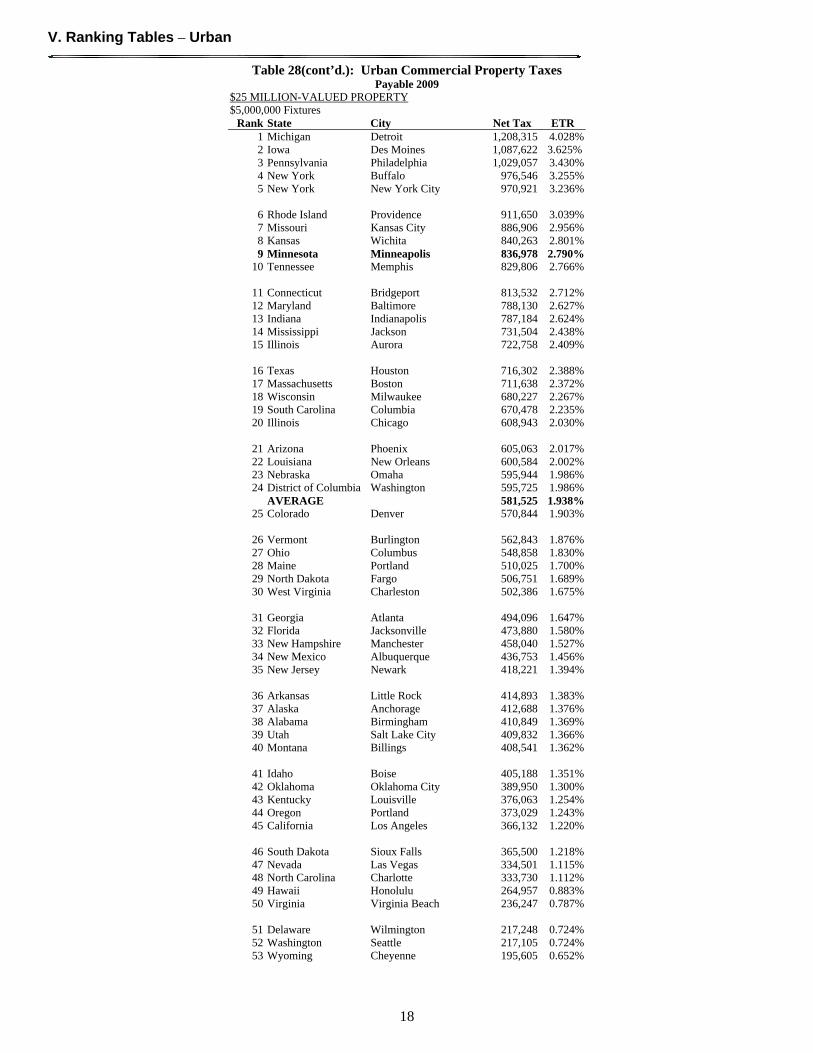
V. Ranking Tables – Urban
18
Table 28(cont’d.): Urban Commercial Property Taxes Payable 2009
$25 MILLION-VALUED PROPERTY $5,000,000 Fixtures
Rank State City Net Tax ETR 1 Michigan Detroit 1,208,315 4.028% 2 Iowa Des Moines 1,087,622 3.625% 3 Pennsylvania Philadelphia 1,029,057 3.430% 4 New York Buffalo 976,546 3.255% 5 New York New York City 970,921 3.236%
6 Rhode Island Providence 911,650 3.039% 7 Missouri Kansas City 886,906 2.956% 8 Kansas Wichita 840,263 2.801% 9 Minnesota Minneapolis 836,978 2.790%
10 Tennessee Memphis 829,806 2.766%
11 Connecticut Bridgeport 813,532 2.712% 12 Maryland Baltimore 788,130 2.627% 13 Indiana Indianapolis 787,184 2.624% 14 Mississippi Jackson 731,504 2.438% 15 Illinois Aurora 722,758 2.409%
16 Texas Houston 716,302 2.388% 17 Massachusetts Boston 711,638 2.372% 18 Wisconsin Milwaukee 680,227 2.267% 19 South Carolina Columbia 670,478 2.235% 20 Illinois Chicago 608,943 2.030%
21 Arizona Phoenix 605,063 2.017% 22 Louisiana New Orleans 600,584 2.002% 23 Nebraska Omaha 595,944 1.986% 24 District of Columbia Washington 595,725 1.986%
AVERAGE 581,525 1.938% 25 Colorado Denver 570,844 1.903%
26 Vermont Burlington 562,843 1.876% 27 Ohio Columbus 548,858 1.830% 28 Maine Portland 510,025 1.700% 29 North Dakota Fargo 506,751 1.689% 30 West Virginia Charleston 502,386 1.675%
31 Georgia Atlanta 494,096 1.647% 32 Florida Jacksonville 473,880 1.580% 33 New Hampshire Manchester 458,040 1.527% 34 New Mexico Albuquerque 436,753 1.456% 35 New Jersey Newark 418,221 1.394%
36 Arkansas Little Rock 414,893 1.383% 37 Alaska Anchorage 412,688 1.376% 38 Alabama Birmingham 410,849 1.369% 39 Utah Salt Lake City 409,832 1.366% 40 Montana Billings 408,541 1.362%
41 Idaho Boise 405,188 1.351% 42 Oklahoma Oklahoma City 389,950 1.300% 43 Kentucky Louisville 376,063 1.254% 44 Oregon Portland 373,029 1.243% 45 California Los Angeles 366,132 1.220%
46 South Dakota Sioux Falls 365,500 1.218% 47 Nevada Las Vegas 334,501 1.115% 48 North Carolina Charlotte 333,730 1.112% 49 Hawaii Honolulu 264,957 0.883% 50 Virginia Virginia Beach 236,247 0.787%
51 Delaware Wilmington 217,248 0.724% 52 Washington Seattle 217,105 0.724% 53 Wyoming Cheyenne 195,605 0.652%
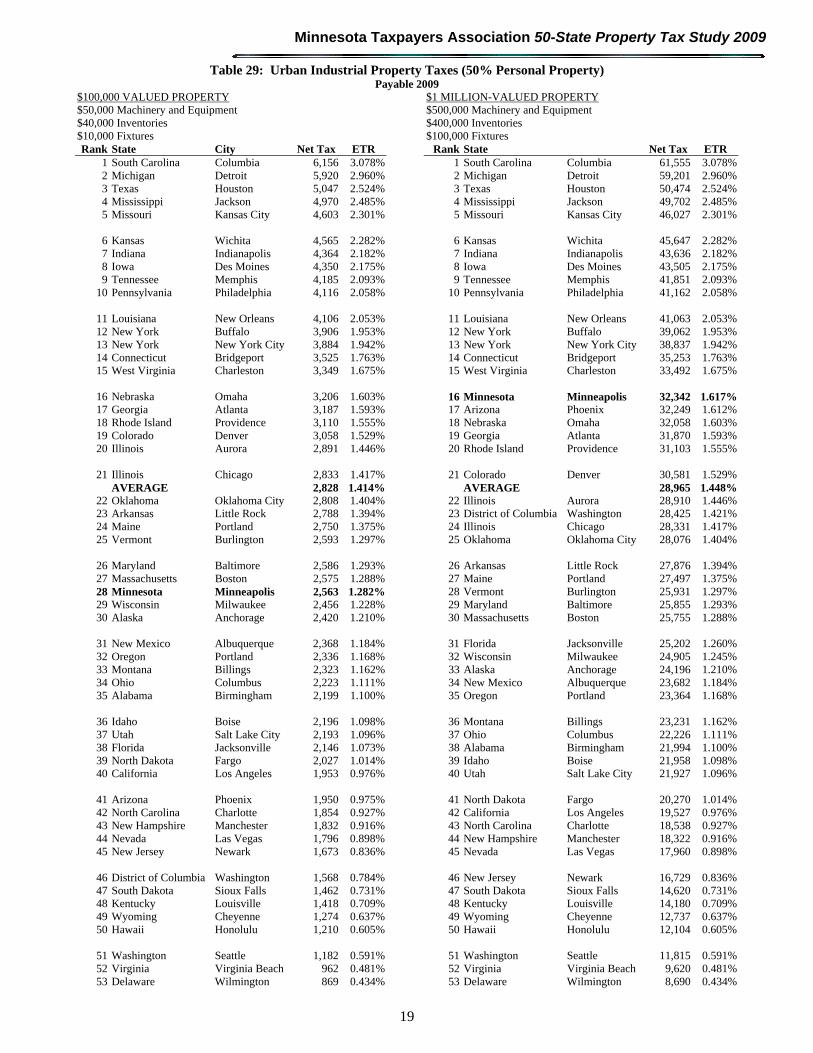
Minnesota Taxpayers Association 50-State Property Tax Study 2009
19
Table 29: Urban Industrial Property Taxes (50% Personal Property) Payable 2009
$100,000 VALUED PROPERTY $1 MILLION-VALUED PROPERTY $50,000 Machinery and Equipment $500,000 Machinery and Equipment $40,000 Inventories $400,000 Inventories $10,000 Fixtures $100,000 Fixtures Rank State City Net Tax ETR Rank State Net Tax ETR
1 South Carolina Columbia 6,156 3.078% 1 South Carolina Columbia 61,555 3.078%2 Michigan Detroit 5,920 2.960% 2 Michigan Detroit 59,201 2.960%3 Texas Houston 5,047 2.524% 3 Texas Houston 50,474 2.524%4 Mississippi Jackson 4,970 2.485% 4 Mississippi Jackson 49,702 2.485%5 Missouri Kansas City 4,603 2.301% 5 Missouri Kansas City 46,027 2.301%
6 Kansas Wichita 4,565 2.282% 6 Kansas Wichita 45,647 2.282%7 Indiana Indianapolis 4,364 2.182% 7 Indiana Indianapolis 43,636 2.182%8 Iowa Des Moines 4,350 2.175% 8 Iowa Des Moines 43,505 2.175%9 Tennessee Memphis 4,185 2.093% 9 Tennessee Memphis 41,851 2.093%
10 Pennsylvania Philadelphia 4,116 2.058% 10 Pennsylvania Philadelphia 41,162 2.058%
11 Louisiana New Orleans 4,106 2.053% 11 Louisiana New Orleans 41,063 2.053%12 New York Buffalo 3,906 1.953% 12 New York Buffalo 39,062 1.953%13 New York New York City 3,884 1.942% 13 New York New York City 38,837 1.942%14 Connecticut Bridgeport 3,525 1.763% 14 Connecticut Bridgeport 35,253 1.763%15 West Virginia Charleston 3,349 1.675% 15 West Virginia Charleston 33,492 1.675%
16 Nebraska Omaha 3,206 1.603% 16 Minnesota Minneapolis 32,342 1.617%17 Georgia Atlanta 3,187 1.593% 17 Arizona Phoenix 32,249 1.612%18 Rhode Island Providence 3,110 1.555% 18 Nebraska Omaha 32,058 1.603%19 Colorado Denver 3,058 1.529% 19 Georgia Atlanta 31,870 1.593%20 Illinois Aurora 2,891 1.446% 20 Rhode Island Providence 31,103 1.555%
21 Illinois Chicago 2,833 1.417% 21 Colorado Denver 30,581 1.529%
AVERAGE 2,828 1.414% AVERAGE 28,965 1.448%22 Oklahoma Oklahoma City 2,808 1.404% 22 Illinois Aurora 28,910 1.446%23 Arkansas Little Rock 2,788 1.394% 23 District of Columbia Washington 28,425 1.421%24 Maine Portland 2,750 1.375% 24 Illinois Chicago 28,331 1.417%25 Vermont Burlington 2,593 1.297% 25 Oklahoma Oklahoma City 28,076 1.404%
26 Maryland Baltimore 2,586 1.293% 26 Arkansas Little Rock 27,876 1.394%27 Massachusetts Boston 2,575 1.288% 27 Maine Portland 27,497 1.375%28 Minnesota Minneapolis 2,563 1.282% 28 Vermont Burlington 25,931 1.297%29 Wisconsin Milwaukee 2,456 1.228% 29 Maryland Baltimore 25,855 1.293%30 Alaska Anchorage 2,420 1.210% 30 Massachusetts Boston 25,755 1.288%
31 New Mexico Albuquerque 2,368 1.184% 31 Florida Jacksonville 25,202 1.260%32 Oregon Portland 2,336 1.168% 32 Wisconsin Milwaukee 24,905 1.245%33 Montana Billings 2,323 1.162% 33 Alaska Anchorage 24,196 1.210%34 Ohio Columbus 2,223 1.111% 34 New Mexico Albuquerque 23,682 1.184%35 Alabama Birmingham 2,199 1.100% 35 Oregon Portland 23,364 1.168%
36 Idaho Boise 2,196 1.098% 36 Montana Billings 23,231 1.162%37 Utah Salt Lake City 2,193 1.096% 37 Ohio Columbus 22,226 1.111%38 Florida Jacksonville 2,146 1.073% 38 Alabama Birmingham 21,994 1.100%39 North Dakota Fargo 2,027 1.014% 39 Idaho Boise 21,958 1.098%40 California Los Angeles 1,953 0.976% 40 Utah Salt Lake City 21,927 1.096%
41 Arizona Phoenix 1,950 0.975% 41 North Dakota Fargo 20,270 1.014%42 North Carolina Charlotte 1,854 0.927% 42 California Los Angeles 19,527 0.976%43 New Hampshire Manchester 1,832 0.916% 43 North Carolina Charlotte 18,538 0.927%44 Nevada Las Vegas 1,796 0.898% 44 New Hampshire Manchester 18,322 0.916%45 New Jersey Newark 1,673 0.836% 45 Nevada Las Vegas 17,960 0.898%
46 District of Columbia Washington 1,568 0.784% 46 New Jersey Newark 16,729 0.836%47 South Dakota Sioux Falls 1,462 0.731% 47 South Dakota Sioux Falls 14,620 0.731%48 Kentucky Louisville 1,418 0.709% 48 Kentucky Louisville 14,180 0.709%49 Wyoming Cheyenne 1,274 0.637% 49 Wyoming Cheyenne 12,737 0.637%50 Hawaii Honolulu 1,210 0.605% 50 Hawaii Honolulu 12,104 0.605%
51 Washington Seattle 1,182 0.591% 51 Washington Seattle 11,815 0.591%52 Virginia Virginia Beach 962 0.481% 52 Virginia Virginia Beach 9,620 0.481%53 Delaware Wilmington 869 0.434% 53 Delaware Wilmington 8,690 0.434%
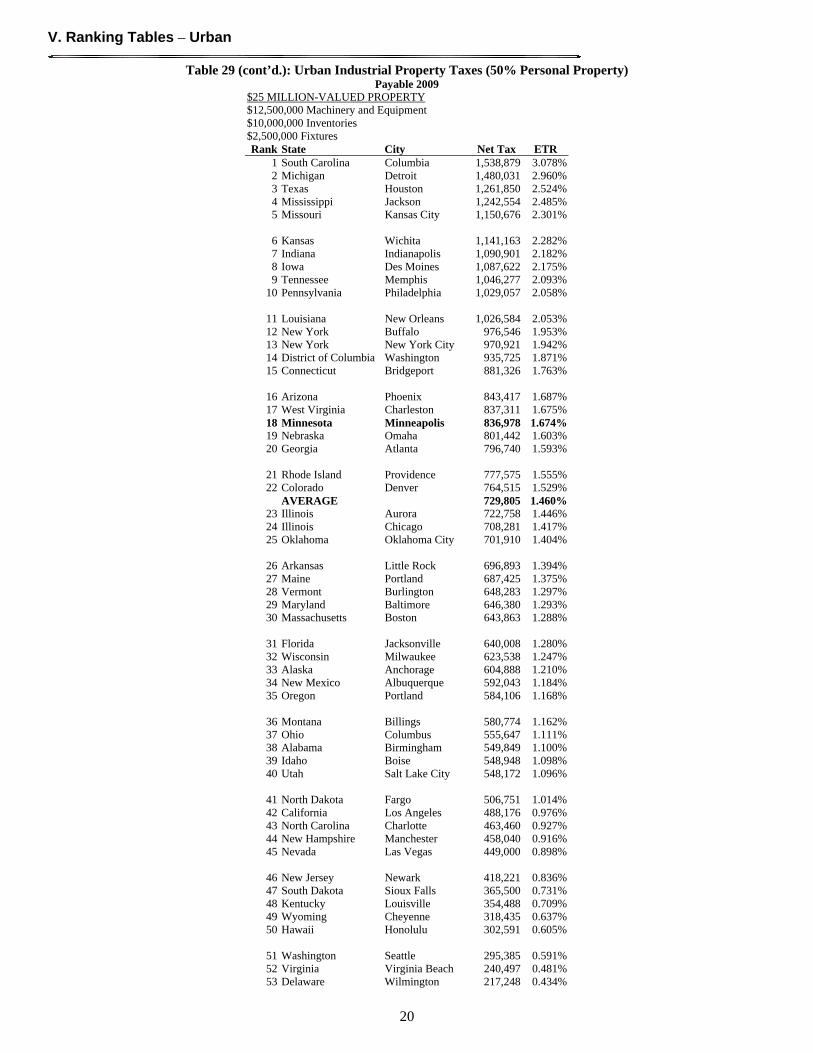
V. Ranking Tables – Urban
20
Table 29 (cont’d.): Urban Industrial Property Taxes (50% Personal Property) Payable 2009
$25 MILLION-VALUED PROPERTY $12,500,000 Machinery and Equipment $10,000,000 Inventories $2,500,000 Fixtures Rank State City Net Tax ETR
1 South Carolina Columbia 1,538,879 3.078%2 Michigan Detroit 1,480,031 2.960%3 Texas Houston 1,261,850 2.524%4 Mississippi Jackson 1,242,554 2.485%5 Missouri Kansas City 1,150,676 2.301%
6 Kansas Wichita 1,141,163 2.282%7 Indiana Indianapolis 1,090,901 2.182%8 Iowa Des Moines 1,087,622 2.175%9 Tennessee Memphis 1,046,277 2.093%
10 Pennsylvania Philadelphia 1,029,057 2.058%
11 Louisiana New Orleans 1,026,584 2.053%12 New York Buffalo 976,546 1.953%13 New York New York City 970,921 1.942%14 District of Columbia Washington 935,725 1.871%15 Connecticut Bridgeport 881,326 1.763%
16 Arizona Phoenix 843,417 1.687%17 West Virginia Charleston 837,311 1.675%18 Minnesota Minneapolis 836,978 1.674%19 Nebraska Omaha 801,442 1.603%20 Georgia Atlanta 796,740 1.593%
21 Rhode Island Providence 777,575 1.555%22 Colorado Denver 764,515 1.529%
AVERAGE 729,805 1.460%23 Illinois Aurora 722,758 1.446%24 Illinois Chicago 708,281 1.417%25 Oklahoma Oklahoma City 701,910 1.404%
26 Arkansas Little Rock 696,893 1.394%27 Maine Portland 687,425 1.375%28 Vermont Burlington 648,283 1.297%29 Maryland Baltimore 646,380 1.293%30 Massachusetts Boston 643,863 1.288%
31 Florida Jacksonville 640,008 1.280%32 Wisconsin Milwaukee 623,538 1.247%33 Alaska Anchorage 604,888 1.210%34 New Mexico Albuquerque 592,043 1.184%35 Oregon Portland 584,106 1.168%
36 Montana Billings 580,774 1.162%37 Ohio Columbus 555,647 1.111%38 Alabama Birmingham 549,849 1.100%39 Idaho Boise 548,948 1.098%40 Utah Salt Lake City 548,172 1.096%
41 North Dakota Fargo 506,751 1.014%42 California Los Angeles 488,176 0.976%43 North Carolina Charlotte 463,460 0.927%44 New Hampshire Manchester 458,040 0.916%45 Nevada Las Vegas 449,000 0.898%
46 New Jersey Newark 418,221 0.836%47 South Dakota Sioux Falls 365,500 0.731%48 Kentucky Louisville 354,488 0.709%49 Wyoming Cheyenne 318,435 0.637%50 Hawaii Honolulu 302,591 0.605%
51 Washington Seattle 295,385 0.591%52 Virginia Virginia Beach 240,497 0.481%53 Delaware Wilmington 217,248 0.434%

Minnesota Taxpayers Association 50-State Property Tax Study 2009
21
Table 30: Urban Industrial Property Taxes (60% Personal Property) Payable 2009
$100,000 VALUED PROPERTY $1 MILLION-VALUED PROPERTY $75,000 Machinery and Equipment $750,000 Machinery and Equipment $60,000 Inventories $600,000 Inventories $15,000 Fixtures $150,000 Fixtures Rank State City Net Tax ETR Rank State Net Tax ETR
1 South Carolina Columbia 7,582 3.033% 1 South Carolina Columbia 75,816 3.033%2 Michigan Detroit 6,807 2.723% 2 Michigan Detroit 68,072 2.723%3 Texas Houston 6,309 2.524% 3 Texas Houston 63,093 2.524%4 Mississippi Jackson 6,248 2.499% 4 Mississippi Jackson 62,478 2.499%5 Kansas Wichita 5,467 2.187% 5 Kansas Wichita 54,674 2.187%
6 Missouri Kansas City 5,394 2.158% 6 Missouri Kansas City 53,940 2.158%7 Indiana Indianapolis 5,190 2.076% 7 Indiana Indianapolis 51,900 2.076%8 Louisiana New Orleans 5,171 2.069% 8 Louisiana New Orleans 51,713 2.069%9 Tennessee Memphis 4,835 1.934% 9 Tennessee Memphis 48,345 1.934%
10 Iowa Des Moines 4,350 1.740% 10 Iowa Des Moines 43,505 1.740%
11 West Virginia Charleston 4,187 1.675% 11 West Virginia Charleston 41,866 1.675%12 Pennsylvania Philadelphia 4,116 1.646% 12 Pennsylvania Philadelphia 41,162 1.646%13 Georgia Atlanta 3,969 1.588% 13 Georgia Atlanta 39,689 1.588%14 Connecticut Bridgeport 3,932 1.573% 14 Arizona Phoenix 39,400 1.576%15 New York Buffalo 3,906 1.562% 15 Connecticut Bridgeport 39,321 1.573%
16 New York New York City 3,884 1.553% 16 New York Buffalo 39,062 1.562%17 Nebraska Omaha 3,822 1.529% 17 New York New York City 38,837 1.553%18 Colorado Denver 3,639 1.456% 18 District of Columbia Washington 38,625 1.545%19 Oklahoma Oklahoma City 3,588 1.435% 19 Nebraska Omaha 38,223 1.529%20 Arkansas Little Rock 3,493 1.397% 20 Colorado Denver 36,391 1.456%
21 Rhode Island Providence 3,378 1.351% 21 Oklahoma Oklahoma City 35,875 1.435%22 Maine Portland 3,282 1.313% 22 Arkansas Little Rock 34,926 1.397%
AVERAGE 3,238 1.295% 23 Rhode Island Providence 33,785 1.351%23 Oregon Portland 2,970 1.188% AVERAGE 33,276 1.331%24 Alaska Anchorage 2,900 1.160% 24 Maine Portland 32,819 1.313%25 Illinois Aurora 2,891 1.156% 25 Minnesota Minneapolis 32,342 1.294%
26 Maryland Baltimore 2,869 1.148% 26 Florida Jacksonville 30,185 1.207%27 Vermont Burlington 2,849 1.140% 27 Oregon Portland 29,697 1.188%28 Montana Billings 2,840 1.136% 28 Alaska Anchorage 29,001 1.160%29 New Mexico Albuquerque 2,834 1.134% 29 Illinois Aurora 28,910 1.156%30 Illinois Chicago 2,833 1.133% 30 Maryland Baltimore 28,690 1.148%
31 Massachusetts Boston 2,711 1.084% 31 Vermont Burlington 28,495 1.140%32 Florida Jacksonville 2,645 1.058% 32 Montana Billings 28,398 1.136%33 Idaho Boise 2,627 1.051% 33 New Mexico Albuquerque 28,340 1.134%34 Alabama Birmingham 2,616 1.047% 34 Illinois Chicago 28,331 1.133%35 Utah Salt Lake City 2,608 1.043% 35 Massachusetts Boston 27,110 1.084%
36 Wisconsin Milwaukee 2,570 1.028% 36 Idaho Boise 26,271 1.051%37 Minnesota Minneapolis 2,563 1.025% 37 Alabama Birmingham 26,164 1.047%38 Arizona Phoenix 2,545 1.018% 38 Utah Salt Lake City 26,077 1.043%39 California Los Angeles 2,319 0.928% 39 Wisconsin Milwaukee 26,039 1.042%40 North Carolina Charlotte 2,243 0.897% 40 California Los Angeles 23,188 0.928%
41 Ohio Columbus 2,223 0.889% 41 North Carolina Charlotte 22,430 0.897%42 Nevada Las Vegas 2,139 0.856% 42 Ohio Columbus 22,226 0.889%43 North Dakota Fargo 2,027 0.811% 43 Nevada Las Vegas 21,395 0.856%44 New Hampshire Manchester 1,832 0.733% 44 North Dakota Fargo 20,270 0.811%45 New Jersey Newark 1,673 0.669% 45 New Hampshire Manchester 18,322 0.733%
46 District of Columbia Washington 1,568 0.627% 46 New Jersey Newark 16,729 0.669%47 Kentucky Louisville 1,556 0.622% 47 Kentucky Louisville 15,561 0.622%48 Wyoming Cheyenne 1,519 0.607% 48 Wyoming Cheyenne 15,187 0.607%49 South Dakota Sioux Falls 1,462 0.585% 49 South Dakota Sioux Falls 14,620 0.585%50 Washington Seattle 1,416 0.567% 50 Washington Seattle 14,164 0.567%
51 Hawaii Honolulu 1,210 0.484% 51 Hawaii Honolulu 12,104 0.484%52 Virginia Virginia Beach 1,118 0.447% 52 Virginia Virginia Beach 11,185 0.447%53 Delaware Wilmington 869 0.348% 53 Delaware Wilmington 8,690 0.348%
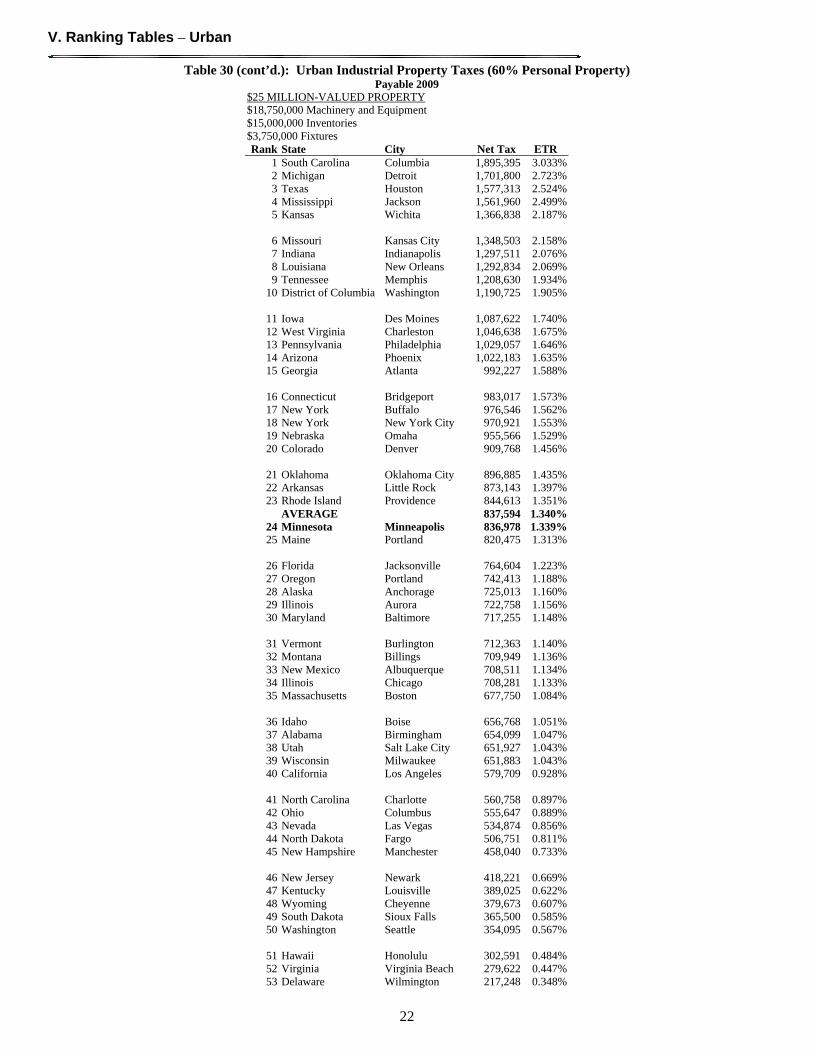
V. Ranking Tables – Urban
22
Table 30 (cont’d.): Urban Industrial Property Taxes (60% Personal Property) Payable 2009
$25 MILLION-VALUED PROPERTY $18,750,000 Machinery and Equipment $15,000,000 Inventories $3,750,000 Fixtures Rank State City Net Tax ETR
1 South Carolina Columbia 1,895,395 3.033%2 Michigan Detroit 1,701,800 2.723%3 Texas Houston 1,577,313 2.524%4 Mississippi Jackson 1,561,960 2.499%5 Kansas Wichita 1,366,838 2.187%
6 Missouri Kansas City 1,348,503 2.158%7 Indiana Indianapolis 1,297,511 2.076%8 Louisiana New Orleans 1,292,834 2.069%9 Tennessee Memphis 1,208,630 1.934%
10 District of Columbia Washington 1,190,725 1.905%
11 Iowa Des Moines 1,087,622 1.740%12 West Virginia Charleston 1,046,638 1.675%13 Pennsylvania Philadelphia 1,029,057 1.646%14 Arizona Phoenix 1,022,183 1.635%15 Georgia Atlanta 992,227 1.588%
16 Connecticut Bridgeport 983,017 1.573%17 New York Buffalo 976,546 1.562%18 New York New York City 970,921 1.553%19 Nebraska Omaha 955,566 1.529%20 Colorado Denver 909,768 1.456%
21 Oklahoma Oklahoma City 896,885 1.435%22 Arkansas Little Rock 873,143 1.397%23 Rhode Island Providence 844,613 1.351%
AVERAGE 837,594 1.340%24 Minnesota Minneapolis 836,978 1.339%25 Maine Portland 820,475 1.313%
26 Florida Jacksonville 764,604 1.223%27 Oregon Portland 742,413 1.188%28 Alaska Anchorage 725,013 1.160%29 Illinois Aurora 722,758 1.156%30 Maryland Baltimore 717,255 1.148%
31 Vermont Burlington 712,363 1.140%32 Montana Billings 709,949 1.136%33 New Mexico Albuquerque 708,511 1.134%34 Illinois Chicago 708,281 1.133%35 Massachusetts Boston 677,750 1.084%
36 Idaho Boise 656,768 1.051%37 Alabama Birmingham 654,099 1.047%38 Utah Salt Lake City 651,927 1.043%39 Wisconsin Milwaukee 651,883 1.043%40 California Los Angeles 579,709 0.928%
41 North Carolina Charlotte 560,758 0.897%42 Ohio Columbus 555,647 0.889%43 Nevada Las Vegas 534,874 0.856%44 North Dakota Fargo 506,751 0.811%45 New Hampshire Manchester 458,040 0.733%
46 New Jersey Newark 418,221 0.669%47 Kentucky Louisville 389,025 0.622%48 Wyoming Cheyenne 379,673 0.607%49 South Dakota Sioux Falls 365,500 0.585%50 Washington Seattle 354,095 0.567%
51 Hawaii Honolulu 302,591 0.484%52 Virginia Virginia Beach 279,622 0.447%53 Delaware Wilmington 217,248 0.348%
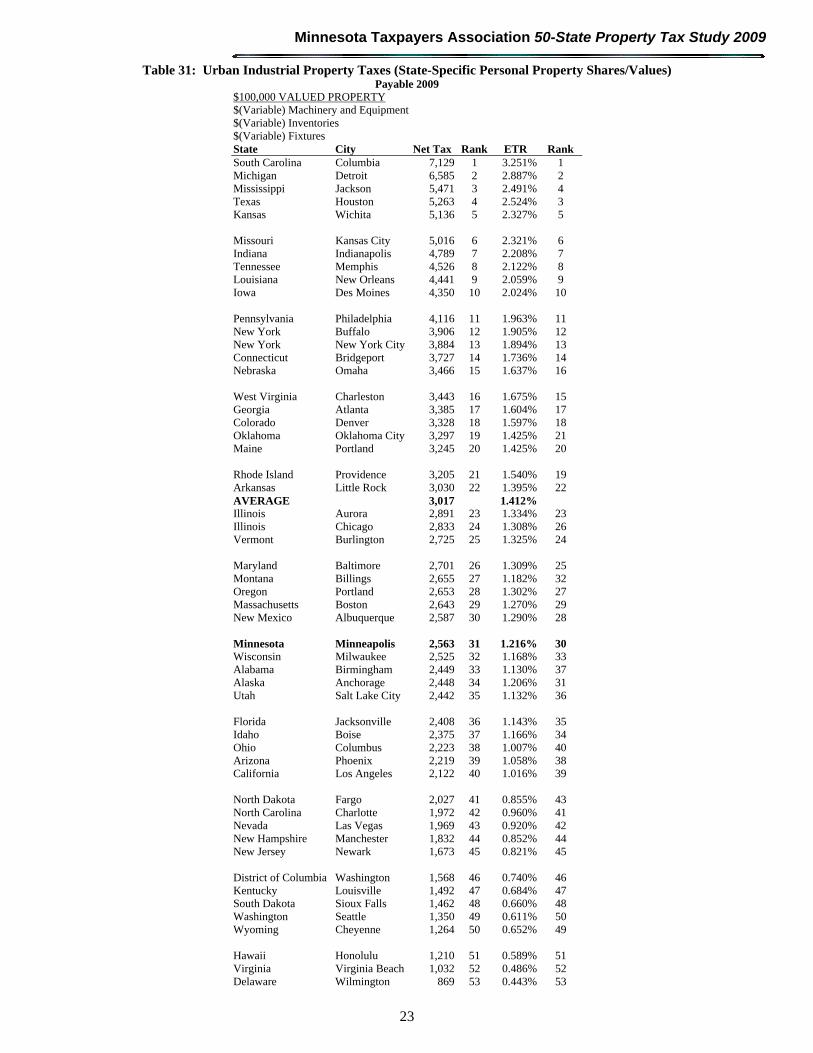
Minnesota Taxpayers Association 50-State Property Tax Study 2009
23
Table 31: Urban Industrial Property Taxes (State-Specific Personal Property Shares/Values) Payable 2009
$100,000 VALUED PROPERTY $(Variable) Machinery and Equipment $(Variable) Inventories $(Variable) Fixtures State City Net Tax Rank ETR Rank South Carolina Columbia 7,129 1 3.251% 1 Michigan Detroit 6,585 2 2.887% 2 Mississippi Jackson 5,471 3 2.491% 4 Texas Houston 5,263 4 2.524% 3 Kansas Wichita 5,136 5 2.327% 5 Missouri Kansas City 5,016 6 2.321% 6 Indiana Indianapolis 4,789 7 2.208% 7 Tennessee Memphis 4,526 8 2.122% 8 Louisiana New Orleans 4,441 9 2.059% 9 Iowa Des Moines 4,350 10 2.024% 10 Pennsylvania Philadelphia 4,116 11 1.963% 11 New York Buffalo 3,906 12 1.905% 12 New York New York City 3,884 13 1.894% 13 Connecticut Bridgeport 3,727 14 1.736% 14 Nebraska Omaha 3,466 15 1.637% 16 West Virginia Charleston 3,443 16 1.675% 15 Georgia Atlanta 3,385 17 1.604% 17 Colorado Denver 3,328 18 1.597% 18 Oklahoma Oklahoma City 3,297 19 1.425% 21 Maine Portland 3,245 20 1.425% 20 Rhode Island Providence 3,205 21 1.540% 19 Arkansas Little Rock 3,030 22 1.395% 22 AVERAGE 3,017 1.412% Illinois Aurora 2,891 23 1.334% 23 Illinois Chicago 2,833 24 1.308% 26 Vermont Burlington 2,725 25 1.325% 24 Maryland Baltimore 2,701 26 1.309% 25 Montana Billings 2,655 27 1.182% 32 Oregon Portland 2,653 28 1.302% 27 Massachusetts Boston 2,643 29 1.270% 29 New Mexico Albuquerque 2,587 30 1.290% 28 Minnesota Minneapolis 2,563 31 1.216% 30 Wisconsin Milwaukee 2,525 32 1.168% 33 Alabama Birmingham 2,449 33 1.130% 37 Alaska Anchorage 2,448 34 1.206% 31 Utah Salt Lake City 2,442 35 1.132% 36 Florida Jacksonville 2,408 36 1.143% 35 Idaho Boise 2,375 37 1.166% 34 Ohio Columbus 2,223 38 1.007% 40 Arizona Phoenix 2,219 39 1.058% 38 California Los Angeles 2,122 40 1.016% 39 North Dakota Fargo 2,027 41 0.855% 43 North Carolina Charlotte 1,972 42 0.960% 41 Nevada Las Vegas 1,969 43 0.920% 42 New Hampshire Manchester 1,832 44 0.852% 44 New Jersey Newark 1,673 45 0.821% 45 District of Columbia Washington 1,568 46 0.740% 46 Kentucky Louisville 1,492 47 0.684% 47 South Dakota Sioux Falls 1,462 48 0.660% 48 Washington Seattle 1,350 49 0.611% 50 Wyoming Cheyenne 1,264 50 0.652% 49 Hawaii Honolulu 1,210 51 0.589% 51 Virginia Virginia Beach 1,032 52 0.486% 52 Delaware Wilmington 869 53 0.443% 53
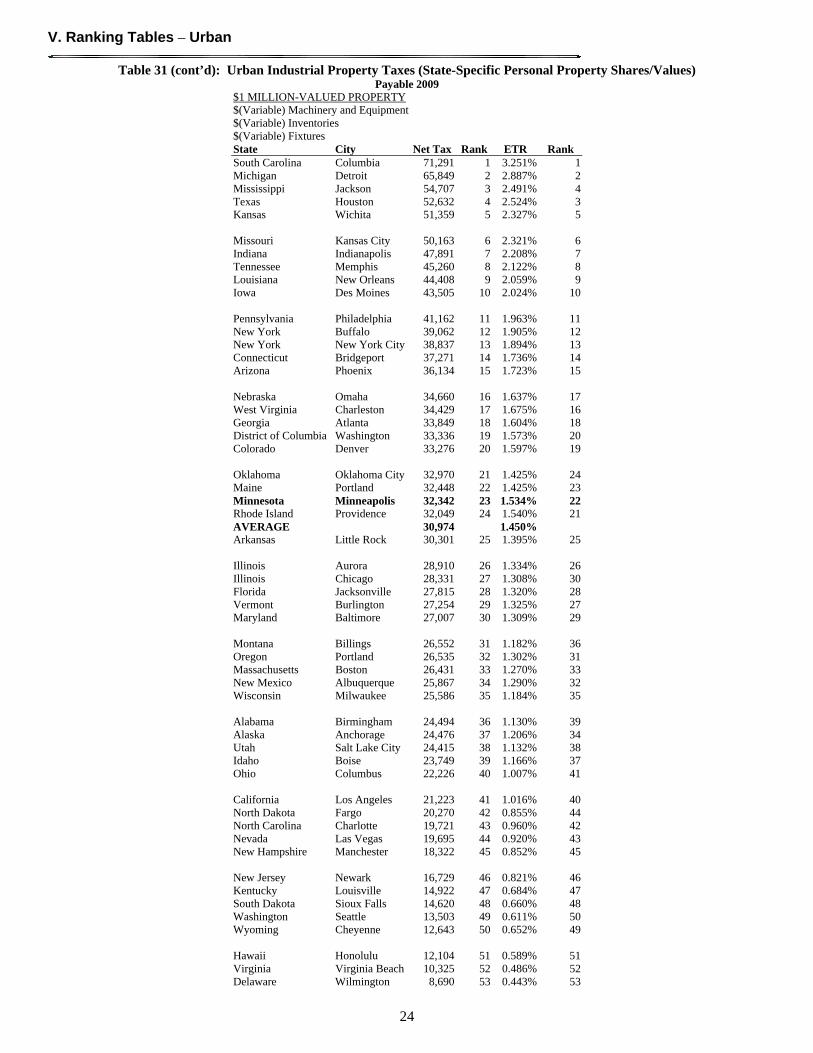
V. Ranking Tables – Urban
24
Table 31 (cont’d): Urban Industrial Property Taxes (State-Specific Personal Property Shares/Values) Payable 2009
$1 MILLION-VALUED PROPERTY $(Variable) Machinery and Equipment $(Variable) Inventories $(Variable) Fixtures State City Net Tax Rank ETR Rank South Carolina Columbia 71,291 1 3.251% 1 Michigan Detroit 65,849 2 2.887% 2 Mississippi Jackson 54,707 3 2.491% 4 Texas Houston 52,632 4 2.524% 3 Kansas Wichita 51,359 5 2.327% 5 Missouri Kansas City 50,163 6 2.321% 6 Indiana Indianapolis 47,891 7 2.208% 7 Tennessee Memphis 45,260 8 2.122% 8 Louisiana New Orleans 44,408 9 2.059% 9 Iowa Des Moines 43,505 10 2.024% 10 Pennsylvania Philadelphia 41,162 11 1.963% 11 New York Buffalo 39,062 12 1.905% 12 New York New York City 38,837 13 1.894% 13 Connecticut Bridgeport 37,271 14 1.736% 14 Arizona Phoenix 36,134 15 1.723% 15 Nebraska Omaha 34,660 16 1.637% 17 West Virginia Charleston 34,429 17 1.675% 16 Georgia Atlanta 33,849 18 1.604% 18 District of Columbia Washington 33,336 19 1.573% 20 Colorado Denver 33,276 20 1.597% 19 Oklahoma Oklahoma City 32,970 21 1.425% 24 Maine Portland 32,448 22 1.425% 23 Minnesota Minneapolis 32,342 23 1.534% 22 Rhode Island Providence 32,049 24 1.540% 21 AVERAGE 30,974 1.450% Arkansas Little Rock 30,301 25 1.395% 25 Illinois Aurora 28,910 26 1.334% 26 Illinois Chicago 28,331 27 1.308% 30 Florida Jacksonville 27,815 28 1.320% 28 Vermont Burlington 27,254 29 1.325% 27 Maryland Baltimore 27,007 30 1.309% 29 Montana Billings 26,552 31 1.182% 36 Oregon Portland 26,535 32 1.302% 31 Massachusetts Boston 26,431 33 1.270% 33 New Mexico Albuquerque 25,867 34 1.290% 32 Wisconsin Milwaukee 25,586 35 1.184% 35 Alabama Birmingham 24,494 36 1.130% 39 Alaska Anchorage 24,476 37 1.206% 34 Utah Salt Lake City 24,415 38 1.132% 38 Idaho Boise 23,749 39 1.166% 37 Ohio Columbus 22,226 40 1.007% 41 California Los Angeles 21,223 41 1.016% 40 North Dakota Fargo 20,270 42 0.855% 44 North Carolina Charlotte 19,721 43 0.960% 42 Nevada Las Vegas 19,695 44 0.920% 43 New Hampshire Manchester 18,322 45 0.852% 45 New Jersey Newark 16,729 46 0.821% 46 Kentucky Louisville 14,922 47 0.684% 47 South Dakota Sioux Falls 14,620 48 0.660% 48 Washington Seattle 13,503 49 0.611% 50 Wyoming Cheyenne 12,643 50 0.652% 49 Hawaii Honolulu 12,104 51 0.589% 51 Virginia Virginia Beach 10,325 52 0.486% 52 Delaware Wilmington 8,690 53 0.443% 53
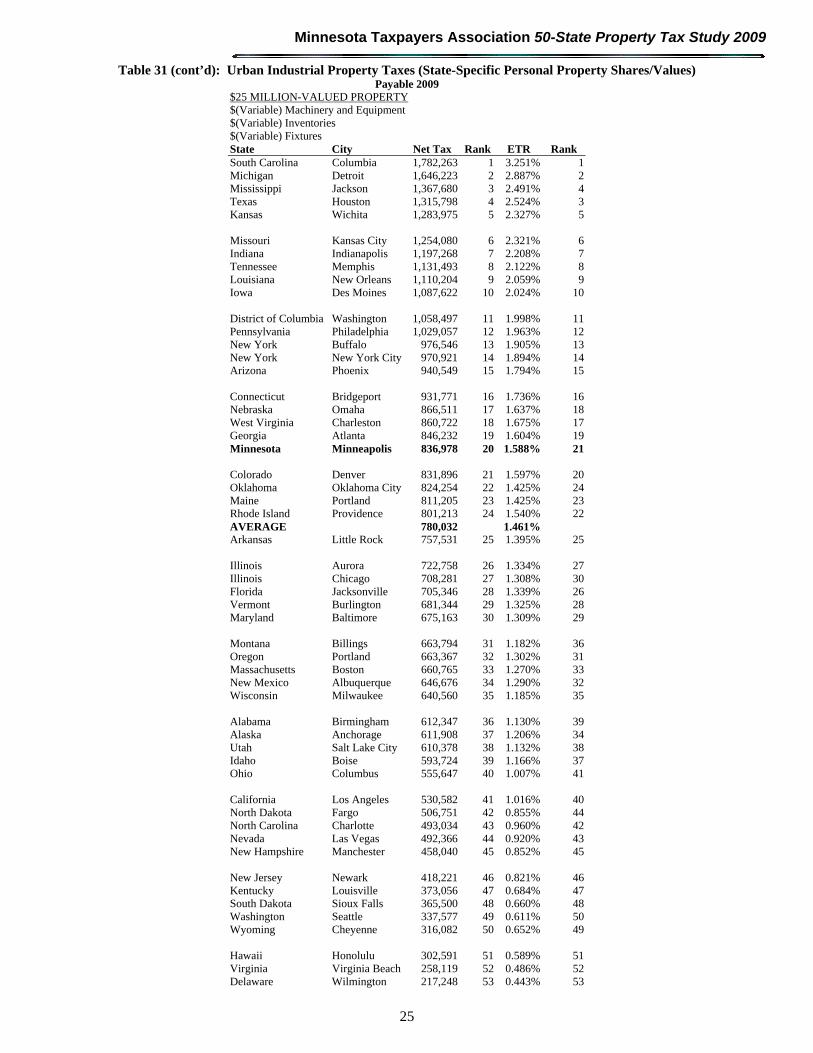
Minnesota Taxpayers Association 50-State Property Tax Study 2009
25
Table 31 (cont’d): Urban Industrial Property Taxes (State-Specific Personal Property Shares/Values) Payable 2009
$25 MILLION-VALUED PROPERTY $(Variable) Machinery and Equipment $(Variable) Inventories $(Variable) Fixtures State City Net Tax Rank ETR Rank South Carolina Columbia 1,782,263 1 3.251% 1 Michigan Detroit 1,646,223 2 2.887% 2 Mississippi Jackson 1,367,680 3 2.491% 4 Texas Houston 1,315,798 4 2.524% 3 Kansas Wichita 1,283,975 5 2.327% 5 Missouri Kansas City 1,254,080 6 2.321% 6 Indiana Indianapolis 1,197,268 7 2.208% 7 Tennessee Memphis 1,131,493 8 2.122% 8 Louisiana New Orleans 1,110,204 9 2.059% 9 Iowa Des Moines 1,087,622 10 2.024% 10 District of Columbia Washington 1,058,497 11 1.998% 11 Pennsylvania Philadelphia 1,029,057 12 1.963% 12 New York Buffalo 976,546 13 1.905% 13 New York New York City 970,921 14 1.894% 14 Arizona Phoenix 940,549 15 1.794% 15 Connecticut Bridgeport 931,771 16 1.736% 16 Nebraska Omaha 866,511 17 1.637% 18 West Virginia Charleston 860,722 18 1.675% 17 Georgia Atlanta 846,232 19 1.604% 19 Minnesota Minneapolis 836,978 20 1.588% 21 Colorado Denver 831,896 21 1.597% 20 Oklahoma Oklahoma City 824,254 22 1.425% 24 Maine Portland 811,205 23 1.425% 23 Rhode Island Providence 801,213 24 1.540% 22 AVERAGE 780,032 1.461% Arkansas Little Rock 757,531 25 1.395% 25 Illinois Aurora 722,758 26 1.334% 27 Illinois Chicago 708,281 27 1.308% 30 Florida Jacksonville 705,346 28 1.339% 26 Vermont Burlington 681,344 29 1.325% 28 Maryland Baltimore 675,163 30 1.309% 29 Montana Billings 663,794 31 1.182% 36 Oregon Portland 663,367 32 1.302% 31 Massachusetts Boston 660,765 33 1.270% 33 New Mexico Albuquerque 646,676 34 1.290% 32 Wisconsin Milwaukee 640,560 35 1.185% 35 Alabama Birmingham 612,347 36 1.130% 39 Alaska Anchorage 611,908 37 1.206% 34 Utah Salt Lake City 610,378 38 1.132% 38 Idaho Boise 593,724 39 1.166% 37 Ohio Columbus 555,647 40 1.007% 41 California Los Angeles 530,582 41 1.016% 40 North Dakota Fargo 506,751 42 0.855% 44 North Carolina Charlotte 493,034 43 0.960% 42 Nevada Las Vegas 492,366 44 0.920% 43 New Hampshire Manchester 458,040 45 0.852% 45 New Jersey Newark 418,221 46 0.821% 46 Kentucky Louisville 373,056 47 0.684% 47 South Dakota Sioux Falls 365,500 48 0.660% 48 Washington Seattle 337,577 49 0.611% 50 Wyoming Cheyenne 316,082 50 0.652% 49 Hawaii Honolulu 302,591 51 0.589% 51 Virginia Virginia Beach 258,119 52 0.486% 52 Delaware Wilmington 217,248 53 0.443% 53
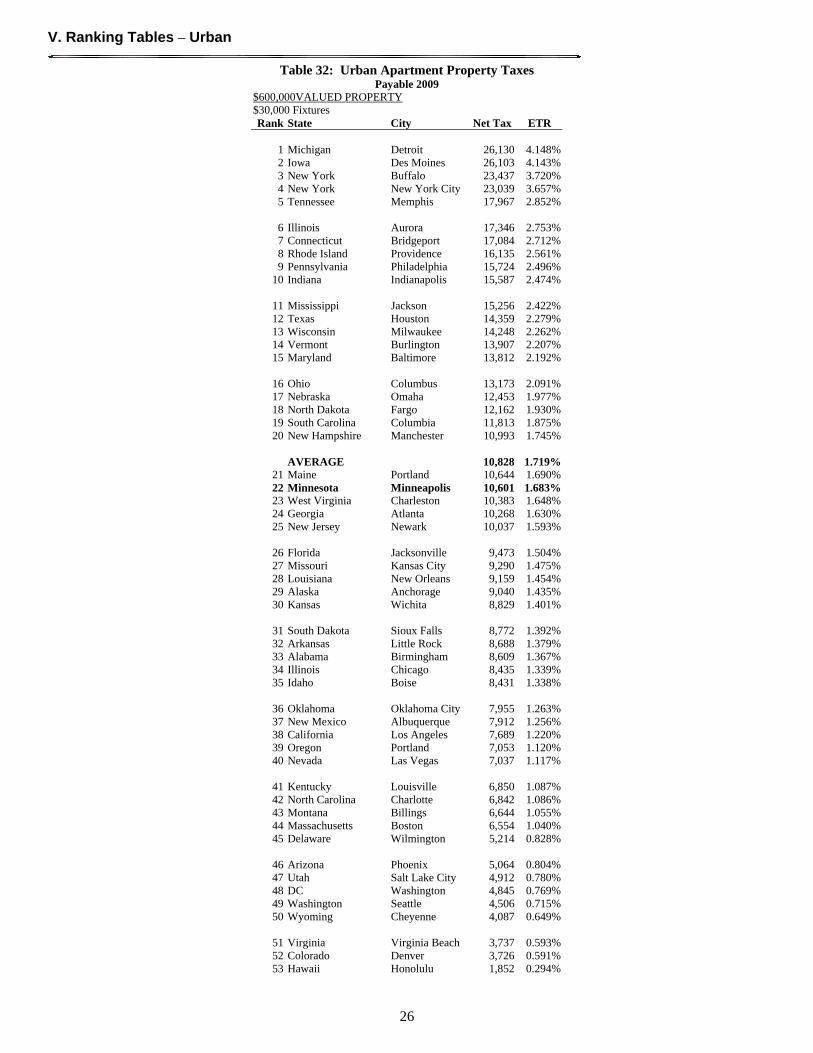
V. Ranking Tables – Urban
26
Table 32: Urban Apartment Property Taxes Payable 2009
$600,000VALUED PROPERTY $30,000 Fixtures Rank State City Net Tax ETR
1 Michigan Detroit 26,130 4.148%2 Iowa Des Moines 26,103 4.143%3 New York Buffalo 23,437 3.720%4 New York New York City 23,039 3.657%5 Tennessee Memphis 17,967 2.852%
6 Illinois Aurora 17,346 2.753%7 Connecticut Bridgeport 17,084 2.712%8 Rhode Island Providence 16,135 2.561%9 Pennsylvania Philadelphia 15,724 2.496%
10 Indiana Indianapolis 15,587 2.474%
11 Mississippi Jackson 15,256 2.422%12 Texas Houston 14,359 2.279%13 Wisconsin Milwaukee 14,248 2.262%14 Vermont Burlington 13,907 2.207%15 Maryland Baltimore 13,812 2.192%
16 Ohio Columbus 13,173 2.091%17 Nebraska Omaha 12,453 1.977%18 North Dakota Fargo 12,162 1.930%19 South Carolina Columbia 11,813 1.875%20 New Hampshire Manchester 10,993 1.745%
AVERAGE 10,828 1.719%
21 Maine Portland 10,644 1.690%22 Minnesota Minneapolis 10,601 1.683%23 West Virginia Charleston 10,383 1.648%24 Georgia Atlanta 10,268 1.630%25 New Jersey Newark 10,037 1.593%
26 Florida Jacksonville 9,473 1.504%27 Missouri Kansas City 9,290 1.475%28 Louisiana New Orleans 9,159 1.454%29 Alaska Anchorage 9,040 1.435%30 Kansas Wichita 8,829 1.401%
31 South Dakota Sioux Falls 8,772 1.392%32 Arkansas Little Rock 8,688 1.379%33 Alabama Birmingham 8,609 1.367%34 Illinois Chicago 8,435 1.339%35 Idaho Boise 8,431 1.338%
36 Oklahoma Oklahoma City 7,955 1.263%37 New Mexico Albuquerque 7,912 1.256%38 California Los Angeles 7,689 1.220%39 Oregon Portland 7,053 1.120%40 Nevada Las Vegas 7,037 1.117%
41 Kentucky Louisville 6,850 1.087%42 North Carolina Charlotte 6,842 1.086%43 Montana Billings 6,644 1.055%44 Massachusetts Boston 6,554 1.040%45 Delaware Wilmington 5,214 0.828%
46 Arizona Phoenix 5,064 0.804%47 Utah Salt Lake City 4,912 0.780%48 DC Washington 4,845 0.769%49 Washington Seattle 4,506 0.715%50 Wyoming Cheyenne 4,087 0.649%
51 Virginia Virginia Beach 3,737 0.593%52 Colorado Denver 3,726 0.591%53 Hawaii Honolulu 1,852 0.294%
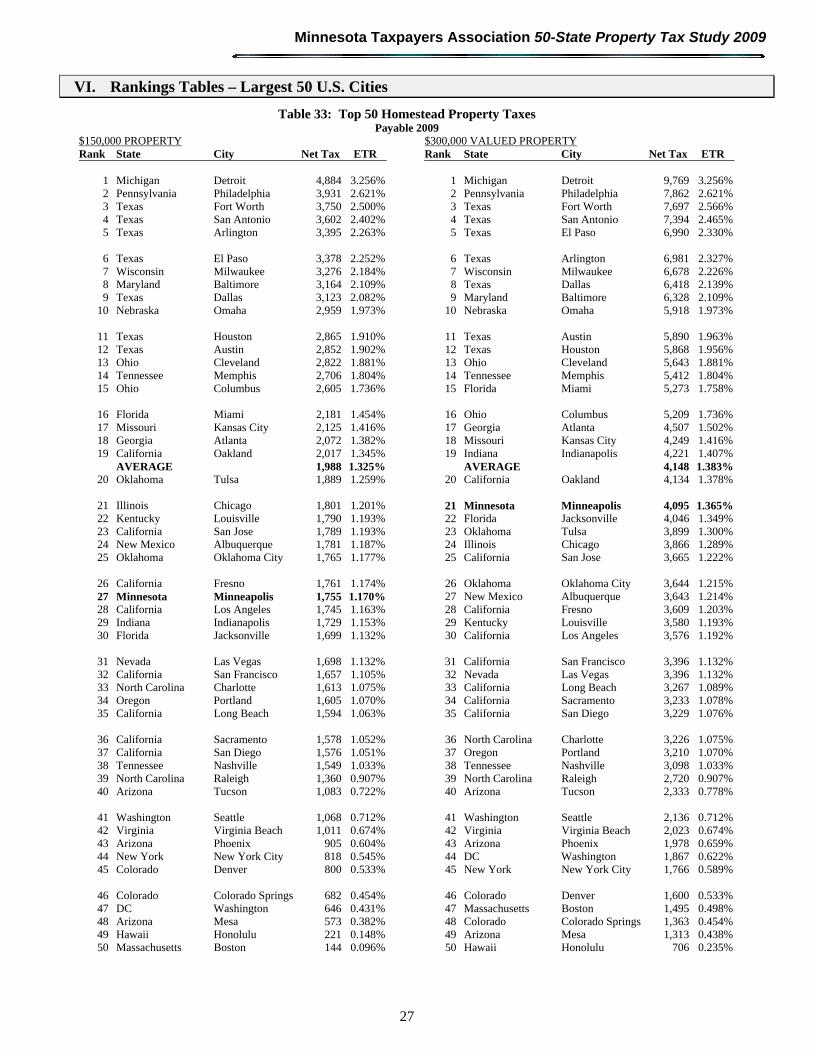
Minnesota Taxpayers Association 50-State Property Tax Study 2009
27
VI. Rankings Tables – Largest 50 U.S. Cities
Table 33: Top 50 Homestead Property Taxes Payable 2009
$150,000 PROPERTY $300,000 VALUED PROPERTY Rank State City Net Tax ETR Rank State City Net Tax ETR
1 Michigan Detroit 4,884 3.256% 1 Michigan Detroit 9,769 3.256%2 Pennsylvania Philadelphia 3,931 2.621% 2 Pennsylvania Philadelphia 7,862 2.621%3 Texas Fort Worth 3,750 2.500% 3 Texas Fort Worth 7,697 2.566%4 Texas San Antonio 3,602 2.402% 4 Texas San Antonio 7,394 2.465%5 Texas Arlington 3,395 2.263% 5 Texas El Paso 6,990 2.330%
6 Texas El Paso 3,378 2.252% 6 Texas Arlington 6,981 2.327%7 Wisconsin Milwaukee 3,276 2.184% 7 Wisconsin Milwaukee 6,678 2.226%8 Maryland Baltimore 3,164 2.109% 8 Texas Dallas 6,418 2.139%9 Texas Dallas 3,123 2.082% 9 Maryland Baltimore 6,328 2.109%
10 Nebraska Omaha 2,959 1.973% 10 Nebraska Omaha 5,918 1.973%
11 Texas Houston 2,865 1.910% 11 Texas Austin 5,890 1.963%12 Texas Austin 2,852 1.902% 12 Texas Houston 5,868 1.956%13 Ohio Cleveland 2,822 1.881% 13 Ohio Cleveland 5,643 1.881%14 Tennessee Memphis 2,706 1.804% 14 Tennessee Memphis 5,412 1.804%15 Ohio Columbus 2,605 1.736% 15 Florida Miami 5,273 1.758%
16 Florida Miami 2,181 1.454% 16 Ohio Columbus 5,209 1.736%17 Missouri Kansas City 2,125 1.416% 17 Georgia Atlanta 4,507 1.502%18 Georgia Atlanta 2,072 1.382% 18 Missouri Kansas City 4,249 1.416%19 California Oakland 2,017 1.345% 19 Indiana Indianapolis 4,221 1.407%
AVERAGE 1,988 1.325% AVERAGE 4,148 1.383%20 Oklahoma Tulsa 1,889 1.259% 20 California Oakland 4,134 1.378%
21 Illinois Chicago 1,801 1.201% 21 Minnesota Minneapolis 4,095 1.365%22 Kentucky Louisville 1,790 1.193% 22 Florida Jacksonville 4,046 1.349%23 California San Jose 1,789 1.193% 23 Oklahoma Tulsa 3,899 1.300%24 New Mexico Albuquerque 1,781 1.187% 24 Illinois Chicago 3,866 1.289%25 Oklahoma Oklahoma City 1,765 1.177% 25 California San Jose 3,665 1.222%
26 California Fresno 1,761 1.174% 26 Oklahoma Oklahoma City 3,644 1.215%27 Minnesota Minneapolis 1,755 1.170% 27 New Mexico Albuquerque 3,643 1.214%28 California Los Angeles 1,745 1.163% 28 California Fresno 3,609 1.203%29 Indiana Indianapolis 1,729 1.153% 29 Kentucky Louisville 3,580 1.193%30 Florida Jacksonville 1,699 1.132% 30 California Los Angeles 3,576 1.192%
31 Nevada Las Vegas 1,698 1.132% 31 California San Francisco 3,396 1.132%32 California San Francisco 1,657 1.105% 32 Nevada Las Vegas 3,396 1.132%33 North Carolina Charlotte 1,613 1.075% 33 California Long Beach 3,267 1.089%34 Oregon Portland 1,605 1.070% 34 California Sacramento 3,233 1.078%35 California Long Beach 1,594 1.063% 35 California San Diego 3,229 1.076%
36 California Sacramento 1,578 1.052% 36 North Carolina Charlotte 3,226 1.075%37 California San Diego 1,576 1.051% 37 Oregon Portland 3,210 1.070%38 Tennessee Nashville 1,549 1.033% 38 Tennessee Nashville 3,098 1.033%39 North Carolina Raleigh 1,360 0.907% 39 North Carolina Raleigh 2,720 0.907%40 Arizona Tucson 1,083 0.722% 40 Arizona Tucson 2,333 0.778%
41 Washington Seattle 1,068 0.712% 41 Washington Seattle 2,136 0.712%42 Virginia Virginia Beach 1,011 0.674% 42 Virginia Virginia Beach 2,023 0.674%43 Arizona Phoenix 905 0.604% 43 Arizona Phoenix 1,978 0.659%44 New York New York City 818 0.545% 44 DC Washington 1,867 0.622%45 Colorado Denver 800 0.533% 45 New York New York City 1,766 0.589%
46 Colorado Colorado Springs 682 0.454% 46 Colorado Denver 1,600 0.533%47 DC Washington 646 0.431% 47 Massachusetts Boston 1,495 0.498%48 Arizona Mesa 573 0.382% 48 Colorado Colorado Springs 1,363 0.454%49 Hawaii Honolulu 221 0.148% 49 Arizona Mesa 1,313 0.438%50 Massachusetts Boston 144 0.096% 50 Hawaii Honolulu 706 0.235%
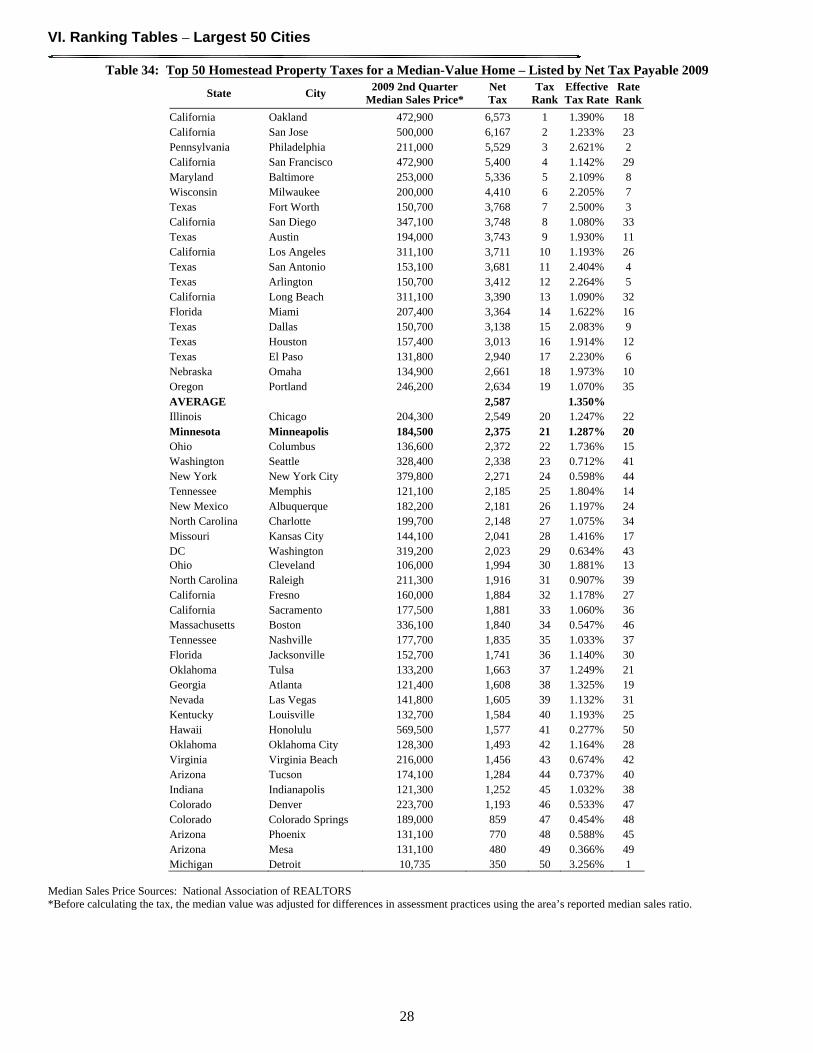
VI. Ranking Tables – Largest 50 Cities
28
Table 34: Top 50 Homestead Property Taxes for a Median-Value Home – Listed by Net Tax Payable 2009
State City 2009 2nd Quarter
Median Sales Price*Net Tax
Tax Rank
Effective Tax Rate
Rate Rank
California Oakland 472,900 6,573 1 1.390% 18 California San Jose 500,000 6,167 2 1.233% 23 Pennsylvania Philadelphia 211,000 5,529 3 2.621% 2 California San Francisco 472,900 5,400 4 1.142% 29 Maryland Baltimore 253,000 5,336 5 2.109% 8 Wisconsin Milwaukee 200,000 4,410 6 2.205% 7 Texas Fort Worth 150,700 3,768 7 2.500% 3 California San Diego 347,100 3,748 8 1.080% 33 Texas Austin 194,000 3,743 9 1.930% 11 California Los Angeles 311,100 3,711 10 1.193% 26 Texas San Antonio 153,100 3,681 11 2.404% 4 Texas Arlington 150,700 3,412 12 2.264% 5 California Long Beach 311,100 3,390 13 1.090% 32 Florida Miami 207,400 3,364 14 1.622% 16 Texas Dallas 150,700 3,138 15 2.083% 9 Texas Houston 157,400 3,013 16 1.914% 12 Texas El Paso 131,800 2,940 17 2.230% 6 Nebraska Omaha 134,900 2,661 18 1.973% 10 Oregon Portland 246,200 2,634 19 1.070% 35 AVERAGE 2,587 1.350% Illinois Chicago 204,300 2,549 20 1.247% 22 Minnesota Minneapolis 184,500 2,375 21 1.287% 20 Ohio Columbus 136,600 2,372 22 1.736% 15 Washington Seattle 328,400 2,338 23 0.712% 41 New York New York City 379,800 2,271 24 0.598% 44 Tennessee Memphis 121,100 2,185 25 1.804% 14 New Mexico Albuquerque 182,200 2,181 26 1.197% 24 North Carolina Charlotte 199,700 2,148 27 1.075% 34 Missouri Kansas City 144,100 2,041 28 1.416% 17 DC Washington 319,200 2,023 29 0.634% 43 Ohio Cleveland 106,000 1,994 30 1.881% 13 North Carolina Raleigh 211,300 1,916 31 0.907% 39 California Fresno 160,000 1,884 32 1.178% 27 California Sacramento 177,500 1,881 33 1.060% 36 Massachusetts Boston 336,100 1,840 34 0.547% 46 Tennessee Nashville 177,700 1,835 35 1.033% 37 Florida Jacksonville 152,700 1,741 36 1.140% 30 Oklahoma Tulsa 133,200 1,663 37 1.249% 21 Georgia Atlanta 121,400 1,608 38 1.325% 19 Nevada Las Vegas 141,800 1,605 39 1.132% 31 Kentucky Louisville 132,700 1,584 40 1.193% 25 Hawaii Honolulu 569,500 1,577 41 0.277% 50 Oklahoma Oklahoma City 128,300 1,493 42 1.164% 28 Virginia Virginia Beach 216,000 1,456 43 0.674% 42 Arizona Tucson 174,100 1,284 44 0.737% 40 Indiana Indianapolis 121,300 1,252 45 1.032% 38 Colorado Denver 223,700 1,193 46 0.533% 47 Colorado Colorado Springs 189,000 859 47 0.454% 48 Arizona Phoenix 131,100 770 48 0.588% 45 Arizona Mesa 131,100 480 49 0.366% 49 Michigan Detroit 10,735 350 50 3.256% 1
Median Sales Price Sources: National Association of REALTORS *Before calculating the tax, the median value was adjusted for differences in assessment practices using the area’s reported median sales ratio.
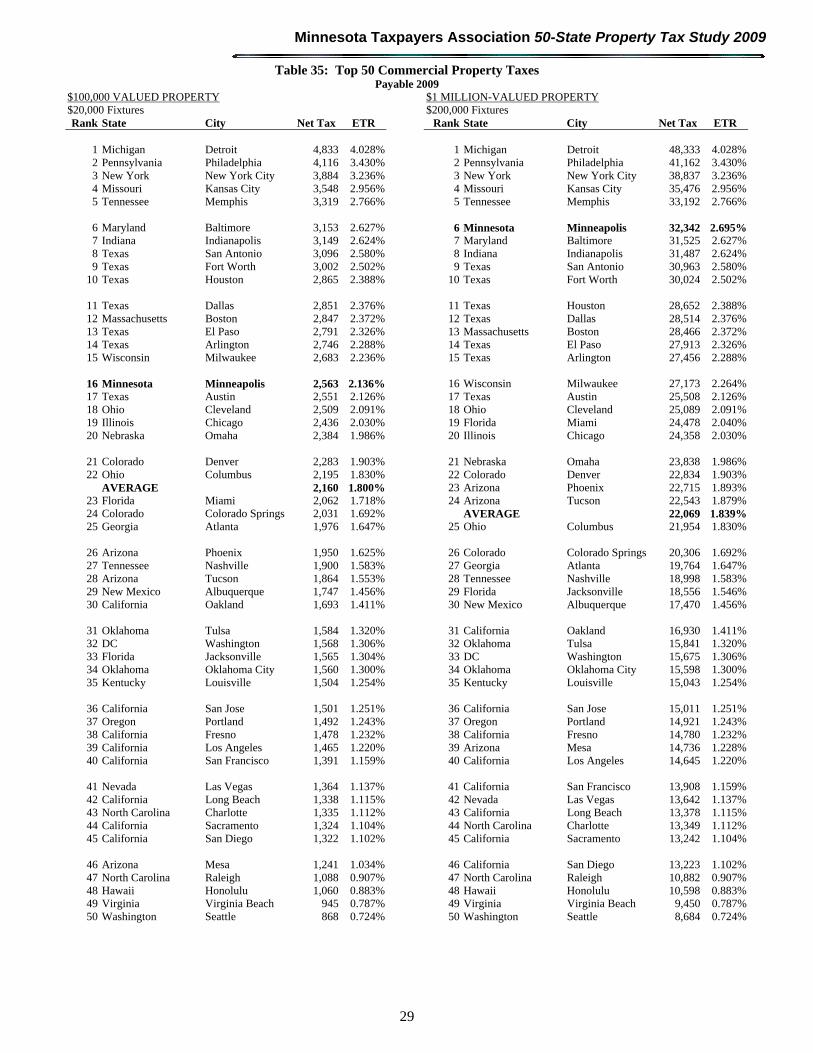
Minnesota Taxpayers Association 50-State Property Tax Study 2009
29
Table 35: Top 50 Commercial Property Taxes Payable 2009
$100,000 VALUED PROPERTY $1 MILLION-VALUED PROPERTY $20,000 Fixtures $200,000 Fixtures Rank State City Net Tax ETR Rank State City Net Tax ETR
1 Michigan Detroit 4,833 4.028% 1 Michigan Detroit 48,333 4.028%2 Pennsylvania Philadelphia 4,116 3.430% 2 Pennsylvania Philadelphia 41,162 3.430%3 New York New York City 3,884 3.236% 3 New York New York City 38,837 3.236%4 Missouri Kansas City 3,548 2.956% 4 Missouri Kansas City 35,476 2.956%5 Tennessee Memphis 3,319 2.766% 5 Tennessee Memphis 33,192 2.766%
6 Maryland Baltimore 3,153 2.627% 6 Minnesota Minneapolis 32,342 2.695%7 Indiana Indianapolis 3,149 2.624% 7 Maryland Baltimore 31,525 2.627%8 Texas San Antonio 3,096 2.580% 8 Indiana Indianapolis 31,487 2.624%9 Texas Fort Worth 3,002 2.502% 9 Texas San Antonio 30,963 2.580%
10 Texas Houston 2,865 2.388% 10 Texas Fort Worth 30,024 2.502%
11 Texas Dallas 2,851 2.376% 11 Texas Houston 28,652 2.388%12 Massachusetts Boston 2,847 2.372% 12 Texas Dallas 28,514 2.376%13 Texas El Paso 2,791 2.326% 13 Massachusetts Boston 28,466 2.372%14 Texas Arlington 2,746 2.288% 14 Texas El Paso 27,913 2.326%15 Wisconsin Milwaukee 2,683 2.236% 15 Texas Arlington 27,456 2.288%
16 Minnesota Minneapolis 2,563 2.136% 16 Wisconsin Milwaukee 27,173 2.264%17 Texas Austin 2,551 2.126% 17 Texas Austin 25,508 2.126%18 Ohio Cleveland 2,509 2.091% 18 Ohio Cleveland 25,089 2.091%19 Illinois Chicago 2,436 2.030% 19 Florida Miami 24,478 2.040%20 Nebraska Omaha 2,384 1.986% 20 Illinois Chicago 24,358 2.030%
21 Colorado Denver 2,283 1.903% 21 Nebraska Omaha 23,838 1.986%22 Ohio Columbus 2,195 1.830% 22 Colorado Denver 22,834 1.903%
AVERAGE 2,160 1.800% 23 Arizona Phoenix 22,715 1.893%23 Florida Miami 2,062 1.718% 24 Arizona Tucson 22,543 1.879%24 Colorado Colorado Springs 2,031 1.692% AVERAGE 22,069 1.839%25 Georgia Atlanta 1,976 1.647% 25 Ohio Columbus 21,954 1.830%
26 Arizona Phoenix 1,950 1.625% 26 Colorado Colorado Springs 20,306 1.692%27 Tennessee Nashville 1,900 1.583% 27 Georgia Atlanta 19,764 1.647%28 Arizona Tucson 1,864 1.553% 28 Tennessee Nashville 18,998 1.583%29 New Mexico Albuquerque 1,747 1.456% 29 Florida Jacksonville 18,556 1.546%30 California Oakland 1,693 1.411% 30 New Mexico Albuquerque 17,470 1.456%
31 Oklahoma Tulsa 1,584 1.320% 31 California Oakland 16,930 1.411%32 DC Washington 1,568 1.306% 32 Oklahoma Tulsa 15,841 1.320%33 Florida Jacksonville 1,565 1.304% 33 DC Washington 15,675 1.306%34 Oklahoma Oklahoma City 1,560 1.300% 34 Oklahoma Oklahoma City 15,598 1.300%35 Kentucky Louisville 1,504 1.254% 35 Kentucky Louisville 15,043 1.254%
36 California San Jose 1,501 1.251% 36 California San Jose 15,011 1.251%37 Oregon Portland 1,492 1.243% 37 Oregon Portland 14,921 1.243%38 California Fresno 1,478 1.232% 38 California Fresno 14,780 1.232%39 California Los Angeles 1,465 1.220% 39 Arizona Mesa 14,736 1.228%40 California San Francisco 1,391 1.159% 40 California Los Angeles 14,645 1.220%
41 Nevada Las Vegas 1,364 1.137% 41 California San Francisco 13,908 1.159%42 California Long Beach 1,338 1.115% 42 Nevada Las Vegas 13,642 1.137%43 North Carolina Charlotte 1,335 1.112% 43 California Long Beach 13,378 1.115%44 California Sacramento 1,324 1.104% 44 North Carolina Charlotte 13,349 1.112%45 California San Diego 1,322 1.102% 45 California Sacramento 13,242 1.104%
46 Arizona Mesa 1,241 1.034% 46 California San Diego 13,223 1.102%47 North Carolina Raleigh 1,088 0.907% 47 North Carolina Raleigh 10,882 0.907%48 Hawaii Honolulu 1,060 0.883% 48 Hawaii Honolulu 10,598 0.883%49 Virginia Virginia Beach 945 0.787% 49 Virginia Virginia Beach 9,450 0.787%50 Washington Seattle 868 0.724% 50 Washington Seattle 8,684 0.724%
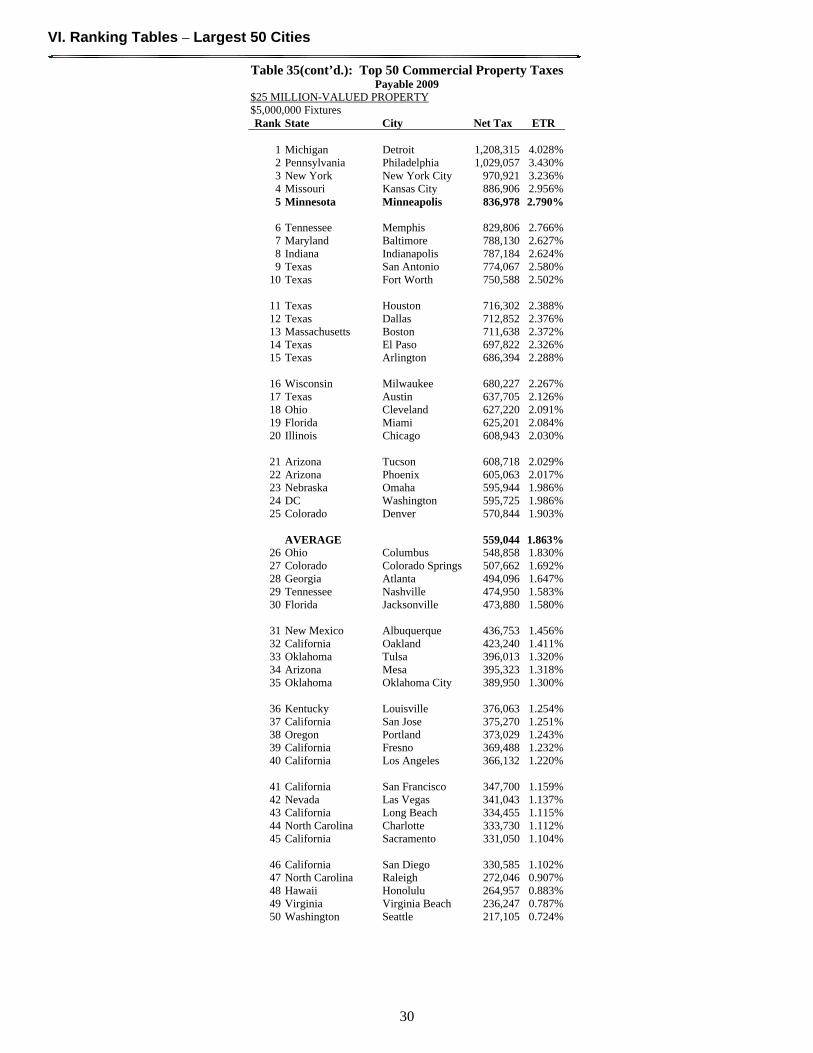
VI. Ranking Tables – Largest 50 Cities
30
Table 35(cont’d.): Top 50 Commercial Property Taxes Payable 2009
$25 MILLION-VALUED PROPERTY $5,000,000 Fixtures Rank State City Net Tax ETR
1 Michigan Detroit 1,208,315 4.028%2 Pennsylvania Philadelphia 1,029,057 3.430%3 New York New York City 970,921 3.236%4 Missouri Kansas City 886,906 2.956%5 Minnesota Minneapolis 836,978 2.790%
6 Tennessee Memphis 829,806 2.766%7 Maryland Baltimore 788,130 2.627%8 Indiana Indianapolis 787,184 2.624%9 Texas San Antonio 774,067 2.580%
10 Texas Fort Worth 750,588 2.502%
11 Texas Houston 716,302 2.388%12 Texas Dallas 712,852 2.376%13 Massachusetts Boston 711,638 2.372%14 Texas El Paso 697,822 2.326%15 Texas Arlington 686,394 2.288%
16 Wisconsin Milwaukee 680,227 2.267%17 Texas Austin 637,705 2.126%18 Ohio Cleveland 627,220 2.091%19 Florida Miami 625,201 2.084%20 Illinois Chicago 608,943 2.030%
21 Arizona Tucson 608,718 2.029%22 Arizona Phoenix 605,063 2.017%23 Nebraska Omaha 595,944 1.986%24 DC Washington 595,725 1.986%25 Colorado Denver 570,844 1.903%
AVERAGE 559,044 1.863%
26 Ohio Columbus 548,858 1.830%27 Colorado Colorado Springs 507,662 1.692%28 Georgia Atlanta 494,096 1.647%29 Tennessee Nashville 474,950 1.583%30 Florida Jacksonville 473,880 1.580%
31 New Mexico Albuquerque 436,753 1.456%32 California Oakland 423,240 1.411%33 Oklahoma Tulsa 396,013 1.320%34 Arizona Mesa 395,323 1.318%35 Oklahoma Oklahoma City 389,950 1.300%
36 Kentucky Louisville 376,063 1.254%37 California San Jose 375,270 1.251%38 Oregon Portland 373,029 1.243%39 California Fresno 369,488 1.232%40 California Los Angeles 366,132 1.220%
41 California San Francisco 347,700 1.159%42 Nevada Las Vegas 341,043 1.137%43 California Long Beach 334,455 1.115%44 North Carolina Charlotte 333,730 1.112%45 California Sacramento 331,050 1.104%
46 California San Diego 330,585 1.102%47 North Carolina Raleigh 272,046 0.907%48 Hawaii Honolulu 264,957 0.883%49 Virginia Virginia Beach 236,247 0.787%50 Washington Seattle 217,105 0.724%

Minnesota Taxpayers Association 50-State Property Tax Study 2009
31
Table 36: Top 50 Industrial Property Taxes (50% Personal Property) Payable 2009
$100,000 VALUED PROPERTY $1 MILLION-VALUED PROPERTY $50,000 Machinery and Equipment $500,000 Machinery and Equipment $40,000 Inventories $400,000 Inventories $10,000 Fixtures $100,000 Fixtures Rank State City Net Tax ETR Rank State Net Tax ETR
1 Michigan Detroit 5,920 2.960% 1 Michigan Detroit 59,201 2.960%2 Texas Fort Worth 5,613 2.807% 2 Texas Fort Worth 56,131 2.807%3 Texas Dallas 5,243 2.621% 3 Texas Dallas 52,429 2.621%4 Texas San Antonio 5,121 2.560% 4 Texas San Antonio 51,206 2.560%5 Texas Arlington 5,099 2.550% 5 Texas Arlington 50,991 2.550%
6 Texas Houston 5,047 2.524% 6 Texas Houston 50,474 2.524%7 Texas El Paso 4,983 2.491% 7 Texas El Paso 49,827 2.491%8 Missouri Kansas City 4,603 2.301% 8 Missouri Kansas City 46,027 2.301%9 Texas Austin 4,413 2.206% 9 Texas Austin 44,128 2.206%
10 Indiana Indianapolis 4,364 2.182% 10 Indiana Indianapolis 43,636 2.182%
11 Tennessee Memphis 4,185 2.093% 11 Tennessee Memphis 41,851 2.093%12 Pennsylvania Philadelphia 4,116 2.058% 12 Pennsylvania Philadelphia 41,162 2.058%13 New York New York City 3,884 1.942% 13 New York New York City 38,837 1.942%14 Nebraska Omaha 3,206 1.603% 14 Arizona Tucson 34,118 1.706%15 Georgia Atlanta 3,187 1.593% 15 Florida Miami 33,307 1.665%
16 Colorado Denver 3,058 1.529% 16 Minnesota Minneapolis 32,342 1.617%
AVERAGE 2,839 1.420% 17 Arizona Phoenix 32,249 1.612%17 Florida Miami 2,834 1.417% 18 Nebraska Omaha 32,058 1.603%18 Illinois Chicago 2,833 1.417% 19 Georgia Atlanta 31,870 1.593%19 Oklahoma Oklahoma City 2,808 1.404% 20 Colorado Denver 30,581 1.529%20 Colorado Colorado Springs 2,719 1.360%
AVERAGE 29,714 1.486%21 Ohio Cleveland 2,660 1.330% 21 District of Columbia Washington 28,425 1.421%22 Maryland Baltimore 2,586 1.293% 22 Illinois Chicago 28,331 1.417%23 Massachusetts Boston 2,575 1.288% 23 Oklahoma Oklahoma City 28,076 1.404%24 Minnesota Minneapolis 2,563 1.282% 24 Colorado Colorado Springs 27,190 1.360%25 Oklahoma Tulsa 2,559 1.279% 25 Ohio Cleveland 26,596 1.330%
26 Wisconsin Milwaukee 2,456 1.228% 26 Maryland Baltimore 25,855 1.293%27 Tennessee Nashville 2,395 1.198% 27 Massachusetts Boston 25,755 1.288%28 New Mexico Albuquerque 2,368 1.184% 28 Oklahoma Tulsa 25,589 1.279%29 Oregon Portland 2,336 1.168% 29 Florida Jacksonville 25,202 1.260%30 California Oakland 2,257 1.129% 30 Wisconsin Milwaukee 24,905 1.245%
31 Ohio Columbus 2,223 1.111% 31 Tennessee Nashville 23,954 1.198%32 Florida Jacksonville 2,146 1.073% 32 New Mexico Albuquerque 23,682 1.184%33 California San Jose 2,001 1.001% 33 Oregon Portland 23,364 1.168%34 California Fresno 1,971 0.985% 34 California Oakland 22,573 1.129%35 California Los Angeles 1,953 0.976% 35 Ohio Columbus 22,226 1.111%
36 Arizona Phoenix 1,950 0.975% 36 Arizona Mesa 21,638 1.082%37 Arizona Tucson 1,864 0.932% 37 California San Jose 20,014 1.001%38 California San Francisco 1,854 0.927% 38 California Fresno 19,706 0.985%39 North Carolina Charlotte 1,854 0.927% 39 California Los Angeles 19,527 0.976%40 Nevada Las Vegas 1,822 0.911% 40 California San Francisco 18,544 0.927%
41 California Long Beach 1,784 0.892% 41 North Carolina Charlotte 18,538 0.927%42 California Sacramento 1,766 0.883% 42 Nevada Las Vegas 18,222 0.911%43 California San Diego 1,763 0.882% 43 California Long Beach 17,838 0.892%44 District of Columbia Washington 1,568 0.784% 44 California Sacramento 17,656 0.883%45 North Carolina Raleigh 1,451 0.726% 45 California San Diego 17,631 0.882%
46 Kentucky Louisville 1,418 0.709% 46 North Carolina Raleigh 14,512 0.726%47 Arizona Mesa 1,241 0.620% 47 Kentucky Louisville 14,180 0.709%48 Hawaii Honolulu 1,210 0.605% 48 Hawaii Honolulu 12,104 0.605%49 Washington Seattle 1,182 0.591% 49 Washington Seattle 11,815 0.591%50 Virginia Virginia Beach 962 0.481% 50 Virginia Virginia Beach 9,620 0.481%
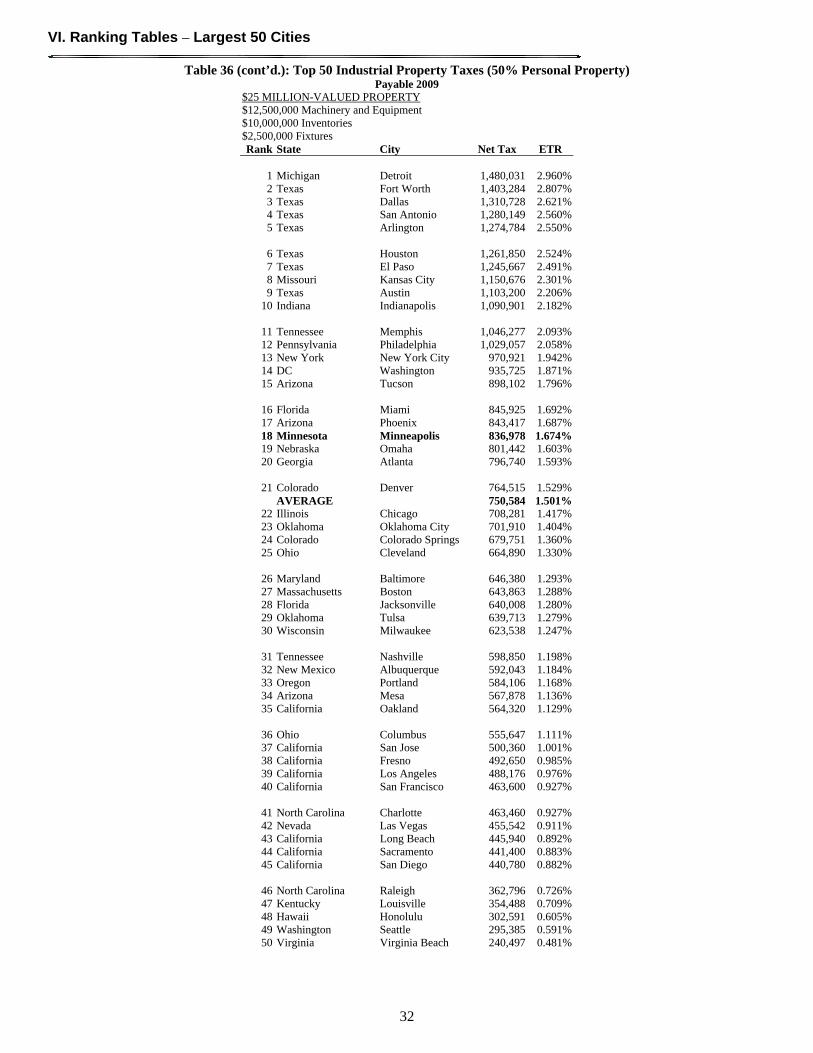
VI. Ranking Tables – Largest 50 Cities
32
Table 36 (cont’d.): Top 50 Industrial Property Taxes (50% Personal Property) Payable 2009
$25 MILLION-VALUED PROPERTY $12,500,000 Machinery and Equipment $10,000,000 Inventories $2,500,000 Fixtures Rank State City Net Tax ETR
1 Michigan Detroit 1,480,031 2.960% 2 Texas Fort Worth 1,403,284 2.807% 3 Texas Dallas 1,310,728 2.621% 4 Texas San Antonio 1,280,149 2.560% 5 Texas Arlington 1,274,784 2.550%
6 Texas Houston 1,261,850 2.524% 7 Texas El Paso 1,245,667 2.491% 8 Missouri Kansas City 1,150,676 2.301% 9 Texas Austin 1,103,200 2.206%
10 Indiana Indianapolis 1,090,901 2.182%
11 Tennessee Memphis 1,046,277 2.093% 12 Pennsylvania Philadelphia 1,029,057 2.058% 13 New York New York City 970,921 1.942% 14 DC Washington 935,725 1.871% 15 Arizona Tucson 898,102 1.796%
16 Florida Miami 845,925 1.692% 17 Arizona Phoenix 843,417 1.687% 18 Minnesota Minneapolis 836,978 1.674% 19 Nebraska Omaha 801,442 1.603% 20 Georgia Atlanta 796,740 1.593%
21 Colorado Denver 764,515 1.529%
AVERAGE 750,584 1.501% 22 Illinois Chicago 708,281 1.417% 23 Oklahoma Oklahoma City 701,910 1.404% 24 Colorado Colorado Springs 679,751 1.360% 25 Ohio Cleveland 664,890 1.330%
26 Maryland Baltimore 646,380 1.293% 27 Massachusetts Boston 643,863 1.288% 28 Florida Jacksonville 640,008 1.280% 29 Oklahoma Tulsa 639,713 1.279% 30 Wisconsin Milwaukee 623,538 1.247%
31 Tennessee Nashville 598,850 1.198% 32 New Mexico Albuquerque 592,043 1.184% 33 Oregon Portland 584,106 1.168% 34 Arizona Mesa 567,878 1.136% 35 California Oakland 564,320 1.129%
36 Ohio Columbus 555,647 1.111% 37 California San Jose 500,360 1.001% 38 California Fresno 492,650 0.985% 39 California Los Angeles 488,176 0.976% 40 California San Francisco 463,600 0.927%
41 North Carolina Charlotte 463,460 0.927% 42 Nevada Las Vegas 455,542 0.911% 43 California Long Beach 445,940 0.892% 44 California Sacramento 441,400 0.883% 45 California San Diego 440,780 0.882%
46 North Carolina Raleigh 362,796 0.726% 47 Kentucky Louisville 354,488 0.709% 48 Hawaii Honolulu 302,591 0.605% 49 Washington Seattle 295,385 0.591% 50 Virginia Virginia Beach 240,497 0.481%

Minnesota Taxpayers Association 50-State Property Tax Study 2009
33
Table 37: Top 50 Industrial Property Taxes (60% Personal Property) Payable 2009
$100,000 VALUED PROPERTY $1 MILLION-VALUED PROPERTY $75,000 Machinery and Equipment $750,000 Machinery and Equipment $60,000 Inventories $600,000 Inventories $15,000 Fixtures $150,000 Fixtures Rank State City Net Tax ETR Rank State Net Tax ETR
1 Texas Fort Worth 7,016 2.807% 1 Texas Fort Worth 70,164 2.807%2 Michigan Detroit 6,807 2.723% 2 Michigan Detroit 68,072 2.723%3 Texas Dallas 6,554 2.621% 3 Texas Dallas 65,536 2.621%4 Texas San Antonio 6,401 2.560% 4 Texas San Antonio 64,007 2.560%5 Texas Arlington 6,374 2.550% 5 Texas Arlington 63,739 2.550%
6 Texas Houston 6,309 2.524% 6 Texas Houston 63,093 2.524%7 Texas El Paso 6,228 2.491% 7 Texas El Paso 62,283 2.491%8 Texas Austin 5,516 2.206% 8 Texas Austin 55,160 2.206%9 Missouri Kansas City 5,394 2.158% 9 Missouri Kansas City 53,940 2.158%
10 Indiana Indianapolis 5,190 2.076% 10 Indiana Indianapolis 51,900 2.076%
11 Tennessee Memphis 4,835 1.934% 11 Tennessee Memphis 48,345 1.934%12 Pennsylvania Philadelphia 4,116 1.646% 12 Arizona Tucson 42,799 1.712%13 Georgia Atlanta 3,969 1.588% 13 Pennsylvania Philadelphia 41,162 1.646%14 New York New York City 3,884 1.553% 14 Florida Miami 39,929 1.597%15 Nebraska Omaha 3,822 1.529% 15 Georgia Atlanta 39,689 1.588%
16 Colorado Denver 3,639 1.456% 16 Arizona Phoenix 39,400 1.576%17 Oklahoma Oklahoma City 3,588 1.435% 17 New York New York City 38,837 1.553%18 Florida Miami 3,496 1.399% 18 DC Washington 38,625 1.545%
AVERAGE 3,344 1.338% 19 Nebraska Omaha 38,223 1.529%19 Colorado Colorado Springs 3,235 1.294% 20 Colorado Denver 36,391 1.456%20 Oklahoma Tulsa 3,168 1.267%
21 Oklahoma Oklahoma City 35,875 1.435%21 Oregon Portland 2,970 1.188% AVERAGE 35,037 1.401%22 Maryland Baltimore 2,869 1.148% 22 Colorado Colorado Springs 32,353 1.294%23 New Mexico Albuquerque 2,834 1.134% 23 Minnesota Minneapolis 32,342 1.294%24 Illinois Chicago 2,833 1.133% 24 Oklahoma Tulsa 31,681 1.267%25 Tennessee Nashville 2,767 1.107% 25 Florida Jacksonville 30,185 1.207%
26 Massachusetts Boston 2,711 1.084% 26 Oregon Portland 29,697 1.188%27 California Oakland 2,681 1.072% 27 Maryland Baltimore 28,690 1.148%28 Ohio Cleveland 2,660 1.064% 28 New Mexico Albuquerque 28,340 1.134%29 Florida Jacksonville 2,645 1.058% 29 Illinois Chicago 28,331 1.133%30 Arizona Tucson 2,587 1.035% 30 Tennessee Nashville 27,671 1.107%
31 Wisconsin Milwaukee 2,570 1.028% 31 Massachusetts Boston 27,110 1.084%32 Minnesota Minneapolis 2,563 1.025% 32 Arizona Mesa 26,815 1.073%33 Arizona Phoenix 2,545 1.018% 33 California Oakland 26,805 1.072%34 California San Jose 2,377 0.951% 34 Ohio Cleveland 26,596 1.064%35 California Fresno 2,340 0.936% 35 Wisconsin Milwaukee 26,039 1.042%
36 California Los Angeles 2,319 0.928% 36 California San Jose 23,767 0.951%37 North Carolina Charlotte 2,243 0.897% 37 California Fresno 23,401 0.936%38 Ohio Columbus 2,223 0.889% 38 California Los Angeles 23,188 0.928%39 California San Francisco 2,202 0.881% 39 North Carolina Charlotte 22,430 0.897%40 Nevada Las Vegas 2,166 0.866% 40 Ohio Columbus 22,226 0.889%
41 California Long Beach 2,118 0.847% 41 California San Francisco 22,021 0.881%42 California Sacramento 2,097 0.839% 42 Nevada Las Vegas 21,657 0.866%43 California San Diego 2,094 0.837% 43 California Long Beach 21,182 0.847%44 North Carolina Raleigh 1,723 0.689% 44 California Sacramento 20,967 0.839%45 Arizona Mesa 1,672 0.669% 45 California San Diego 20,937 0.837%
46 DC Washington 1,568 0.627% 46 North Carolina Raleigh 17,234 0.689%47 Kentucky Louisville 1,556 0.622% 47 Kentucky Louisville 15,561 0.622%48 Washington Seattle 1,416 0.567% 48 Washington Seattle 14,164 0.567%49 Hawaii Honolulu 1,210 0.484% 49 Hawaii Honolulu 12,104 0.484%50 Virginia Virginia Beach 1,118 0.447% 50 Virginia Virginia Beach 11,185 0.447%
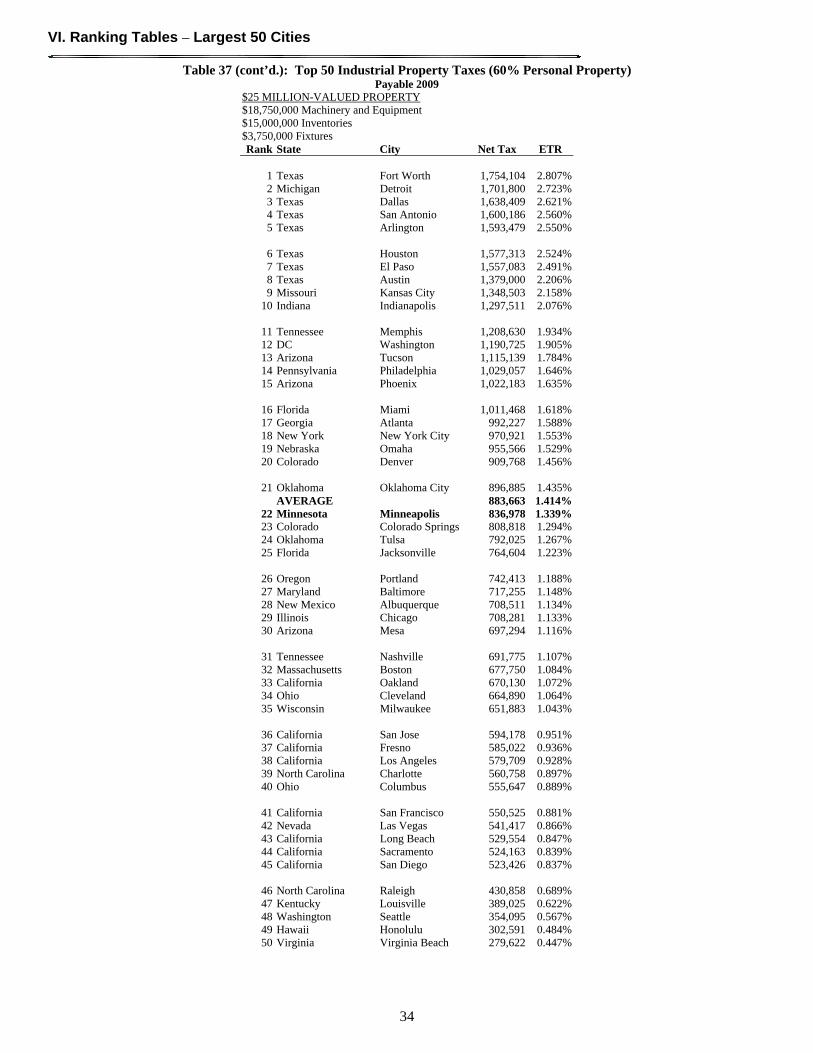
VI. Ranking Tables – Largest 50 Cities
34
Table 37 (cont’d.): Top 50 Industrial Property Taxes (60% Personal Property) Payable 2009
$25 MILLION-VALUED PROPERTY $18,750,000 Machinery and Equipment $15,000,000 Inventories $3,750,000 Fixtures Rank State City Net Tax ETR
1 Texas Fort Worth 1,754,104 2.807% 2 Michigan Detroit 1,701,800 2.723% 3 Texas Dallas 1,638,409 2.621% 4 Texas San Antonio 1,600,186 2.560% 5 Texas Arlington 1,593,479 2.550%
6 Texas Houston 1,577,313 2.524% 7 Texas El Paso 1,557,083 2.491% 8 Texas Austin 1,379,000 2.206% 9 Missouri Kansas City 1,348,503 2.158%
10 Indiana Indianapolis 1,297,511 2.076%
11 Tennessee Memphis 1,208,630 1.934% 12 DC Washington 1,190,725 1.905% 13 Arizona Tucson 1,115,139 1.784% 14 Pennsylvania Philadelphia 1,029,057 1.646% 15 Arizona Phoenix 1,022,183 1.635%
16 Florida Miami 1,011,468 1.618% 17 Georgia Atlanta 992,227 1.588% 18 New York New York City 970,921 1.553% 19 Nebraska Omaha 955,566 1.529% 20 Colorado Denver 909,768 1.456%
21 Oklahoma Oklahoma City 896,885 1.435%
AVERAGE 883,663 1.414% 22 Minnesota Minneapolis 836,978 1.339% 23 Colorado Colorado Springs 808,818 1.294% 24 Oklahoma Tulsa 792,025 1.267% 25 Florida Jacksonville 764,604 1.223%
26 Oregon Portland 742,413 1.188% 27 Maryland Baltimore 717,255 1.148% 28 New Mexico Albuquerque 708,511 1.134% 29 Illinois Chicago 708,281 1.133% 30 Arizona Mesa 697,294 1.116%
31 Tennessee Nashville 691,775 1.107% 32 Massachusetts Boston 677,750 1.084% 33 California Oakland 670,130 1.072% 34 Ohio Cleveland 664,890 1.064% 35 Wisconsin Milwaukee 651,883 1.043%
36 California San Jose 594,178 0.951% 37 California Fresno 585,022 0.936% 38 California Los Angeles 579,709 0.928% 39 North Carolina Charlotte 560,758 0.897% 40 Ohio Columbus 555,647 0.889%
41 California San Francisco 550,525 0.881% 42 Nevada Las Vegas 541,417 0.866% 43 California Long Beach 529,554 0.847% 44 California Sacramento 524,163 0.839% 45 California San Diego 523,426 0.837%
46 North Carolina Raleigh 430,858 0.689% 47 Kentucky Louisville 389,025 0.622% 48 Washington Seattle 354,095 0.567% 49 Hawaii Honolulu 302,591 0.484% 50 Virginia Virginia Beach 279,622 0.447%
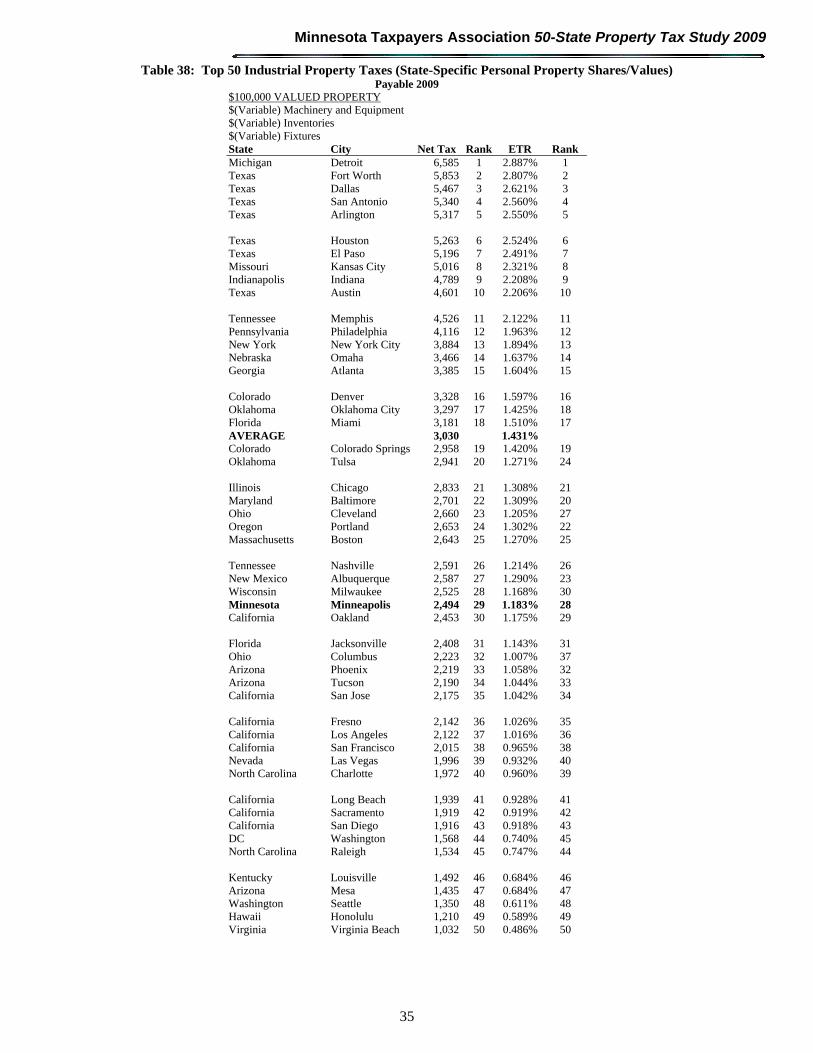
Minnesota Taxpayers Association 50-State Property Tax Study 2009
35
Table 38: Top 50 Industrial Property Taxes (State-Specific Personal Property Shares/Values) Payable 2009
$100,000 VALUED PROPERTY $(Variable) Machinery and Equipment $(Variable) Inventories $(Variable) Fixtures State City Net Tax Rank ETR Rank Michigan Detroit 6,585 1 2.887% 1 Texas Fort Worth 5,853 2 2.807% 2 Texas Dallas 5,467 3 2.621% 3 Texas San Antonio 5,340 4 2.560% 4 Texas Arlington 5,317 5 2.550% 5 Texas Houston 5,263 6 2.524% 6 Texas El Paso 5,196 7 2.491% 7 Missouri Kansas City 5,016 8 2.321% 8 Indianapolis Indiana 4,789 9 2.208% 9 Texas Austin 4,601 10 2.206% 10 Tennessee Memphis 4,526 11 2.122% 11 Pennsylvania Philadelphia 4,116 12 1.963% 12 New York New York City 3,884 13 1.894% 13 Nebraska Omaha 3,466 14 1.637% 14 Georgia Atlanta 3,385 15 1.604% 15 Colorado Denver 3,328 16 1.597% 16 Oklahoma Oklahoma City 3,297 17 1.425% 18 Florida Miami 3,181 18 1.510% 17 AVERAGE 3,030 1.431% Colorado Colorado Springs 2,958 19 1.420% 19 Oklahoma Tulsa 2,941 20 1.271% 24 Illinois Chicago 2,833 21 1.308% 21 Maryland Baltimore 2,701 22 1.309% 20 Ohio Cleveland 2,660 23 1.205% 27 Oregon Portland 2,653 24 1.302% 22 Massachusetts Boston 2,643 25 1.270% 25 Tennessee Nashville 2,591 26 1.214% 26 New Mexico Albuquerque 2,587 27 1.290% 23 Wisconsin Milwaukee 2,525 28 1.168% 30 Minnesota Minneapolis 2,494 29 1.183% 28 California Oakland 2,453 30 1.175% 29 Florida Jacksonville 2,408 31 1.143% 31 Ohio Columbus 2,223 32 1.007% 37 Arizona Phoenix 2,219 33 1.058% 32 Arizona Tucson 2,190 34 1.044% 33 California San Jose 2,175 35 1.042% 34 California Fresno 2,142 36 1.026% 35 California Los Angeles 2,122 37 1.016% 36 California San Francisco 2,015 38 0.965% 38 Nevada Las Vegas 1,996 39 0.932% 40 North Carolina Charlotte 1,972 40 0.960% 39 California Long Beach 1,939 41 0.928% 41 California Sacramento 1,919 42 0.919% 42 California San Diego 1,916 43 0.918% 43 DC Washington 1,568 44 0.740% 45 North Carolina Raleigh 1,534 45 0.747% 44 Kentucky Louisville 1,492 46 0.684% 46 Arizona Mesa 1,435 47 0.684% 47 Washington Seattle 1,350 48 0.611% 48 Hawaii Honolulu 1,210 49 0.589% 49 Virginia Virginia Beach 1,032 50 0.486% 50
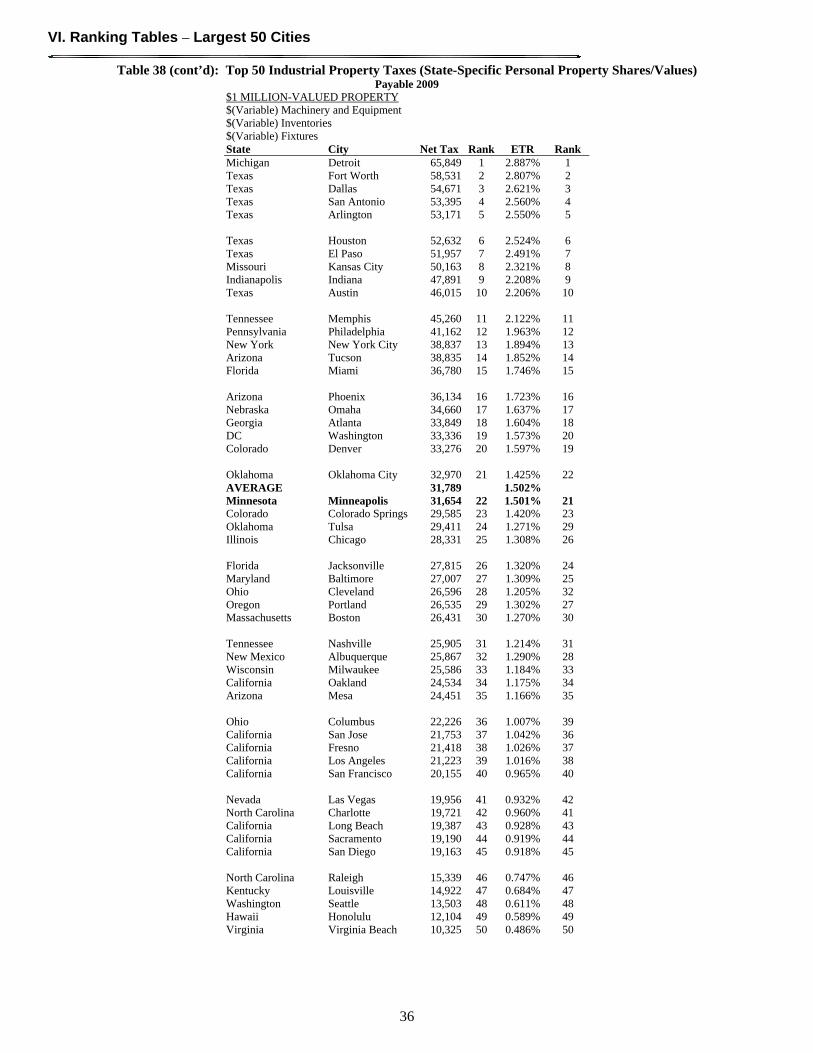
VI. Ranking Tables – Largest 50 Cities
36
Table 38 (cont’d): Top 50 Industrial Property Taxes (State-Specific Personal Property Shares/Values) Payable 2009
$1 MILLION-VALUED PROPERTY $(Variable) Machinery and Equipment $(Variable) Inventories $(Variable) Fixtures State City Net Tax Rank ETR Rank Michigan Detroit 65,849 1 2.887% 1 Texas Fort Worth 58,531 2 2.807% 2 Texas Dallas 54,671 3 2.621% 3 Texas San Antonio 53,395 4 2.560% 4 Texas Arlington 53,171 5 2.550% 5 Texas Houston 52,632 6 2.524% 6 Texas El Paso 51,957 7 2.491% 7 Missouri Kansas City 50,163 8 2.321% 8 Indianapolis Indiana 47,891 9 2.208% 9 Texas Austin 46,015 10 2.206% 10 Tennessee Memphis 45,260 11 2.122% 11 Pennsylvania Philadelphia 41,162 12 1.963% 12 New York New York City 38,837 13 1.894% 13 Arizona Tucson 38,835 14 1.852% 14 Florida Miami 36,780 15 1.746% 15 Arizona Phoenix 36,134 16 1.723% 16 Nebraska Omaha 34,660 17 1.637% 17 Georgia Atlanta 33,849 18 1.604% 18 DC Washington 33,336 19 1.573% 20 Colorado Denver 33,276 20 1.597% 19 Oklahoma Oklahoma City 32,970 21 1.425% 22 AVERAGE 31,789 1.502% Minnesota Minneapolis 31,654 22 1.501% 21 Colorado Colorado Springs 29,585 23 1.420% 23 Oklahoma Tulsa 29,411 24 1.271% 29 Illinois Chicago 28,331 25 1.308% 26 Florida Jacksonville 27,815 26 1.320% 24 Maryland Baltimore 27,007 27 1.309% 25 Ohio Cleveland 26,596 28 1.205% 32 Oregon Portland 26,535 29 1.302% 27 Massachusetts Boston 26,431 30 1.270% 30 Tennessee Nashville 25,905 31 1.214% 31 New Mexico Albuquerque 25,867 32 1.290% 28 Wisconsin Milwaukee 25,586 33 1.184% 33 California Oakland 24,534 34 1.175% 34 Arizona Mesa 24,451 35 1.166% 35 Ohio Columbus 22,226 36 1.007% 39 California San Jose 21,753 37 1.042% 36 California Fresno 21,418 38 1.026% 37 California Los Angeles 21,223 39 1.016% 38 California San Francisco 20,155 40 0.965% 40 Nevada Las Vegas 19,956 41 0.932% 42 North Carolina Charlotte 19,721 42 0.960% 41 California Long Beach 19,387 43 0.928% 43 California Sacramento 19,190 44 0.919% 44 California San Diego 19,163 45 0.918% 45 North Carolina Raleigh 15,339 46 0.747% 46 Kentucky Louisville 14,922 47 0.684% 47 Washington Seattle 13,503 48 0.611% 48 Hawaii Honolulu 12,104 49 0.589% 49 Virginia Virginia Beach 10,325 50 0.486% 50
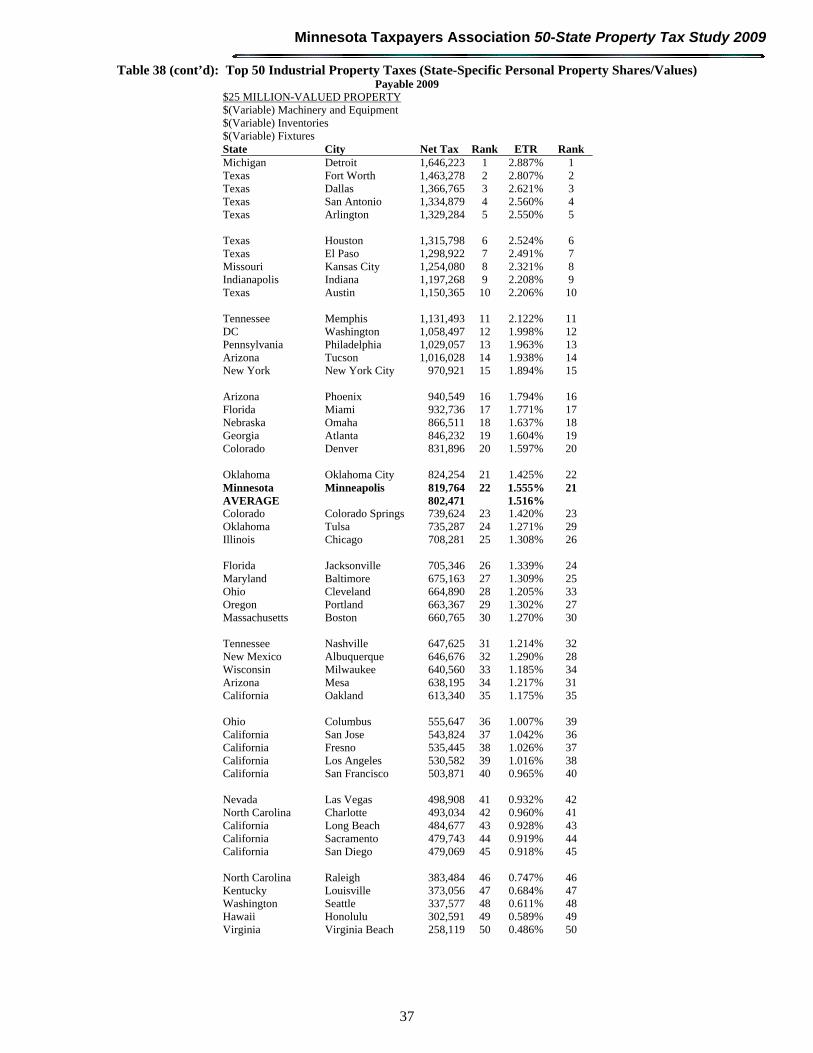
Minnesota Taxpayers Association 50-State Property Tax Study 2009
37
Table 38 (cont’d): Top 50 Industrial Property Taxes (State-Specific Personal Property Shares/Values) Payable 2009
$25 MILLION-VALUED PROPERTY $(Variable) Machinery and Equipment $(Variable) Inventories $(Variable) Fixtures State City Net Tax Rank ETR Rank Michigan Detroit 1,646,223 1 2.887% 1 Texas Fort Worth 1,463,278 2 2.807% 2 Texas Dallas 1,366,765 3 2.621% 3 Texas San Antonio 1,334,879 4 2.560% 4 Texas Arlington 1,329,284 5 2.550% 5 Texas Houston 1,315,798 6 2.524% 6 Texas El Paso 1,298,922 7 2.491% 7 Missouri Kansas City 1,254,080 8 2.321% 8 Indianapolis Indiana 1,197,268 9 2.208% 9 Texas Austin 1,150,365 10 2.206% 10 Tennessee Memphis 1,131,493 11 2.122% 11 DC Washington 1,058,497 12 1.998% 12 Pennsylvania Philadelphia 1,029,057 13 1.963% 13 Arizona Tucson 1,016,028 14 1.938% 14 New York New York City 970,921 15 1.894% 15 Arizona Phoenix 940,549 16 1.794% 16 Florida Miami 932,736 17 1.771% 17 Nebraska Omaha 866,511 18 1.637% 18 Georgia Atlanta 846,232 19 1.604% 19 Colorado Denver 831,896 20 1.597% 20 Oklahoma Oklahoma City 824,254 21 1.425% 22 Minnesota Minneapolis 819,764 22 1.555% 21 AVERAGE 802,471 1.516% Colorado Colorado Springs 739,624 23 1.420% 23 Oklahoma Tulsa 735,287 24 1.271% 29 Illinois Chicago 708,281 25 1.308% 26 Florida Jacksonville 705,346 26 1.339% 24 Maryland Baltimore 675,163 27 1.309% 25 Ohio Cleveland 664,890 28 1.205% 33 Oregon Portland 663,367 29 1.302% 27 Massachusetts Boston 660,765 30 1.270% 30 Tennessee Nashville 647,625 31 1.214% 32 New Mexico Albuquerque 646,676 32 1.290% 28 Wisconsin Milwaukee 640,560 33 1.185% 34 Arizona Mesa 638,195 34 1.217% 31 California Oakland 613,340 35 1.175% 35 Ohio Columbus 555,647 36 1.007% 39 California San Jose 543,824 37 1.042% 36 California Fresno 535,445 38 1.026% 37 California Los Angeles 530,582 39 1.016% 38 California San Francisco 503,871 40 0.965% 40 Nevada Las Vegas 498,908 41 0.932% 42 North Carolina Charlotte 493,034 42 0.960% 41 California Long Beach 484,677 43 0.928% 43 California Sacramento 479,743 44 0.919% 44 California San Diego 479,069 45 0.918% 45 North Carolina Raleigh 383,484 46 0.747% 46 Kentucky Louisville 373,056 47 0.684% 47 Washington Seattle 337,577 48 0.611% 48 Hawaii Honolulu 302,591 49 0.589% 49 Virginia Virginia Beach 258,119 50 0.486% 50
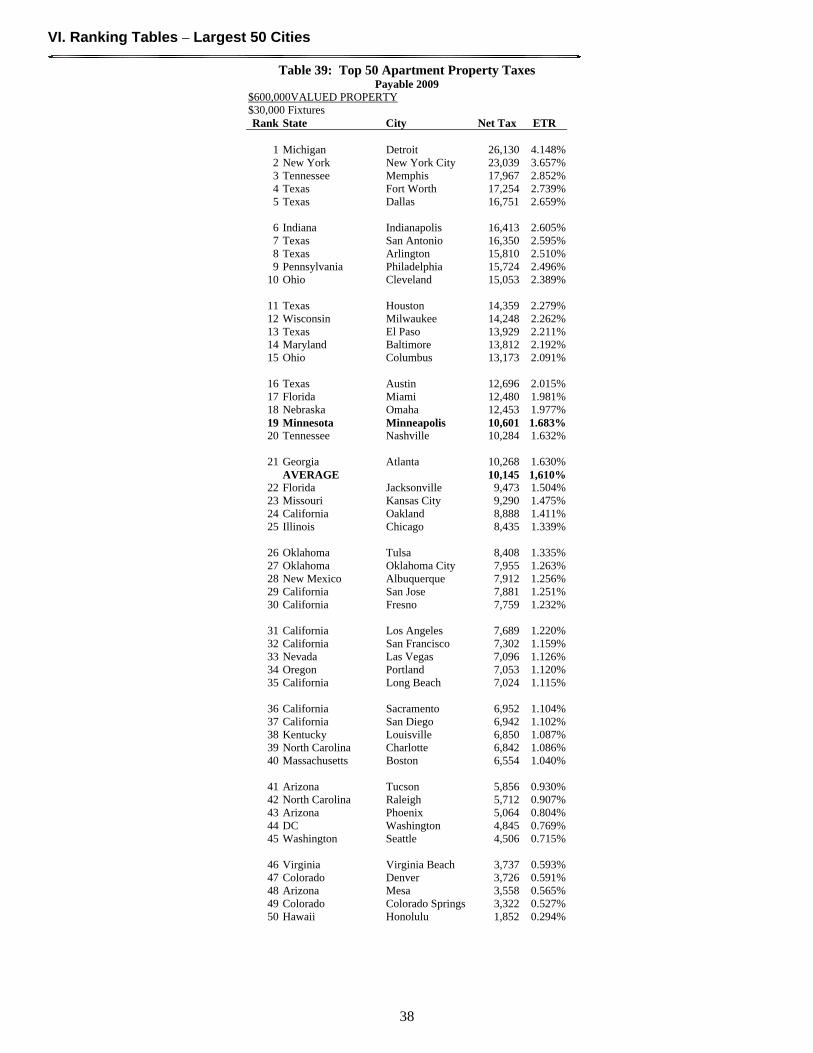
VI. Ranking Tables – Largest 50 Cities
38
Table 39: Top 50 Apartment Property Taxes Payable 2009
$600,000VALUED PROPERTY $30,000 Fixtures Rank State City Net Tax ETR
1 Michigan Detroit 26,130 4.148%2 New York New York City 23,039 3.657%3 Tennessee Memphis 17,967 2.852%4 Texas Fort Worth 17,254 2.739%5 Texas Dallas 16,751 2.659%
6 Indiana Indianapolis 16,413 2.605%7 Texas San Antonio 16,350 2.595%8 Texas Arlington 15,810 2.510%9 Pennsylvania Philadelphia 15,724 2.496%
10 Ohio Cleveland 15,053 2.389%
11 Texas Houston 14,359 2.279%12 Wisconsin Milwaukee 14,248 2.262%13 Texas El Paso 13,929 2.211%14 Maryland Baltimore 13,812 2.192%15 Ohio Columbus 13,173 2.091%
16 Texas Austin 12,696 2.015%17 Florida Miami 12,480 1.981%18 Nebraska Omaha 12,453 1.977%19 Minnesota Minneapolis 10,601 1.683%20 Tennessee Nashville 10,284 1.632%
21 Georgia Atlanta 10,268 1.630%
AVERAGE 10,145 1,610%22 Florida Jacksonville 9,473 1.504%23 Missouri Kansas City 9,290 1.475%24 California Oakland 8,888 1.411%25 Illinois Chicago 8,435 1.339%
26 Oklahoma Tulsa 8,408 1.335%27 Oklahoma Oklahoma City 7,955 1.263%28 New Mexico Albuquerque 7,912 1.256%29 California San Jose 7,881 1.251%30 California Fresno 7,759 1.232%
31 California Los Angeles 7,689 1.220%32 California San Francisco 7,302 1.159%33 Nevada Las Vegas 7,096 1.126%34 Oregon Portland 7,053 1.120%35 California Long Beach 7,024 1.115%
36 California Sacramento 6,952 1.104%37 California San Diego 6,942 1.102%38 Kentucky Louisville 6,850 1.087%39 North Carolina Charlotte 6,842 1.086%40 Massachusetts Boston 6,554 1.040%
41 Arizona Tucson 5,856 0.930%42 North Carolina Raleigh 5,712 0.907%43 Arizona Phoenix 5,064 0.804%44 DC Washington 4,845 0.769%45 Washington Seattle 4,506 0.715%
46 Virginia Virginia Beach 3,737 0.593%47 Colorado Denver 3,726 0.591%48 Arizona Mesa 3,558 0.565%49 Colorado Colorado Springs 3,322 0.527%50 Hawaii Honolulu 1,852 0.294%
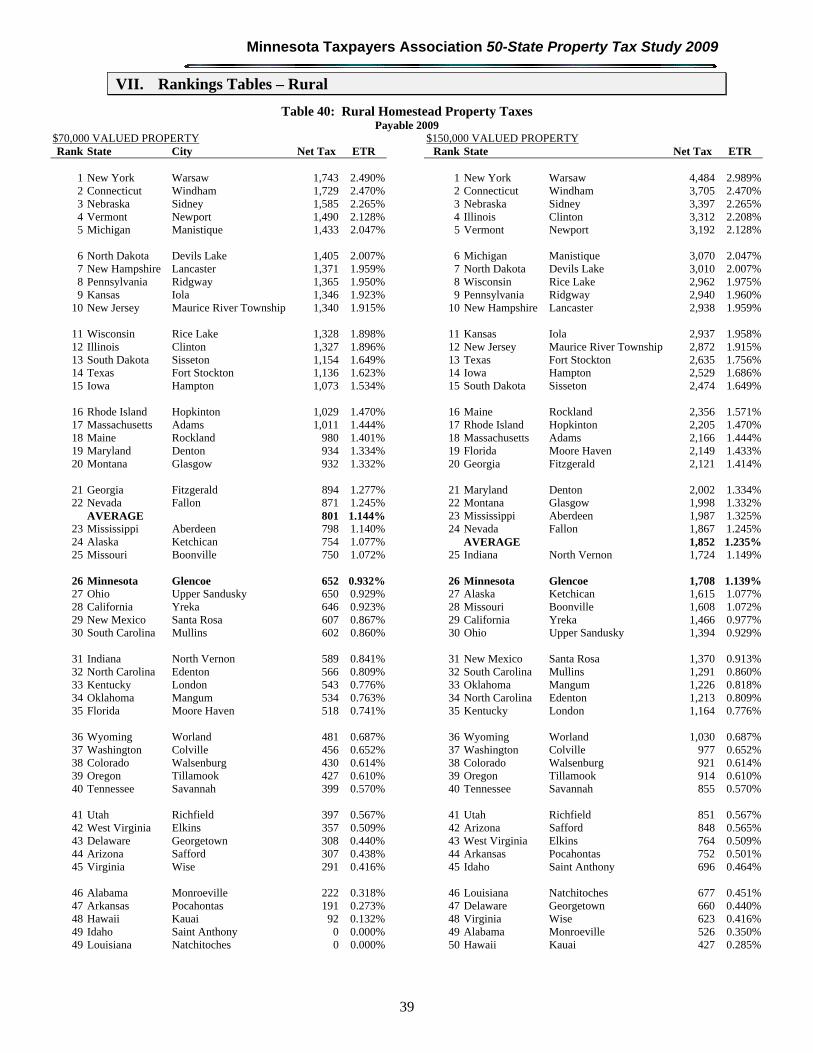
Minnesota Taxpayers Association 50-State Property Tax Study 2009
39
VII. Rankings Tables – Rural
Table 40: Rural Homestead Property Taxes Payable 2009
$70,000 VALUED PROPERTY $150,000 VALUED PROPERTY Rank State City Net Tax ETR Rank State Net Tax ETR
1 New York Warsaw 1,743 2.490% 1 New York Warsaw 4,484 2.989%2 Connecticut Windham 1,729 2.470% 2 Connecticut Windham 3,705 2.470%3 Nebraska Sidney 1,585 2.265% 3 Nebraska Sidney 3,397 2.265%4 Vermont Newport 1,490 2.128% 4 Illinois Clinton 3,312 2.208%5 Michigan Manistique 1,433 2.047% 5 Vermont Newport 3,192 2.128%
6 North Dakota Devils Lake 1,405 2.007% 6 Michigan Manistique 3,070 2.047%7 New Hampshire Lancaster 1,371 1.959% 7 North Dakota Devils Lake 3,010 2.007%8 Pennsylvania Ridgway 1,365 1.950% 8 Wisconsin Rice Lake 2,962 1.975%9 Kansas Iola 1,346 1.923% 9 Pennsylvania Ridgway 2,940 1.960%
10 New Jersey Maurice River Township 1,340 1.915% 10 New Hampshire Lancaster 2,938 1.959%
11 Wisconsin Rice Lake 1,328 1.898% 11 Kansas Iola 2,937 1.958%12 Illinois Clinton 1,327 1.896% 12 New Jersey Maurice River Township 2,872 1.915%13 South Dakota Sisseton 1,154 1.649% 13 Texas Fort Stockton 2,635 1.756%14 Texas Fort Stockton 1,136 1.623% 14 Iowa Hampton 2,529 1.686%15 Iowa Hampton 1,073 1.534% 15 South Dakota Sisseton 2,474 1.649%
16 Rhode Island Hopkinton 1,029 1.470% 16 Maine Rockland 2,356 1.571%17 Massachusetts Adams 1,011 1.444% 17 Rhode Island Hopkinton 2,205 1.470%18 Maine Rockland 980 1.401% 18 Massachusetts Adams 2,166 1.444%19 Maryland Denton 934 1.334% 19 Florida Moore Haven 2,149 1.433%20 Montana Glasgow 932 1.332% 20 Georgia Fitzgerald 2,121 1.414%
21 Georgia Fitzgerald 894 1.277% 21 Maryland Denton 2,002 1.334%22 Nevada Fallon 871 1.245% 22 Montana Glasgow 1,998 1.332%
AVERAGE 801 1.144% 23 Mississippi Aberdeen 1,987 1.325%23 Mississippi Aberdeen 798 1.140% 24 Nevada Fallon 1,867 1.245%24 Alaska Ketchican 754 1.077% AVERAGE 1,852 1.235%25 Missouri Boonville 750 1.072% 25 Indiana North Vernon 1,724 1.149%
26 Minnesota Glencoe 652 0.932% 26 Minnesota Glencoe 1,708 1.139%27 Ohio Upper Sandusky 650 0.929% 27 Alaska Ketchican 1,615 1.077%28 California Yreka 646 0.923% 28 Missouri Boonville 1,608 1.072%29 New Mexico Santa Rosa 607 0.867% 29 California Yreka 1,466 0.977%30 South Carolina Mullins 602 0.860% 30 Ohio Upper Sandusky 1,394 0.929%
31 Indiana North Vernon 589 0.841% 31 New Mexico Santa Rosa 1,370 0.913%32 North Carolina Edenton 566 0.809% 32 South Carolina Mullins 1,291 0.860%33 Kentucky London 543 0.776% 33 Oklahoma Mangum 1,226 0.818%34 Oklahoma Mangum 534 0.763% 34 North Carolina Edenton 1,213 0.809%35 Florida Moore Haven 518 0.741% 35 Kentucky London 1,164 0.776%
36 Wyoming Worland 481 0.687% 36 Wyoming Worland 1,030 0.687%37 Washington Colville 456 0.652% 37 Washington Colville 977 0.652%38 Colorado Walsenburg 430 0.614% 38 Colorado Walsenburg 921 0.614%39 Oregon Tillamook 427 0.610% 39 Oregon Tillamook 914 0.610%40 Tennessee Savannah 399 0.570% 40 Tennessee Savannah 855 0.570%
41 Utah Richfield 397 0.567% 41 Utah Richfield 851 0.567%42 West Virginia Elkins 357 0.509% 42 Arizona Safford 848 0.565%43 Delaware Georgetown 308 0.440% 43 West Virginia Elkins 764 0.509%44 Arizona Safford 307 0.438% 44 Arkansas Pocahontas 752 0.501%45 Virginia Wise 291 0.416% 45 Idaho Saint Anthony 696 0.464%
46 Alabama Monroeville 222 0.318% 46 Louisiana Natchitoches 677 0.451%47 Arkansas Pocahontas 191 0.273% 47 Delaware Georgetown 660 0.440%48 Hawaii Kauai 92 0.132% 48 Virginia Wise 623 0.416%49 Idaho Saint Anthony 0 0.000% 49 Alabama Monroeville 526 0.350%49 Louisiana Natchitoches 0 0.000% 50 Hawaii Kauai 427 0.285%
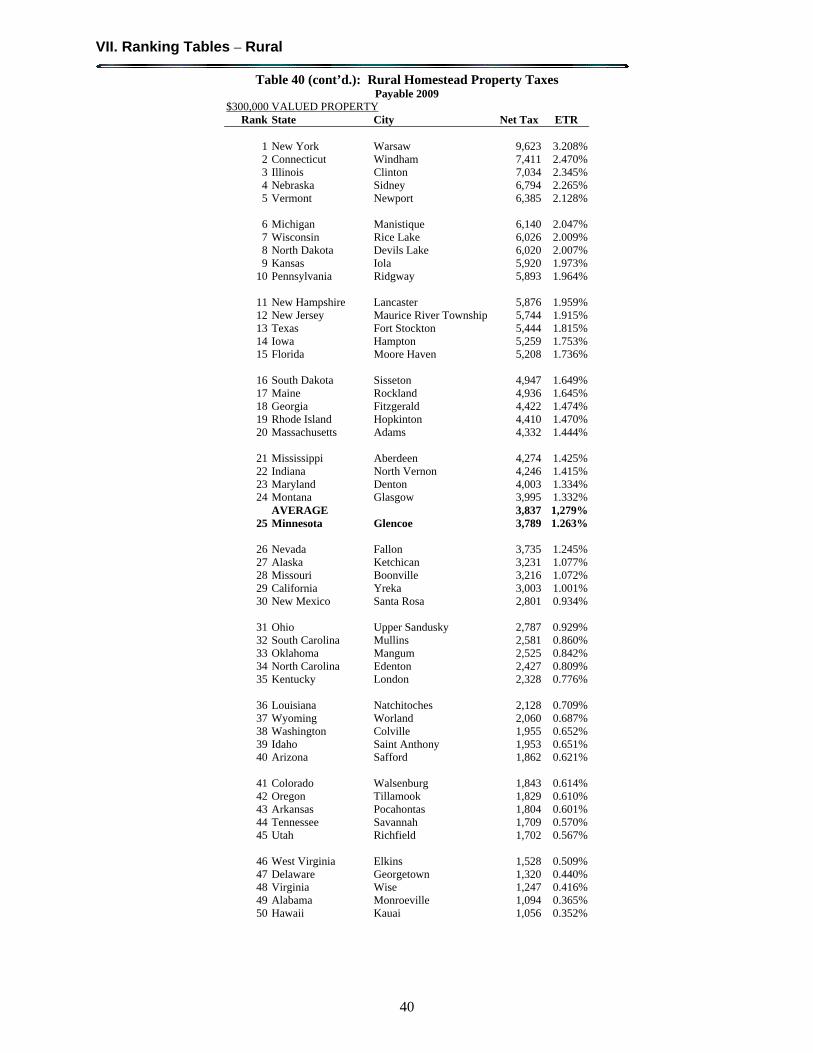
VII. Ranking Tables – Rural
40
Table 40 (cont’d.): Rural Homestead Property Taxes Payable 2009
$300,000 VALUED PROPERTY Rank State City Net Tax ETR
1 New York Warsaw 9,623 3.208% 2 Connecticut Windham 7,411 2.470% 3 Illinois Clinton 7,034 2.345% 4 Nebraska Sidney 6,794 2.265% 5 Vermont Newport 6,385 2.128%
6 Michigan Manistique 6,140 2.047% 7 Wisconsin Rice Lake 6,026 2.009% 8 North Dakota Devils Lake 6,020 2.007% 9 Kansas Iola 5,920 1.973%
10 Pennsylvania Ridgway 5,893 1.964%
11 New Hampshire Lancaster 5,876 1.959% 12 New Jersey Maurice River Township 5,744 1.915% 13 Texas Fort Stockton 5,444 1.815% 14 Iowa Hampton 5,259 1.753% 15 Florida Moore Haven 5,208 1.736%
16 South Dakota Sisseton 4,947 1.649% 17 Maine Rockland 4,936 1.645% 18 Georgia Fitzgerald 4,422 1.474% 19 Rhode Island Hopkinton 4,410 1.470% 20 Massachusetts Adams 4,332 1.444%
21 Mississippi Aberdeen 4,274 1.425% 22 Indiana North Vernon 4,246 1.415% 23 Maryland Denton 4,003 1.334% 24 Montana Glasgow 3,995 1.332%
AVERAGE 3,837 1,279% 25 Minnesota Glencoe 3,789 1.263%
26 Nevada Fallon 3,735 1.245% 27 Alaska Ketchican 3,231 1.077% 28 Missouri Boonville 3,216 1.072% 29 California Yreka 3,003 1.001% 30 New Mexico Santa Rosa 2,801 0.934%
31 Ohio Upper Sandusky 2,787 0.929% 32 South Carolina Mullins 2,581 0.860% 33 Oklahoma Mangum 2,525 0.842% 34 North Carolina Edenton 2,427 0.809% 35 Kentucky London 2,328 0.776%
36 Louisiana Natchitoches 2,128 0.709% 37 Wyoming Worland 2,060 0.687% 38 Washington Colville 1,955 0.652% 39 Idaho Saint Anthony 1,953 0.651% 40 Arizona Safford 1,862 0.621%
41 Colorado Walsenburg 1,843 0.614% 42 Oregon Tillamook 1,829 0.610% 43 Arkansas Pocahontas 1,804 0.601% 44 Tennessee Savannah 1,709 0.570% 45 Utah Richfield 1,702 0.567%
46 West Virginia Elkins 1,528 0.509% 47 Delaware Georgetown 1,320 0.440% 48 Virginia Wise 1,247 0.416% 49 Alabama Monroeville 1,094 0.365% 50 Hawaii Kauai 1,056 0.352%
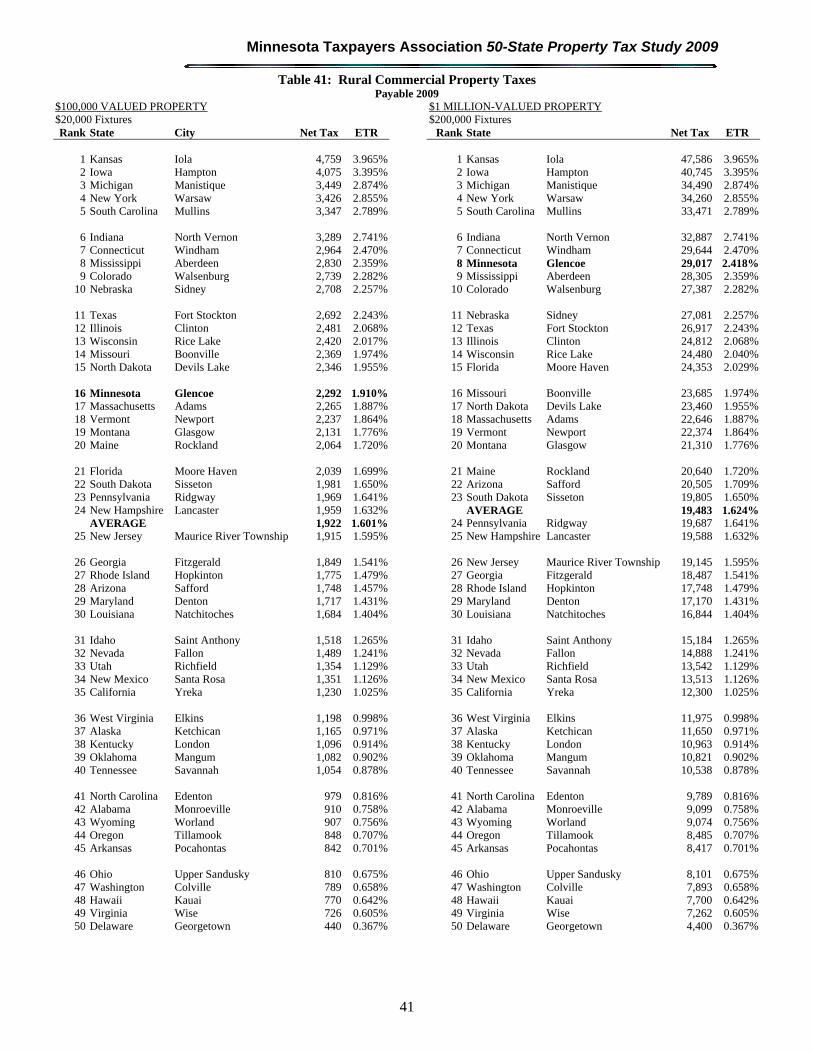
Minnesota Taxpayers Association 50-State Property Tax Study 2009
41
Table 41: Rural Commercial Property Taxes Payable 2009
$100,000 VALUED PROPERTY $1 MILLION-VALUED PROPERTY $20,000 Fixtures $200,000 Fixtures Rank State City Net Tax ETR Rank State Net Tax ETR
1 Kansas Iola 4,759 3.965% 1 Kansas Iola 47,586 3.965%2 Iowa Hampton 4,075 3.395% 2 Iowa Hampton 40,745 3.395%3 Michigan Manistique 3,449 2.874% 3 Michigan Manistique 34,490 2.874%4 New York Warsaw 3,426 2.855% 4 New York Warsaw 34,260 2.855%5 South Carolina Mullins 3,347 2.789% 5 South Carolina Mullins 33,471 2.789%
6 Indiana North Vernon 3,289 2.741% 6 Indiana North Vernon 32,887 2.741%7 Connecticut Windham 2,964 2.470% 7 Connecticut Windham 29,644 2.470%8 Mississippi Aberdeen 2,830 2.359% 8 Minnesota Glencoe 29,017 2.418%9 Colorado Walsenburg 2,739 2.282% 9 Mississippi Aberdeen 28,305 2.359%
10 Nebraska Sidney 2,708 2.257% 10 Colorado Walsenburg 27,387 2.282%
11 Texas Fort Stockton 2,692 2.243% 11 Nebraska Sidney 27,081 2.257%12 Illinois Clinton 2,481 2.068% 12 Texas Fort Stockton 26,917 2.243%13 Wisconsin Rice Lake 2,420 2.017% 13 Illinois Clinton 24,812 2.068%14 Missouri Boonville 2,369 1.974% 14 Wisconsin Rice Lake 24,480 2.040%15 North Dakota Devils Lake 2,346 1.955% 15 Florida Moore Haven 24,353 2.029%
16 Minnesota Glencoe 2,292 1.910% 16 Missouri Boonville 23,685 1.974%17 Massachusetts Adams 2,265 1.887% 17 North Dakota Devils Lake 23,460 1.955%18 Vermont Newport 2,237 1.864% 18 Massachusetts Adams 22,646 1.887%19 Montana Glasgow 2,131 1.776% 19 Vermont Newport 22,374 1.864%20 Maine Rockland 2,064 1.720% 20 Montana Glasgow 21,310 1.776%
21 Florida Moore Haven 2,039 1.699% 21 Maine Rockland 20,640 1.720%22 South Dakota Sisseton 1,981 1.650% 22 Arizona Safford 20,505 1.709%23 Pennsylvania Ridgway 1,969 1.641% 23 South Dakota Sisseton 19,805 1.650%24 New Hampshire Lancaster 1,959 1.632% AVERAGE 19,483 1.624%
AVERAGE 1,922 1.601% 24 Pennsylvania Ridgway 19,687 1.641%25 New Jersey Maurice River Township 1,915 1.595% 25 New Hampshire Lancaster 19,588 1.632%
26 Georgia Fitzgerald 1,849 1.541% 26 New Jersey Maurice River Township 19,145 1.595%27 Rhode Island Hopkinton 1,775 1.479% 27 Georgia Fitzgerald 18,487 1.541%28 Arizona Safford 1,748 1.457% 28 Rhode Island Hopkinton 17,748 1.479%29 Maryland Denton 1,717 1.431% 29 Maryland Denton 17,170 1.431%30 Louisiana Natchitoches 1,684 1.404% 30 Louisiana Natchitoches 16,844 1.404%
31 Idaho Saint Anthony 1,518 1.265% 31 Idaho Saint Anthony 15,184 1.265%32 Nevada Fallon 1,489 1.241% 32 Nevada Fallon 14,888 1.241%33 Utah Richfield 1,354 1.129% 33 Utah Richfield 13,542 1.129%34 New Mexico Santa Rosa 1,351 1.126% 34 New Mexico Santa Rosa 13,513 1.126%35 California Yreka 1,230 1.025% 35 California Yreka 12,300 1.025%
36 West Virginia Elkins 1,198 0.998% 36 West Virginia Elkins 11,975 0.998%37 Alaska Ketchican 1,165 0.971% 37 Alaska Ketchican 11,650 0.971%38 Kentucky London 1,096 0.914% 38 Kentucky London 10,963 0.914%39 Oklahoma Mangum 1,082 0.902% 39 Oklahoma Mangum 10,821 0.902%40 Tennessee Savannah 1,054 0.878% 40 Tennessee Savannah 10,538 0.878%
41 North Carolina Edenton 979 0.816% 41 North Carolina Edenton 9,789 0.816%42 Alabama Monroeville 910 0.758% 42 Alabama Monroeville 9,099 0.758%43 Wyoming Worland 907 0.756% 43 Wyoming Worland 9,074 0.756%44 Oregon Tillamook 848 0.707% 44 Oregon Tillamook 8,485 0.707%45 Arkansas Pocahontas 842 0.701% 45 Arkansas Pocahontas 8,417 0.701%
46 Ohio Upper Sandusky 810 0.675% 46 Ohio Upper Sandusky 8,101 0.675%47 Washington Colville 789 0.658% 47 Washington Colville 7,893 0.658%48 Hawaii Kauai 770 0.642% 48 Hawaii Kauai 7,700 0.642%49 Virginia Wise 726 0.605% 49 Virginia Wise 7,262 0.605%50 Delaware Georgetown 440 0.367% 50 Delaware Georgetown 4,400 0.367%
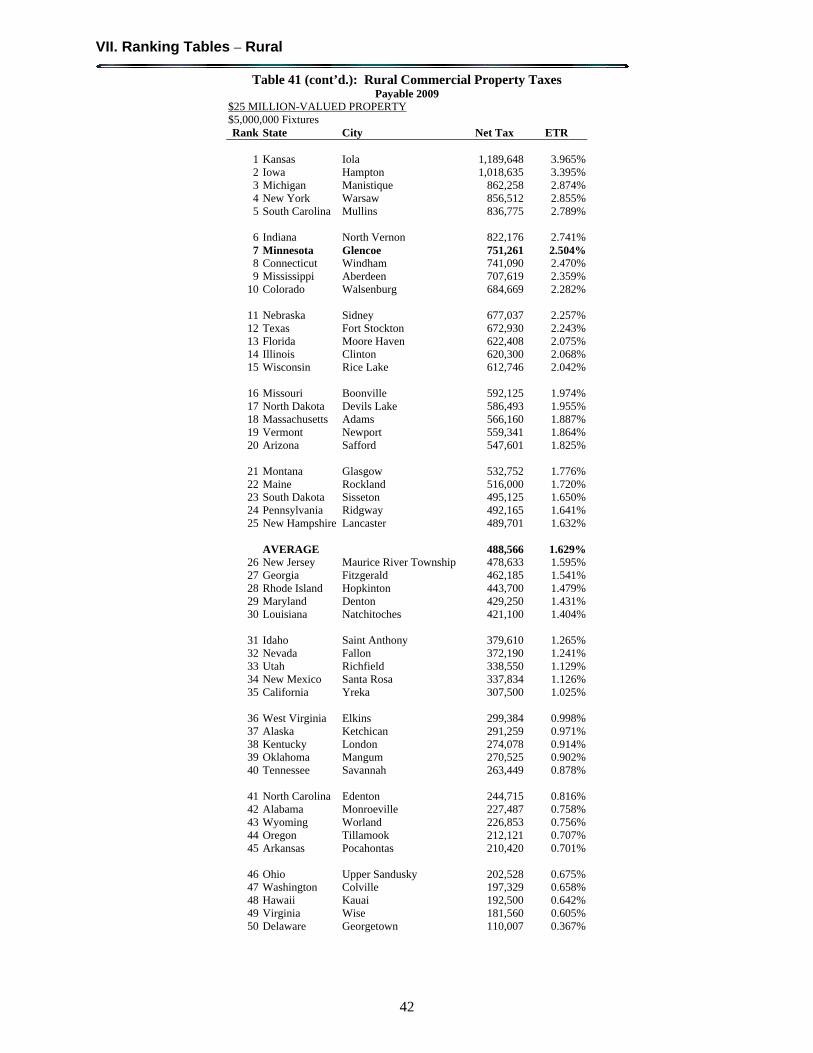
VII. Ranking Tables – Rural
42
Table 41 (cont’d.): Rural Commercial Property Taxes Payable 2009
$25 MILLION-VALUED PROPERTY $5,000,000 Fixtures Rank State City Net Tax ETR
1 Kansas Iola 1,189,648 3.965% 2 Iowa Hampton 1,018,635 3.395% 3 Michigan Manistique 862,258 2.874% 4 New York Warsaw 856,512 2.855% 5 South Carolina Mullins 836,775 2.789%
6 Indiana North Vernon 822,176 2.741% 7 Minnesota Glencoe 751,261 2.504% 8 Connecticut Windham 741,090 2.470% 9 Mississippi Aberdeen 707,619 2.359%
10 Colorado Walsenburg 684,669 2.282%
11 Nebraska Sidney 677,037 2.257% 12 Texas Fort Stockton 672,930 2.243% 13 Florida Moore Haven 622,408 2.075% 14 Illinois Clinton 620,300 2.068% 15 Wisconsin Rice Lake 612,746 2.042%
16 Missouri Boonville 592,125 1.974% 17 North Dakota Devils Lake 586,493 1.955% 18 Massachusetts Adams 566,160 1.887% 19 Vermont Newport 559,341 1.864% 20 Arizona Safford 547,601 1.825%
21 Montana Glasgow 532,752 1.776% 22 Maine Rockland 516,000 1.720% 23 South Dakota Sisseton 495,125 1.650% 24 Pennsylvania Ridgway 492,165 1.641% 25 New Hampshire Lancaster 489,701 1.632%
AVERAGE 488,566 1.629%
26 New Jersey Maurice River Township 478,633 1.595% 27 Georgia Fitzgerald 462,185 1.541% 28 Rhode Island Hopkinton 443,700 1.479% 29 Maryland Denton 429,250 1.431% 30 Louisiana Natchitoches 421,100 1.404%
31 Idaho Saint Anthony 379,610 1.265% 32 Nevada Fallon 372,190 1.241% 33 Utah Richfield 338,550 1.129% 34 New Mexico Santa Rosa 337,834 1.126% 35 California Yreka 307,500 1.025%
36 West Virginia Elkins 299,384 0.998% 37 Alaska Ketchican 291,259 0.971% 38 Kentucky London 274,078 0.914% 39 Oklahoma Mangum 270,525 0.902% 40 Tennessee Savannah 263,449 0.878%
41 North Carolina Edenton 244,715 0.816% 42 Alabama Monroeville 227,487 0.758% 43 Wyoming Worland 226,853 0.756% 44 Oregon Tillamook 212,121 0.707% 45 Arkansas Pocahontas 210,420 0.701%
46 Ohio Upper Sandusky 202,528 0.675% 47 Washington Colville 197,329 0.658% 48 Hawaii Kauai 192,500 0.642% 49 Virginia Wise 181,560 0.605% 50 Delaware Georgetown 110,007 0.367%
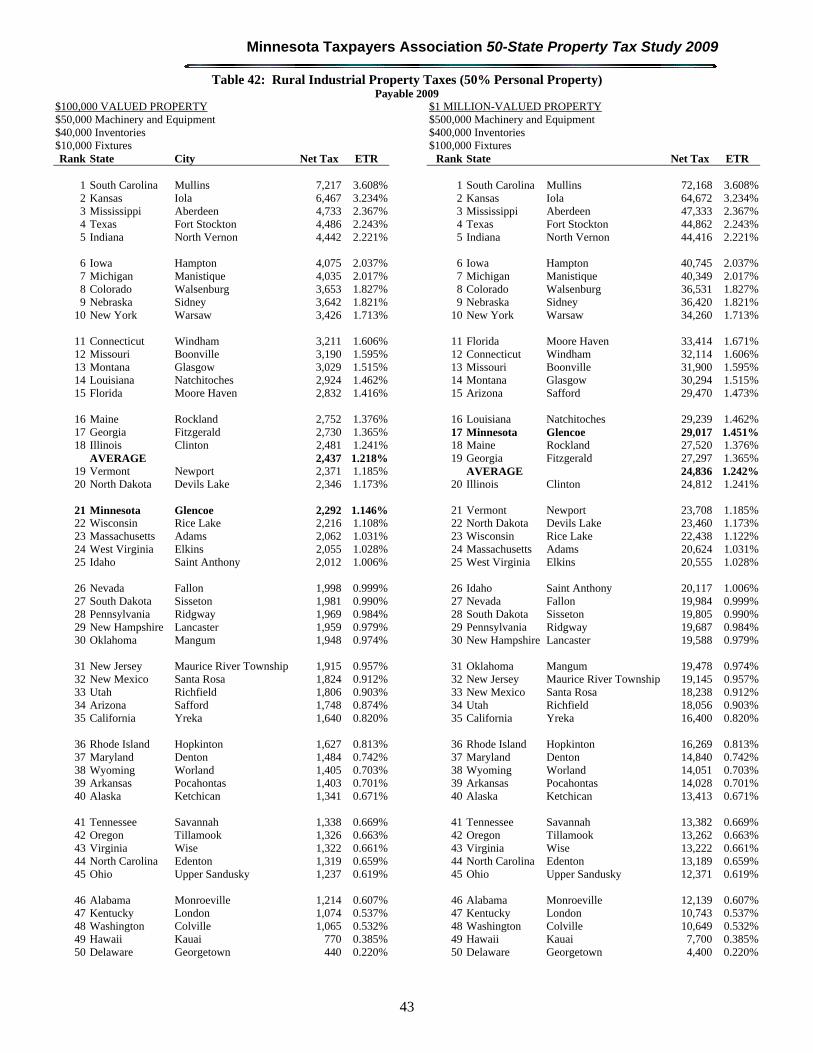
Minnesota Taxpayers Association 50-State Property Tax Study 2009
43
Table 42: Rural Industrial Property Taxes (50% Personal Property) Payable 2009
$100,000 VALUED PROPERTY $1 MILLION-VALUED PROPERTY $50,000 Machinery and Equipment $500,000 Machinery and Equipment $40,000 Inventories $400,000 Inventories $10,000 Fixtures $100,000 Fixtures Rank State City Net Tax ETR Rank State Net Tax ETR
1 South Carolina Mullins 7,217 3.608% 1 South Carolina Mullins 72,168 3.608%2 Kansas Iola 6,467 3.234% 2 Kansas Iola 64,672 3.234%3 Mississippi Aberdeen 4,733 2.367% 3 Mississippi Aberdeen 47,333 2.367%4 Texas Fort Stockton 4,486 2.243% 4 Texas Fort Stockton 44,862 2.243%5 Indiana North Vernon 4,442 2.221% 5 Indiana North Vernon 44,416 2.221%
6 Iowa Hampton 4,075 2.037% 6 Iowa Hampton 40,745 2.037%7 Michigan Manistique 4,035 2.017% 7 Michigan Manistique 40,349 2.017%8 Colorado Walsenburg 3,653 1.827% 8 Colorado Walsenburg 36,531 1.827%9 Nebraska Sidney 3,642 1.821% 9 Nebraska Sidney 36,420 1.821%
10 New York Warsaw 3,426 1.713% 10 New York Warsaw 34,260 1.713%
11 Connecticut Windham 3,211 1.606% 11 Florida Moore Haven 33,414 1.671%12 Missouri Boonville 3,190 1.595% 12 Connecticut Windham 32,114 1.606%13 Montana Glasgow 3,029 1.515% 13 Missouri Boonville 31,900 1.595%14 Louisiana Natchitoches 2,924 1.462% 14 Montana Glasgow 30,294 1.515%15 Florida Moore Haven 2,832 1.416% 15 Arizona Safford 29,470 1.473%
16 Maine Rockland 2,752 1.376% 16 Louisiana Natchitoches 29,239 1.462%17 Georgia Fitzgerald 2,730 1.365% 17 Minnesota Glencoe 29,017 1.451%18 Illinois Clinton 2,481 1.241% 18 Maine Rockland 27,520 1.376%
AVERAGE 2,437 1.218% 19 Georgia Fitzgerald 27,297 1.365%19 Vermont Newport 2,371 1.185% AVERAGE 24,836 1.242%20 North Dakota Devils Lake 2,346 1.173% 20 Illinois Clinton 24,812 1.241%
21 Minnesota Glencoe 2,292 1.146% 21 Vermont Newport 23,708 1.185%22 Wisconsin Rice Lake 2,216 1.108% 22 North Dakota Devils Lake 23,460 1.173%23 Massachusetts Adams 2,062 1.031% 23 Wisconsin Rice Lake 22,438 1.122%24 West Virginia Elkins 2,055 1.028% 24 Massachusetts Adams 20,624 1.031%25 Idaho Saint Anthony 2,012 1.006% 25 West Virginia Elkins 20,555 1.028%
26 Nevada Fallon 1,998 0.999% 26 Idaho Saint Anthony 20,117 1.006%27 South Dakota Sisseton 1,981 0.990% 27 Nevada Fallon 19,984 0.999%28 Pennsylvania Ridgway 1,969 0.984% 28 South Dakota Sisseton 19,805 0.990%29 New Hampshire Lancaster 1,959 0.979% 29 Pennsylvania Ridgway 19,687 0.984%30 Oklahoma Mangum 1,948 0.974% 30 New Hampshire Lancaster 19,588 0.979%
31 New Jersey Maurice River Township 1,915 0.957% 31 Oklahoma Mangum 19,478 0.974%32 New Mexico Santa Rosa 1,824 0.912% 32 New Jersey Maurice River Township 19,145 0.957%33 Utah Richfield 1,806 0.903% 33 New Mexico Santa Rosa 18,238 0.912%34 Arizona Safford 1,748 0.874% 34 Utah Richfield 18,056 0.903%35 California Yreka 1,640 0.820% 35 California Yreka 16,400 0.820%
36 Rhode Island Hopkinton 1,627 0.813% 36 Rhode Island Hopkinton 16,269 0.813%37 Maryland Denton 1,484 0.742% 37 Maryland Denton 14,840 0.742%38 Wyoming Worland 1,405 0.703% 38 Wyoming Worland 14,051 0.703%39 Arkansas Pocahontas 1,403 0.701% 39 Arkansas Pocahontas 14,028 0.701%40 Alaska Ketchican 1,341 0.671% 40 Alaska Ketchican 13,413 0.671%
41 Tennessee Savannah 1,338 0.669% 41 Tennessee Savannah 13,382 0.669%42 Oregon Tillamook 1,326 0.663% 42 Oregon Tillamook 13,262 0.663%43 Virginia Wise 1,322 0.661% 43 Virginia Wise 13,222 0.661%44 North Carolina Edenton 1,319 0.659% 44 North Carolina Edenton 13,189 0.659%45 Ohio Upper Sandusky 1,237 0.619% 45 Ohio Upper Sandusky 12,371 0.619%
46 Alabama Monroeville 1,214 0.607% 46 Alabama Monroeville 12,139 0.607%47 Kentucky London 1,074 0.537% 47 Kentucky London 10,743 0.537%48 Washington Colville 1,065 0.532% 48 Washington Colville 10,649 0.532%49 Hawaii Kauai 770 0.385% 49 Hawaii Kauai 7,700 0.385%50 Delaware Georgetown 440 0.220% 50 Delaware Georgetown 4,400 0.220%
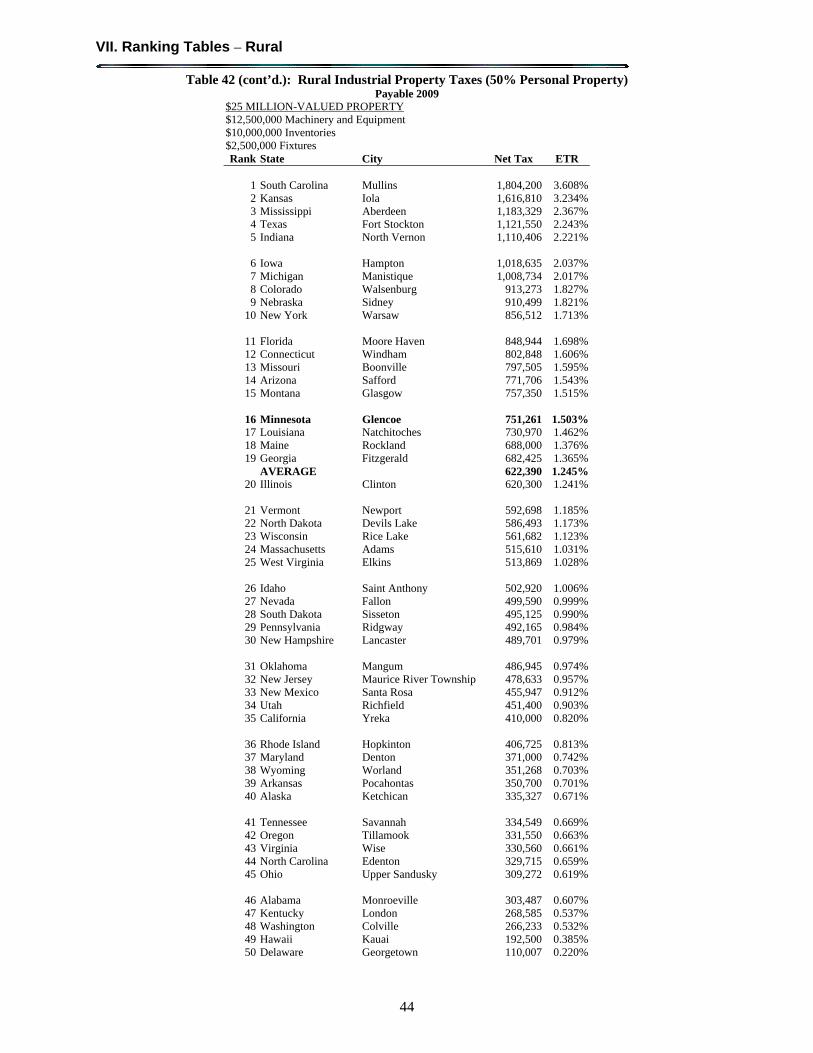
VII. Ranking Tables – Rural
44
Table 42 (cont’d.): Rural Industrial Property Taxes (50% Personal Property) Payable 2009
$25 MILLION-VALUED PROPERTY $12,500,000 Machinery and Equipment $10,000,000 Inventories $2,500,000 Fixtures Rank State City Net Tax ETR
1 South Carolina Mullins 1,804,200 3.608% 2 Kansas Iola 1,616,810 3.234% 3 Mississippi Aberdeen 1,183,329 2.367% 4 Texas Fort Stockton 1,121,550 2.243% 5 Indiana North Vernon 1,110,406 2.221%
6 Iowa Hampton 1,018,635 2.037% 7 Michigan Manistique 1,008,734 2.017% 8 Colorado Walsenburg 913,273 1.827% 9 Nebraska Sidney 910,499 1.821%
10 New York Warsaw 856,512 1.713%
11 Florida Moore Haven 848,944 1.698% 12 Connecticut Windham 802,848 1.606% 13 Missouri Boonville 797,505 1.595% 14 Arizona Safford 771,706 1.543% 15 Montana Glasgow 757,350 1.515%
16 Minnesota Glencoe 751,261 1.503% 17 Louisiana Natchitoches 730,970 1.462% 18 Maine Rockland 688,000 1.376% 19 Georgia Fitzgerald 682,425 1.365%
AVERAGE 622,390 1.245% 20 Illinois Clinton 620,300 1.241%
21 Vermont Newport 592,698 1.185% 22 North Dakota Devils Lake 586,493 1.173% 23 Wisconsin Rice Lake 561,682 1.123% 24 Massachusetts Adams 515,610 1.031% 25 West Virginia Elkins 513,869 1.028%
26 Idaho Saint Anthony 502,920 1.006% 27 Nevada Fallon 499,590 0.999% 28 South Dakota Sisseton 495,125 0.990% 29 Pennsylvania Ridgway 492,165 0.984% 30 New Hampshire Lancaster 489,701 0.979%
31 Oklahoma Mangum 486,945 0.974% 32 New Jersey Maurice River Township 478,633 0.957% 33 New Mexico Santa Rosa 455,947 0.912% 34 Utah Richfield 451,400 0.903% 35 California Yreka 410,000 0.820%
36 Rhode Island Hopkinton 406,725 0.813% 37 Maryland Denton 371,000 0.742% 38 Wyoming Worland 351,268 0.703% 39 Arkansas Pocahontas 350,700 0.701% 40 Alaska Ketchican 335,327 0.671%
41 Tennessee Savannah 334,549 0.669% 42 Oregon Tillamook 331,550 0.663% 43 Virginia Wise 330,560 0.661% 44 North Carolina Edenton 329,715 0.659% 45 Ohio Upper Sandusky 309,272 0.619%
46 Alabama Monroeville 303,487 0.607% 47 Kentucky London 268,585 0.537% 48 Washington Colville 266,233 0.532% 49 Hawaii Kauai 192,500 0.385% 50 Delaware Georgetown 110,007 0.220%
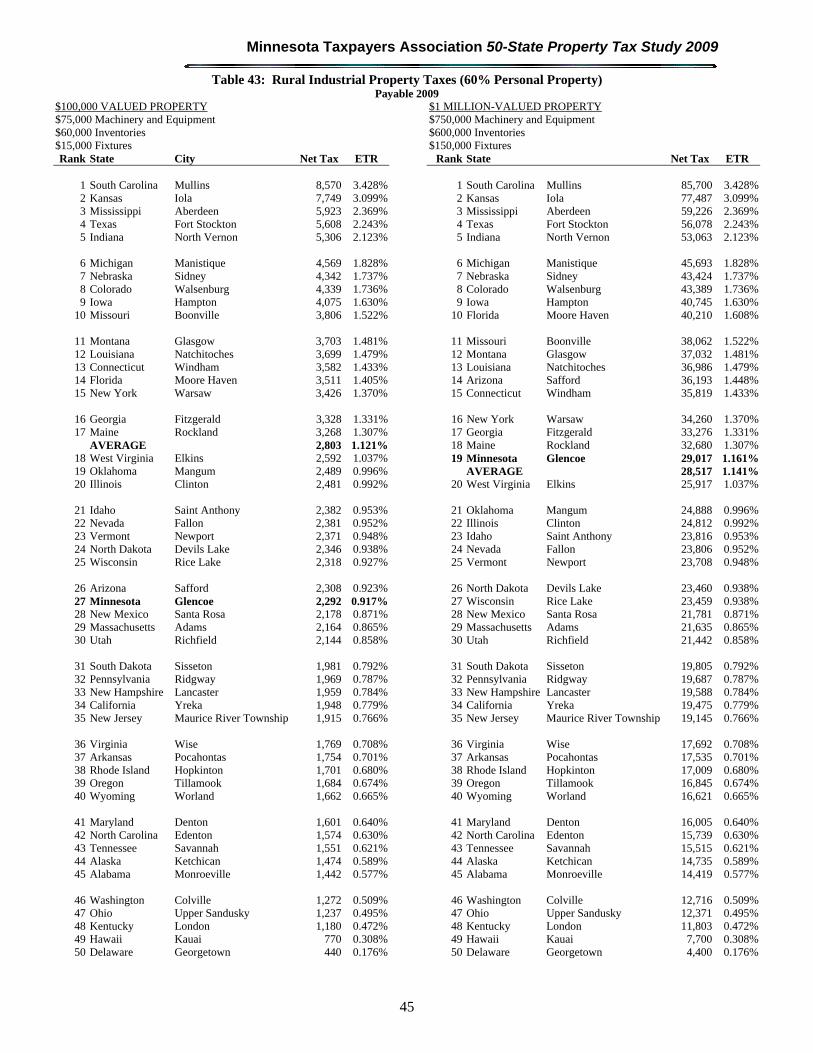
Minnesota Taxpayers Association 50-State Property Tax Study 2009
45
Table 43: Rural Industrial Property Taxes (60% Personal Property) Payable 2009
$100,000 VALUED PROPERTY $1 MILLION-VALUED PROPERTY $75,000 Machinery and Equipment $750,000 Machinery and Equipment $60,000 Inventories $600,000 Inventories $15,000 Fixtures $150,000 Fixtures Rank State City Net Tax ETR Rank State Net Tax ETR
1 South Carolina Mullins 8,570 3.428% 1 South Carolina Mullins 85,700 3.428%2 Kansas Iola 7,749 3.099% 2 Kansas Iola 77,487 3.099%3 Mississippi Aberdeen 5,923 2.369% 3 Mississippi Aberdeen 59,226 2.369%4 Texas Fort Stockton 5,608 2.243% 4 Texas Fort Stockton 56,078 2.243%5 Indiana North Vernon 5,306 2.123% 5 Indiana North Vernon 53,063 2.123%
6 Michigan Manistique 4,569 1.828% 6 Michigan Manistique 45,693 1.828%7 Nebraska Sidney 4,342 1.737% 7 Nebraska Sidney 43,424 1.737%8 Colorado Walsenburg 4,339 1.736% 8 Colorado Walsenburg 43,389 1.736%9 Iowa Hampton 4,075 1.630% 9 Iowa Hampton 40,745 1.630%
10 Missouri Boonville 3,806 1.522% 10 Florida Moore Haven 40,210 1.608%
11 Montana Glasgow 3,703 1.481% 11 Missouri Boonville 38,062 1.522%12 Louisiana Natchitoches 3,699 1.479% 12 Montana Glasgow 37,032 1.481%13 Connecticut Windham 3,582 1.433% 13 Louisiana Natchitoches 36,986 1.479%14 Florida Moore Haven 3,511 1.405% 14 Arizona Safford 36,193 1.448%15 New York Warsaw 3,426 1.370% 15 Connecticut Windham 35,819 1.433%
16 Georgia Fitzgerald 3,328 1.331% 16 New York Warsaw 34,260 1.370%17 Maine Rockland 3,268 1.307% 17 Georgia Fitzgerald 33,276 1.331%
AVERAGE 2,803 1.121% 18 Maine Rockland 32,680 1.307%18 West Virginia Elkins 2,592 1.037% 19 Minnesota Glencoe 29,017 1.161%19 Oklahoma Mangum 2,489 0.996% AVERAGE 28,517 1.141%20 Illinois Clinton 2,481 0.992% 20 West Virginia Elkins 25,917 1.037%
21 Idaho Saint Anthony 2,382 0.953% 21 Oklahoma Mangum 24,888 0.996%22 Nevada Fallon 2,381 0.952% 22 Illinois Clinton 24,812 0.992%23 Vermont Newport 2,371 0.948% 23 Idaho Saint Anthony 23,816 0.953%24 North Dakota Devils Lake 2,346 0.938% 24 Nevada Fallon 23,806 0.952%25 Wisconsin Rice Lake 2,318 0.927% 25 Vermont Newport 23,708 0.948%
26 Arizona Safford 2,308 0.923% 26 North Dakota Devils Lake 23,460 0.938%27 Minnesota Glencoe 2,292 0.917% 27 Wisconsin Rice Lake 23,459 0.938%28 New Mexico Santa Rosa 2,178 0.871% 28 New Mexico Santa Rosa 21,781 0.871%29 Massachusetts Adams 2,164 0.865% 29 Massachusetts Adams 21,635 0.865%30 Utah Richfield 2,144 0.858% 30 Utah Richfield 21,442 0.858%
31 South Dakota Sisseton 1,981 0.792% 31 South Dakota Sisseton 19,805 0.792%32 Pennsylvania Ridgway 1,969 0.787% 32 Pennsylvania Ridgway 19,687 0.787%33 New Hampshire Lancaster 1,959 0.784% 33 New Hampshire Lancaster 19,588 0.784%34 California Yreka 1,948 0.779% 34 California Yreka 19,475 0.779%35 New Jersey Maurice River Township 1,915 0.766% 35 New Jersey Maurice River Township 19,145 0.766%
36 Virginia Wise 1,769 0.708% 36 Virginia Wise 17,692 0.708%37 Arkansas Pocahontas 1,754 0.701% 37 Arkansas Pocahontas 17,535 0.701%38 Rhode Island Hopkinton 1,701 0.680% 38 Rhode Island Hopkinton 17,009 0.680%39 Oregon Tillamook 1,684 0.674% 39 Oregon Tillamook 16,845 0.674%40 Wyoming Worland 1,662 0.665% 40 Wyoming Worland 16,621 0.665%
41 Maryland Denton 1,601 0.640% 41 Maryland Denton 16,005 0.640%42 North Carolina Edenton 1,574 0.630% 42 North Carolina Edenton 15,739 0.630%43 Tennessee Savannah 1,551 0.621% 43 Tennessee Savannah 15,515 0.621%44 Alaska Ketchican 1,474 0.589% 44 Alaska Ketchican 14,735 0.589%45 Alabama Monroeville 1,442 0.577% 45 Alabama Monroeville 14,419 0.577%
46 Washington Colville 1,272 0.509% 46 Washington Colville 12,716 0.509%47 Ohio Upper Sandusky 1,237 0.495% 47 Ohio Upper Sandusky 12,371 0.495%48 Kentucky London 1,180 0.472% 48 Kentucky London 11,803 0.472%49 Hawaii Kauai 770 0.308% 49 Hawaii Kauai 7,700 0.308%50 Delaware Georgetown 440 0.176% 50 Delaware Georgetown 4,400 0.176%
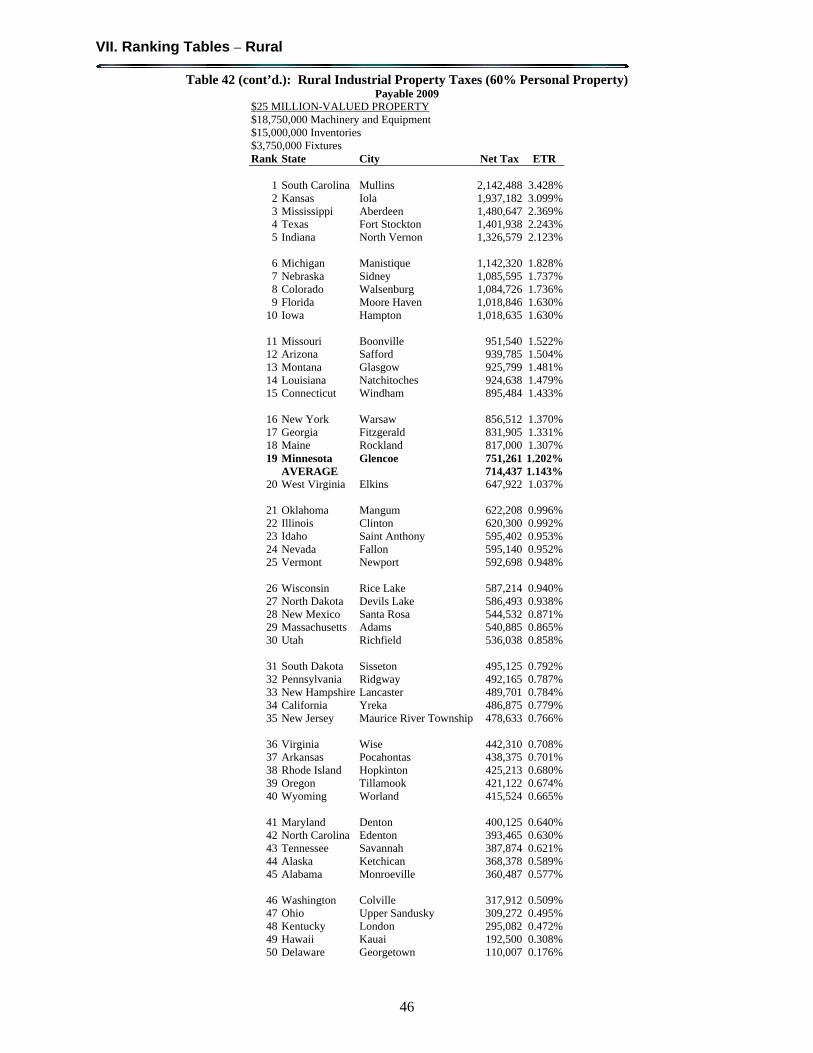
VII. Ranking Tables – Rural
46
Table 42 (cont’d.): Rural Industrial Property Taxes (60% Personal Property) Payable 2009
$25 MILLION-VALUED PROPERTY $18,750,000 Machinery and Equipment $15,000,000 Inventories $3,750,000 Fixtures Rank State City Net Tax ETR
1 South Carolina Mullins 2,142,488 3.428%2 Kansas Iola 1,937,182 3.099%3 Mississippi Aberdeen 1,480,647 2.369%4 Texas Fort Stockton 1,401,938 2.243%5 Indiana North Vernon 1,326,579 2.123%
6 Michigan Manistique 1,142,320 1.828%7 Nebraska Sidney 1,085,595 1.737%8 Colorado Walsenburg 1,084,726 1.736%9 Florida Moore Haven 1,018,846 1.630%
10 Iowa Hampton 1,018,635 1.630%
11 Missouri Boonville 951,540 1.522%12 Arizona Safford 939,785 1.504%13 Montana Glasgow 925,799 1.481%14 Louisiana Natchitoches 924,638 1.479%15 Connecticut Windham 895,484 1.433%
16 New York Warsaw 856,512 1.370%17 Georgia Fitzgerald 831,905 1.331%18 Maine Rockland 817,000 1.307%19 Minnesota Glencoe 751,261 1.202%
AVERAGE 714,437 1.143%20 West Virginia Elkins 647,922 1.037%
21 Oklahoma Mangum 622,208 0.996%22 Illinois Clinton 620,300 0.992%23 Idaho Saint Anthony 595,402 0.953%24 Nevada Fallon 595,140 0.952%25 Vermont Newport 592,698 0.948%
26 Wisconsin Rice Lake 587,214 0.940%27 North Dakota Devils Lake 586,493 0.938%28 New Mexico Santa Rosa 544,532 0.871%29 Massachusetts Adams 540,885 0.865%30 Utah Richfield 536,038 0.858%
31 South Dakota Sisseton 495,125 0.792%32 Pennsylvania Ridgway 492,165 0.787%33 New Hampshire Lancaster 489,701 0.784%34 California Yreka 486,875 0.779%35 New Jersey Maurice River Township 478,633 0.766%
36 Virginia Wise 442,310 0.708%37 Arkansas Pocahontas 438,375 0.701%38 Rhode Island Hopkinton 425,213 0.680%39 Oregon Tillamook 421,122 0.674%40 Wyoming Worland 415,524 0.665%
41 Maryland Denton 400,125 0.640%42 North Carolina Edenton 393,465 0.630%43 Tennessee Savannah 387,874 0.621%44 Alaska Ketchican 368,378 0.589%45 Alabama Monroeville 360,487 0.577%
46 Washington Colville 317,912 0.509%47 Ohio Upper Sandusky 309,272 0.495%48 Kentucky London 295,082 0.472%49 Hawaii Kauai 192,500 0.308%50 Delaware Georgetown 110,007 0.176%
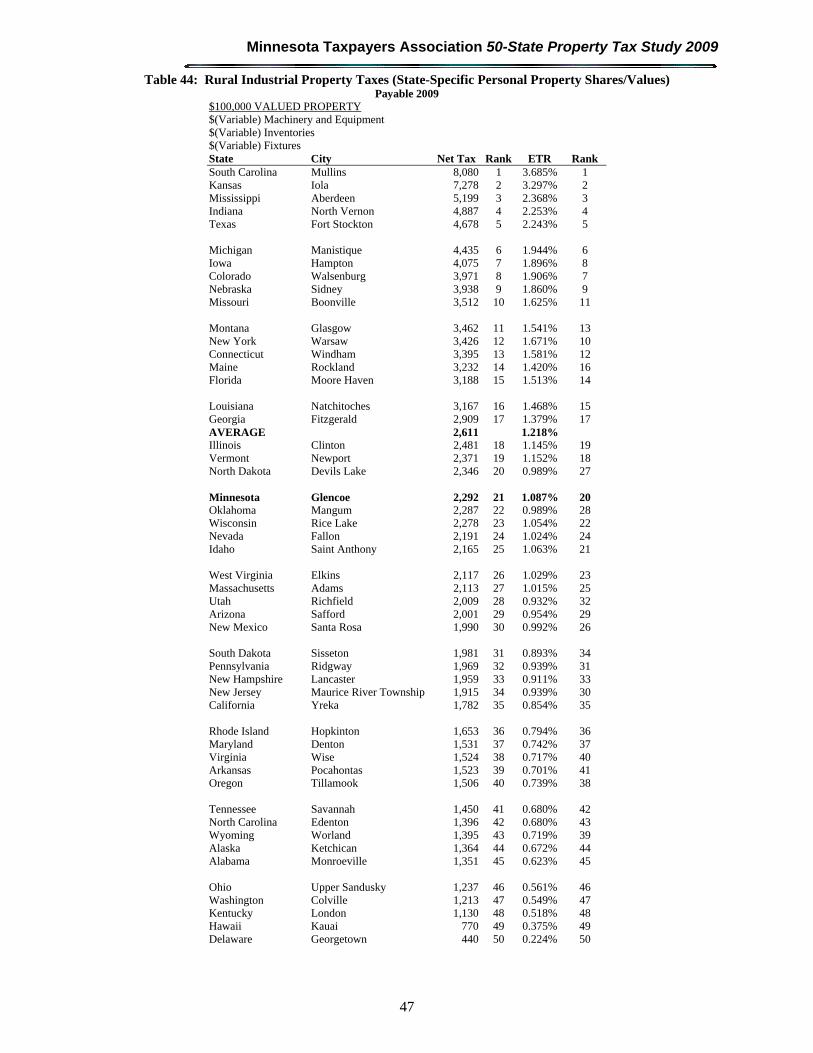
Minnesota Taxpayers Association 50-State Property Tax Study 2009
47
Table 44: Rural Industrial Property Taxes (State-Specific Personal Property Shares/Values) Payable 2009
$100,000 VALUED PROPERTY $(Variable) Machinery and Equipment $(Variable) Inventories $(Variable) Fixtures State City Net Tax Rank ETR Rank South Carolina Mullins 8,080 1 3.685% 1 Kansas Iola 7,278 2 3.297% 2 Mississippi Aberdeen 5,199 3 2.368% 3 Indiana North Vernon 4,887 4 2.253% 4 Texas Fort Stockton 4,678 5 2.243% 5 Michigan Manistique 4,435 6 1.944% 6 Iowa Hampton 4,075 7 1.896% 8 Colorado Walsenburg 3,971 8 1.906% 7 Nebraska Sidney 3,938 9 1.860% 9 Missouri Boonville 3,512 10 1.625% 11 Montana Glasgow 3,462 11 1.541% 13 New York Warsaw 3,426 12 1.671% 10 Connecticut Windham 3,395 13 1.581% 12 Maine Rockland 3,232 14 1.420% 16 Florida Moore Haven 3,188 15 1.513% 14 Louisiana Natchitoches 3,167 16 1.468% 15 Georgia Fitzgerald 2,909 17 1.379% 17 AVERAGE 2,611 1.218% Illinois Clinton 2,481 18 1.145% 19 Vermont Newport 2,371 19 1.152% 18 North Dakota Devils Lake 2,346 20 0.989% 27 Minnesota Glencoe 2,292 21 1.087% 20 Oklahoma Mangum 2,287 22 0.989% 28 Wisconsin Rice Lake 2,278 23 1.054% 22 Nevada Fallon 2,191 24 1.024% 24 Idaho Saint Anthony 2,165 25 1.063% 21 West Virginia Elkins 2,117 26 1.029% 23 Massachusetts Adams 2,113 27 1.015% 25 Utah Richfield 2,009 28 0.932% 32 Arizona Safford 2,001 29 0.954% 29 New Mexico Santa Rosa 1,990 30 0.992% 26 South Dakota Sisseton 1,981 31 0.893% 34 Pennsylvania Ridgway 1,969 32 0.939% 31 New Hampshire Lancaster 1,959 33 0.911% 33 New Jersey Maurice River Township 1,915 34 0.939% 30 California Yreka 1,782 35 0.854% 35 Rhode Island Hopkinton 1,653 36 0.794% 36 Maryland Denton 1,531 37 0.742% 37 Virginia Wise 1,524 38 0.717% 40 Arkansas Pocahontas 1,523 39 0.701% 41 Oregon Tillamook 1,506 40 0.739% 38 Tennessee Savannah 1,450 41 0.680% 42 North Carolina Edenton 1,396 42 0.680% 43 Wyoming Worland 1,395 43 0.719% 39 Alaska Ketchican 1,364 44 0.672% 44 Alabama Monroeville 1,351 45 0.623% 45 Ohio Upper Sandusky 1,237 46 0.561% 46 Washington Colville 1,213 47 0.549% 47 Kentucky London 1,130 48 0.518% 48 Hawaii Kauai 770 49 0.375% 49 Delaware Georgetown 440 50 0.224% 50
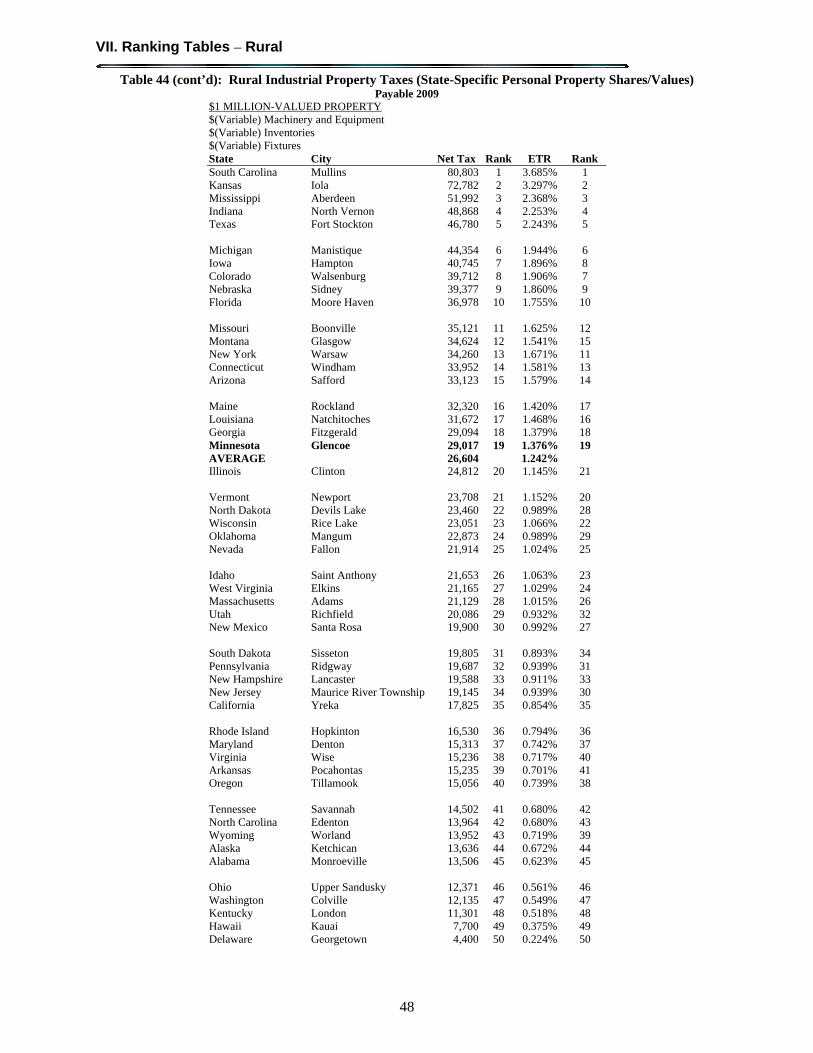
VII. Ranking Tables – Rural
48
Table 44 (cont’d): Rural Industrial Property Taxes (State-Specific Personal Property Shares/Values) Payable 2009
$1 MILLION-VALUED PROPERTY $(Variable) Machinery and Equipment $(Variable) Inventories $(Variable) Fixtures State City Net Tax Rank ETR Rank South Carolina Mullins 80,803 1 3.685% 1 Kansas Iola 72,782 2 3.297% 2 Mississippi Aberdeen 51,992 3 2.368% 3 Indiana North Vernon 48,868 4 2.253% 4 Texas Fort Stockton 46,780 5 2.243% 5 Michigan Manistique 44,354 6 1.944% 6 Iowa Hampton 40,745 7 1.896% 8 Colorado Walsenburg 39,712 8 1.906% 7 Nebraska Sidney 39,377 9 1.860% 9 Florida Moore Haven 36,978 10 1.755% 10 Missouri Boonville 35,121 11 1.625% 12 Montana Glasgow 34,624 12 1.541% 15 New York Warsaw 34,260 13 1.671% 11 Connecticut Windham 33,952 14 1.581% 13 Arizona Safford 33,123 15 1.579% 14 Maine Rockland 32,320 16 1.420% 17 Louisiana Natchitoches 31,672 17 1.468% 16 Georgia Fitzgerald 29,094 18 1.379% 18 Minnesota Glencoe 29,017 19 1.376% 19 AVERAGE 26,604 1.242% Illinois Clinton 24,812 20 1.145% 21 Vermont Newport 23,708 21 1.152% 20 North Dakota Devils Lake 23,460 22 0.989% 28 Wisconsin Rice Lake 23,051 23 1.066% 22 Oklahoma Mangum 22,873 24 0.989% 29 Nevada Fallon 21,914 25 1.024% 25 Idaho Saint Anthony 21,653 26 1.063% 23 West Virginia Elkins 21,165 27 1.029% 24 Massachusetts Adams 21,129 28 1.015% 26 Utah Richfield 20,086 29 0.932% 32 New Mexico Santa Rosa 19,900 30 0.992% 27 South Dakota Sisseton 19,805 31 0.893% 34 Pennsylvania Ridgway 19,687 32 0.939% 31 New Hampshire Lancaster 19,588 33 0.911% 33 New Jersey Maurice River Township 19,145 34 0.939% 30 California Yreka 17,825 35 0.854% 35 Rhode Island Hopkinton 16,530 36 0.794% 36 Maryland Denton 15,313 37 0.742% 37 Virginia Wise 15,236 38 0.717% 40 Arkansas Pocahontas 15,235 39 0.701% 41 Oregon Tillamook 15,056 40 0.739% 38 Tennessee Savannah 14,502 41 0.680% 42 North Carolina Edenton 13,964 42 0.680% 43 Wyoming Worland 13,952 43 0.719% 39 Alaska Ketchican 13,636 44 0.672% 44 Alabama Monroeville 13,506 45 0.623% 45 Ohio Upper Sandusky 12,371 46 0.561% 46 Washington Colville 12,135 47 0.549% 47 Kentucky London 11,301 48 0.518% 48 Hawaii Kauai 7,700 49 0.375% 49 Delaware Georgetown 4,400 50 0.224% 50
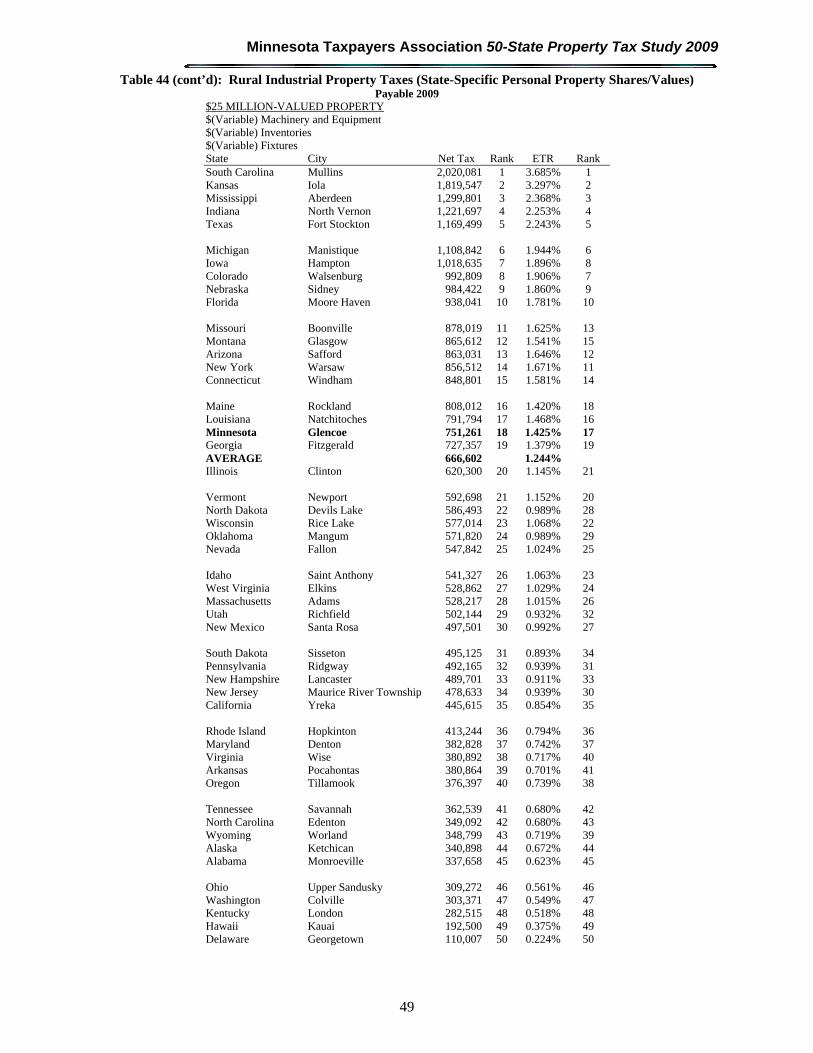
Minnesota Taxpayers Association 50-State Property Tax Study 2009
49
Table 44 (cont’d): Rural Industrial Property Taxes (State-Specific Personal Property Shares/Values) Payable 2009
$25 MILLION-VALUED PROPERTY $(Variable) Machinery and Equipment $(Variable) Inventories $(Variable) Fixtures State City Net Tax Rank ETR Rank South Carolina Mullins 2,020,081 1 3.685% 1 Kansas Iola 1,819,547 2 3.297% 2 Mississippi Aberdeen 1,299,801 3 2.368% 3 Indiana North Vernon 1,221,697 4 2.253% 4 Texas Fort Stockton 1,169,499 5 2.243% 5 Michigan Manistique 1,108,842 6 1.944% 6 Iowa Hampton 1,018,635 7 1.896% 8 Colorado Walsenburg 992,809 8 1.906% 7 Nebraska Sidney 984,422 9 1.860% 9 Florida Moore Haven 938,041 10 1.781% 10 Missouri Boonville 878,019 11 1.625% 13 Montana Glasgow 865,612 12 1.541% 15 Arizona Safford 863,031 13 1.646% 12 New York Warsaw 856,512 14 1.671% 11 Connecticut Windham 848,801 15 1.581% 14 Maine Rockland 808,012 16 1.420% 18 Louisiana Natchitoches 791,794 17 1.468% 16 Minnesota Glencoe 751,261 18 1.425% 17 Georgia Fitzgerald 727,357 19 1.379% 19 AVERAGE 666,602 1.244% Illinois Clinton 620,300 20 1.145% 21 Vermont Newport 592,698 21 1.152% 20 North Dakota Devils Lake 586,493 22 0.989% 28 Wisconsin Rice Lake 577,014 23 1.068% 22 Oklahoma Mangum 571,820 24 0.989% 29 Nevada Fallon 547,842 25 1.024% 25 Idaho Saint Anthony 541,327 26 1.063% 23 West Virginia Elkins 528,862 27 1.029% 24 Massachusetts Adams 528,217 28 1.015% 26 Utah Richfield 502,144 29 0.932% 32 New Mexico Santa Rosa 497,501 30 0.992% 27 South Dakota Sisseton 495,125 31 0.893% 34 Pennsylvania Ridgway 492,165 32 0.939% 31 New Hampshire Lancaster 489,701 33 0.911% 33 New Jersey Maurice River Township 478,633 34 0.939% 30 California Yreka 445,615 35 0.854% 35 Rhode Island Hopkinton 413,244 36 0.794% 36 Maryland Denton 382,828 37 0.742% 37 Virginia Wise 380,892 38 0.717% 40 Arkansas Pocahontas 380,864 39 0.701% 41 Oregon Tillamook 376,397 40 0.739% 38 Tennessee Savannah 362,539 41 0.680% 42 North Carolina Edenton 349,092 42 0.680% 43 Wyoming Worland 348,799 43 0.719% 39 Alaska Ketchican 340,898 44 0.672% 44 Alabama Monroeville 337,658 45 0.623% 45 Ohio Upper Sandusky 309,272 46 0.561% 46 Washington Colville 303,371 47 0.549% 47 Kentucky London 282,515 48 0.518% 48 Hawaii Kauai 192,500 49 0.375% 49 Delaware Georgetown 110,007 50 0.224% 50

VII. Ranking Tables – Rural
50
Table 45: Rural Apartment Property Taxes Payable 2009
$600,000VALUED PROPERTY $30,000 Fixtures Rank State City Net Tax ETR
1 Iowa Hampton 24,447 3.881%2 New York Warsaw 20,556 3.263%3 Michigan Manistique 18,484 2.934%4 Indiana North Vernon 16,273 2.583%5 South Carolina Mullins 16,023 2.543%
6 Connecticut Windham 15,563 2.470%7 Illinois Clinton 14,887 2.363%8 Mississippi Aberdeen 14,842 2.356%9 Vermont Newport 14,225 2.258%
10 Nebraska Sidney 14,148 2.246%
11 Texas Fort Stockton 14,132 2.243%12 North Dakota Devils Lake 14,076 2.234%13 Kansas Iola 13,167 2.090%14 Wisconsin Rice Lake 12,838 2.038%15 Florida Moore Haven 12,346 1.960%
16 South Dakota Sisseton 11,883 1.886%17 Pennsylvania Ridgway 11,812 1.875%18 New Hampshire Lancaster 11,753 1.866%19 New Jersey Maurice River Township 11,487 1.823%20 Maine Rockland 10,836 1.720%
21 Georgia Fitzgerald 9,675 1.536%
AVERAGE 9,447 1.500%22 Rhode Island Hopkinton 9,318 1.479%23 Massachusetts Adams 9,270 1.471%24 Montana Glasgow 8,664 1.375%25 Maryland Denton 8,205 1.302%
26 Minnesota Glencoe 8,109 1.287%27 Idaho Saint Anthony 8,001 1.270%28 Nevada Fallon 7,830 1.243%29 Alaska Ketchican 6,594 1.047%30 California Yreka 6,458 1.025%
31 Missouri Boonville 6,433 1.021%32 Louisiana Natchitoches 6,271 0.995%33 New Mexico Santa Rosa 6,026 0.957%34 West Virginia Elkins 5,791 0.919%35 Tennessee Savannah 5,683 0.902%
36 Oklahoma Mangum 5,519 0.876%37 Kentucky London 5,174 0.821%38 North Carolina Edenton 5,108 0.811%39 Ohio Upper Sandusky 4,861 0.772%40 Arizona Safford 4,847 0.769%
41 Alabama Monroeville 4,776 0.758%42 Wyoming Worland 4,629 0.735%43 Hawaii Kauai 4,620 0.733%44 Colorado Walsenburg 4,451 0.706%45 Arkansas Pocahontas 4,419 0.701%
46 Washington Colville 4,116 0.653%47 Utah Richfield 4,063 0.645%48 Oregon Tillamook 4,016 0.637%49 Virginia Wise 3,016 0.479%50 Delaware Georgetown 2,640 0.419%
Minnesota Taxpayers Association 50-State Property Tax Study 2009
51
VIII. Appendix: Methodology and Assumptions
This study updates the 50-State Property Tax Comparison Study: Payable Year 2008. It examines four distinct classes of property using a standard set of assumptions about their “true” market values and the split between real and personal property. The tax was calculated for variously-valued parcels in three sets of cities:
the largest urban area of each state and the District of Columbia along with Aurora, Illinois and Buffalo, New York;
the largest fifty cities in the United States; and a rural area in each state
More specific details about key assumptions are provided in the sections below.
Data Collection
Data for property tax calculations was collected in one of two ways. Where possible, property tax data was collected directly from information available through various state and local websites. Where such reports were not available, property taxes were calculated using a contact-verification approach in which state and local tax experts were asked to provide information. In both cases, this information served as the basis for calculations by Minnesota Taxpayers Association staff. Those calculations were, in turn, subject to local verification when necessary.
Selection of Additional Urban Cities
In Cook County (Chicago) and in New York City, the property tax system (notably, the assessment ratios) is substantially different than the system used in the remainder of Illinois and New York, respectively. We include the second-largest cities in those states (Buffalo and Aurora) to represent the property tax structures in the remainder of those states. In essence, our Urban analysis is a comparison of 53 different property tax structures.
Selection of Rural Cities
Prior to payable 2008, our methodology for selecting rural cities for this study was to rely on the expertise of local contacts to provide a rural city with a population of between 2,500 and 10,000 with an “average rural tax rate” for inclusion in the study. Unfortunately, in some instances our local contacts have provided cities that did not meet each of these criteria. We have modified our methodology for rural city selection by choosing rural cities based on the rural-urban continuum codes developed by the United State Department of Agriculture. This provides measurable eligibility criteria, removes subjectivity in city choice, and creates a more heterogeneous set of cities with regard to population and geographic relationship to urban areas.
In most instances, the cities selected for inclusion are county seats in counties coded “6” (a nonmetro county with an urban population of 2,500 to 19,999, adjacent to a metro area) or “7” (a nonmetro county with an urban population of 2.500 to 19,999, not adjacent to a metro area). In five states (Connecticut, Delaware, Hawaii, New Jersey, and Rhode Island), there were no counties coded 6 or 7. In the case of Massachusetts, the only code 6 or 7 county included Nantucket Island, which we did not include since it did not seem to be comparable to rural counties in other states. In those cases, we selected the county seat in the most rural county available for inclusion in the study. Wherever possible, we also included only cities with a population of 2,500 to 10,000.
Components of the Property Tax Calculation
As an aid in reviewing the remaining assumptions of this study, it is helpful to think of the property tax calculation as having five distinct components: (1) a “true” market value (TMV), (2) a local sales ratio (SR), (3) a statutory classification system (classification rate) or other
VIII. Appendix: Methodology and Assumptions
52
provisions that effectively determine the proportion of the assessor’s estimated market value that is taxable (CR), (4) the total local property tax rate (TR), and (5) applicable property tax credits (C). Accordingly, the net local property tax for a given parcel of property is written:
Net Property Tax = TMV x SR x CR x TR – C
Assumptions about each component are discussed in the sections below.
True Market Value (TMV) It is important to note that the calculations for this study start with an assumption about the true market value of the four classes of property. This is the market value of a parcel of property as determined in the local real estate market consisting of arm-length transactions between willing buyers and sellers. This is in contrast to “assessed value” or “estimated market value,” which, in most states is the starting point for the tax calculation.
This study assumes the true market value of each property type is the same for each state. For example, the ranking of property taxes on a residential homestead parcel with a true market value of $150,000 assumes that the parcel is actually worth $150,000 in the local real estate market in each location in each state, regardless of what the local assessor may think the property is worth.
In the cases of some locations the assumed true market value may be very atypical (a $150,000 home in Boston, for example). Nevertheless, this study assumes the property exists there. Essentially the goal of this study is to compare the effects of property tax structures. By fixing values we are able to observe the isolated effects of tax structures. That is, we are comparing property taxes, not local real estate markets. However, we have added a table showing median values for single-family homes in the largest urban area of each state.
The specific market value assumed for each class of property in this report is described below in the section on property classes.
Sales Ratios (SR) A unique aspect of this study is the inclusion of the effects of assessment practices on relative tax burdens across the country. It would have been much simpler to start the calculations by fixing the assessor’s “estimated market value” for each property. This would have resulted in a comparison of only the statutory property tax structure. However, in every state, the quality of property tax assessments is a significant aspect of the local property tax scene. Omission of this aspect of the property tax calculation would have made this study much less useful.
Sales ratios are simply a measure of the accuracy of assessments. The sales ratio is determined by comparing assessments to actual sales. If a sales ratio is: above 100%, the property has sold for more than its assessed value, below 100%, the property has sold for less than its assessed value, is 100%, assessments and market values are equal. If the sales ratios are at 100% that generally indicates that reassessments have just occurred. In some states, sales ratios are used to adjust assessor’s values for use in state aid formulas that use local property wealth as a measure of local fiscal capacity. Sales ratios are generally not used in calculating an individual’s actual property tax bill; however, some states use an equalization factor for calculating property tax bills, a factor that equalizes assessment values to market values.
In order for the tax liabilities to represent the actual experience of property owners, and to compare “effective” property tax rates across the states, it was important to use the true market value as a point of reference.
We attempted to adjust the assumed true market value of our sample properties with the use of sales ratios applicable to the location and type of property being studied. These are normally county-level sales ratios for the specific classes of property. Where location and class specific ratios were not available, we tried to use the ratio most applicable to the property (either a statewide ratio for the class, or in some cases, a county ratio applicable to all property classes).
Minnesota Taxpayers Association 50-State Property Tax Study 2009
53
By applying sales ratios, this study recognizes that our $150,000 residential homestead may be “on the books” at $155,000 in one location, and $140,000 in another, and that the actual tax on the property will be based on these “estimates” of market value. In this study, if the relevant sales ratio in a given location is 93%, we convert the $150,000 true market value to $139,500 ($150,000 x .93) before applying the provisions of the local property tax.
It is important that we use sales ratios in this study because our fixed reference point for all calculations is an assumed true market value.
In the case of personal property, sales ratios are generally not used. Many states do not have sales ratios for personal property or assume they are 100%. Where states report personal property sales ratios, we include them in this study.
Classification Rates (CR) The third component of the property tax calculation involves subjecting the assessor’s estimated market value to provisions designed to affect the distribution of property tax levies, namely statutory classification or differential assessment schemes.
In the absence of classification or differential assessments, the distribution of property tax burdens by class of property will reflect the distribution of the assessor’s estimated market values, assuming the properties are located in the same set of taxing jurisdictions. That is, a home assessed at $100,000 and a business with the same assessment would pay identical property taxes and their effective tax rates (tax as a percent of assessed value) would be the same.
In most states, classification schemes are set by state legislatures. In a few states classification is partly determined by local governments.
Because of the wide variation in the quality of assessments across the states, particularly across classes of property, many states that appear to have no classification scheme may in fact have significant classification via uneven assessments across classes of property, in some cases, perhaps, in violation of state constitution uniformity provision. Some states, like Minnesota, enforces strict standards of assessment quality (sales ratio studies, state orders adjusting values, state certification of assessors, etc.) and put their classification policy in statute.
Total Local Tax Rate (TR) Tax rates requested were state and local, payable 2008 applicable to the greatest number of parcels in the largest urban area of each state. “Payable 2008 tax rate” was defined as the tax rate used to calculate the property taxes with a lien date originating in 2008, regardless of the date(s) on which payments are due. In any one city, there may be many different taxing jurisdictions, essentially intersections of city, county, school district, and special taxing district. We asked for the local tax rates for the intersection with the largest number of properties.
We were careful to include the tax rate for all taxing jurisdictions that “normally” levy against real and personal property (namely, cities, counties, school districts, and special taxing districts). Special assessments were excluded from this study since they are more in the nature of user charges, do not affect a majority of parcels, and are usually not sources of general revenue.
Credits (C) The final step in the tax calculation is to recognize any general deductions from the gross property tax calculations (credits). Certain states provide credits based on early payment; we assume in the study that taxpayers take advantage of the credit by making the early payment. Any other credits that apply to a majority of parcels of the specified type were included in our calculations.
Certain states offer property tax credits or rebates to homeowners generally, based on income and/or home value. We have used data from the 2000 Census regarding the intersection of home values and income to determine appropriate location-specific income levels for the homestead property values in the study.
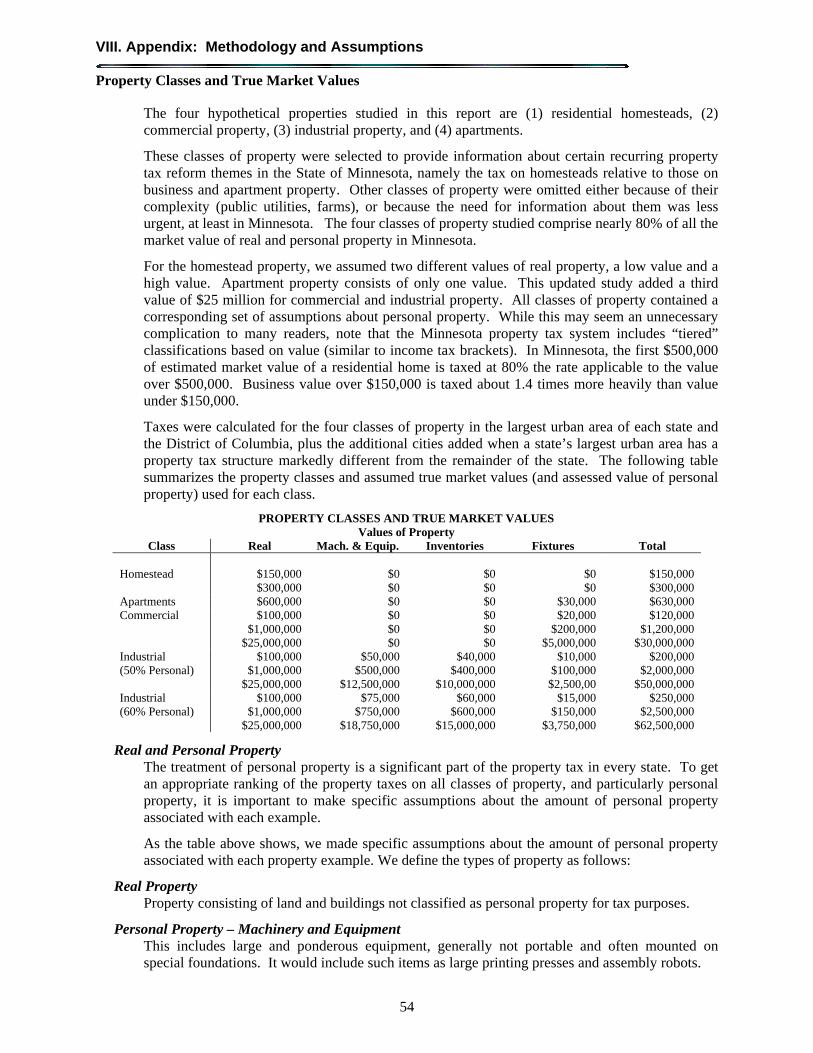
VIII. Appendix: Methodology and Assumptions
54
Property Classes and True Market Values
The four hypothetical properties studied in this report are (1) residential homesteads, (2) commercial property, (3) industrial property, and (4) apartments.
These classes of property were selected to provide information about certain recurring property tax reform themes in the State of Minnesota, namely the tax on homesteads relative to those on business and apartment property. Other classes of property were omitted either because of their complexity (public utilities, farms), or because the need for information about them was less urgent, at least in Minnesota. The four classes of property studied comprise nearly 80% of all the market value of real and personal property in Minnesota.
For the homestead property, we assumed two different values of real property, a low value and a high value. Apartment property consists of only one value. This updated study added a third value of $25 million for commercial and industrial property. All classes of property contained a corresponding set of assumptions about personal property. While this may seem an unnecessary complication to many readers, note that the Minnesota property tax system includes “tiered” classifications based on value (similar to income tax brackets). In Minnesota, the first $500,000 of estimated market value of a residential home is taxed at 80% the rate applicable to the value over $500,000. Business value over $150,000 is taxed about 1.4 times more heavily than value under $150,000.
Taxes were calculated for the four classes of property in the largest urban area of each state and the District of Columbia, plus the additional cities added when a state’s largest urban area has a property tax structure markedly different from the remainder of the state. The following table summarizes the property classes and assumed true market values (and assessed value of personal property) used for each class.
PROPERTY CLASSES AND TRUE MARKET VALUES Values of Property
Class Real Mach. & Equip. Inventories Fixtures Total Homestead
$150,000 $300,000
$0 $0
$0 $0
$0 $0
$150,000 $300,000
Apartments $600,000 $0 $0 $30,000 $630,000 Commercial $100,000
$1,000,000 $25,000,000
$0 $0 $0
$0 $0 $0
$20,000 $200,000
$5,000,000
$120,000 $1,200,000
$30,000,000 Industrial (50% Personal)
$100,000 $1,000,000
$25,000,000
$50,000 $500,000
$12,500,000
$40,000 $400,000
$10,000,000
$10,000 $100,000
$2,500,00
$200,000 $2,000,000
$50,000,000 Industrial (60% Personal)
$100,000 $1,000,000
$25,000,000
$75,000 $750,000
$18,750,000
$60,000 $600,000
$15,000,000
$15,000 $150,000
$3,750,000
$250,000 $2,500,000
$62,500,000
Real and Personal Property The treatment of personal property is a significant part of the property tax in every state. To get an appropriate ranking of the property taxes on all classes of property, and particularly personal property, it is important to make specific assumptions about the amount of personal property associated with each example.
As the table above shows, we made specific assumptions about the amount of personal property associated with each property example. We define the types of property as follows:
Real Property Property consisting of land and buildings not classified as personal property for tax purposes.
Personal Property – Machinery and Equipment This includes large and ponderous equipment, generally not portable and often mounted on special foundations. It would include such items as large printing presses and assembly robots.
Minnesota Taxpayers Association 50-State Property Tax Study 2009
55
Personal Property – Inventories This includes raw materials, unfinished products, supplies and similar items.
Personal Property – Fixtures Fixtures include such items as home or office furnishings, display racks, tools and similar items, but excluding motor vehicles. In the case of apartments, it would include such things as stoves, refrigerators, garbage disposals, air conditioners, drapes, and lawn care equipment.
The specific mix of real and personal property obviously varies by industry and location. Since some states tax most personal property and other states exempt all personal property, the tax rankings, particularly for the industrial example, are sensitive to the assumed mix of values.
In the body of this report, we present industrial rankings based on a 50% - 50% and 40% - 60% mix of real and personal property value, respectively.
This study does not include intangibles such as bank balances or financial securities in the property tax calculations.
Property Classes and True Market Values
With the permission of the Minnesota Department of Revenue’s Research Division, we have borrowed the methodology they use to determine shares of real and personal business property in their biennial Tax Incidence Study. Using that methodology, we have calculated state-specific real property, machinery and equipment, fixtures, and inventory shares for industrial parcels. Essentially, this analysis indicates how each state-specific industry mixes affect the property tax burden on industrial parcels of equal real property value. This differs from the intent of our other analyses – to compare property tax burdens on identical parcels in various locations.
Effective Tax Rates (ETRs)
Repeated reference has already been made to the concept of effective tax rates. In contrast to statutory tax rates that generally apply to taxable values, in this study effective tax rates are used to express the relationship between net property taxes and the true market value of the property. By including the effects of all statutory tax provisions as well as the effects of local assessment practices, effective tax rates have the virtue of allowing more meaningful comparisons across states and property types.
The comparison tables included in this report show actual dollar taxes and effective tax rates ranked from highest to lowest as well as alphabetically.
Special Property Tax Provisions
This study excludes all “special property tax provisions.” These are defined as provisions that, in practice, apply to less than half of all taxpayers for a given class of property. Special provisions are normally triggered by special circumstances or attributes of the taxpayer or property. Examples would include senior tax deferrals, and special valuation exclusions based on age, health or special use.
The goal of this study is to compare the actual tax experience of the largest number of taxpayers in the selected jurisdictions.
What Do Rankings Mean?
Property tax rankings must be evaluated in the broader context of each state’s fiscal system. The level of property taxes in each state reflects the level of local spending there, intergovernmental aids paid to local governments, the relative use of non-property tax sources of financing public services such as local income or sales taxes and fees, for selected classes of property, state and local policies that affect the distribution of the property tax burden across properties.