Embed Size (px)
Citation preview

68
5.0 Sedimentary Processes and Benthic-Pelagic Coupling
M. J. AlperinE. J. ClesceriJ.T. WellsD. B. AlbertJ.E. McNinchC. S. Martens
5.1 Introduction
In shallow-water systems like the NRE, the water column and surficial sediments interactcontinually, exchanging and redistributing particles and solutes so as to impact the operation ofthe entire system (Wells and Kim, 1991). The NRE and its receiving basin, Pamlico Sound, areof considerable interest in this regard since they have very limited exchange with the adjacentAtlantic, yet receive muddy sediments from deeply weathered Piedmont soils of the large andrapidly expanding urban areas to the west. In addition to inorganic sediment delivered throughthe network of drainage basin tributaries, high levels of organic matter are supplied by municipalwastewater treatment plants, agricultural runoff and instream algal blooms along the 350-km-long course of the river.
Consideration of sediments and sedimentary processes in the NRE is essential inaddressing water quality issues, and research into these processes is a vital part of any systemwide modeling or management effort. However, in contrast to the water, the sediments are oftenan unseen and seemingly passive component in the estuary. Sediment distribution and propertiesmay be slow to change, and their role in water-column events is not always apparent. Yet,sediments play a potentially critical role in altering habitat, transporting and sequesteringpollutants, modulating productivity and releasing nutrients.
Sediments are especially important in drainage basins where development is rapid sincethe same development pressures and basin-wide activities that lead to higher levels of pollutantswill almost surely lead to increased sediment loads. The well established connection betweentransport of sediments and transport of toxic and non-toxic substances that naturally partition tosediments is an important reason to integrate studies of particulates into studies ofeutrophication, habitat loss, agricultural impact and fisheries in the NRE. Furthermore, theexchange of material between the bottom and the water column imparts an internal nutrient"storage bank" nature to estuarine sediments and complicates management decisions that mustconsider the effects of internal nutrient storage and exchange over time scales of years todecades.
At the present time, our rudimentary knowledge of the origin, composition, size, anddynamics of sediments in the NRE is based on an exceedingly small number of studiesconducted mainly between the mid-1950s and mid-1970s (summarized by Wells and Kim,1989). Much of this previous work was undertaken as graduate thesis research and little hasbeen published in the open literature. More recently, Riggs et al. (1991) conducted an extensivesurvey of heavy metals in the organic-rich muds of the Neuse in an attempt to identify areas ofcontamination. In addition to the heavy metal analyses, their work provided information on
69
sediment grain size and composition, and classified the bottom material into broad categories ofsand, peat and organic-rich mud. Using a combination of new and previously-published data,Wells and Kim (1991) hypothesized that the NRE serves as an efficient sediment trap, releasingits bottom sediments to Pamlico Sound only during extreme discharge events.
5.1.1 Nitrogen and Oxygen Cycles
One of the primary controls on estuarine nitrogen and oxygen cycles involves interactionsbetween the water column and the sediments (e.g., Billen, 1978; Kemp and Boynton, 1992;Jørgensen, 1996). These interactions are particularly important in shallow, slow-flowingestuaries like the NRE where a large portion of the organic matter produced in the water columnreaches the sediment surface (Suess, 1980; Nixon, 1981). Although time delays betweendeposition and remineralization allow sediments to retain organic carbon and nitrogen overseasonal and annual time scales (Kemp and Boynton, 1992), most detrital organic matter thatenters the sediment is ultimately remineralized (burial is usually a small component of thebenthic budget; e.g., Kemp et al., 1990; Jørgensen et al., 1990; Christian et al., 1992).
Remineralization of sedimentary organic matter has two important impacts on watercolumn processes. First, organic matter decomposition imposes an O2 demand on the bottom-water due to respiration by aerobic organisms and oxidation of reduced compounds produced byanaerobic metabolism. Second, sedimentary remineralization produces NH4
+ that either diffusesfrom the sediment to the overlying water (providing a limiting nutrient for phytoplanktongrowth) or is converted to NO3
- by aerobic nitrifying bacteria. The production of NO3- is of
particular interest because it can stimulate denitrification, an anaerobic process whereby NO3- is
converted to N2 and rendered unavailable to most algae.
5.1.2 Objectives
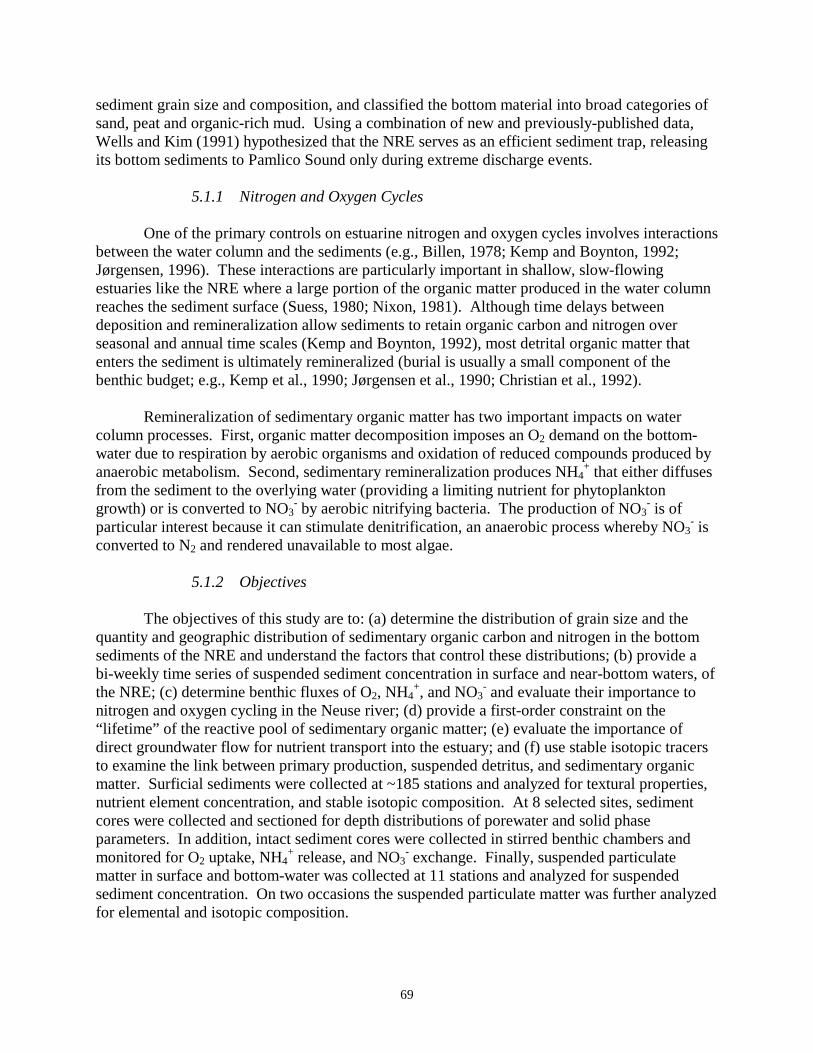
The objectives of this study are to: (a) determine the distribution of grain size and thequantity and geographic distribution of sedimentary organic carbon and nitrogen in the bottomsediments of the NRE and understand the factors that control these distributions; (b) provide abi-weekly time series of suspended sediment concentration in surface and near-bottom waters, ofthe NRE; (c) determine benthic fluxes of O2, NH4
+, and NO3- and evaluate their importance to
nitrogen and oxygen cycling in the Neuse river; (d) provide a first-order constraint on the“lifetime” of the reactive pool of sedimentary organic matter; (e) evaluate the importance ofdirect groundwater flow for nutrient transport into the estuary; and (f) use stable isotopic tracersto examine the link between primary production, suspended detritus, and sedimentary organicmatter. Surficial sediments were collected at ~185 stations and analyzed for textural properties,nutrient element concentration, and stable isotopic composition. At 8 selected sites, sedimentcores were collected and sectioned for depth distributions of porewater and solid phaseparameters. In addition, intact sediment cores were collected in stirred benthic chambers andmonitored for O2 uptake, NH4
+ release, and NO3- exchange. Finally, suspended particulate
matter in surface and bottom-water was collected at 11 stations and analyzed for suspendedsediment concentration. On two occasions the suspended particulate matter was further analyzedfor elemental and isotopic composition.
70
5.2 Methods
5.2.1 Sediment sampling and processing
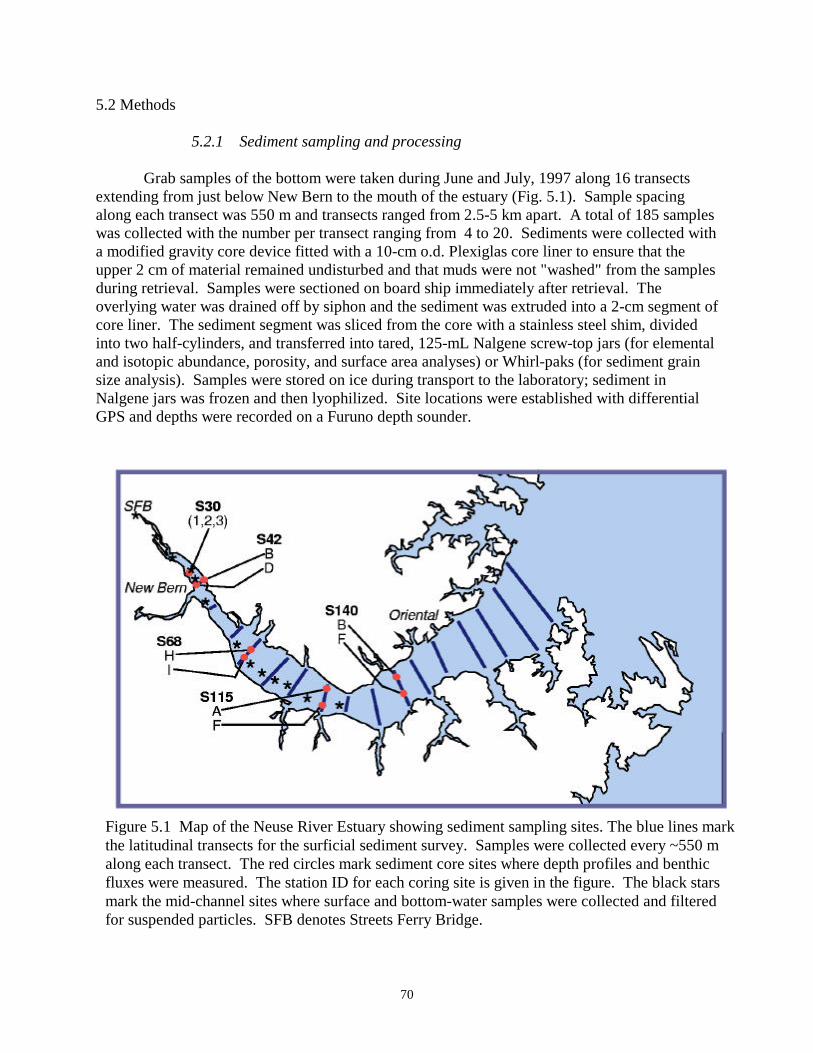
Grab samples of the bottom were taken during June and July, 1997 along 16 transectsextending from just below New Bern to the mouth of the estuary (Fig. 5.1). Sample spacingalong each transect was 550 m and transects ranged from 2.5-5 km apart. A total of 185 sampleswas collected with the number per transect ranging from 4 to 20. Sediments were collected witha modified gravity core device fitted with a 10-cm o.d. Plexiglas core liner to ensure that theupper 2 cm of material remained undisturbed and that muds were not "washed" from the samplesduring retrieval. Samples were sectioned on board ship immediately after retrieval. Theoverlying water was drained off by siphon and the sediment was extruded into a 2-cm segment ofcore liner. The sediment segment was sliced from the core with a stainless steel shim, dividedinto two half-cylinders, and transferred into tared, 125-mL Nalgene screw-top jars (for elementaland isotopic abundance, porosity, and surface area analyses) or Whirl-paks (for sediment grainsize analysis). Samples were stored on ice during transport to the laboratory; sediment inNalgene jars was frozen and then lyophilized. Site locations were established with differentialGPS and depths were recorded on a Furuno depth sounder.
Figure 5.1 Map of the Neuse River Estuary showing sediment sampling sites. The blue lines markthe latitudinal transects for the surficial sediment survey. Samples were collected every ~550 malong each transect. The red circles mark sediment core sites where depth profiles and benthicfluxes were measured. The station ID for each coring site is given in the figure. The black starsmark the mid-channel sites where surface and bottom-water samples were collected and filteredfor suspended particles. SFB denotes Streets Ferry Bridge.

71
Sediment cores were also collected for depth-distributions of porewater and whole-sediment parameters at 9 stations along 5 of the latitudinal transects (Fig. 5.1). Triplicate coresfrom Sta. S30 were collected by SCUBA divers; all other cores were collected by a gravity corer.The cores were kept in a water bath in the dark near in situ temperature during transport to thelaboratory. Processing began within 12 h of the time cores were collected. The overlying waterwas drained and sediment was extruded at 3-cm intervals using a core liner segment containingtwo side-by-side ports. Sediment was sampled using cut-off 30-mL syringes (2.4-cm diameter)as mini-piston corers. Syringes were pushed ~1 cm into the sediment with the piston fullyinserted to prevent sampling material that may have been smeared along the inside wall of thecore liner. A Delrin nozzle was used to transfer sediment to precombusted, tared Pyrexscintillation vials (whole sediment analyses), 40-mL polypropylene centrifuge tubes (porewateranalyses), and 20-mL Pyrex serum vials containing 5.0 mL of 1 M NaOH (methane analysis).Samples for whole sediment and methane analyses were lyophilized and frozen, respectively.
Centrifuge tubes were filled to the rim to minimize O2 contact and CO2 exchange andspun at 5000 g for 15 min. The supernatent was pipetted from the centrifuge tube using astainless steel needle connected to a 10-mL polypropylene syringe. The porewater was passedthrough a 0.45-µm syringe filter (Millipore Millex HV) that had been pre-cleaned by flushingwith 40 mL of distilled water and purging with air. The first mL of filtrate was discarded.Porewater aliquots (~5 mL) for nutrient analyses (NH4
+, NO3-+NO2
-, and PO43-) and DOC were
stored frozen in 10-mL polypropylene vials. Samples (0.5 mL) for anion analyses (Cl- and SO42-
) were purged with CO2 for ~4 min to lower the pH and remove H2S (to avoid sulfateinterference from sulfide oxidation) and stored at room temperature in 1-mL O-ring-sealpolypropylene vials. Porewater for Σ CO2 analysis was transferred to 5-mL Glass-pak syringessealed with 3-way stopcocks and stored in a refrigerator until analysis (<12 h).
5.2.2 Bottom-water samples
In concert with the sediment sampling, a set of bottom water samples was collected,generally using a Van Dorn bottle that was gently lowered to the sediment, than lifted upward by~ 0.5 m. The messenger was released after waiting several minutes to allow sediment suspendedby the sampler to flow down current. At Sta. S30, bottom-water was collected by SCUBA diver.Bottom-water samples were stored frozen in 125-mL polypropylene bottles prior to analyses.
5.2.3 Suspended particulate matter
Water samples for determination of suspensate concentration were taken biweekly frommid-August, 1997 through December, 1998, at 11 stations from Streets Ferry Bridge (New Bern)to Station 160 (between Adams Creek and South River) as part of the mid-river samplingprogram (section 3.2.1). Near surface samples were taken by filling by hand a 10-L containerand near-bottom samples (0.5 m above bottom) were taken using a Van Doran bottle; onapproximately 30% of the sampling days the lowermost two stations were not sampled due torough conditions on this open stretch of the river, giving a total for all stations of 700 samples.Water samples used in this component of the monitoring work were subsamples of 10-liter watercontainers returned from the field for nutrient and chlorophyll analyses (section 4). In additionto this bi-weekly data, suspended particulates from surface and bottom waters were collected at

72
11 stations in the Neuse River Estuary on 07/21/98 and 10/27/98 (Fig. 5.1). Surface watersamples were collected at the vessel’s edge into acid-washed and rinsed (three times withambient water) 20-L Nalgene containers. Bottom water samples were collected with a Van Dornwater sampler and transferred to acid-cleaned and rinsed containers. Water was stored atambient temperature and out of direct sunlight in large coolers and filtered immediately uponreturn to the laboratory in Morehead City. Aliquots (200-500 mL) were filtered under a gentlevacuum (<50 kPa) through filter funnels (Gelman, 25-mm polysulphone, 200-mL capacity) ontopre-weighed (Cahn C-30 Microbalance), pre-combusted (350°C for 5 h) glass fiber filters(Whatman GF/F, 25 mm diameter). Filter samples were folded once, placed in glass vials, anddried overnight at 60ºC.
5.2.4 Benthic flux measurements
Benthic fluxes were measured in the laboratory using chambers made from 25-cm longby 14-cm diameter PVC tubing capped with a Plexiglas lid (O-ring seal) equipped with inlet andoutlet ports and magnetic stirring bar (Fig. 5.2). The lower rim of the PVC was beveled topromote sediment coring. Cores were collected by diver by gently inserting the beveled end ofthe core barrel ~15 cm into the sediment. After excavating the mud around the core tube, thediver sealed the chamber by inserting a base plate with a silicone gasket; straps made fromrubber tubing provided the force to seal the bottom edge of the PVC against the gasket. The fluxchambers were kept in a water bath during transport to the laboratory in Morehead City.
In the laboratory, bottom water in the flux chambers was gently aerated overnight toassure that O2 levels were near saturation. The chambers were then sealed and several mL ofestuarine water from the vicinity of the sampling site was injected to remove any gas bubbles.The chambers were stirred at ~60 rpm; this rate is sufficient to mix the overlying water but doesnot cause visible re-suspension of the sediment. No attempt was made to match benthic boundaryconditions inside the chamber to those of the natural environment.
Samples were collected at regular time intervals by removing 10-mL of overlying waterinto two 5-mL Glass-pak syringes while injecting estuarine water to maintain the volume.Addition of the small volume of aerated water had a negligible effect on the O2 concentration.One water sample was passed through a 0.45-µm syringe filter and stored frozen in 10-mLpolypropylene vials for nutrient analysis; the other sample was analyzed immediately for O2.The benthic flux for each species was calculated from the change in concentration with time aftermeasuring the average height of overlying water in the chamber.
5.2.5 Analytical
5.2.5.1 Particle Size Analysis and Porosity.
Bottom samples were analyzed for percentages of gravel, sand, silt and clay usingstandard sedimentological techniques (Folk, 1974). Approximately 22 g of sediment was splitfrom each of the bulk subsamples (weighing approx. 100 g) that were available for the sizeanalysis work. Samples were first wet sieved to separate sand and gravel from mud (silt andclay). The sands and gravels were dried and the muds were retained in 1000 ml graduated

73
cylinders with a 10% calgon dispersant solution. Next a separation of gravel from sand wasmade by passing the dry sediment through a 2.0 mm sieve; weights of both components wererecorded to use in computation of percentages. The muds were then divided into their silt andclay fractions by making timed pipette withdrawals (based on Stokes settling) from thehomogenized suspensions in the graduated cylinders.
Sediment porosity was calculated based on mass lost on freeze-drying, assuming auniform sediment density of 2.4 g cm-3 (Benninger and Wells, 1993).
Figure 5.2. Stirred chamber for measuring benthic fluxes of O2, NH4+, and NO3
-.

74
5.2.5.2 Surface area.
Sediment surface area was measured by the N2 adsorption technique using aQuantachrome NOVA 1200. Freeze-dried sediments were disaggregated by shaking andpretreated by heating to 350°C for 12-16 h in open crucibles. Just prior to analysis, aliquots wereweighed into calibrated cells and degassed for 30 min at 300°C under vacuum. Surface areaswere calculated by the three-point BET method (Brunauer et al., 1938). The analytical precisionis typically <1% (based on re-analysis of the same sediment parcel) but surface areas measuredon duplicate aliquots of a well-mixed sample can differ by up to 10%.
5.2.5.3 Suspended Sediment Concentration.
Water samples were analyzed for suspended sediment concentration using a filtrationapparatus with pre-weighed Whatman 47 mm diameter glass fiber filters following standardtechniques (Eaton et al. 1969). Filter pads retained the particulate material coarser than 1.5microns which, when combined with known volumes of filtered water, provided the mass perunit volume of particulate material. Because of the small volume of water used for filtering andrinsing (350-500 ml), a stacked filter system to account for leaching was not necessary. Driedfilter pads were reweighed and mass of sediment was then determined on the basis of change inweight.
5.2.5.4 Total Organic Carbon (TOC), Total Nitrogen (TN), and stableisotope ratios.
Freeze-dried sediments were ground and homogenized with a mortar and pestle to reducefine-scale variability. Sediment (10 to 80 mg dry weight) was weighed into tared and combusted(400ºC for 5 h) silver boats (5x9 mm, Costech Analytical) on a Cahn C-30 Microbalance.Inorganic carbon was removed by exposing the weighed sediment loaded on a Teflon tray to HClvapor for 12 h in a closed, organic-free, glass desiccator (Hedges and Stern, 1984). Silver boatsare used rather than tin boats due to their resistance to corrosion by HCl vapor. Followingcarbonate removal, samples were oven-dried at 70ºC for 0.5 h to remove residual acid prior toanalysis. Silver boats containing sediment were crimped and formed for loading onto theautosampler.
Oven-dried filter samples were stored in a desiccator until weighed on a microbalance tocalculate suspended sediment concentrations. To remove carbonates, filters in glass vials wereexposed to HCl vapor for 12 h in a closed, organic-free, glass desiccator. Residual acid vaporwas removed from the filters in a 70ºC oven for 0.5 h. Acid-free filters were then encapsulatedin 30-mm tin foil discs (Elemental Analysis Limited) for loading onto the elemental analyzerautosampler.
Sediment and filter samples were analyzed for both carbon and nitrogen on a Carlo ErbaNA 1500 elemental analyzer outfitted with an autosampler. The autosampler prepared samplesfor combustion by removing atmospheric contaminants in a stream of dry helium. Samples andstandards loaded on the autosampler carousel were dropped into a quartz oxidative reactor tube
75
packed with silvered cobalt (II, III) oxide (Costech Analytical) at 1050ºC with a constant carriergas flow of helium (Research Grade, National Specialty Gases). Combustion was initiated whensample and container were exposed to an atmosphere temporarily enriched with a 5-mL aliquotof pure Ultra-Pure O2 (99.98%). A 20-cm fluted quartz crucible fitted with a quartz glass woolplug was placed in the combustion zone for trapping and periodic removal of combustion ash.Excess O2 was removed and nitrogen oxides were reduced to N2 in the quartz reductive reactortube, which was packed with reduced pure copper wires and maintained at 650ºC. Combustionwater was removed in a magnesium perchlorate trap. CO2 and N2 gases were resolved on apacked gas chromatographic column maintained at 54ºC and detected by thermal conductivity(Pella and Colombo, 1973). Peak integration was carried out on a Shimazdu CR501Chromatopac integrator. Organic carbon and total nitrogen values were expressed on a percentdry weight basis. Quantification was performed using external calibration curves of acetanilide(C8H9ON).
Dual stable carbon and nitrogen isotopic analyses were performed on the bulk sedimentsimultaneously with the TOC and TN analyses by coupled elemental analysis/continuous-flow/isotope ratio mass spectrometry. Sediment and filter samples were dried, vapor acidified, andcombusted on the elemental analyzer as described above. Resolved CO2 and N2 combustiongases were transferred in a helium carrier gas through an open split on the Finnigan MATConFlo II interface and isotopic ratios were measured on a Finnigan MAT 242 magnetic sectorisotope ratio mass spectrometer (IRMS). Helium dilution of the larger CO2 peak via the ConFlointerface open split allowed measurement of both carbon and nitrogen isotopic ratios on a singlesample. The stable isotopic ratio is calculated as:
δNX = [(Rsample - Rstd)/Rstd] x 103
in units of parts per thousand (‰ ). The coefficient NX is the heavy stable isotope of the element(13C or 15N). R is the ratio 13C/12C or 15N/14N of both sample and standard. A negative valueindicates that the sample is “lighter”, i.e. contains less NX than the standard (Craig, 1953). TheIRMS standard for carbon isotopic measurements was Pee Dee Belemnite (0.0 ‰ ) andatmospheric N2 (0.0 ‰ ) for nitrogen. A correction factor accounting for isotopic fractionationinherent in the transfer of N2 and dilution of CO2 combustion gases was applied to all samples.The correction factor was calculated at each run by subtracting the average carbon and nitrogenisotopic ratios for acetanilide from the isotopic values determined by traditional vacuum lineisotope ratio mass spectrometry. Instrument specified standard deviations for δ13C and δ15Nanalyses were 0.2 and 0.3‰ , respectively.
5.2.5.5 Dissolved constituents.
Nutrient (NH4+, NO3
-+NO2-, and PO4
3-) concentrations were measured with a LachetQuikChem automated ion analyzer employing standard colorimetric methods (Grasshoff et al.,1983). Porewater samples were acidified (10-µL concentrated HCl to ~5-mL porewater) todissolve iron precipitates and diluted 1:20 with distilled water. Bottom-water and flux chambersamples were analyzed without dilution. The relative standard deviation of replicate analyses istypically ±3% for all three nutrients. Concentrations of ΣCO2 were determined by flow injectionanalysis (Hall and Aller, 1992). Samples were analyzed in triplicate; the coefficient of variation
76
averaged ±3%. Sulfate and Cl- concentrations were measured by ion chromatography (Dionex2010i) employing post-column chemical suppression. Samples were diluted with eluent 1:10 to1:50, depending on the mean salinity at the station. Analytical precision is typically ±3%. DOCconcentrations were measured by high temperature catalytic combustion using a Shimadzu TOC-5000 with automated sample injector. Porewater samples were diluted 1:7 with 0.2% (v/v) HCland bottom water samples were acidified with HCl (30-µL concentration HCl to 4.0-mL). Allsamples were sparged (30 mL min-1) with low-carbon air for ~12 min to quantitatively removedissolved inorganic carbon. The instrumental precision for the DOC analysis is typically ±2%.Methane concentrations were quantified by head-space equilibration gas chromatography(Alperin et al., 1992) using a Hach-Carle AGC-311 equipped with flame ionization detector;precision is ±3% based on replicate analysis of a standard gas mixture.
5.3 Results
5.3.1 Surface sediment properties
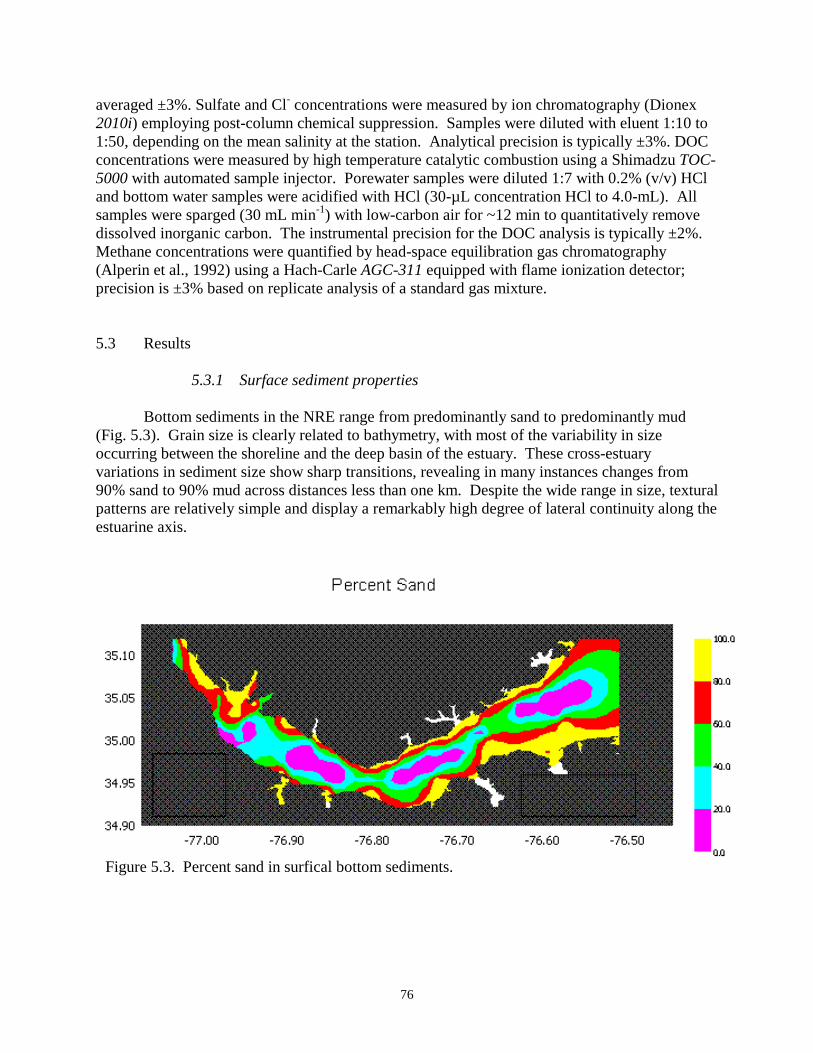
Bottom sediments in the NRE range from predominantly sand to predominantly mud(Fig. 5.3). Grain size is clearly related to bathymetry, with most of the variability in sizeoccurring between the shoreline and the deep basin of the estuary. These cross-estuaryvariations in sediment size show sharp transitions, revealing in many instances changes from90% sand to 90% mud across distances less than one km. Despite the wide range in size, texturalpatterns are relatively simple and display a remarkably high degree of lateral continuity along theestuarine axis.
Figure 5.3. Percent sand in surfical bottom sediments.

77
Most of the sand is confined to the shoulders of the estuary. Finer-grained sedimentsoccur in the deeper regions as shown by the four nearly equally-spaced pods of organic-rich mudspread along the axis (Fig. 5.3). Visual examination of bulk samples returned from the field,prior to size analysis, suggests that the lithologic variability of these axial muds is quite low.Within the mud fraction, the ratio between silt and clay is uniform along most of the estuary,indicating very modest textural variability within the finer-grained constituents. The threeregions of coarser sediments that separate the pods of axial muds occur at locations of modestbathymetric constrictions. The most significant of these constrictions results from a narrowing ofthe estuary at the 90 degree bend midway between New Bern and the mouth.
Although a small amount of gravel-sized material (usually < 1%) was found in 44 of thesamples, gravel is a very minor constituent of surficial bottom sediments in the Neuse. In allexcept 7 samples, the gravel-sized material was biogenic (shell or wood) as opposed tofragments of rock. Whole shells were rare and wood fragments (mm to cm scale) were in a highstate of decay.
Surface sediment porosity in the Neuse River ranges from 0.35 to 0.97 (Fig. 5.4). Inrecently deposited sediments, porosity is primarily a function of grain size because surfacecharges on small particles cause them to adopt an open, highly porous structure (Berner, 1980).Fifty percent of the surface sediment samples have a porosity greater than 0.8, characteristic ofclay- to silt-size particles (Berner, 1980). Fine-grain sediments occur along the entire estuarineaxis but predominate in the deeper trenches and in regimes of reduced wave energy. Lowporosity sands and gravel are found at the edges of the estuary where wind-, tide-, orprecipitation-driven currents cause winnowing of fines.
Figure 5.4. Distribution of surface sediment porosity in the Neuse River Estuary.
78
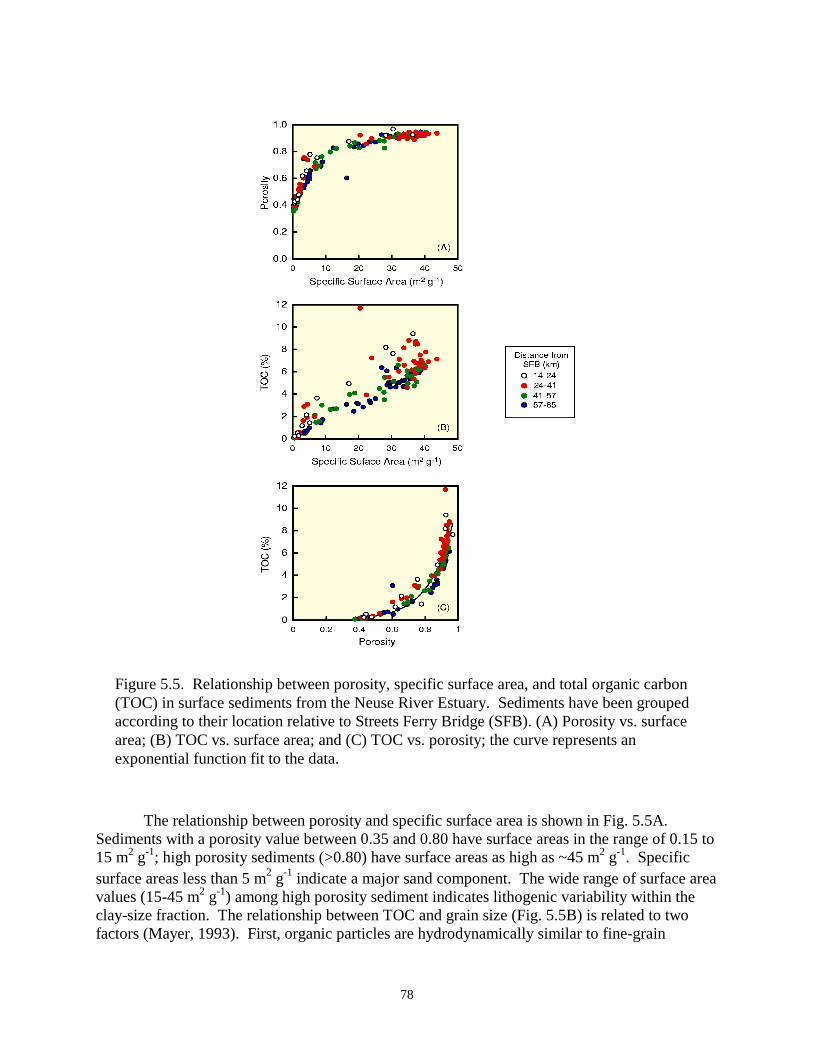
The relationship between porosity and specific surface area is shown in Fig. 5.5A.Sediments with a porosity value between 0.35 and 0.80 have surface areas in the range of 0.15 to15 m2 g-1; high porosity sediments (>0.80) have surface areas as high as ~45 m2 g-1. Specificsurface areas less than 5 m2 g-1 indicate a major sand component. The wide range of surface areavalues (15-45 m2 g-1) among high porosity sediment indicates lithogenic variability within theclay-size fraction. The relationship between TOC and grain size (Fig. 5.5B) is related to twofactors (Mayer, 1993). First, organic particles are hydrodynamically similar to fine-grain
Figure 5.5. Relationship between porosity, specific surface area, and total organic carbon(TOC) in surface sediments from the Neuse River Estuary. Sediments have been groupedaccording to their location relative to Streets Ferry Bridge (SFB). (A) Porosity vs. surfacearea; (B) TOC vs. surface area; and (C) TOC vs. porosity; the curve represents anexponential function fit to the data.

79
sediments and therefore accumulate in the same region of the estuary. Microscopic inspectionreveals intact fecal pellets in Neuse River surficial sediments with porosity values greater than0.7, while none were observed in low porosity, sandy sediments. Second, elevated organicmatter concentrations in fine-grain sediments may reflect greater sorption of organic matter onparticles with higher surface areas. Whatever the cause of the TOC-surface area correlation, thepronounced exponential relationship between TOC concentration and porosity in surfacesediments (Fig. 5.5C) indicates that organic matter distributions are strongly controlled by thesame hydrodynamic factors that affect sediment grain size.
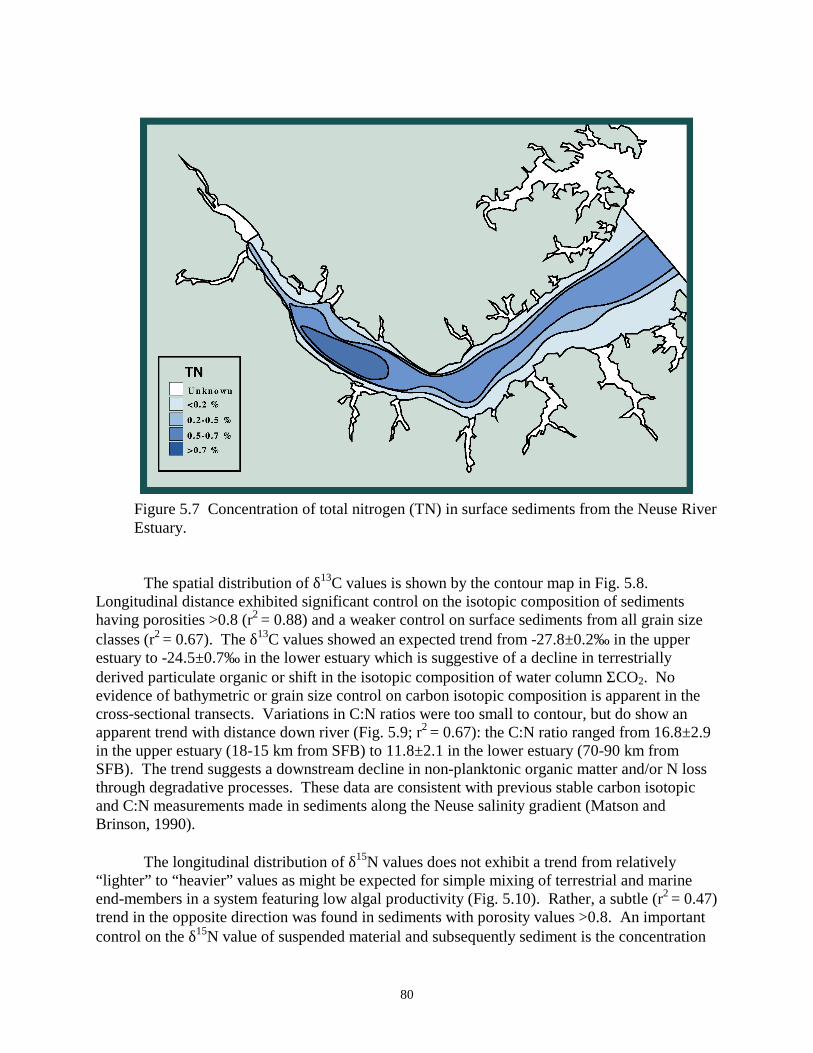
Concentrations of TOC are the highest (>7%) downstream from New Bern where theriver broadens and the currents slow (Fig. 5.6). The cross-channel distribution of TOC clearlydemonstrates the effect of riverbed bathymetry (and hence sediment grain size) on the depositionof organic particles. The TN content in sediments also peaks (>0.7%) immediately after the riverwidens (Fig. 5.7). This section of the estuary is where major phytoplankton blooms and fish killevents are documented with the greatest frequency. The weakly focused, seasonally variableturbidity maximum (Wells and Kim, 1989) may induce a net deposition of organic particulates tothe sediments in the upper estuary. Organic-rich muds, representing a vast reservoir of O2demand and recycled nitrogen, are present all along the estuarine axis.
Figure 5.6. Concentration of total organic carbon (TOC) in surface sediments from theNeuse River Estuary.
80
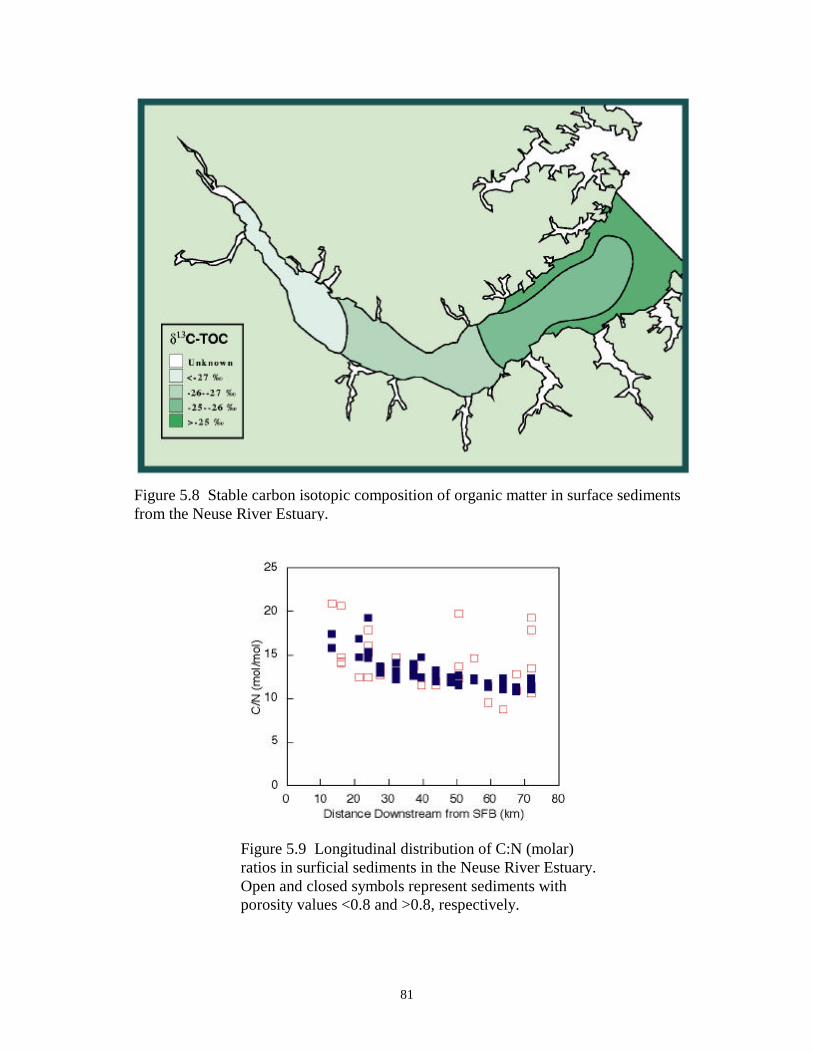
The spatial distribution of δ13C values is shown by the contour map in Fig. 5.8.Longitudinal distance exhibited significant control on the isotopic composition of sedimentshaving porosities >0.8 (r2 = 0.88) and a weaker control on surface sediments from all grain sizeclasses (r2 = 0.67). The δ13C values showed an expected trend from -27.8±0.2‰ in the upperestuary to -24.5±0.7‰ in the lower estuary which is suggestive of a decline in terrestriallyderived particulate organic or shift in the isotopic composition of water column ΣCO2. Noevidence of bathymetric or grain size control on carbon isotopic composition is apparent in thecross-sectional transects. Variations in C:N ratios were too small to contour, but do show anapparent trend with distance down river (Fig. 5.9; r2 = 0.67): the C:N ratio ranged from 16.8±2.9in the upper estuary (18-15 km from SFB) to 11.8±2.1 in the lower estuary (70-90 km fromSFB). The trend suggests a downstream decline in non-planktonic organic matter and/or N lossthrough degradative processes. These data are consistent with previous stable carbon isotopicand C:N measurements made in sediments along the Neuse salinity gradient (Matson andBrinson, 1990).
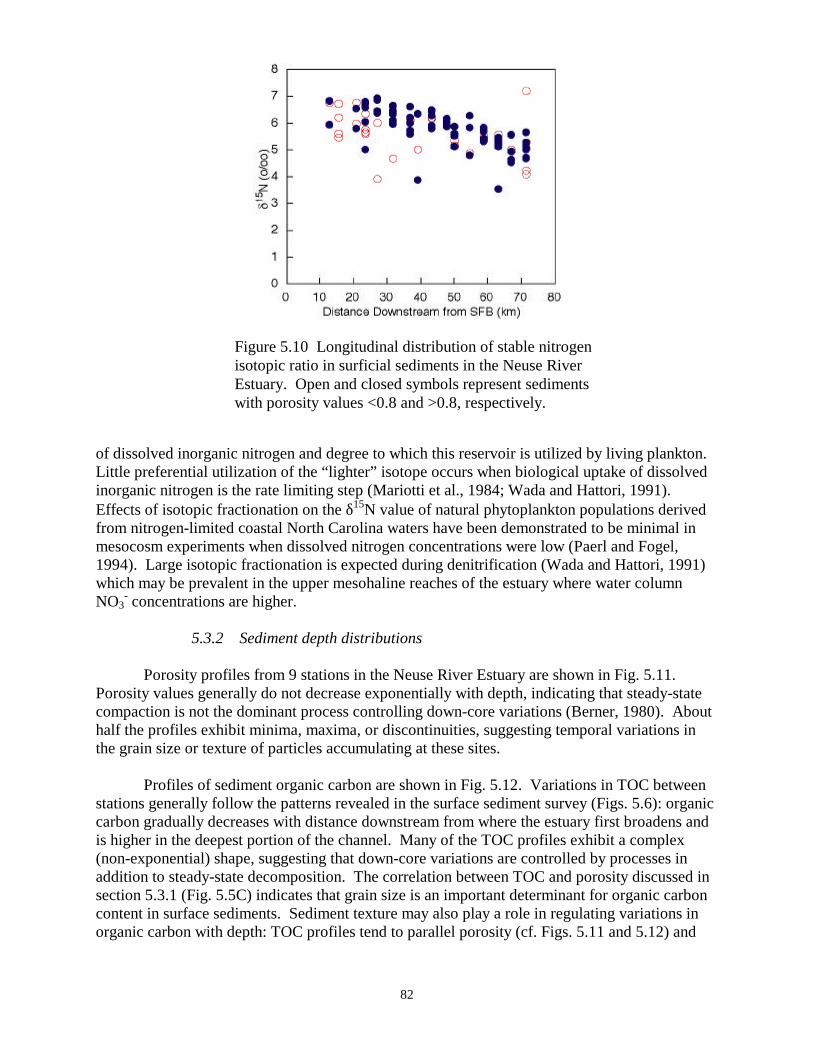
The longitudinal distribution of δ15N values does not exhibit a trend from relatively“lighter” to “heavier” values as might be expected for simple mixing of terrestrial and marineend-members in a system featuring low algal productivity (Fig. 5.10). Rather, a subtle (r2 = 0.47)trend in the opposite direction was found in sediments with porosity values >0.8. An importantcontrol on the δ15N value of suspended material and subsequently sediment is the concentration
Figure 5.7 Concentration of total nitrogen (TN) in surface sediments from the Neuse RiverEstuary.
81
Figure 5.8 Stable carbon isotopic composition of organic matter in surface sedimentsfrom the Neuse River Estuary.
Figure 5.9 Longitudinal distribution of C:N (molar)ratios in surficial sediments in the Neuse River Estuary.Open and closed symbols represent sediments withporosity values <0.8 and >0.8, respectively.
82
of dissolved inorganic nitrogen and degree to which this reservoir is utilized by living plankton.Little preferential utilization of the “lighter” isotope occurs when biological uptake of dissolvedinorganic nitrogen is the rate limiting step (Mariotti et al., 1984; Wada and Hattori, 1991).Effects of isotopic fractionation on the δ15N value of natural phytoplankton populations derivedfrom nitrogen-limited coastal North Carolina waters have been demonstrated to be minimal inmesocosm experiments when dissolved nitrogen concentrations were low (Paerl and Fogel,1994). Large isotopic fractionation is expected during denitrification (Wada and Hattori, 1991)which may be prevalent in the upper mesohaline reaches of the estuary where water columnNO3
- concentrations are higher.
5.3.2 Sediment depth distributions
Porosity profiles from 9 stations in the Neuse River Estuary are shown in Fig. 5.11.Porosity values generally do not decrease exponentially with depth, indicating that steady-statecompaction is not the dominant process controlling down-core variations (Berner, 1980). Abouthalf the profiles exhibit minima, maxima, or discontinuities, suggesting temporal variations inthe grain size or texture of particles accumulating at these sites.
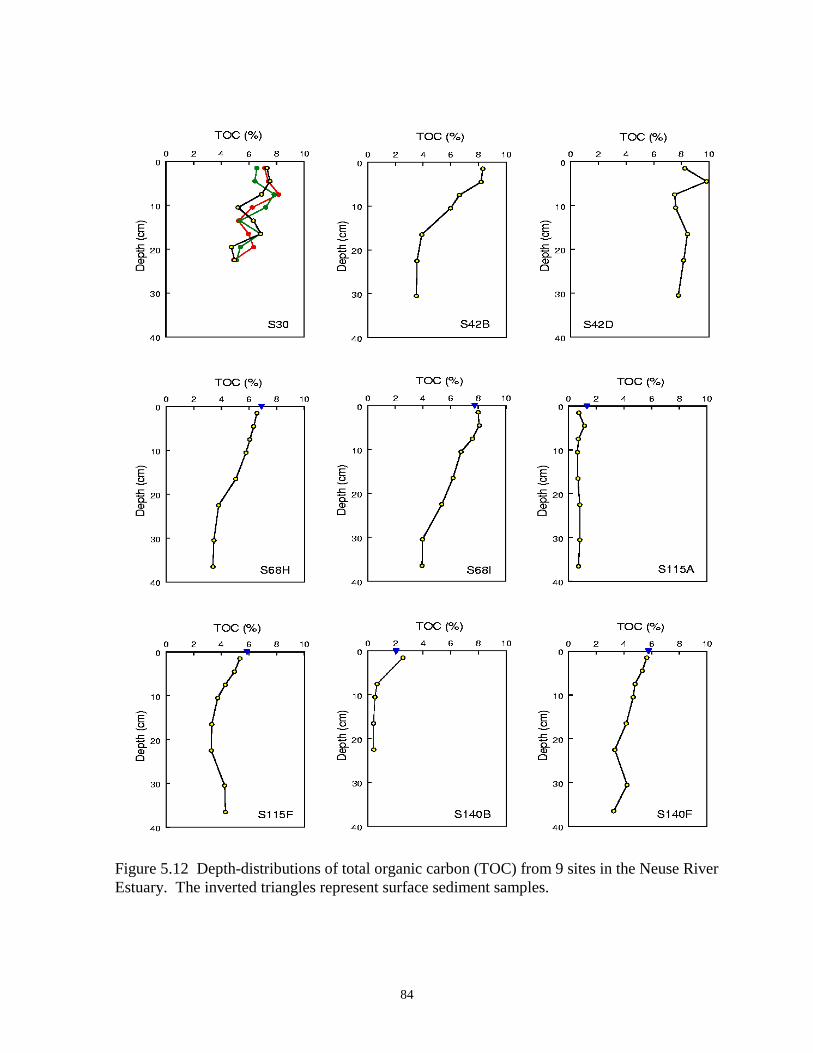
Profiles of sediment organic carbon are shown in Fig. 5.12. Variations in TOC betweenstations generally follow the patterns revealed in the surface sediment survey (Figs. 5.6): organiccarbon gradually decreases with distance downstream from where the estuary first broadens andis higher in the deepest portion of the channel. Many of the TOC profiles exhibit a complex(non-exponential) shape, suggesting that down-core variations are controlled by processes inaddition to steady-state decomposition. The correlation between TOC and porosity discussed insection 5.3.1 (Fig. 5.5C) indicates that grain size is an important determinant for organic carboncontent in surface sediments. Sediment texture may also play a role in regulating variations inorganic carbon with depth: TOC profiles tend to parallel porosity (cf. Figs. 5.11 and 5.12) and
Figure 5.10 Longitudinal distribution of stable nitrogenisotopic ratio in surficial sediments in the Neuse RiverEstuary. Open and closed symbols represent sedimentswith porosity values <0.8 and >0.8, respectively.

83
Figure 5.11 Sediment porosity profiles from 9 sites in the Neuse River Estuary. The invertedtriangles represent surface sediment samples.
84
Figure 5.12 Depth-distributions of total organic carbon (TOC) from 9 sites in the Neuse RiverEstuary. The inverted triangles represent surface sediment samples.
85
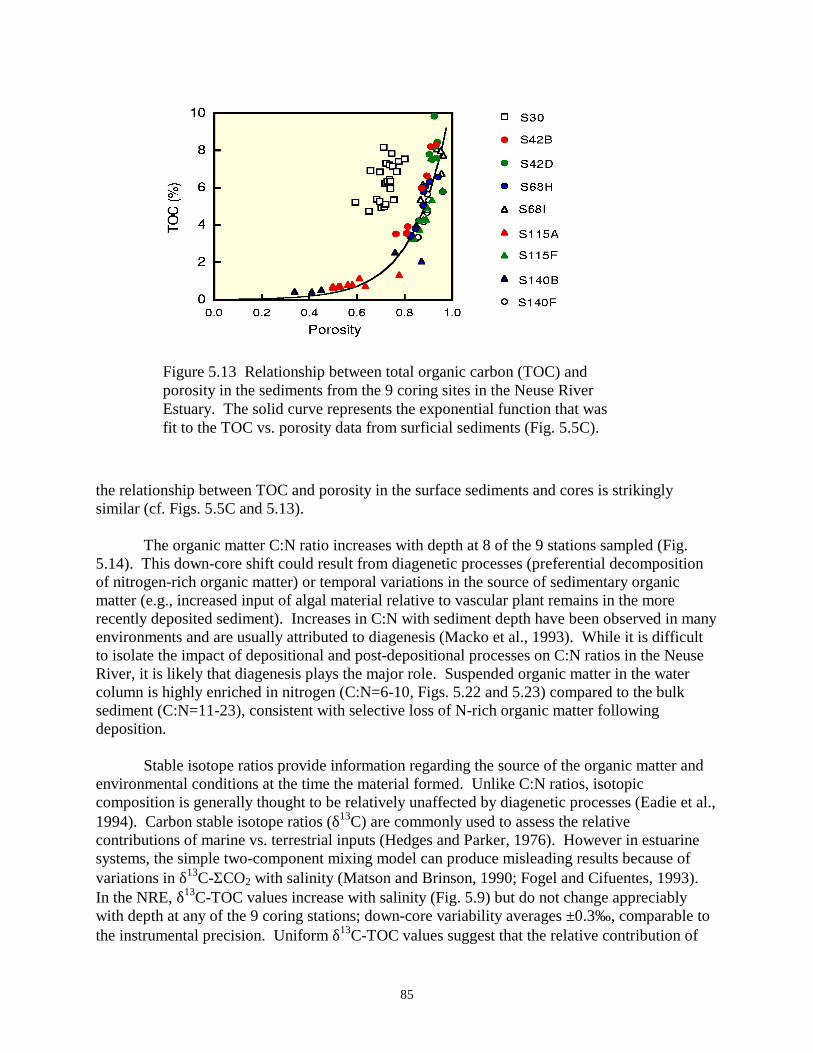
the relationship between TOC and porosity in the surface sediments and cores is strikinglysimilar (cf. Figs. 5.5C and 5.13).
The organic matter C:N ratio increases with depth at 8 of the 9 stations sampled (Fig.5.14). This down-core shift could result from diagenetic processes (preferential decompositionof nitrogen-rich organic matter) or temporal variations in the source of sedimentary organicmatter (e.g., increased input of algal material relative to vascular plant remains in the morerecently deposited sediment). Increases in C:N with sediment depth have been observed in manyenvironments and are usually attributed to diagenesis (Macko et al., 1993). While it is difficultto isolate the impact of depositional and post-depositional processes on C:N ratios in the NeuseRiver, it is likely that diagenesis plays the major role. Suspended organic matter in the watercolumn is highly enriched in nitrogen (C:N=6-10, Figs. 5.22 and 5.23) compared to the bulksediment (C:N=11-23), consistent with selective loss of N-rich organic matter followingdeposition.
Stable isotope ratios provide information regarding the source of the organic matter andenvironmental conditions at the time the material formed. Unlike C:N ratios, isotopiccomposition is generally thought to be relatively unaffected by diagenetic processes (Eadie et al.,1994). Carbon stable isotope ratios (δ13C) are commonly used to assess the relativecontributions of marine vs. terrestrial inputs (Hedges and Parker, 1976). However in estuarinesystems, the simple two-component mixing model can produce misleading results because ofvariations in δ13C-ΣCO2 with salinity (Matson and Brinson, 1990; Fogel and Cifuentes, 1993).In the NRE, δ13C-TOC values increase with salinity (Fig. 5.9) but do not change appreciablywith depth at any of the 9 coring stations; down-core variability averages ±0.3‰ , comparable tothe instrumental precision. Uniform δ13C-TOC values suggest that the relative contribution of
Figure 5.13 Relationship between total organic carbon (TOC) andporosity in the sediments from the 9 coring sites in the Neuse RiverEstuary. The solid curve represents the exponential function that wasfit to the TOC vs. porosity data from surficial sediments (Fig. 5.5C).

86
Figure 5.14 Depth distributions of C:N (molar) ratios from 9 sites in the Neuse River Estuary.The inverted triangles represent surface sediment samples.

87
different organic matter sources (algae, vascular plants, and soil), the isotopic composition ofwater column ΣCO2, and the kinetic isotope effect associated with primary production have notchanged markedly during the time period represented by the 35-cm sediment column.
In contrast to carbon, profiles of stable nitrogen isotope ratios show a consistent trend atmost of the stations (Fig. 5.15): δ15N-TN values decrease with depth by 1-3‰ in all cores exceptS42D. The enrichment of 15N in more recently deposited sediment provides an indication thatdespite increases in nitrogen loading, primary production in the Neuse River is not currentlyshifting away from nitrogen-limitation. Such a shift would allow for higher dissolved inorganicnitrogen concentrations, increased expression of the enzymatic isotope effect during nitrogenuptake, and isotopically “lighter” organic nitrogen. Also, there is no evidence from the isotoperecord that the contribution of nitrogen derived from chemical fertilizer (δ15N values close to0‰ ) has increased in recent years. The isotopic composition of municipal sewage is highlyvariable (-1 to +8‰ , Eadie et al., 1994) but not sufficiently “heavy” to explain the trend seen inthe cores. An increase in nitrification-denitrification is a candidate for explaining “heavier”nitrogen isotopes in more recently deposited sediment. These processes preferentially removeisotopically “light” nitrogen from the system and are known to be stimulated by high nitrogenloading (Seitzinger, 1990).
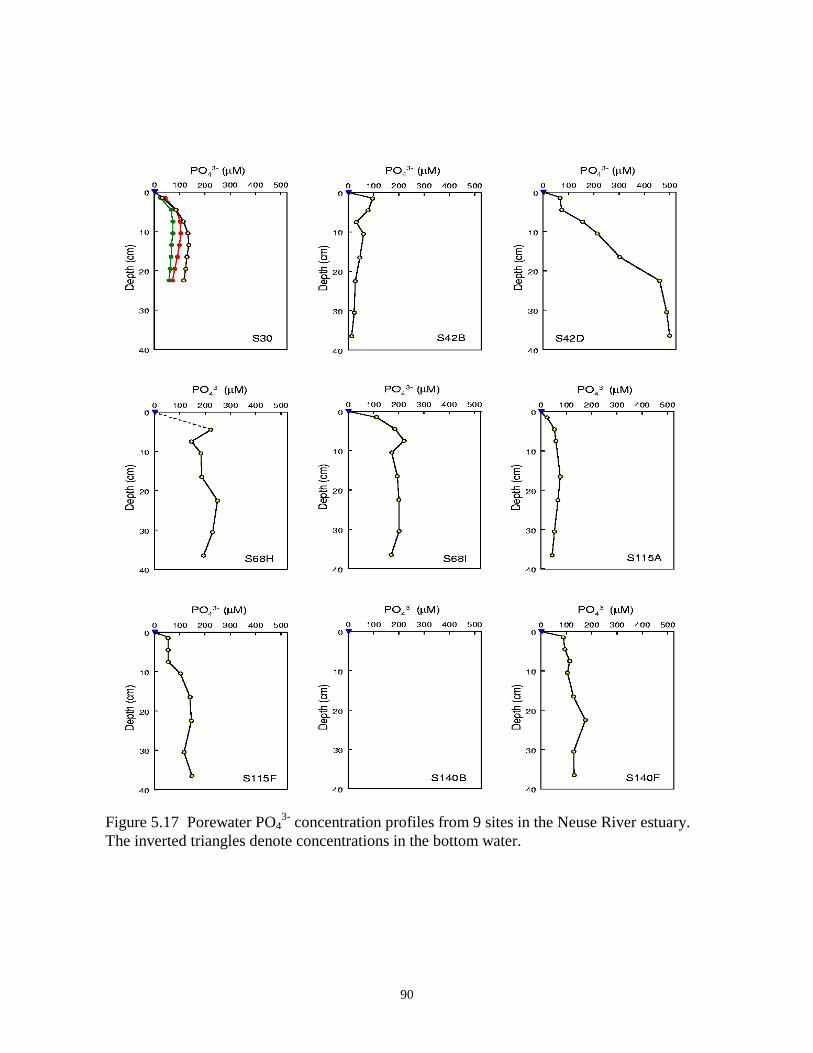
Porewater nutrient profiles for the 9 stations are given in Figs. 5.16 and 5.17.Ammonium concentrations increase from <10 µM in the bottom water to 300-1700 µM in thesediment (Fig. 5.16), suggesting a substantial flux of NH4
+ across the sediment-water interface.The highest NH4
+ concentrations occur at Sta. S42D, the upriver mid-channel site (Fig. 5.1) withhighest TOC values (Fig. 5.12) and no depth gradient in C:N (Fig. 5.14) or δ15N-TN (Fig. 5.15).For most stations, the increase in NH4
+ concentration occurs primarily in the upper 5-10 cm.However at S42D, a significant gradient occurs to almost 40 cm, suggesting activeammonification throughout the sediment column. Porewater PO4
3- concentration profiles (Fig.5.17) show a similar pattern to NH4
+. The average value of the NH4+:PO4
3- ratio (4:1) is muchless than expected for fresh algal material (16:1), suggesting that N is preferentially lost and P ispreferentially retained in the sediment. Porewater NO3
- concentrations at Sta. S30 were very low(£ 1 µM) throughout the sediment column despite high concentrations (50 µM) in the bottomwater. Much higher sampling resolution is needed to accurately capture the porewater NO3
-
gradient. Nevertheless, rapid NO3- depletion in the uppermost sediments suggests that
denitrification can be an important process in these sediments.
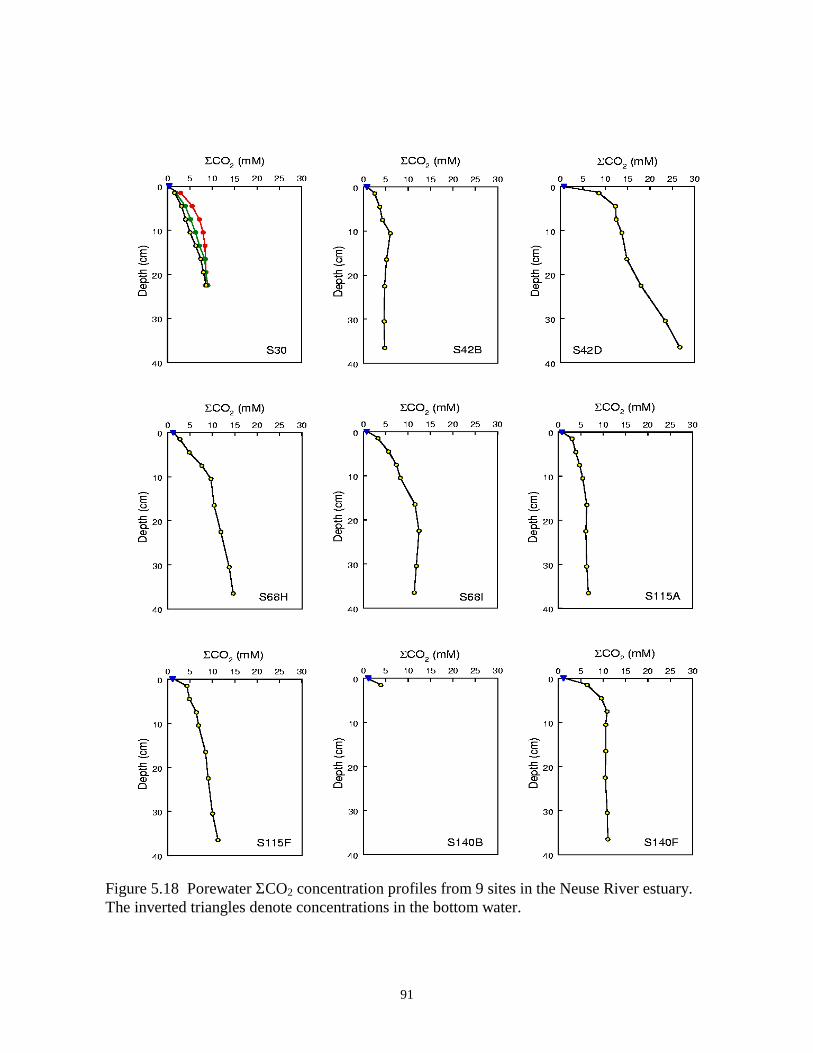
Depth distributions of ΣCO2 show a pattern that is consistent with the nutrient profiles(Fig. 5.18). Porewater ΣCO2 is elevated above bottom water at all stations, indicating activedegradation of sedimentary organic matter. As with NH4
+ and PO43-, the highest ΣCO2
concentrations occur at Sta. S42B. The shapes of the ΣCO2 profiles provide a constraint on thedepth of the active remineralization zone: the absence of a concentration gradient indicatesdepletion of reactive organic matter. The vertical extent of the remineralization zone rangesfrom 10 cm (Sta. S42B) to >35 cm (Stations S42D, S68H, and S115F). The occurrence of deepremineralization implies a relatively long lifetime for sedimentary organic matter. PorewaterDOC concentrations generally range from 1 to 3 mM, and continue to increase below 20 cm forStations S42D, S68H, and S115F, confirming deep remineralization at these sites.

88
Figure 5.15 Down-core variations in δ15N-TN from 9 sites in the Neuse River estuary. Theinverted triangles represent surface sediment samples.

89
Figure 5.16 Porewater NH4+ concentration profiles from 9 sites in the Neuse River estuary.
The inverted triangles denote concentrations in the bottom water.
90
Figure 5.17 Porewater PO43- concentration profiles from 9 sites in the Neuse River estuary.
The inverted triangles denote concentrations in the bottom water.
91
Figure 5.18 Porewater ΣCO2 concentration profiles from 9 sites in the Neuse River estuary.The inverted triangles denote concentrations in the bottom water.
92
Sulfate concentration profiles indicate significant sulfate reduction at all but the mostupriver site (Fig. 5.19). Sulfate reduction produces H2S, which can diffuse to the sediment-waterinterface and contribute to the O2 demand. At sites where SO4
2- depletion occurs before reactiveorganic matter is exhausted, CH4 production will occur. Like H2S, CH4 can diffuse to thesediment surface where it is oxidized at the expense of O2. Alternatively, CH4 concentrationscan exceed saturation and form bubbles that exit the sediment via ebullition. At Sta. S30, CH4concentrations reached saturation at 5 cm below the sediment surface, suggesting that ebullitionmay be an important mechanism for transferring reduced compounds (O2 demand) from thesediment to the water column.
Several recent studies suggest that advective flow of groundwater may be a quantitativelyimportant source of nutrients in coastal regions (e.g., Moore, 1996; Church, 1996). However,porewater Cl- profiles (Fig. 5.20) suggest that this process is only important in the Neuse in theup-river section near Sta. S42B. Although several other sites show slight decreases in Cl- withdepth, this freshening effect may be related to temporal variations in bottom water chlorinity.The response time of porewater Cl- to changes in bottom-water salinity— estimated as L2/Dwhere L is length scale and D is diffusivity— ranges from 2 weeks in the upper 5 cm to 7 monthsat a depth of 20 cm. Thus, Cl- concentrations below 20 cm reflect the average annual salinitywhile surficial values reflect seasonal variations. Cores collected in this study (except for Sta.S30) were sampled in October; elevated Cl- concentrations in the upper 10 cm likely reflecthigher salinities that occur during the relatively dry summer period. The impact of advectivegroundwater flow at Sta. S42B is discussed in Section 5.4.6.
5.3.3 Benthic fluxes
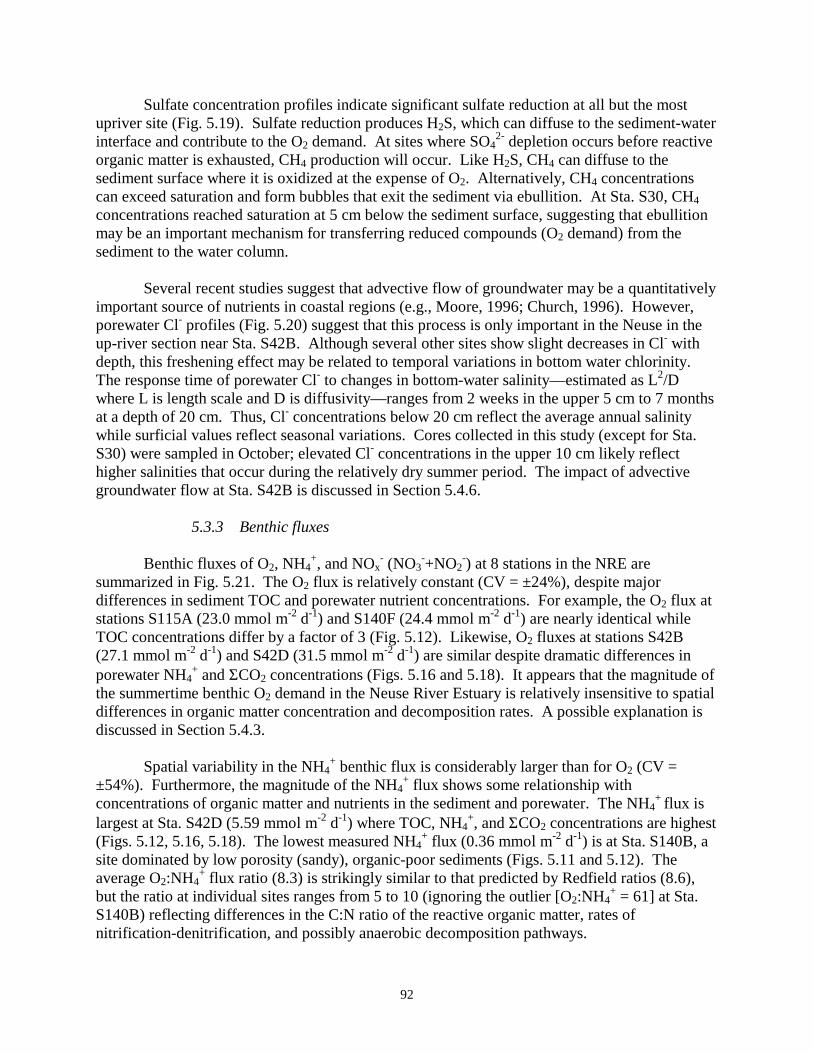
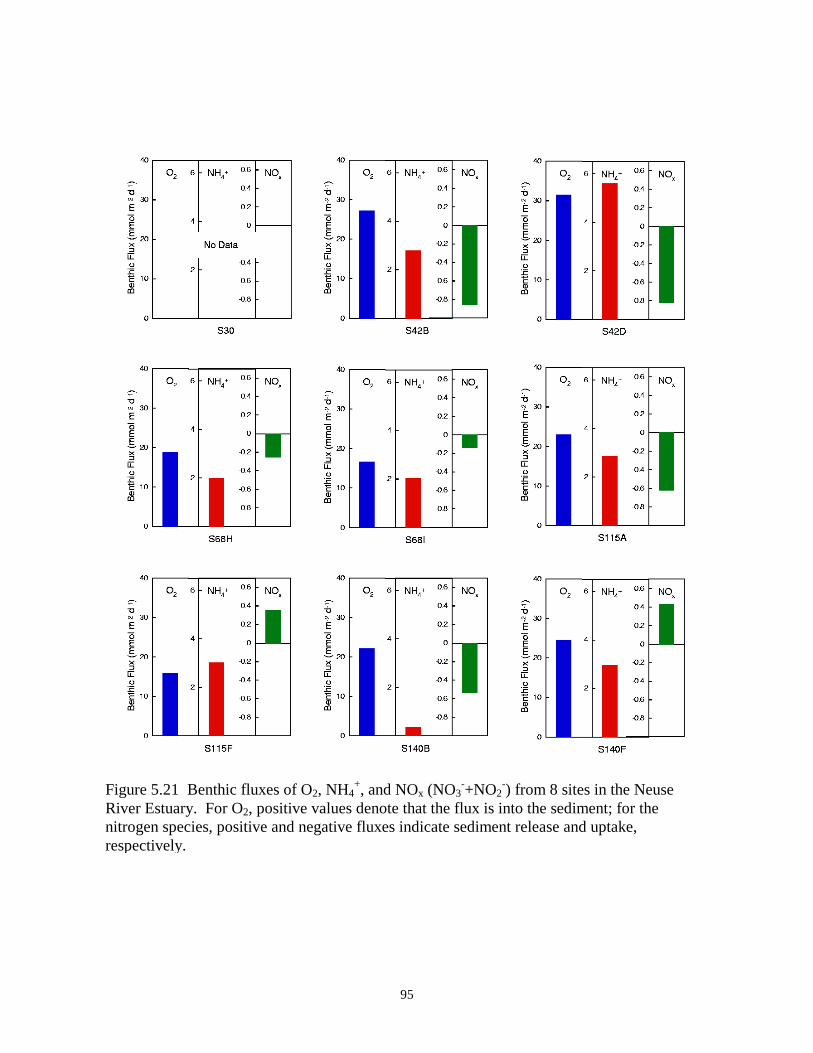
Benthic fluxes of O2, NH4+, and NOx
- (NO3-+NO2
-) at 8 stations in the NRE aresummarized in Fig. 5.21. The O2 flux is relatively constant (CV = ±24%), despite majordifferences in sediment TOC and porewater nutrient concentrations. For example, the O2 flux atstations S115A (23.0 mmol m-2 d-1) and S140F (24.4 mmol m-2 d-1) are nearly identical whileTOC concentrations differ by a factor of 3 (Fig. 5.12). Likewise, O2 fluxes at stations S42B(27.1 mmol m-2 d-1) and S42D (31.5 mmol m-2 d-1) are similar despite dramatic differences inporewater NH4
+ and ΣCO2 concentrations (Figs. 5.16 and 5.18). It appears that the magnitude ofthe summertime benthic O2 demand in the Neuse River Estuary is relatively insensitive to spatialdifferences in organic matter concentration and decomposition rates. A possible explanation isdiscussed in Section 5.4.3.
Spatial variability in the NH4+ benthic flux is considerably larger than for O2 (CV =
±54%). Furthermore, the magnitude of the NH4+ flux shows some relationship with
concentrations of organic matter and nutrients in the sediment and porewater. The NH4+ flux is
largest at Sta. S42D (5.59 mmol m-2 d-1) where TOC, NH4+, and ΣCO2 concentrations are highest
(Figs. 5.12, 5.16, 5.18). The lowest measured NH4+ flux (0.36 mmol m-2 d-1) is at Sta. S140B, a
site dominated by low porosity (sandy), organic-poor sediments (Figs. 5.11 and 5.12). Theaverage O2:NH4
+ flux ratio (8.3) is strikingly similar to that predicted by Redfield ratios (8.6),but the ratio at individual sites ranges from 5 to 10 (ignoring the outlier [O2:NH4
+ = 61] at Sta.S140B) reflecting differences in the C:N ratio of the reactive organic matter, rates ofnitrification-denitrification, and possibly anaerobic decomposition pathways.

93
Figure 5.19 Porewater SO42- concentration profiles from 9 sites in the Neuse River estuary. The
inverted triangles denote concentrations in the bottom water.

94
Figure 5.20 Porewater Cl- concentration profiles from 9 sites in the Neuse River estuary. Theinverted triangles denote concentrations in the bottom water.
95
Figure 5.21 Benthic fluxes of O2, NH4+, and NOx (NO3
-+NO2-) from 8 sites in the Neuse
River Estuary. For O2, positive values denote that the flux is into the sediment; for thenitrogen species, positive and negative fluxes indicate sediment release and uptake,respectively.

96
Sediments can serve as either a source or sink for bottom-water NO3- depending on the
relative rates of nitrification and denitrification. Sediment uptake of NOx- was highest in
samples collected at the upriver stations (S42B and S42D) where it removed a quantity of NO3-
equivalent to 15-30% of the benthic NH4+ release (Fig. 5.21). At Sta. S140B, the flux of NOx
-
into the sediment (-0.53 mmol m-2 d-1) exceeded the flux of NH4+ from the sediment (0.36 mmol
m-2 d-1) by almost 50%. For sediment collected from several of the down-river sites (StationsS115A and S140F), the NOx
- flux augmented the NH4+ flux by 10-15%.
5.3.4 Seston concentration and composition
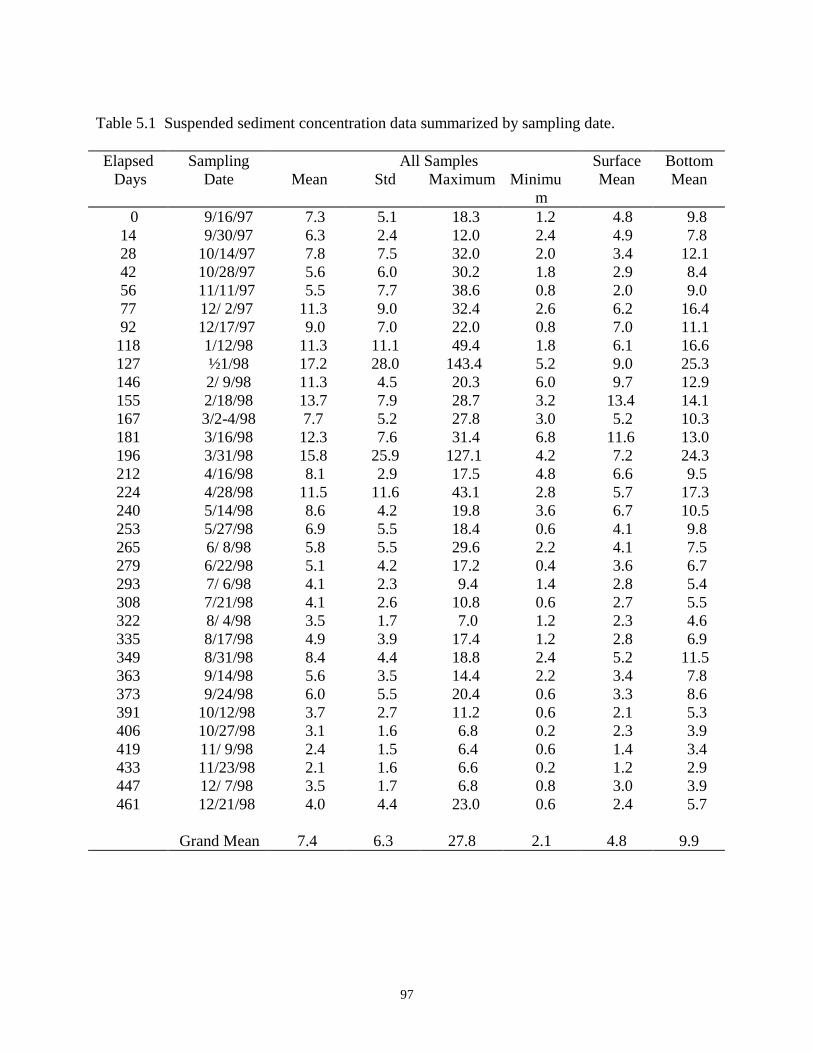
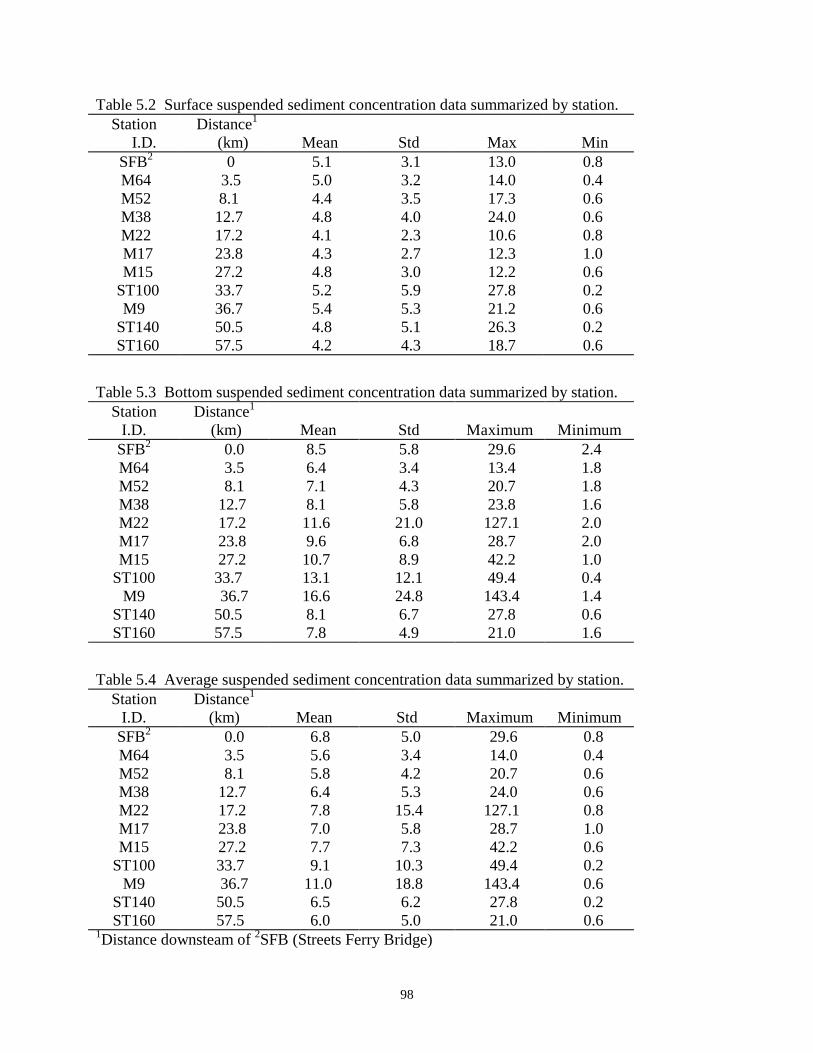
Sediment in suspension shows little change among stations and only modest change overtime (Tables 5.1-5.4). Average surface and bottom concentrations for the entire data set were 4.8and 9.9 mg/l, respectively. Examination of data on a station-by-station basis shows that in everycase concentrations were lower at the surface than at the bottom with surface values being almostinvariant. Although the bottom concentrations show two peaks, a turbidity maximum cannot beclearly established from the data. Several of the very high bottom concentrations (stations M9and M22) may have been a result of unintended bottom disturbance (resuspension) during thesampling procedure, thereby biasing results at these stations. Sediment concentrations over the16-month period of observations show slightly more than a two-fold change both in surfacevalues and in bottom values. In every case, average concentrations at the surface were lowerthan concentrations at the bottom.
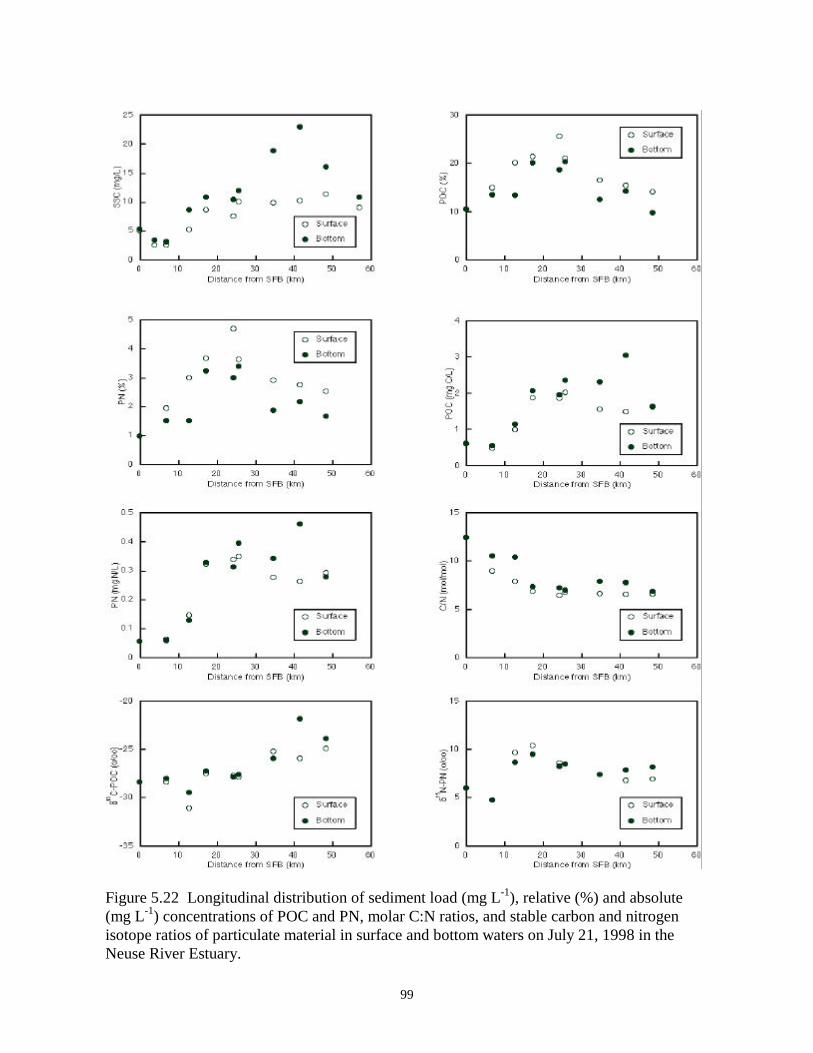
The longitudinal distributions of suspended particulate matter in surface and bottomwaters on 07/21/98 and 10/27/98 are illustrated in Figs. 5.22 and 5.23, respectively. Thereappears to be an increase in suspended sediment concentration (SSC) with longitudinal distancefrom SFB on both dates. The difference between surface and bottom-water SSC was smallest inthe up-estuary stations near SFB and increased with distance downstream suggesting a greaterdownstream contribution of re-suspended bottom sediment in the estuarine bottom waters. Theweight percent of particulate organic carbon (POC) ranged from 10% near SFB to ~25% in Julyand ~45% in October. Lower POC values in bottom waters are generally associated with higherSSC, suggesting a contribution from C-poor re-suspended sediment. A plot of absolute POCconcentration (mg L-1) vs. distance downstream shows an increase in July, whereas thisrelationship is less clear in October. The estuarine concentrations of particulate nitrogen (PN)were as high as 3-5% in July and 6-8% in October. The relative and absolute concentrations ofPN follow closely the trends shown by the POC fraction.
In July, C:N ratios in the upper three stations (SFB, 58, 68) suggest a contribution byterrestrial sources or preferential N removal via degradative processes. In October, suspendedmatter in the upper estuary has similar C:N ratios (~7) to those in the lower estuary, suggestiveof the predominance of planktonic materials along the estuarine axis. In July, the δ13C ofsuspended organic matter increased from -29 to –24‰ , potentially indicating the reducedinfluence of up estuary terrestrial material and increased impact of sound-derived particulates.The δ15N of suspended matter tended to be lowest near SFB and exhibited a weakly defined mid-estuary maximum in the 15 to 30 km reach of the estuary, near stations M38 to M15. A mid-estuarine isotopic maximum (~14 ‰ ) was observed by Middelburg and Nieuwenhuize (in press)in the polluted Schelde Estuary. They suggested this enrichment was due to the utilization of
97
Table 5.1 Suspended sediment concentration data summarized by sampling date.
Elapsed Sampling All Samples Surface Bottom Days Date Mean Std Maximum Minimu
mMean Mean
0 9/16/97 7.3 5.1 18.3 1.2 4.8 9.814 9/30/97 6.3 2.4 12.0 2.4 4.9 7.828 10/14/97 7.8 7.5 32.0 2.0 3.4 12.142 10/28/97 5.6 6.0 30.2 1.8 2.9 8.456 11/11/97 5.5 7.7 38.6 0.8 2.0 9.077 12/ 2/97 11.3 9.0 32.4 2.6 6.2 16.492 12/17/97 9.0 7.0 22.0 0.8 7.0 11.1118 1/12/98 11.3 11.1 49.4 1.8 6.1 16.6127 ½1/98 17.2 28.0 143.4 5.2 9.0 25.3146 2/ 9/98 11.3 4.5 20.3 6.0 9.7 12.9155 2/18/98 13.7 7.9 28.7 3.2 13.4 14.1167 3/2-4/98 7.7 5.2 27.8 3.0 5.2 10.3181 3/16/98 12.3 7.6 31.4 6.8 11.6 13.0196 3/31/98 15.8 25.9 127.1 4.2 7.2 24.3212 4/16/98 8.1 2.9 17.5 4.8 6.6 9.5224 4/28/98 11.5 11.6 43.1 2.8 5.7 17.3240 5/14/98 8.6 4.2 19.8 3.6 6.7 10.5253 5/27/98 6.9 5.5 18.4 0.6 4.1 9.8265 6/ 8/98 5.8 5.5 29.6 2.2 4.1 7.5279 6/22/98 5.1 4.2 17.2 0.4 3.6 6.7293 7/ 6/98 4.1 2.3 9.4 1.4 2.8 5.4308 7/21/98 4.1 2.6 10.8 0.6 2.7 5.5322 8/ 4/98 3.5 1.7 7.0 1.2 2.3 4.6335 8/17/98 4.9 3.9 17.4 1.2 2.8 6.9349 8/31/98 8.4 4.4 18.8 2.4 5.2 11.5363 9/14/98 5.6 3.5 14.4 2.2 3.4 7.8373 9/24/98 6.0 5.5 20.4 0.6 3.3 8.6391 10/12/98 3.7 2.7 11.2 0.6 2.1 5.3406 10/27/98 3.1 1.6 6.8 0.2 2.3 3.9419 11/ 9/98 2.4 1.5 6.4 0.6 1.4 3.4433 11/23/98 2.1 1.6 6.6 0.2 1.2 2.9447 12/ 7/98 3.5 1.7 6.8 0.8 3.0 3.9461 12/21/98 4.0 4.4 23.0 0.6 2.4 5.7
Grand Mean 7.4 6.3 27.8 2.1 4.8 9.9
98
Table 5.2 Surface suspended sediment concentration data summarized by station.Station Distance1
I.D. (km) Mean Std Max Min SFB2 0 5.1 3.1 13.0 0.8 M64 3.5 5.0 3.2 14.0 0.4 M52 8.1 4.4 3.5 17.3 0.6 M38 12.7 4.8 4.0 24.0 0.6 M22 17.2 4.1 2.3 10.6 0.8 M17 23.8 4.3 2.7 12.3 1.0 M15 27.2 4.8 3.0 12.2 0.6
ST100 33.7 5.2 5.9 27.8 0.2M9 36.7 5.4 5.3 21.2 0.6
ST140 50.5 4.8 5.1 26.3 0.2 ST160 57.5 4.2 4.3 18.7 0.6
Table 5.3 Bottom suspended sediment concentration data summarized by station.Station Distance1
I.D. (km) Mean Std Maximum MinimumSFB2 0.0 8.5 5.8 29.6 2.4M64 3.5 6.4 3.4 13.4 1.8M52 8.1 7.1 4.3 20.7 1.8M38 12.7 8.1 5.8 23.8 1.6M22 17.2 11.6 21.0 127.1 2.0M17 23.8 9.6 6.8 28.7 2.0M15 27.2 10.7 8.9 42.2 1.0
ST100 33.7 13.1 12.1 49.4 0.4M9 36.7 16.6 24.8 143.4 1.4
ST140 50.5 8.1 6.7 27.8 0.6ST160 57.5 7.8 4.9 21.0 1.6
Table 5.4 Average suspended sediment concentration data summarized by station.Station Distance1
I.D. (km) Mean Std Maximum MinimumSFB2 0.0 6.8 5.0 29.6 0.8M64 3.5 5.6 3.4 14.0 0.4M52 8.1 5.8 4.2 20.7 0.6M38 12.7 6.4 5.3 24.0 0.6M22 17.2 7.8 15.4 127.1 0.8M17 23.8 7.0 5.8 28.7 1.0M15 27.2 7.7 7.3 42.2 0.6
ST100 33.7 9.1 10.3 49.4 0.2M9 36.7 11.0 18.8 143.4 0.6
ST140 50.5 6.5 6.2 27.8 0.2ST160 57.5 6.0 5.0 21.0 0.6
1Distance downsteam of 2SFB (Streets Ferry Bridge)
99
Figure 5.22 Longitudinal distribution of sediment load (mg L-1), relative (%) and absolute(mg L-1) concentrations of POC and PN, molar C:N ratios, and stable carbon and nitrogenisotope ratios of particulate material in surface and bottom waters on July 21, 1998 in theNeuse River Estuary.

100
Figure 5.23 Longitudinal distribution of sediment load (mg L-1), relative (%) and absolute(mg L-1) concentrations of POC and PN, molar C:N ratios, and stable carbon and nitrogenisotope ratios of particulate material in surface and bottom waters on October 27, 1998 in theNeuse River Estuary.

101
isotopically enriched, residual NH4+ from nitrification as suggested by Mariotti et al. (1984). An
additional explanation was extensive algal uptake where N became limited as was observed byCifuentes et al. (1988) in the Delaware Estuary.
5.4 Discussion
5.4.1 Sediments and Processes of Sedimentation
It is clear that sediment distribution patterns are related to basin morphology andestuarine processes. Sands that occur along the flanks of the channel have probably been derivedfrom shoreline erosion of older Pleistocene deposits, as has been noted in other parts of theAlbemarle-Pamlico system (Stirewalt and Ingram, 1974; Bellis et al. 1975). Waves that impingeon the shallow estuarine shoulders during storms, especially on the south side of the lowerestuary, promote shoreline erosion, create narrow estuarine beaches, and prevent deposition ofmud. Microscopic examination of the filter pads from samples taken over the 16-month periodreveals that in fact little sand enters the estuary from upstream, at least as suspended load. Mostof the sand in the Neuse drainage basin has been trapped well above the estuarine section and isstored in the drainage basin as old overbank or point bar deposits.
As the bottom profile drops off to the estuarine basin, organic-rich muds quickly replaceclean shoreline sands as the dominant bottom material. Vibracores from other studies show,however, that sands underlie the muds at depths of 0.5 m to 3.5 m below the bottom (Wells andKim, 1991). The lateral distribution and thickness of organic-rich mud increases as the basinwidens and deepens downstream (Riggs et al. 1991). This present-day dominance of mudthroughout much of the NRE is a result of several factors: 1) lack of new sand from upstreamsources, 2) efficient trapping by estuarine process, and 3) possible landward transport of mudfrom Pamlico Sound (Benninger and Wells, 1993). On geologic time scales, the organic-richmuds are very recent; however, on time scales relevant to modeling or management, the muds(except in the top several cm) can be considered "old" and unlikely to change significantly intheir surficial distribution patterns.
The significance of the range in surficial sediment size is twofold. First, sediments ofdifferent sizes have very different resuspension and transport dynamics. Not only will the spatialdistribution of shear stress vary with wind direction and speed, but the response to any givenshear distribution will also vary because of different degrees of sediment stability. Second, thereis an association of nutrients, heavy metals and other polluting substances with the muds. Notonly are these muds the easiest materials to resuspend from the bottom, but they are thedominant materials in the Neuse and represent a large reservoir in estuaries in general.
The fact that much of the mud appears to be aggregated would at first suggest thatvertical flux may be high. Whereas size analysis of disaggregated muds reveals a mean diameterof about 4 microns (Wells and Kim, 1991), in situ photographs show mean aggregate sizes 1-2orders-of-magnitude greater (Wells and Kim, 1989). Settling speeds from two fall-velocityexperiments conducted near New Bern using an in situ settling chamber show mean aggregatediameters of 156 microns and 179 microns with settling speeds of 0.023 cm/s and 0.024 cm/s,respectively (S.C. Knowles, personal communication). These settling speeds appear to be lower
102
than those in other estuaries and, when combined with the low suspended sedimentconcentrations, probably result in relatively low long-term sedimentation rates.
Previous research using radionuclides has shown that short-term sedimentation rates(order of years) are highest in the upper estuary (stations 50-70), but that highest long-term rates(order of decades) are in mid-estuary regions (stations 120-160) where they range from 1-6mm/yr (Benninger, 1989, 1990; Wells and Kim, 1991). Thus it appears that trapping of muds inthe upper estuary occurs only on a short-term basis and that intervals of rapid accumulationalternate with episodes of erosion. Despite the trapping efficiency of the estuary and thewidespread occurrence of organic-rich muds, these soft muds are considered to be mobilesediments, and ultimately what accumulates in the Neuse over a period of decades is swept intoPamlico Sound.
Although samples were taken during fairweather conditions, suspended sedimentconcentrations are remarkably low and uniform, given that much of the estuarine basin iscomprised of organic-rich mud with a mobile upper surface. Sediment resuspension in estuariesis often assumed to be dominated by tidal currents, particularly in deep, narrow estuaries havingrelatively strong tidal flow. However, tidal forcing in the Neuse is minimal and sedimentresuspension in this shallow system is probably dominated by storm events. The previously-measured (maximum) sediment accumulation rates of 1-6 mm/yr probably account for stormresuspension and are considered insufficient for significant basin infilling at present rates of sealevel rise of 1-2 mm/yr.
5.4.2 Sediment nitrogen and carbon inventories
The average sediment TN concentration (%N) along each latitudinal transect is relativelyuniform but the inventory (tons of N) increases from New Bern toward Pamlico Sound as thearea of the estuary becomes larger. The uppermost 2 cm of sediment contains 7800 tons ofnitrogen. In contrast, the total nitrogen (particulate nitrogen, dissolved organic nitrogen, urea,NH4
+, and NO3-) content of the entire 3-4 meter water column is less than 800 tons (Christian et
al., 1991). The large pool sedimentary nitrogen serves as a vast nutrient storage reservoir andcan be an important source of NH4
+ to the overlying water, particularly during the summer whenexternal nitrogen loading is at a minimum (Paerl et al., 1998). The total inventory of organiccarbon in the upper 2 cm of Neuse River sediments is 86,000 tons.
5.4.3 Sediment O2 demand
Benthic O2 fluxes measured in October 1997 are relatively uniform for the 8 stations thatwere sampled (Fig. 5.21). Furthermore, variations among the stations do not appear to correlatewith sediment and porewater parameters that generally relate to benthic metabolism (e.g., TOCcontent and porewater ΣCO2 and NH4
+). Sauber (1998) conducted a similar spatial survey in theNeuse River during September/October 1996-97 using in situ benthic chambers. He also reportsmodest variability (CV = ±25%) among 6 of 7 sites located in the upper and mesohaline portionof the estuary. The outlier flux, an extremely low value measured in hard, sandy sedimentshortly after the passage of Hurricane Fran, was attributed to scouring of organic matter and fine-grained sediments during high flow conditions. Rizzo and Christian (1996) conducted seasonal
103
measurements of sediment O2 uptake over the entire length of the estuary using unstirredsediment cores. Their extensive data set (654 incubations) is suitable for rigorous statisticalanalysis and shows no significant difference in the annually integrated benthic O2 fluxthroughout the estuary. Furthermore, temporal variability is highly complex; only a smallcomponent of the variance can be attributed to temperature. However, they did observesubstantial differences among stations at any given time. On at least one occasion, nearly everysite had significantly greater O2 uptake than all the others.
Diffusion limitation may contribute to the modest spatial variability in the benthic O2 fluxdata and the poor correlation with sediment and porewater parameters. For dissolvedconstituents with strong concentration gradients at the sediment-water interface, sediment uptakecould be controlled by molecular diffusion through the stagnant boundary layer. Boundarylayers are typically 0.2-1.3 mm thick (Jørgensen, 1996) and stirring mechanisms in benthicchambers are often designed to create a stagnant layer that falls in this range (Devol, 1987). Themaximum (diffusion limited) O2 flux (JO2) through a 0.7-mm thick boundary layer (∆z) is:
JO 2 = ϕ 3D0∆O2
∆z= 0.9( )3 ⋅1.4 cm 2 d − 1 ⋅200 nmol cm-3
0.07 cm= 29 mmol m -2 d-1 ,
where ϕ is porosity at the sediment surface, Do is the molecular diffusion coefficient for O2 at25°C (Li and Gregory, 1974), and ∆O2 is the difference between O2 concentration in bulkbottom-water (assumed to be 200 µM or 6 mg L-1) and the base of the stagnant boundary layer(assumed to be zero for calculating the diffusion-limited flux). This value is close to themaximum measured O2 flux (Fig. 5.21), suggesting that diffusion limitation may serve as agovernor for regulating sediment O2 demand.
The average of our O2 flux data is compared with results from several other Neuse Riverstudies in Table 5.5. Although the measurements were conducted at different sites and timesusing different methods, our fluxes appear to overlap with those reported by Sauber (1998). Thesomewhat lower values reported by Rizzo and Christian (1996) may be due to a larger proportionof shallow (1 m) sandy-sediment sites or the absence of stirring during the core incubationsresulting in thicker boundary layers (> 1 mm) and greater diffusion limitation.
Bottom-water in the mesohaline region of the Neuse River is hypoxic (<2.0 mg O2 L-1)for about 60% of the days from May through October (Garrett, 1994). The basic cause of thehypoxia is well known: O2 consumption exceeds resupply from vertical mixing and lateraltransport. During periods of calm or southwest winds, the NRE becomes highly stratified andthe strong pycnocline located 1-1.5 m above the bottom greatly restricts bottom-waterventilation. Respiration in the water and sediments both contribute to O2 consumption in thebottom water. Assuming that bottom-water contains 200 µM O2 (6 mg L-1) prior to stratification,the O2 inventory below the pycnocline is 200-300 mmol m-2. The average sediment O2 demandfor the Neuse River (25±10 mmol m-2 d-1, Table 5.5) is sufficient to completely consume bottom-water O2 in ~10 days. Likewise, the pelagic O2 demand (32±23 mmol m-3 d-1, Sauber [1998])will consume the bottom-water O2 pool in ~6 days. Although benthic and pelagic respiration areof comparable magnitude, the inventory of sedimentary organic carbon (and hence O2 demand)
104
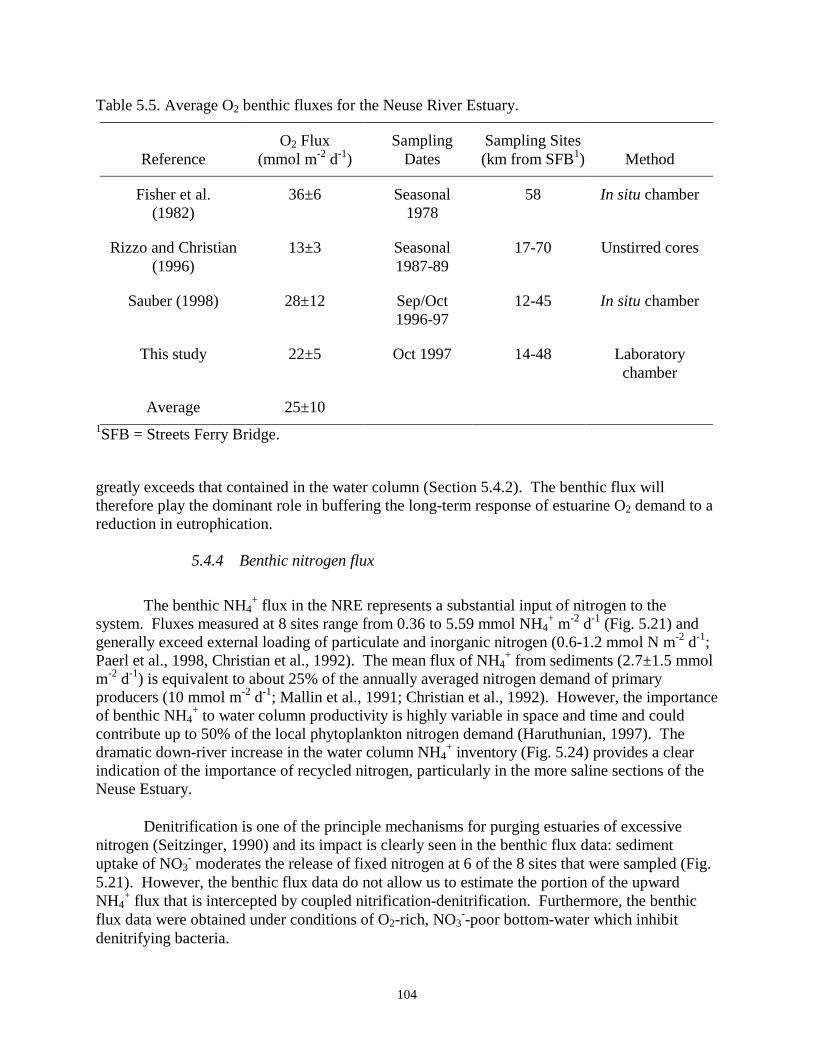
Table 5.5. Average O2 benthic fluxes for the Neuse River Estuary.
ReferenceO2 Flux
(mmol m-2 d-1)Sampling
DatesSampling Sites(km from SFB1) Method
Fisher et al.(1982)
36±6 Seasonal1978
58 In situ chamber
Rizzo and Christian(1996)
13±3 Seasonal1987-89
17-70 Unstirred cores
Sauber (1998) 28±12 Sep/Oct1996-97
12-45 In situ chamber
This study 22±5 Oct 1997 14-48 Laboratorychamber
Average 25±101SFB = Streets Ferry Bridge.
greatly exceeds that contained in the water column (Section 5.4.2). The benthic flux willtherefore play the dominant role in buffering the long-term response of estuarine O2 demand to areduction in eutrophication.
5.4.4 Benthic nitrogen flux
The benthic NH4+ flux in the NRE represents a substantial input of nitrogen to the
system. Fluxes measured at 8 sites range from 0.36 to 5.59 mmol NH4+ m-2 d-1 (Fig. 5.21) and
generally exceed external loading of particulate and inorganic nitrogen (0.6-1.2 mmol N m-2 d-1;Paerl et al., 1998, Christian et al., 1992). The mean flux of NH4
+ from sediments (2.7±1.5 mmolm-2 d-1) is equivalent to about 25% of the annually averaged nitrogen demand of primaryproducers (10 mmol m-2 d-1; Mallin et al., 1991; Christian et al., 1992). However, the importanceof benthic NH4
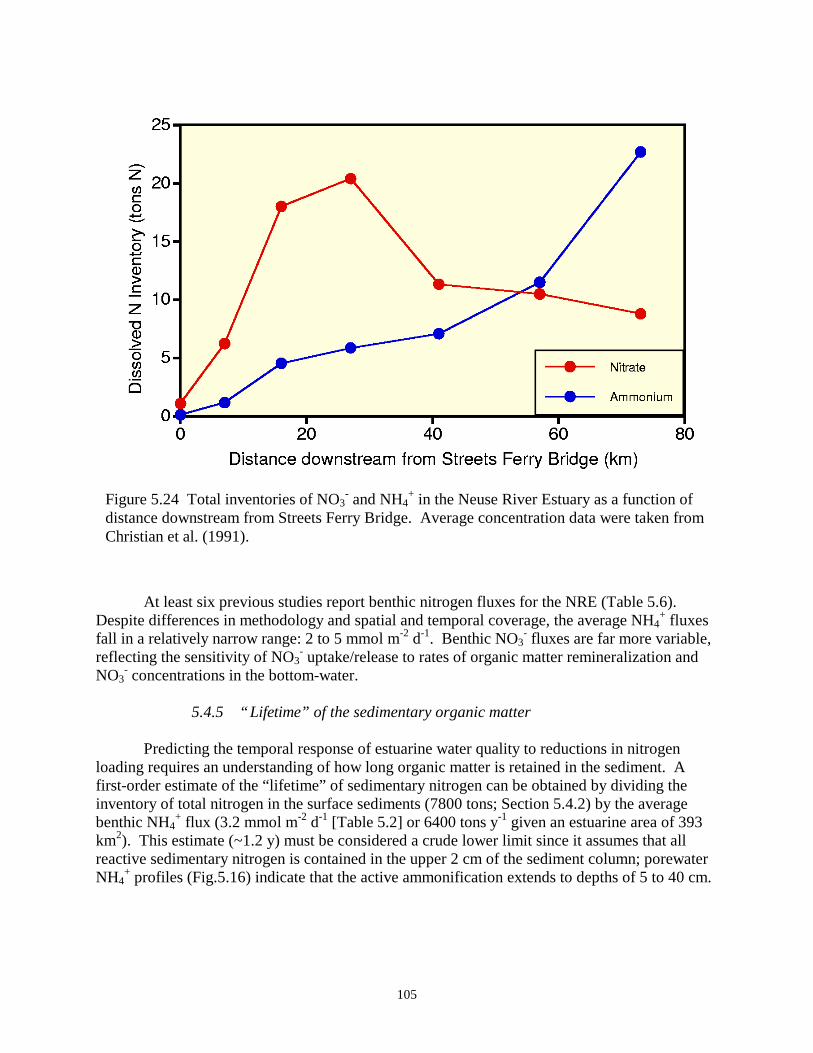
+ to water column productivity is highly variable in space and time and couldcontribute up to 50% of the local phytoplankton nitrogen demand (Haruthunian, 1997). Thedramatic down-river increase in the water column NH4
+ inventory (Fig. 5.24) provides a clearindication of the importance of recycled nitrogen, particularly in the more saline sections of theNeuse Estuary.
Denitrification is one of the principle mechanisms for purging estuaries of excessivenitrogen (Seitzinger, 1990) and its impact is clearly seen in the benthic flux data: sedimentuptake of NO3
- moderates the release of fixed nitrogen at 6 of the 8 sites that were sampled (Fig.5.21). However, the benthic flux data do not allow us to estimate the portion of the upwardNH4
+ flux that is intercepted by coupled nitrification-denitrification. Furthermore, the benthicflux data were obtained under conditions of O2-rich, NO3
--poor bottom-water which inhibitdenitrifying bacteria.
105
At least six previous studies report benthic nitrogen fluxes for the NRE (Table 5.6).Despite differences in methodology and spatial and temporal coverage, the average NH4
+ fluxesfall in a relatively narrow range: 2 to 5 mmol m-2 d-1. Benthic NO3
- fluxes are far more variable,reflecting the sensitivity of NO3
- uptake/release to rates of organic matter remineralization andNO3
- concentrations in the bottom-water.
5.4.5 “Lifetime” of the sedimentary organic matter
Predicting the temporal response of estuarine water quality to reductions in nitrogenloading requires an understanding of how long organic matter is retained in the sediment. Afirst-order estimate of the “lifetime” of sedimentary nitrogen can be obtained by dividing theinventory of total nitrogen in the surface sediments (7800 tons; Section 5.4.2) by the averagebenthic NH4
+ flux (3.2 mmol m-2 d-1 [Table 5.2] or 6400 tons y-1 given an estuarine area of 393km2). This estimate (~1.2 y) must be considered a crude lower limit since it assumes that allreactive sedimentary nitrogen is contained in the upper 2 cm of the sediment column; porewaterNH4
+ profiles (Fig.5.16) indicate that the active ammonification extends to depths of 5 to 40 cm.
Figure 5.24 Total inventories of NO3- and NH4
+ in the Neuse River Estuary as a function ofdistance downstream from Streets Ferry Bridge. Average concentration data were taken fromChristian et al. (1991).

106
Table 5.6. Average NH4+ and NOx
- benthic fluxes for the Neuse River Estuary.
ReferenceNH4
+ Flux(mmol m-2 d-1)
NOx- Flux1
(mmol m-2 d-
1)
SamplingDates
Sampling Sites(km from SFB2) Method
Fisher et al.(1982)
5.4±4.0 0.08±0.08 Seasonal1978
58 In situ chamber
Matson et al.(1983)
1.8±0.9 — Seasonal1981-82
17-70 PorewaterGradient
Rizzo and Christian(1996)
2.4±0.7 0.6±0.5 Seasonal1987-89
17-70 Unstirred cores
Haruthunian(1987)
4.0±2.8 — Seasonal1996
13-42 PorewaterGradient
Sauber (1998) 2.7±1.3 -0.5±1.1 Sep/Oct1996-97
12-45 In situ chamber
This study 2.7±1.5 -0.3±0.5 Oct 1997 14-48 Laboratorychamber
Average 3.2±1.31Negative value denotes a flux into the sediment.2SFB = Streets Ferry Bridge.
Similarly, we can calculate the “lifetime” of the sediment O2 demand. The inventory oforganic carbon in the surface sediments (0-2 cm) is 86,000 tons (Section 5.4.2). Given theaverage benthic O2 flux (25±10 mmol m-2 d-1 [Table 5.5] or 115,000 tons y-1) and assumingRedfield stoichiometry for the reactive organic matter, we calculate a “lifetime” for O2 demandof ~2.6 y. Again, this estimate must be considered a crude lower limit since porewater ΣCO2profiles (Fig.5.18) indicate that organic matter decomposition occurs well below the 0-2 cmdepth interval. In contrast to the ~2.6 y “lifetime” of the benthic O2 demand, the residence timeof suspended particulate organic in the bottom-water is only 3 to 6 days (assuming 1-2 mg C L-1
[Figs. 5.22 and 5.23], water column O2 consumption rate of 32 µM d-1 [Sauber, 1998] andRedfield stoichiometry).
5.4.6 Groundwater advection
Several recent studies present evidence that large quantities of groundwater maydischarge directly into the coastal ocean (e.g., Moore, 1996; Church, 1996). The groundwatermay be enriched in nutrients and thereby serve as a significant source of nitrogen to the estuary.Porewater Cl- profiles from the NRE show a clear freshening effect with depth only at Sta. S42B,
107
a shallow site in the upriver section of the estuary (Fig. 5.20). We applied a steady-state, one-dimensional advection-diffusion model (Berner, 1980) to Cl- data from this site in order toestimate the upward, groundwater advection rate:
ddz
ϕDS
dcdz
= − ϕ (ω − υ )
dcdz
,
where ϕ is sediment porosity, Ds is the whole-sediment diffusion coefficient for Cl- at the in situtemperature and salinity (Li and Gregory, 1974), c is Cl- concentration, z is depth below thesediment surface, ω is downward advection due to the net effect of sedimentation andcompaction, and υ is upward advection associated with groundwater flow in the porewaters. Weassumed a sedimentation rate of 0.5 cm y-1 based on measurements from Benninger and Martens(1983) at a nearby site. The Cl- data were fit reasonably well with an upward advection rate of1 mm d-1. This rate is slow enough that upward advection will have minimal impact relative tomolecular diffusion (i.e., Peclet number is <1).
5.4.7 Benthic-pelagic coupling
Longitudinal profiles of δ13C, δ15N, and C:N values in estuarine seston have been used tostudy the mixing of terrestrial and marine particulates (Peters et al., 1978; Thornton andMcManus, 1994; and others). These studies assume that local autochthonous inputs are low andcan therefore be neglected. In a weakly flushed estuary like the Neuse, this assumption is notvalid as algal-derived organic matter is probably a significant component of the total suspendedmatter. We propose to use the isotopic and elemental composition of the seston and sediment totrace the settling and remineralization of the algal organic matter derived from specific bloomevents. Our preliminary data are discussed below.
Suspended particulates collected in July and October (Fig. 5.25a) were significantlyenriched in nitrogen (>6 %) compared to surficial (0-2 cm) sediment (<0.7%). Theconcentration differential is attributed to degradation of N-rich plankton in the upper 2 cm anddilution by N-poor lithogenic particles. Likewise, C:N ratios in suspended particles areconsistently lower than surface sediments (Fig. 5.25b). Suspended particulate C:N values near 8suggest a large contribution from planktonic material. The relative C enrichment in sediments islikely due to N loss during remineralization at the sediment-water interface. The δ13C ofsuspended particulates and sediments follow the same trend towards “heavier” marine valuesdownstream, although the water column samples show considerably more scatter (Fig. 5.25c).This trend is likely due to the changing isotopic composition of assimilated ΣCO2 rather than astrictly conservative mixing of terrestrial and marine particulates (Matson and Brinson, 1990). In the upper estuary near SFB, δ15N values of suspended particulates were lower thanthose found downstream of New Bern (Fig. 5.25d), suggesting either the predominance ofterrigenous sources or preferential uptake of isotopically “light” N. Under conditions where
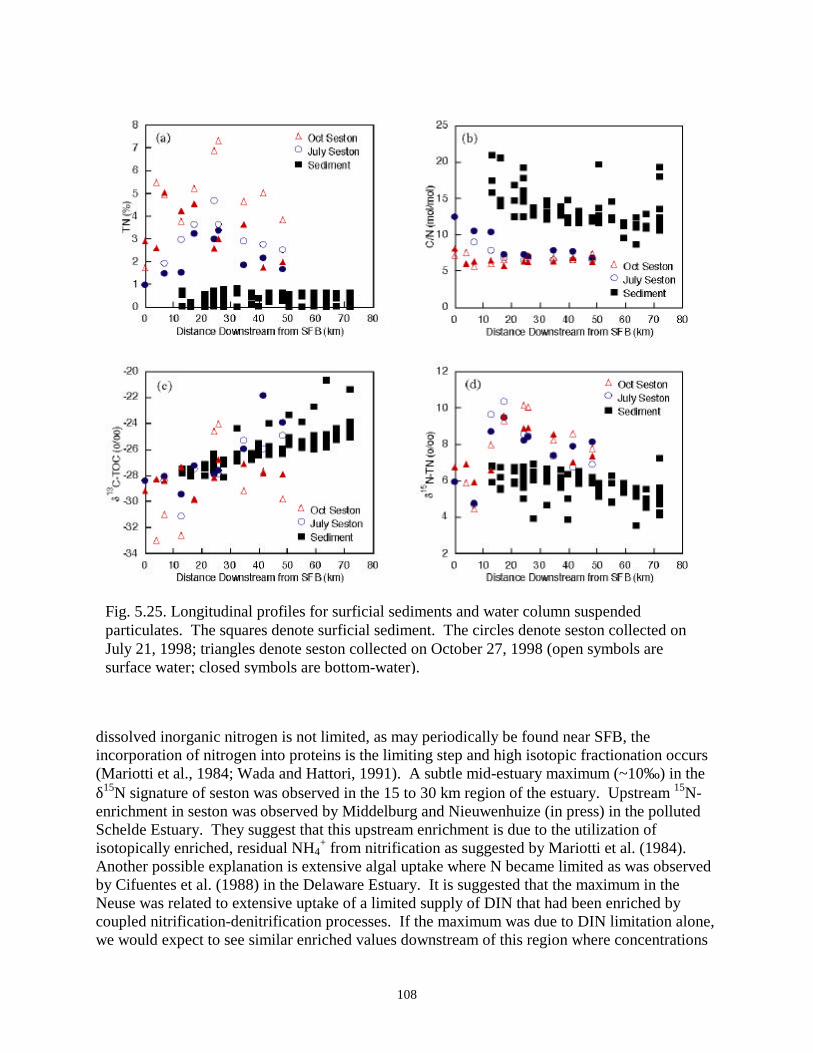
108
dissolved inorganic nitrogen is not limited, as may periodically be found near SFB, theincorporation of nitrogen into proteins is the limiting step and high isotopic fractionation occurs(Mariotti et al., 1984; Wada and Hattori, 1991). A subtle mid-estuary maximum (~10‰ ) in theδ15N signature of seston was observed in the 15 to 30 km region of the estuary. Upstream 15N-enrichment in seston was observed by Middelburg and Nieuwenhuize (in press) in the pollutedSchelde Estuary. They suggest that this upstream enrichment is due to the utilization ofisotopically enriched, residual NH4
+ from nitrification as suggested by Mariotti et al. (1984).Another possible explanation is extensive algal uptake where N became limited as was observedby Cifuentes et al. (1988) in the Delaware Estuary. It is suggested that the maximum in theNeuse was related to extensive uptake of a limited supply of DIN that had been enriched bycoupled nitrification-denitrification processes. If the maximum was due to DIN limitation alone,we would expect to see similar enriched values downstream of this region where concentrations
Fig. 5.25. Longitudinal profiles for surficial sediments and water column suspendedparticulates. The squares denote surficial sediment. The circles denote seston collected onJuly 21, 1998; triangles denote seston collected on October 27, 1998 (open symbols aresurface water; closed symbols are bottom-water).

109
of DIN are lower. This was not observed. Downstream seston δ15N values were “heavier” thanthat observed near SFB, but still “lighter” than water column particulates from the 15-30 kmreach. Suspended sediment δ15N values were enriched over sediments by about 2-4‰ in the 15to 30 km region of the estuary. This sediment-water column de-coupling of absolute δ15N valuesindicates that the particles undergo several stages of isotopic alteration via biogeochemicalprocessing before their eventual burial in the sediments.
Suspended sediments collected during summer and fall likely contain a large fraction ofnewly produced material whereas sediments are an annual integrator containing a largercontribution of terrestrial and/or remineralized material. Due to these degradative processes, theseston C:N and δ15N absolute values and— to a lessor extent— δ13C values are somewhat de-coupled from sedimentary values. Further characterization of suspended sediment seasonalvariability and its response to hydrological and bloom events will, however, allow for the use oftrends (similar to these fairly well behaved preliminary variations) to trace the settling andremineralization of the organic matter.