Embed Size (px)
Citation preview
© February 2004 PacifiCorpWater Resources FTR .DOC Water Resources FTR Page 5-1
5.0 ANALYSIS OF PROJECT EFFECTS ON HYDROLOGY
5.1 DESCRIPTION AND PURPOSE
The purpose of this study is to determine how much control and what effects the PacifiCorpKlamath Hydroelectric Project facilities and operations have on the hydrology of the KlamathRiver. To address this purpose, this study assesses the hydrologic regime and controlling factorsin the Project area, including the effects of Project operations. This hydrology study alsoprovides information for supporting other resources, including water quality, fluvial geo-morphology, fish and wildlife habitat, riparian resources, recreation, and visual/aesthetics values.
At present, USBR has management control of specific Upper Klamath Lake elevations andspecific flow releases at Iron Gate dam. Since 1997, USBR has defined Klamath IrrigationProject operations through annual operations plans. Each annual plan defines how UpperKlamath Lake and flows downstream of Iron Gate dam will be regulated for that year, based onhydrological and environmental conditions. To assist USBR in achieving its plan, PacifiCorp hassigned annual agreements with USBR. Each annual agreement states that PacifiCorp will operateits Project in accordance with the annual plan. USBR has recently developed a long-termoperations plan so that new plans do not have to be written each year.
5.2 OBJECTIVES
The objectives and key questions addressed by this study are as follows:
• Provide a detailed explanation and understanding of flow regulation into, within, anddownstream of the Project area. What are the relative roles and responsibilities of USBR,PacifiCorp, and others for such flow regulation?
• What are the potential effects of PacifiCorp operations and activities on the long-termhydrologic regime, including the magnitude, duration, and timing of monthly discharges andannual high flows?
• What are the potential effects of PacifiCorp operations and activities on the short-termhydrologic regime, including the magnitude, duration, and rate of change of daily and hourlyfluctuations in river flows and reservoir water levels?
• Provide hydrologic data and information as needed to support other studies that will furtherevaluate Project flow effects and potential modifications on other resources (such as waterquality, fisheries and fish passage, terrestrial resources, recreation).
5.3 RELICENSING RELEVANCE AND USE IN DECISIONMAKING
This study helps PacifiCorp address certain agency/stakeholder management objectives andresources issues related to Project effects on river hydrology and flow management. A number offactors, many outside PacifiCorp’s control, contribute to the river flow conditions within anddownstream of the Project area. The information obtained in this study helps to determine howPacifiCorp’s Project operations contribute to these conditions.
PacifiCorpKlamath Hydroelectric ProjectFERC No. 2082
© February 2004 PacifiCorpWater Resources FTR Page 5-2 Water Resources FTR .DOC
Relicensing of the Project also requires 401 certifications from relevant state agencies that theProject complies with requirements of the federal Clean Water Act. This task helps PacifiCorp toassess hydrologic effects as they relate to water quality objectives and standards as promulgatedby these agencies. Water quality is directly affected by hydrologic conditions. For example, ariver’s volume and rate of discharge can determine the concentration of water qualityconstituents (such as total suspended solids) and the river’s capacity to assimilate loading ofpotential pollutants (such as nutrients). This hydrology study provides data and information ofuse to studies of other resources, such as water quality, fish and wildlife habitat, riparianresources, and recreation.
5.4 METHODS AND GEOGRAPHIC SCOPE
5.4.1 Explanation of Facilities and Operational Issues Associated with the Project
In May 2002, PacifiCorp issued a report that provides a detailed explanation of flow regulationand operation into, within, and downstream of the Project area (PacifiCorp, 2002). In particular,the report describes the respective roles and responsibilities of USBR and PacifiCorp for lake,reservoir, and river flow operations, and how these operations are coordinated. Specific detailsare provided on the operations at each facility and relevant agreements and obligations. Thereport includes the following.
1. A copy of the 1956 contract, amendments, and renewals between PacifiCorp and USBR isprovided.
In 1956, a contract between PacifiCorp and USBR was signed whereby, among other issues,PacifiCorp was obligated to operate the Link River dam for USBR. The Link River dam isowned by USBR, and PacifiCorp owns West Side and East Side powerhouses and canals.The implications of this contract extend beyond the mere operation of the dam by PacifiCorpfor USBR, hence the importance of providing and describing the contract.
2. A summary of the implications of the 1956 contract to PacifiCorp’s operation of the KlamathHydroelectric Project is described. Specifically:
a. Why PacifiCorp is obliged to operate Iron Gate dam to meet minimum flows as directedby USBR
b. Why PacifiCorp is obliged to operate according to USBR target elevations for UpperKlamath Lake
c. Why Link River dam is not included in the current FERC Project boundary and the EastSide and West Side powerhouses are included
3. For a better understanding of Project operations and issues to follow, the document describeshow water is routed through the Project area and why PacifiCorp routes the water in such afashion. This description includes a table of existing minimum instream flow requirementsand lengths of each bypass reach.
4. The historical operational flexibility of Upper Klamath Lake is described. Since the listing oftwo species of endangered suckers that inhabit Upper Klamath Lake and subsequentBiological Opinions, PacifiCorp’s flexibility to operate the lake for the benefit of
PacifiCorpKlamath Hydroelectric Project
FERC No. 2082
© February 2004 PacifiCorpWater Resources FTR .DOC Water Resources FTR Page 5-3
hydroelectric production has been lost in favor of maintaining target lake levels for ESAcompliance.
5. The purpose of Keno dam is described. The purpose (benefits) of Keno dam has beenquestioned because it is not a hydroelectricity-producing facility. Yet this structure servesother purposes, such as diversion points for irrigation, that may not be readily apparent.
6. Specifics of how and why Keno reservoir is operated to maintain a constant elevation areexplained, as are the implications of doing so.
PacifiCorp and USBR entered into a contract in 1968, when Keno dam was built, thatspecified constraints on reservoir operations for the benefit of USBR’s Klamath IrrigationProject.
7. The contract (cited above) between PacifiCorp and USBR describing the operationalarrangements of Keno reservoir is provided.
8. The purpose of drawing down Keno reservoir is explained, as are the frequency, magnitude,and duration of such events. The implications of not drawing down the reservoir are alsodescribed.
On an annual or sometimes biannual basis in the spring, Keno reservoir is drawn downapproximately 2 feet to accommodate irrigators wishing to perform maintenance on theirpumps.
9. The Spring Creek diversion is described, as are its historical operation and current statusrelated to water rights.
The Spring Creek diversion is one that, at times in the past, has diverted water for the benefitof hydroelectricity production at the Fall Creek powerhouse. This operation diverts waterfrom the Jenny Creek drainage into the Fall Creek drainage.
10. A description of Project structures pertinent to hydrologic control is provided, such as depthof intake structures relative to reservoir elevation and hydraulic capacity of turbines.
5.4.2 Analysis of Effects of PacifiCorp Operations on Existing and Future Hydrologic Regimes
5.4.2.1 Effects on the Short-Term (Daily and Hourly) Hydrologic Regime
Exploration of Existing Hourly Data
This study includes analysis of the effects of Project operations on the short-term (daily andhourly) hydrologic regime using several recent years of operations data. PacifiCorp maintains adatabase containing hourly operations data at the Project facilities for the period from about 1990to present. The database includes hourly data on river flow, reservoir elevation, flow throughturbines, and spill. This study uses several recent years of these data to depict the various modesof Project operations and relates these operations to specific effects on short-term (daily andhourly) changes in river flow and reservoir water levels.
PacifiCorpKlamath Hydroelectric ProjectFERC No. 2082
© February 2004 PacifiCorpWater Resources FTR Page 5-4 Water Resources FTR .DOC
Six recent water years of hourly data form the basis of this analysis: 1991, 1992, 1994, 1997,1998, and 1999. These water years represent a variety of water year types.1 The 1991 datarepresent a “dry” water year, 1992 and 1994 a “critically dry” water year, 1997 a “normal” wateryear, 1998 a “wet” water year, and 1999 an “extremely wet” water year.
For each facility, graphs were produced that display by water year the time-series of daily rangein hourly river flows, reservoir elevations, turbine flows, and spills in the bypass reaches. Thedata sets for these parameters are overlaid on one another to clearly depict hydrologic changesoccurring concurrently. For example, data for flow through the turbines are graphed againstreservoir elevation fluctuation to depict the effect that one has upon the other. These graphsprovide a trend analysis of the type and timing of various operation modes at each facility (suchas run-of-river operation, one-turbine peaking operation, two-turbine peaking operation), as wellas transitions between operation modes.
The data are also used to calculate statistics that summarize the magnitude, frequency, duration,and timing of river flow, reservoir elevation, flow through turbines, and spill. For example, themagnitude and frequency of flow and stage changes are calculated at gauged river locations tocharacterize the effects of flow fluctuations. These summary statistics allow for straightforwardcomparisons of different situations, such as different years, seasons, and operation modes.
The extent of control exerted by Project operations on the short-term (daily and hourly)hydrologic regime is determined and described by two primary means. Graphs and summarystatistics (as described above) are compared for locations that represent the inflow and outflowfrom Project facilities. The differences observed from these comparisons indicate potential netProject effects.
Flow and Hydrodynamics Modeling
As outlined in Section 4.0, PacifiCorp has developed a comprehensive package of water qualitymodels to assess Project water quality effects and potential management scenarios. A keycomponent of the numerical models are hydrodynamic flow-routing models. For riverinereaches, the hydrodynamic model RMA-2 was used.2 RMA-2 is a model specifically designed toassess flow response in complex river systems. For Project reservoirs, the model CE-QUAL-W2was used.3 CE-QUAL-W2 effectively simulates the routing of flow through reservoir geometryand predict reservoir water surface elevations.
RMA-2 solves the full-flow equations known as the St. Venant Equations (also called theshallow water equations). These equations use all terms of the conservation of momentumformulation and provide a complete description of dynamic flow conditions. RMA-2 has anoption to represent steep river systems without using unrealistic bed roughness parameters. Thissteep river system formulation is critical in representing proper transit time, which is paramountto modeling water quality. The model has been widely applied (it is one of the most used full
1 Per definition of water year type as developed by Hardy and Addley (2001).2 RMA-2 was used in combination with RMA-11 to provide a complete and comprehensive water quality model. RMA-11 uses thegeometry and output of RMA-2 and solves the advection-diffusion equation to determine the fate and transport of up to 16 waterquality constituents.3 Different models were selected for riverine reaches and reservoirs because of fundamental differences in their geometric,hydraulic, and water quality characteristics. See Section 4.0 (Appendix 4A) of this FTR for further discussion of model purpose andselection.
PacifiCorpKlamath Hydroelectric Project
FERC No. 2082
© February 2004 PacifiCorpWater Resources FTR .DOC Water Resources FTR Page 5-5
hydrodynamic models in the United States) to a variety of river and estuary systems in theUnited States as well as internationally.
These models were used to examine the short-term hydrology and hydrodynamics effects ofProject operations scenarios, together with examination of water quality effects based on 2000and 2001 conditions. PacifiCorp has assessed four basic operations scenarios: (1) existingconditions, (2) steady flow condition, (3) a hypothetical without-Project condition, and (4) asecond hypothetical without-Project II condition. These scenarios and their associated modelingassumptions are described in detail in Appendix 4A of this FTR. The characteristics of the fourbasic scenarios are summarized below.
Existing Conditions Scenario
The EC scenario models the actual conditions in the Klamath River during 2000 and 2001,including actual operation at PacifiCorp’s Project facilities. All projects were assumed to be inplace and operating under 2000 and 2001 conditions.
Steady Flow Scenario
The SF scenario models alternative flows to those recorded in 2000 and 2001. All projects wereassumed to be in place but were not assumed to be operating under historical 2000 and 2001conditions. Instead, a steady flow run-of-river type of operation was assumed (i.e., no peaking).The reservoirs were operated with approximately no change in water surface elevation for theentire year. Calculations started by assuming that dam releases from Iron Gate reservoir were thesame as those used in the EC scenario (so as to maintain instream flows as stipulated in USBR’sKlamath Project Operations Plan), calculating overall smoothed EC accretions/depletions foreach reach and then moving upstream using a water balance method between each reservoir upto Link dam.
Without-Project Scenario
The WOP scenario models the Klamath River as though there are no PacifiCorp facilities (i.e.,dams, reservoirs, power canals, powerhouses) in place or operating in the Klamath Riverdownstream of Link dam. The reservoirs were replaced with river reaches, with the geometry ofthe reaches estimated from the deepest points in the bathymetry of each reservoir. River widthswithin the reservoirs were a linear interpolation between the river width in the elementimmediately preceding the reservoir and the river width in the element immediately followingthe reservoir. The same channel lengths as with the EC river miles were assumed, except forCopco reservoir, where the river was lengthened to capture the sinuosity of the old river bedunder the reservoir.
Without-Project II Scenario
All conditions in the WOP II scenario are the same as the WOP scenario with the exception ofthe hydrology. The primary purpose of this scenario was to smooth out the flow variability(evident in the WOP scenario) being routed down the river during summer periods. Thesevariations, which are most prominent between Julian day 200 and 250, orginate with USBRproject operations and maintenance of Keno reservoir at a stable water surface elevation duringoperations. The fluctuation over the span of a few days can exceed 500 cfs. The original WOP
PacifiCorpKlamath Hydroelectric ProjectFERC No. 2082
© February 2004 PacifiCorpWater Resources FTR Page 5-6 Water Resources FTR .DOC
scenario assumed that all USBR project operations were consistent with historical conditions, inwhich case the flow variations that were historically “re-regulated” by system reservoirs wererouted down the river. Stakeholder input identified this as an unrealistic without-Projectoperation and requested that attempts be made to smooth the hydrograph that was routed downthe river.
Other Scenarios
Stakeholders have indicated or suggested that PacifiCorp should examine other types ofscenarios. In fact, PacifiCorp is in the process of conducting two additional specific scenarios foruse by the Plenary Group in completing a Systems Landscape Options Matrix. These include aSLOM scenario that assumes Copco and Iron Gate developments are removed, and a SLOMscenario that assumes Iron Gate is removed. Results of these two additional SLOM scenariosshould be available for use in the Plenary Groups’s SLOM analysis in about February 2004.
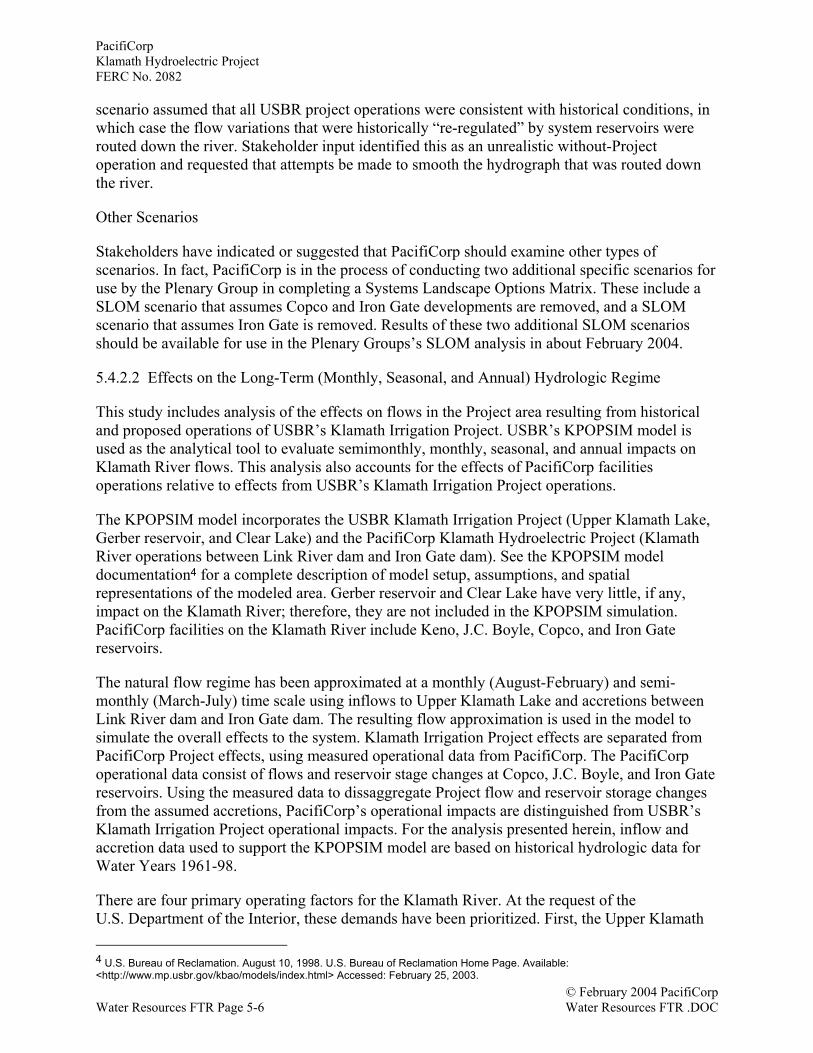
5.4.2.2 Effects on the Long-Term (Monthly, Seasonal, and Annual) Hydrologic Regime
This study includes analysis of the effects on flows in the Project area resulting from historicaland proposed operations of USBR’s Klamath Irrigation Project. USBR’s KPOPSIM model isused as the analytical tool to evaluate semimonthly, monthly, seasonal, and annual impacts onKlamath River flows. This analysis also accounts for the effects of PacifiCorp facilitiesoperations relative to effects from USBR’s Klamath Irrigation Project operations.
The KPOPSIM model incorporates the USBR Klamath Irrigation Project (Upper Klamath Lake,Gerber reservoir, and Clear Lake) and the PacifiCorp Klamath Hydroelectric Project (KlamathRiver operations between Link River dam and Iron Gate dam). See the KPOPSIM modeldocumentation4 for a complete description of model setup, assumptions, and spatialrepresentations of the modeled area. Gerber reservoir and Clear Lake have very little, if any,impact on the Klamath River; therefore, they are not included in the KPOPSIM simulation.PacifiCorp facilities on the Klamath River include Keno, J.C. Boyle, Copco, and Iron Gatereservoirs.
The natural flow regime has been approximated at a monthly (August-February) and semi-monthly (March-July) time scale using inflows to Upper Klamath Lake and accretions betweenLink River dam and Iron Gate dam. The resulting flow approximation is used in the model tosimulate the overall effects to the system. Klamath Irrigation Project effects are separated fromPacifiCorp Project effects, using measured operational data from PacifiCorp. The PacifiCorpoperational data consist of flows and reservoir stage changes at Copco, J.C. Boyle, and Iron Gatereservoirs. Using the measured data to dissaggregate Project flow and reservoir storage changesfrom the assumed accretions, PacifiCorp’s operational impacts are distinguished from USBR’sKlamath Irrigation Project operational impacts. For the analysis presented herein, inflow andaccretion data used to support the KPOPSIM model are based on historical hydrologic data forWater Years 1961-98.
There are four primary operating factors for the Klamath River. At the request of theU.S. Department of the Interior, these demands have been prioritized. First, the Upper Klamath 4 U.S. Bureau of Reclamation. August 10, 1998. U.S. Bureau of Reclamation Home Page. Available:<http://www.mp.usbr.gov/kbao/models/index.html> Accessed: February 25, 2003.
PacifiCorpKlamath Hydroelectric Project
FERC No. 2082
© February 2004 PacifiCorpWater Resources FTR .DOC Water Resources FTR Page 5-7
Lake Biological Opinion minimum lake elevations must be met. Second, Klamath Riverminimum flow targets below Iron Gate dam must be met. Third, priority is given to irrigationdeliveries to the USBR Klamath Irrigation Project. And fourth, ADY canal deliveries to theLower Klamath Lake and Lower Klamath Lake National Wildlife Refuge must be fulfilled.
KPOPSIM analyses were performed as follows:
• KPOPSIM simulations were based on the assumption that the USBR-recommended targets tosimulate probable future flow conditions (i.e., targets for Upper Klamath Lake and KlamathRiver flows below Iron Gate dam based on the 2002 Biological Opinion).
• PacifiCorp Project reservoir inflows, outflows, and storage changes were itemized at thesame semimonthly (February through July) and monthly (June through January) time steps inKPOPSIM. These data (obtained for Copco, J.C. Boyle, and Iron Gate reservoirs for theperiod 1961 through 1998) were incorporated in KPOPSIM’s assumed accretions from LinkRiver dam to Iron Gate dam. Project operations impacts were then distinguished fromUSBR’s Klamath Irrigation Project operational impacts by performing KPOPSIM modelruns where the PacifiCorp flow and reservoir storage changes were disaggregated from theassumed accretions.
• An approximate natural flow below Iron Gate dam was computed using historical inflow toUpper Klamath Lake, plus historical accretions from Link River dam to Iron Gate dam. (Thisvalue was used to measure the relative impacts of the Klamath Irrigation Project and thePacifiCorp Project operations on approximate natural flow conditions below Iron Gate dam.)
• Monthly, semimonthly, and annual effects of USBR’s Klamath Irrigation Project andPacifiCorp’s Project operations were quantified for five water year types:5 (1) critically dry,(2) dry, (3) normal, (4) wet, and (5) extremely wet.
• USGS data were analyzed to determine the relative contribution of flow from Iron Gate damto lower basin flows in different water year types.
• An analysis was conducted to determine the approximate total contribution of flow fromtributaries and springs within the Project area.
5.4.2.3 Other Hydrologic Analyses
Flood Frequency Analysis
The Flood Frequency Analysis (FFA) program from the U.S. Army Corps of EngineersHydrologic Engineering Center (HEC) was used to compute flood frequencies. HEC-FFAcomputes flood frequencies in accordance with Guidelines for Determining Flood FlowFrequencies (U.S. Water Resources Council, 1982). This guideline is designed for computingflood flow frequency curves where systematic stream gauging records of sufficient length (atleast 10 years) to warrant statistical analysis are available as the basis for determination.
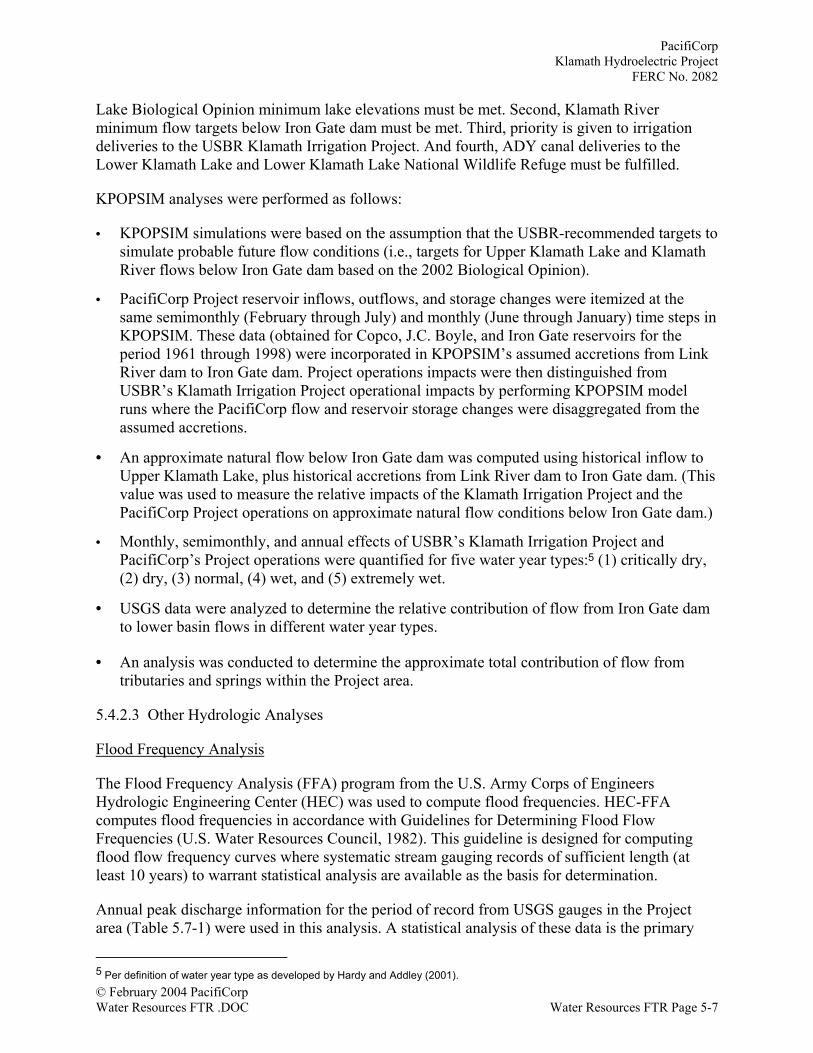
Annual peak discharge information for the period of record from USGS gauges in the Projectarea (Table 5.7-1) were used in this analysis. A statistical analysis of these data is the primary
5 Per definition of water year type as developed by Hardy and Addley (2001).
PacifiCorpKlamath Hydroelectric ProjectFERC No. 2082
© February 2004 PacifiCorpWater Resources FTR Page 5-8 Water Resources FTR .DOC
basis for the determination of the flow frequency curve for each gauge location. The PearsonType III distribution with log transformation of the flood data (log-Pearson Type III) wasassumed as the basic distribution for defining the annual flood series.
Table 5.7-1. USGS flow gauging data for the Klamath River and Fall Creek in the Project area.
USGS GaugeDrainage Area(square miles)
GaugeNumber
Daily FlowPeriod of Record
Annual Peak FlowPeriod of Record
Link River at Klamath Falls 3,810 11507500 10/1/1961-present 5/12/1904-presentKlamath River at Keno 3,920 11509500 6/1/1904-9/30/1913,
10/1/1929-present3/28/1905-9/30/1913,10/1/1929-present
Klamath River at SpencerBridge near Keno
4,050 11510500 10/1/1913-9/30/1931 4/21/1914-12/15/1930
Klamath River Downstreamfrom J.C. BoylePowerhouse
4,080 11510700 1/1/1959-9/30/197110/1/1974-9/30/197910/1/1982-9/30/198710/1/1988-present
1/1/1959-9/30/197110/1/1974-9/30/197910/1/1982-9/30/198710/1/1988-present
Klamath River below FallCreek near Copco
4,370 11512500 10/1/1923-9/30/1961 1/2/1924-12/1/1960
Klamath River Downstreamof Iron Gate Dam
4,630 11516530 10/1/1960-present 12/1/1960-present
Fall Creek at Copco 14.6 11512000 4/1/1933-9/30/1959 12/27/1928-7/2/1959
Low Flow Frequency Analysis
A frequency analysis of low flows was performed using DFLOW 3, a Windows-based revisionof the DFLOW computer code developed by U.S. EPA in the early 1990s to estimate designstream flows for use in water quality studies. Low flow statistics were calculated as annual x-dayaverage low flows whose return period is y years, i.e., the xQy low flow. For example, the 3Q5 isthe 3-day average low flow that occurs every 5 years, corresponding to the 3-day flow with a20 percent chance of occurrence every year. These flows were estimated from the daily flowrecord for the period of record from gauges in the Project area (Table 5.7-1). The DFLOW 3analysis fits the historical low flow data to a log Pearson Type III distribution probability densityfunction and then computes from this function the flow whose probability of not being exceededis 1/year.
5.4.3 Geographic Scope
The hydrologic analyses described in this study are most focused on the Project area from LinkRiver dam to just below the Iron Gate dam and powerhouse. It is in this area that Projectoperations have the most direct and varied potential effects on flows. However, some tasksdescribed in the study plan incorporate a broader basinwide area to enhance perspective andcontext for the Project setting and potential Project hydrologic effects. For example, theevaluation of responsibilities and coordination of USBR and PacifiCorp on river flow operationsaddresses Upper Klamath Lake because lake volume and level are important factors foroperations at Link River dam. In addition, the assessment of effects on the long-term (monthly,seasonal, and annual) hydrologic regime includes an analysis of data from USGS gauges in the
PacifiCorpKlamath Hydroelectric Project
FERC No. 2082
© February 2004 PacifiCorpWater Resources FTR .DOC Water Resources FTR Page 5-9
lower basin to quantify the relative contribution of flow from Iron Gate dam to lower basin flowsin different water year types. The geographic scope for water quality modeling, which includesCE-QUAL-W2 and RMA-2 flow and hydrodynamic modeling, includes the Klamath River fromLink River dam (RM 254.3) to Turwar (about RM 6).
5.5 RELATIONSHIP TO REGULATORY REQUIREMENTS AND PLANS
This study helps PacifiCorp to address certain regulatory requirements and planning objectivesrelated to Project effects on river hydrology and flow management. The information derivedfrom this study is used to address FERC requirements (18 CFR 4.51 and 16.8) for information onwater uses in the Project area and coordination of Project operations with other water resourcesprojects. This study also provides flow information as needed to support FERC requirements(18 CFR 4.51 and 16.8) for analyses of water quality, fisheries, recreation, and other resources.
Relicensing of the Project requires 401 certifications from relevant agencies that the Projectcomplies with requirements of the federal Clean Water Act. This study provides information tohelp assess hydrologic effects as they relate to water quality objectives and standardspromulgated by these agencies. Water quality is directly affected by hydrologic conditions. Forexample, a river’s volume and rate of discharge can determine the concentration of water qualityconstituents (such as total suspended solids) and the river’s capacity to assimilate loading ofpotential pollutants (such as nutrients).
The information in this study is used to help address compliance with management objectivesfrom various resource agencies, tribes, and other stakeholders. Such objectives relate to flow useand protection, and flows needed to support water quality, fisheries, wildlife and botanicalresources, and recreation resources. This information also helps PacifiCorp and stakeholders todevelop PM&E measures to meet the intention of these regulations and management objectives.
5.6 TECHNICAL WORK GROUP COLLABORATION
PacifiCorp has worked with stakeholders to establish a more collaborative process for planningand conducting studies needed to support Project relicensing documentation. As part of thiscollaborative process, a Water Quality Work Group was formed and met approximately monthlyas needed to plan and discuss water quality studies and results, including this study.
5.7 RESULTS AND DISCUSSION
5.7.1 Project Area’s Natural Hydrologic Factors and Flow Regime
The annual and seasonal trends in gauged runoff and flow patterns on the Klamath Rivergenerally reflect climatic conditions and cycles (Balance Hydrologics, 1996; Ayers Associates,1999). Precipitation in the basin is distinctly seasonal, with 60 percent of the total annualprecipitation falling from November to March. December and January are the wettest months;the driest months are between June and September. Annual precipitation patterns historicallydefine distinct dry and wet cycles that are closely related to runoff and the river’s flow regime.The most recent climatic trends include wet periods (1885-1915 and 1940-1975) and dry periods(1915-1940 and 1975-1994). General decreases in runoff and discharge over the last 20 yearsalso coincide with a generally decreasing trend in precipitation patterns.
PacifiCorpKlamath Hydroelectric ProjectFERC No. 2082
© February 2004 PacifiCorpWater Resources FTR Page 5-10 Water Resources FTR .DOC
The installation of the Copco dams (1918 and 1925) followed by the Link River dam (1921),J.C. Boyle dam (1958), Iron Gate dam (1962), and Keno dam (1967) have had an effect onstorage capacity and flow in the Klamath River. In addition, extensive diversions in the upperbasin include the A canal (1907), the Lost River diversion canal (1912), the North canaldiversion, and the ADY diversion.
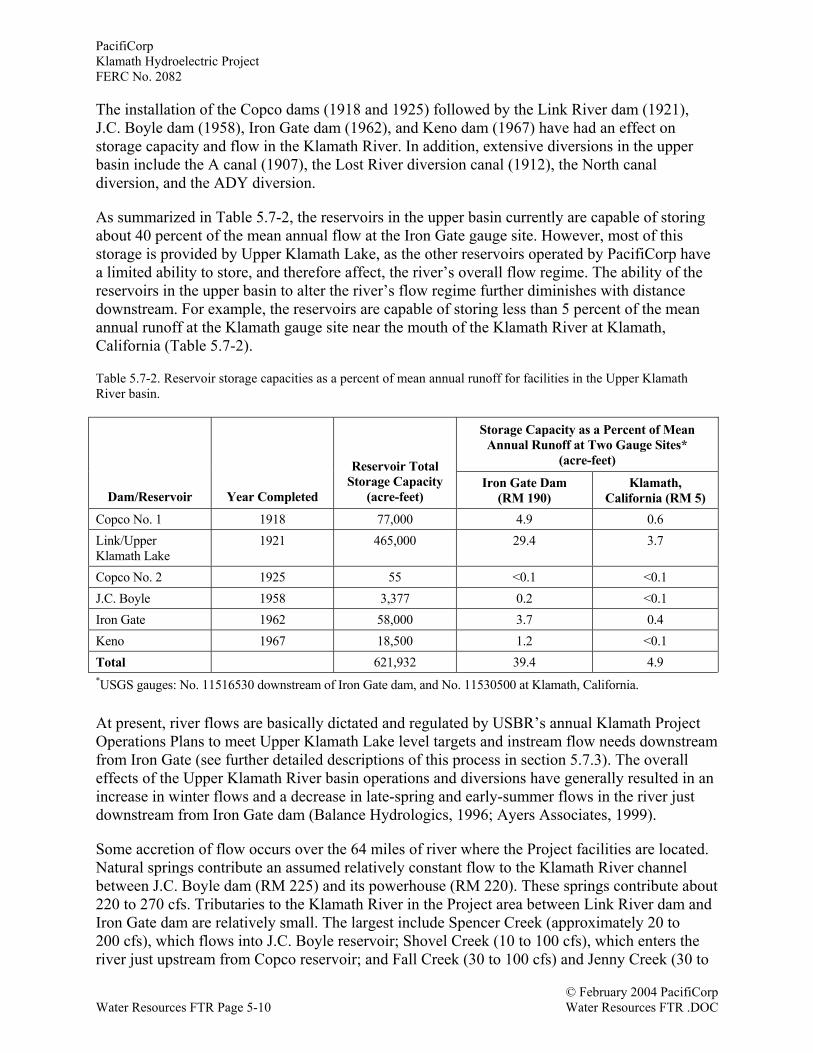
As summarized in Table 5.7-2, the reservoirs in the upper basin currently are capable of storingabout 40 percent of the mean annual flow at the Iron Gate gauge site. However, most of thisstorage is provided by Upper Klamath Lake, as the other reservoirs operated by PacifiCorp havea limited ability to store, and therefore affect, the river’s overall flow regime. The ability of thereservoirs in the upper basin to alter the river’s flow regime further diminishes with distancedownstream. For example, the reservoirs are capable of storing less than 5 percent of the meanannual runoff at the Klamath gauge site near the mouth of the Klamath River at Klamath,California (Table 5.7-2).
Table 5.7-2. Reservoir storage capacities as a percent of mean annual runoff for facilities in the Upper KlamathRiver basin.
Storage Capacity as a Percent of MeanAnnual Runoff at Two Gauge Sites*
(acre-feet)
Dam/Reservoir Year Completed
Reservoir TotalStorage Capacity
(acre-feet)Iron Gate Dam
(RM 190)Klamath,
California (RM 5)Copco No. 1 1918 77,000 4.9 0.6Link/UpperKlamath Lake
1921 465,000 29.4 3.7
Copco No. 2 1925 55 <0.1 <0.1J.C. Boyle 1958 3,377 0.2 <0.1Iron Gate 1962 58,000 3.7 0.4Keno 1967 18,500 1.2 <0.1Total 621,932 39.4 4.9*USGS gauges: No. 11516530 downstream of Iron Gate dam, and No. 11530500 at Klamath, California.
At present, river flows are basically dictated and regulated by USBR’s annual Klamath ProjectOperations Plans to meet Upper Klamath Lake level targets and instream flow needs downstreamfrom Iron Gate (see further detailed descriptions of this process in section 5.7.3). The overalleffects of the Upper Klamath River basin operations and diversions have generally resulted in anincrease in winter flows and a decrease in late-spring and early-summer flows in the river justdownstream from Iron Gate dam (Balance Hydrologics, 1996; Ayers Associates, 1999).
Some accretion of flow occurs over the 64 miles of river where the Project facilities are located.Natural springs contribute an assumed relatively constant flow to the Klamath River channelbetween J.C. Boyle dam (RM 225) and its powerhouse (RM 220). These springs contribute about220 to 270 cfs. Tributaries to the Klamath River in the Project area between Link River dam andIron Gate dam are relatively small. The largest include Spencer Creek (approximately 20 to200 cfs), which flows into J.C. Boyle reservoir; Shovel Creek (10 to 100 cfs), which enters theriver just upstream from Copco reservoir; and Fall Creek (30 to 100 cfs) and Jenny Creek (30 to
PacifiCorpKlamath Hydroelectric Project
FERC No. 2082
© February 2004 PacifiCorpWater Resources FTR .DOC Water Resources FTR Page 5-11
500 cfs), which flow into Iron Gate reservoir. Spencer Creek, Shovel Creek, and Jenny Creek allhave irrigation diversions that remove some water from them. The largest diversion is by USBR,on Jenny Creek, where water is transferred out of the basin to the Rogue River Valley.
5.7.2 Project Area River Flows
5.7.2.1 Hydrologic Data Sources for the Klamath River in the Project Area
Four currently operating key USGS gauging stations are located in the Klamath River in the nearvicinity of the Project:
• Link River at Klamath Falls (No. 11507500, RM 253.5)• Near Keno dam (No. 11509500, RM 232)• Downstream from J.C. Boyle powerhouse (No. 11510700, RM 220)• Downstream from Iron Gate dam just downstream from Bogus Creek (No. 11516530,
RM 190).
Table 5.7-1 summarizes the drainage area and the period of record of the data for each of thesegauges and three other discontinued USGS flow gauge sites in the Project area: Klamath River atSpencer Bridge (No. 11510500, RM 226.1); Klamath River below Fall Creek near Copco(No. 11512500, RM 196); and Fall Creek (No. 11512000, near the mouth of the creek).
5.7.2.2 Klamath River and Fall Creek Average Daily Flow Rates
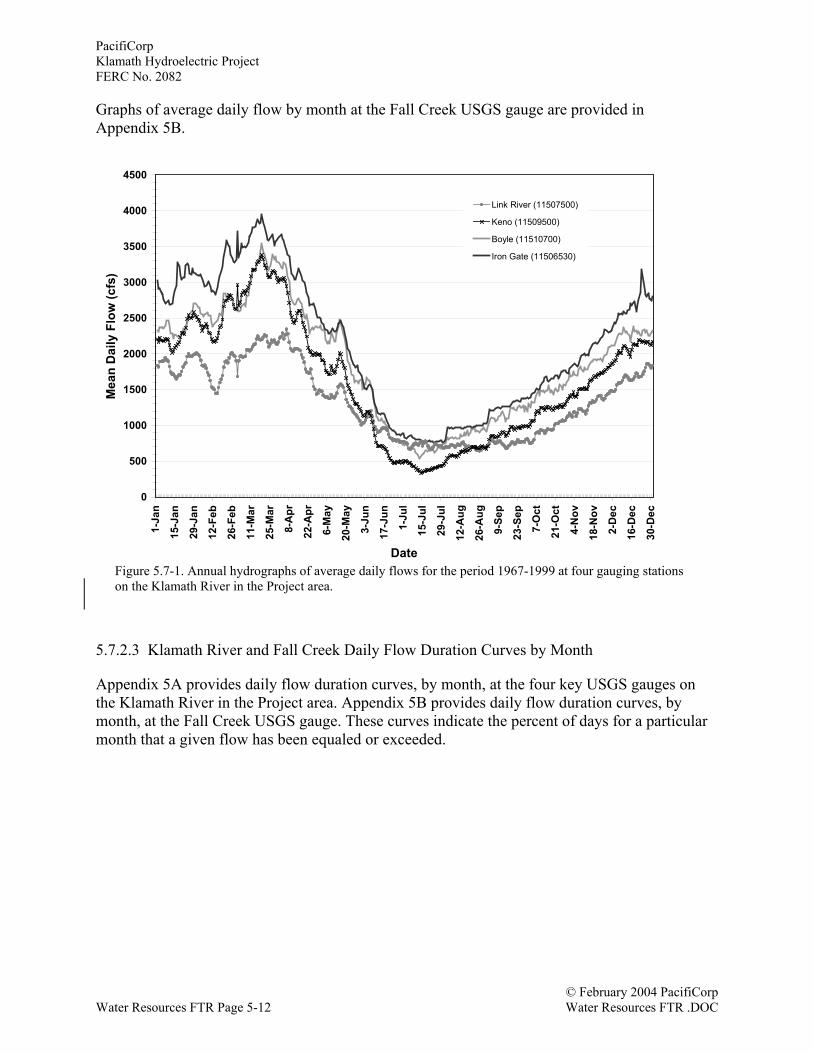
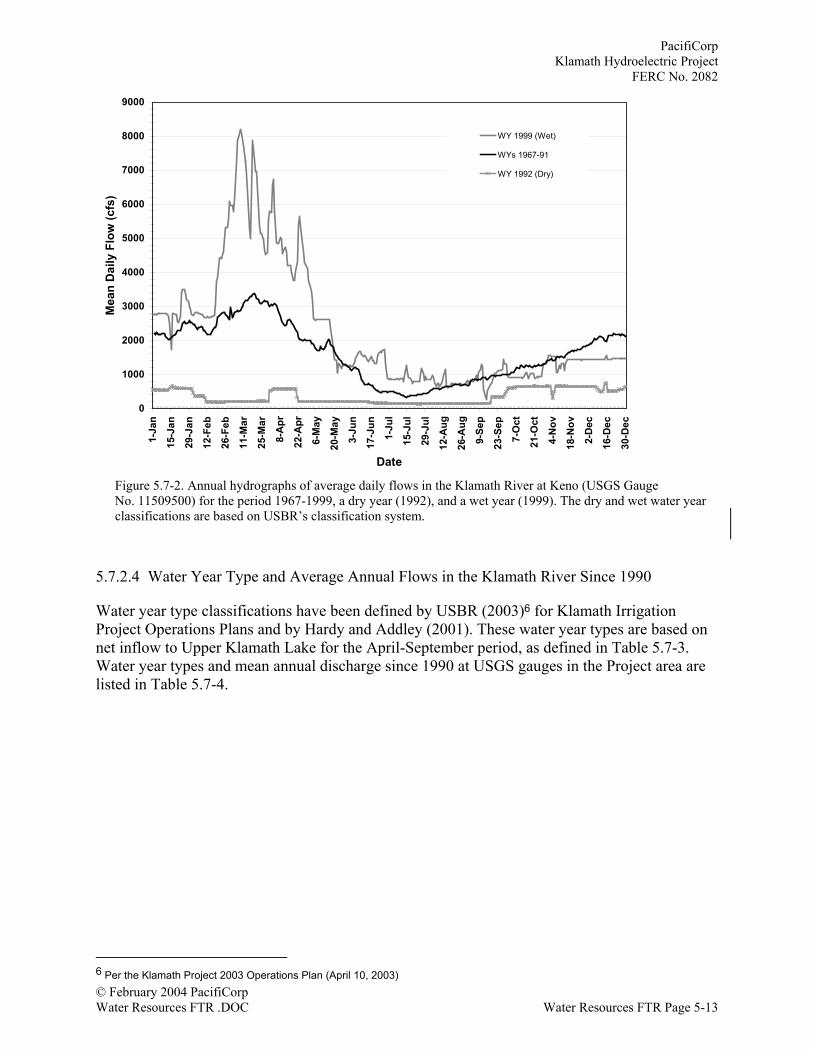
Graphs of average daily flow by month at the four key USGS gauges on the Klamath River in theProject area are provided in Appendix 5A. Figure 5.7-1 depicts annual hydrographs of averagedaily flow over the period 1967-1999 for the four key USGS gauges. To illustrate flow variationin recent years, Figure 5.7-2 shows the annual hydrograph of average daily flow for the Kenogauge (No. 11509500), together with annual hydrographs for 1991 (a critical dry year) and 1998(a wet year).
PacifiCorpKlamath Hydroelectric ProjectFERC No. 2082
© February 2004 PacifiCorpWater Resources FTR Page 5-12 Water Resources FTR .DOC
Graphs of average daily flow by month at the Fall Creek USGS gauge are provided inAppendix 5B.
5.7.2.3 Klamath River and Fall Creek Daily Flow Duration Curves by Month
Appendix 5A provides daily flow duration curves, by month, at the four key USGS gauges onthe Klamath River in the Project area. Appendix 5B provides daily flow duration curves, bymonth, at the Fall Creek USGS gauge. These curves indicate the percent of days for a particularmonth that a given flow has been equaled or exceeded.
0
500
1000
1500
2000
2500
3000
3500
4000
4500
1-Ja
n
15-J
an
29-J
an
12-F
eb
26-F
eb
11-M
ar
25-M
ar
8-A
pr
22-A
pr
6-M
ay
20-M
ay
3-Ju
n
17-J
un
1-Ju
l
15-J
ul
29-J
ul
12-A
ug
26-A
ug
9-Se
p
23-S
ep
7-O
ct
21-O
ct
4-N
ov
18-N
ov
2-D
ec
16-D
ec
30-D
ec
Date
Mea
n D
aily
Flo
w (c
fs)
Link River (11507500)
Keno (11509500)
Boyle (11510700)
Iron Gate (11506530)
Figure 5.7-1. Annual hydrographs of average daily flows for the period 1967-1999 at four gauging stationson the Klamath River in the Project area.
PacifiCorpKlamath Hydroelectric Project
FERC No. 2082
© February 2004 PacifiCorpWater Resources FTR .DOC Water Resources FTR Page 5-13
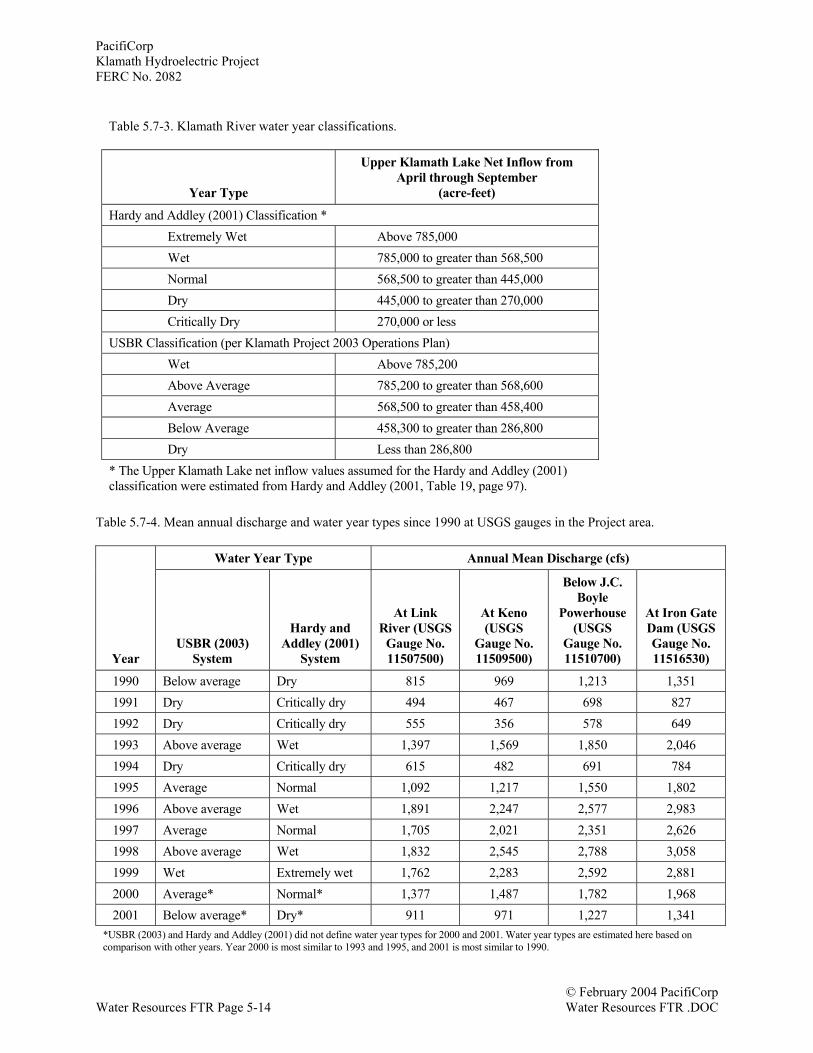
5.7.2.4 Water Year Type and Average Annual Flows in the Klamath River Since 1990
Water year type classifications have been defined by USBR (2003)6 for Klamath IrrigationProject Operations Plans and by Hardy and Addley (2001). These water year types are based onnet inflow to Upper Klamath Lake for the April-September period, as defined in Table 5.7-3.Water year types and mean annual discharge since 1990 at USGS gauges in the Project area arelisted in Table 5.7-4.
6 Per the Klamath Project 2003 Operations Plan (April 10, 2003)
Figure 5.7-2. Annual hydrographs of average daily flows in the Klamath River at Keno (USGS GaugeNo. 11509500) for the period 1967-1999, a dry year (1992), and a wet year (1999). The dry and wet water yearclassifications are based on USBR’s classification system.
0
1000
2000
3000
4000
5000
6000
7000
8000
9000
1-Ja
n
15-J
an
29-J
an
12-F
eb
26-F
eb
11-M
ar
25-M
ar
8-A
pr
22-A
pr
6-M
ay
20-M
ay
3-Ju
n
17-J
un
1-Ju
l
15-J
ul
29-J
ul
12-A
ug
26-A
ug
9-Se
p
23-S
ep
7-O
ct
21-O
ct
4-N
ov
18-N
ov
2-D
ec
16-D
ec
30-D
ec
Date
Mea
n D
aily
Flo
w (c
fs)
WY 1999 (Wet)
WYs 1967-91
WY 1992 (Dry)
PacifiCorpKlamath Hydroelectric ProjectFERC No. 2082
© February 2004 PacifiCorpWater Resources FTR Page 5-14 Water Resources FTR .DOC
Table 5.7-3. Klamath River water year classifications.
Year Type
Upper Klamath Lake Net Inflow fromApril through September
(acre-feet)
Hardy and Addley (2001) Classification *Extremely Wet Above 785,000Wet 785,000 to greater than 568,500Normal 568,500 to greater than 445,000Dry 445,000 to greater than 270,000Critically Dry 270,000 or less
USBR Classification (per Klamath Project 2003 Operations Plan)Wet Above 785,200Above Average 785,200 to greater than 568,600Average 568,500 to greater than 458,400Below Average 458,300 to greater than 286,800Dry Less than 286,800
* The Upper Klamath Lake net inflow values assumed for the Hardy and Addley (2001)classification were estimated from Hardy and Addley (2001, Table 19, page 97).
Table 5.7-4. Mean annual discharge and water year types since 1990 at USGS gauges in the Project area.
Water Year Type Annual Mean Discharge (cfs)
YearUSBR (2003)
System
Hardy andAddley (2001)
System
At LinkRiver (USGS
Gauge No.11507500)
At Keno(USGS
Gauge No.11509500)
Below J.C.Boyle
Powerhouse(USGS
Gauge No.11510700)
At Iron GateDam (USGSGauge No.11516530)
1990 Below average Dry 815 969 1,213 1,3511991 Dry Critically dry 494 467 698 8271992 Dry Critically dry 555 356 578 6491993 Above average Wet 1,397 1,569 1,850 2,0461994 Dry Critically dry 615 482 691 7841995 Average Normal 1,092 1,217 1,550 1,8021996 Above average Wet 1,891 2,247 2,577 2,9831997 Average Normal 1,705 2,021 2,351 2,6261998 Above average Wet 1,832 2,545 2,788 3,0581999 Wet Extremely wet 1,762 2,283 2,592 2,8812000 Average* Normal* 1,377 1,487 1,782 1,9682001 Below average* Dry* 911 971 1,227 1,341
*USBR (2003) and Hardy and Addley (2001) did not define water year types for 2000 and 2001. Water year types are estimated here based oncomparison with other years. Year 2000 is most similar to 1993 and 1995, and 2001 is most similar to 1990.

PacifiCorpKlamath Hydroelectric Project
FERC No. 2082
© February 2004 PacifiCorpWater Resources FTR .DOC Water Resources FTR Page 5-15
5.7.3 Current and Historical Flow Management in the Klamath Hydroelectric Project Area
PacifiCorp’s May 2002 report provides a detailed explanation of flow regulation and operationinto, within, and downstream of the Project area. In particular, the report describes the relativeroles and responsibilities of USBR and PacifiCorp regarding lake, reservoir, and river flowoperations, and how these operations are coordinated. Specific details are provided on theoperations at each facility and relevant agreements and obligations. The report’s contents are notreproduced here but can be accessed at PacifiCorp’s website (PacifiCorp, 2002). The documentprovides detailed results and discussion pertinent to this topic as part of this hydrology study.
In recent years, a number of studies and agency reports have provided significant analyses of theflow regime and management in the Upper Klamath River basin of southern Oregon andnorthern California. Generally, these studies address two topics—the hydrologic regime of theUpper Klamath River basin, and the management of the irrigation and hydroelectric projects inthe basin. In most cases, the goal of these documents was either to report past project manage-ment and perceived impacts or to develop a framework for evaluating future operations policy toquantify and minimize impacts. The purpose of this section is to summarize the key findings inthese reports as related to river flow management in the Project area.
5.7.3.1 USBR Klamath Irrigation Project
The document titled Klamath Project: Historic Operation (USBR, 2000) provides a concisediscussion of the history of USBR’s Klamath Irrigation Project. Although some diversions werebuilt earlier, the Klamath Irrigation Project officially began in 1905. At that time, the U.S.government took appropriation of all remaining water within the basin and also purchasedseveral existing senior rights. Land was set aside through arrangements with Oregon andCalifornia state governments. Work on the first canal began in 1906. The project was intended todivert water from Upper Klamath Lake to the Lost River basin for irrigation use and to provideflood control in the Klamath basin. Approximately 200,000 acres of cropland were irrigated in1999. It was acknowledged in the Klamath River Basin Compact (August 30, 1957; 71 Stat. 497)that the Lost River has been made a tributary of the Klamath River by Project operations.
In general, the contract holders for the Klamath Irrigation Project are irrigation districts andsimilar water conservation entities. In all, over 250 contracts for water service are administeredthrough Klamath Irrigation Project operations. In an average year, the Klamath Irrigation Projectcan provide water supply to meet its obligations to contract holders with no restrictions to timingand quantity. This is a key component of the Klamath Irrigation Project appropriation scheme.The water service contracts typically stipulate acres irrigated, not volume of water delivered. Inaddition to these long-term and/or perpetual contracts, a number of temporary contracts forsurplus water are negotiated based on the expected availability of water in a given year. Fournational wildlife refuges near or within the Klamath Irrigation Project boundaries also receivewater supplies.
Operation of the Klamath Irrigation Project changed as the number of control structuresincreased with completion of different components of the system. Consumptive use from theKlamath Irrigation Project has also increased as the number of irrigated acres has grown. Finally,further understanding of the hydrologic variability of the basin and downstream effects of theKlamath Irrigation Project has led to changes in operational policy. Currently, the Klamath
PacifiCorpKlamath Hydroelectric ProjectFERC No. 2082
© February 2004 PacifiCorpWater Resources FTR Page 5-16 Water Resources FTR .DOC
Irrigation Project provides year-round irrigation delivery to various contract holders, with floodirrigation in late fall for Lower Klamath Lake areas, spring and summer deliveries to irrigationdistricts, and flood control operations during winter and spring runoff seasons. Upper KlamathLake is operated to stay within guidelines established for irrigation storage, flood protection,ESA needs, and tribal trusts. Water not allocated to these needs is released to the Klamath River.This release is about 900,000 acre-feet in an average year. The Klamath Irrigation Project uses350,000 to 400,000 acre-feet for irrigation and refuge operations in an average year.
5.7.3.2 PacifiCorp Klamath Hydroelectric Project
The PacifiCorp Project consists of six hydroelectric power-generating facilities. The first, LinkRiver dam, was constructed as a result of a 1917 agreement between PacifiCorp’s predecessor,Copco, to regulate flows out of Upper Klamath Lake. This agreement gave Copco significantflexibility in operating the dam for hydropower generation, as long as all irrigation projectrequirements were met. This flexibility allowed for use of some lake storage to augment flowsfor generation. This flexibility remained largely intact until 1992, when the operation of the damwas restricted more significantly to protect endangered species.
The new policies required that certain Upper Klamath Lake levels be met, thus reducing thecapability of Upper Klamath Lake to store spring flood flows. This has resulted in increasedwater spilled. In 1996, as a result of these and downstream minimum flow requirements and therelated potential liability for ESA-related charges, PacifiCorp contemplated rescinding its 1956operations contract with USBR. In 1997, an agreement was reached whereby USBR assumed allresponsibility for Upper Klamath Lake levels and downstream flow requirements (below IronGate dam). This means that PacifiCorp has no more than an average 7-day storage capacity(12,000 acre-feet) in its entire Project system. Essentially, under historical operations, thePacifiCorp Project had some capacity for longer term (monthly, seasonal) storage to balanceavailable water for hydropower. Under current practice, with little or no control over storage inUpper Klamath Lake or downstream flows below Iron Gate dam, the PacifiCorp Project only hasthe ability to influence flows at daily or hourly time steps.
In late winter and spring, particularly for average or wetter years, Project reservoirs are typicallyfull, resulting in run-of-river operations through the Project area. In summer and fall, whenaverage flows are below the capacity of the turbines, PacifiCorp manages flows to maximizepower generation. Typically, this might involve holding half the “natural” flow in a reservoir,filling during the night, and releasing 1.5 times the “natural” flow during the day, to increase theflow through the turbines during the time when electricity demand is relatively high. This resultsin a shift in time of 12 hours and a change in magnitude of 50 percent of the natural flow.Because the hydraulic capacity of the J.C. Boyle powerhouse is about 2,850 cfs and the CopcoNo. 2 powerhouse is about 3,200 cfs, any larger flows would not be subject to this peakingaction. Minimum instream flows and prescribed ramping rates also constrain this approach,based on FERC license requirements and ESA considerations. With downstream flowrequirements below Iron Gate Dam typically at approximately 1,000 cfs, this effectively limitsthe range of possible operational effects to no more than +/- 2,000 cfs (3,000-1,000 cfs) from“natural” flow, within the 1,000-3,000 cfs range. Temporally, this maximum effect can only bein place for up to 3.5 days, assuming active storage is empty, before reservoirs would fill to run-of-river conditions. The largest impact of this peaking behavior is the wide fluctuation betweenhigh and low flow that can occur during a single day.
PacifiCorpKlamath Hydroelectric Project
FERC No. 2082
© February 2004 PacifiCorpWater Resources FTR .DOC Water Resources FTR Page 5-17
5.7.3.3 Flow Management Effects
Three key studies—Balance Hydrologics (1996), Ayres Associates (1999), and Hardy andAddley (2001)— provide analyses of basin hydrology and the effects on hydrology of flowmanagement in the Klamath River basin. Each study included analysis that sought to illuminateflow management effects by comparing a “natural” hydrology condition to the current flowregulation regime. These three studies focus mainly on the effects on hydrology of flowmanagement from the Klamath Irrigation Project. While the current flow regulation regimeincludes both irrigation and hydropower components, these studies emphasize the irrigationproject component, probably for a couple of reasons. First, the PacifiCorp Project requires littleto no consumptive use. Second, less than 1 percent of total basin storage is “actively” stored byPacifiCorp Project components, while over 80 percent of the total storage capacity is containedwithin Upper Klamath Lake, managed by USBR. The lack of active storage under PacifiCorp’scontrol means that comparatively little effect on the basin flow regime is caused by Projectoperations, and as such no work was done to explicitly quantify hydrologic impacts of thoseoperations.
Balance Hydrologics (1996)
The Balance Hydrologics report (1996), prepared on behalf of the Yurok Tribe, discussesfindings regarding the impact of the Klamath Irrigation Project on instream flows below IronGate dam. This report attempts to quantify the extent to which the Klamath Irrigation Project hasaffected seasonal flows in the river. In general, the report describes an increase in winter flowsand a decrease in late-spring and summer flows. The report also makes the link betweensubsurface storage in the upper basin and base flows in the Klamath River, suggesting thatconsumptive irrigation use diminishes the buffer subsurface flows historically provided, andsurface flows are correlated to precipitation in the basin over the previous several years.
This report uses USGS gauge data recorded from 1905 to 1912 at Keno, Oregon, supplementedby records from several other sites downstream, to estimate a without-project hydrologic record.Rainfall records are used to quantify long-term wet and dry periods in the past century. Inparticular, these include severe drought in the 1840s; wet periods in the 1860s, 1905-1917, and1951-1984; and dry periods in 1872-1890 and 1918-1950.
Balance Hydrologics offers several recommendations for improving river flow conditions,including increasing storage in Upper Klamath Lake, artificially recharging runoff to ground-water, conjunctive use of groundwater in certain areas to augment surface flow irrigation, andimproving irrigation efficiencies.
Ayers Associates (1999)
The Ayres Associates (1999) report was prepared for the U.S. Fish and Wildlife Service toevaluate Klamath River geomorphology, and to determine if channel geometry and sedimentdynamics are changing, particularly downstream of Iron Gate dam. As part of this evaluation, thereport presents additional analyses of the hydrologic data in the basin, and examines the analysisand conclusions of Balance Hydrologics (1996), agreeing with many but taking issue with some.Ayres Associates disagrees with the correlation procedure for previous year precipitation andsubsequent runoff volume, and also disputes the adjustment used to index the relatively short
PacifiCorpKlamath Hydroelectric ProjectFERC No. 2082
© February 2004 PacifiCorpWater Resources FTR Page 5-18 Water Resources FTR .DOC
pre-Project gauge data record to normalize it against average expected flows. Ayres Associatesrecalculated the index to show that the pre-Project data are nearly average, not slightly wet, asBalance Hydrologics reported. This change implies that flows in the basin were not diminishingover time, as Balance Hydrologics suggested. Ayres Associates concurs that seasonal shifts arediscernible with respect to peak flows and volumes. In addition, peak discharges have increasedin magnitude and frequency since construction of Iron Gate dam, but it is not clear that thesechanges are related to the Klamath Irrigation Project, as opposed to land use changes, such astimber harvest. Ayres Associates concurs with the Balance Hydrologics’ finding of shifts inseasonal averages, with higher winter flows and lower summer flows.
Hardy and Addley (2001)
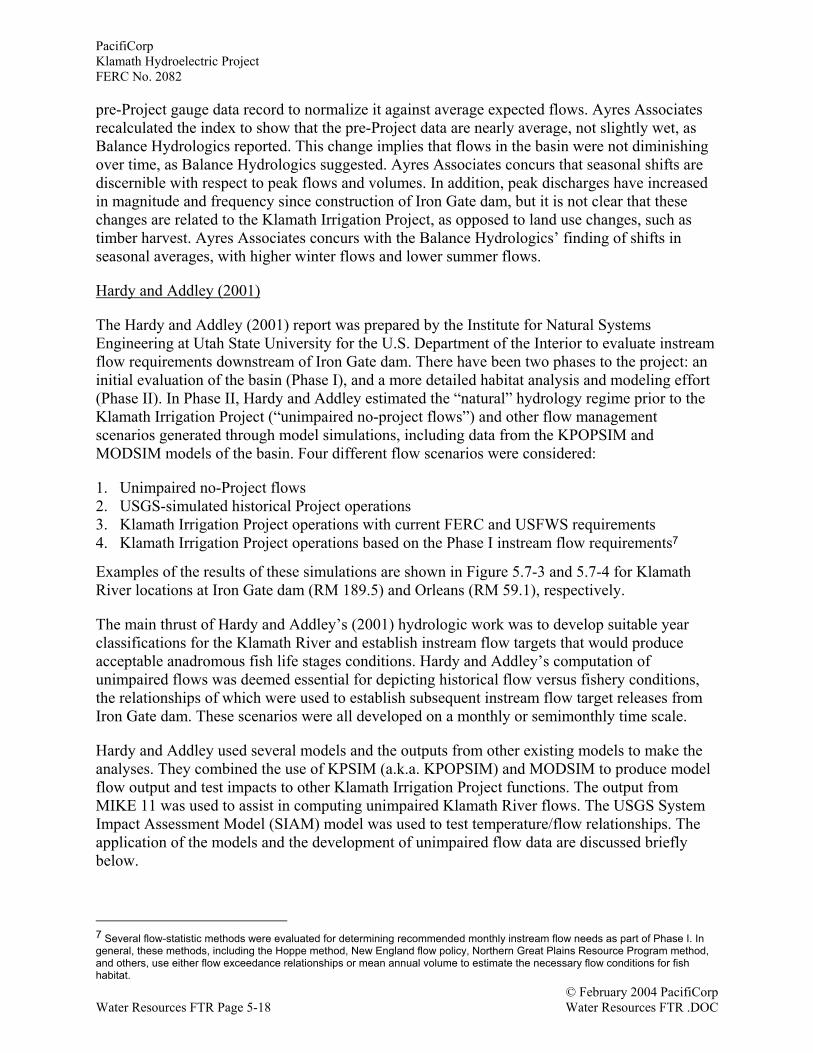
The Hardy and Addley (2001) report was prepared by the Institute for Natural SystemsEngineering at Utah State University for the U.S. Department of the Interior to evaluate instreamflow requirements downstream of Iron Gate dam. There have been two phases to the project: aninitial evaluation of the basin (Phase I), and a more detailed habitat analysis and modeling effort(Phase II). In Phase II, Hardy and Addley estimated the “natural” hydrology regime prior to theKlamath Irrigation Project (“unimpaired no-project flows”) and other flow managementscenarios generated through model simulations, including data from the KPOPSIM andMODSIM models of the basin. Four different flow scenarios were considered:
1. Unimpaired no-Project flows2. USGS-simulated historical Project operations3. Klamath Irrigation Project operations with current FERC and USFWS requirements4. Klamath Irrigation Project operations based on the Phase I instream flow requirements7
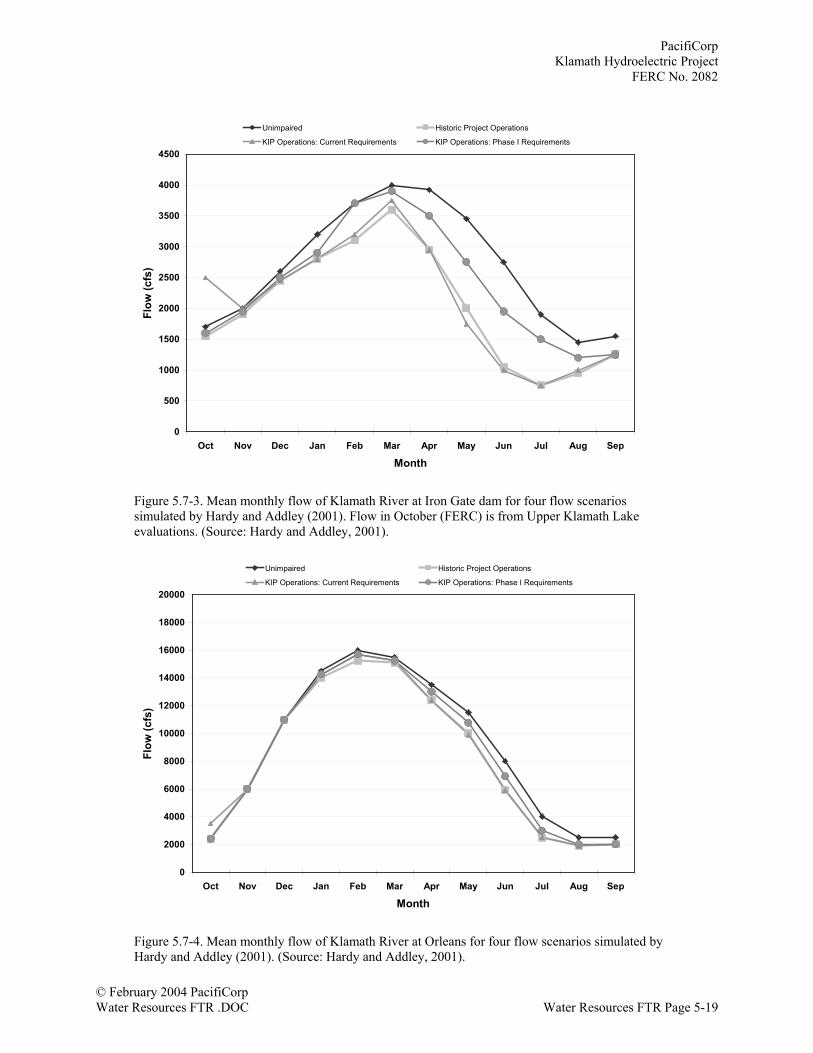
Examples of the results of these simulations are shown in Figure 5.7-3 and 5.7-4 for KlamathRiver locations at Iron Gate dam (RM 189.5) and Orleans (RM 59.1), respectively.
The main thrust of Hardy and Addley’s (2001) hydrologic work was to develop suitable yearclassifications for the Klamath River and establish instream flow targets that would produceacceptable anadromous fish life stages conditions. Hardy and Addley’s computation ofunimpaired flows was deemed essential for depicting historical flow versus fishery conditions,the relationships of which were used to establish subsequent instream flow target releases fromIron Gate dam. These scenarios were all developed on a monthly or semimonthly time scale.
Hardy and Addley used several models and the outputs from other existing models to make theanalyses. They combined the use of KPSIM (a.k.a. KPOPSIM) and MODSIM to produce modelflow output and test impacts to other Klamath Irrigation Project functions. The output fromMIKE 11 was used to assist in computing unimpaired Klamath River flows. The USGS SystemImpact Assessment Model (SIAM) model was used to test temperature/flow relationships. Theapplication of the models and the development of unimpaired flow data are discussed brieflybelow.
7 Several flow-statistic methods were evaluated for determining recommended monthly instream flow needs as part of Phase I. Ingeneral, these methods, including the Hoppe method, New England flow policy, Northern Great Plains Resource Program method,and others, use either flow exceedance relationships or mean annual volume to estimate the necessary flow conditions for fishhabitat.
PacifiCorpKlamath Hydroelectric Project
FERC No. 2082
© February 2004 PacifiCorpWater Resources FTR .DOC Water Resources FTR Page 5-19
0
500
1000
1500
2000
2500
3000
3500
4000
4500
Oct Nov Dec Jan Feb Mar Apr May Jun Jul Aug Sep
Month
Flow
(cfs
)
Unimpaired Historic Project Operations
KIP Operations: Current Requirements KIP Operations: Phase I Requirements
Figure 5.7-3. Mean monthly flow of Klamath River at Iron Gate dam for four flow scenariossimulated by Hardy and Addley (2001). Flow in October (FERC) is from Upper Klamath Lakeevaluations. (Source: Hardy and Addley, 2001).
0
2000
4000
6000
8000
10000
12000
14000
16000
18000
20000
Oct Nov Dec Jan Feb Mar Apr May Jun Jul Aug Sep
Month
Flow
(cfs
)
Unimpaired Historic Project Operations
KIP Operations: Current Requirements KIP Operations: Phase I Requirements
Figure 5.7-4. Mean monthly flow of Klamath River at Orleans for four flow scenarios simulated byHardy and Addley (2001). (Source: Hardy and Addley, 2001).
PacifiCorpKlamath Hydroelectric ProjectFERC No. 2082
© February 2004 PacifiCorpWater Resources FTR Page 5-20 Water Resources FTR .DOC
MODSIM is an off-the-shelf model developed at Colorado State University approximately30 years ago. It is a popular decisionmaking tool that permits the user to establish prioritizationof water supply features to meet varying demands in a linear system. Colorado State Universitydeveloped a MODSIM model specifically for the Klamath River for the purpose of analyzingpotential water sources to meet increased flow releases below Iron Gate dam. PacifiCorp’sJ.C. Boyle, Copco, and Iron Gate reservoirs were included in this analysis. In their modelapplications, Hardy and Addley concluded that MODSIM has limited capability to simulate theriver system above Iron Gate dam to realistically reflect actual Klamath Irrigation Projectoperations. Instead, they used KPSIM to “front-load” flows for the USGS SIAM model.
MIKE 11, a flow routing model, was used by Hardy and Addley to de-operate Upper KlamathLake historical storage regulation. The outflow from Upper Klamath Lake is controlled by LinkRiver dam. Before the dam’s construction in the early 1900s, the outflow from Upper KlamathLake was controlled by a rock reef located just upstream of the existing dam. The portion of theKlamath River between the reef and the Link dam location contained a series of cataracts knownas Klamath Falls. In computing “unimpaired flow” below Link dam, Hardy and Addley used theoutput from MIKE 11 modeling to yield more accurate daily “unimpaired flows” at Link dam byaccounting for these pre-construction features.
Hardy and Addley’s 2001 analysis found that the difference between estimated average annualflow (1.8 million acre-feet) prior to the Klamath Irrigation Project and current conditions(1.5 million acre-feet) represents the consumptive use in the basin by irrigators and other users.Some seasonal shifts and changes in peak and trough magnitudes can be seen at the monthly timescale, similar to those concluded by the Balance Hydrologics (1996) and Ayres Associates(1999) studies.
5.7.4 Effects of PacifiCorp Operations on the Short-term (Hourly and Daily) HydrologicRegime of the Klamath River
The Project is composed of a series of reservoirs and reaches that step down from UpperKlamath Lake to Iron Gate dam. Each reservoir has certain operating rules connected by avarying degree with other reservoirs in the system. As discussed in section 5.7.1, the reservoirsunder PacifiCorp control contain a relatively small volume available for active storage (about10 percent of mean annual runoff at Iron Gate dam, and about 1 percent at Klamath, California).The effects on Klamath River and basin hydrology from operating the reservoirs are mostrelevant at a short time period (daily and hourly), low volume scale.
Hourly data were compiled for several recent characteristic years (1991, 1992, 1997, 1998, and1999) at various facilities in the Project area. The data constitute a substantial number ofcollected measurements, approximately 500,000. To facilitate examination, the data wereorganized in two ways, either as a “snapshot” of typical operational characteristics or as a“summary” describing maximum, minimum, and average values for each water year type.Snapshot figures have been selected to illustrate typical operations patterns observed underdifferent seasonal conditions. These types of figures have been created for each component ofthe Project system, including reservoirs, peaking reaches, and bypass reaches.
In general, these figures show that macro-scale hydrologic variability has little effect on reservoiroperations at extremes because the active storage volume within each Project reservoir is small.
PacifiCorpKlamath Hydroelectric Project
FERC No. 2082
© February 2004 PacifiCorpWater Resources FTR .DOC Water Resources FTR Page 5-21
In addition, the Project reservoirs typically operate across the entire operations range over thecourse of a water year and, in some cases, much more frequently. This is another consequence ofthe small storage volume, which allows the reservoir to refill quickly under most macro-hydrologic conditions. In wet years, it is more likely that available river flows exceed power-house total turbine hydraulic capacities8 in such a way that some or all Project reservoirs willspill, sending additional flows through the downstream bypass reaches. In drier years, peakingoperations will be more frequent to maximize power production at peak times of day. Rampingrates and minimum flows are regulated and adhered to. Except in run-of-river conditions,reservoir discharges are balanced to avoid releasing more flow than turbines can handle.
5.7.4.1 Link River
Flow-Related Operations in Link River
The Link River reach includes the relatively short 1.2-mile reach of the Klamath River from LinkRiver dam (RM 254.3) to the inlet to Lake Ewauna (about RM 253.1). Link River dam is locatedat the outlet from Upper Klamath Lake. USBR owns the dam and PacifiCorp operates it, asspecified by USBR. Link River dam operates principally to maintain Upper Klamath Lakeelevations and to provide needed instream flows in the Klamath River downstream of Iron Gatedam. Link River dam also provides control for diversion of flow to USBR’s Klamath IrrigationProject and to PacifiCorp’s East Side and West Side powerhouses.
The East Side powerhouse is operated continuously at a constant discharge from Upper KlamathLake, as specified by USBR. The powerhouse generates power with flows provided from UpperKlamath Lake to meet downstream needs, including USBR’s Klamath Irrigation Project andESA flows downstream of Iron Gate dam. The exception to this type of operation is during lateJuly into October when the powerhouse operates in a diurnal fashion, reducing flows through thepowerhouse at night to 200 cfs, and the West Side facility is shut down. This operationminimizes potential entrainment of ESA-listed Lost River and shortnose suckers.
The East Side powerhouse has a single vertical Francis turbine with a hydraulic capacity of about975 cfs. The West Side powerhouse is operated when outflows from Upper Klamath Lakerequested by USBR exceed about 1,300 cfs (the sum of the hydraulic capacities of East Side andWest Side, and the minimum instream flow below Link River dam). Under these conditions,West Side is generally operated at a fixed discharge (full gate, about 250 cfs) for an extendedperiod. The West Side powerhouse has a single horizontal Francis turbine with a hydrauliccapacity of about 250 cfs. Under cooperative agreement with ODFW, a minimum flow of at least90 cfs is currently maintained in Link River between Link River dam and the East Sidepowerhouse. PacifiCorp currently maintains a minimum flow of 450 cfs in Link River below theEast Side powerhouse. Maximum ramping rates are 100 cfs per 30 minutes when flows are 500to 1,500 cfs, 50 cfs per 30 minutes when flows are 300 to 500 cfs, and 20 cfs per 5 min whenflows are less than 300 cfs. These rates are stipulated by the 2001 Biological Opinion on ESAconsultation for shortnose and Lost River suckers.
8 Powerhouse total turbine hydraulic capacities at Project facilities on the Klamath River are approximately as follows: Iron Gate –1,735 cfs, Copco 1 and 2 – 3,200 cfs, J.C. Boyle – 2,850 cfs, East Side – 1,200 cfs, West Side – 250 cfs.
PacifiCorpKlamath Hydroelectric ProjectFERC No. 2082
© February 2004 PacifiCorpWater Resources FTR Page 5-22 Water Resources FTR .DOC
Flow Conditions in Link River
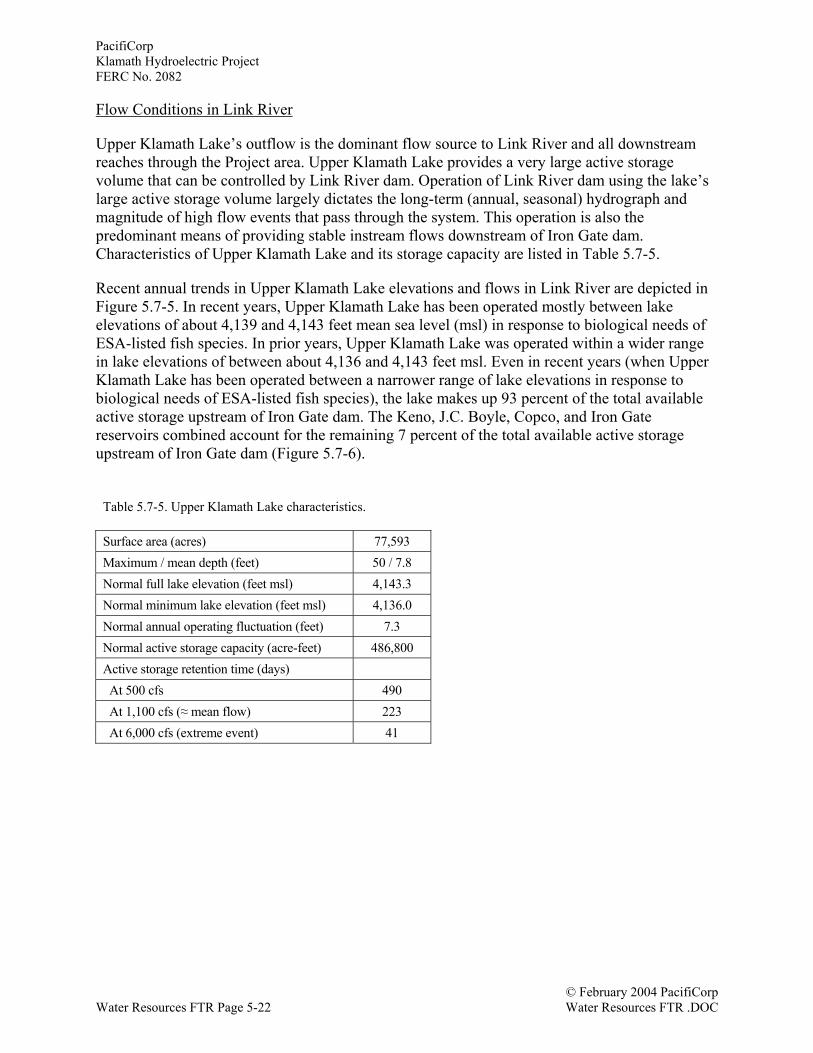
Upper Klamath Lake’s outflow is the dominant flow source to Link River and all downstreamreaches through the Project area. Upper Klamath Lake provides a very large active storagevolume that can be controlled by Link River dam. Operation of Link River dam using the lake’slarge active storage volume largely dictates the long-term (annual, seasonal) hydrograph andmagnitude of high flow events that pass through the system. This operation is also thepredominant means of providing stable instream flows downstream of Iron Gate dam.Characteristics of Upper Klamath Lake and its storage capacity are listed in Table 5.7-5.
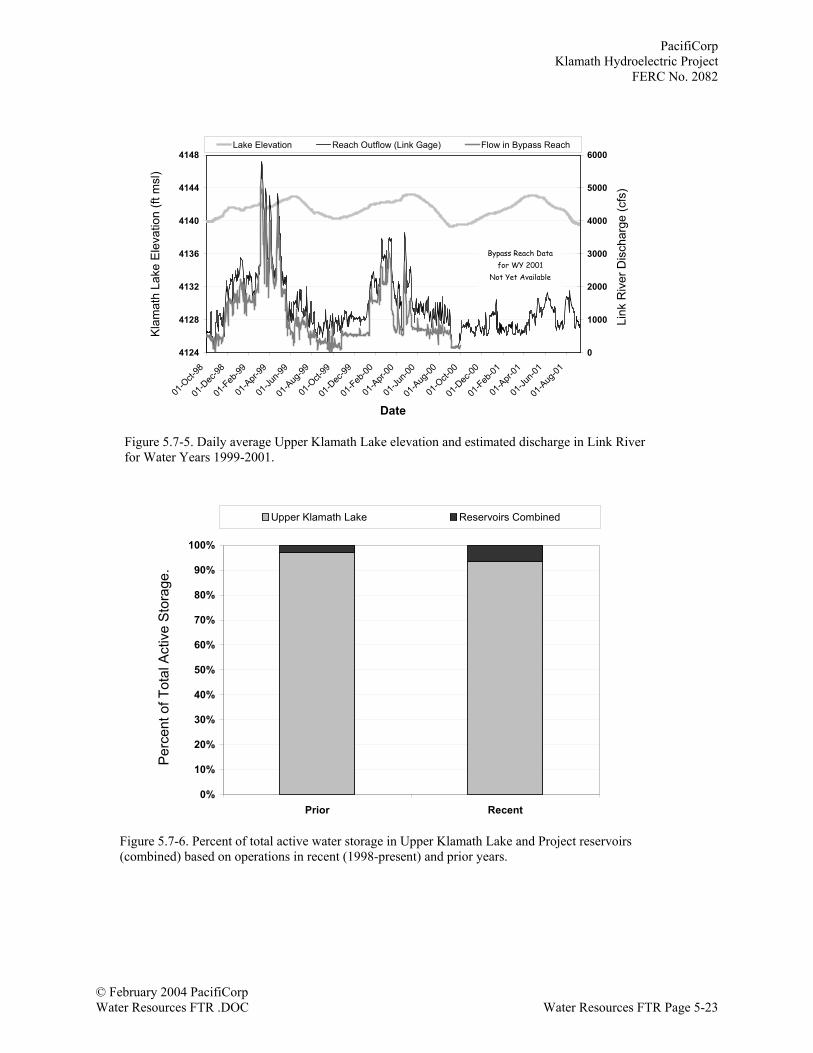
Recent annual trends in Upper Klamath Lake elevations and flows in Link River are depicted inFigure 5.7-5. In recent years, Upper Klamath Lake has been operated mostly between lakeelevations of about 4,139 and 4,143 feet mean sea level (msl) in response to biological needs ofESA-listed fish species. In prior years, Upper Klamath Lake was operated within a wider rangein lake elevations of between about 4,136 and 4,143 feet msl. Even in recent years (when UpperKlamath Lake has been operated between a narrower range of lake elevations in response tobiological needs of ESA-listed fish species), the lake makes up 93 percent of the total availableactive storage upstream of Iron Gate dam. The Keno, J.C. Boyle, Copco, and Iron Gatereservoirs combined account for the remaining 7 percent of the total available active storageupstream of Iron Gate dam (Figure 5.7-6).
Table 5.7-5. Upper Klamath Lake characteristics.
Surface area (acres) 77,593Maximum / mean depth (feet) 50 / 7.8Normal full lake elevation (feet msl) 4,143.3Normal minimum lake elevation (feet msl) 4,136.0Normal annual operating fluctuation (feet) 7.3Normal active storage capacity (acre-feet) 486,800Active storage retention time (days) At 500 cfs 490 At 1,100 cfs (≈ mean flow) 223 At 6,000 cfs (extreme event) 41
PacifiCorpKlamath Hydroelectric Project
FERC No. 2082
© February 2004 PacifiCorpWater Resources FTR .DOC Water Resources FTR Page 5-23
4124
4128
4132
4136
4140
4144
4148
01-O
ct-98
01-D
ec-98
01-F
eb-99
01-A
pr-99
01-Ju
n-99
01-A
ug-99
01-O
ct-99
01-D
ec-99
01-F
eb-00
01-A
pr-00
01-Ju
n-00
01-A
ug-00
01-O
ct-00
01-D
ec-00
01-Feb
-01
01-A
pr-01
01-Ju
n-01
01-A
ug-01
Date
Kla
mat
h La
ke E
leva
tion
(ft m
sl)
0
1000
2000
3000
4000
5000
6000Lake Elevation Reach Outflow (Link Gage) Flow in Bypass Reach
Link
Riv
er D
isch
arge
(cfs
)
Bypass Reach Datafor WY 2001
Not Yet Available
Figure 5.7-5. Daily average Upper Klamath Lake elevation and estimated discharge in Link Riverfor Water Years 1999-2001.
0%
10%
20%
30%
40%
50%
60%
70%
80%
90%
100%
Prior Recent
Upper Klamath Lake Reservoirs Combined
Per
cent
of T
otal
Act
ive
Sto
rage
.
Figure 5.7-6. Percent of total active water storage in Upper Klamath Lake and Project reservoirs(combined) based on operations in recent (1998-present) and prior years.
PacifiCorpKlamath Hydroelectric ProjectFERC No. 2082
© February 2004 PacifiCorpWater Resources FTR Page 5-24 Water Resources FTR .DOC
Annual Trend in Flow Conditions
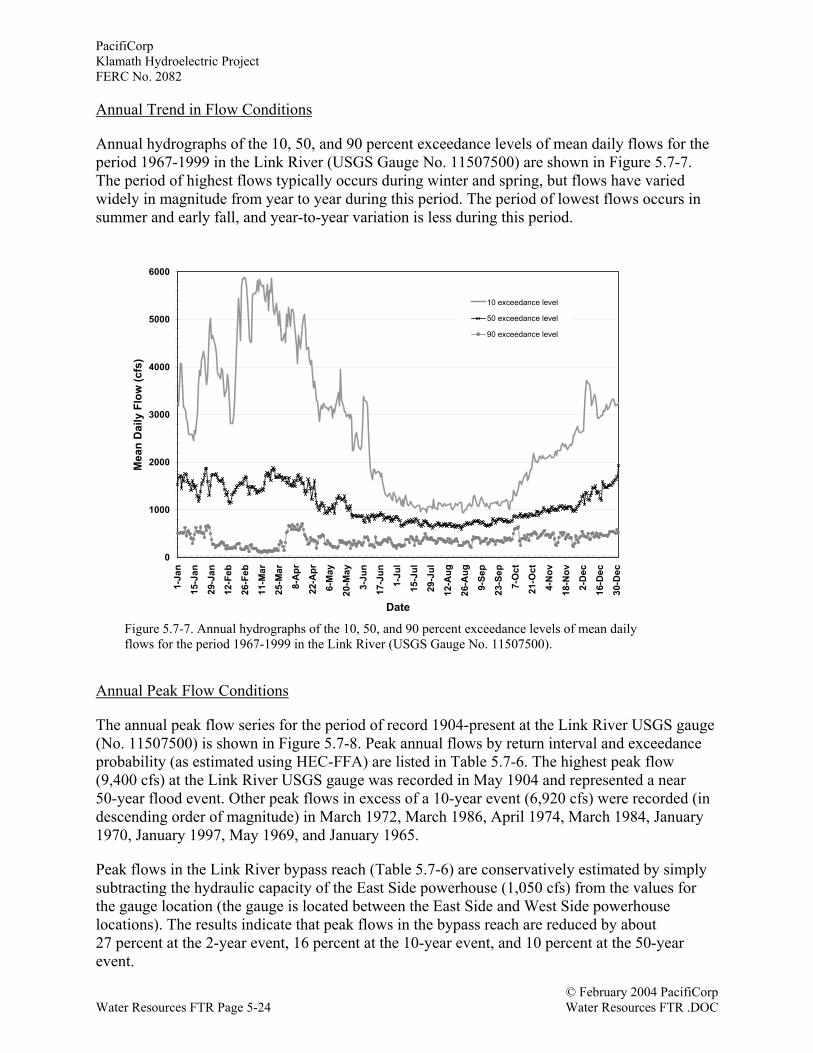
Annual hydrographs of the 10, 50, and 90 percent exceedance levels of mean daily flows for theperiod 1967-1999 in the Link River (USGS Gauge No. 11507500) are shown in Figure 5.7-7.The period of highest flows typically occurs during winter and spring, but flows have variedwidely in magnitude from year to year during this period. The period of lowest flows occurs insummer and early fall, and year-to-year variation is less during this period.
Annual Peak Flow Conditions
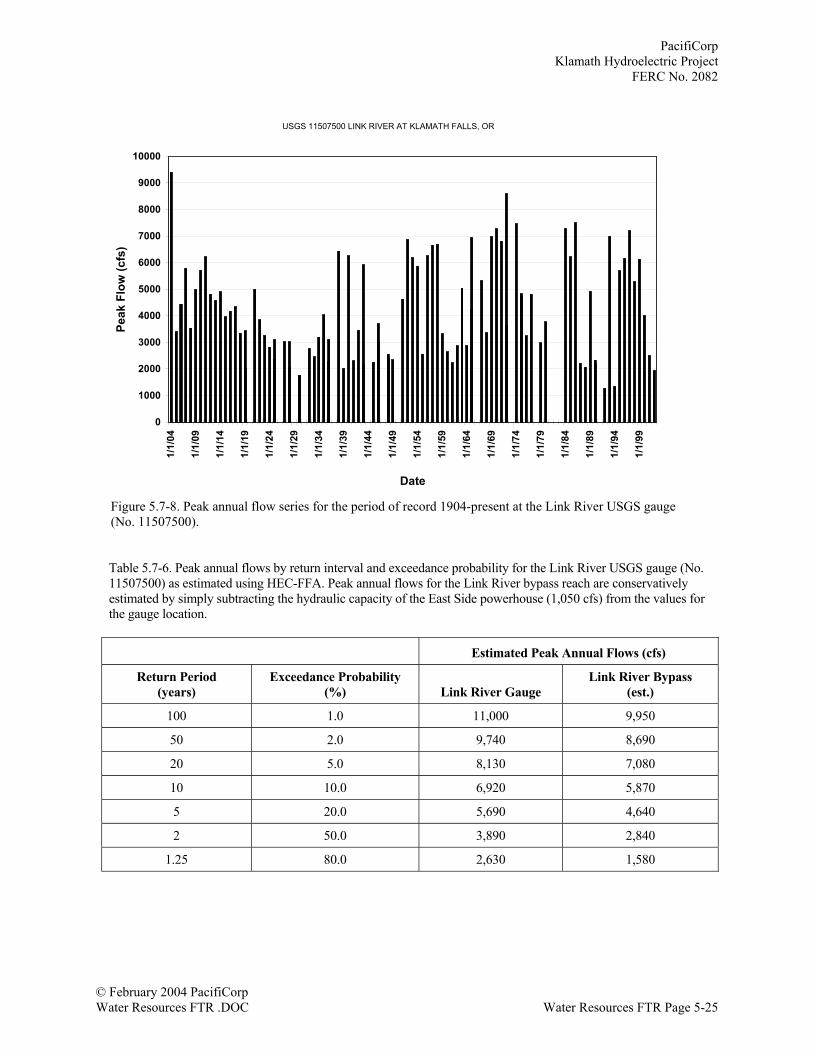
The annual peak flow series for the period of record 1904-present at the Link River USGS gauge(No. 11507500) is shown in Figure 5.7-8. Peak annual flows by return interval and exceedanceprobability (as estimated using HEC-FFA) are listed in Table 5.7-6. The highest peak flow(9,400 cfs) at the Link River USGS gauge was recorded in May 1904 and represented a near50-year flood event. Other peak flows in excess of a 10-year event (6,920 cfs) were recorded (indescending order of magnitude) in March 1972, March 1986, April 1974, March 1984, January1970, January 1997, May 1969, and January 1965.
Peak flows in the Link River bypass reach (Table 5.7-6) are conservatively estimated by simplysubtracting the hydraulic capacity of the East Side powerhouse (1,050 cfs) from the values forthe gauge location (the gauge is located between the East Side and West Side powerhouselocations). The results indicate that peak flows in the bypass reach are reduced by about27 percent at the 2-year event, 16 percent at the 10-year event, and 10 percent at the 50-yearevent.
0
1000
2000
3000
4000
5000
6000
1-Ja
n
15-J
an
29-J
an
12-F
eb
26-F
eb
11-M
ar
25-M
ar
8-A
pr
22-A
pr
6-M
ay
20-M
ay
3-Ju
n
17-J
un
1-Ju
l
15-J
ul
29-J
ul
12-A
ug
26-A
ug
9-Se
p
23-S
ep
7-O
ct
21-O
ct
4-N
ov
18-N
ov
2-D
ec
16-D
ec
30-D
ecDate
Mea
n D
aily
Flo
w (c
fs)
10 exceedance level
50 exceedance level
90 exceedance level
Figure 5.7-7. Annual hydrographs of the 10, 50, and 90 percent exceedance levels of mean dailyflows for the period 1967-1999 in the Link River (USGS Gauge No. 11507500).
PacifiCorpKlamath Hydroelectric Project
FERC No. 2082
© February 2004 PacifiCorpWater Resources FTR .DOC Water Resources FTR Page 5-25
Table 5.7-6. Peak annual flows by return interval and exceedance probability for the Link River USGS gauge (No.11507500) as estimated using HEC-FFA. Peak annual flows for the Link River bypass reach are conservativelyestimated by simply subtracting the hydraulic capacity of the East Side powerhouse (1,050 cfs) from the values forthe gauge location.
Estimated Peak Annual Flows (cfs)
Return Period(years)
Exceedance Probability(%) Link River Gauge
Link River Bypass(est.)
100 1.0 11,000 9,950
50 2.0 9,740 8,690
20 5.0 8,130 7,080
10 10.0 6,920 5,870
5 20.0 5,690 4,640
2 50.0 3,890 2,840
1.25 80.0 2,630 1,580
USGS 11507500 LINK RIVER AT KLAMATH FALLS, OR
0
1000
2000
3000
4000
5000
6000
7000
8000
9000
100001/
1/04
1/1/
09
1/1/
14
1/1/
19
1/1/
24
1/1/
29
1/1/
34
1/1/
39
1/1/
44
1/1/
49
1/1/
54
1/1/
59
1/1/
64
1/1/
69
1/1/
74
1/1/
79
1/1/
84
1/1/
89
1/1/
94
1/1/
99
Date
Peak
Flo
w (c
fs)
Figure 5.7-8. Peak annual flow series for the period of record 1904-present at the Link River USGS gauge(No. 11507500).
PacifiCorpKlamath Hydroelectric ProjectFERC No. 2082
© February 2004 PacifiCorpWater Resources FTR Page 5-26 Water Resources FTR .DOC
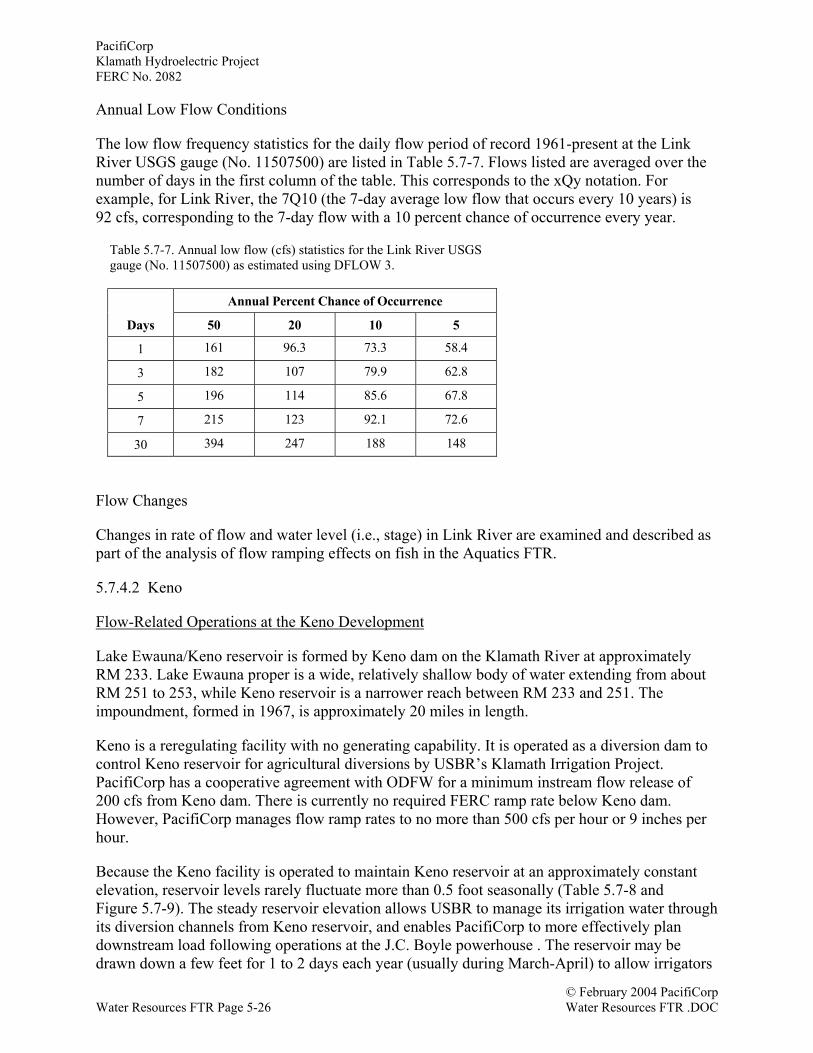
Annual Low Flow Conditions
The low flow frequency statistics for the daily flow period of record 1961-present at the LinkRiver USGS gauge (No. 11507500) are listed in Table 5.7-7. Flows listed are averaged over thenumber of days in the first column of the table. This corresponds to the xQy notation. Forexample, for Link River, the 7Q10 (the 7-day average low flow that occurs every 10 years) is92 cfs, corresponding to the 7-day flow with a 10 percent chance of occurrence every year.
Table 5.7-7. Annual low flow (cfs) statistics for the Link River USGSgauge (No. 11507500) as estimated using DFLOW 3.
Annual Percent Chance of Occurrence
Days 50 20 10 5
1 161 96.3 73.3 58.4
3 182 107 79.9 62.8
5 196 114 85.6 67.8
7 215 123 92.1 72.6
30 394 247 188 148
Flow Changes
Changes in rate of flow and water level (i.e., stage) in Link River are examined and described aspart of the analysis of flow ramping effects on fish in the Aquatics FTR.
5.7.4.2 Keno
Flow-Related Operations at the Keno Development
Lake Ewauna/Keno reservoir is formed by Keno dam on the Klamath River at approximatelyRM 233. Lake Ewauna proper is a wide, relatively shallow body of water extending from aboutRM 251 to 253, while Keno reservoir is a narrower reach between RM 233 and 251. Theimpoundment, formed in 1967, is approximately 20 miles in length.
Keno is a reregulating facility with no generating capability. It is operated as a diversion dam tocontrol Keno reservoir for agricultural diversions by USBR’s Klamath Irrigation Project.PacifiCorp has a cooperative agreement with ODFW for a minimum instream flow release of200 cfs from Keno dam. There is currently no required FERC ramp rate below Keno dam.However, PacifiCorp manages flow ramp rates to no more than 500 cfs per hour or 9 inches perhour.
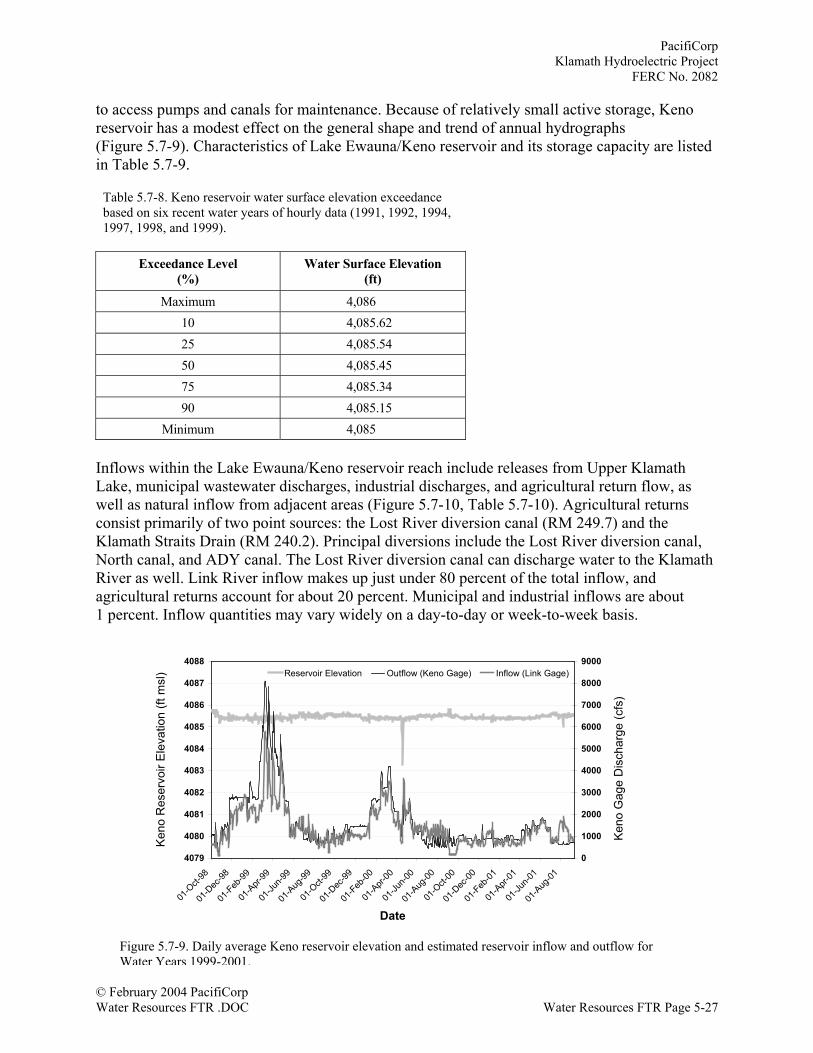
Because the Keno facility is operated to maintain Keno reservoir at an approximately constantelevation, reservoir levels rarely fluctuate more than 0.5 foot seasonally (Table 5.7-8 andFigure 5.7-9). The steady reservoir elevation allows USBR to manage its irrigation water throughits diversion channels from Keno reservoir, and enables PacifiCorp to more effectively plandownstream load following operations at the J.C. Boyle powerhouse . The reservoir may bedrawn down a few feet for 1 to 2 days each year (usually during March-April) to allow irrigators
PacifiCorpKlamath Hydroelectric Project
FERC No. 2082
© February 2004 PacifiCorpWater Resources FTR .DOC Water Resources FTR Page 5-27
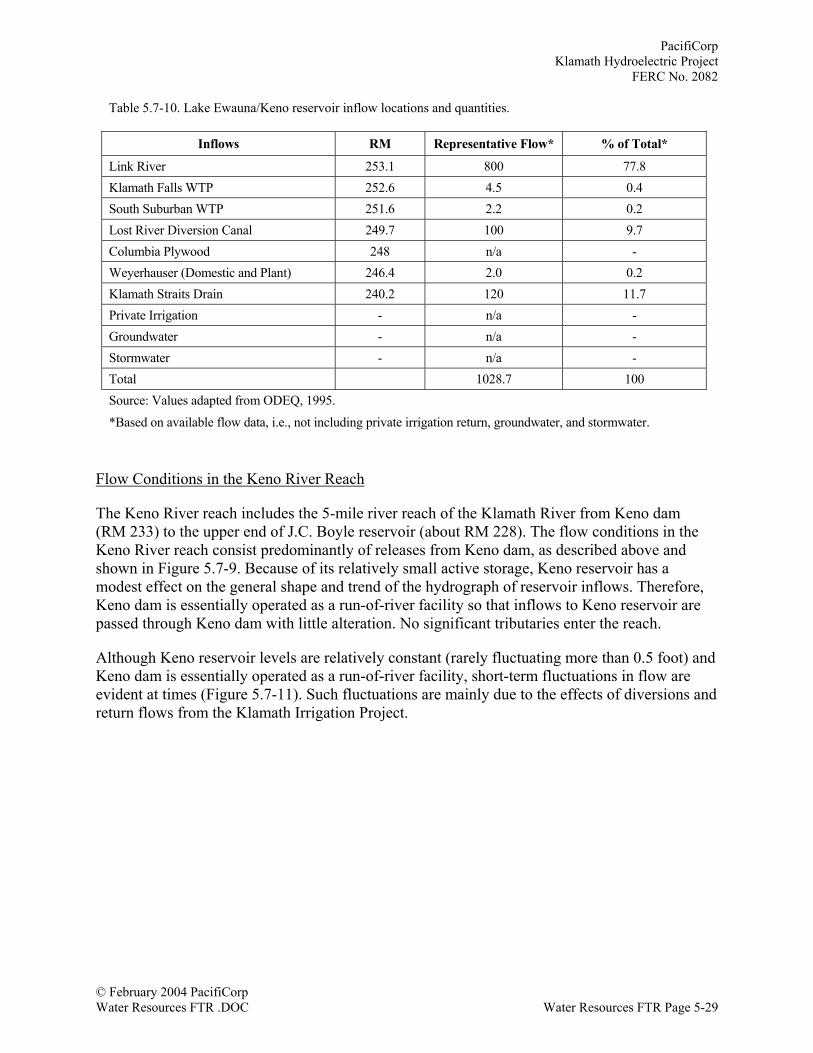
to access pumps and canals for maintenance. Because of relatively small active storage, Kenoreservoir has a modest effect on the general shape and trend of annual hydrographs(Figure 5.7-9). Characteristics of Lake Ewauna/Keno reservoir and its storage capacity are listedin Table 5.7-9.
Table 5.7-8. Keno reservoir water surface elevation exceedancebased on six recent water years of hourly data (1991, 1992, 1994,1997, 1998, and 1999).
Exceedance Level(%)
Water Surface Elevation(ft)
Maximum 4,08610 4,085.6225 4,085.5450 4,085.4575 4,085.3490 4,085.15
Minimum 4,085
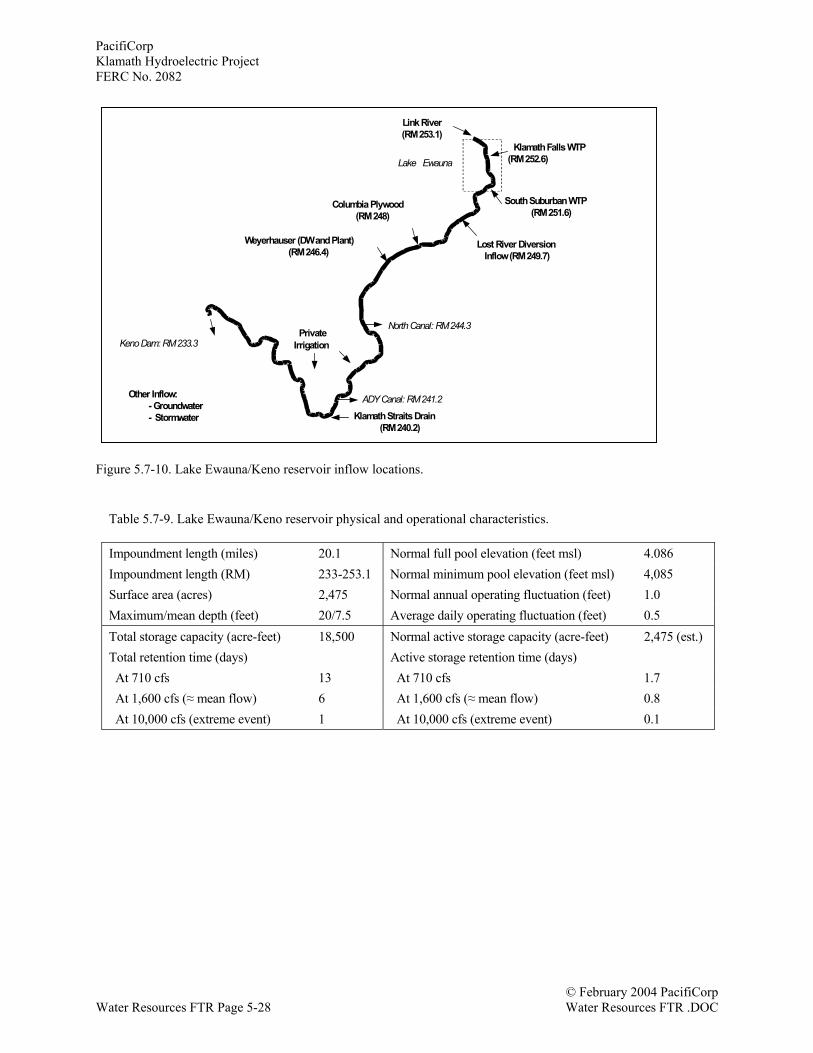
Inflows within the Lake Ewauna/Keno reservoir reach include releases from Upper KlamathLake, municipal wastewater discharges, industrial discharges, and agricultural return flow, aswell as natural inflow from adjacent areas (Figure 5.7-10, Table 5.7-10). Agricultural returnsconsist primarily of two point sources: the Lost River diversion canal (RM 249.7) and theKlamath Straits Drain (RM 240.2). Principal diversions include the Lost River diversion canal,North canal, and ADY canal. The Lost River diversion canal can discharge water to the KlamathRiver as well. Link River inflow makes up just under 80 percent of the total inflow, andagricultural returns account for about 20 percent. Municipal and industrial inflows are about1 percent. Inflow quantities may vary widely on a day-to-day or week-to-week basis.
4079
4080
4081
4082
4083
4084
4085
4086
4087
4088
01-O
ct-98
01-D
ec-98
01-F
eb-99
01-A
pr-99
01-Ju
n-99
01-A
ug-99
01-O
ct-99
01-D
ec-99
01-F
eb-00
01-A
pr-00
01-Ju
n-00
01-A
ug-00
01-O
ct-00
01-D
ec-00
01-F
eb-01
01-A
pr-01
01-Ju
n-01
01-A
ug-01
Date
Ken
o R
eser
voir
Ele
vatio
n (ft
msl
)
0
1000
2000
3000
4000
5000
6000
7000
8000
9000Reservoir Elevation Outflow (Keno Gage) Inflow (Link Gage)
Ken
o G
age
Dis
char
ge (c
fs)
Fi 2 1Figure 5.7-9. Daily average Keno reservoir elevation and estimated reservoir inflow and outflow forWater Years 1999-2001.
PacifiCorpKlamath Hydroelectric ProjectFERC No. 2082
© February 2004 PacifiCorpWater Resources FTR Page 5-28 Water Resources FTR .DOC
Figure 5.7-10. Lake Ewauna/Keno reservoir inflow locations.
Table 5.7-9. Lake Ewauna/Keno reservoir physical and operational characteristics.
Impoundment length (miles) 20.1 Normal full pool elevation (feet msl) 4.086Impoundment length (RM) 233-253.1 Normal minimum pool elevation (feet msl) 4,085Surface area (acres) 2,475 Normal annual operating fluctuation (feet) 1.0Maximum/mean depth (feet) 20/7.5 Average daily operating fluctuation (feet) 0.5Total storage capacity (acre-feet) 18,500 Normal active storage capacity (acre-feet) 2,475 (est.)Total retention time (days) Active storage retention time (days) At 710 cfs 13 At 710 cfs 1.7 At 1,600 cfs (≈ mean flow) 6 At 1,600 cfs (≈ mean flow) 0.8 At 10,000 cfs (extreme event) 1 At 10,000 cfs (extreme event) 0.1
Keno Dam: RM 233.3
Klamath Straits Drain(RM 240.2)
North Canal: RM 244.3
Lost River DiversionInflow (RM 249.7)
Link River(RM 253.1)
ADY Canal: RM 241.2
South Suburban WTP (RM 251.6) Columbia Plywood
(RM 248)
Klamath Falls WTP (RM 252.6)
Weyerhauser (DW and Plant)(RM 246.4)
Lake Ewauna
Private Irrigation
Other Inflow: - Groundwater - Stormwater
PacifiCorpKlamath Hydroelectric Project
FERC No. 2082
© February 2004 PacifiCorpWater Resources FTR .DOC Water Resources FTR Page 5-29
Table 5.7-10. Lake Ewauna/Keno reservoir inflow locations and quantities.
Inflows RM Representative Flow* % of Total*
Link River 253.1 800 77.8Klamath Falls WTP 252.6 4.5 0.4South Suburban WTP 251.6 2.2 0.2Lost River Diversion Canal 249.7 100 9.7Columbia Plywood 248 n/a -Weyerhauser (Domestic and Plant) 246.4 2.0 0.2Klamath Straits Drain 240.2 120 11.7Private Irrigation - n/a -Groundwater - n/a -Stormwater - n/a -Total 1028.7 100Source: Values adapted from ODEQ, 1995.
*Based on available flow data, i.e., not including private irrigation return, groundwater, and stormwater.
Flow Conditions in the Keno River Reach
The Keno River reach includes the 5-mile river reach of the Klamath River from Keno dam(RM 233) to the upper end of J.C. Boyle reservoir (about RM 228). The flow conditions in theKeno River reach consist predominantly of releases from Keno dam, as described above andshown in Figure 5.7-9. Because of its relatively small active storage, Keno reservoir has amodest effect on the general shape and trend of the hydrograph of reservoir inflows. Therefore,Keno dam is essentially operated as a run-of-river facility so that inflows to Keno reservoir arepassed through Keno dam with little alteration. No significant tributaries enter the reach.
Although Keno reservoir levels are relatively constant (rarely fluctuating more than 0.5 foot) andKeno dam is essentially operated as a run-of-river facility, short-term fluctuations in flow areevident at times (Figure 5.7-11). Such fluctuations are mainly due to the effects of diversions andreturn flows from the Klamath Irrigation Project.
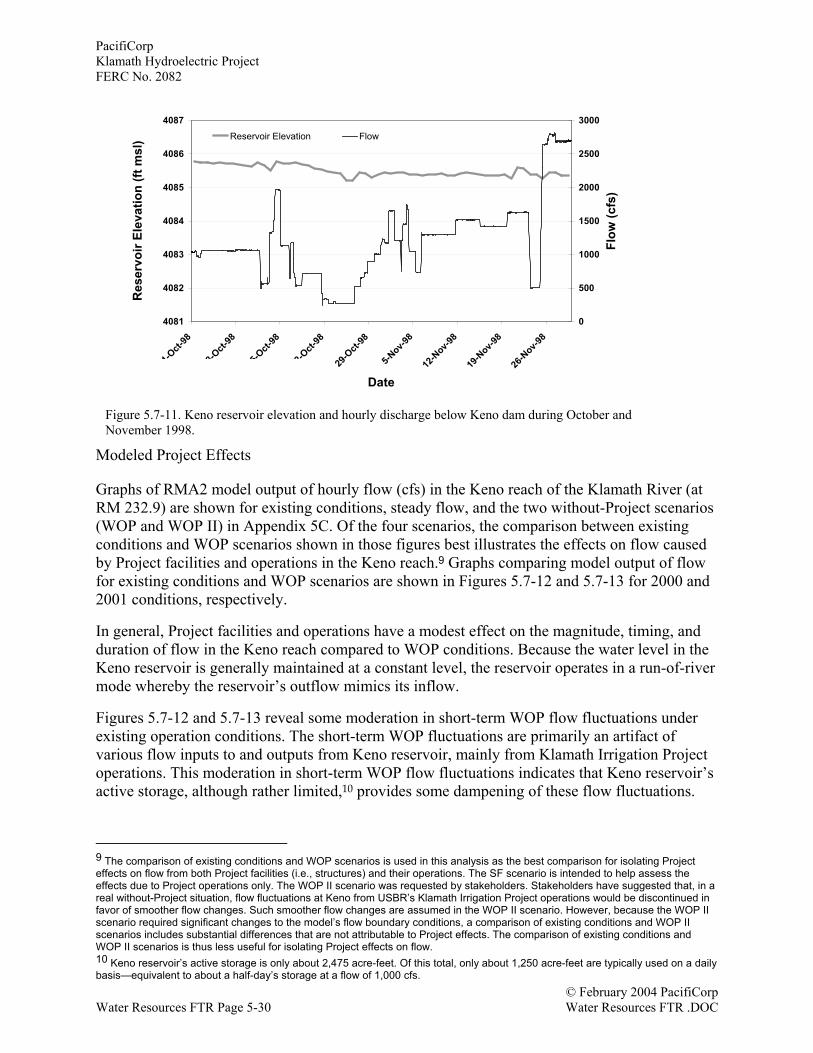
PacifiCorpKlamath Hydroelectric ProjectFERC No. 2082
© February 2004 PacifiCorpWater Resources FTR Page 5-30 Water Resources FTR .DOC
Modeled Project Effects
Graphs of RMA2 model output of hourly flow (cfs) in the Keno reach of the Klamath River (atRM 232.9) are shown for existing conditions, steady flow, and the two without-Project scenarios(WOP and WOP II) in Appendix 5C. Of the four scenarios, the comparison between existingconditions and WOP scenarios shown in those figures best illustrates the effects on flow causedby Project facilities and operations in the Keno reach.9 Graphs comparing model output of flowfor existing conditions and WOP scenarios are shown in Figures 5.7-12 and 5.7-13 for 2000 and2001 conditions, respectively.
In general, Project facilities and operations have a modest effect on the magnitude, timing, andduration of flow in the Keno reach compared to WOP conditions. Because the water level in theKeno reservoir is generally maintained at a constant level, the reservoir operates in a run-of-rivermode whereby the reservoir’s outflow mimics its inflow.
Figures 5.7-12 and 5.7-13 reveal some moderation in short-term WOP flow fluctuations underexisting operation conditions. The short-term WOP fluctuations are primarily an artifact ofvarious flow inputs to and outputs from Keno reservoir, mainly from Klamath Irrigation Projectoperations. This moderation in short-term WOP flow fluctuations indicates that Keno reservoir’sactive storage, although rather limited,10 provides some dampening of these flow fluctuations.
9 The comparison of existing conditions and WOP scenarios is used in this analysis as the best comparison for isolating Projecteffects on flow from both Project facilities (i.e., structures) and their operations. The SF scenario is intended to help assess theeffects due to Project operations only. The WOP II scenario was requested by stakeholders. Stakeholders have suggested that, in areal without-Project situation, flow fluctuations at Keno from USBR’s Klamath Irrigation Project operations would be discontinued infavor of smoother flow changes. Such smoother flow changes are assumed in the WOP II scenario. However, because the WOP IIscenario required significant changes to the model’s flow boundary conditions, a comparison of existing conditions and WOP IIscenarios includes substantial differences that are not attributable to Project effects. The comparison of existing conditions andWOP II scenarios is thus less useful for isolating Project effects on flow.10 Keno reservoir’s active storage is only about 2,475 acre-feet. Of this total, only about 1,250 acre-feet are typically used on a dailybasis—equivalent to about a half-day’s storage at a flow of 1,000 cfs.
4081
4082
4083
4084
4085
4086
4087
1-Oct-
98
8-Oct-
98
15-O
ct-98
22-O
ct-98
29-O
ct-98
5-Nov-9
8
12-N
ov-98
19-N
ov-98
26-N
ov-98
Date
Res
ervo
ir El
evat
ion
(ft m
sl)
0
500
1000
1500
2000
2500
3000
Flow
(cfs
)
Reservoir Elevation Flow
Fi 3 2Figure 5.7-11. Keno reservoir elevation and hourly discharge below Keno dam during October andNovember 1998.
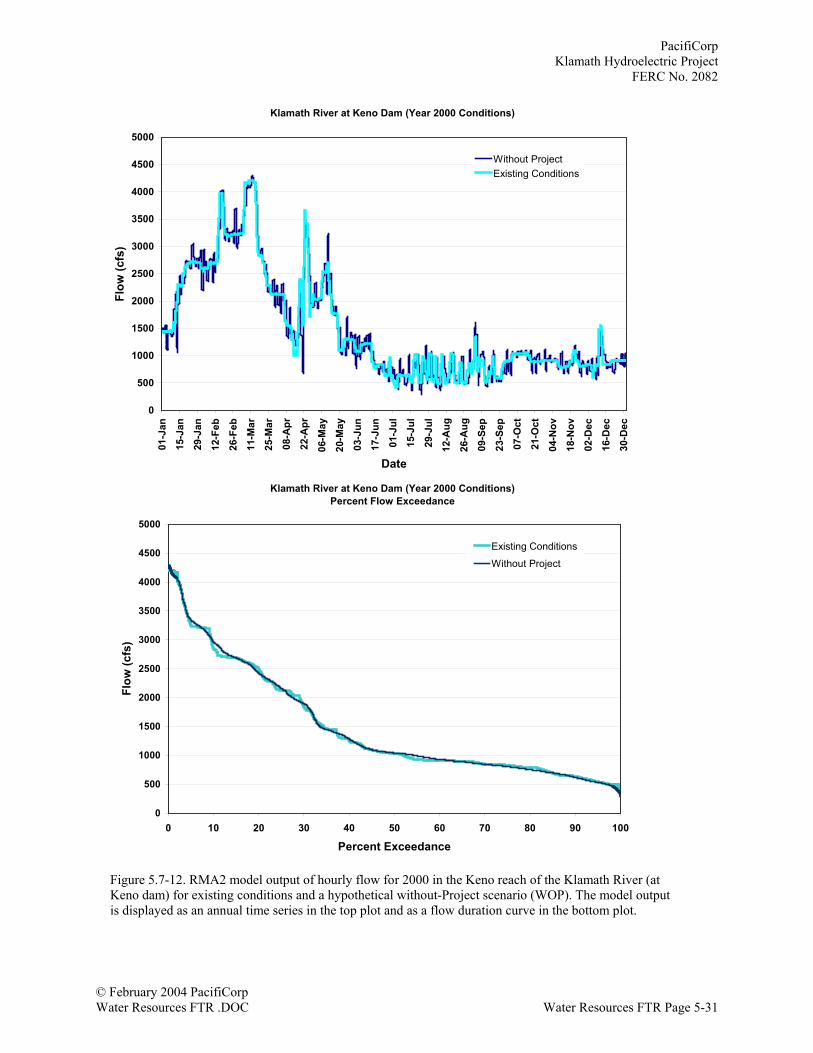
PacifiCorpKlamath Hydroelectric Project
FERC No. 2082
© February 2004 PacifiCorpWater Resources FTR .DOC Water Resources FTR Page 5-31
Klamath River at Keno Dam (Year 2000 Conditions)
0
500
1000
1500
2000
2500
3000
3500
4000
4500
5000
01-J
an
15-J
an
29-J
an
12-F
eb
26-F
eb
11-M
ar
25-M
ar
08-A
pr
22-A
pr
06-M
ay
20-M
ay
03-J
un
17-J
un
01-J
ul
15-J
ul
29-J
ul
12-A
ug
26-A
ug
09-S
ep
23-S
ep
07-O
ct
21-O
ct
04-N
ov
18-N
ov
02-D
ec
16-D
ec
30-D
ec
Date
Flow
(cfs
)
Without ProjectExisting Conditions
Klamath River at Keno Dam (Year 2000 Conditions)Percent Flow Exceedance
0
500
1000
1500
2000
2500
3000
3500
4000
4500
5000
0 10 20 30 40 50 60 70 80 90 100
Percent Exceedance
Flow
(cfs
)
Existing Conditions
Without Project
Figure 5.7-12. RMA2 model output of hourly flow for 2000 in the Keno reach of the Klamath River (atKeno dam) for existing conditions and a hypothetical without-Project scenario (WOP). The model outputis displayed as an annual time series in the top plot and as a flow duration curve in the bottom plot.
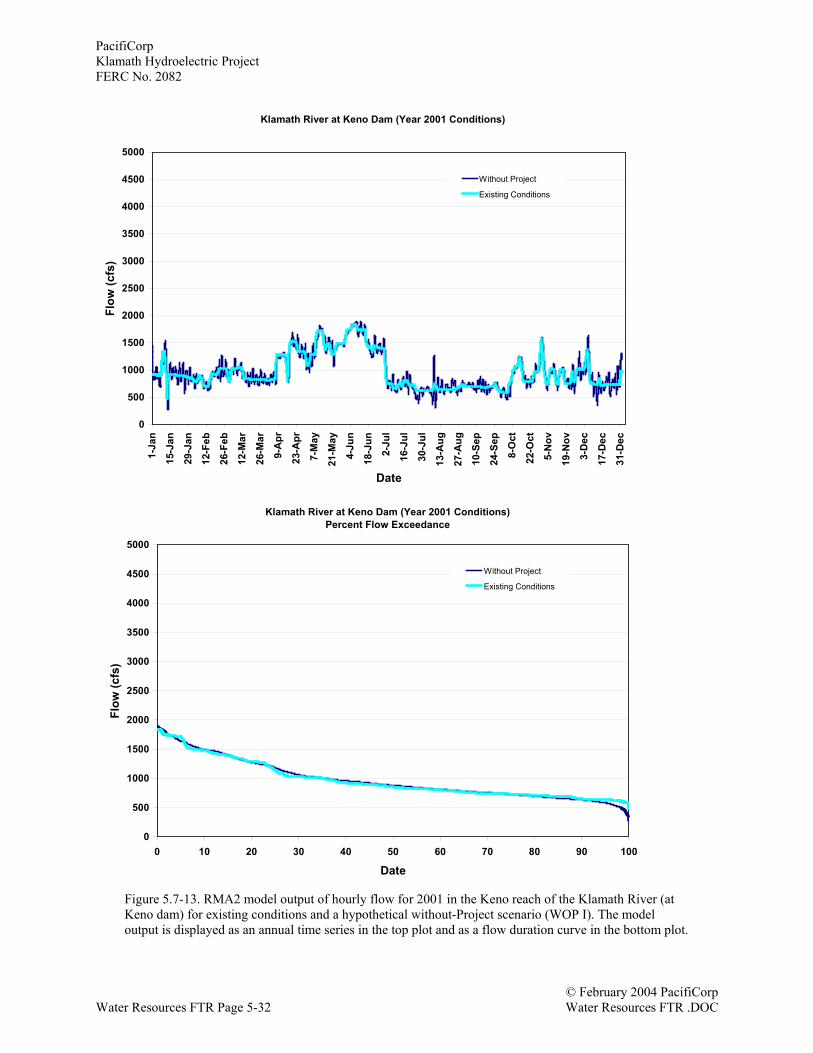
PacifiCorpKlamath Hydroelectric ProjectFERC No. 2082
© February 2004 PacifiCorpWater Resources FTR Page 5-32 Water Resources FTR .DOC
Klamath River at Keno Dam (Year 2001 Conditions)
0
500
1000
1500
2000
2500
3000
3500
4000
4500
50001-
Jan
15-J
an
29-J
an
12-F
eb
26-F
eb
12-M
ar
26-M
ar
9-A
pr
23-A
pr
7-M
ay
21-M
ay
4-Ju
n
18-J
un
2-Ju
l
16-J
ul
30-J
ul
13-A
ug
27-A
ug
10-S
ep
24-S
ep
8-O
ct
22-O
ct
5-N
ov
19-N
ov
3-D
ec
17-D
ec
31-D
ec
Date
Flow
(cfs
)
Without Project
Existing Conditions
Klamath River at Keno Dam (Year 2001 Conditions)Percent Flow Exceedance
0
500
1000
1500
2000
2500
3000
3500
4000
4500
5000
0 10 20 30 40 50 60 70 80 90 100
Date
Flow
(cfs
)
Without Project
Existing Conditions
Figure 5.7-13. RMA2 model output of hourly flow for 2001 in the Keno reach of the Klamath River (atKeno dam) for existing conditions and a hypothetical without-Project scenario (WOP I). The modeloutput is displayed as an annual time series in the top plot and as a flow duration curve in the bottom plot.
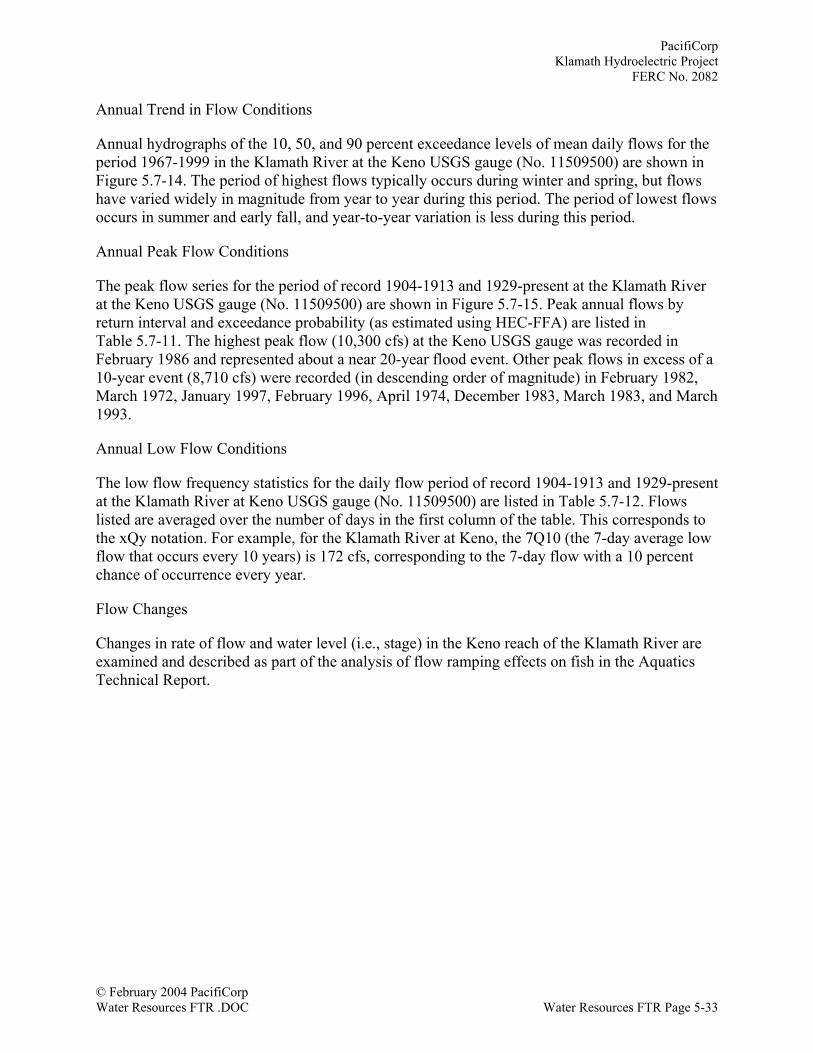
PacifiCorpKlamath Hydroelectric Project
FERC No. 2082
© February 2004 PacifiCorpWater Resources FTR .DOC Water Resources FTR Page 5-33
Annual Trend in Flow Conditions
Annual hydrographs of the 10, 50, and 90 percent exceedance levels of mean daily flows for theperiod 1967-1999 in the Klamath River at the Keno USGS gauge (No. 11509500) are shown inFigure 5.7-14. The period of highest flows typically occurs during winter and spring, but flowshave varied widely in magnitude from year to year during this period. The period of lowest flowsoccurs in summer and early fall, and year-to-year variation is less during this period.
Annual Peak Flow Conditions
The peak flow series for the period of record 1904-1913 and 1929-present at the Klamath Riverat the Keno USGS gauge (No. 11509500) are shown in Figure 5.7-15. Peak annual flows byreturn interval and exceedance probability (as estimated using HEC-FFA) are listed inTable 5.7-11. The highest peak flow (10,300 cfs) at the Keno USGS gauge was recorded inFebruary 1986 and represented about a near 20-year flood event. Other peak flows in excess of a10-year event (8,710 cfs) were recorded (in descending order of magnitude) in February 1982,March 1972, January 1997, February 1996, April 1974, December 1983, March 1983, and March1993.
Annual Low Flow Conditions
The low flow frequency statistics for the daily flow period of record 1904-1913 and 1929-presentat the Klamath River at Keno USGS gauge (No. 11509500) are listed in Table 5.7-12. Flowslisted are averaged over the number of days in the first column of the table. This corresponds tothe xQy notation. For example, for the Klamath River at Keno, the 7Q10 (the 7-day average lowflow that occurs every 10 years) is 172 cfs, corresponding to the 7-day flow with a 10 percentchance of occurrence every year.
Flow Changes
Changes in rate of flow and water level (i.e., stage) in the Keno reach of the Klamath River areexamined and described as part of the analysis of flow ramping effects on fish in the AquaticsTechnical Report.
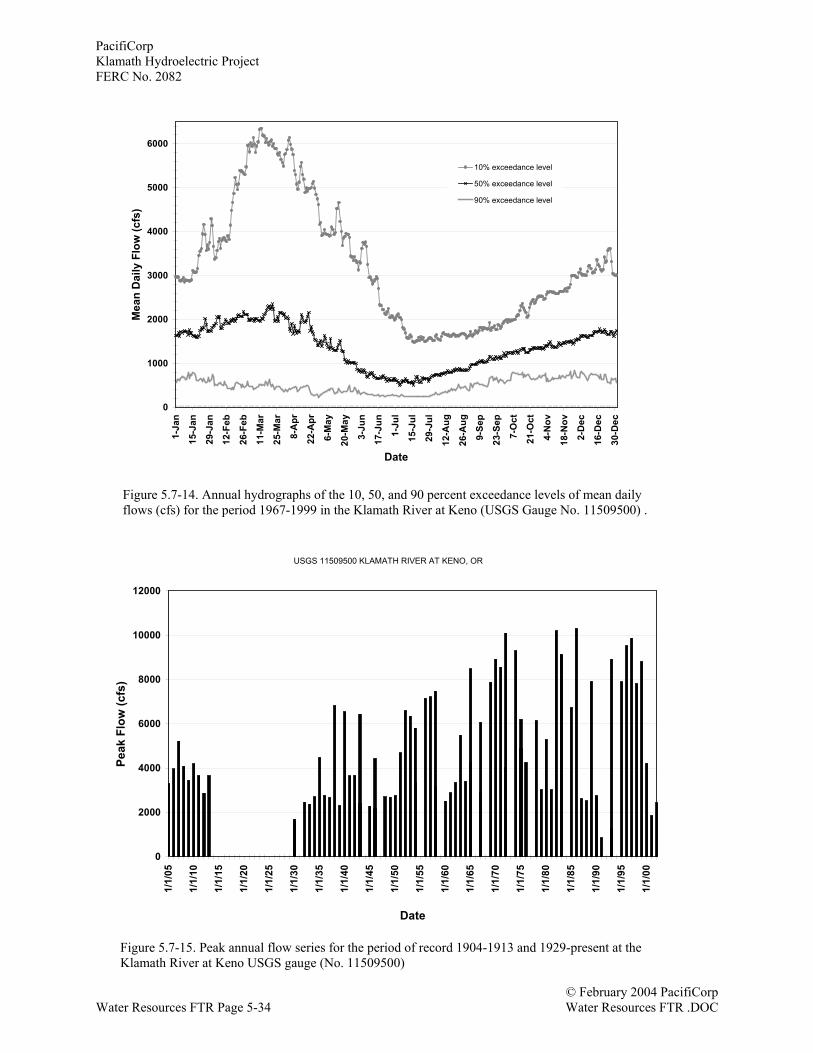
PacifiCorpKlamath Hydroelectric ProjectFERC No. 2082
© February 2004 PacifiCorpWater Resources FTR Page 5-34 Water Resources FTR .DOC
0
1000
2000
3000
4000
5000
6000
1-Ja
n
15-J
an
29-J
an
12-F
eb
26-F
eb
11-M
ar
25-M
ar
8-A
pr
22-A
pr
6-M
ay
20-M
ay
3-Ju
n
17-J
un
1-Ju
l
15-J
ul
29-J
ul
12-A
ug
26-A
ug
9-Se
p
23-S
ep
7-O
ct
21-O
ct
4-N
ov
18-N
ov
2-D
ec
16-D
ec
30-D
ec
Date
Mea
n D
aily
Flo
w (c
fs)
10% exceedance level
50% exceedance level
90% exceedance level
Figure 5.7-14. Annual hydrographs of the 10, 50, and 90 percent exceedance levels of mean dailyflows (cfs) for the period 1967-1999 in the Klamath River at Keno (USGS Gauge No. 11509500) .
USGS 11509500 KLAMATH RIVER AT KENO, OR
0
2000
4000
6000
8000
10000
12000
1/1/
05
1/1/
10
1/1/
15
1/1/
20
1/1/
25
1/1/
30
1/1/
35
1/1/
40
1/1/
45
1/1/
50
1/1/
55
1/1/
60
1/1/
65
1/1/
70
1/1/
75
1/1/
80
1/1/
85
1/1/
90
1/1/
95
1/1/
00
Date
Peak
Flo
w (c
fs)
Figure 5.7-15. Peak annual flow series for the period of record 1904-1913 and 1929-present at theKlamath River at Keno USGS gauge (No. 11509500)
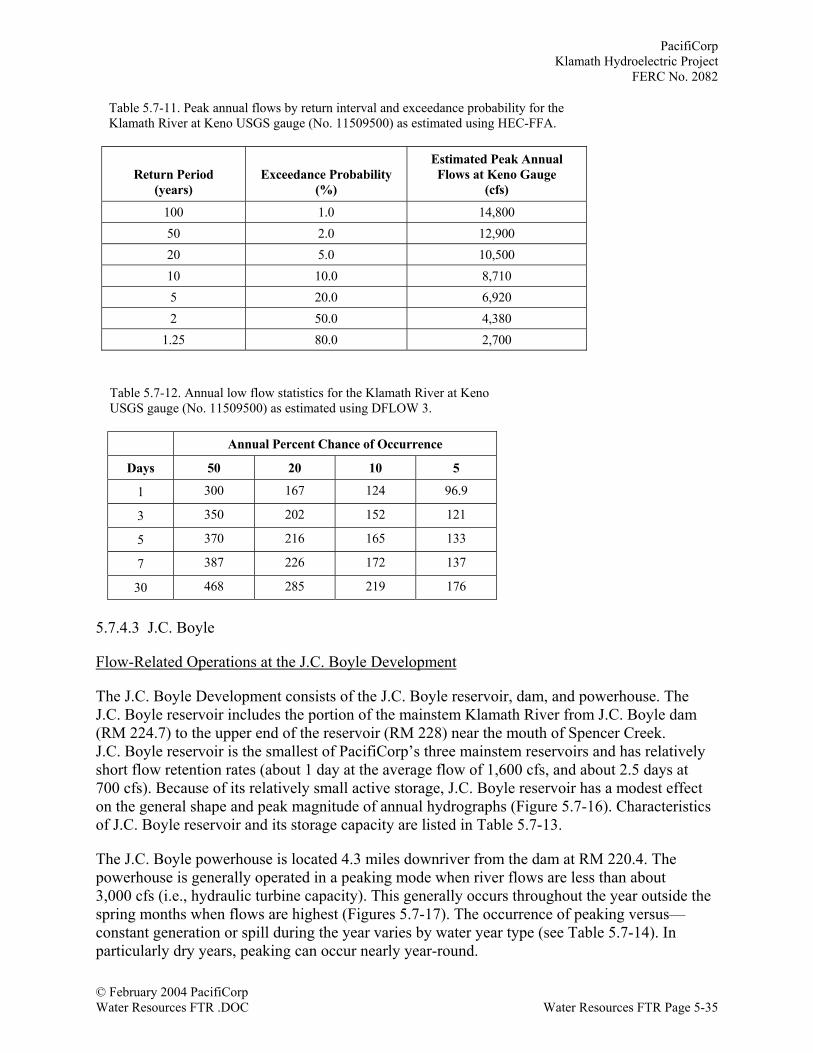
PacifiCorpKlamath Hydroelectric Project
FERC No. 2082
© February 2004 PacifiCorpWater Resources FTR .DOC Water Resources FTR Page 5-35
Table 5.7-11. Peak annual flows by return interval and exceedance probability for theKlamath River at Keno USGS gauge (No. 11509500) as estimated using HEC-FFA.
Return Period(years)
Exceedance Probability(%)
Estimated Peak AnnualFlows at Keno Gauge
(cfs)
100 1.0 14,80050 2.0 12,90020 5.0 10,50010 10.0 8,7105 20.0 6,9202 50.0 4,380
1.25 80.0 2,700
Table 5.7-12. Annual low flow statistics for the Klamath River at KenoUSGS gauge (No. 11509500) as estimated using DFLOW 3.
Annual Percent Chance of Occurrence
Days 50 20 10 5
1 300 167 124 96.9
3 350 202 152 121
5 370 216 165 133
7 387 226 172 137
30 468 285 219 176
5.7.4.3 J.C. Boyle
Flow-Related Operations at the J.C. Boyle Development
The J.C. Boyle Development consists of the J.C. Boyle reservoir, dam, and powerhouse. TheJ.C. Boyle reservoir includes the portion of the mainstem Klamath River from J.C. Boyle dam(RM 224.7) to the upper end of the reservoir (RM 228) near the mouth of Spencer Creek.J.C. Boyle reservoir is the smallest of PacifiCorp’s three mainstem reservoirs and has relativelyshort flow retention rates (about 1 day at the average flow of 1,600 cfs, and about 2.5 days at700 cfs). Because of its relatively small active storage, J.C. Boyle reservoir has a modest effecton the general shape and peak magnitude of annual hydrographs (Figure 5.7-16). Characteristicsof J.C. Boyle reservoir and its storage capacity are listed in Table 5.7-13.
The J.C. Boyle powerhouse is located 4.3 miles downriver from the dam at RM 220.4. Thepowerhouse is generally operated in a peaking mode when river flows are less than about3,000 cfs (i.e., hydraulic turbine capacity). This generally occurs throughout the year outside thespring months when flows are highest (Figures 5.7-17). The occurrence of peaking versus—constant generation or spill during the year varies by water year type (see Table 5.7-14). Inparticularly dry years, peaking can occur nearly year-round.
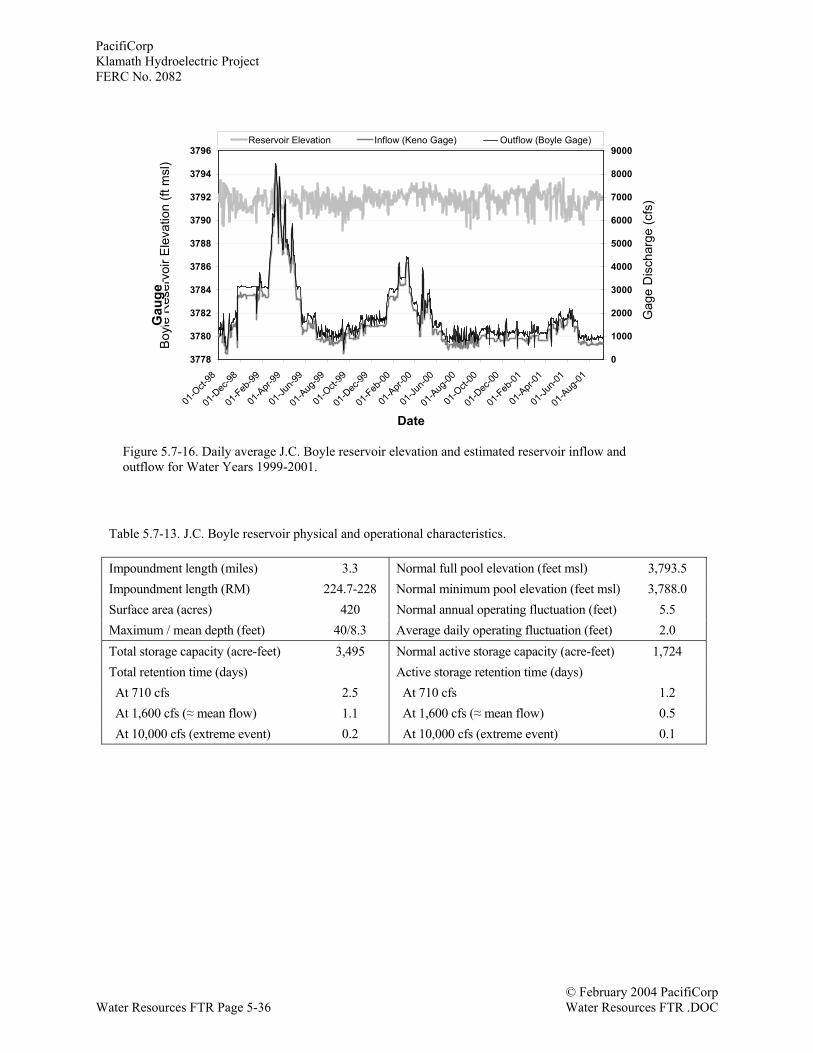
PacifiCorpKlamath Hydroelectric ProjectFERC No. 2082
© February 2004 PacifiCorpWater Resources FTR Page 5-36 Water Resources FTR .DOC
Table 5.7-13. J.C. Boyle reservoir physical and operational characteristics.
Impoundment length (miles) 3.3 Normal full pool elevation (feet msl) 3,793.5Impoundment length (RM) 224.7-228 Normal minimum pool elevation (feet msl) 3,788.0Surface area (acres) 420 Normal annual operating fluctuation (feet) 5.5Maximum / mean depth (feet) 40/8.3 Average daily operating fluctuation (feet) 2.0Total storage capacity (acre-feet) 3,495 Normal active storage capacity (acre-feet) 1,724Total retention time (days) Active storage retention time (days) At 710 cfs 2.5 At 710 cfs 1.2 At 1,600 cfs (≈ mean flow) 1.1 At 1,600 cfs (≈ mean flow) 0.5 At 10,000 cfs (extreme event) 0.2 At 10,000 cfs (extreme event) 0.1
3778
3780
3782
3784
3786
3788
3790
3792
3794
3796
01-O
ct-98
01-D
ec-98
01-F
eb-99
01-A
pr-99
01-Ju
n-99
01-A
ug-99
01-O
ct-99
01-D
ec-99
01-F
eb-00
01-A
pr-00
01-Ju
n-00
01-A
ug-00
01-O
ct-00
01-D
ec-00
01-F
eb-01
01-A
pr-01
01-Ju
n-01
01-A
ug-01
Date
Boy
le R
eser
voir
Ele
vatio
n (ft
msl
)
0
1000
2000
3000
4000
5000
6000
7000
8000
9000Reservoir Elevation Inflow (Keno Gage) Outflow (Boyle Gage)
Gag
e D
isch
arge
(cfs
)
Figure 5.7-16. Daily average J.C. Boyle reservoir elevation and estimated reservoir inflow andoutflow for Water Years 1999-2001.
Gau
ge
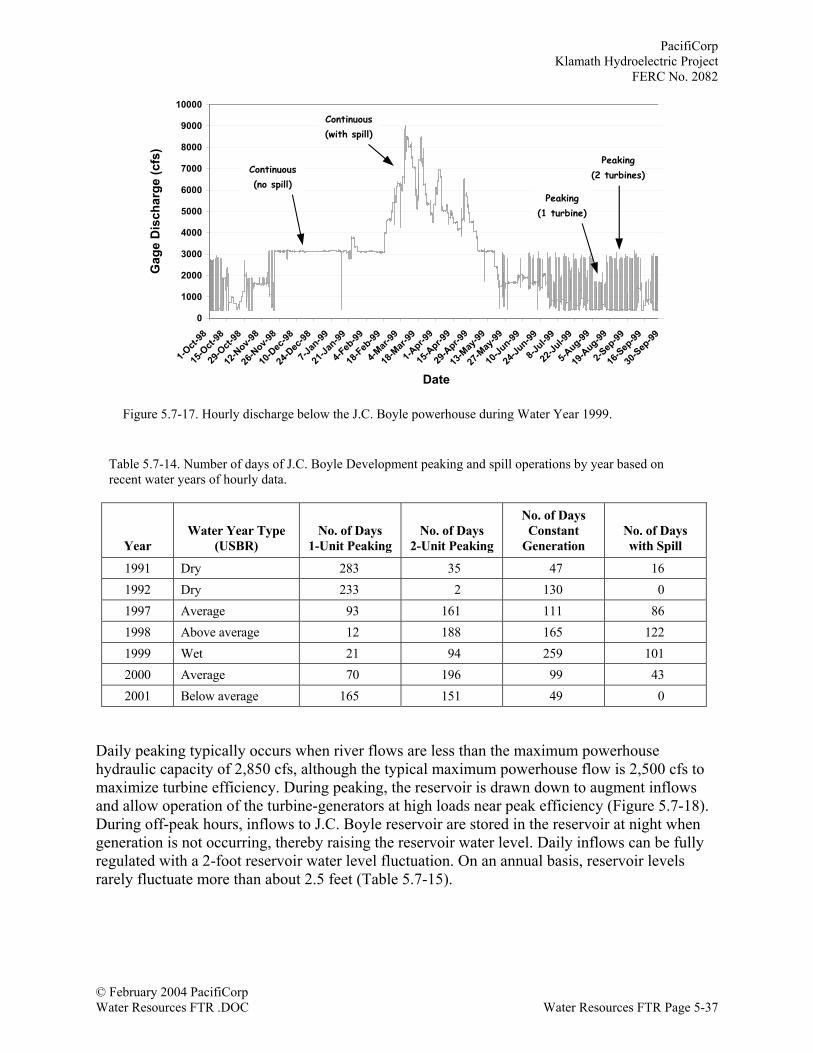
PacifiCorpKlamath Hydroelectric Project
FERC No. 2082
© February 2004 PacifiCorpWater Resources FTR .DOC Water Resources FTR Page 5-37
Table 5.7-14. Number of days of J.C. Boyle Development peaking and spill operations by year based onrecent water years of hourly data.
YearWater Year Type
(USBR)No. of Days
1-Unit PeakingNo. of Days
2-Unit Peaking
No. of DaysConstant
GenerationNo. of Dayswith Spill
1991 Dry 283 35 47 161992 Dry 233 2 130 01997 Average 93 161 111 861998 Above average 12 188 165 1221999 Wet 21 94 259 1012000 Average 70 196 99 432001 Below average 165 151 49 0
Daily peaking typically occurs when river flows are less than the maximum powerhousehydraulic capacity of 2,850 cfs, although the typical maximum powerhouse flow is 2,500 cfs tomaximize turbine efficiency. During peaking, the reservoir is drawn down to augment inflowsand allow operation of the turbine-generators at high loads near peak efficiency (Figure 5.7-18).During off-peak hours, inflows to J.C. Boyle reservoir are stored in the reservoir at night whengeneration is not occurring, thereby raising the reservoir water level. Daily inflows can be fullyregulated with a 2-foot reservoir water level fluctuation. On an annual basis, reservoir levelsrarely fluctuate more than about 2.5 feet (Table 5.7-15).
0
1000
2000
3000
4000
5000
6000
7000
8000
9000
10000
1-Oct-
98
15-O
ct-98
29-O
ct-98
12-N
ov-98
26-N
ov-98
10-D
ec-98
24-D
ec-98
7-Jan
-99
21-Ja
n-99
4-Feb
-99
18-Feb
-99
4-Mar-
99
18-M
ar-99
1-Apr-9
9
15-A
pr-99
29-A
pr-99
13-M
ay-99
27-M
ay-99
10-Ju
n-99
24-Ju
n-99
8-Jul-9
9
22-Ju
l-99
5-Aug-99
19-A
ug-99
2-Sep
-99
16-S
ep-99
30-S
ep-99
Date
Gag
e D
isch
arge
(cfs
)
Peaking(1 turbine)
Peaking(2 turbines)Continuous
(no spill)
Continuous(with spill)
Figure 5.7-17. Hourly discharge below the J.C. Boyle powerhouse during Water Year 1999.
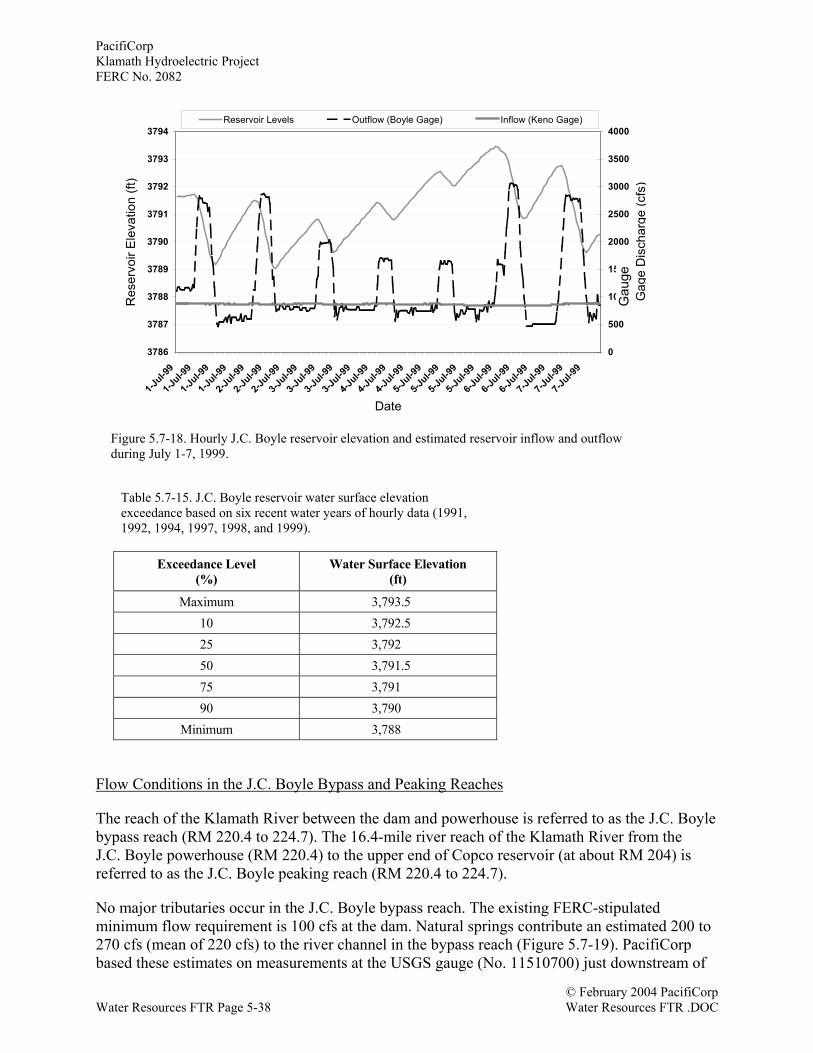
PacifiCorpKlamath Hydroelectric ProjectFERC No. 2082
© February 2004 PacifiCorpWater Resources FTR Page 5-38 Water Resources FTR .DOC
Table 5.7-15. J.C. Boyle reservoir water surface elevationexceedance based on six recent water years of hourly data (1991,1992, 1994, 1997, 1998, and 1999).
Exceedance Level(%)
Water Surface Elevation(ft)
Maximum 3,793.510 3,792.525 3,79250 3,791.575 3,79190 3,790
Minimum 3,788
Flow Conditions in the J.C. Boyle Bypass and Peaking Reaches
The reach of the Klamath River between the dam and powerhouse is referred to as the J.C. Boylebypass reach (RM 220.4 to 224.7). The 16.4-mile river reach of the Klamath River from theJ.C. Boyle powerhouse (RM 220.4) to the upper end of Copco reservoir (at about RM 204) isreferred to as the J.C. Boyle peaking reach (RM 220.4 to 224.7).
No major tributaries occur in the J.C. Boyle bypass reach. The existing FERC-stipulatedminimum flow requirement is 100 cfs at the dam. Natural springs contribute an estimated 200 to270 cfs (mean of 220 cfs) to the river channel in the bypass reach (Figure 5.7-19). PacifiCorpbased these estimates on measurements at the USGS gauge (No. 11510700) just downstream of
3786
3787
3788
3789
3790
3791
3792
3793
3794
1-Jul-9
9
1-Jul-9
9
1-Jul-9
9
1-Jul-9
9
2-Jul-9
9
2-Jul-9
9
2-Jul-9
9
3-Jul-9
9
3-Jul-9
9
3-Jul-9
9
3-Jul-9
9
4-Jul-9
9
4-Jul-9
9
4-Jul-9
9
5-Jul-9
9
5-Jul-9
9
5-Jul-9
9
5-Jul-9
9
6-Jul-9
9
6-Jul-9
9
6-Jul-9
9
7-Jul-9
9
7-Jul-9
9
7-Jul-9
9
Date
Res
ervo
ir E
leva
tion
(ft)
0
500
1000
1500
2000
2500
3000
3500
4000
Gag
e D
isch
arge
(cfs
)
Reservoir Levels Outflow (Boyle Gage) Inflow (Keno Gage)
Figure 5.7-18. Hourly J.C. Boyle reservoir elevation and estimated reservoir inflow and outflowduring July 1-7, 1999.
Gau
ge
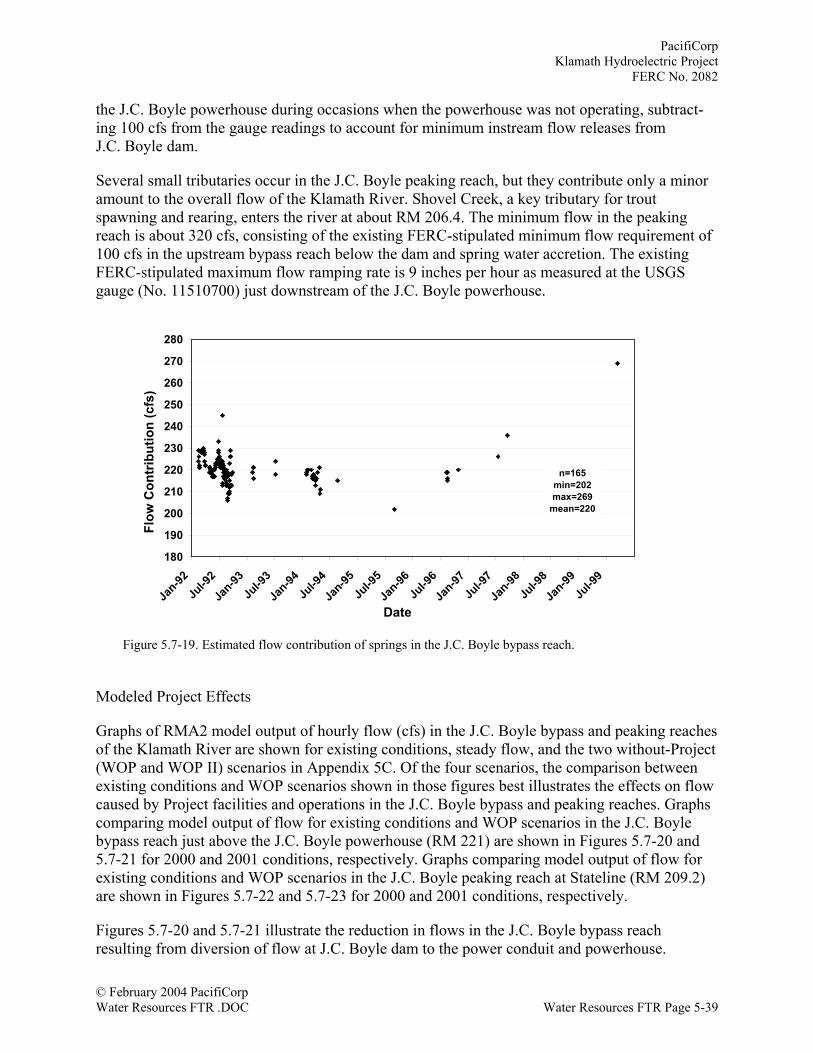
PacifiCorpKlamath Hydroelectric Project
FERC No. 2082
© February 2004 PacifiCorpWater Resources FTR .DOC Water Resources FTR Page 5-39
the J.C. Boyle powerhouse during occasions when the powerhouse was not operating, subtract-ing 100 cfs from the gauge readings to account for minimum instream flow releases fromJ.C. Boyle dam.
Several small tributaries occur in the J.C. Boyle peaking reach, but they contribute only a minoramount to the overall flow of the Klamath River. Shovel Creek, a key tributary for troutspawning and rearing, enters the river at about RM 206.4. The minimum flow in the peakingreach is about 320 cfs, consisting of the existing FERC-stipulated minimum flow requirement of100 cfs in the upstream bypass reach below the dam and spring water accretion. The existingFERC-stipulated maximum flow ramping rate is 9 inches per hour as measured at the USGSgauge (No. 11510700) just downstream of the J.C. Boyle powerhouse.
Modeled Project Effects
Graphs of RMA2 model output of hourly flow (cfs) in the J.C. Boyle bypass and peaking reachesof the Klamath River are shown for existing conditions, steady flow, and the two without-Project(WOP and WOP II) scenarios in Appendix 5C. Of the four scenarios, the comparison betweenexisting conditions and WOP scenarios shown in those figures best illustrates the effects on flowcaused by Project facilities and operations in the J.C. Boyle bypass and peaking reaches. Graphscomparing model output of flow for existing conditions and WOP scenarios in the J.C. Boylebypass reach just above the J.C. Boyle powerhouse (RM 221) are shown in Figures 5.7-20 and5.7-21 for 2000 and 2001 conditions, respectively. Graphs comparing model output of flow forexisting conditions and WOP scenarios in the J.C. Boyle peaking reach at Stateline (RM 209.2)are shown in Figures 5.7-22 and 5.7-23 for 2000 and 2001 conditions, respectively.
Figures 5.7-20 and 5.7-21 illustrate the reduction in flows in the J.C. Boyle bypass reachresulting from diversion of flow at J.C. Boyle dam to the power conduit and powerhouse.
180
190
200
210
220
230
240
250
260
270
280
Jan-92
Jul-9
2
Jan-93
Jul-9
3
Jan-94
Jul-9
4
Jan-95
Jul-9
5
Jan-96
Jul-9
6
Jan-97
Jul-9
7
Jan-98
Jul-9
8
Jan-99
Jul-9
9
Date
Flow
Con
trib
utio
n (c
fs)
n=165min=202max=269
mean=220
Figure 5.7-19. Estimated flow contribution of springs in the J.C. Boyle bypass reach.
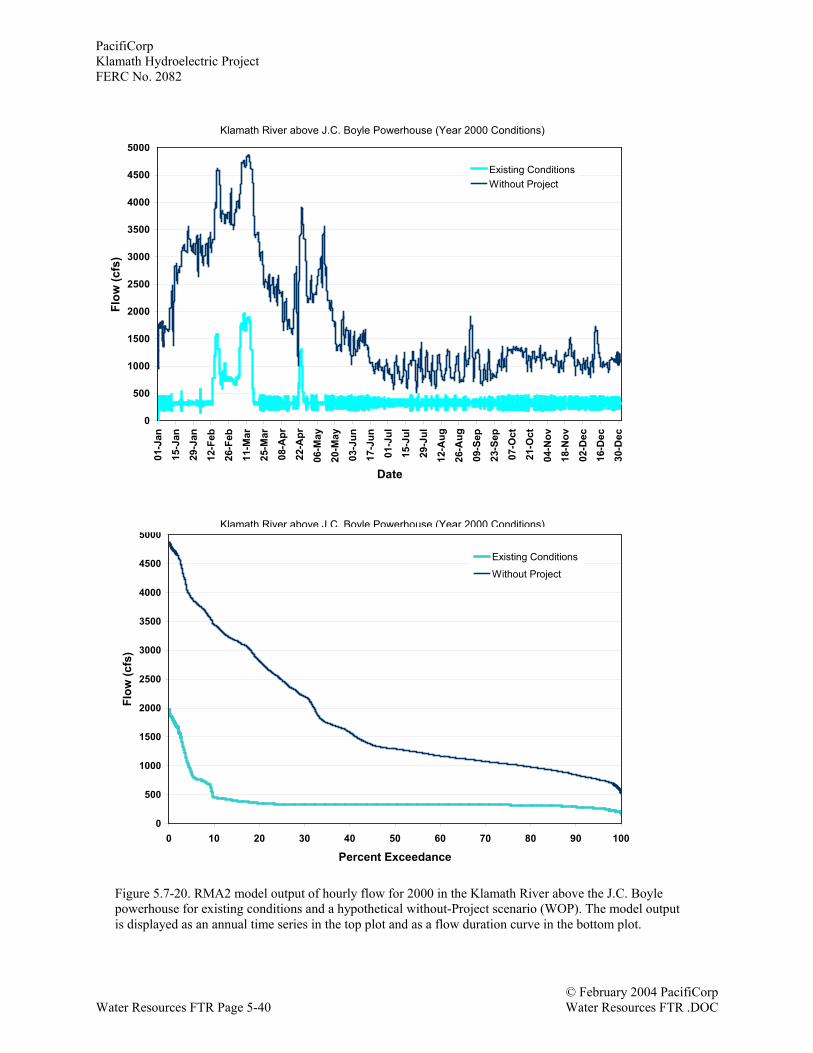
PacifiCorpKlamath Hydroelectric ProjectFERC No. 2082
© February 2004 PacifiCorpWater Resources FTR Page 5-40 Water Resources FTR .DOC
Figure 5.7-20. RMA2 model output of hourly flow for 2000 in the Klamath River above the J.C. Boylepowerhouse for existing conditions and a hypothetical without-Project scenario (WOP). The model outputis displayed as an annual time series in the top plot and as a flow duration curve in the bottom plot.
0
500
1000
1500
2000
2500
3000
3500
4000
4500
500001
-Jan
15-J
an
29-J
an
12-F
eb
26-F
eb
11-M
ar
25-M
ar
08-A
pr
22-A
pr
06-M
ay
20-M
ay
03-J
un
17-J
un
01-J
ul
15-J
ul
29-J
ul
12-A
ug
26-A
ug
09-S
ep
23-S
ep
07-O
ct
21-O
ct
04-N
ov
18-N
ov
02-D
ec
16-D
ec
30-D
ec
Date
Flow
(cfs
)
Existing ConditionsWithout Project
0
500
1000
1500
2000
2500
3000
3500
4000
4500
5000
0 10 20 30 40 50 60 70 80 90 100
Percent Exceedance
Flow
(cfs
)
Existing Conditions
Without Project
Klamath River above J.C. Boyle Powerhouse (Year 2000 Conditions)
Klamath River above J.C. Boyle Powerhouse (Year 2000 Conditions)
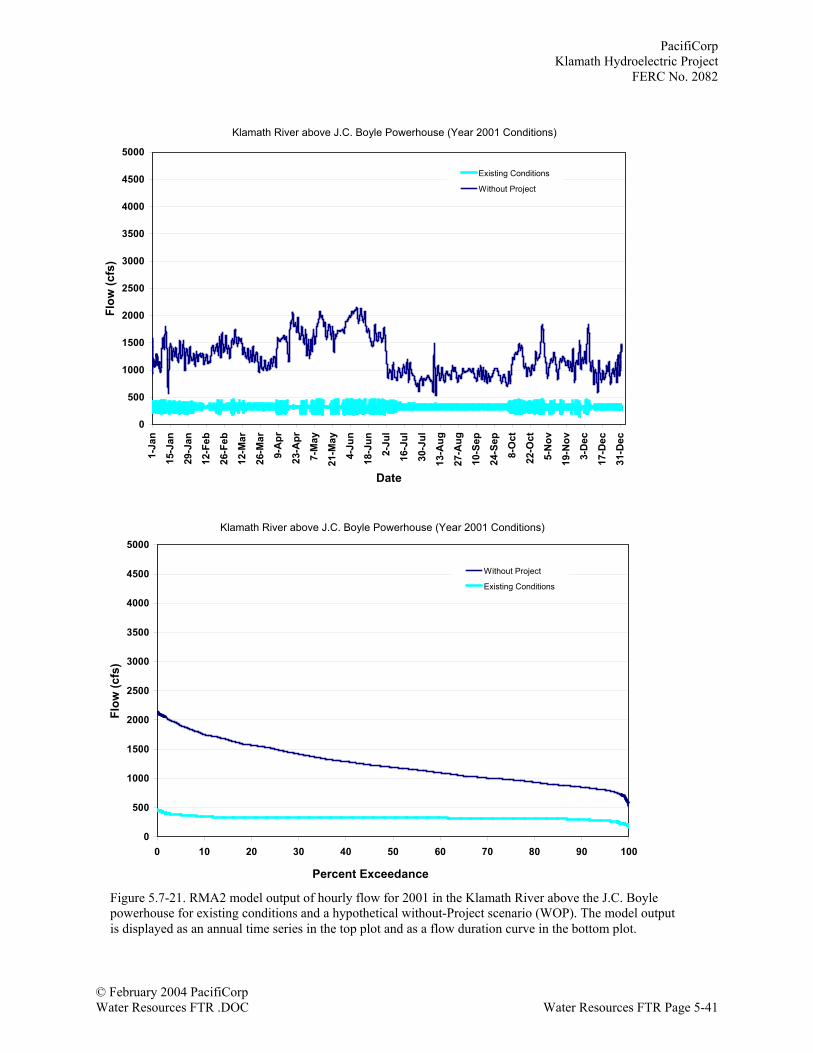
PacifiCorpKlamath Hydroelectric Project
FERC No. 2082
© February 2004 PacifiCorpWater Resources FTR .DOC Water Resources FTR Page 5-41
Klamath River above JC Boyle Powerhouse (Year 2001 Conditions)
0
500
1000
1500
2000
2500
3000
3500
4000
4500
50001-
Jan
15-J
an
29-J
an
12-F
eb
26-F
eb
12-M
ar
26-M
ar
9-A
pr
23-A
pr
7-M
ay
21-M
ay
4-Ju
n
18-J
un
2-Ju
l
16-J
ul
30-J
ul
13-A
ug
27-A
ug
10-S
ep
24-S
ep
8-O
ct
22-O
ct
5-N
ov
19-N
ov
3-D
ec
17-D
ec
31-D
ec
Date
Flow
(cfs
)
Existing Conditions
Without Project
Klamath River above JC Boyle Powerhouse (Year 2001 Conditions)Percent Flow Exceedance
0
500
1000
1500
2000
2500
3000
3500
4000
4500
5000
0 10 20 30 40 50 60 70 80 90 100
Date
Flow
(cfs
)
Without Project
Existing Conditions
Figure 5.7-21. RMA2 model output of hourly flow for 2001 in the Klamath River above the J.C. Boylepowerhouse for existing conditions and a hypothetical without-Project scenario (WOP). The model outputis displayed as an annual time series in the top plot and as a flow duration curve in the bottom plot.
Klamath River above J.C. Boyle Powerhouse (Year 2001 Conditions)
Klamath River above J.C. Boyle Powerhouse (Year 2001 Conditions)
Percent Exceedance
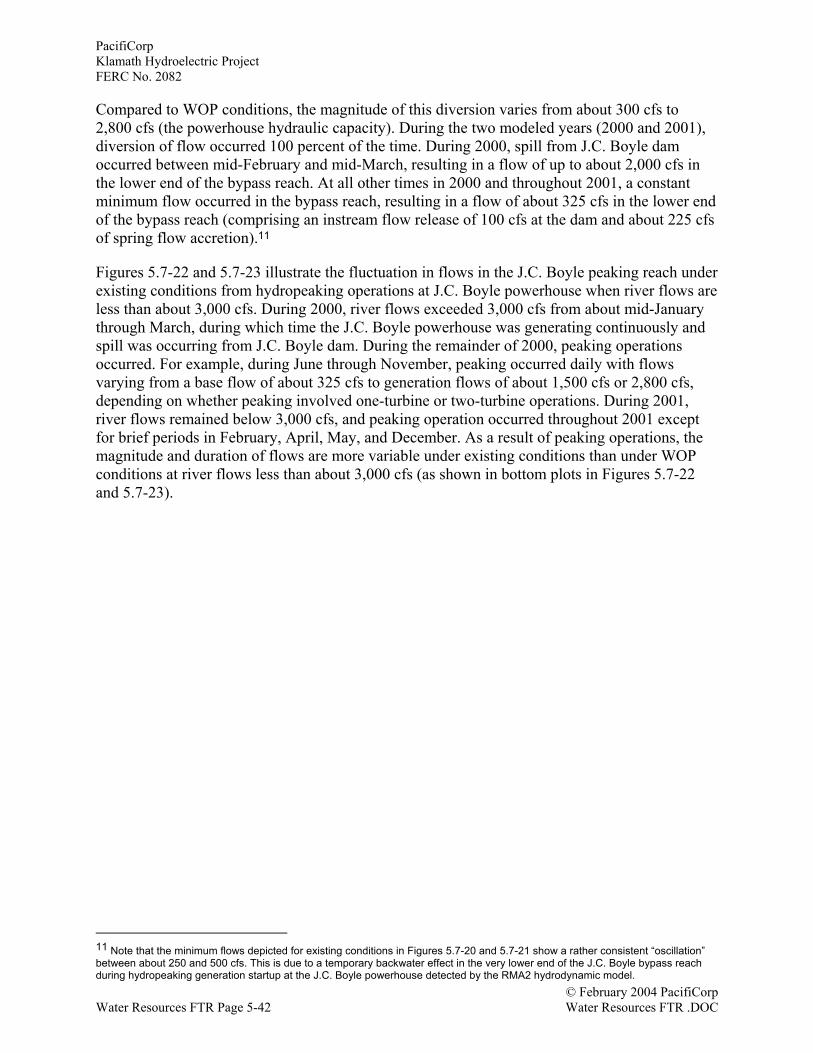
PacifiCorpKlamath Hydroelectric ProjectFERC No. 2082
© February 2004 PacifiCorpWater Resources FTR Page 5-42 Water Resources FTR .DOC
Compared to WOP conditions, the magnitude of this diversion varies from about 300 cfs to2,800 cfs (the powerhouse hydraulic capacity). During the two modeled years (2000 and 2001),diversion of flow occurred 100 percent of the time. During 2000, spill from J.C. Boyle damoccurred between mid-February and mid-March, resulting in a flow of up to about 2,000 cfs inthe lower end of the bypass reach. At all other times in 2000 and throughout 2001, a constantminimum flow occurred in the bypass reach, resulting in a flow of about 325 cfs in the lower endof the bypass reach (comprising an instream flow release of 100 cfs at the dam and about 225 cfsof spring flow accretion).11
Figures 5.7-22 and 5.7-23 illustrate the fluctuation in flows in the J.C. Boyle peaking reach underexisting conditions from hydropeaking operations at J.C. Boyle powerhouse when river flows areless than about 3,000 cfs. During 2000, river flows exceeded 3,000 cfs from about mid-Januarythrough March, during which time the J.C. Boyle powerhouse was generating continuously andspill was occurring from J.C. Boyle dam. During the remainder of 2000, peaking operationsoccurred. For example, during June through November, peaking occurred daily with flowsvarying from a base flow of about 325 cfs to generation flows of about 1,500 cfs or 2,800 cfs,depending on whether peaking involved one-turbine or two-turbine operations. During 2001,river flows remained below 3,000 cfs, and peaking operation occurred throughout 2001 exceptfor brief periods in February, April, May, and December. As a result of peaking operations, themagnitude and duration of flows are more variable under existing conditions than under WOPconditions at river flows less than about 3,000 cfs (as shown in bottom plots in Figures 5.7-22and 5.7-23).
11 Note that the minimum flows depicted for existing conditions in Figures 5.7-20 and 5.7-21 show a rather consistent “oscillation”between about 250 and 500 cfs. This is due to a temporary backwater effect in the very lower end of the J.C. Boyle bypass reachduring hydropeaking generation startup at the J.C. Boyle powerhouse detected by the RMA2 hydrodynamic model.
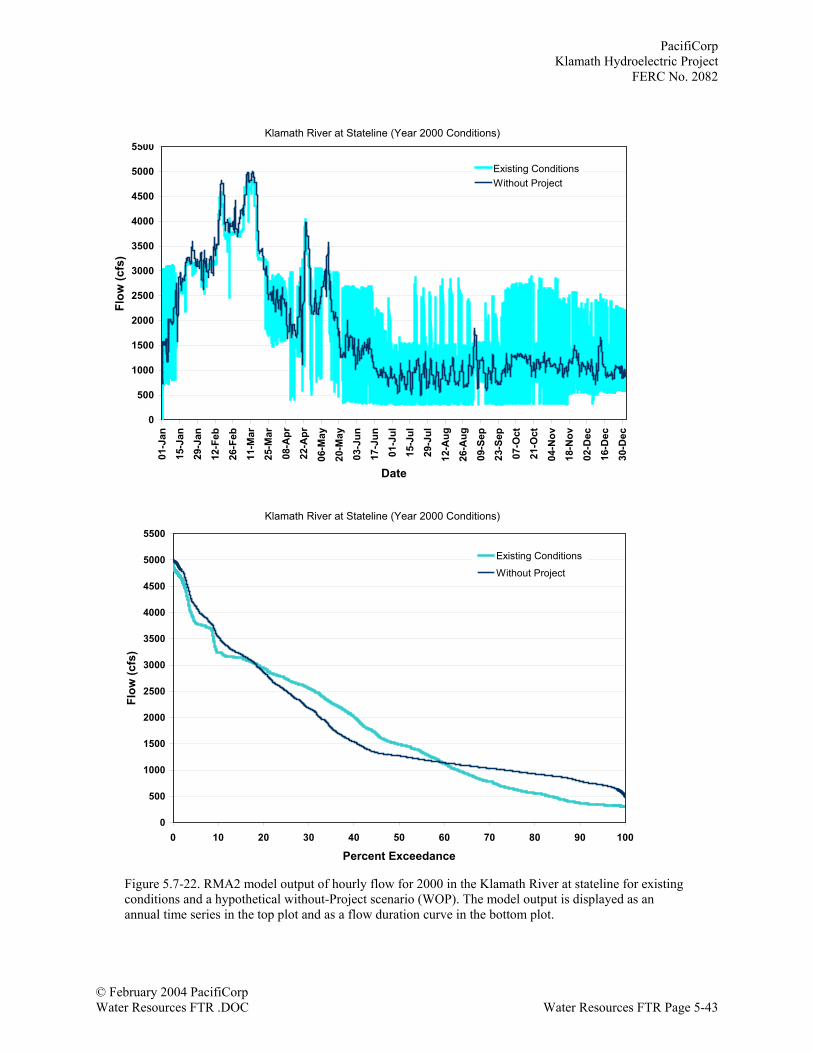
PacifiCorpKlamath Hydroelectric Project
FERC No. 2082
© February 2004 PacifiCorpWater Resources FTR .DOC Water Resources FTR Page 5-43
Klamath River at Stateline (Year 2000 Conditions)
0
500
1000
1500
2000
2500
3000
3500
4000
4500
5000
550001
-Jan
15-J
an
29-J
an
12-F
eb
26-F
eb
11-M
ar
25-M
ar
08-A
pr
22-A
pr
06-M
ay
20-M
ay
03-J
un
17-J
un
01-J
ul
15-J
ul
29-J
ul
12-A
ug
26-A
ug
09-S
ep
23-S
ep
07-O
ct
21-O
ct
04-N
ov
18-N
ov
02-D
ec
16-D
ec
30-D
ec
Date
Flow
(cfs
)
Existing ConditionsWithout Project
Klamath River at Stateline (Year 2000 Conditions)Percent Flow Exceedance
0
500
1000
1500
2000
2500
3000
3500
4000
4500
5000
5500
0 10 20 30 40 50 60 70 80 90 100
Percent Exceedance
Flow
(cfs
)
Existing Conditions
Without Project
Figure 5.7-22. RMA2 model output of hourly flow for 2000 in the Klamath River at stateline for existingconditions and a hypothetical without-Project scenario (WOP). The model output is displayed as anannual time series in the top plot and as a flow duration curve in the bottom plot.
Klamath River at Stateline (Year 2000 Conditions)
Klamath River at Stateline (Year 2000 Conditions)
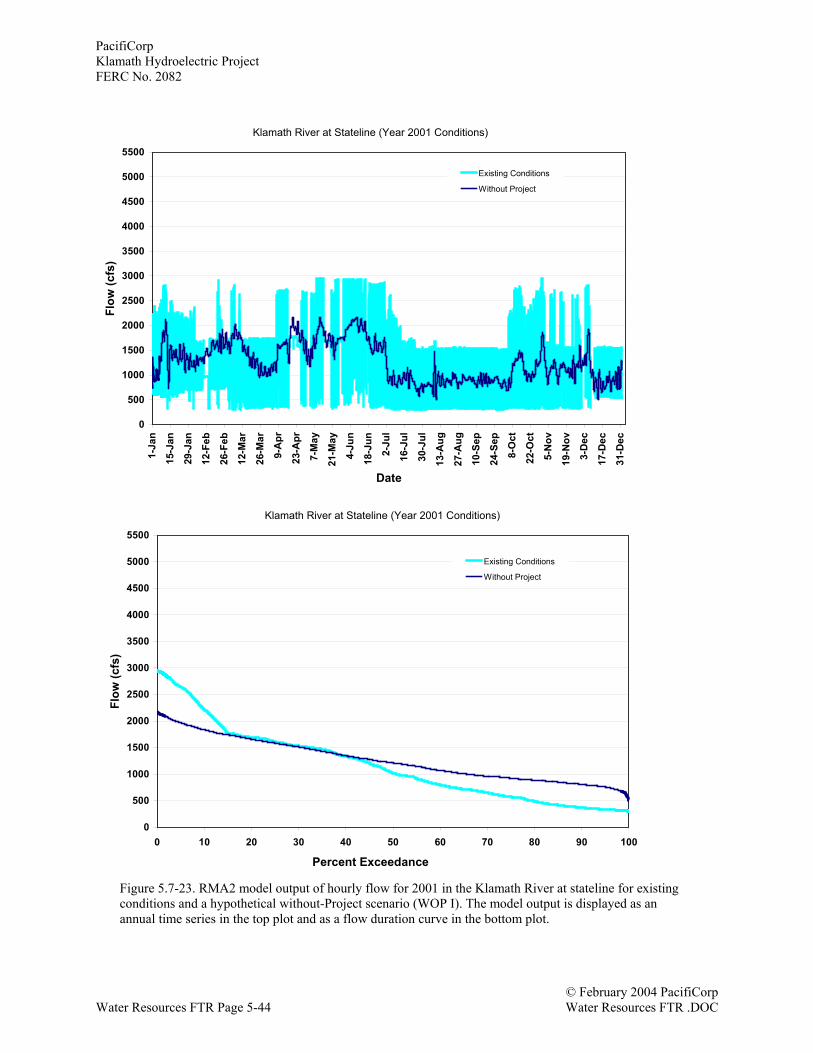
PacifiCorpKlamath Hydroelectric ProjectFERC No. 2082
© February 2004 PacifiCorpWater Resources FTR Page 5-44 Water Resources FTR .DOC
Klamath River at Stateline (Year 2001 Conditions)
0
500
1000
1500
2000
2500
3000
3500
4000
4500
5000
55001-
Jan
15-J
an
29-J
an
12-F
eb
26-F
eb
12-M
ar
26-M
ar
9-A
pr
23-A
pr
7-M
ay
21-M
ay
4-Ju
n
18-J
un
2-Ju
l
16-J
ul
30-J
ul
13-A
ug
27-A
ug
10-S
ep
24-S
ep
8-O
ct
22-O
ct
5-N
ov
19-N
ov
3-D
ec
17-D
ec
31-D
ec
Date
Flow
(cfs
)
Existing Conditions
Without Project
Klamath River at Stateline (Year 2001 Conditions)Percent Flow Exceedance
0
500
1000
1500
2000
2500
3000
3500
4000
4500
5000
5500
0 10 20 30 40 50 60 70 80 90 100
Date
Flow
(cfs
)
Existing Conditions
Without Project
Figure 5.7-23. RMA2 model output of hourly flow for 2001 in the Klamath River at stateline for existingconditions and a hypothetical without-Project scenario (WOP I). The model output is displayed as anannual time series in the top plot and as a flow duration curve in the bottom plot.
Klamath River at Stateline (Year 2001 Conditions)
Klamath River at Stateline (Year 2001 Conditions)
Percent Exceedance
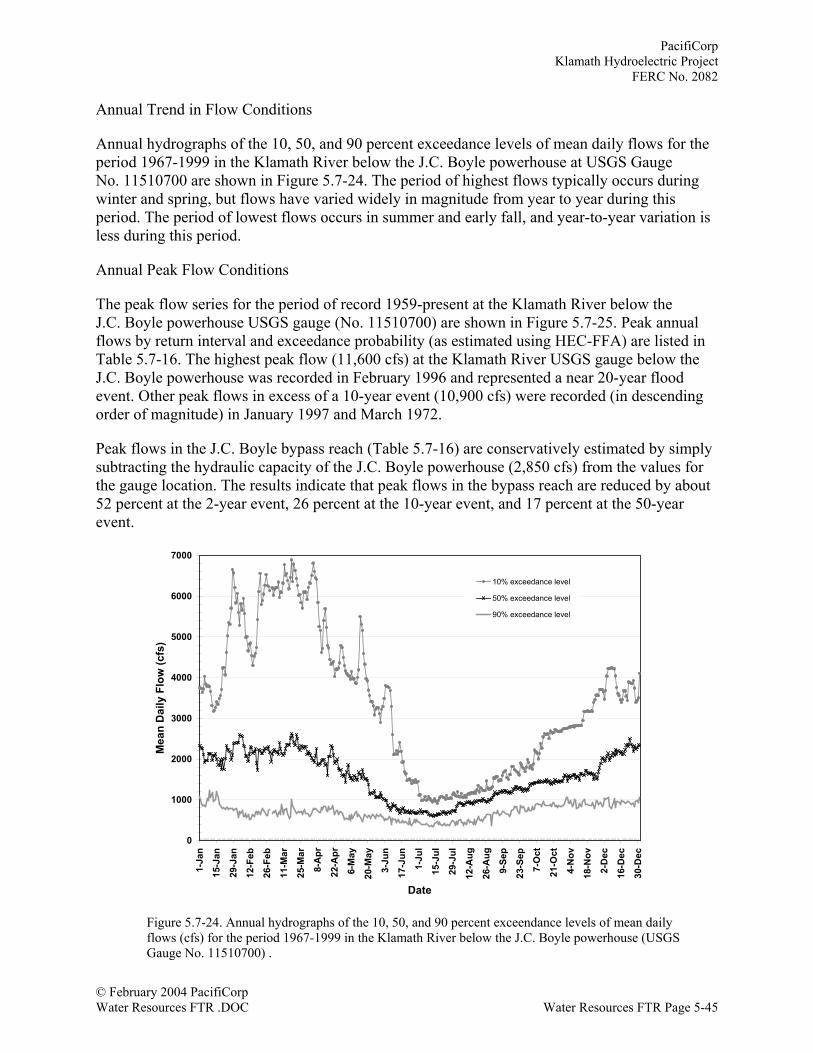
PacifiCorpKlamath Hydroelectric Project
FERC No. 2082
© February 2004 PacifiCorpWater Resources FTR .DOC Water Resources FTR Page 5-45
Annual Trend in Flow Conditions
Annual hydrographs of the 10, 50, and 90 percent exceedance levels of mean daily flows for theperiod 1967-1999 in the Klamath River below the J.C. Boyle powerhouse at USGS GaugeNo. 11510700 are shown in Figure 5.7-24. The period of highest flows typically occurs duringwinter and spring, but flows have varied widely in magnitude from year to year during thisperiod. The period of lowest flows occurs in summer and early fall, and year-to-year variation isless during this period.
Annual Peak Flow Conditions
The peak flow series for the period of record 1959-present at the Klamath River below theJ.C. Boyle powerhouse USGS gauge (No. 11510700) are shown in Figure 5.7-25. Peak annualflows by return interval and exceedance probability (as estimated using HEC-FFA) are listed inTable 5.7-16. The highest peak flow (11,600 cfs) at the Klamath River USGS gauge below theJ.C. Boyle powerhouse was recorded in February 1996 and represented a near 20-year floodevent. Other peak flows in excess of a 10-year event (10,900 cfs) were recorded (in descendingorder of magnitude) in January 1997 and March 1972.
Peak flows in the J.C. Boyle bypass reach (Table 5.7-16) are conservatively estimated by simplysubtracting the hydraulic capacity of the J.C. Boyle powerhouse (2,850 cfs) from the values forthe gauge location. The results indicate that peak flows in the bypass reach are reduced by about52 percent at the 2-year event, 26 percent at the 10-year event, and 17 percent at the 50-yearevent.
0
1000
2000
3000
4000
5000
6000
7000
1-Ja
n
15-J
an
29-J
an
12-F
eb
26-F
eb
11-M
ar
25-M
ar
8-A
pr
22-A
pr
6-M
ay
20-M
ay
3-Ju
n
17-J
un
1-Ju
l
15-J
ul
29-J
ul
12-A
ug
26-A
ug
9-Se
p
23-S
ep
7-O
ct
21-O
ct
4-N
ov
18-N
ov
2-D
ec
16-D
ec
30-D
ec
Date
Mea
n D
aily
Flo
w (c
fs)
10% exceedance level
50% exceedance level
90% exceedance level
Figure 5.7-24. Annual hydrographs of the 10, 50, and 90 percent exceendance levels of mean dailyflows (cfs) for the period 1967-1999 in the Klamath River below the J.C. Boyle powerhouse (USGSGauge No. 11510700) .
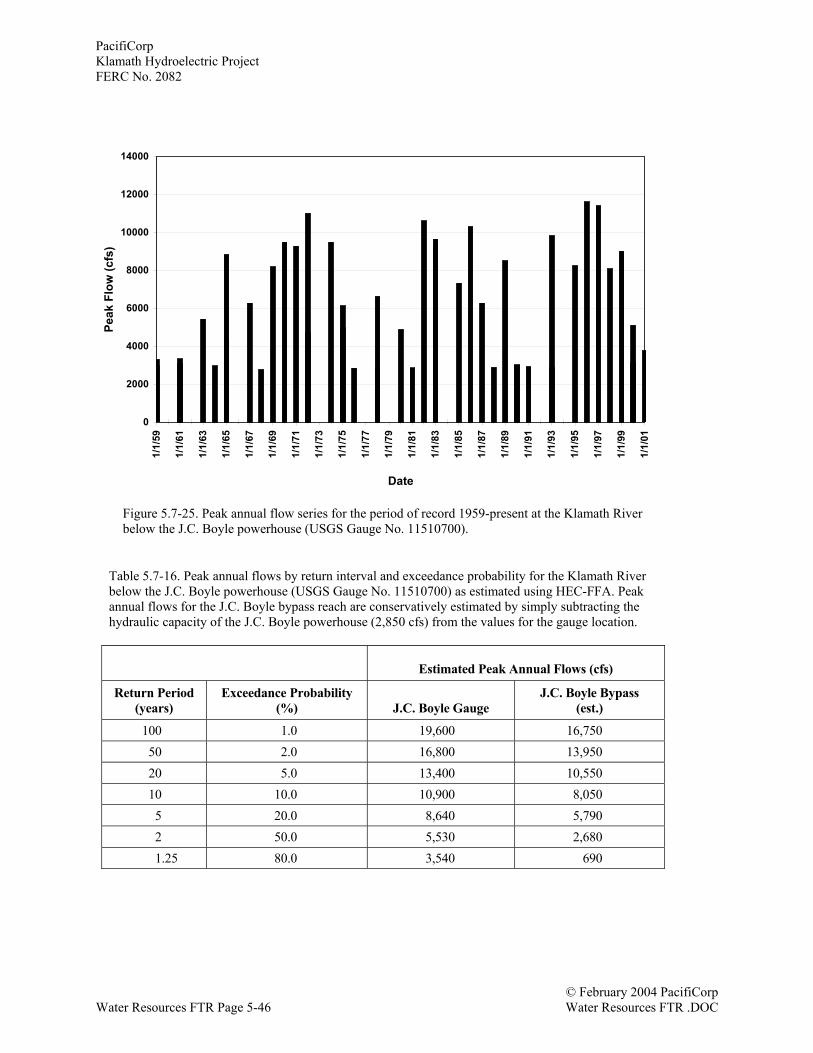
PacifiCorpKlamath Hydroelectric ProjectFERC No. 2082
© February 2004 PacifiCorpWater Resources FTR Page 5-46 Water Resources FTR .DOC
Table 5.7-16. Peak annual flows by return interval and exceedance probability for the Klamath Riverbelow the J.C. Boyle powerhouse (USGS Gauge No. 11510700) as estimated using HEC-FFA. Peakannual flows for the J.C. Boyle bypass reach are conservatively estimated by simply subtracting thehydraulic capacity of the J.C. Boyle powerhouse (2,850 cfs) from the values for the gauge location.
Estimated Peak Annual Flows (cfs)
Return Period(years)
Exceedance Probability(%) J.C. Boyle Gauge
J.C. Boyle Bypass(est.)
100 1.0 19,600 16,75050 2.0 16,800 13,95020 5.0 13,400 10,55010 10.0 10,900 8,0505 20.0 8,640 5,7902 50.0 5,530 2,6801.25 80.0 3,540 690
USGS 11510700 KLAMATH RIVER BLW JOHN C.BOYLE PWRPLNT, NR KENO,OR
0
2000
4000
6000
8000
10000
12000
140001/
1/59
1/1/
61
1/1/
63
1/1/
65
1/1/
67
1/1/
69
1/1/
71
1/1/
73
1/1/
75
1/1/
77
1/1/
79
1/1/
81
1/1/
83
1/1/
85
1/1/
87
1/1/
89
1/1/
91
1/1/
93
1/1/
95
1/1/
97
1/1/
99
1/1/
01
Date
Peak
Flo
w (c
fs)
Figure 5.7-25. Peak annual flow series for the period of record 1959-present at the Klamath Riverbelow the J.C. Boyle powerhouse (USGS Gauge No. 11510700).
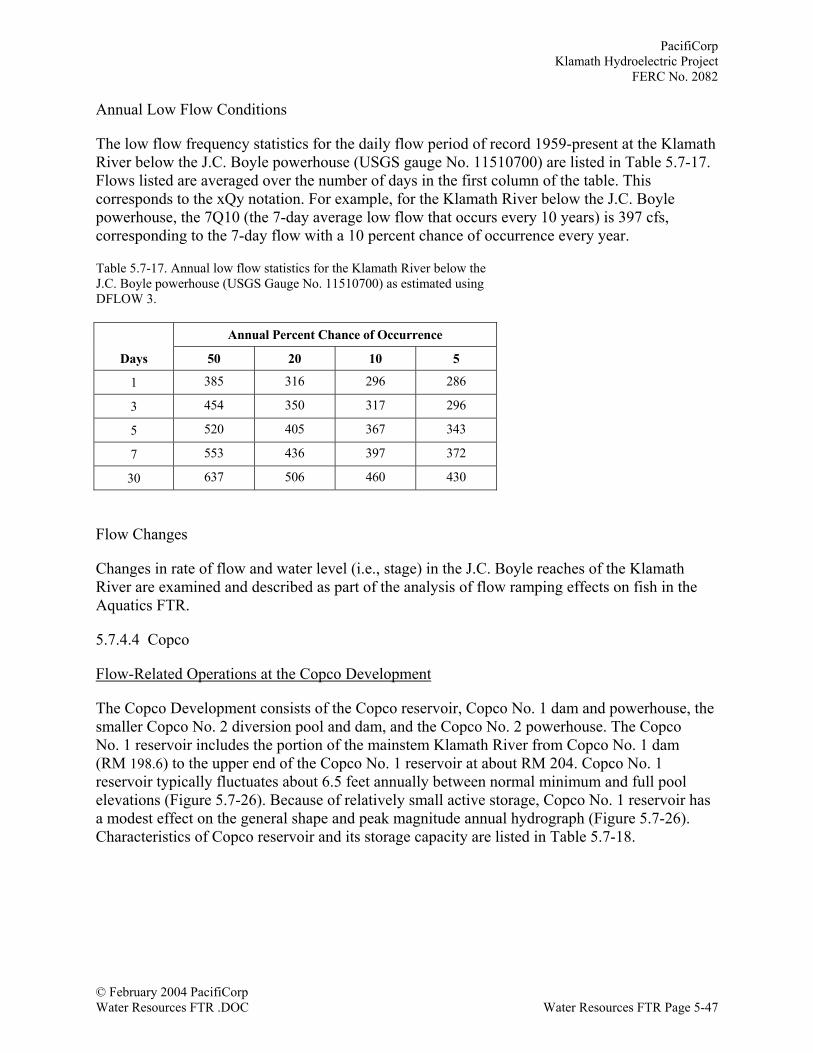
PacifiCorpKlamath Hydroelectric Project
FERC No. 2082
© February 2004 PacifiCorpWater Resources FTR .DOC Water Resources FTR Page 5-47
Annual Low Flow Conditions
The low flow frequency statistics for the daily flow period of record 1959-present at the KlamathRiver below the J.C. Boyle powerhouse (USGS gauge No. 11510700) are listed in Table 5.7-17.Flows listed are averaged over the number of days in the first column of the table. Thiscorresponds to the xQy notation. For example, for the Klamath River below the J.C. Boylepowerhouse, the 7Q10 (the 7-day average low flow that occurs every 10 years) is 397 cfs,corresponding to the 7-day flow with a 10 percent chance of occurrence every year.
Table 5.7-17. Annual low flow statistics for the Klamath River below theJ.C. Boyle powerhouse (USGS Gauge No. 11510700) as estimated usingDFLOW 3.
Annual Percent Chance of Occurrence
Days 50 20 10 5
1 385 316 296 286
3 454 350 317 296
5 520 405 367 343
7 553 436 397 372
30 637 506 460 430
Flow Changes
Changes in rate of flow and water level (i.e., stage) in the J.C. Boyle reaches of the KlamathRiver are examined and described as part of the analysis of flow ramping effects on fish in theAquatics FTR.
5.7.4.4 Copco
Flow-Related Operations at the Copco Development
The Copco Development consists of the Copco reservoir, Copco No. 1 dam and powerhouse, thesmaller Copco No. 2 diversion pool and dam, and the Copco No. 2 powerhouse. The CopcoNo. 1 reservoir includes the portion of the mainstem Klamath River from Copco No. 1 dam(RM 198.6) to the upper end of the Copco No. 1 reservoir at about RM 204. Copco No. 1reservoir typically fluctuates about 6.5 feet annually between normal minimum and full poolelevations (Figure 5.7-26). Because of relatively small active storage, Copco No. 1 reservoir hasa modest effect on the general shape and peak magnitude annual hydrograph (Figure 5.7-26).Characteristics of Copco reservoir and its storage capacity are listed in Table 5.7-18.
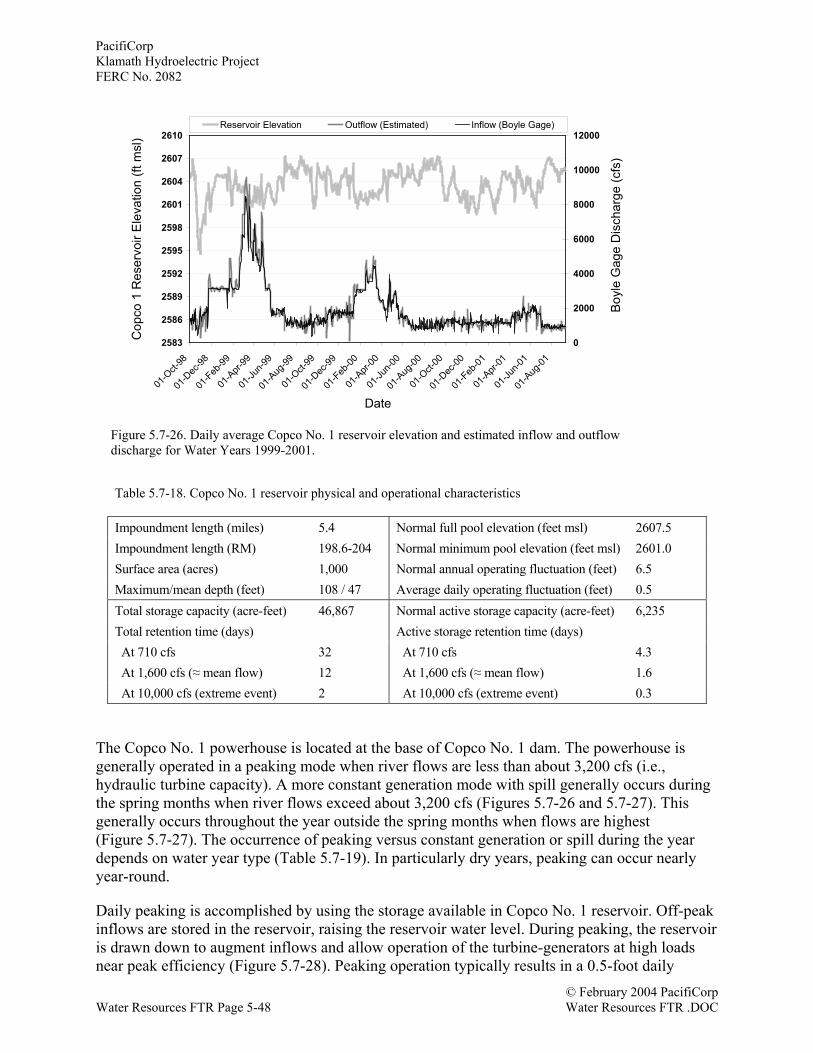
PacifiCorpKlamath Hydroelectric ProjectFERC No. 2082
© February 2004 PacifiCorpWater Resources FTR Page 5-48 Water Resources FTR .DOC
Table 5.7-18. Copco No. 1 reservoir physical and operational characteristics
Impoundment length (miles) 5.4 Normal full pool elevation (feet msl) 2607.5Impoundment length (RM) 198.6-204 Normal minimum pool elevation (feet msl) 2601.0Surface area (acres) 1,000 Normal annual operating fluctuation (feet) 6.5Maximum/mean depth (feet) 108 / 47 Average daily operating fluctuation (feet) 0.5Total storage capacity (acre-feet) 46,867 Normal active storage capacity (acre-feet) 6,235Total retention time (days) Active storage retention time (days) At 710 cfs 32 At 710 cfs 4.3 At 1,600 cfs (≈ mean flow) 12 At 1,600 cfs (≈ mean flow) 1.6 At 10,000 cfs (extreme event) 2 At 10,000 cfs (extreme event) 0.3
The Copco No. 1 powerhouse is located at the base of Copco No. 1 dam. The powerhouse isgenerally operated in a peaking mode when river flows are less than about 3,200 cfs (i.e.,hydraulic turbine capacity). A more constant generation mode with spill generally occurs duringthe spring months when river flows exceed about 3,200 cfs (Figures 5.7-26 and 5.7-27). Thisgenerally occurs throughout the year outside the spring months when flows are highest(Figure 5.7-27). The occurrence of peaking versus constant generation or spill during the yeardepends on water year type (Table 5.7-19). In particularly dry years, peaking can occur nearlyyear-round.
Daily peaking is accomplished by using the storage available in Copco No. 1 reservoir. Off-peakinflows are stored in the reservoir, raising the reservoir water level. During peaking, the reservoiris drawn down to augment inflows and allow operation of the turbine-generators at high loadsnear peak efficiency (Figure 5.7-28). Peaking operation typically results in a 0.5-foot daily
2583
2586
2589
2592
2595
2598
2601
2604
2607
2610
01-O
ct-98
01-D
ec-98
01-F
eb-99
01-A
pr-99
01-Ju
n-99
01-A
ug-99
01-O
ct-99
01-D
ec-99
01-F
eb-00
01-A
pr-00
01-Ju
n-00
01-A
ug-00
01-O
ct-00
01-D
ec-00
01-F
eb-01
01-A
pr-01
01-Ju
n-01
01-A
ug-01
Date
Cop
co 1
Res
ervo
ir E
leva
tion
(ft m
sl)
0
2000
4000
6000
8000
10000
12000Reservoir Elevation Outflow (Estimated) Inflow (Boyle Gage)
Boy
le G
age
Dis
char
ge (c
fs)
Figure 5.7-26. Daily average Copco No. 1 reservoir elevation and estimated inflow and outflowdischarge for Water Years 1999-2001.
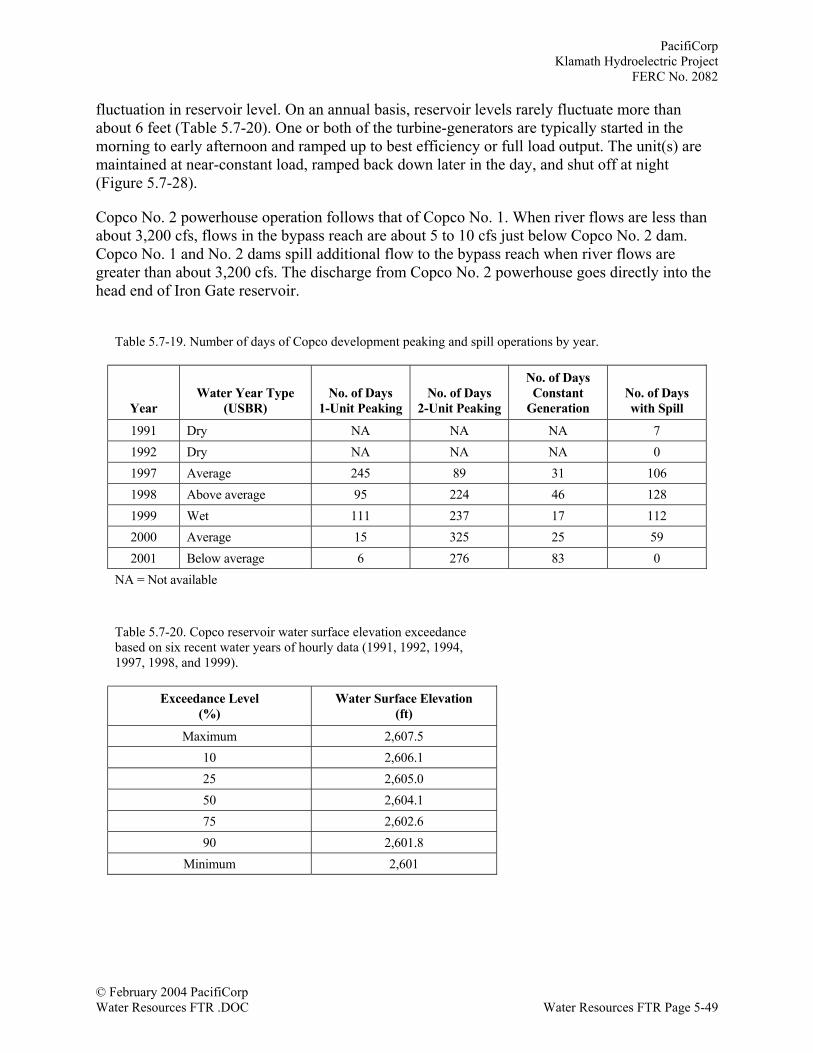
PacifiCorpKlamath Hydroelectric Project
FERC No. 2082
© February 2004 PacifiCorpWater Resources FTR .DOC Water Resources FTR Page 5-49
fluctuation in reservoir level. On an annual basis, reservoir levels rarely fluctuate more thanabout 6 feet (Table 5.7-20). One or both of the turbine-generators are typically started in themorning to early afternoon and ramped up to best efficiency or full load output. The unit(s) aremaintained at near-constant load, ramped back down later in the day, and shut off at night(Figure 5.7-28).
Copco No. 2 powerhouse operation follows that of Copco No. 1. When river flows are less thanabout 3,200 cfs, flows in the bypass reach are about 5 to 10 cfs just below Copco No. 2 dam.Copco No. 1 and No. 2 dams spill additional flow to the bypass reach when river flows aregreater than about 3,200 cfs. The discharge from Copco No. 2 powerhouse goes directly into thehead end of Iron Gate reservoir.
Table 5.7-19. Number of days of Copco development peaking and spill operations by year.
YearWater Year Type
(USBR)No. of Days
1-Unit PeakingNo. of Days
2-Unit Peaking
No. of DaysConstant
GenerationNo. of Dayswith Spill
1991 Dry NA NA NA 71992 Dry NA NA NA 01997 Average 245 89 31 1061998 Above average 95 224 46 1281999 Wet 111 237 17 1122000 Average 15 325 25 592001 Below average 6 276 83 0
NA = Not available
Table 5.7-20. Copco reservoir water surface elevation exceedancebased on six recent water years of hourly data (1991, 1992, 1994,1997, 1998, and 1999).
Exceedance Level(%)
Water Surface Elevation(ft)
Maximum 2,607.510 2,606.125 2,605.050 2,604.175 2,602.690 2,601.8
Minimum 2,601
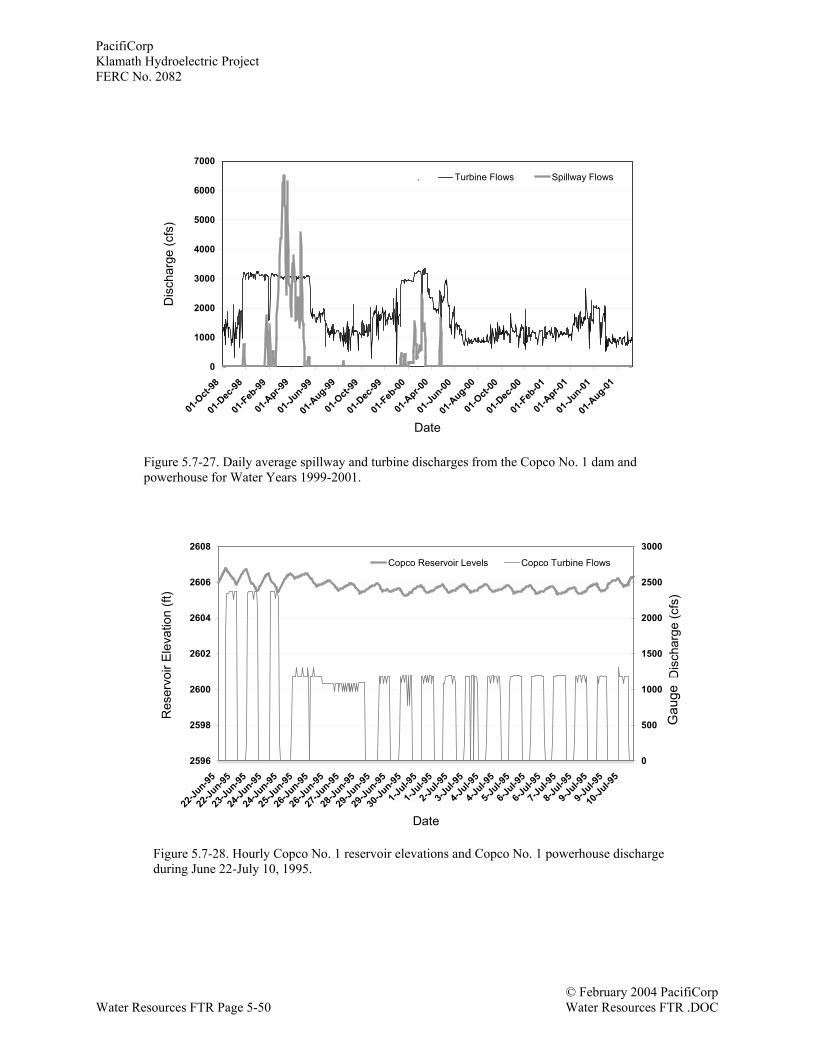
PacifiCorpKlamath Hydroelectric ProjectFERC No. 2082
© February 2004 PacifiCorpWater Resources FTR Page 5-50 Water Resources FTR .DOC
0
1000
2000
3000
4000
5000
6000
7000
01-O
ct-98
01-D
ec-98
01-Feb
-99
01-A
pr-99
01-Ju
n-99
01-A
ug-99
01-O
ct-99
01-D
ec-99
01-Feb
-00
01-A
pr-00
01-Ju
n-00
01-A
ug-00
01-O
ct-00
01-D
ec-00
01-Feb
-01
01-A
pr-01
01-Ju
n-01
01-A
ug-01
Date
Dis
char
ge (c
fs)
. Turbine Flows Spillway Flows
Figure 5.7-27. Daily average spillway and turbine discharges from the Copco No. 1 dam andpowerhouse for Water Years 1999-2001.
2596
2598
2600
2602
2604
2606
2608
22-Ju
n-95
22-Ju
n-95
23-Ju
n-95
24-Ju
n-95
24-Ju
n-95
25-Ju
n-95
26-Ju
n-95
26-Ju
n-95
27-Ju
n-95
28-Ju
n-95
29-Ju
n-95
29-Ju
n-95
30-Ju
n-95
1-Jul-9
5
1-Jul-9
5
2-Jul-9
5
3-Jul-9
5
4-Jul-9
5
4-Jul-9
5
5-Jul-9
5
6-Jul-9
5
6-Jul-9
5
7-Jul-9
5
8-Jul-9
5
9-Jul-9
5
9-Jul-9
5
10-Ju
l-95
Date
Res
ervo
ir E
leva
tion
(ft)
0
500
1000
1500
2000
2500
3000
Gag
e D
isch
arge
(cfs
)
Copco Reservoir Levels Copco Turbine Flows
Figure 5.7-28. Hourly Copco No. 1 reservoir elevations and Copco No. 1 powerhouse dischargeduring June 22-July 10, 1995.
Gau
ge
PacifiCorpKlamath Hydroelectric Project
FERC No. 2082
© February 2004 PacifiCorpWater Resources FTR .DOC Water Resources FTR Page 5-51
Flow Conditions in the Copco Bypass Reach
The relatively short reach of the Klamath River between Copco No. 2 dam and powerhouse isreferred to as the Copco bypass reach (RM 196.8 to 198.3). No major tributaries occur in thisCopco bypass reach, and there are no existing instream flow or ramp rate requirements.PacifiCorp maintains a minimum instream flow of 5 to 10 cfs as a standard operating practice.
Modeled Project Effects
Graphs of RMA2 model output of hourly flow (cfs) in the Klamath River at Copco No. 1 damare shown for existing conditions, steady flow, and the two without-Project scenarios (WOP andWOP II) in Appendix 5C. RMA2 was not used to specifically model the relatively short 1.5-mileCopco bypass reach. Therefore, to represent existing conditions, flows for the bypass reach wereestimated by subtracting a continuous diversion of up to 3,200 cfs (i.e., the Copco No. 2powerhouse hydraulic capacity) from the modeled flows at Copco No. 1 dam. In addition, aminimum instream flow of about 20 cfs was assumed in the bypass reach.
Graphs comparing estimated flow for existing conditions and WOP scenarios in the Copcobypass reach (about RM 197) are shown in Figure 5.7-29 for 2000 (top plot) and 2001 (bottomplot) conditions. Graphs comparing model output of flow for existing conditions and WOPscenarios in the Klamath River just below the Copco No. 2 powerhouse (RM 196.7) are shown inFigure 5.7-30 for 2000 (top plot) and 2001 (bottom plot) conditions. The Klamath River justbelow the Copco No. 2 powerhouse (RM 196.7) is actually at the head end of Iron Gatereservoir, and therefore is not actually a riverine section.
Figure 5.7-29 illustrates the reduction in flows in the Copco bypass reach from diversion of flowat Copco No. 2 dam to the power conduit and powerhouse. Compared to WOP conditions, themagnitude of this diversion varies up to 3,200 cfs (the Copco No. 2 powerhouse hydrauliccapacity). During 2000, spill from Copco No. 1 and No. 2 dams occurred between mid-Februaryand mid-March, resulting in a flow of up to about 2,000 cfs in the bypass reach. At all othertimes in 2000 and throughout 2001, only the minimum flow occurred in the bypass reach.
Figure 5.7-30 illustrates the fluctuation in flows below the Copco No. 2 powerhouse underexisting conditions from hydropeaking operations at Copco No. 2 powerhouse when river flowsare less than about 3,200 cfs. During 2000, river flows exceeded 3,200 cfs from about mid-January through March, during which time the Copco No. 2 powerhouse was generatingcontinuously and spill up to about 5,000 cfs was occurring at Copco No. 1 and No. 2 dams.During the remainder of 2000, peaking operations occurred, except for brief periods in earlySeptember and November. When peaking operations occurred, the peaking took place daily withflows varying from a base flow of about 20 cfs to generation flows of about 2,600 cfs to3,000 cfs. During 2001, river flows remained below 3,200 cfs and peaking operations occurredthroughout the year except for brief periods in January, May, June, October, and November.
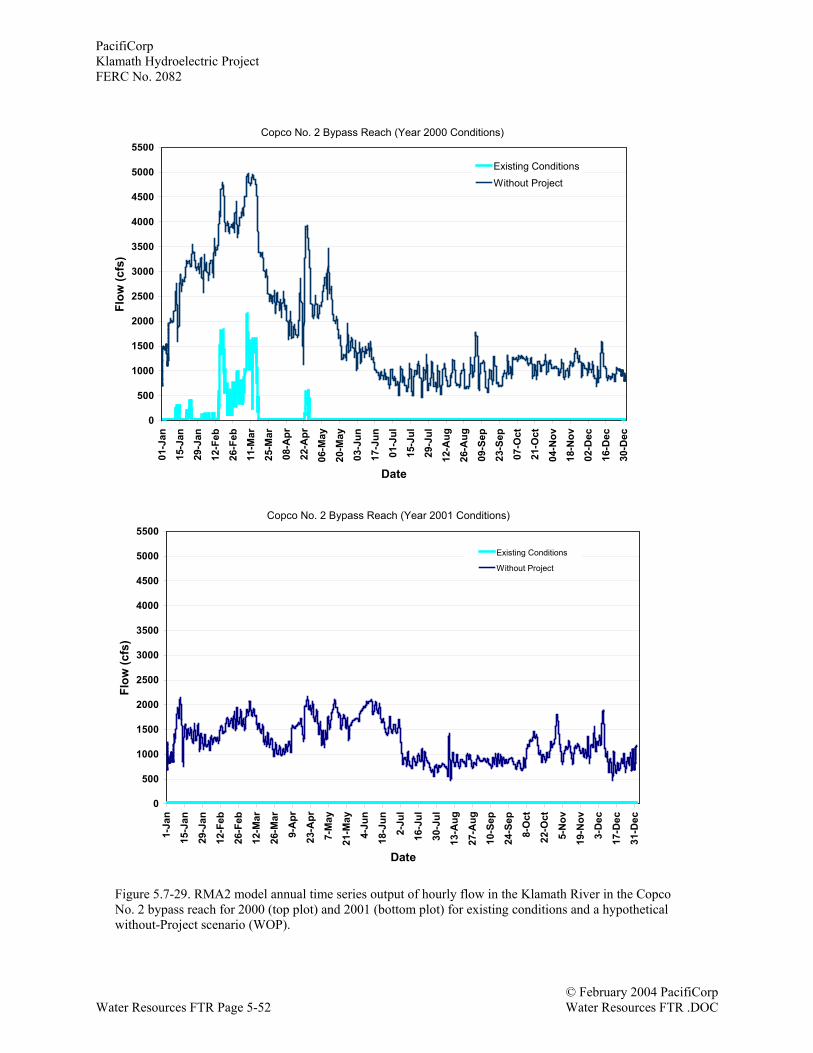
PacifiCorpKlamath Hydroelectric ProjectFERC No. 2082
© February 2004 PacifiCorpWater Resources FTR Page 5-52 Water Resources FTR .DOC
Figure 5.7-29. RMA2 model annual time series output of hourly flow in the Klamath River in the CopcoNo. 2 bypass reach for 2000 (top plot) and 2001 (bottom plot) for existing conditions and a hypotheticalwithout-Project scenario (WOP).
Copco 2 Bypass Reach (Year 2000 Conditions)
0
500
1000
1500
2000
2500
3000
3500
4000
4500
5000
550001
-Jan
15-J
an
29-J
an
12-F
eb
26-F
eb
11-M
ar
25-M
ar
08-A
pr
22-A
pr
06-M
ay
20-M
ay
03-J
un
17-J
un
01-J
ul
15-J
ul
29-J
ul
12-A
ug
26-A
ug
09-S
ep
23-S
ep
07-O
ct
21-O
ct
04-N
ov
18-N
ov
02-D
ec
16-D
ec
30-D
ec
Date
Flow
(cfs
)
Existing Conditions
Without Project
Copco 2 Bypass Reach (Year 2001 Conditions)
0
500
1000
1500
2000
2500
3000
3500
4000
4500
5000
5500
1-Ja
n
15-J
an
29-J
an
12-F
eb
26-F
eb
12-M
ar
26-M
ar
9-A
pr
23-A
pr
7-M
ay
21-M
ay
4-Ju
n
18-J
un
2-Ju
l
16-J
ul
30-J
ul
13-A
ug
27-A
ug
10-S
ep
24-S
ep
8-O
ct
22-O
ct
5-N
ov
19-N
ov
3-D
ec
17-D
ec
31-D
ec
Date
Flow
(cfs
)
Existing Conditions
Without Project
Copco No. 2 Bypass Reach (Year 2000 Conditions)
Copco No. 2 Bypass Reach (Year 2001 Conditions)
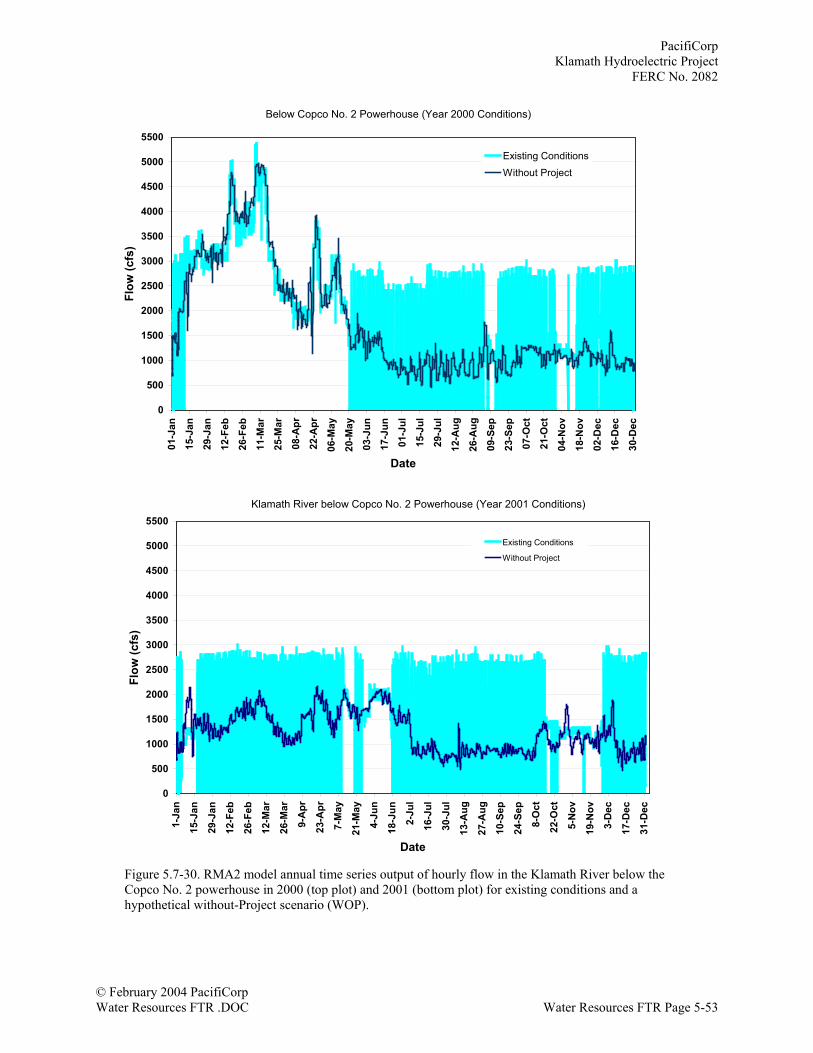
PacifiCorpKlamath Hydroelectric Project
FERC No. 2082
© February 2004 PacifiCorpWater Resources FTR .DOC Water Resources FTR Page 5-53
Below Copco 2 Powerhouse (Year 2000 Conditions)
0
500
1000
1500
2000
2500
3000
3500
4000
4500
5000
5500
01-J
an
15-J
an
29-J
an
12-F
eb
26-F
eb
11-M
ar
25-M
ar
08-A
pr
22-A
pr
06-M
ay
20-M
ay
03-J
un
17-J
un
01-J
ul
15-J
ul
29-J
ul
12-A
ug
26-A
ug
09-S
ep
23-S
ep
07-O
ct
21-O
ct
04-N
ov
18-N
ov
02-D
ec
16-D
ec
30-D
ec
Date
Flow
(cfs
)
Existing Conditions
Without Project
Klamath River below Copco 2 Powerhouse (Year 2001 Conditions)
0
500
1000
1500
2000
2500
3000
3500
4000
4500
5000
5500
1-Ja
n
15-J
an
29-J
an
12-F
eb
26-F
eb
12-M
ar
26-M
ar
9-A
pr
23-A
pr
7-M
ay
21-M
ay
4-Ju
n
18-J
un
2-Ju
l
16-J
ul
30-J
ul
13-A
ug
27-A
ug
10-S
ep
24-S
ep
8-O
ct
22-O
ct
5-N
ov
19-N
ov
3-D
ec
17-D
ec
31-D
ec
Date
Flow
(cfs
)
Existing Conditions
Without Project
Figure 5.7-30. RMA2 model annual time series output of hourly flow in the Klamath River below theCopco No. 2 powerhouse in 2000 (top plot) and 2001 (bottom plot) for existing conditions and ahypothetical without-Project scenario (WOP).
Below Copco No. 2 Powerhouse (Year 2000 Conditions)
Klamath River below Copco No. 2 Powerhouse (Year 2001 Conditions)
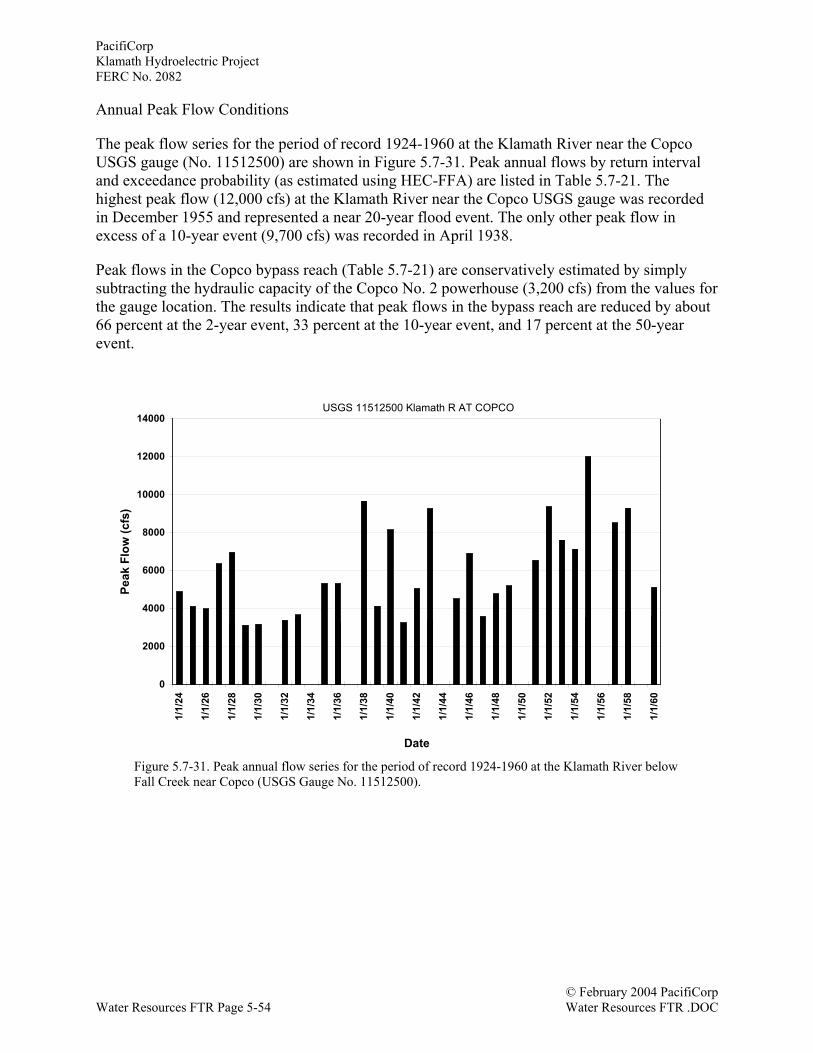
PacifiCorpKlamath Hydroelectric ProjectFERC No. 2082
© February 2004 PacifiCorpWater Resources FTR Page 5-54 Water Resources FTR .DOC
Annual Peak Flow Conditions
The peak flow series for the period of record 1924-1960 at the Klamath River near the CopcoUSGS gauge (No. 11512500) are shown in Figure 5.7-31. Peak annual flows by return intervaland exceedance probability (as estimated using HEC-FFA) are listed in Table 5.7-21. Thehighest peak flow (12,000 cfs) at the Klamath River near the Copco USGS gauge was recordedin December 1955 and represented a near 20-year flood event. The only other peak flow inexcess of a 10-year event (9,700 cfs) was recorded in April 1938.
Peak flows in the Copco bypass reach (Table 5.7-21) are conservatively estimated by simplysubtracting the hydraulic capacity of the Copco No. 2 powerhouse (3,200 cfs) from the values forthe gauge location. The results indicate that peak flows in the bypass reach are reduced by about66 percent at the 2-year event, 33 percent at the 10-year event, and 17 percent at the 50-yearevent.
USGS 11512500 KLAMATH R AT COPCO
0
2000
4000
6000
8000
10000
12000
14000
1/1/
24
1/1/
26
1/1/
28
1/1/
30
1/1/
32
1/1/
34
1/1/
36
1/1/
38
1/1/
40
1/1/
42
1/1/
44
1/1/
46
1/1/
48
1/1/
50
1/1/
52
1/1/
54
1/1/
56
1/1/
58
1/1/
60
Date
Peak
Flo
w (c
fs)
Figure 5.7-31. Peak annual flow series for the period of record 1924-1960 at the Klamath River belowFall Creek near Copco (USGS Gauge No. 11512500).
USGS 11512500 Klamath R AT COPCO
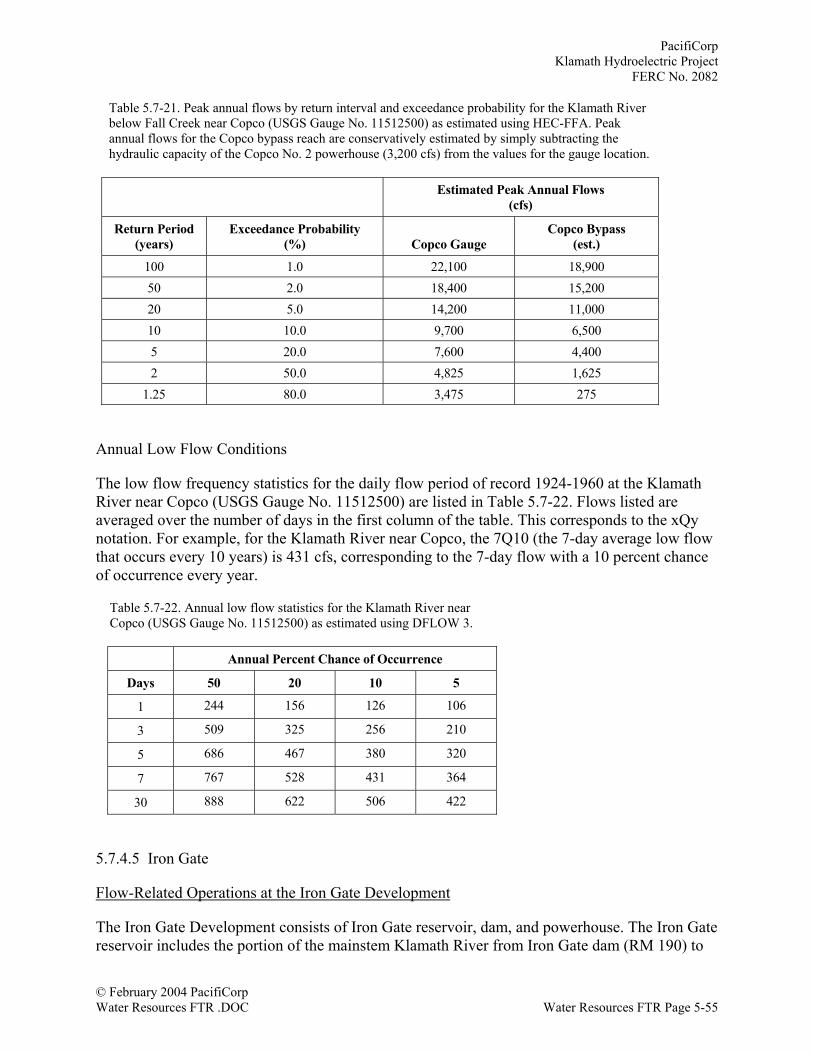
PacifiCorpKlamath Hydroelectric Project
FERC No. 2082
© February 2004 PacifiCorpWater Resources FTR .DOC Water Resources FTR Page 5-55
Table 5.7-21. Peak annual flows by return interval and exceedance probability for the Klamath Riverbelow Fall Creek near Copco (USGS Gauge No. 11512500) as estimated using HEC-FFA. Peakannual flows for the Copco bypass reach are conservatively estimated by simply subtracting thehydraulic capacity of the Copco No. 2 powerhouse (3,200 cfs) from the values for the gauge location.
Estimated Peak Annual Flows(cfs)
Return Period(years)
Exceedance Probability(%) Copco Gauge
Copco Bypass(est.)
100 1.0 22,100 18,90050 2.0 18,400 15,20020 5.0 14,200 11,00010 10.0 9,700 6,5005 20.0 7,600 4,4002 50.0 4,825 1,625
1.25 80.0 3,475 275
Annual Low Flow Conditions
The low flow frequency statistics for the daily flow period of record 1924-1960 at the KlamathRiver near Copco (USGS Gauge No. 11512500) are listed in Table 5.7-22. Flows listed areaveraged over the number of days in the first column of the table. This corresponds to the xQynotation. For example, for the Klamath River near Copco, the 7Q10 (the 7-day average low flowthat occurs every 10 years) is 431 cfs, corresponding to the 7-day flow with a 10 percent chanceof occurrence every year.
Table 5.7-22. Annual low flow statistics for the Klamath River nearCopco (USGS Gauge No. 11512500) as estimated using DFLOW 3.
Annual Percent Chance of Occurrence
Days 50 20 10 5
1 244 156 126 106
3 509 325 256 210
5 686 467 380 320
7 767 528 431 364
30 888 622 506 422
5.7.4.5 Iron Gate
Flow-Related Operations at the Iron Gate Development
The Iron Gate Development consists of Iron Gate reservoir, dam, and powerhouse. The Iron Gatereservoir includes the portion of the mainstem Klamath River from Iron Gate dam (RM 190) to
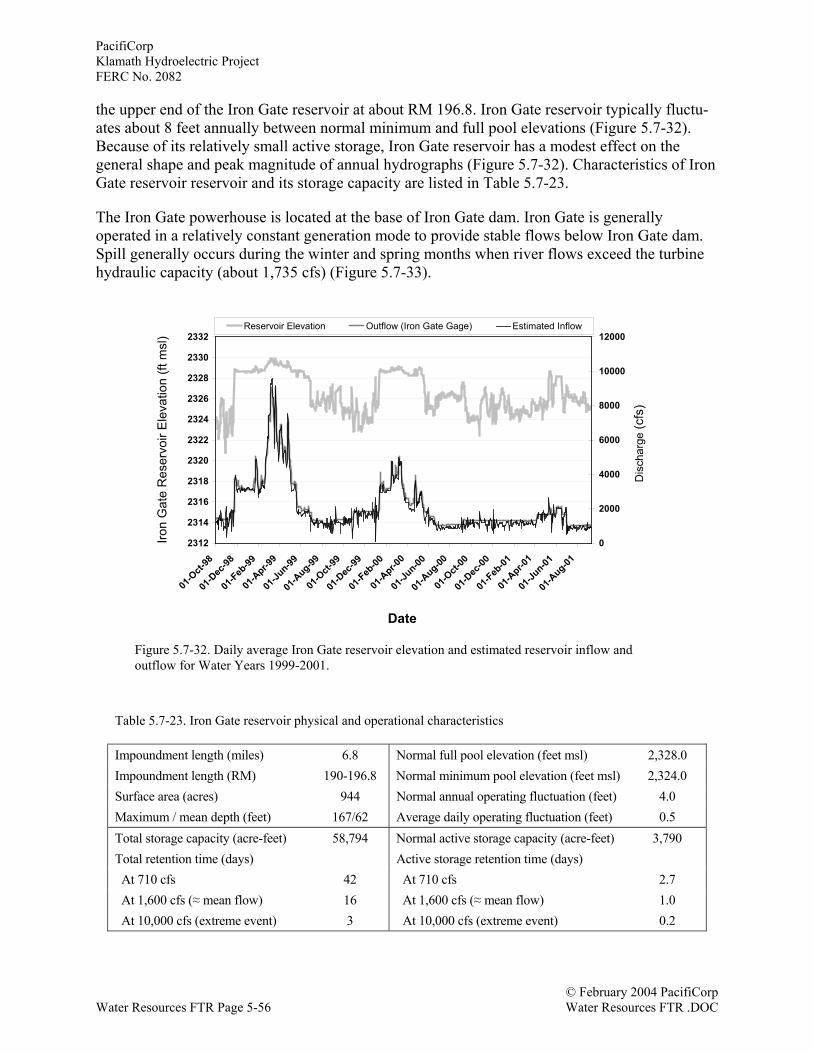
PacifiCorpKlamath Hydroelectric ProjectFERC No. 2082
© February 2004 PacifiCorpWater Resources FTR Page 5-56 Water Resources FTR .DOC
the upper end of the Iron Gate reservoir at about RM 196.8. Iron Gate reservoir typically fluctu-ates about 8 feet annually between normal minimum and full pool elevations (Figure 5.7-32).Because of its relatively small active storage, Iron Gate reservoir has a modest effect on thegeneral shape and peak magnitude of annual hydrographs (Figure 5.7-32). Characteristics of IronGate reservoir reservoir and its storage capacity are listed in Table 5.7-23.
The Iron Gate powerhouse is located at the base of Iron Gate dam. Iron Gate is generallyoperated in a relatively constant generation mode to provide stable flows below Iron Gate dam.Spill generally occurs during the winter and spring months when river flows exceed the turbinehydraulic capacity (about 1,735 cfs) (Figure 5.7-33).
Table 5.7-23. Iron Gate reservoir physical and operational characteristics
Impoundment length (miles) 6.8 Normal full pool elevation (feet msl) 2,328.0Impoundment length (RM) 190-196.8 Normal minimum pool elevation (feet msl) 2,324.0Surface area (acres) 944 Normal annual operating fluctuation (feet) 4.0Maximum / mean depth (feet) 167/62 Average daily operating fluctuation (feet) 0.5Total storage capacity (acre-feet) 58,794 Normal active storage capacity (acre-feet) 3,790Total retention time (days) Active storage retention time (days) At 710 cfs 42 At 710 cfs 2.7 At 1,600 cfs (≈ mean flow) 16 At 1,600 cfs (≈ mean flow) 1.0 At 10,000 cfs (extreme event) 3 At 10,000 cfs (extreme event) 0.2
2312
2314
2316
2318
2320
2322
2324
2326
2328
2330
2332
01-O
ct-98
01-D
ec-98
01-Feb
-99
01-A
pr-99
01-Ju
n-99
01-A
ug-99
01-O
ct-99
01-D
ec-99
01-Feb
-00
01-A
pr-00
01-Ju
n-00
01-A
ug-00
01-O
ct-00
01-D
ec-00
01-Feb
-01
01-A
pr-01
01-Ju
n-01
01-A
ug-01
Iron
Gat
e R
eser
voir
Ele
vatio
n (ft
msl
)
0
2000
4000
6000
8000
10000
12000Reservoir Elevation Outflow (Iron Gate Gage) Estimated Inflow
Dis
char
ge (c
fs)
Date
Figure 5.7-32. Daily average Iron Gate reservoir elevation and estimated reservoir inflow andoutflow for Water Years 1999-2001.
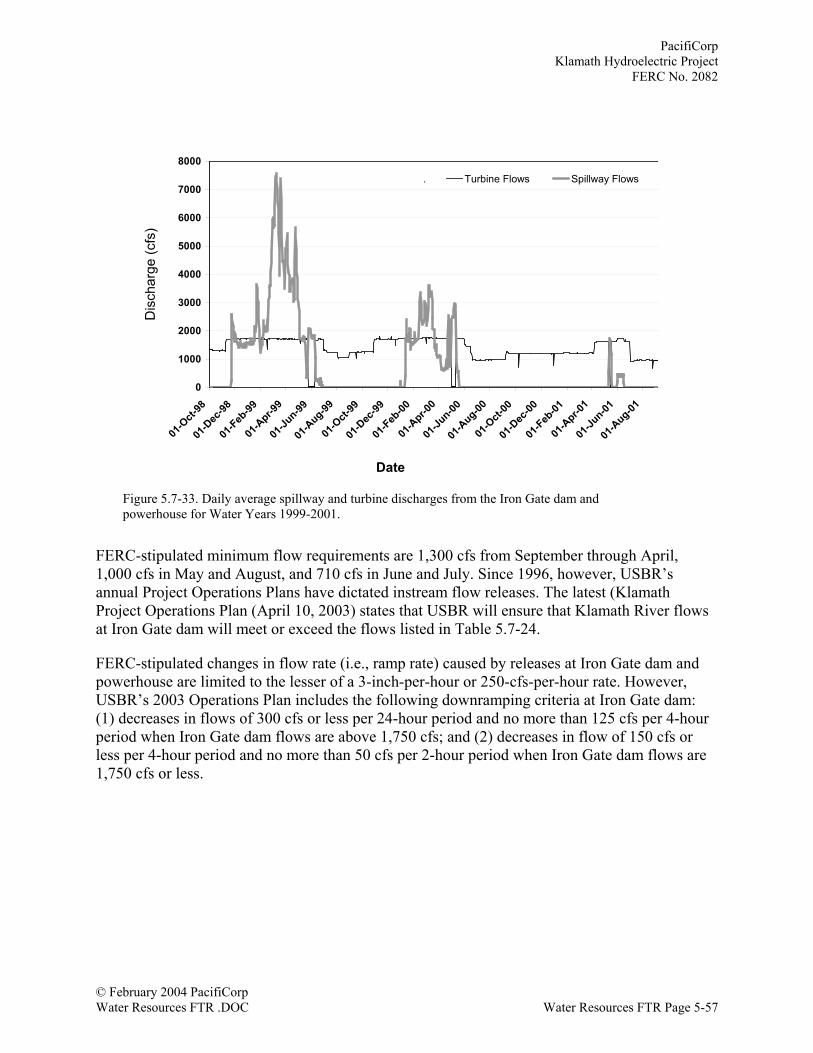
PacifiCorpKlamath Hydroelectric Project
FERC No. 2082
© February 2004 PacifiCorpWater Resources FTR .DOC Water Resources FTR Page 5-57
FERC-stipulated minimum flow requirements are 1,300 cfs from September through April,1,000 cfs in May and August, and 710 cfs in June and July. Since 1996, however, USBR’sannual Project Operations Plans have dictated instream flow releases. The latest (KlamathProject Operations Plan (April 10, 2003) states that USBR will ensure that Klamath River flowsat Iron Gate dam will meet or exceed the flows listed in Table 5.7-24.
FERC-stipulated changes in flow rate (i.e., ramp rate) caused by releases at Iron Gate dam andpowerhouse are limited to the lesser of a 3-inch-per-hour or 250-cfs-per-hour rate. However,USBR’s 2003 Operations Plan includes the following downramping criteria at Iron Gate dam:(1) decreases in flows of 300 cfs or less per 24-hour period and no more than 125 cfs per 4-hourperiod when Iron Gate dam flows are above 1,750 cfs; and (2) decreases in flow of 150 cfs orless per 4-hour period and no more than 50 cfs per 2-hour period when Iron Gate dam flows are1,750 cfs or less.
0
1000
2000
3000
4000
5000
6000
7000
8000
01-O
ct-98
01-D
ec-98
01-Feb
-99
01-A
pr-99
01-Ju
n-99
01-A
ug-99
01-O
ct-99
01-D
ec-99
01-Feb
-00
01-A
pr-00
01-Ju
n-00
01-A
ug-00
01-O
ct-00
01-D
ec-00
01-Feb
-01
01-A
pr-01
01-Ju
n-01
01-A
ug-01
Dis
char
ge (c
fs)
. Turbine Flows Spillway Flows
Date
Figure 5.7-33. Daily average spillway and turbine discharges from the Iron Gate dam andpowerhouse for Water Years 1999-2001.
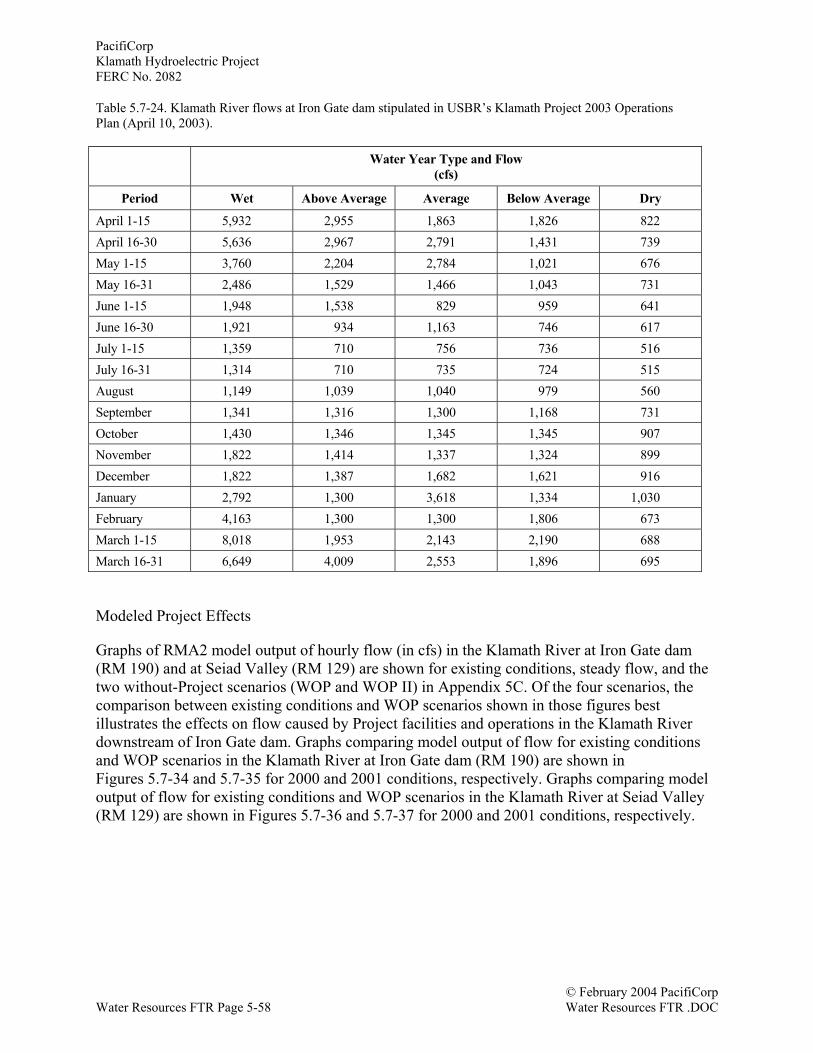
PacifiCorpKlamath Hydroelectric ProjectFERC No. 2082
© February 2004 PacifiCorpWater Resources FTR Page 5-58 Water Resources FTR .DOC
Table 5.7-24. Klamath River flows at Iron Gate dam stipulated in USBR’s Klamath Project 2003 OperationsPlan (April 10, 2003).
Water Year Type and Flow(cfs)
Period Wet Above Average Average Below Average Dry
April 1-15 5,932 2,955 1,863 1,826 822April 16-30 5,636 2,967 2,791 1,431 739May 1-15 3,760 2,204 2,784 1,021 676May 16-31 2,486 1,529 1,466 1,043 731June 1-15 1,948 1,538 829 959 641June 16-30 1,921 934 1,163 746 617July 1-15 1,359 710 756 736 516July 16-31 1,314 710 735 724 515August 1,149 1,039 1,040 979 560September 1,341 1,316 1,300 1,168 731October 1,430 1,346 1,345 1,345 907November 1,822 1,414 1,337 1,324 899December 1,822 1,387 1,682 1,621 916January 2,792 1,300 3,618 1,334 1,030February 4,163 1,300 1,300 1,806 673March 1-15 8,018 1,953 2,143 2,190 688March 16-31 6,649 4,009 2,553 1,896 695
Modeled Project Effects
Graphs of RMA2 model output of hourly flow (in cfs) in the Klamath River at Iron Gate dam(RM 190) and at Seiad Valley (RM 129) are shown for existing conditions, steady flow, and thetwo without-Project scenarios (WOP and WOP II) in Appendix 5C. Of the four scenarios, thecomparison between existing conditions and WOP scenarios shown in those figures bestillustrates the effects on flow caused by Project facilities and operations in the Klamath Riverdownstream of Iron Gate dam. Graphs comparing model output of flow for existing conditionsand WOP scenarios in the Klamath River at Iron Gate dam (RM 190) are shown inFigures 5.7-34 and 5.7-35 for 2000 and 2001 conditions, respectively. Graphs comparing modeloutput of flow for existing conditions and WOP scenarios in the Klamath River at Seiad Valley(RM 129) are shown in Figures 5.7-36 and 5.7-37 for 2000 and 2001 conditions, respectively.
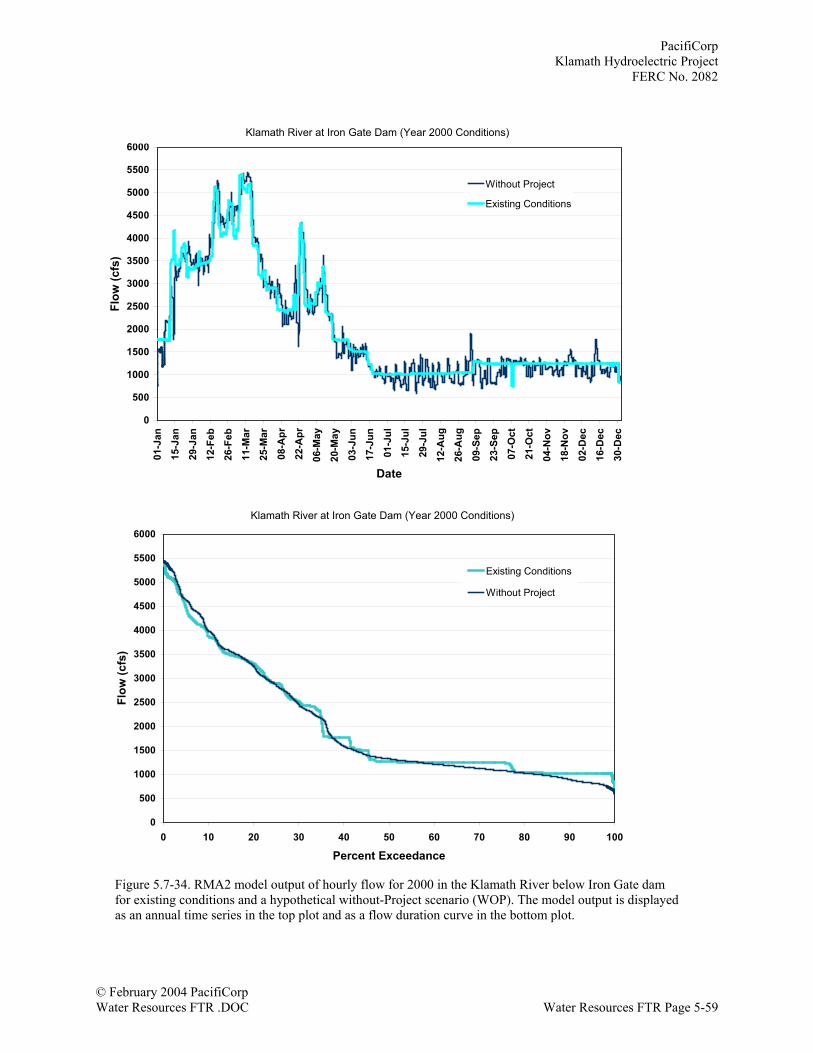
PacifiCorpKlamath Hydroelectric Project
FERC No. 2082
© February 2004 PacifiCorpWater Resources FTR .DOC Water Resources FTR Page 5-59
Klamath River at Iron Gate Dam (Year 2000 Conditions)
0
500
1000
1500
2000
2500
3000
3500
4000
4500
5000
5500
600001
-Jan
15-J
an
29-J
an
12-F
eb
26-F
eb
11-M
ar
25-M
ar
08-A
pr
22-A
pr
06-M
ay
20-M
ay
03-J
un
17-J
un
01-J
ul
15-J
ul
29-J
ul
12-A
ug
26-A
ug
09-S
ep
23-S
ep
07-O
ct
21-O
ct
04-N
ov
18-N
ov
02-D
ec
16-D
ec
30-D
ec
Date
Flow
(cfs
)
Without Project
Existing Conditions
Klamath River at Iron Gate Dam (Year 2000 Conditions)Percent Flow Exceedance
0
500
1000
1500
2000
2500
3000
3500
4000
4500
5000
5500
6000
0 10 20 30 40 50 60 70 80 90 100
Percent Exceedance
Flow
(cfs
)
Existing Conditions
Without Project
Figure 5.7-34. RMA2 model output of hourly flow for 2000 in the Klamath River below Iron Gate damfor existing conditions and a hypothetical without-Project scenario (WOP). The model output is displayedas an annual time series in the top plot and as a flow duration curve in the bottom plot.
Klamath River at Iron Gate Dam (Year 2000 Conditions)
Klamath River at Iron Gate Dam (Year 2000 Conditions)
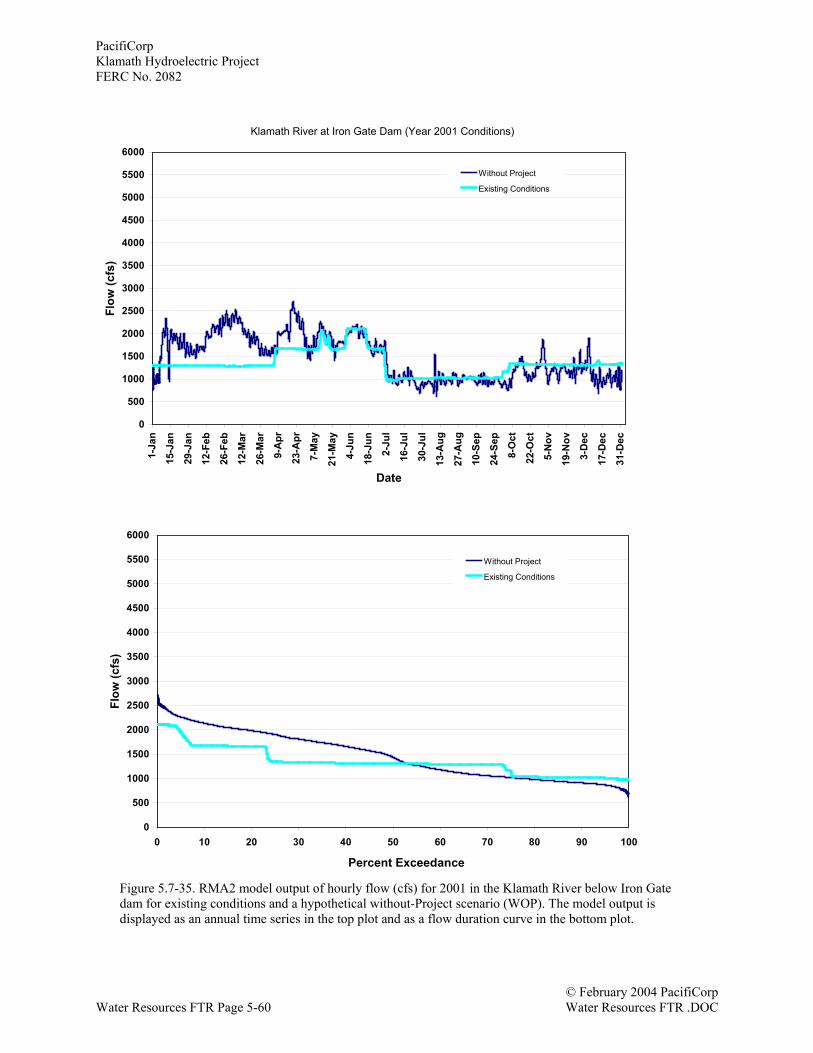
PacifiCorpKlamath Hydroelectric ProjectFERC No. 2082
© February 2004 PacifiCorpWater Resources FTR Page 5-60 Water Resources FTR .DOC
Figure 5.7-35. RMA2 model output of hourly flow (cfs) for 2001 in the Klamath River below Iron Gatedam for existing conditions and a hypothetical without-Project scenario (WOP). The model output isdisplayed as an annual time series in the top plot and as a flow duration curve in the bottom plot.
0
500
1000
1500
2000
2500
3000
3500
4000
4500
5000
5500
60001-
Jan
15-J
an
29-J
an
12-F
eb
26-F
eb
12-M
ar
26-M
ar
9-A
pr
23-A
pr
7-M
ay
21-M
ay
4-Ju
n
18-J
un
2-Ju
l
16-J
ul
30-J
ul
13-A
ug
27-A
ug
10-S
ep
24-S
ep
8-O
ct
22-O
ct
5-N
ov
19-N
ov
3-D
ec
17-D
ec
31-D
ec
Date
Flow
(cfs
)
Without Project
Existing Conditions
0
500
1000
1500
2000
2500
3000
3500
4000
4500
5000
5500
6000
0 10 20 30 40 50 60 70 80 90 100
Date
Flow
(cfs
)
Without Project
Existing Conditions
Klamath River at Iron Gate Dam (Year 2001 Conditions)
Percent Exceedance
PacifiCorpKlamath Hydroelectric Project
FERC No. 2082
© February 2004 PacifiCorpWater Resources FTR .DOC Water Resources FTR Page 5-61
Klamath River at Siead Valley (Year 2000 Conditions)
0
1000
2000
3000
4000
5000
6000
7000
8000
9000
1000001
-Jan
15-J
an
29-J
an
12-F
eb
26-F
eb11
-Mar
25-M
ar
08-A
pr
22-A
pr
06-M
ay
20-M
ay
03-J
un
17-J
un
01-J
ul
15-J
ul
29-J
ul
12-A
ug
26-A
ug
09-S
ep
23-S
ep
07-O
ct
21-O
ct
04-N
ov
18-N
ov
02-D
ec
16-D
ec30
-Dec
Date
Flow
(cfs
)
Without Project
Existing Conditions
Klamath River at Siead Valley (Year 2000 Conditions)Percent Flow Exceedance
0
1000
2000
3000
4000
5000
6000
7000
8000
9000
10000
0 10 20 30 40 50 60 70 80 90 100
Percent Exceedance
Flow
(cfs
)
Existing Conditions
Without Project
Figure 5.7-36. RMA2 model output of hourly flow for 2000 in the Klamath River at Seiad Valley forexisting conditions and a hypothetical without-Project scenario (WOP). The model output is displayed asan annual time series in the top plot and as a flow duration curve in the bottom plot.
Klamath River at Seiad Valley (Year 2001 Conditions)
Klamath River at Seiad Valley (Year 2001 Conditions)
Percent Exceedance
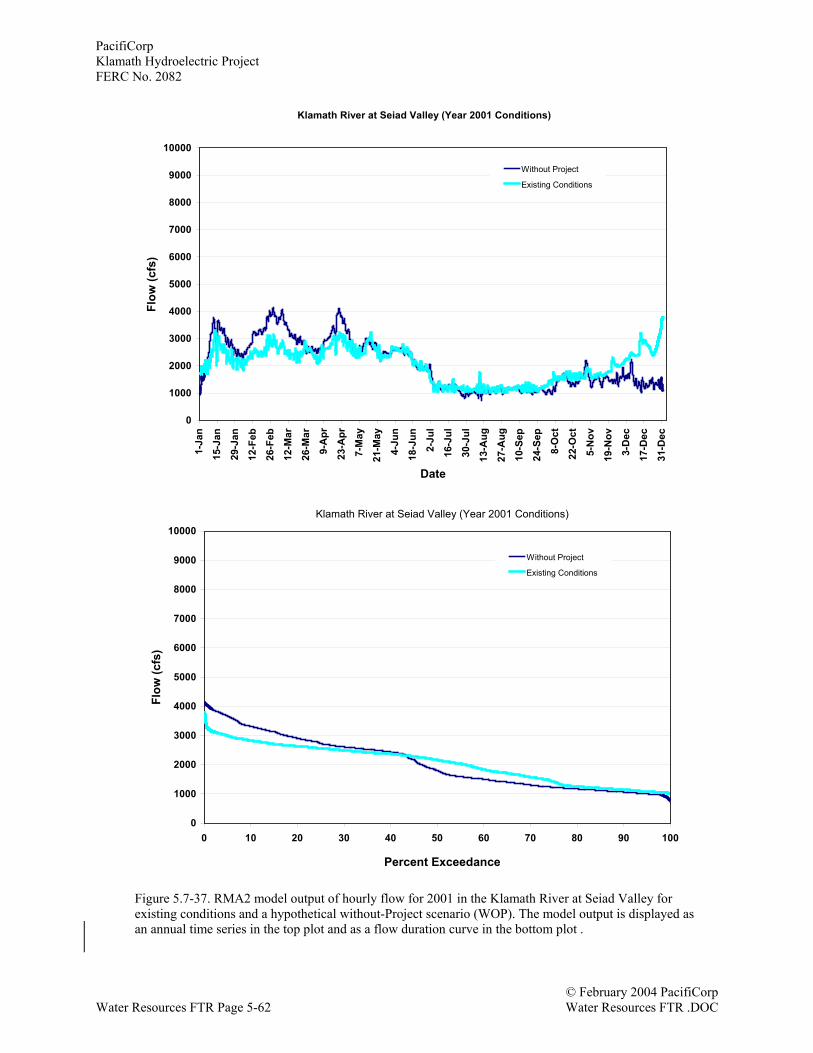
PacifiCorpKlamath Hydroelectric ProjectFERC No. 2082
© February 2004 PacifiCorpWater Resources FTR Page 5-62 Water Resources FTR .DOC
Klamath River at Seiad Valley (Year 2001 Conditions)
0
1000
2000
3000
4000
5000
6000
7000
8000
9000
10000
1-Ja
n
15-J
an
29-J
an
12-F
eb
26-F
eb
12-M
ar
26-M
ar
9-A
pr
23-A
pr
7-M
ay
21-M
ay
4-Ju
n
18-J
un
2-Ju
l
16-J
ul
30-J
ul
13-A
ug
27-A
ug
10-S
ep
24-S
ep
8-O
ct
22-O
ct
5-N
ov
19-N
ov
3-D
ec
17-D
ec
31-D
ec
Date
Flow
(cfs
)Without Project
Existing Conditions
Klamath River at Siead Valley (Year 2001 Conditions)Percent Flow Exceedance
0
1000
2000
3000
4000
5000
6000
7000
8000
9000
10000
0 10 20 30 40 50 60 70 80 90 100
Date
Flow
(cfs
)
Without Project
Existing Conditions
Figure 5.7-37. RMA2 model output of hourly flow for 2001 in the Klamath River at Seiad Valley forexisting conditions and a hypothetical without-Project scenario (WOP). The model output is displayed asan annual time series in the top plot and as a flow duration curve in the bottom plot .
Percent Exceedance
Klamath River at Seiad Valley (Year 2001 Conditions)
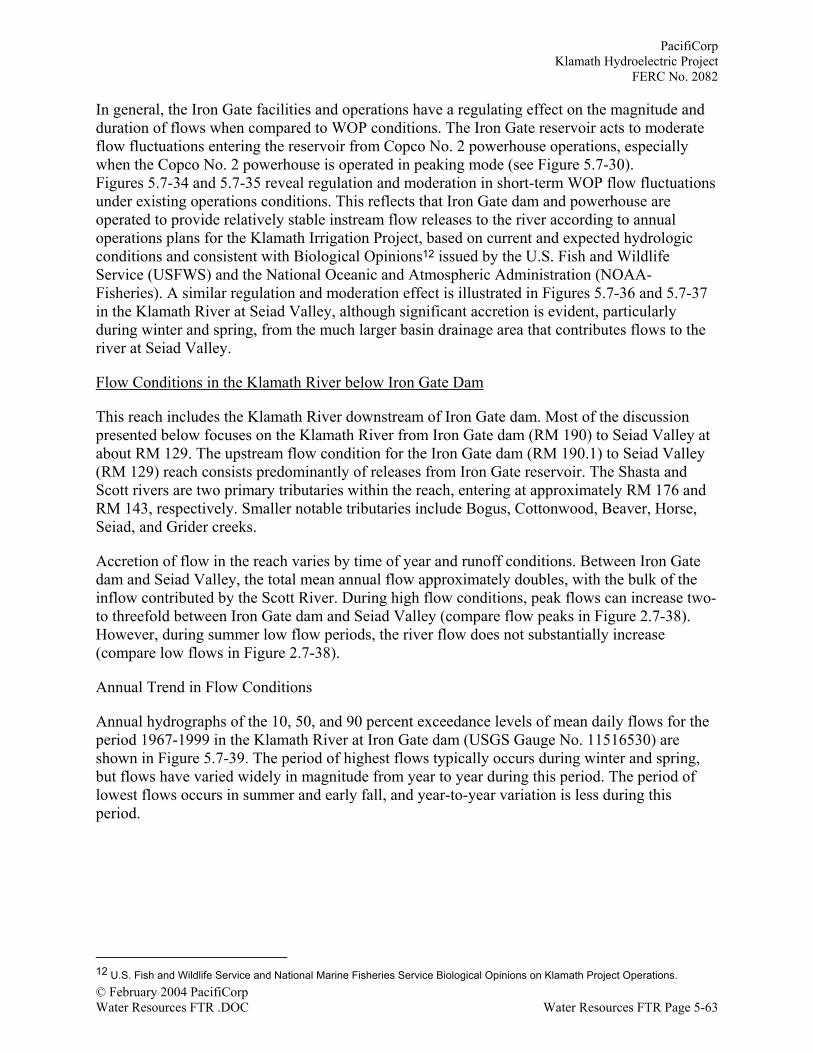
PacifiCorpKlamath Hydroelectric Project
FERC No. 2082
© February 2004 PacifiCorpWater Resources FTR .DOC Water Resources FTR Page 5-63
In general, the Iron Gate facilities and operations have a regulating effect on the magnitude andduration of flows when compared to WOP conditions. The Iron Gate reservoir acts to moderateflow fluctuations entering the reservoir from Copco No. 2 powerhouse operations, especiallywhen the Copco No. 2 powerhouse is operated in peaking mode (see Figure 5.7-30).Figures 5.7-34 and 5.7-35 reveal regulation and moderation in short-term WOP flow fluctuationsunder existing operations conditions. This reflects that Iron Gate dam and powerhouse areoperated to provide relatively stable instream flow releases to the river according to annualoperations plans for the Klamath Irrigation Project, based on current and expected hydrologicconditions and consistent with Biological Opinions12 issued by the U.S. Fish and WildlifeService (USFWS) and the National Oceanic and Atmospheric Administration (NOAA-Fisheries). A similar regulation and moderation effect is illustrated in Figures 5.7-36 and 5.7-37in the Klamath River at Seiad Valley, although significant accretion is evident, particularlyduring winter and spring, from the much larger basin drainage area that contributes flows to theriver at Seiad Valley.
Flow Conditions in the Klamath River below Iron Gate Dam
This reach includes the Klamath River downstream of Iron Gate dam. Most of the discussionpresented below focuses on the Klamath River from Iron Gate dam (RM 190) to Seiad Valley atabout RM 129. The upstream flow condition for the Iron Gate dam (RM 190.1) to Seiad Valley(RM 129) reach consists predominantly of releases from Iron Gate reservoir. The Shasta andScott rivers are two primary tributaries within the reach, entering at approximately RM 176 andRM 143, respectively. Smaller notable tributaries include Bogus, Cottonwood, Beaver, Horse,Seiad, and Grider creeks.
Accretion of flow in the reach varies by time of year and runoff conditions. Between Iron Gatedam and Seiad Valley, the total mean annual flow approximately doubles, with the bulk of theinflow contributed by the Scott River. During high flow conditions, peak flows can increase two-to threefold between Iron Gate dam and Seiad Valley (compare flow peaks in Figure 2.7-38).However, during summer low flow periods, the river flow does not substantially increase(compare low flows in Figure 2.7-38).
Annual Trend in Flow Conditions
Annual hydrographs of the 10, 50, and 90 percent exceedance levels of mean daily flows for theperiod 1967-1999 in the Klamath River at Iron Gate dam (USGS Gauge No. 11516530) areshown in Figure 5.7-39. The period of highest flows typically occurs during winter and spring,but flows have varied widely in magnitude from year to year during this period. The period oflowest flows occurs in summer and early fall, and year-to-year variation is less during thisperiod.
12 U.S. Fish and Wildlife Service and National Marine Fisheries Service Biological Opinions on Klamath Project Operations.
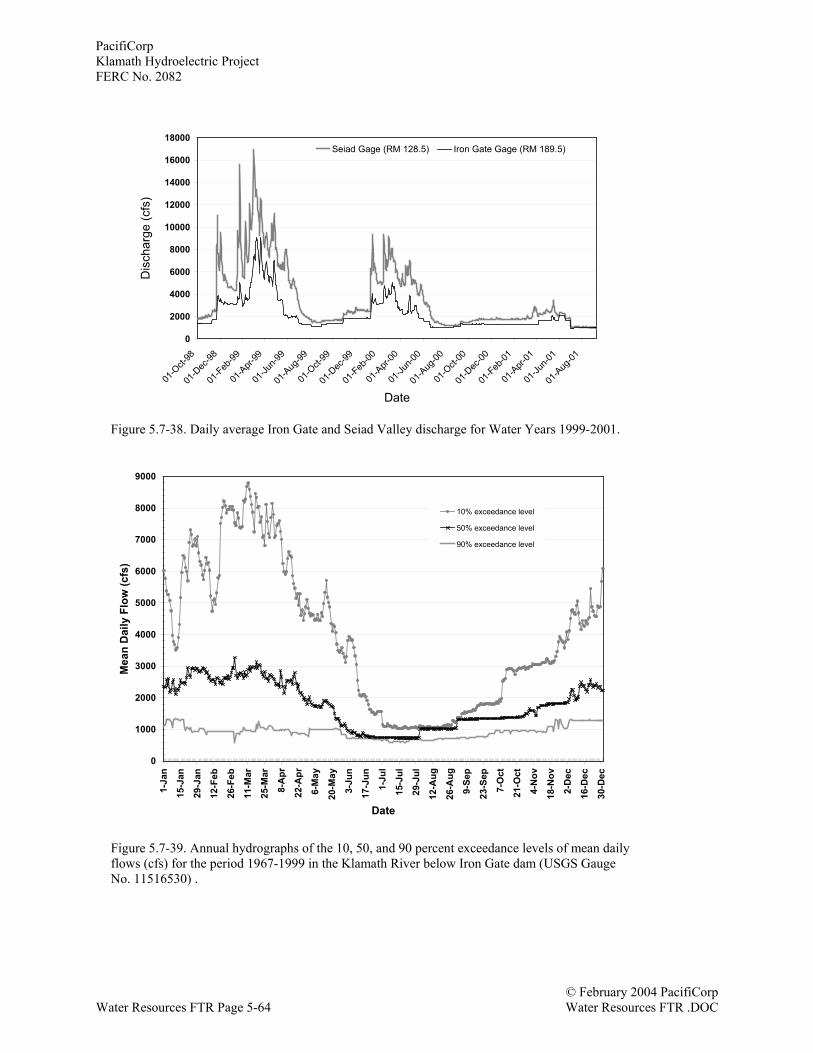
PacifiCorpKlamath Hydroelectric ProjectFERC No. 2082
© February 2004 PacifiCorpWater Resources FTR Page 5-64 Water Resources FTR .DOC
0
2000
4000
6000
8000
10000
12000
14000
16000
18000
01-O
ct-98
01-D
ec-98
01-F
eb-99
01-A
pr-99
01-Ju
n-99
01-A
ug-99
01-O
ct-99
01-D
ec-99
01-F
eb-00
01-A
pr-00
01-Ju
n-00
01-A
ug-00
01-O
ct-00
01-D
ec-00
01-F
eb-01
01-A
pr-01
01-Ju
n-01
01-A
ug-01
Date
Dis
char
ge (c
fs)
Seiad Gage (RM 128.5) Iron Gate Gage (RM 189.5)
Fi 10 3Figure 5.7-38. Daily average Iron Gate and Seiad Valley discharge for Water Years 1999-2001.
0
1000
2000
3000
4000
5000
6000
7000
8000
9000
1-Ja
n
15-J
an
29-J
an
12-F
eb
26-F
eb
11-M
ar
25-M
ar
8-A
pr
22-A
pr
6-M
ay
20-M
ay
3-Ju
n
17-J
un
1-Ju
l
15-J
ul
29-J
ul
12-A
ug
26-A
ug
9-Se
p
23-S
ep
7-O
ct
21-O
ct
4-N
ov
18-N
ov
2-D
ec
16-D
ec
30-D
ec
Date
Mea
n D
aily
Flo
w (c
fs)
10% exceedance level
50% exceedance level
90% exceedance level
Figure 5.7-39. Annual hydrographs of the 10, 50, and 90 percent exceedance levels of mean dailyflows (cfs) for the period 1967-1999 in the Klamath River below Iron Gate dam (USGS GaugeNo. 11516530) .
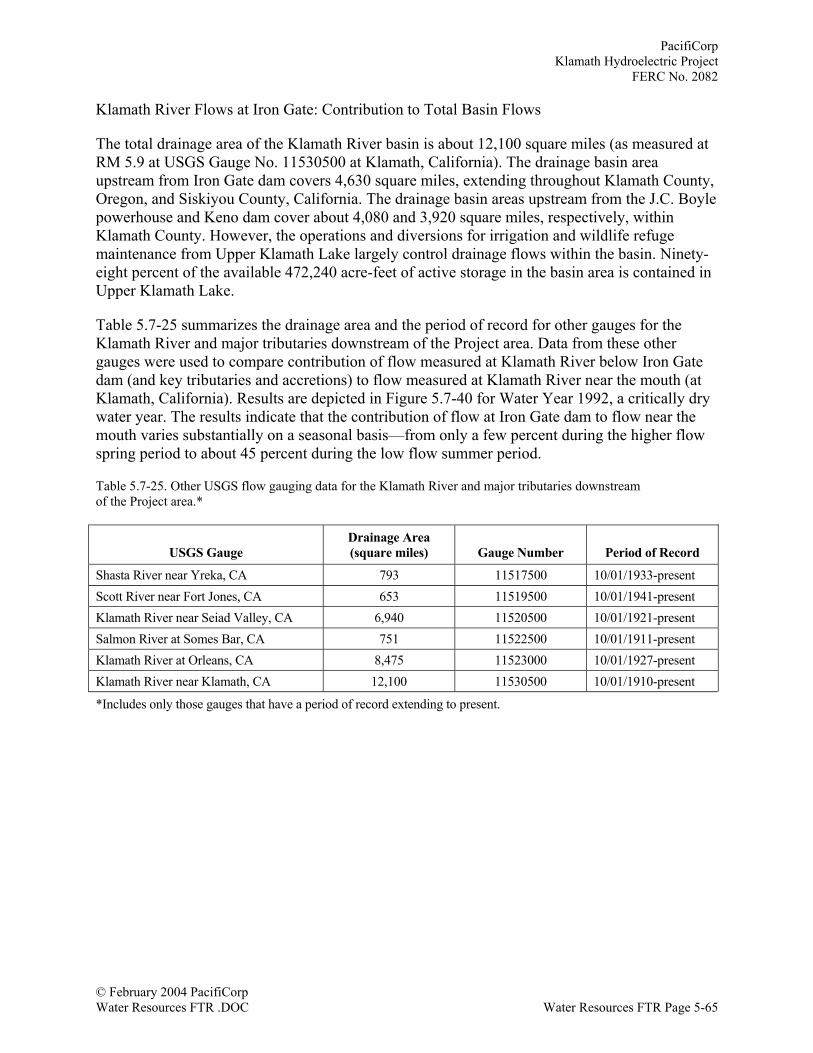
PacifiCorpKlamath Hydroelectric Project
FERC No. 2082
© February 2004 PacifiCorpWater Resources FTR .DOC Water Resources FTR Page 5-65
Klamath River Flows at Iron Gate: Contribution to Total Basin Flows
The total drainage area of the Klamath River basin is about 12,100 square miles (as measured atRM 5.9 at USGS Gauge No. 11530500 at Klamath, California). The drainage basin areaupstream from Iron Gate dam covers 4,630 square miles, extending throughout Klamath County,Oregon, and Siskiyou County, California. The drainage basin areas upstream from the J.C. Boylepowerhouse and Keno dam cover about 4,080 and 3,920 square miles, respectively, withinKlamath County. However, the operations and diversions for irrigation and wildlife refugemaintenance from Upper Klamath Lake largely control drainage flows within the basin. Ninety-eight percent of the available 472,240 acre-feet of active storage in the basin area is contained inUpper Klamath Lake.
Table 5.7-25 summarizes the drainage area and the period of record for other gauges for theKlamath River and major tributaries downstream of the Project area. Data from these othergauges were used to compare contribution of flow measured at Klamath River below Iron Gatedam (and key tributaries and accretions) to flow measured at Klamath River near the mouth (atKlamath, California). Results are depicted in Figure 5.7-40 for Water Year 1992, a critically drywater year. The results indicate that the contribution of flow at Iron Gate dam to flow near themouth varies substantially on a seasonal basis—from only a few percent during the higher flowspring period to about 45 percent during the low flow summer period.
Table 5.7-25. Other USGS flow gauging data for the Klamath River and major tributaries downstreamof the Project area.*
USGS GaugeDrainage Area(square miles) Gauge Number Period of Record
Shasta River near Yreka, CA 793 11517500 10/01/1933-presentScott River near Fort Jones, CA 653 11519500 10/01/1941-presentKlamath River near Seiad Valley, CA 6,940 11520500 10/01/1921-presentSalmon River at Somes Bar, CA 751 11522500 10/01/1911-presentKlamath River at Orleans, CA 8,475 11523000 10/01/1927-presentKlamath River near Klamath, CA 12,100 11530500 10/01/1910-present
*Includes only those gauges that have a period of record extending to present.
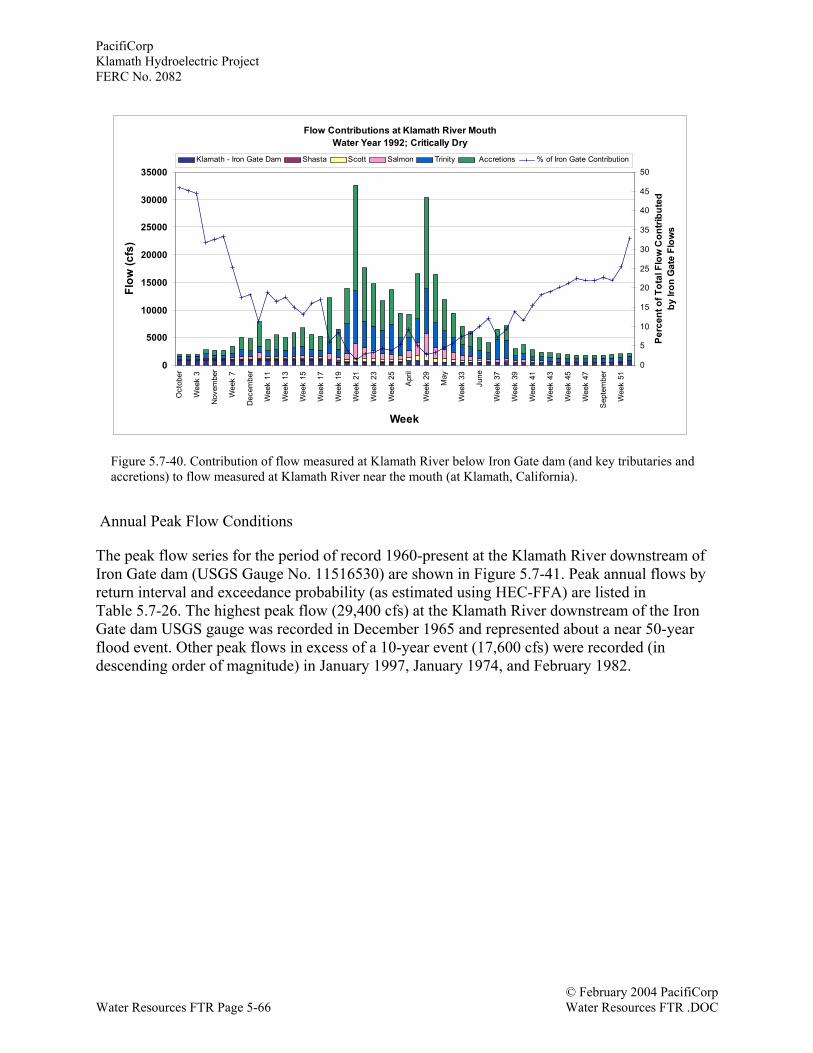
PacifiCorpKlamath Hydroelectric ProjectFERC No. 2082
© February 2004 PacifiCorpWater Resources FTR Page 5-66 Water Resources FTR .DOC
Annual Peak Flow Conditions
The peak flow series for the period of record 1960-present at the Klamath River downstream ofIron Gate dam (USGS Gauge No. 11516530) are shown in Figure 5.7-41. Peak annual flows byreturn interval and exceedance probability (as estimated using HEC-FFA) are listed inTable 5.7-26. The highest peak flow (29,400 cfs) at the Klamath River downstream of the IronGate dam USGS gauge was recorded in December 1965 and represented about a near 50-yearflood event. Other peak flows in excess of a 10-year event (17,600 cfs) were recorded (indescending order of magnitude) in January 1997, January 1974, and February 1982.
Flow Contributions at Klamath River MouthWater Year 1992; Critically Dry
0
5000
10000
15000
20000
25000
30000
35000O
ctob
er
Wee
k 3
Nov
embe
r
Wee
k 7
Dec
embe
r
Wee
k 11
Wee
k 13
Wee
k 15
Wee
k 17
Wee
k 19
Wee
k 21
Wee
k 23
Wee
k 25
Apr
il
Wee
k 29
May
Wee
k 33
June
Wee
k 37
Wee
k 39
Wee
k 41
Wee
k 43
Wee
k 45
Wee
k 47
Sep
tem
ber
Wee
k 51
Week
Flow
(cfs
)
0
5
10
15
20
25
30
35
40
45
50
Perc
ent o
f Tot
al F
low
Con
tribu
ted
by Ir
on G
ate
Flow
s
Klamath - Iron Gate Dam Shasta Scott Salmon Trinity Accretions % of Iron Gate Contribution
Figure 5.7-40. Contribution of flow measured at Klamath River below Iron Gate dam (and key tributaries andaccretions) to flow measured at Klamath River near the mouth (at Klamath, California).
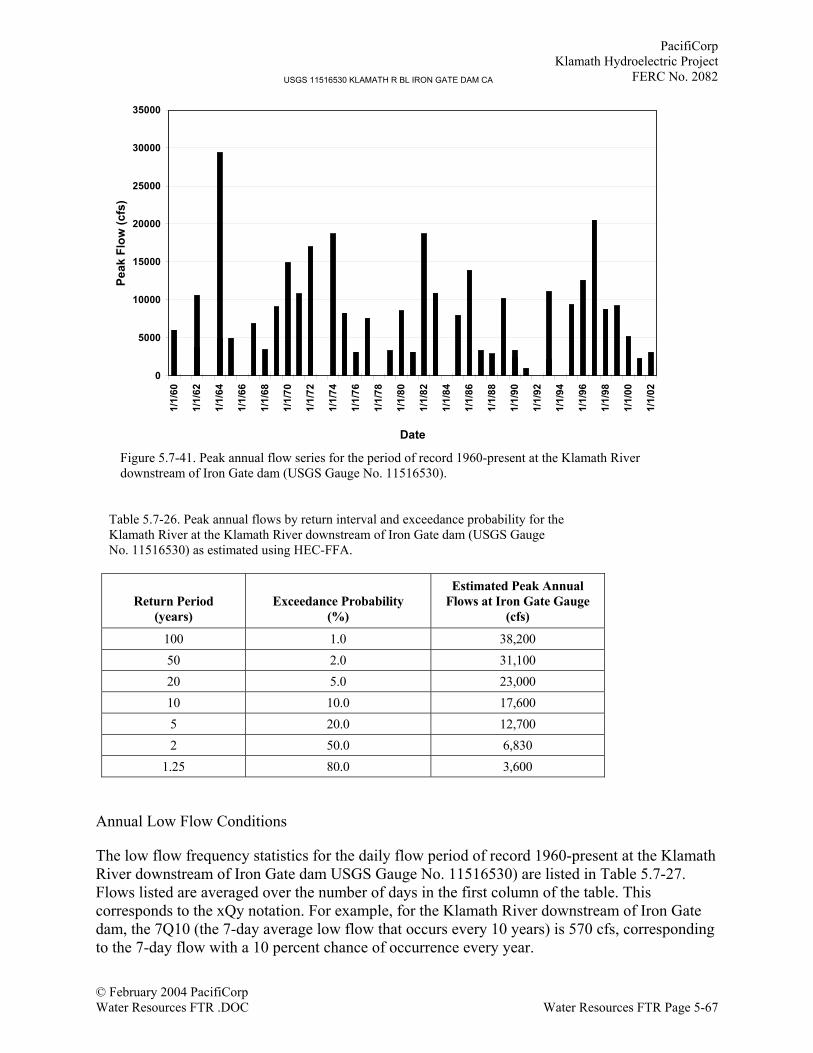
PacifiCorpKlamath Hydroelectric Project
FERC No. 2082
© February 2004 PacifiCorpWater Resources FTR .DOC Water Resources FTR Page 5-67
Table 5.7-26. Peak annual flows by return interval and exceedance probability for theKlamath River at the Klamath River downstream of Iron Gate dam (USGS GaugeNo. 11516530) as estimated using HEC-FFA.
Return Period(years)
Exceedance Probability(%)
Estimated Peak AnnualFlows at Iron Gate Gauge
(cfs)
100 1.0 38,20050 2.0 31,10020 5.0 23,00010 10.0 17,6005 20.0 12,7002 50.0 6,830
1.25 80.0 3,600
Annual Low Flow Conditions
The low flow frequency statistics for the daily flow period of record 1960-present at the KlamathRiver downstream of Iron Gate dam USGS Gauge No. 11516530) are listed in Table 5.7-27.Flows listed are averaged over the number of days in the first column of the table. Thiscorresponds to the xQy notation. For example, for the Klamath River downstream of Iron Gatedam, the 7Q10 (the 7-day average low flow that occurs every 10 years) is 570 cfs, correspondingto the 7-day flow with a 10 percent chance of occurrence every year.
USGS 11516530 KLAMATH R BL IRON GATE DAM CA
0
5000
10000
15000
20000
25000
30000
35000
1/1/
60
1/1/
62
1/1/
64
1/1/
66
1/1/
68
1/1/
70
1/1/
72
1/1/
74
1/1/
76
1/1/
78
1/1/
80
1/1/
82
1/1/
84
1/1/
86
1/1/
88
1/1/
90
1/1/
92
1/1/
94
1/1/
96
1/1/
98
1/1/
00
1/1/
02
Date
Peak
Flo
w (c
fs)
Figure 5.7-41. Peak annual flow series for the period of record 1960-present at the Klamath Riverdownstream of Iron Gate dam (USGS Gauge No. 11516530).
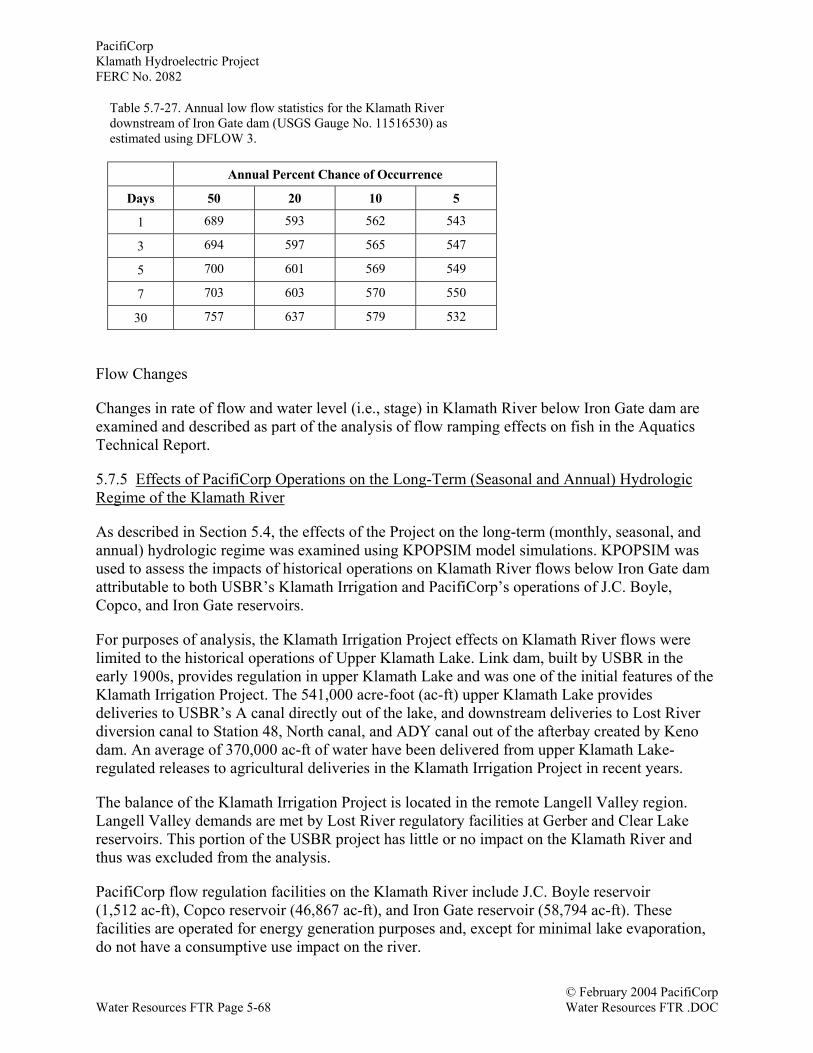
PacifiCorpKlamath Hydroelectric ProjectFERC No. 2082
© February 2004 PacifiCorpWater Resources FTR Page 5-68 Water Resources FTR .DOC
Table 5.7-27. Annual low flow statistics for the Klamath Riverdownstream of Iron Gate dam (USGS Gauge No. 11516530) asestimated using DFLOW 3.
Annual Percent Chance of Occurrence
Days 50 20 10 5
1 689 593 562 543
3 694 597 565 547
5 700 601 569 549
7 703 603 570 550
30 757 637 579 532
Flow Changes
Changes in rate of flow and water level (i.e., stage) in Klamath River below Iron Gate dam areexamined and described as part of the analysis of flow ramping effects on fish in the AquaticsTechnical Report.
5.7.5 Effects of PacifiCorp Operations on the Long-Term (Seasonal and Annual) HydrologicRegime of the Klamath River
As described in Section 5.4, the effects of the Project on the long-term (monthly, seasonal, andannual) hydrologic regime was examined using KPOPSIM model simulations. KPOPSIM wasused to assess the impacts of historical operations on Klamath River flows below Iron Gate damattributable to both USBR’s Klamath Irrigation and PacifiCorp’s operations of J.C. Boyle,Copco, and Iron Gate reservoirs.
For purposes of analysis, the Klamath Irrigation Project effects on Klamath River flows werelimited to the historical operations of Upper Klamath Lake. Link dam, built by USBR in theearly 1900s, provides regulation in upper Klamath Lake and was one of the initial features of theKlamath Irrigation Project. The 541,000 acre-foot (ac-ft) upper Klamath Lake providesdeliveries to USBR’s A canal directly out of the lake, and downstream deliveries to Lost Riverdiversion canal to Station 48, North canal, and ADY canal out of the afterbay created by Kenodam. An average of 370,000 ac-ft of water have been delivered from upper Klamath Lake-regulated releases to agricultural deliveries in the Klamath Irrigation Project in recent years.
The balance of the Klamath Irrigation Project is located in the remote Langell Valley region.Langell Valley demands are met by Lost River regulatory facilities at Gerber and Clear Lakereservoirs. This portion of the USBR project has little or no impact on the Klamath River andthus was excluded from the analysis.
PacifiCorp flow regulation facilities on the Klamath River include J.C. Boyle reservoir(1,512 ac-ft), Copco reservoir (46,867 ac-ft), and Iron Gate reservoir (58,794 ac-ft). Thesefacilities are operated for energy generation purposes and, except for minimal lake evaporation,do not have a consumptive use impact on the river.
PacifiCorpKlamath Hydroelectric Project
FERC No. 2082
© February 2004 PacifiCorpWater Resources FTR .DOC Water Resources FTR Page 5-69
5.7.5.1 KPOPSIM Analyses of Flow Effects
The KPOPSIM analyses of flow effects for this study considered one key flow point: theKlamath River at Iron Gate dam. This represents the most downstream point of Project flowregulation facilities on the Klamath River and therefore is the point at which PacifiCorpoperations effects on the long-term (monthly, seasonal, and annual) hydrologic regime would begreatest. Analyses were performed for the hydrologic period, Water Years 1961 through 1997.Complete and accurate data are available for this period. Furthermore, Iron Gate was completedin 1962, with full operations beginning in 1963.
Table 5.7-28 presents KPOPSIM-modeled monthly flows for the Klamath River below Iron Gatedam in terms of 1,000 acre-feet per month (1,000 ac-ft/mo) for the 1961-97 period. (A flow of1,000 ac-ft/mo equals approximately 17 cfs.) Table 5.7-29 presents the flow effects (in1,000 ac-ft/mo) predicted by KPOPSIM for the 1961-1997 period attributable to USBR’sKlamath Irrigation Project operations. Klamath Irrigation Project operations are computed asfollows:
• (-) Historical Upper Klamath Lake storage change (including net lake evaporation andA canal operations)
• (+) Easterly deliveries through Lost River diversion channel to Station 48 for irrigationdemands
• (+) Deliveries to North canal for irrigation demands• (+) Deliveries to ADY canal for irrigation and refuge demands
Table 5.7-30 presents the flow effects predicted by KPOPSIM for the 1961-1997 period resultingfrom PacifiCorp’s operations at J.C. Boyle, Copco, and Iron Gate reservoirs. (Calendar year1988 data were not available.) These flow effects are due to monthly reservoir storage changes,since PacifiCorp’s operations do not involve consumptive water use.
Table 5.7-31 presents the KPOPSIM-modeled flows for the Klamath River below Iron Gate damfor the 1961-1997 period adjusted for the operations of the Klamath Irrigation Project andPacifiCorp facilities. This represents flow without either the Klamath Irrigation Project or thehydroelectric Project. It is referred to as the No-Projects flow condition and approximates a “nearnatural” flow condition.13
13 This “near-natural” flow represents the flow conditions at Iron Gate dam with the operations by regulatory and consumptive usefacilities from Upper Klamath Lake to Iron Gate Dam for the 1961-97 period removed.
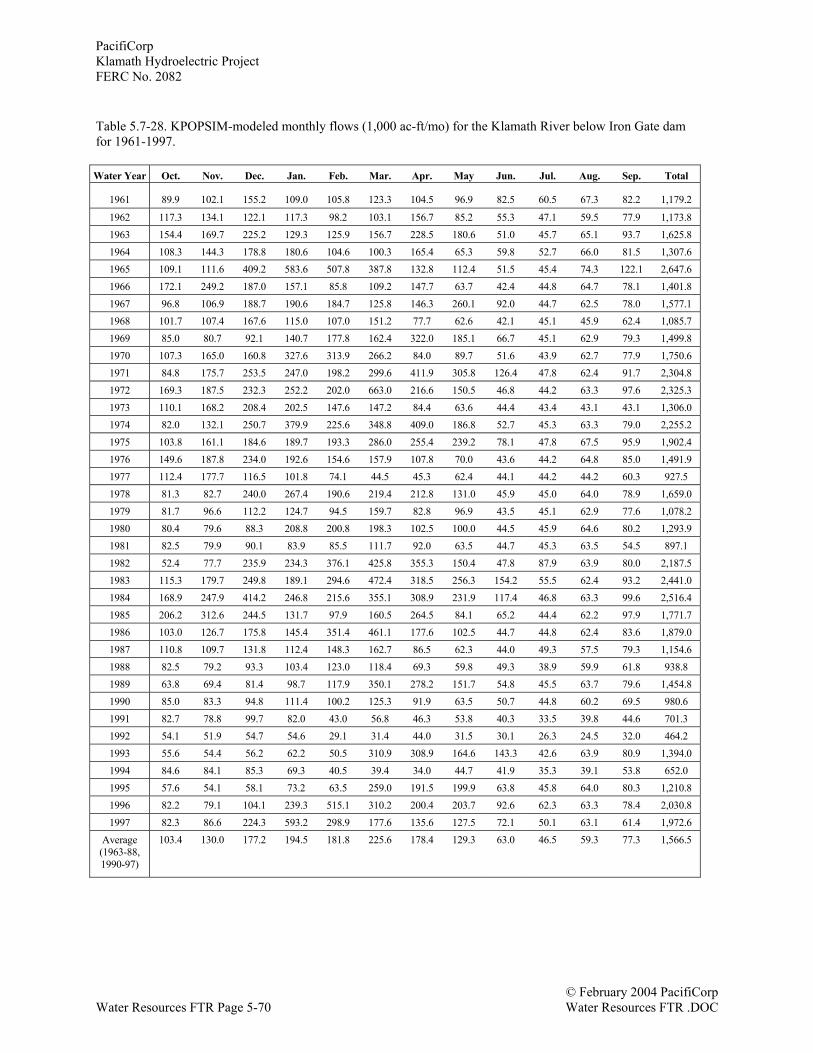
PacifiCorpKlamath Hydroelectric ProjectFERC No. 2082
© February 2004 PacifiCorpWater Resources FTR Page 5-70 Water Resources FTR .DOC
Table 5.7-28. KPOPSIM-modeled monthly flows (1,000 ac-ft/mo) for the Klamath River below Iron Gate damfor 1961-1997.
Water Year Oct. Nov. Dec. Jan. Feb. Mar. Apr. May Jun. Jul. Aug. Sep. Total
1961 89.9 102.1 155.2 109.0 105.8 123.3 104.5 96.9 82.5 60.5 67.3 82.2 1,179.2
1962 117.3 134.1 122.1 117.3 98.2 103.1 156.7 85.2 55.3 47.1 59.5 77.9 1,173.81963 154.4 169.7 225.2 129.3 125.9 156.7 228.5 180.6 51.0 45.7 65.1 93.7 1,625.81964 108.3 144.3 178.8 180.6 104.6 100.3 165.4 65.3 59.8 52.7 66.0 81.5 1,307.61965 109.1 111.6 409.2 583.6 507.8 387.8 132.8 112.4 51.5 45.4 74.3 122.1 2,647.61966 172.1 249.2 187.0 157.1 85.8 109.2 147.7 63.7 42.4 44.8 64.7 78.1 1,401.81967 96.8 106.9 188.7 190.6 184.7 125.8 146.3 260.1 92.0 44.7 62.5 78.0 1,577.11968 101.7 107.4 167.6 115.0 107.0 151.2 77.7 62.6 42.1 45.1 45.9 62.4 1,085.71969 85.0 80.7 92.1 140.7 177.8 162.4 322.0 185.1 66.7 45.1 62.9 79.3 1,499.81970 107.3 165.0 160.8 327.6 313.9 266.2 84.0 89.7 51.6 43.9 62.7 77.9 1,750.61971 84.8 175.7 253.5 247.0 198.2 299.6 411.9 305.8 126.4 47.8 62.4 91.7 2,304.81972 169.3 187.5 232.3 252.2 202.0 663.0 216.6 150.5 46.8 44.2 63.3 97.6 2,325.31973 110.1 168.2 208.4 202.5 147.6 147.2 84.4 63.6 44.4 43.4 43.1 43.1 1,306.01974 82.0 132.1 250.7 379.9 225.6 348.8 409.0 186.8 52.7 45.3 63.3 79.0 2,255.21975 103.8 161.1 184.6 189.7 193.3 286.0 255.4 239.2 78.1 47.8 67.5 95.9 1,902.41976 149.6 187.8 234.0 192.6 154.6 157.9 107.8 70.0 43.6 44.2 64.8 85.0 1,491.91977 112.4 177.7 116.5 101.8 74.1 44.5 45.3 62.4 44.1 44.2 44.2 60.3 927.51978 81.3 82.7 240.0 267.4 190.6 219.4 212.8 131.0 45.9 45.0 64.0 78.9 1,659.01979 81.7 96.6 112.2 124.7 94.5 159.7 82.8 96.9 43.5 45.1 62.9 77.6 1,078.21980 80.4 79.6 88.3 208.8 200.8 198.3 102.5 100.0 44.5 45.9 64.6 80.2 1,293.91981 82.5 79.9 90.1 83.9 85.5 111.7 92.0 63.5 44.7 45.3 63.5 54.5 897.11982 52.4 77.7 235.9 234.3 376.1 425.8 355.3 150.4 47.8 87.9 63.9 80.0 2,187.51983 115.3 179.7 249.8 189.1 294.6 472.4 318.5 256.3 154.2 55.5 62.4 93.2 2,441.01984 168.9 247.9 414.2 246.8 215.6 355.1 308.9 231.9 117.4 46.8 63.3 99.6 2,516.41985 206.2 312.6 244.5 131.7 97.9 160.5 264.5 84.1 65.2 44.4 62.2 97.9 1,771.71986 103.0 126.7 175.8 145.4 351.4 461.1 177.6 102.5 44.7 44.8 62.4 83.6 1,879.01987 110.8 109.7 131.8 112.4 148.3 162.7 86.5 62.3 44.0 49.3 57.5 79.3 1,154.61988 82.5 79.2 93.3 103.4 123.0 118.4 69.3 59.8 49.3 38.9 59.9 61.8 938.81989 63.8 69.4 81.4 98.7 117.9 350.1 278.2 151.7 54.8 45.5 63.7 79.6 1,454.81990 85.0 83.3 94.8 111.4 100.2 125.3 91.9 63.5 50.7 44.8 60.2 69.5 980.61991 82.7 78.8 99.7 82.0 43.0 56.8 46.3 53.8 40.3 33.5 39.8 44.6 701.31992 54.1 51.9 54.7 54.6 29.1 31.4 44.0 31.5 30.1 26.3 24.5 32.0 464.21993 55.6 54.4 56.2 62.2 50.5 310.9 308.9 164.6 143.3 42.6 63.9 80.9 1,394.01994 84.6 84.1 85.3 69.3 40.5 39.4 34.0 44.7 41.9 35.3 39.1 53.8 652.01995 57.6 54.1 58.1 73.2 63.5 259.0 191.5 199.9 63.8 45.8 64.0 80.3 1,210.81996 82.2 79.1 104.1 239.3 515.1 310.2 200.4 203.7 92.6 62.3 63.3 78.4 2,030.81997 82.3 86.6 224.3 593.2 298.9 177.6 135.6 127.5 72.1 50.1 63.1 61.4 1,972.6
Average(1963-88,1990-97)
103.4 130.0 177.2 194.5 181.8 225.6 178.4 129.3 63.0 46.5 59.3 77.3 1,566.5
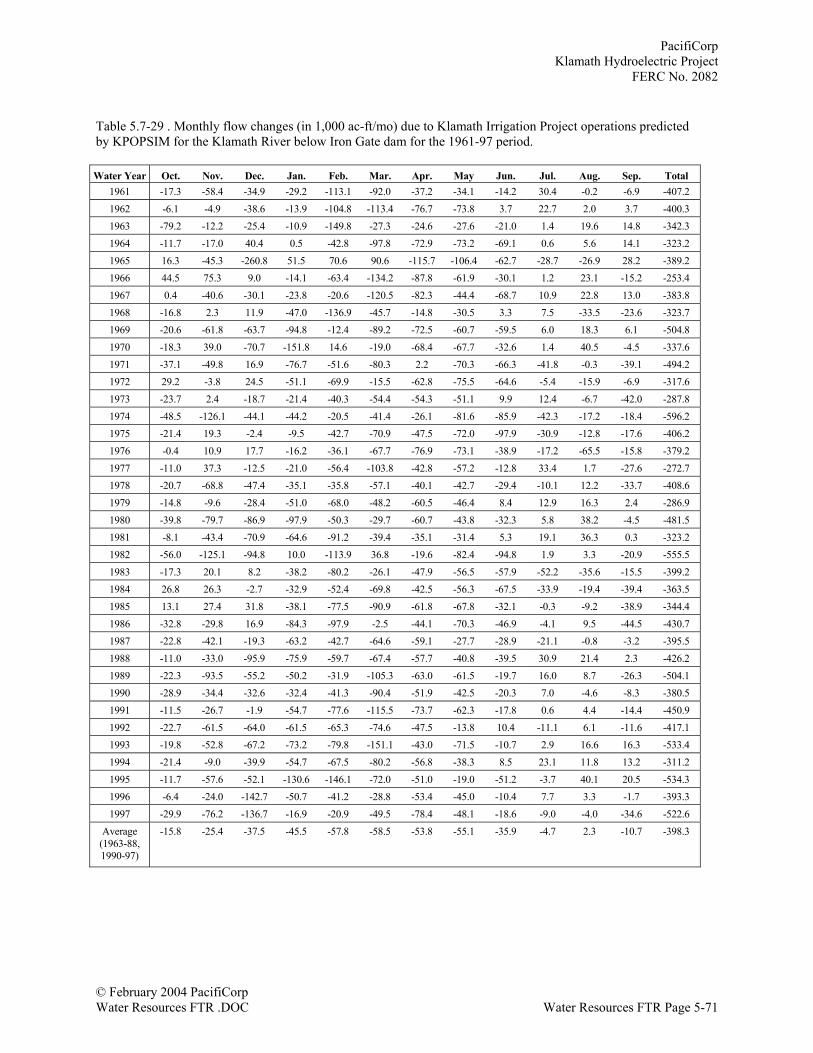
PacifiCorpKlamath Hydroelectric Project
FERC No. 2082
© February 2004 PacifiCorpWater Resources FTR .DOC Water Resources FTR Page 5-71
Table 5.7-29 . Monthly flow changes (in 1,000 ac-ft/mo) due to Klamath Irrigation Project operations predictedby KPOPSIM for the Klamath River below Iron Gate dam for the 1961-97 period.
Water Year Oct. Nov. Dec. Jan. Feb. Mar. Apr. May Jun. Jul. Aug. Sep. Total1961 -17.3 -58.4 -34.9 -29.2 -113.1 -92.0 -37.2 -34.1 -14.2 30.4 -0.2 -6.9 -407.21962 -6.1 -4.9 -38.6 -13.9 -104.8 -113.4 -76.7 -73.8 3.7 22.7 2.0 3.7 -400.31963 -79.2 -12.2 -25.4 -10.9 -149.8 -27.3 -24.6 -27.6 -21.0 1.4 19.6 14.8 -342.31964 -11.7 -17.0 40.4 0.5 -42.8 -97.8 -72.9 -73.2 -69.1 0.6 5.6 14.1 -323.21965 16.3 -45.3 -260.8 51.5 70.6 90.6 -115.7 -106.4 -62.7 -28.7 -26.9 28.2 -389.21966 44.5 75.3 9.0 -14.1 -63.4 -134.2 -87.8 -61.9 -30.1 1.2 23.1 -15.2 -253.41967 0.4 -40.6 -30.1 -23.8 -20.6 -120.5 -82.3 -44.4 -68.7 10.9 22.8 13.0 -383.81968 -16.8 2.3 11.9 -47.0 -136.9 -45.7 -14.8 -30.5 3.3 7.5 -33.5 -23.6 -323.71969 -20.6 -61.8 -63.7 -94.8 -12.4 -89.2 -72.5 -60.7 -59.5 6.0 18.3 6.1 -504.81970 -18.3 39.0 -70.7 -151.8 14.6 -19.0 -68.4 -67.7 -32.6 1.4 40.5 -4.5 -337.61971 -37.1 -49.8 16.9 -76.7 -51.6 -80.3 2.2 -70.3 -66.3 -41.8 -0.3 -39.1 -494.21972 29.2 -3.8 24.5 -51.1 -69.9 -15.5 -62.8 -75.5 -64.6 -5.4 -15.9 -6.9 -317.61973 -23.7 2.4 -18.7 -21.4 -40.3 -54.4 -54.3 -51.1 9.9 12.4 -6.7 -42.0 -287.81974 -48.5 -126.1 -44.1 -44.2 -20.5 -41.4 -26.1 -81.6 -85.9 -42.3 -17.2 -18.4 -596.21975 -21.4 19.3 -2.4 -9.5 -42.7 -70.9 -47.5 -72.0 -97.9 -30.9 -12.8 -17.6 -406.21976 -0.4 10.9 17.7 -16.2 -36.1 -67.7 -76.9 -73.1 -38.9 -17.2 -65.5 -15.8 -379.21977 -11.0 37.3 -12.5 -21.0 -56.4 -103.8 -42.8 -57.2 -12.8 33.4 1.7 -27.6 -272.71978 -20.7 -68.8 -47.4 -35.1 -35.8 -57.1 -40.1 -42.7 -29.4 -10.1 12.2 -33.7 -408.61979 -14.8 -9.6 -28.4 -51.0 -68.0 -48.2 -60.5 -46.4 8.4 12.9 16.3 2.4 -286.91980 -39.8 -79.7 -86.9 -97.9 -50.3 -29.7 -60.7 -43.8 -32.3 5.8 38.2 -4.5 -481.51981 -8.1 -43.4 -70.9 -64.6 -91.2 -39.4 -35.1 -31.4 5.3 19.1 36.3 0.3 -323.21982 -56.0 -125.1 -94.8 10.0 -113.9 36.8 -19.6 -82.4 -94.8 1.9 3.3 -20.9 -555.51983 -17.3 20.1 8.2 -38.2 -80.2 -26.1 -47.9 -56.5 -57.9 -52.2 -35.6 -15.5 -399.21984 26.8 26.3 -2.7 -32.9 -52.4 -69.8 -42.5 -56.3 -67.5 -33.9 -19.4 -39.4 -363.51985 13.1 27.4 31.8 -38.1 -77.5 -90.9 -61.8 -67.8 -32.1 -0.3 -9.2 -38.9 -344.41986 -32.8 -29.8 16.9 -84.3 -97.9 -2.5 -44.1 -70.3 -46.9 -4.1 9.5 -44.5 -430.71987 -22.8 -42.1 -19.3 -63.2 -42.7 -64.6 -59.1 -27.7 -28.9 -21.1 -0.8 -3.2 -395.51988 -11.0 -33.0 -95.9 -75.9 -59.7 -67.4 -57.7 -40.8 -39.5 30.9 21.4 2.3 -426.21989 -22.3 -93.5 -55.2 -50.2 -31.9 -105.3 -63.0 -61.5 -19.7 16.0 8.7 -26.3 -504.11990 -28.9 -34.4 -32.6 -32.4 -41.3 -90.4 -51.9 -42.5 -20.3 7.0 -4.6 -8.3 -380.51991 -11.5 -26.7 -1.9 -54.7 -77.6 -115.5 -73.7 -62.3 -17.8 0.6 4.4 -14.4 -450.91992 -22.7 -61.5 -64.0 -61.5 -65.3 -74.6 -47.5 -13.8 10.4 -11.1 6.1 -11.6 -417.11993 -19.8 -52.8 -67.2 -73.2 -79.8 -151.1 -43.0 -71.5 -10.7 2.9 16.6 16.3 -533.41994 -21.4 -9.0 -39.9 -54.7 -67.5 -80.2 -56.8 -38.3 8.5 23.1 11.8 13.2 -311.21995 -11.7 -57.6 -52.1 -130.6 -146.1 -72.0 -51.0 -19.0 -51.2 -3.7 40.1 20.5 -534.31996 -6.4 -24.0 -142.7 -50.7 -41.2 -28.8 -53.4 -45.0 -10.4 7.7 3.3 -1.7 -393.31997 -29.9 -76.2 -136.7 -16.9 -20.9 -49.5 -78.4 -48.1 -18.6 -9.0 -4.0 -34.6 -522.6
Average(1963-88,1990-97)
-15.8 -25.4 -37.5 -45.5 -57.8 -58.5 -53.8 -55.1 -35.9 -4.7 2.3 -10.7 -398.3
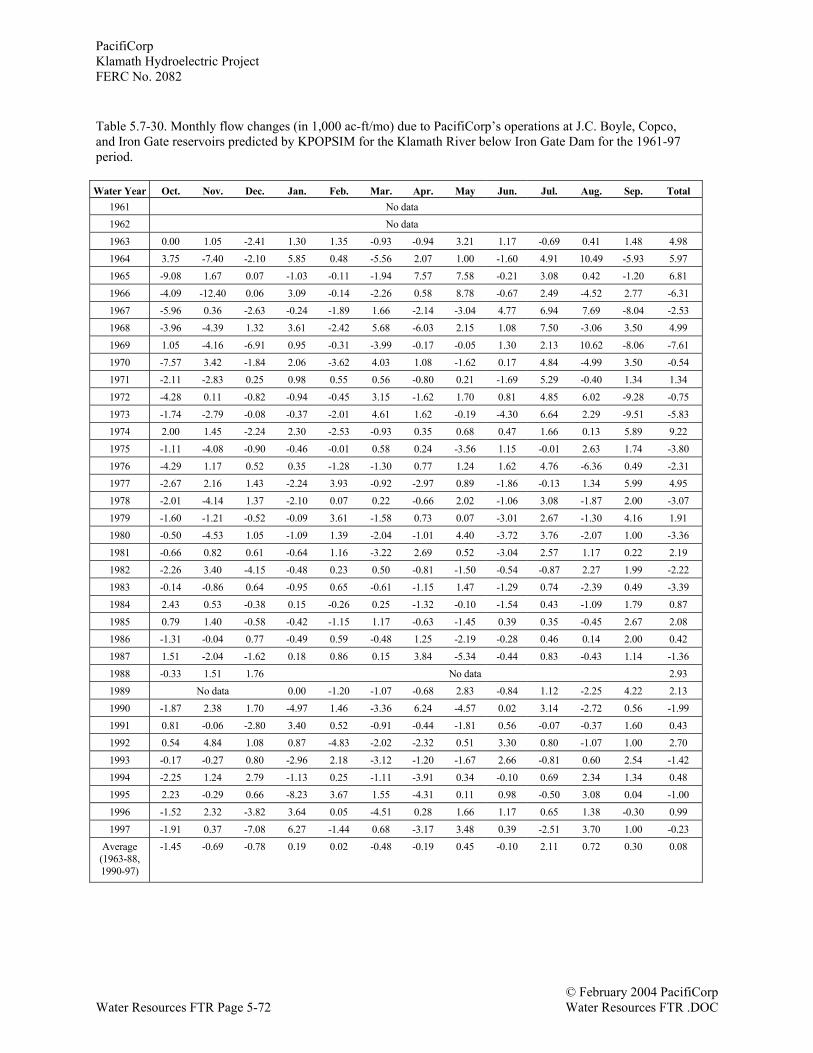
PacifiCorpKlamath Hydroelectric ProjectFERC No. 2082
© February 2004 PacifiCorpWater Resources FTR Page 5-72 Water Resources FTR .DOC
Table 5.7-30. Monthly flow changes (in 1,000 ac-ft/mo) due to PacifiCorp’s operations at J.C. Boyle, Copco,and Iron Gate reservoirs predicted by KPOPSIM for the Klamath River below Iron Gate Dam for the 1961-97period.
Water Year Oct. Nov. Dec. Jan. Feb. Mar. Apr. May Jun. Jul. Aug. Sep. Total1961 No data1962 No data1963 0.00 1.05 -2.41 1.30 1.35 -0.93 -0.94 3.21 1.17 -0.69 0.41 1.48 4.981964 3.75 -7.40 -2.10 5.85 0.48 -5.56 2.07 1.00 -1.60 4.91 10.49 -5.93 5.971965 -9.08 1.67 0.07 -1.03 -0.11 -1.94 7.57 7.58 -0.21 3.08 0.42 -1.20 6.811966 -4.09 -12.40 0.06 3.09 -0.14 -2.26 0.58 8.78 -0.67 2.49 -4.52 2.77 -6.311967 -5.96 0.36 -2.63 -0.24 -1.89 1.66 -2.14 -3.04 4.77 6.94 7.69 -8.04 -2.531968 -3.96 -4.39 1.32 3.61 -2.42 5.68 -6.03 2.15 1.08 7.50 -3.06 3.50 4.991969 1.05 -4.16 -6.91 0.95 -0.31 -3.99 -0.17 -0.05 1.30 2.13 10.62 -8.06 -7.611970 -7.57 3.42 -1.84 2.06 -3.62 4.03 1.08 -1.62 0.17 4.84 -4.99 3.50 -0.541971 -2.11 -2.83 0.25 0.98 0.55 0.56 -0.80 0.21 -1.69 5.29 -0.40 1.34 1.341972 -4.28 0.11 -0.82 -0.94 -0.45 3.15 -1.62 1.70 0.81 4.85 6.02 -9.28 -0.751973 -1.74 -2.79 -0.08 -0.37 -2.01 4.61 1.62 -0.19 -4.30 6.64 2.29 -9.51 -5.831974 2.00 1.45 -2.24 2.30 -2.53 -0.93 0.35 0.68 0.47 1.66 0.13 5.89 9.221975 -1.11 -4.08 -0.90 -0.46 -0.01 0.58 0.24 -3.56 1.15 -0.01 2.63 1.74 -3.801976 -4.29 1.17 0.52 0.35 -1.28 -1.30 0.77 1.24 1.62 4.76 -6.36 0.49 -2.311977 -2.67 2.16 1.43 -2.24 3.93 -0.92 -2.97 0.89 -1.86 -0.13 1.34 5.99 4.951978 -2.01 -4.14 1.37 -2.10 0.07 0.22 -0.66 2.02 -1.06 3.08 -1.87 2.00 -3.071979 -1.60 -1.21 -0.52 -0.09 3.61 -1.58 0.73 0.07 -3.01 2.67 -1.30 4.16 1.911980 -0.50 -4.53 1.05 -1.09 1.39 -2.04 -1.01 4.40 -3.72 3.76 -2.07 1.00 -3.361981 -0.66 0.82 0.61 -0.64 1.16 -3.22 2.69 0.52 -3.04 2.57 1.17 0.22 2.191982 -2.26 3.40 -4.15 -0.48 0.23 0.50 -0.81 -1.50 -0.54 -0.87 2.27 1.99 -2.221983 -0.14 -0.86 0.64 -0.95 0.65 -0.61 -1.15 1.47 -1.29 0.74 -2.39 0.49 -3.391984 2.43 0.53 -0.38 0.15 -0.26 0.25 -1.32 -0.10 -1.54 0.43 -1.09 1.79 0.871985 0.79 1.40 -0.58 -0.42 -1.15 1.17 -0.63 -1.45 0.39 0.35 -0.45 2.67 2.081986 -1.31 -0.04 0.77 -0.49 0.59 -0.48 1.25 -2.19 -0.28 0.46 0.14 2.00 0.421987 1.51 -2.04 -1.62 0.18 0.86 0.15 3.84 -5.34 -0.44 0.83 -0.43 1.14 -1.361988 -0.33 1.51 1.76 No data 2.931989 No data 0.00 -1.20 -1.07 -0.68 2.83 -0.84 1.12 -2.25 4.22 2.131990 -1.87 2.38 1.70 -4.97 1.46 -3.36 6.24 -4.57 0.02 3.14 -2.72 0.56 -1.991991 0.81 -0.06 -2.80 3.40 0.52 -0.91 -0.44 -1.81 0.56 -0.07 -0.37 1.60 0.431992 0.54 4.84 1.08 0.87 -4.83 -2.02 -2.32 0.51 3.30 0.80 -1.07 1.00 2.701993 -0.17 -0.27 0.80 -2.96 2.18 -3.12 -1.20 -1.67 2.66 -0.81 0.60 2.54 -1.421994 -2.25 1.24 2.79 -1.13 0.25 -1.11 -3.91 0.34 -0.10 0.69 2.34 1.34 0.481995 2.23 -0.29 0.66 -8.23 3.67 1.55 -4.31 0.11 0.98 -0.50 3.08 0.04 -1.001996 -1.52 2.32 -3.82 3.64 0.05 -4.51 0.28 1.66 1.17 0.65 1.38 -0.30 0.991997 -1.91 0.37 -7.08 6.27 -1.44 0.68 -3.17 3.48 0.39 -2.51 3.70 1.00 -0.23
Average(1963-88,1990-97)
-1.45 -0.69 -0.78 0.19 0.02 -0.48 -0.19 0.45 -0.10 2.11 0.72 0.30 0.08
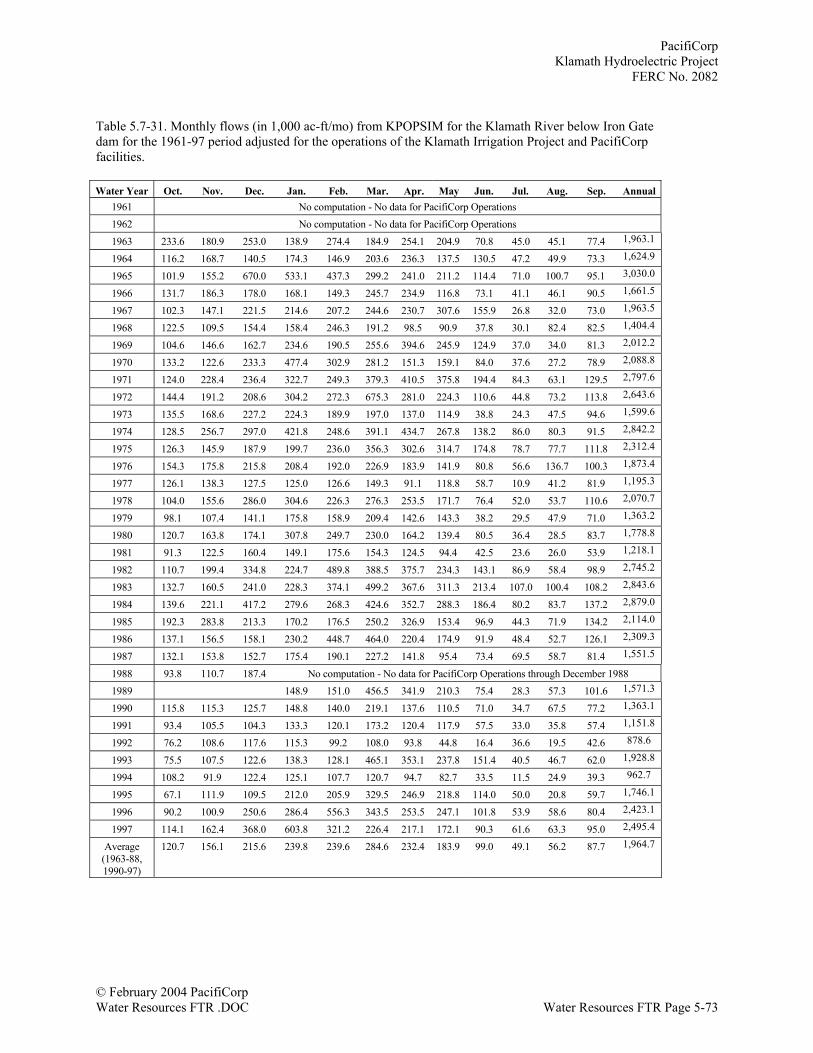
PacifiCorpKlamath Hydroelectric Project
FERC No. 2082
© February 2004 PacifiCorpWater Resources FTR .DOC Water Resources FTR Page 5-73
Table 5.7-31. Monthly flows (in 1,000 ac-ft/mo) from KPOPSIM for the Klamath River below Iron Gatedam for the 1961-97 period adjusted for the operations of the Klamath Irrigation Project and PacifiCorpfacilities.
Water Year Oct. Nov. Dec. Jan. Feb. Mar. Apr. May Jun. Jul. Aug. Sep. Annual1961 No computation - No data for PacifiCorp Operations1962 No computation - No data for PacifiCorp Operations1963 233.6 180.9 253.0 138.9 274.4 184.9 254.1 204.9 70.8 45.0 45.1 77.4 1,963.1
1964 116.2 168.7 140.5 174.3 146.9 203.6 236.3 137.5 130.5 47.2 49.9 73.3 1,624.9
1965 101.9 155.2 670.0 533.1 437.3 299.2 241.0 211.2 114.4 71.0 100.7 95.1 3,030.0
1966 131.7 186.3 178.0 168.1 149.3 245.7 234.9 116.8 73.1 41.1 46.1 90.5 1,661.5
1967 102.3 147.1 221.5 214.6 207.2 244.6 230.7 307.6 155.9 26.8 32.0 73.0 1,963.5
1968 122.5 109.5 154.4 158.4 246.3 191.2 98.5 90.9 37.8 30.1 82.4 82.5 1,404.4
1969 104.6 146.6 162.7 234.6 190.5 255.6 394.6 245.9 124.9 37.0 34.0 81.3 2,012.2
1970 133.2 122.6 233.3 477.4 302.9 281.2 151.3 159.1 84.0 37.6 27.2 78.9 2,088.8
1971 124.0 228.4 236.4 322.7 249.3 379.3 410.5 375.8 194.4 84.3 63.1 129.5 2,797.6
1972 144.4 191.2 208.6 304.2 272.3 675.3 281.0 224.3 110.6 44.8 73.2 113.8 2,643.6
1973 135.5 168.6 227.2 224.3 189.9 197.0 137.0 114.9 38.8 24.3 47.5 94.6 1,599.6
1974 128.5 256.7 297.0 421.8 248.6 391.1 434.7 267.8 138.2 86.0 80.3 91.5 2,842.2
1975 126.3 145.9 187.9 199.7 236.0 356.3 302.6 314.7 174.8 78.7 77.7 111.8 2,312.4
1976 154.3 175.8 215.8 208.4 192.0 226.9 183.9 141.9 80.8 56.6 136.7 100.3 1,873.4
1977 126.1 138.3 127.5 125.0 126.6 149.3 91.1 118.8 58.7 10.9 41.2 81.9 1,195.3
1978 104.0 155.6 286.0 304.6 226.3 276.3 253.5 171.7 76.4 52.0 53.7 110.6 2,070.7
1979 98.1 107.4 141.1 175.8 158.9 209.4 142.6 143.3 38.2 29.5 47.9 71.0 1,363.2
1980 120.7 163.8 174.1 307.8 249.7 230.0 164.2 139.4 80.5 36.4 28.5 83.7 1,778.8
1981 91.3 122.5 160.4 149.1 175.6 154.3 124.5 94.4 42.5 23.6 26.0 53.9 1,218.1
1982 110.7 199.4 334.8 224.7 489.8 388.5 375.7 234.3 143.1 86.9 58.4 98.9 2,745.2
1983 132.7 160.5 241.0 228.3 374.1 499.2 367.6 311.3 213.4 107.0 100.4 108.2 2,843.6
1984 139.6 221.1 417.2 279.6 268.3 424.6 352.7 288.3 186.4 80.2 83.7 137.2 2,879.0
1985 192.3 283.8 213.3 170.2 176.5 250.2 326.9 153.4 96.9 44.3 71.9 134.2 2,114.0
1986 137.1 156.5 158.1 230.2 448.7 464.0 220.4 174.9 91.9 48.4 52.7 126.1 2,309.3
1987 132.1 153.8 152.7 175.4 190.1 227.2 141.8 95.4 73.4 69.5 58.7 81.4 1,551.5
1988 93.8 110.7 187.4 No computation - No data for PacifiCorp Operations through December 19881989 148.9 151.0 456.5 341.9 210.3 75.4 28.3 57.3 101.6 1,571.3
1990 115.8 115.3 125.7 148.8 140.0 219.1 137.6 110.5 71.0 34.7 67.5 77.2 1,363.1
1991 93.4 105.5 104.3 133.3 120.1 173.2 120.4 117.9 57.5 33.0 35.8 57.4 1,151.8
1992 76.2 108.6 117.6 115.3 99.2 108.0 93.8 44.8 16.4 36.6 19.5 42.6 878.6
1993 75.5 107.5 122.6 138.3 128.1 465.1 353.1 237.8 151.4 40.5 46.7 62.0 1,928.8
1994 108.2 91.9 122.4 125.1 107.7 120.7 94.7 82.7 33.5 11.5 24.9 39.3 962.7
1995 67.1 111.9 109.5 212.0 205.9 329.5 246.9 218.8 114.0 50.0 20.8 59.7 1,746.1
1996 90.2 100.9 250.6 286.4 556.3 343.5 253.5 247.1 101.8 53.9 58.6 80.4 2,423.1
1997 114.1 162.4 368.0 603.8 321.2 226.4 217.1 172.1 90.3 61.6 63.3 95.0 2,495.4
Average(1963-88,1990-97)
120.7 156.1 215.6 239.8 239.6 284.6 232.4 183.9 99.0 49.1 56.2 87.7 1,964.7
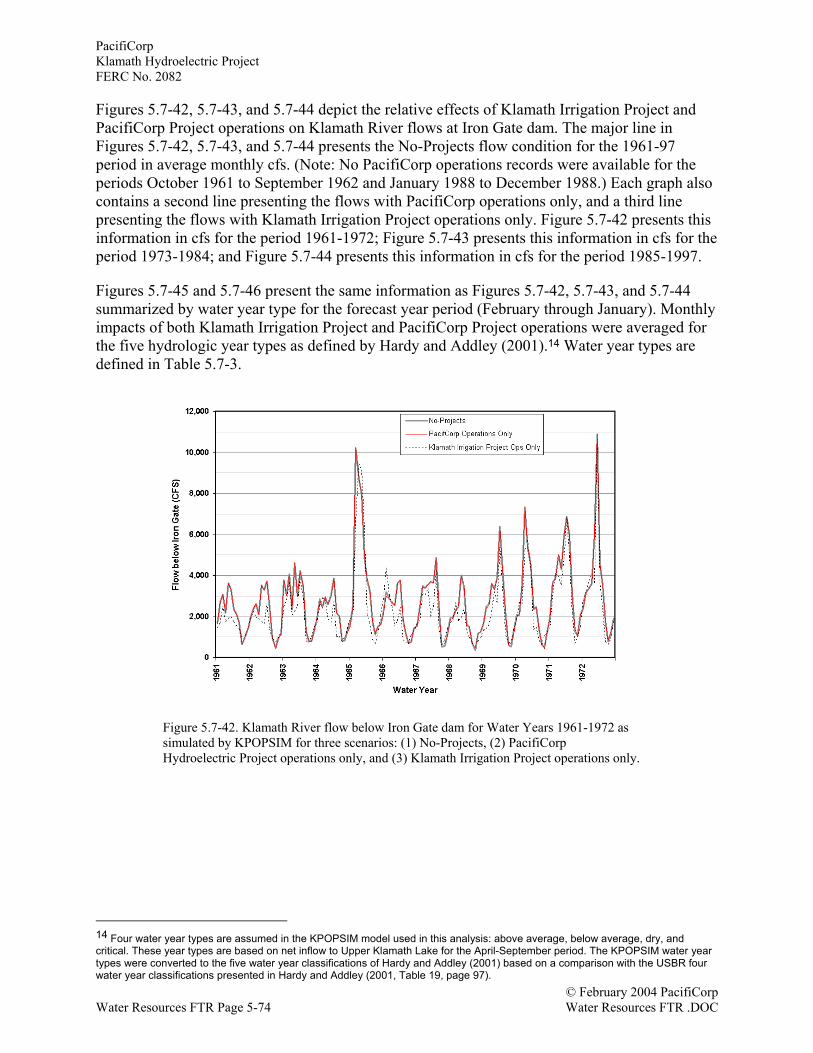
PacifiCorpKlamath Hydroelectric ProjectFERC No. 2082
© February 2004 PacifiCorpWater Resources FTR Page 5-74 Water Resources FTR .DOC
Figures 5.7-42, 5.7-43, and 5.7-44 depict the relative effects of Klamath Irrigation Project andPacifiCorp Project operations on Klamath River flows at Iron Gate dam. The major line inFigures 5.7-42, 5.7-43, and 5.7-44 presents the No-Projects flow condition for the 1961-97period in average monthly cfs. (Note: No PacifiCorp operations records were available for theperiods October 1961 to September 1962 and January 1988 to December 1988.) Each graph alsocontains a second line presenting the flows with PacifiCorp operations only, and a third linepresenting the flows with Klamath Irrigation Project operations only. Figure 5.7-42 presents thisinformation in cfs for the period 1961-1972; Figure 5.7-43 presents this information in cfs for theperiod 1973-1984; and Figure 5.7-44 presents this information in cfs for the period 1985-1997.
Figures 5.7-45 and 5.7-46 present the same information as Figures 5.7-42, 5.7-43, and 5.7-44summarized by water year type for the forecast year period (February through January). Monthlyimpacts of both Klamath Irrigation Project and PacifiCorp Project operations were averaged forthe five hydrologic year types as defined by Hardy and Addley (2001).14 Water year types aredefined in Table 5.7-3.
14 Four water year types are assumed in the KPOPSIM model used in this analysis: above average, below average, dry, andcritical. These year types are based on net inflow to Upper Klamath Lake for the April-September period. The KPOPSIM water yeartypes were converted to the five water year classifications of Hardy and Addley (2001) based on a comparison with the USBR fourwater year classifications presented in Hardy and Addley (2001, Table 19, page 97).
Figure 5.7-42. Klamath River flow below Iron Gate dam for Water Years 1961-1972 assimulated by KPOPSIM for three scenarios: (1) No-Projects, (2) PacifiCorpHydroelectric Project operations only, and (3) Klamath Irrigation Project operations only.
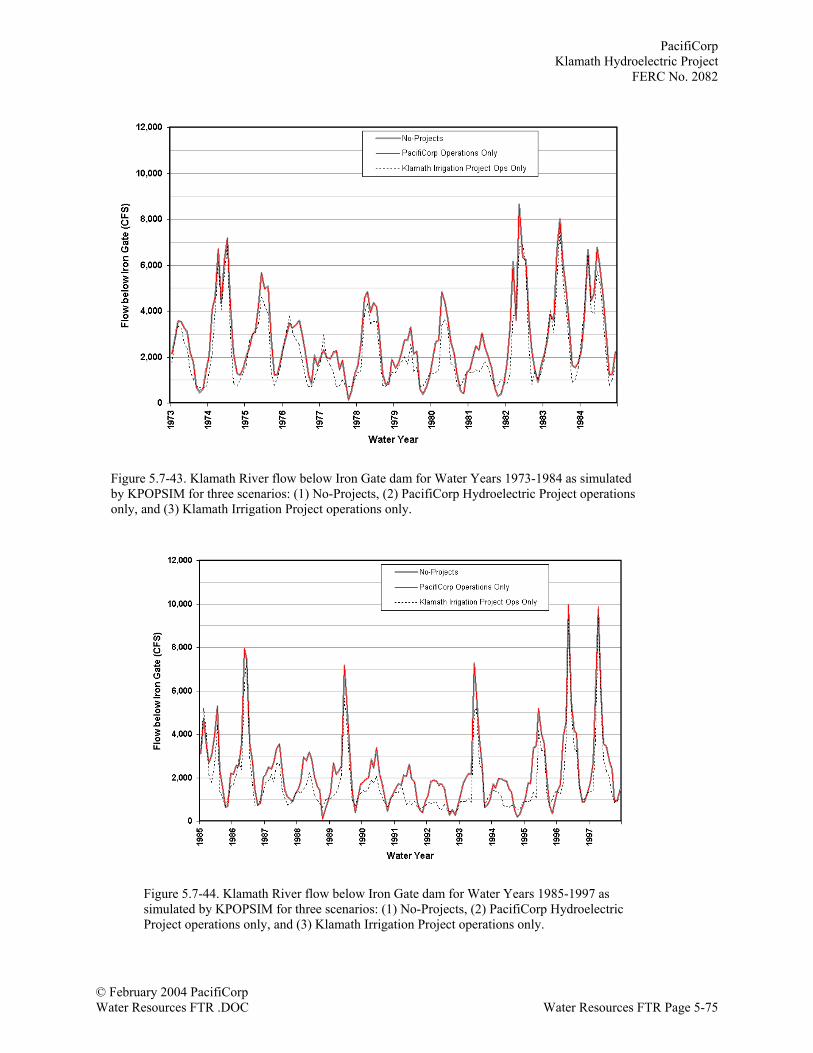
PacifiCorpKlamath Hydroelectric Project
FERC No. 2082
© February 2004 PacifiCorpWater Resources FTR .DOC Water Resources FTR Page 5-75
Figure 5.7-43. Klamath River flow below Iron Gate dam for Water Years 1973-1984 as simulatedby KPOPSIM for three scenarios: (1) No-Projects, (2) PacifiCorp Hydroelectric Project operationsonly, and (3) Klamath Irrigation Project operations only.
Figure 5.7-44. Klamath River flow below Iron Gate dam for Water Years 1985-1997 assimulated by KPOPSIM for three scenarios: (1) No-Projects, (2) PacifiCorp HydroelectricProject operations only, and (3) Klamath Irrigation Project operations only.
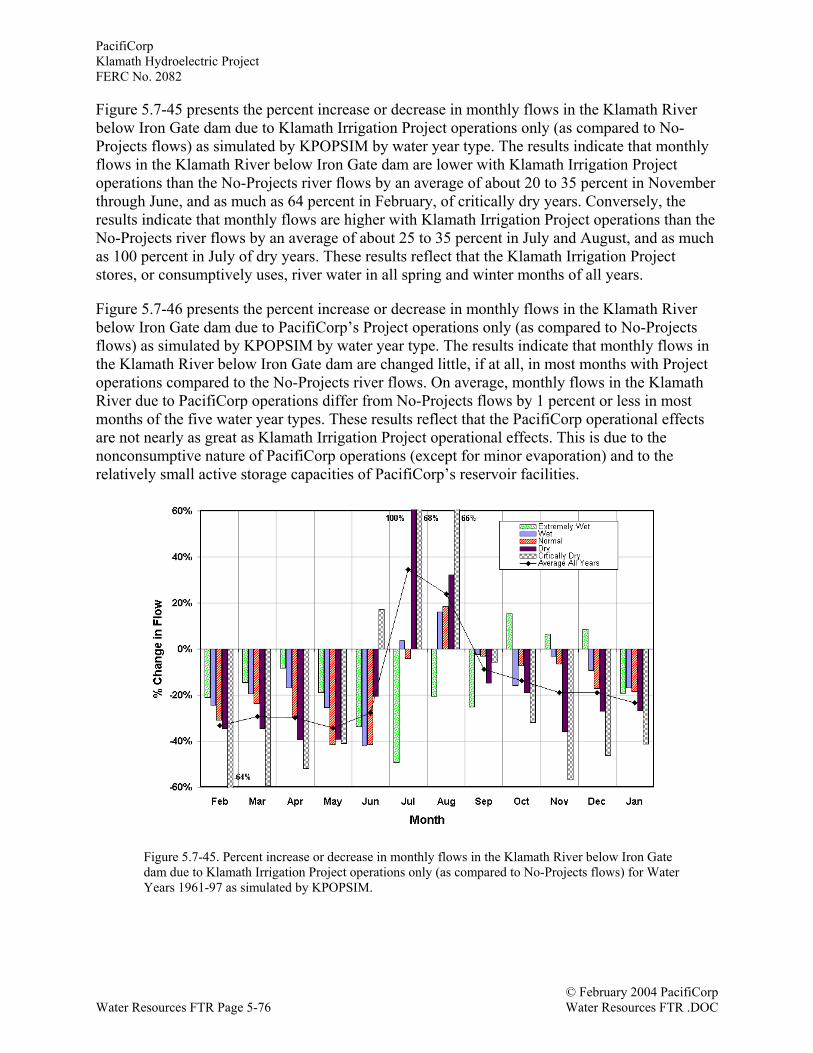
PacifiCorpKlamath Hydroelectric ProjectFERC No. 2082
© February 2004 PacifiCorpWater Resources FTR Page 5-76 Water Resources FTR .DOC
Figure 5.7-45 presents the percent increase or decrease in monthly flows in the Klamath Riverbelow Iron Gate dam due to Klamath Irrigation Project operations only (as compared to No-Projects flows) as simulated by KPOPSIM by water year type. The results indicate that monthlyflows in the Klamath River below Iron Gate dam are lower with Klamath Irrigation Projectoperations than the No-Projects river flows by an average of about 20 to 35 percent in Novemberthrough June, and as much as 64 percent in February, of critically dry years. Conversely, theresults indicate that monthly flows are higher with Klamath Irrigation Project operations than theNo-Projects river flows by an average of about 25 to 35 percent in July and August, and as muchas 100 percent in July of dry years. These results reflect that the Klamath Irrigation Projectstores, or consumptively uses, river water in all spring and winter months of all years.
Figure 5.7-46 presents the percent increase or decrease in monthly flows in the Klamath Riverbelow Iron Gate dam due to PacifiCorp’s Project operations only (as compared to No-Projectsflows) as simulated by KPOPSIM by water year type. The results indicate that monthly flows inthe Klamath River below Iron Gate dam are changed little, if at all, in most months with Projectoperations compared to the No-Projects river flows. On average, monthly flows in the KlamathRiver due to PacifiCorp operations differ from No-Projects flows by 1 percent or less in mostmonths of the five water year types. These results reflect that the PacifiCorp operational effectsare not nearly as great as Klamath Irrigation Project operational effects. This is due to thenonconsumptive nature of PacifiCorp operations (except for minor evaporation) and to therelatively small active storage capacities of PacifiCorp’s reservoir facilities.
Figure 5.7-45. Percent increase or decrease in monthly flows in the Klamath River below Iron Gatedam due to Klamath Irrigation Project operations only (as compared to No-Projects flows) for WaterYears 1961-97 as simulated by KPOPSIM.
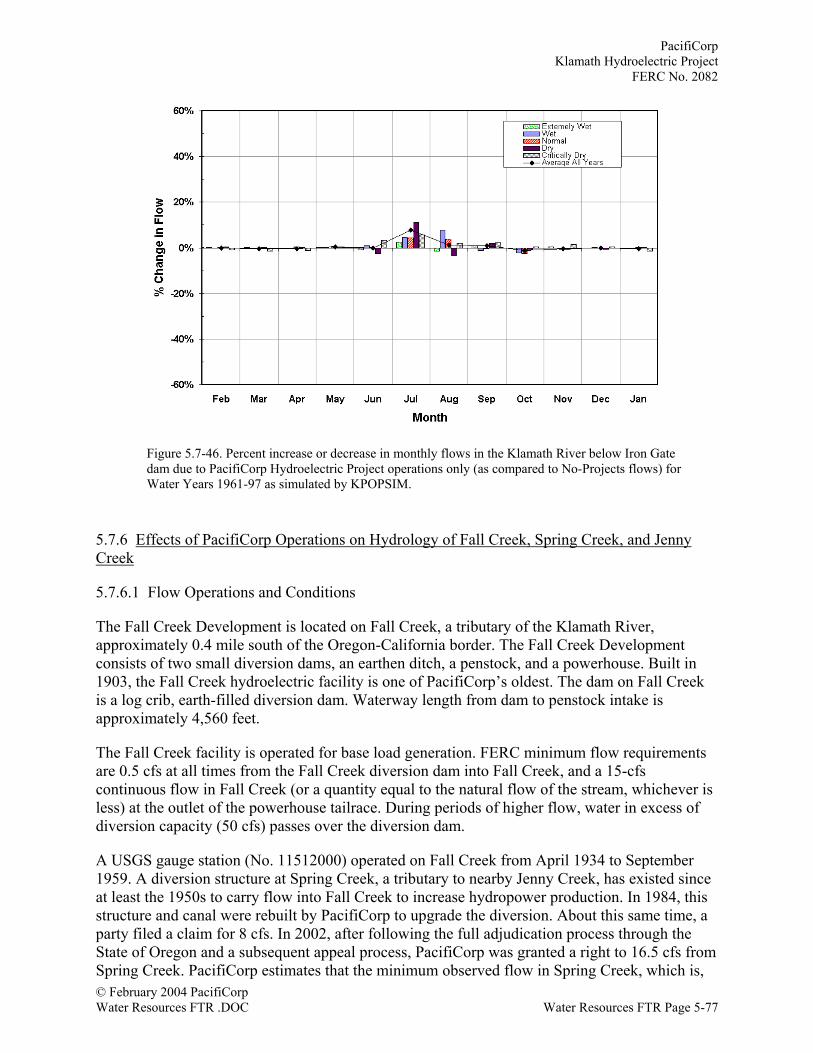
PacifiCorpKlamath Hydroelectric Project
FERC No. 2082
© February 2004 PacifiCorpWater Resources FTR .DOC Water Resources FTR Page 5-77
5.7.6 Effects of PacifiCorp Operations on Hydrology of Fall Creek, Spring Creek, and JennyCreek
5.7.6.1 Flow Operations and Conditions
The Fall Creek Development is located on Fall Creek, a tributary of the Klamath River,approximately 0.4 mile south of the Oregon-California border. The Fall Creek Developmentconsists of two small diversion dams, an earthen ditch, a penstock, and a powerhouse. Built in1903, the Fall Creek hydroelectric facility is one of PacifiCorp’s oldest. The dam on Fall Creekis a log crib, earth-filled diversion dam. Waterway length from dam to penstock intake isapproximately 4,560 feet.
The Fall Creek facility is operated for base load generation. FERC minimum flow requirementsare 0.5 cfs at all times from the Fall Creek diversion dam into Fall Creek, and a 15-cfscontinuous flow in Fall Creek (or a quantity equal to the natural flow of the stream, whichever isless) at the outlet of the powerhouse tailrace. During periods of higher flow, water in excess ofdiversion capacity (50 cfs) passes over the diversion dam.
A USGS gauge station (No. 11512000) operated on Fall Creek from April 1934 to September1959. A diversion structure at Spring Creek, a tributary to nearby Jenny Creek, has existed sinceat least the 1950s to carry flow into Fall Creek to increase hydropower production. In 1984, thisstructure and canal were rebuilt by PacifiCorp to upgrade the diversion. About this same time, aparty filed a claim for 8 cfs. In 2002, after following the full adjudication process through theState of Oregon and a subsequent appeal process, PacifiCorp was granted a right to 16.5 cfs fromSpring Creek. PacifiCorp estimates that the minimum observed flow in Spring Creek, which is,
Figure 5.7-46. Percent increase or decrease in monthly flows in the Klamath River below Iron Gatedam due to PacifiCorp Hydroelectric Project operations only (as compared to No-Projects flows) forWater Years 1961-97 as simulated by KPOPSIM.
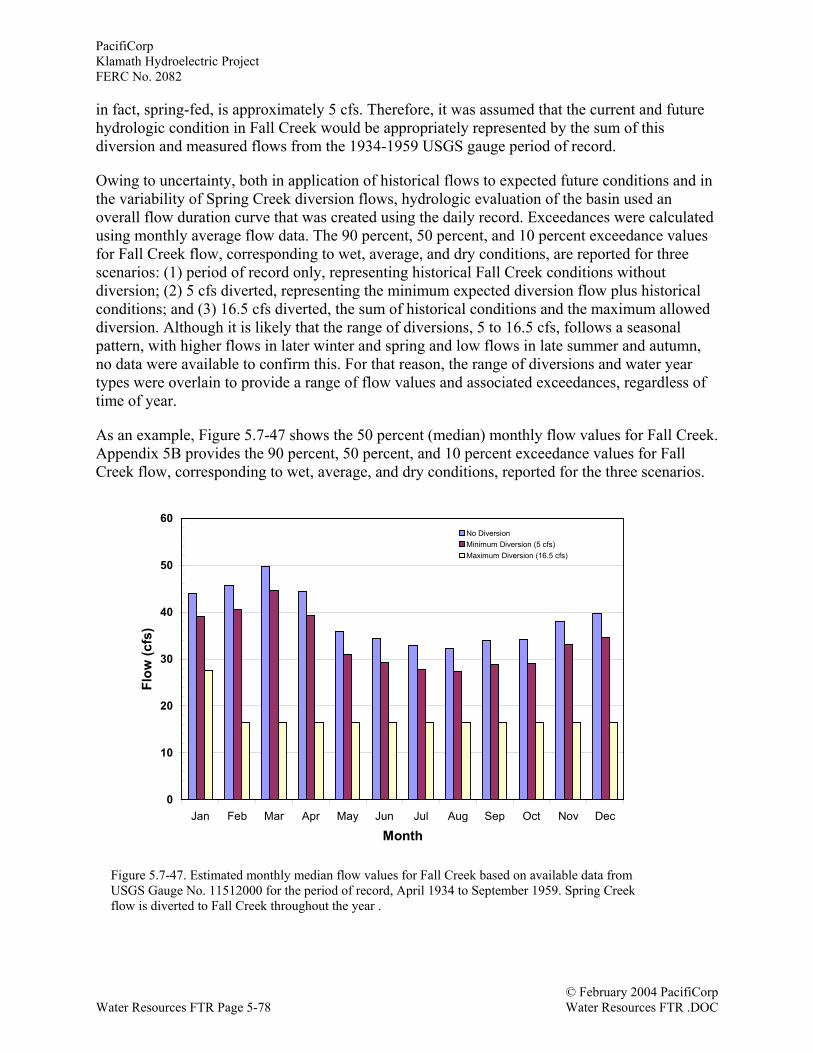
PacifiCorpKlamath Hydroelectric ProjectFERC No. 2082
© February 2004 PacifiCorpWater Resources FTR Page 5-78 Water Resources FTR .DOC
in fact, spring-fed, is approximately 5 cfs. Therefore, it was assumed that the current and futurehydrologic condition in Fall Creek would be appropriately represented by the sum of thisdiversion and measured flows from the 1934-1959 USGS gauge period of record.
Owing to uncertainty, both in application of historical flows to expected future conditions and inthe variability of Spring Creek diversion flows, hydrologic evaluation of the basin used anoverall flow duration curve that was created using the daily record. Exceedances were calculatedusing monthly average flow data. The 90 percent, 50 percent, and 10 percent exceedance valuesfor Fall Creek flow, corresponding to wet, average, and dry conditions, are reported for threescenarios: (1) period of record only, representing historical Fall Creek conditions withoutdiversion; (2) 5 cfs diverted, representing the minimum expected diversion flow plus historicalconditions; and (3) 16.5 cfs diverted, the sum of historical conditions and the maximum alloweddiversion. Although it is likely that the range of diversions, 5 to 16.5 cfs, follows a seasonalpattern, with higher flows in later winter and spring and low flows in late summer and autumn,no data were available to confirm this. For that reason, the range of diversions and water yeartypes were overlain to provide a range of flow values and associated exceedances, regardless oftime of year.
As an example, Figure 5.7-47 shows the 50 percent (median) monthly flow values for Fall Creek.Appendix 5B provides the 90 percent, 50 percent, and 10 percent exceedance values for FallCreek flow, corresponding to wet, average, and dry conditions, reported for the three scenarios.
0
10
20
30
40
50
60
Jan Feb Mar Apr May Jun Jul Aug Sep Oct Nov Dec
Month
Flow
(cfs
)
No DiversionMinimum Diversion (5 cfs)Maximum Diversion (16.5 cfs)
Figure 5.7-47. Estimated monthly median flow values for Fall Creek based on available data fromUSGS Gauge No. 11512000 for the period of record, April 1934 to September 1959. Spring Creekflow is diverted to Fall Creek throughout the year .
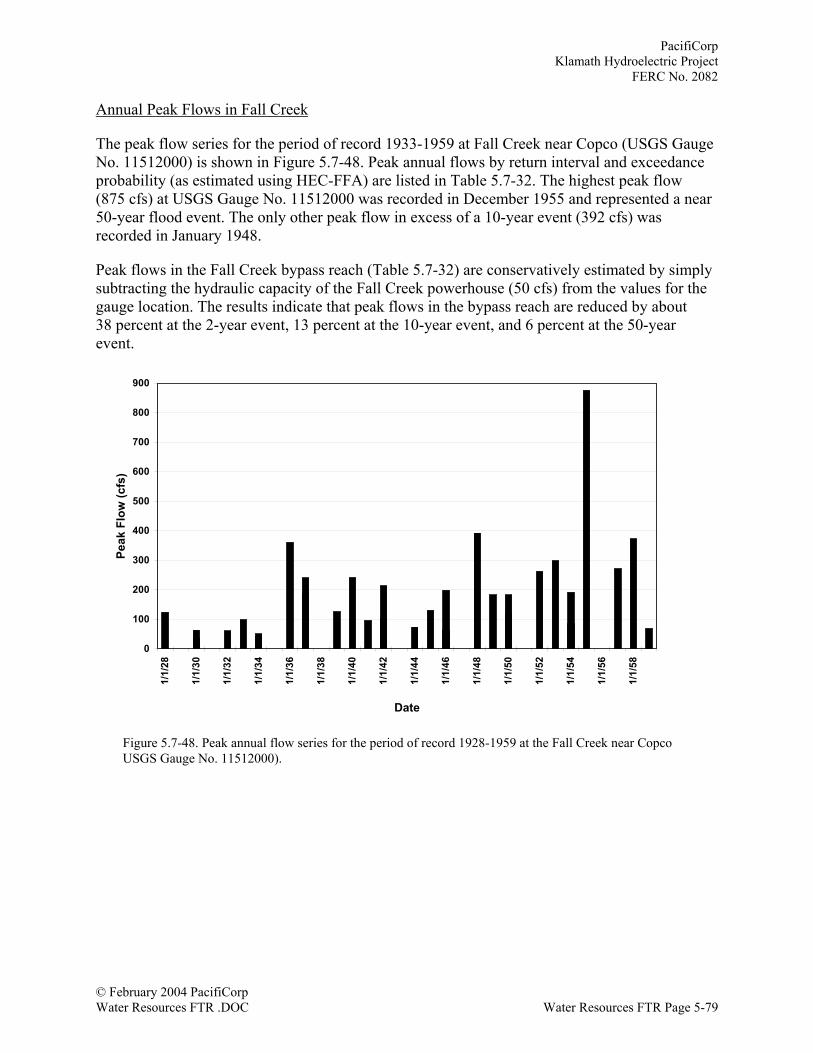
PacifiCorpKlamath Hydroelectric Project
FERC No. 2082
© February 2004 PacifiCorpWater Resources FTR .DOC Water Resources FTR Page 5-79
Annual Peak Flows in Fall Creek
The peak flow series for the period of record 1933-1959 at Fall Creek near Copco (USGS GaugeNo. 11512000) is shown in Figure 5.7-48. Peak annual flows by return interval and exceedanceprobability (as estimated using HEC-FFA) are listed in Table 5.7-32. The highest peak flow(875 cfs) at USGS Gauge No. 11512000 was recorded in December 1955 and represented a near50-year flood event. The only other peak flow in excess of a 10-year event (392 cfs) wasrecorded in January 1948.
Peak flows in the Fall Creek bypass reach (Table 5.7-32) are conservatively estimated by simplysubtracting the hydraulic capacity of the Fall Creek powerhouse (50 cfs) from the values for thegauge location. The results indicate that peak flows in the bypass reach are reduced by about38 percent at the 2-year event, 13 percent at the 10-year event, and 6 percent at the 50-yearevent.
0
100
200
300
400
500
600
700
800
900
1/1/
28
1/1/
30
1/1/
32
1/1/
34
1/1/
36
1/1/
38
1/1/
40
1/1/
42
1/1/
44
1/1/
46
1/1/
48
1/1/
50
1/1/
52
1/1/
54
1/1/
56
1/1/
58
Date
Peak
Flo
w (c
fs)
Figure 5.7-48. Peak annual flow series for the period of record 1928-1959 at the Fall Creek near CopcoUSGS Gauge No. 11512000).
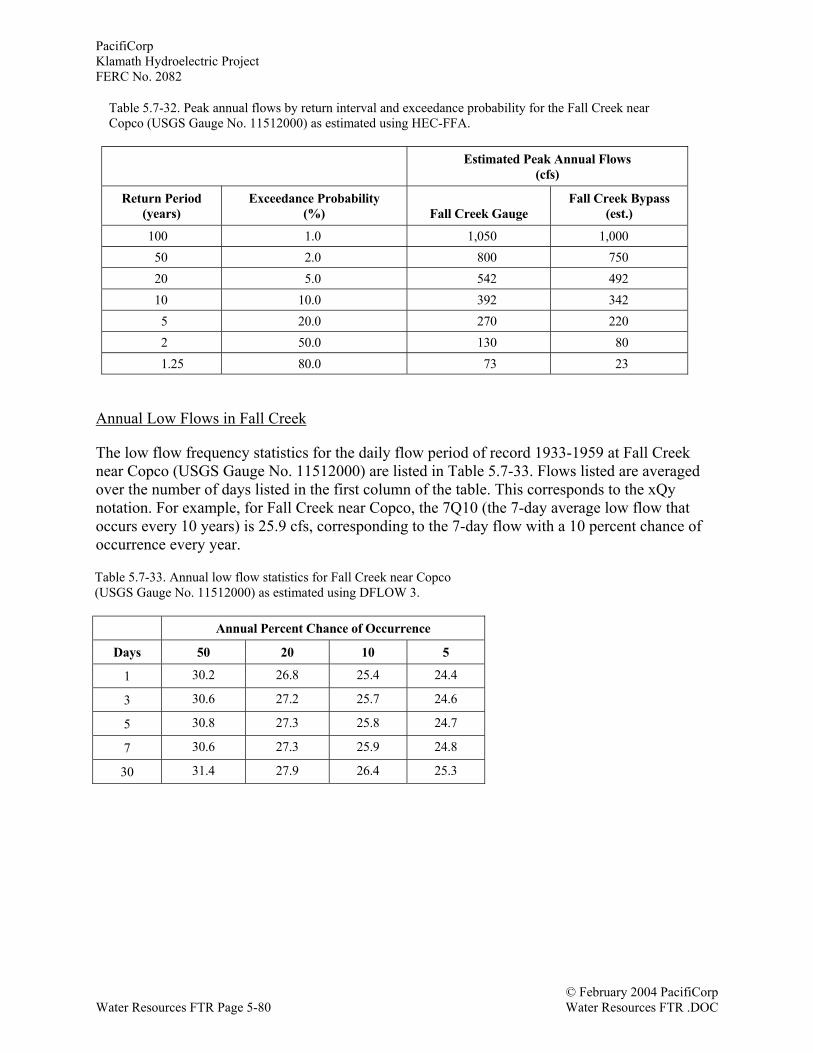
PacifiCorpKlamath Hydroelectric ProjectFERC No. 2082
© February 2004 PacifiCorpWater Resources FTR Page 5-80 Water Resources FTR .DOC
Table 5.7-32. Peak annual flows by return interval and exceedance probability for the Fall Creek nearCopco (USGS Gauge No. 11512000) as estimated using HEC-FFA.
Estimated Peak Annual Flows(cfs)
Return Period(years)
Exceedance Probability(%) Fall Creek Gauge
Fall Creek Bypass(est.)
100 1.0 1,050 1,00050 2.0 800 75020 5.0 542 49210 10.0 392 3425 20.0 270 2202 50.0 130 801.25 80.0 73 23
Annual Low Flows in Fall Creek
The low flow frequency statistics for the daily flow period of record 1933-1959 at Fall Creeknear Copco (USGS Gauge No. 11512000) are listed in Table 5.7-33. Flows listed are averagedover the number of days listed in the first column of the table. This corresponds to the xQynotation. For example, for Fall Creek near Copco, the 7Q10 (the 7-day average low flow thatoccurs every 10 years) is 25.9 cfs, corresponding to the 7-day flow with a 10 percent chance ofoccurrence every year.
Table 5.7-33. Annual low flow statistics for Fall Creek near Copco(USGS Gauge No. 11512000) as estimated using DFLOW 3.
Annual Percent Chance of Occurrence
Days 50 20 10 5
1 30.2 26.8 25.4 24.4
3 30.6 27.2 25.7 24.6
5 30.8 27.3 25.8 24.7
7 30.6 27.3 25.9 24.8
30 31.4 27.9 26.4 25.3


![FTR Appendix 13A - Home : PacifiCorp Resources FTR Appendix 13A.DOC Water Resources FTR—Appendix 13A Page 9 Figure A-5. Turbidity values (in Nephlometric Turbidity Units [NTU]) measured](https://img.pdfslide.us/doc/110x75/5aa501147f8b9ae7438cccb1/ftr-appendix-13a-home-pacificorp-resources-ftr-appendix-13adoc-water-resources.jpg)