Embed Size (px)
Citation preview

___________________________________________________________________________________________________________________________________The 1998 High School Transcript Study
5-1 User's Guide and Technical Report
5. DATA PROCESSING PROCEDURES
Westat processed the data from the 1998 High School Transcript Study (HSTS) along threesimultaneous paths as follows:
The Student Sampling Information System;
The Computer Assisted Data Entry System; and
The Computer Assisted Coding and Editing System.
With the exception of the transcripts and the course catalogs, some data entered in eachsystem were collected by Westat field personnel and some data had already been assembled for NAEPinto data files by the Educational Testing Service (ETS). Westat staff obtained the relevant NAEP datafiles from ETS and merged them with the HSTS data collected from nonNAEP-participating schools. Asdescribed below, appropriate checks were made to ensure that only one set of data was entered for aschool or a student, and procedures were developed to resolve inconsistencies among the data sources.The three data processing paths are described in Sections 5-1 through 5-3.
When entering and cleaning the data for the study, the following tasks were performed:
Establishing Student ID Control Lists;
Entering Transcript Data;
Coding Course Catalogs;
Matching Transcript Titles to Catalog Titles;
Standardizing Credits and Grades; and
Performing Quality Control Checks.
These steps involved the entry and coding of the students’ transcripts and the schools’ coursecatalogs, as well as matching the courses on the coded catalogs to the courses on the transcripts. Each ofthese steps is described in detail in the sections below.
___________________________________________________________________________________________________________________________________The 1998 High School Transcript StudyUser's Guide and Technical Report 5-2
5.1 Establishing Student ID Control Lists
Student ID control lists were developed from lists obtained from the NAEP administrationrecords for schools that participated in NAEP. The control list for a school is the master list of IDs againstwhich all other operations are checked. Only IDs matching those on the control lists are processed, asother IDs are either out of scope or miskeyings. In addition, each data processing step must account for allthe IDs on the control list or for a well-defined subset of those IDs. Only NAEP students who wereidentified during the NAEP administration as 12th graders were retained on the control lists generatedfrom NAEP. Students identified as 10th or 11th graders, or those with an unknown grade, were removedfrom the lists.
For schools that did not participate in NAEP, or that had lost the linkage between thestudents’ names and their IDs, control lists were compiled from completed Transcript Request Forms-Version 2. A data file was created for each school listing the valid student IDs for that specific HSTSschool.
5.1.1 Student Sampling Information System
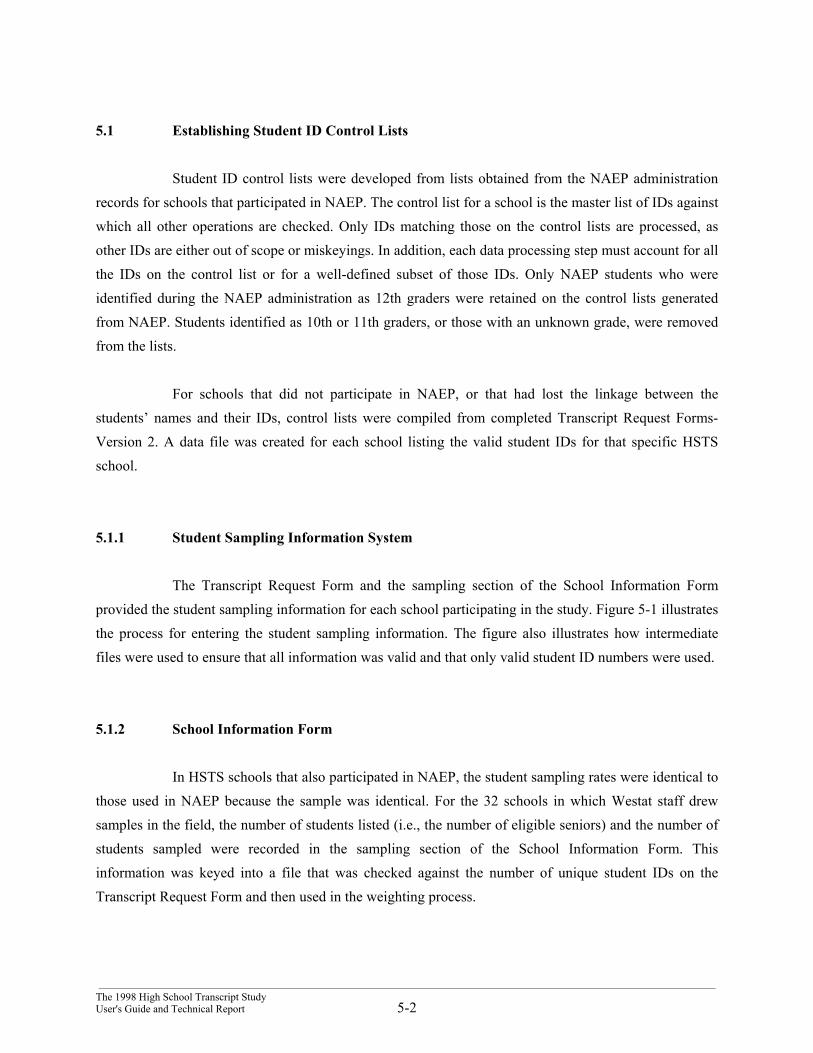
The Transcript Request Form and the sampling section of the School Information Formprovided the student sampling information for each school participating in the study. Figure 5-1 illustratesthe process for entering the student sampling information. The figure also illustrates how intermediatefiles were used to ensure that all information was valid and that only valid student ID numbers were used.
5.1.2 School Information Form
In HSTS schools that also participated in NAEP, the student sampling rates were identical tothose used in NAEP because the sample was identical. For the 32 schools in which Westat staff drewsamples in the field, the number of students listed (i.e., the number of eligible seniors) and the number ofstudents sampled were recorded in the sampling section of the School Information Form. Thisinformation was keyed into a file that was checked against the number of unique student IDs on theTranscript Request Form and then used in the weighting process.
___________________________________________________________________________________________________________________________________The 1998 High School Transcript Study
5-3 User's Guide and Technical Report
From SD/LEPdata entry
Disability Flagand Status
SD/LEP File
Student File
Exit StatusReconciliation
Student Information File(clean)
From transcriptdata entry
List showingSchool NAEPLinkage Status
ID Reconciliation
Master TRF File
Merge and Check forDuplicate IDs
TRF File withnon-NAEP IDs
StudentInformation File
(includes exitstatus)
Student ID controlfiles for each
school
TRF File withNAEP IDs
Data Entry andVerification
TRF(reviewed)
Initial Supervisory Review
SchoolInformation Form
(SIF)
TranscriptRequest Form
(TRF)
Figure 5-1. Student information processing and ID reconciliation
___________________________________________________________________________________________________________________________________The 1998 High School Transcript StudyUser's Guide and Technical Report 5-4
5.1.3 Transcript Request Form
The preprinted information on the Transcript Request Form was drawn from the NAEPstudent file. For schools that kept their NAEP materials, data entry was uncomplicated. Westat staff firstcreated a file containing the preprinted information from the TRF with one record per student. Eachstudent’s graduation status as indicated on the TRF was entered at the end of each record. If necessary,Westat staff corrected the demographic data preprinted on the TRF and then key verified these entries.Finally, Westat staff key entered and verified all the TRFs from the schools for which new samples weredrawn in the 1998 study.
Westat merged the NAEP and non-NAEP TRF files and checked for valid IDs andduplicates. Information in the TRF file and receipt control was used to create a list of valid schoolidentifiers with a flag indicating each school’s linkage status to NAEP. The linkage flag had four possiblevalues:
0 = School did not participate in HSTS;
1 = Both school ID and student IDs linked to NAEP;
2 = School participated in HSTS only; and
3 = School participated in NAEP but, because a new sample was drawn, the student IDsdo not match the NAEP booklet numbers.
The TRF file was also used to create a list of all valid student IDs within each school. Theselists were key control mechanisms that were used throughout all phases of the study to ensure that onlyvalid IDs could be attached to each data record. For example, during entry of the transcript data, one ofthe data entry clerk’s first steps was to key in the school ID and a student ID. As these IDs were keyed,the Computer Assisted Data Entry (CADE) system checked the IDs against the control lists and refused toaccept any IDs not listed.
5.2 CADE System for Entering Transcript Data
The CADE system included three basic screens for data entry. The first screen was used toenter student-level information (date of birth, date of graduation, type of diploma, etc.). The secondscreen was used to enter data on any honors received and scores on standardized tests. The third screen
___________________________________________________________________________________________________________________________________The 1998 High School Transcript Study
5-5 User's Guide and Technical Report
was used to enter course data from the transcripts, including course title, grade, credits received, yeartaken, and a number of “flags,” or special features. The data for all students in a school were collected ina set of three database files, one file corresponding to each of the three screens.
The CADE system displayed labeled blank fields which the data entry clerk filled in asdirected. The system checked each entry to verify that it was within an allowed range and warned theclerk when a problem occurred. Clerks entered data exactly as it appeared on the transcript, using theTranscript Format Checklist as a guide to look for specific needed information on transcripts from a givenschool. The checklist included student’s birthdate, race/ethnicity and gender, SD/LEP status, graduationdate, type of diploma awarded, details about an individual course, total number of credits received andwhether abbreviations or codes were used on the transcript. The data entry staff were instructed to useabbreviations for course titles (see Exhibit 5-1) and to change any Roman numerals to Arabic numerals.When all the transcripts for a school were completed, the status of the school file changed from“incomplete” to “ready for verification.”
5.2.1 Verification of Transcript Data
All transcript data were 100 percent verified in the CADE system by a staff member otherthan the one who initially entered the data. The verification portion of the CADE system is essentially a“re-do and match” process where data are re-entered (blind to the first entry), and the computer stopswhen a nonmatch between the original data and the current data is encountered. Verifiers can then eitheraccept the original entry or override it with the verified entry.
All fields were rekeyed except the course name field, test name field, and honors name field.These three fields were displayed and reviewed by verifiers but were not key verified. As the three“name” fields were not used for any automated analyses and required the greatest number of key strokesto enter, it was felt that the most cost-effective use of resources was to perform a visual verification ratherthan a rekeying. In addition, allowing the verifier to see the name of the course, test, or honors beingentered greatly simplified the task of ensuring that the verifier entered data in the same sequence as theoriginal keyer.

___________________________________________________________________________________________________________________________________The 1998 High School Transcript StudyUser's Guide and Technical Report 5-6
Exhibit 5-1. Abbreviations for data entry
Advanced ......................................... AdvAdvanced Placement........................ APAmerican.......................................... AmerBeginning......................................... BegBiology............................................. BioCollege Prep(aratory)....................... CPCooperative ...................................... CoopEducation ......................................... EdEnglish ............................................. EnglGeneral............................................. GenGovernment...................................... GovtHistory ............................................. Hist
Honors .............................................. HonIndustrial Arts................................... IAIntermediate...................................... IntermedInternational Baccalaureate .............. IBIntroduction ...................................... IntroMathematics ..................................... MathPhysical Education ........................... PEScience ............................................. SciSpecial Education............................. SpEdTrigonometry.................................... TrigUnited States .................................... USVocational ........................................Voc
5.3 CACE System for Coding and Editing Course Catalogs
The Computer Aided Coding and Editing (CACE) System is a Paradox-database systemspecifically created for coding high school catalogs. It consists of two major components: (1) acomponent for selecting and entering the most appropriate Classification of Secondary School Courses(CSSC) code and “flags” for each course in a catalog and (2) a component for matching each entry on atranscript with an entry in the corresponding school’s list of course offerings. The system also providedfor data selection and entry, maintained file consistency, and produced output files suitable for furtheranalysis and manipulation. CACE’s user interface was designed to reduce the likelihood of coding errorsby encouraging selection from a list rather than key entry of data items.
The CACE System presents each title in a school’s catalog to the catalog coder one at a time.The catalog coder then examines a “suggestion list” of potential codes for that course. The list issynchronized with an on-line version of the CSSC so that the coder can simultaneously compare thedescription for the course in the CSSC with the course description in the school catalog. The coder canselect the appropriate CSSC code either in the suggestion list or in the corresponding section of theCSSC. If no catalog was provided, a catalog was created for the school, based on a list of coursescommonly offered by high schools. The list was augmented by adding courses that reasonably would beexpected to be offered, even if they did not occur on a transcript. For example, if transcripts included thefirst and third years of a foreign language, it would be expected that the school also offered the secondyear of that language, even if that course did not appear on any transcript in the HSTS sample.

___________________________________________________________________________________________________________________________________The 1998 High School Transcript Study
5-7 User's Guide and Technical Report
An alternative procedure allows the catalog coder to type the CSSC code directly into theappropriate data field on the screen. The CACE system checks all entries against the master CSSC listbefore allowing the record to be stored in the database. If the items in the suggestion list are not goodmatches to the course description, the catalog coder can always browse through the full on-line CSSC orrefer to the hard copy of the CSSC. If the coder cannot determine an appropriate code for a course, he orshe may select a special code from the suggestion list that will mark the course for further considerationby the coding supervisor.
5.3.1 General Procedures for Coding Course Catalogs
To assure consistency and quality, catalog coding decisions were based on a basic set ofcoding principles and procedures. First, the catalog coder reviewed a school catalog “holistically” toascertain ways that course levels, special education, and other special programs were designated. He orshe looked for sequences of courses, descriptions of programs, requirements, credits awarded, or otherinformation provided, to obtain a general view of the curriculum. Then, using CACE, the coder looked ateach course title, found it in the catalog, and read whatever description was available. The coder thenselected the best CSSC code for the course. Wherever possible, the catalog coder selected codes based ona course description rather than on title.
After selecting the CSSC code, the coder reviewed the flags for that course and edited themas needed. If the coder found courses in the CACE catalog listing that should not be there, they could bedeleted. Similarly, if the coder found that a course was missing from the CACE listing of catalog titles, itwas added to the list and coded. After the coder finished coding the regular education courses for aschool, the special education expert coded all special education courses.
The specific steps of the coding procedure are described below.
5.3.2 Entering Course Titles
A curriculum specialist examined all catalog listings, regardless of how the catalog wascreated. Every attempt was made to eliminate duplicates and to ensure that course titles included
___________________________________________________________________________________________________________________________________The 1998 High School Transcript StudyUser's Guide and Technical Report 5-8
appropriate annotations for grade (“English 10”), level (“Biology, AP”), or special programs(“Automechanics Coop Ed”). Errors were corrected by data entry personnel and the corrected list wasagain reviewed by the curriculum specialist.
Two variables indicating the source of information for a given school’s catalog are providedwith the School File. One variable indicates whether or not the course list that we used was derived fromtranscripts. The other indicates the type of catalog which the school provided (school-level catalogs orcourse lists, district catalogs, or schools without catalogs). The type of catalog or course list that theschool provided is indicated by the CATTYPE variable on the School File. For ease of use, thesevariables also appear in the Course Offerings File.
5.3.2.1 School-level Catalogs or Course Lists
If a school provided a catalog of course offerings (as requested), data entry personnel entereda list of all course titles appearing in the catalog. A concerted effort was made to standardize the format oftitles. All Roman numerals were converted to Arabic numerals. Abbreviation were standardized for allfrequently appearing courses (or words in courses) such as “ADV” for “advanced,” or “BEG” for“beginning,” or “INTRO” for “introduction.” These abbreviations are the same as those used by thetranscript data entry clerks (see Exhibit 5-1).
About 75 percent of the schools provided more than one year’s catalog. Catalogs from allyears received were used to determine whether there were significant changes over the years provided.The School Information Form indicated if there were any significant changes in course offerings over thefour years in which graduating students attended the school. A curriculum specialist selected the portionsof each catalog to be used so that they excluded sections on programs that students could take only byattending another school in the district, courses taken at night, and so on. The specialist includedprograms from previous years that were not listed in the current catalog but were offered during theperiod when students in the HSTS attended the school. These titles were entered in the order of theirappearance in the catalogs.
___________________________________________________________________________________________________________________________________The 1998 High School Transcript Study
5-9 User's Guide and Technical Report
5.3.2.2 District-level Catalogs
Both school-level and district-level catalogs were found at many schools. Twenty schoolsprovided catalogs of courses offered by their entire school district, while the individual school’s specificcourse offerings were a subset of those included in the district catalog. Often these district catalogsincluded programs that were known not to be offered at the home school (such as an InternationalBaccalaureate program, a vocational program, or a performing arts program). To account for coursesactually offered at such schools, a list was created in the same manner as for schools not providing anycatalog (i.e., creating it from titles appearing on transcripts), but the resulting list was supplemented withcourses from the district catalog that were likely to be offered in the HSTS school (such as AdvancedPlacement English 12, Accounting, or Basic Biology) even if they did not appear on a transcript. Thus,the Course Offering File represents the best approximation of the complete list of courses offered by theirschools to the 1998 graduates in the sample.
5.3.2.3 Schools without Catalogs
Approximately 6 percent of the schools (17 of 264) did not provide any list of coursesoffered at the school. For these schools, which were most often very small, a course list was generatedduring the process of transcript data entry. When a course was entered that did not already appear on acourse offering list, it was added to the list using a function key programmed specifically for this purpose.The resulting list of courses taken by students at the school was then treated as the school’s catalog.
There are significant limitations to creating catalogs for a school in this manner: (1) the listrepresents only courses taken by students in the sample and may not include all courses actually offered atthat school; (2) many courses are repeated, since the same course may have been entered into thetranscript file in two different formats (e.g., “CONSTRUCTION 1” and “CONSTRUCTION TRADES 1,“or “GLBL STDY 9” and “GLOBAL STUDIES 9”), and (3) no course description is available to clarifythe meaning of a title. These catalogs required considerable review and editing before course codingcould proceed. Schools with catalogs generated using the procedure described above have the variableCATSRCE set to 0 in the School File. Other schools have the CATSRCE variable set to 1.
___________________________________________________________________________________________________________________________________The 1998 High School Transcript StudyUser's Guide and Technical Report 5-10
5.3.3 Classification of Secondary School Courses
Westat used the Classification of Secondary School Courses (CSSC), includingmodifications that were made during the 1987, 1990, and 1994 HSTS, as a standard for classifying andcoding the courses offered by all the schools in the 1998 HSTS and all the courses appearing ontranscripts of students included in the HSTS. The CSSC is a 6-digit, hierarchical numbering system for allregular and special education courses offered in American secondary schools. Each CSSC entry includesa 6-digit code, a course title and alternate titles, as well as a course description.
Westat updated the CSSC significantly in 1989 to reflect changes in the breadth and types ofcourses taken by students in the 1987 HSTS. The CSSC was supplemented for the 1990 HSTS, and againin 1994, but only modestly. Appendix B of the Tabulations Report lists 83 courses that were revised oradded to the CSSC for the 1998 HSTS. No previously existing CSSC courses were deleted. Many of thesenew codes were added in 1998 to differentiate Advanced Placement (AP) and International Baccalaureate(IB) courses from other honors-level courses. Two new values of the remedial/honors flag were alsoadded for these courses.
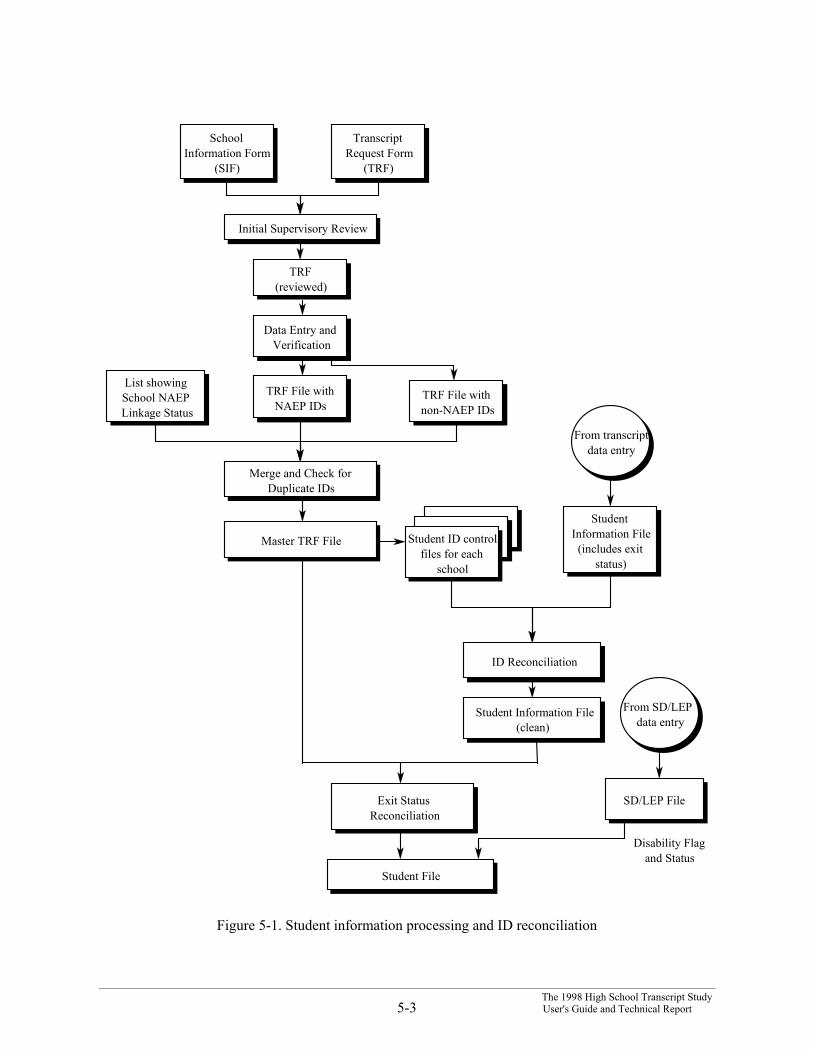
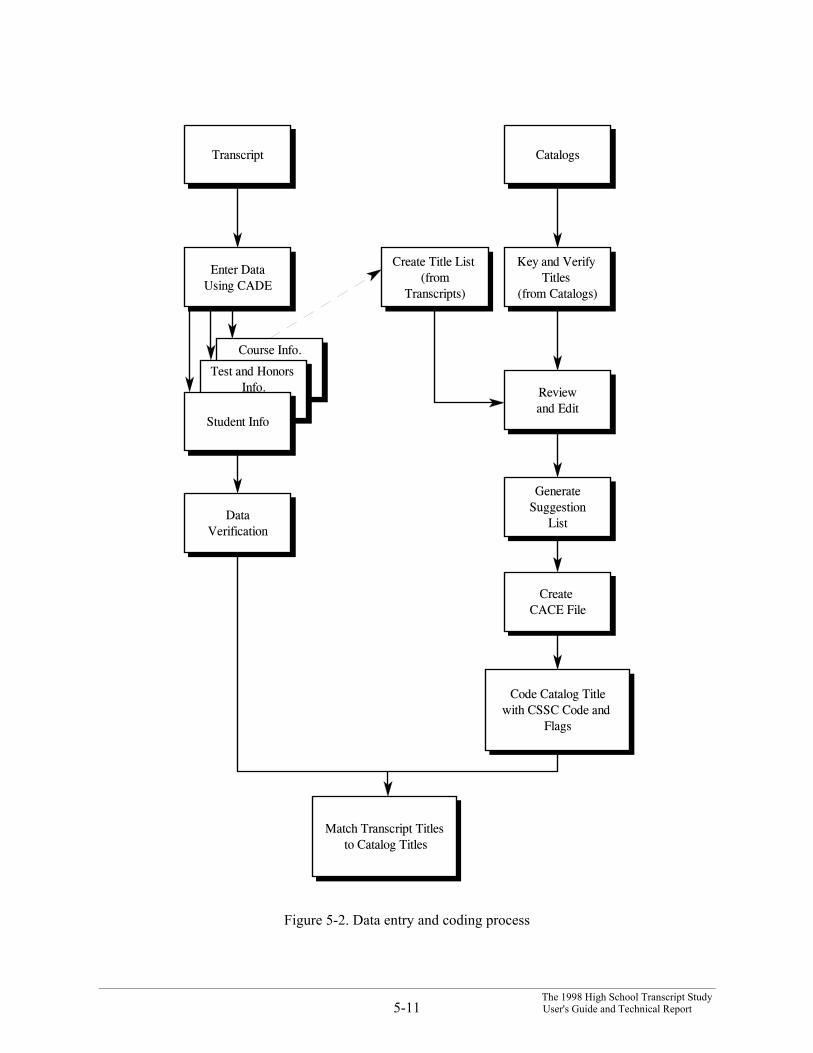
Figure 5-2 is a schematic of the data entry and coding systems illustrating the process used.
5.3.3.1 Flags
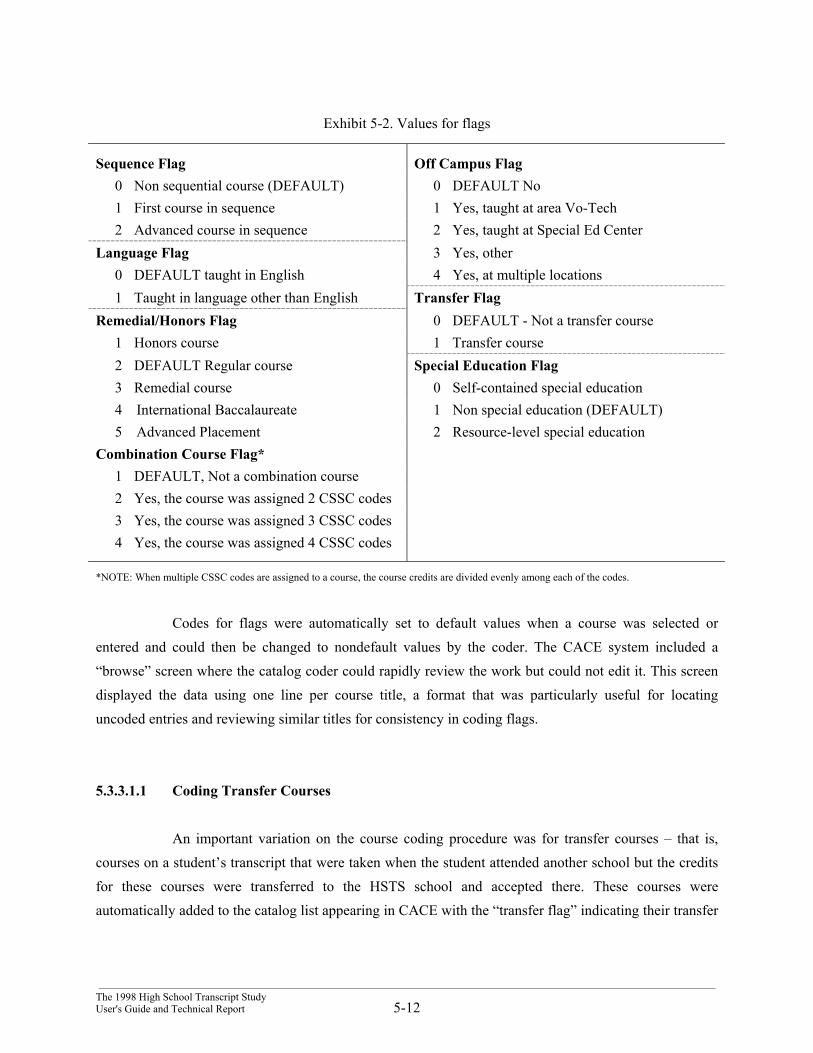
Westat coded additional information for each course as a series of single-digit “flags.” Theseflags were used to indicate special features of a course such as its relationship to other courses in asequence of courses, the language of instruction for the course, the level of the course (honors, regular, orremedial), whether it was a combination course (a multi-subject course requiring multiple codes such asan art appreciation/music appreciation course), the location at which the course was taught, and anyenrollment restrictions (regular or disabled students). A full list of flags and their values is shown inExhibit 5-2.
___________________________________________________________________________________________________________________________________The 1998 High School Transcript Study
5-11 User's Guide and Technical Report
Match Transcript Titles to Catalog Titles
Code Catalog Title with CSSC Code and
Flags
Create Title List (from
Transcripts)
Course Info.
Test and Honors Info.
Create CACE File
Generate Suggestion
List
Review and Edit
Key and Verify Titles
(from Catalogs)
Catalogs
Data Verification
Student Info
Enter Data Using CADE
Transcript
Figure 5-2. Data entry and coding process
___________________________________________________________________________________________________________________________________The 1998 High School Transcript StudyUser's Guide and Technical Report 5-12
Exhibit 5-2. Values for flags
Sequence Flag Off Campus Flag0 Non sequential course (DEFAULT) 0 DEFAULT No1 First course in sequence 1 Yes, taught at area Vo-Tech2 Advanced course in sequence 2 Yes, taught at Special Ed Center
Language Flag 3 Yes, other0 DEFAULT taught in English 4 Yes, at multiple locations1 Taught in language other than English Transfer Flag
Remedial/Honors Flag 0 DEFAULT - Not a transfer course1 Honors course 1 Transfer course2 DEFAULT Regular course Special Education Flag3 Remedial course 0 Self-contained special education4 International Baccalaureate 1 Non special education (DEFAULT)5 Advanced Placement 2 Resource-level special education
Combination Course Flag*1 DEFAULT, Not a combination course2 Yes, the course was assigned 2 CSSC codes3 Yes, the course was assigned 3 CSSC codes4 Yes, the course was assigned 4 CSSC codes
*NOTE: When multiple CSSC codes are assigned to a course, the course credits are divided evenly among each of the codes.
Codes for flags were automatically set to default values when a course was selected orentered and could then be changed to nondefault values by the coder. The CACE system included a“browse” screen where the catalog coder could rapidly review the work but could not edit it. This screendisplayed the data using one line per course title, a format that was particularly useful for locatinguncoded entries and reviewing similar titles for consistency in coding flags.
5.3.3.1.1 Coding Transfer Courses
An important variation on the course coding procedure was for transfer courses – that is,courses on a student’s transcript that were taken when the student attended another school but the creditsfor these courses were transferred to the HSTS school and accepted there. These courses wereautomatically added to the catalog list appearing in CACE with the “transfer flag” indicating their transfer
___________________________________________________________________________________________________________________________________The 1998 High School Transcript Study
5-13 User's Guide and Technical Report
status. In coding these transfer courses, the catalog coder could use only the course title to assign CSSCcodes. No descriptive information was available unless the course was taken in the same school districtand a district catalog was available for review.
To address this issue, the CACE system built a list of transfer course titles and previouslyassigned CSSC codes and used these to assign CSSC codes automatically to transfer courses that matcheditems in the list. When a new transfer course was coded, it was added to the list. Since the number oftransfer titles for a school could be quite large – sometimes up to 80 percent of the titles for the entireschool in an area with a highly transient population – this automated procedure saved a great deal of timeand ensured that identical titles always received identical codes.
Coders performed manual title matching only for nontransfer courses. Transfer titles wereautomatically matched by CACE since the catalog entries are copies of transcript titles. For transfercourses, a copy of the title of each transfer course was placed in the catalog course listing file so that itcould be coded with an appropriate CSSC code. Since these titles in the catalog are identical to thoseappearing in the transcript course list, they could be matched to one another automatically.
5.3.3.1.2 Coding Special Education Courses
Special education courses were coded by a specialist holding an advanced degree in specialeducation. All special education coding was reviewed by the coding supervisor, who had extensiveexpertise in special education. Special education courses were coded using the same procedures andCACE features as those used for other courses.
5.4 Matching Transcript Titles to Catalog Titles
Once the transcript data entry was complete, the next step in the coding process was tomatch transcript titles to catalog titles. Catalog coders completed a table that associated each course titleappearing on a transcript with the title of a course in the school’s catalog and its corresponding CSSCcode and flags. The process was somewhat more difficult than might be expected because of the lack ofuniformity in how courses are entered on transcripts, even within the same school. The task was alsosomewhat complex because both flags and course titles must be matched, e.g., “Algebra 1” with an
___________________________________________________________________________________________________________________________________The 1998 High School Transcript StudyUser's Guide and Technical Report 5-14
honors flag had to be appropriately matched with an honors level course in the catalog. For all schools,special education titles on transcripts were matched to appropriate catalog titles in special education bythe supervisor.
The CACE system includes a facility for matching titles of courses appearing on one or moretranscripts in a school to a course appearing in the course catalog. When a catalog coder entered the titlematching facility, the system divided the screen into two windows. The upper window contained ascrollable list of transcript courses in alphabetical order and their associated transfer flag, language flag,and remedial/honors flag. The lower window contained a scrollable list of course titles from the highschool’s catalog and their associated flags. The catalog coder selected a course title in the upper windowand then scrolled through the list in the lower window to find the matching catalog title. The coderspecified the matching catalog course by highlighting it and pressing the Enter key. The catalog title thenappeared next to the corresponding transcript title in the upper window. This process continued until eachtranscript title was associated with a catalog title. To minimize the effort required for title matching, eachtranscript title was presented for matching only once. Thus, even though “English 9” appeared on all thetranscripts from a school, the coder needed to match it only once.
A CSSC code was assigned to each course listed on a transcript by matching each uniquecourse title on a transcript to a specific CSSC-coded course in the school’s catalog. The CSSC codethereby was associated with the transcript title. The associations were based on a match of the title, level(i.e., average, honors, remedial), and flags (transfer, language of instruction, disability) for each transcriptentry. The matching process also served as an additional check on the accuracy of both transcript andcatalog title data entry. For example, if an entry appeared in the transcript but not in the catalog, thecatalog coder reviewed the transcript to determine whether the course should actually have been markedwith the transfer flag. The coder reviewed the catalog to determine whether the course was erroneouslyomitted from the list of catalog titles. Sometimes this process revealed entire programs that students tookthat were not described or even mentioned in the school catalog. This discrepancy may have occurredbecause the only catalog provided was out of date and different courses were offered in 1994-1998 thanwere represented in the older catalog.
One of the major difficulties encountered in evaluating transcript course titles occurred whencourse titles were abbreviated. The original meaning of these abbreviations was difficult to determine.Some could be deciphered by knowing the program offered at a school (e.g., “EFE” is “Economics andFree Enterprise”), but others remained indecipherable despite all of our efforts (e.g., “ARCS”). Some
___________________________________________________________________________________________________________________________________The 1998 High School Transcript Study
5-15 User's Guide and Technical Report
titles could reasonably be assigned to a broad domain, if not to a specific course. For example, “ABCMath” can be matched to the “Math-Other” course title and CSSC code. An ambiguous title was matchedto an “other” course and code within a specific discipline whenever possible. Otherwise, the course wasassigned a code of “600000” for “uncodable.” This code was assigned to 918 of the over 1,000,000courses entered. It represents less than 0.1 percent of the transcript entries.
5.5 Standardizing Credits and Grades
Since credit and grade information reported on transcripts varied considerably amongschools, districts and states, it was necessary to standardize this information so that valid student- andschool-level comparisons could be made. Standardized credit information was based on the CarnegieUnit, which was defined as the number of credits a student received for a course taken every day, oneperiod per day, for a full school year. For each school, the catalog coder filled out a Carnegie Unit Report(Exhibit 5-3). The factor for converting credits reported on the transcript to the standard Carnegie Unitwas verified by the curriculum specialist and then key entered for each school by data entry personnel.
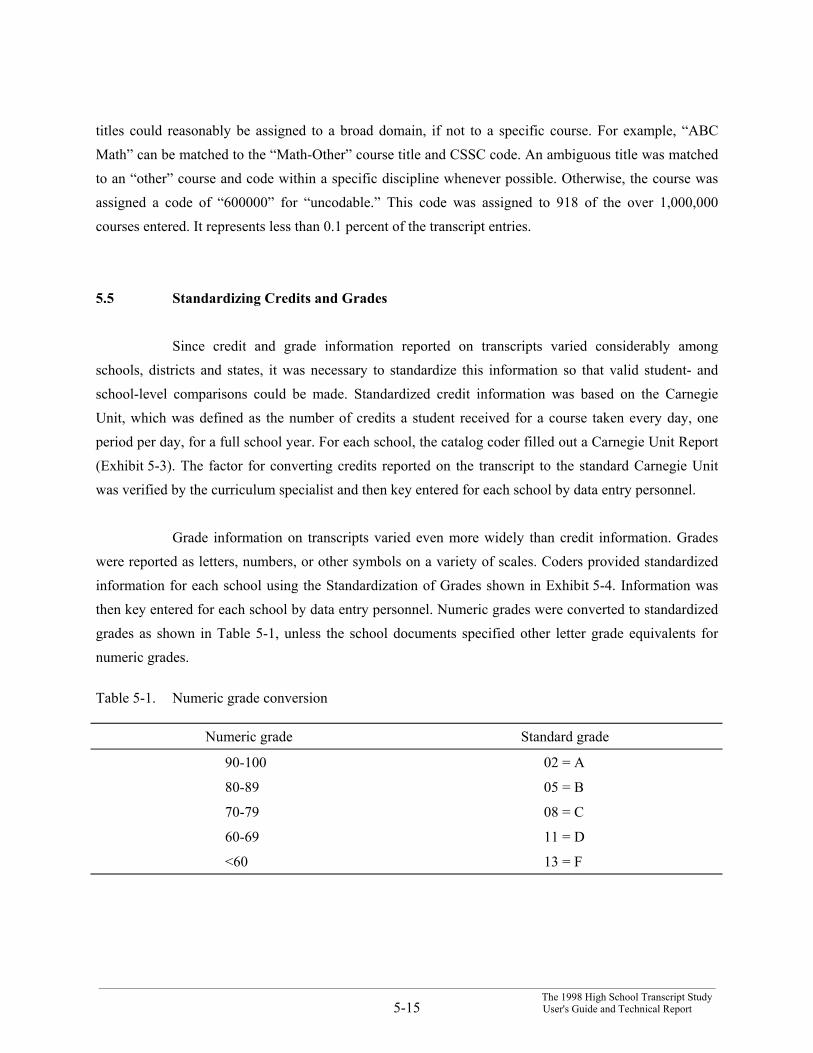
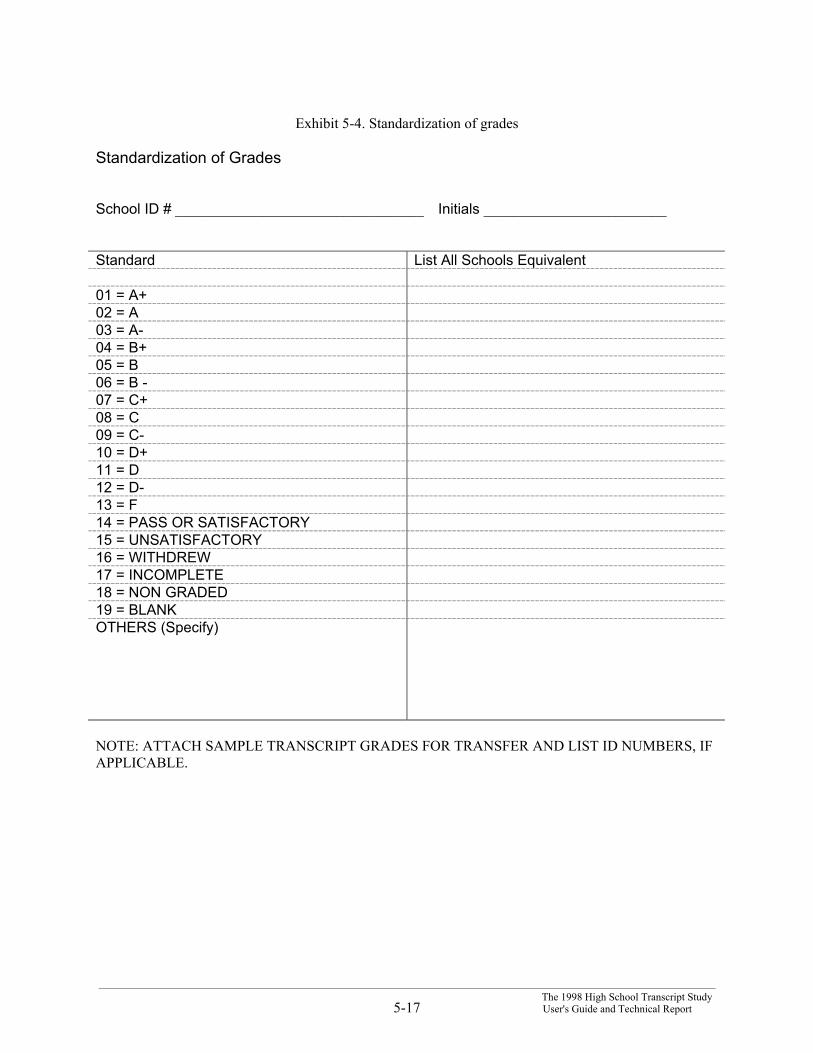
Grade information on transcripts varied even more widely than credit information. Gradeswere reported as letters, numbers, or other symbols on a variety of scales. Coders provided standardizedinformation for each school using the Standardization of Grades shown in Exhibit 5-4. Information wasthen key entered for each school by data entry personnel. Numeric grades were converted to standardizedgrades as shown in Table 5-1, unless the school documents specified other letter grade equivalents fornumeric grades.
Table 5-1. Numeric grade conversion
Numeric grade Standard grade
90-100 02 = A
80-89 05 = B
70-79 08 = C
60-69 11 = D
<60 13 = F

___________________________________________________________________________________________________________________________________The 1998 High School Transcript StudyUser's Guide and Technical Report 5-16
Exhibit 5-3. Carnegie Unit Report
NAEP School ID: Date:
School Name:
____________ = 1 Carnegie Unit# of Credits
• Explicitly stated in school documents
___ Yes ___ No
Indicate where:
• Inferred from transcript data (Check one)
Indicates # of credits received for a full year course taken every day, 1 period.
___ Yes ___ No
Indicates # of credits received for a semester-long course taken every day, 1 period
___ Yes ___ No
• Data Source (Check all that apply)
___ Catalogs ___ SIF ___ Other
___ Transcripts ___ Called school (attach report)
• Any changes over the past four (4) years?
1997 - 98 # of credits =
1996 - 97 # of credits =
1995 - 96 # of credits =
1994 - 95 # of credits =
___________________________________________________________________________________________________________________________________The 1998 High School Transcript Study
5-17 User's Guide and Technical Report
Exhibit 5-4. Standardization of grades
Standardization of Grades
School ID # __________________________________ Initials _________________________
Standard List All Schools Equivalent
01 = A+02 = A03 = A-04 = B+05 = B06 = B -07 = C+08 = C09 = C-10 = D+11 = D12 = D-13 = F14 = PASS OR SATISFACTORY15 = UNSATISFACTORY16 = WITHDREW17 = INCOMPLETE18 = NON GRADED19 = BLANKOTHERS (Specify)
NOTE: ATTACH SAMPLE TRANSCRIPT GRADES FOR TRANSFER AND LIST ID NUMBERS, IFAPPLICABLE.

___________________________________________________________________________________________________________________________________The 1998 High School Transcript StudyUser's Guide and Technical Report 5-18
5.6 Quality Control Checks
As noted already, CACE has a component for selecting and entering CSSC codes and flagsfor courses listed in a catalog. It also matches each entry on a transcript with an entry in the school’s listof course offerings. Yet another component of the CACE system automatically converted the credits oneach transcript to Carnegie Units, then compared the number of credits entered to the number of creditsrequired for graduation in that school, school district, or state (depending upon which was the mostreliable source of information). This automated check verified that the total credits entered for a studentwere less than 150 percent of the total number of credits required for graduation and not fewer than thetotal credits required. This range was necessary because many students take more than the minimumrequirements for graduation, while only a small number of students graduate with fewer than the requiredcredits. When the total credits that a student had earned was less than the number needed to graduate, orgreater than 150 percent of the number required to graduate, the transcript and the data files wereexamined to see if a mistake had occurred. Any mistakes were corrected and the total credits wererecalculated and compared to the graduation requirement.
In a few cases, Westat discovered that a student had not actually graduated and changed theexit status accordingly. It was also found that some students had earned substantially more credits thanwere required to graduate. Often these were students who had spent substantial amounts of time in bothforeign and American high schools. While they were awarded credit for the foreign courses, they werestill required to take an essentially American curriculum in order to obtain the American diploma.
In still other cases it was found that, although a student had fewer credits than were requiredto graduate, the transcript had all the other attributes of a graduated senior such as four full years ofcourses, all required courses, a graduation date, grade point average, and class standing. In these cases, ifa careful review of the transcript and the data files showed no data entry or coding errors, the transcriptwas kept in the database with the apparent inconsistency as recorded on the transcript.
In a number of cases, the transcript listed transfer courses that needed to be given specialtreatment. In some cases it was clear that the appropriate Carnegie Units conversion factor for the creditsreported on the transcript was different from that of the school issuing the transcript. When this occurred,the conversion factor was adjusted appropriately for these courses on a student-by-student basis. In othercases, entries were found on transcripts indicating that a student had been awarded some number of
___________________________________________________________________________________________________________________________________The 1998 High School Transcript Study
5-19 User's Guide and Technical Report
credits for transferred courses, but there was no list of the specific courses. When this happened, a dummycourse titled “Undifferentiated Transfer Courses” was created and treated as uncodable.
If a list of transfer courses appeared on a transcript with an associated number of creditsindicated, a catalog coder apportioned the credits among the courses using whatever information wasavailable. For example, some transcripts had sections that indicated by a series of check marks which of aset of requirements had been met. If the courses explicitly detailed on the transcript did not account for allof the check marks, then the transferred credits must account for the remainder.
Inclusion of the Undifferentiated Transfer Courses on the file had the effect of accountingfor all the credits that appeared on the transcripts. It also provided the ability to screen essentiallyincomplete transcripts out of the analyses. The intent of the transcript study is to summarize thecoursetaking patterns of graduates of American high schools over the three or four years that they attend atypical high school. For analytic purposes, therefore, transcripts that did not list separate credits for theequivalent of at least three full years of high school courses were treated as incomplete. This was done bycreating a flag (GRREQFLG) that was placed on the student file, which indicated whether thedifferentiated course credits on a transcript equaled at least 75 percent of the minimum credits required tograduate. If they did not, the transcript remained in the file, but the student was given a weight of zero andwas treated as missing for purposes of projecting national totals (see Chapter 6 of this report for adescription of the nonresponse adjustment procedures). In other words, the transcripts for such studentswere fully coded and provided on the file, but with the recommendation that they not be used to estimatenational coursetaking patterns.
Each stage of the process described above included measures to assure both the quality andconsistency of the data. Quality control procedures ranged from those for specific data items to those for abroad overview of the data. These are described in more detail in the following sections.
5.6.1 Quality Control for Transcript Data Entry
Measures to maintain the quality of data entry on transcripts included (1) 100 percentverification of data entry, (2) review of all transcripts where the number of credits reported for a givenyear (or the total number of credits) was not indicative of the school’s normal course load or graduationrequirements, and (3) reconciliation of IDs of transcripts entered with the list of valid IDs for the HSTS.
___________________________________________________________________________________________________________________________________The 1998 High School Transcript StudyUser's Guide and Technical Report 5-20
Verification included all data entry fields except course titles, test names, and award titles. Verificationwas performed by a CADE verifier who had not entered that data initially. The number of credits enteredfor a transcript was automatically compared to a file containing the number of credits required forgraduation, and gave the verifier a warning message if the number of credits entered was too large orsmall to be feasible. By reconciling the IDs on the transcripts that were entered with the IDs of studentson the HSTS-eligible list, it was ascertained that every eligible transcript was entered and that noineligible transcripts were entered.
5.6.2 Quality Control for Catalog Data Entry
The full listing of each catalog’s course titles was reviewed by a curriculum specialist whovisually compared the listing with the catalog itself. When errors were encountered, corrections werekeyed and the corrections were reviewed again. For those schools without catalogs, the listing that wasgenerated automatically was reviewed and edited when courses were coded.
5.6.3 Quality Control for Catalog Coding
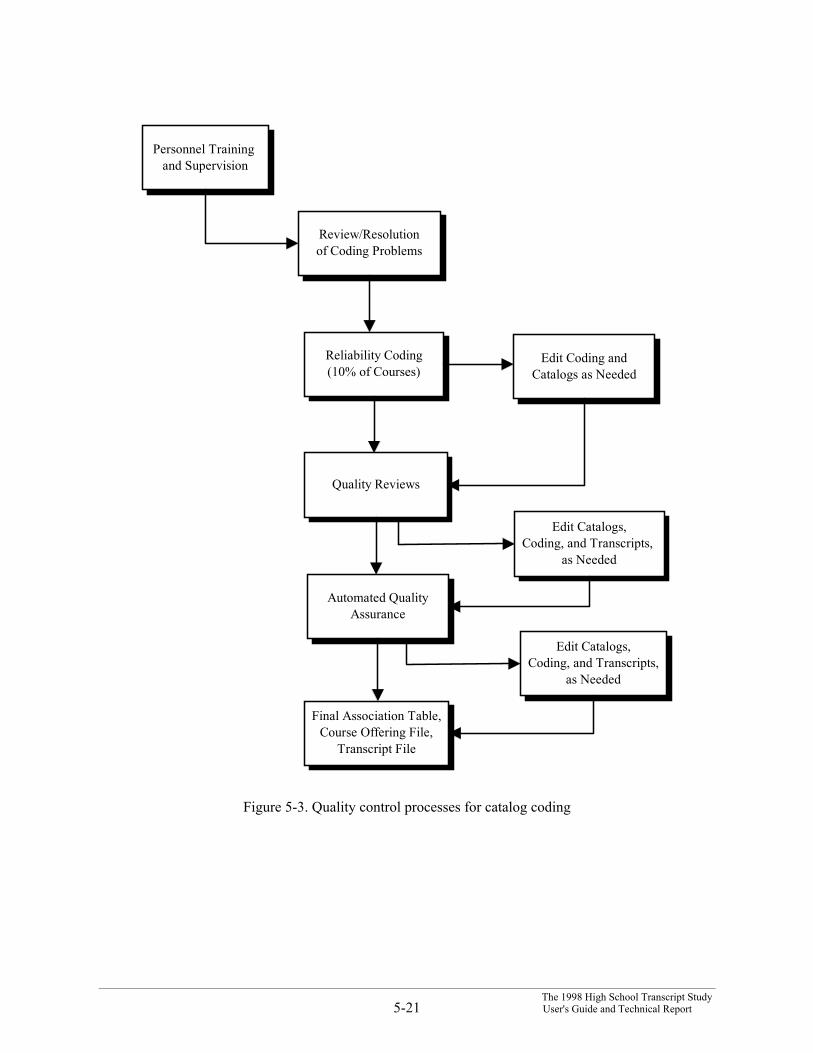
The procedures for assuring the quality of assigning CSSC codes to courses offered in HSTSschools included (1) careful training and supervision of coders, (2) formal reporting and resolution ofcoding difficulties, (3) reliability checking throughout the process through independent coding of asample of courses, or by complete review of codes for non-transfer courses by the curriculum specialist,(4) extensive quality reviews, and (5) automated quality assurance reports. Each of these procedures isdescribed separately below. Figure 5-3 is a schematic diagram of our quality control procedures forcatalog coding.
5.6.3.1 Difficulty Reporting
Problems in coding catalogs were reported directly to the curriculum specialist for reviewand final resolution. In conference, the difficulties were resolved at that time, and notes were made todocument the decisions reached. Occasional telephone conferences with school personnel were alsoconducted to answer important questions.
___________________________________________________________________________________________________________________________________The 1998 High School Transcript Study
5-21 User's Guide and Technical Report
Personnel Training and Supervision
Review/Resolutionof Coding Problems
Reliability Coding(10% of Courses)
Edit Coding andCatalogs as Needed
Quality Reviews
Final Association Table,Course Offering File,
Transcript File
Automated QualityAssurance
Edit Catalogs,Coding, and Transcripts,
as Needed
Edit Catalogs,Coding, and Transcripts,
as Needed
Figure 5-3. Quality control processes for catalog coding
___________________________________________________________________________________________________________________________________The 1998 High School Transcript StudyUser's Guide and Technical Report 5-22
5.6.3.2 Coding Reliability
An important measure of the quality of catalog coding is reliability, or agreement betweencoders on an appropriate CSSC code for a course. To measure coding reliability, one of the experiencedcoders coded a random sample of 10 percent of the nontransfer courses in each school catalog.
For schools with fewer than 100 nontransfer titles in their catalogs, 10 courses were codedby the experienced coder. For schools with more than 250 titles, 25 courses were coded. This samplecoding was then compared with the codes assigned to the same course by the catalog coder. An agreementis either an exact match of codes or a match to a code that the curriculum specialist determines is equallyappropriate for the course. If 90 percent or more of the coding agreed, no further action was taken. Ifagreement was less than 90 percent, the catalog coding was completely reviewed and any necessarychanges were made. The disagreements were also discussed with the catalog coder who had done theoriginal coding, and all coding procedures and principles were reviewed, as necessary. In addition, for 90percent of the schools, the curriculum specialist reviewed all coding of nontransfer courses and madechanges as needed. Multiple levels of review ensured both accuracy and consistency in coding. Sincenearly all catalogs were completely reviewed by the coding supervisor and corrected, coding withextremely high accuracy was ensured.
5.6.3.3 Quality Review
Additional procedures to measure and maintain quality included a two-step review process.The first step consisted of generating a report for each school listing the courses that were uncoded, codedas “uncodable,” or coded “other.” Another report listed transcript titles that were unmatched or matchedto an “uncodable” course. The curriculum specialist reviewed all these and recoded and rematched to thefullest extent possible all courses for which she could provide more explicit coding. The second step or“final review” was the last step in verifying the accuracy and completeness of all coding. The curriculumspecialist performed this review by examining each CACE file a final time, paying close attention to titlematching, as well as to catalog coding. When this review identified problems, the file was returned to acatalog coder to fix the problems and the quality review procedures were repeated.
___________________________________________________________________________________________________________________________________The 1998 High School Transcript Study
5-23 User's Guide and Technical Report
5.6.3.4 Automated Checks
An additional quality check took place when the CACE files for a school were converted todelivery format. Reports listing frequencies of occurrences that might indicate errors were sent to thecurriculum specialist for careful review. Each file was assigned a status of (1) complete, (2) errors intranscript entry, (3) errors in catalog coding and associations, or (4) computer errors (such as duplicatecourse sequence numbers). A file with status of 2, 3, or 4 was returned to CADE and CACE forcorrection, a new report was generated, and the report was again reviewed. This process was repeateduntil the file had a status of 1, indicating that it was complete and correct.
Some of the automated checks performed on the files produced by the transcript data entryand coding process included the following:
All files were checked for duplicate IDs.
It was verified that all NAEP IDs in the control list also appeared on the TRF list.
It was verified that all IDs on the TRF list for a school were in the student data file.
A crosstabulation of graduation year by exit status was created and reviewed foroutliers.
A crosstabulation of highest year (e.g., 11th grade, 12th grade) appearing in thetranscript by exit status was created and reviewed for outliers.
A crosstabulation of total Carnegie Units earned by exit status was created andchecked for outliers.
All students with 12th grade transfer courses (other than summer school) were listedand their transcripts checked for accuracy of data entry.
Valid combinations of course flags were checked. For instance, no course could beboth honors and remedial or special education.
5.7 Scanning and Preparing the SD/LEP Questionnaires
The SD/LEP forms collected during NAEP were scanned by National Computer Systems(NCS) and the files provided to ETS. ETS provided Westat with data for all 12th grade students for whomthe SD/LEP Questionnaires had been completed during NAEP. Of all completed questionnaires, only the
___________________________________________________________________________________________________________________________________The 1998 High School Transcript StudyUser's Guide and Technical Report 5-24
ones with corresponding records in the HSTS Student File were selected for the final HSTS SD/LEP file.A total of 1,237 students are represented in the final SD/LEP file.
The responses to the questionnaire were entered on optical scan forms by school personnel(see Section 4.5) and scanned by NCS. The data in the scanned data file were direct representations of thequestionnaire responses. There were, however, four items on the scanned data file that needed somerecoding. The same recoding algorithm was used for the following three items:
Item 8. What percentage of time is this student mainstreamed (i.e., with his/hernondisabled peers) in academic subjects (e.g., mathematics, reading/languagearts, science)?
Item 9. What percentage of time in the total school day is this student served by a specialeducation program (both in a class with his/her nondisabled peers and outsidesuch a class)?
Item 29. During this school year, what percentage of this student’s academic instruction isprovided in his/her native language?
The choices on the questionnaire were 0 percent, 1-24 percent, 25-49 percent, and so onthrough 75-99 percent and 100 percent. For each item, the scanned data file contained one variable (coded“Yes” or “Missing”) for each possible percentage choice. Because of this, it was possible to have morethan one percentage entered in response to Questions 8, 9, and 29. The following actions were taken inorder to create a file with a single field containing the actual percentage indicated on the questionnaire.
If the respondent checked a single response for the item, the value of that responsewas used;
If the respondent checked two adjacent responses, they were averaged;
If the respondent checked more than two responses or two nonadjacent responses, theresponse code for “multiple response” was used; and
If no response was checked, the code for “missing” was used.
One other item from the scanned data file was also recoded:
Item 3. Which of the following best describes this student’s disability?

___________________________________________________________________________________________________________________________________The 1998 High School Transcript Study
5-25 User's Guide and Technical Report
Once again, the scanned file is structured in such a way that each possible selection is aseparate variable. This allowed multiple selections to occur. The solution was to recode the responses sothat, if two or more responses were chosen, the code for “multidisabled” was used.
Several variables were added to the final SD/LEP file. The student disability status wasdetermined by the first question on the questionnaire and by the pattern of answers to the contentquestions. The disability flag (HCFLAG) was set to “1” if no disabling condition was indicated in ourrecords; otherwise it was set to “2.” Specifically, the disability flag was set to “2” if the followingconditions were met:
The TRF had the SD field flagged as 1 (“Yes”);
The student’s exit status as entered in the CADE system was 3 or 4 (special educationdiploma or certificate of attendance);
Question 1 “Does this student have a disability (physical and/or mental)?” in theSD/LEP questionnaire had a response of B (Yes”).
The student’s Exit Status, race/ethnicity, grade level, gender, birth month and year, Title Iand NSLP flags were obtained from the Student File. If that information did not exist on the Student File,the corresponding data from the SD/LEP questionnaire were incorporated if available. Frequencies andcrosstabulations were run to check the data for valid entries and outliers before, during, and afterprocessing.
5.8 Scanning and Preparing the School Questionnaires
The School Questionnaire was used in the 1998 NAEP and was available for 242 of the264 HSTS schools (the remainder had not participated in NAEP). The data were entered on optical scanforms by school personnel and scanned by NCS.
When coding the School Questionnaires, the coding system used with the previous SchoolFiles was used whenever possible. As with the SD/LEP Questionnaire, processing consisted ofreformatting the scanned responses to provide one variable per question. When necessary, the value wasset to either “multiple response” or “no response” as appropriate. A copy of the 1998 SchoolQuestionnaire is included as Appendix A.
___________________________________________________________________________________________________________________________________The 1998 High School Transcript StudyUser's Guide and Technical Report 5-26
5.9 Personnel Selection, Training, and Supervision
Trained, experienced educators were used for the coding task to ensure that coding wasperformed in a meaningful rather than rote manner. These coders had sufficient experience to understand,for example, the subtle differences in levels of English courses (regardless of specific terms used todescribe them) so that they would be coded appropriately as at, above, or below grade level, and torecognize what the term “grade level” really means. After selecting individuals with appropriateexperience and background, a thorough training was conducted in the concepts and procedures to be usedin performing the coding task. The training included multiple measures of trainees’ understanding andaccurate use of the information presented. Two of the coders had served in a similar capacity for the 1994HSTS.
A curriculum specialist, holding a doctorate in Curriculum and Instruction, and experiencefrom participation in the 1990 and 1994 HSTS, supervised the entire coding operation. She wasconstantly available to coders to answer questions, verify information, discuss issues, and provide generalguidance as questions and problems were encountered. All issues that were of a general nature (i.e.,pertaining to coding many or all catalogs) were brought to the attention of the entire group of coders.Answers to difficult coding decisions were posted on a wall visible to all coders. The curriculumspecialist periodically reviewed each coder’s work to ensure a continued high level of performance.
5.9.1 Training Data Entry Staff
Actual transcripts were used to illustrate different formats and different types of informationas demonstration materials. Trainees also used these transcripts as practice exercises to gain familiarityand skill in using the CADE system. In addition, two experienced HSTS data coders prepared a summarysheet for each school which directed the data entry clerk’s attention to any special features or difficultiesassociated with a set of transcripts.
5.9.2 Training Catalog Coders
Catalog coders who were selected had either current or prior experience teaching inAmerican schools and/or had a college degree in education. An expert in special education was selected
___________________________________________________________________________________________________________________________________The 1998 High School Transcript Study
5-27 User's Guide and Technical Report
to code the special education courses for all schools. Two of the catalog coders had coded catalogs duringthe 1990 and 1994 HSTS and were highly experienced. They assisted in part of the training andperformed some specialized functions throughout the process of coding catalogs and entering transcriptdata.
Coder training was conducted over a 4-day period by the curriculum specialist, who was alsothe coding supervisor. Coders were trained both in the analytic aspects of selecting the best CSSC codefor each course and in operating the CACE system. Training materials included practice exercises basedon actual catalogs and transcripts from HSTS schools. The first day of training consisted of classroom-type presentations and a demonstration of the CACE system. The second day started with directed hands-on practice using CACE with training materials and gradually moved toward more independent use of thesystem. On the third day, coders began working in pairs, using CACE to code their first actual catalog.Each coder’s understanding of the coding task and CACE operation was evaluated each half-day onpractice tests and exercises. The final day was devoted to the beginning of actual coding, but all work wascarefully reviewed before it was considered complete.

___________________________________________________________________________________________________________________________________The 1998 High School Transcript Study
6-1 User's Guide and Technical Report
6. WEIGHTING AND ESTIMATION OF SAMPLING VARIANCE
The 1998 High School Transcript Study used a complex sample design with the goal ofsecuring a sample from which estimates of population and subpopulation characteristics could beobtained with reasonably high precision (in other words, low sampling variability). At the same time, itwas necessary that the sample be economically and operationally feasible to obtain. The resulting designrequires that the user of the HSTS data utilize sampling weights to ensure valid analysis of the transcriptdata.
Sampling weights are factors assigned to each transcript that are used in any aggregations oftranscript characteristics. Heuristically, these weights can be seen as being the number of students in thepopulation that the sampled transcript “represents.” A transcript with a sampling weight of 100 represents1 sampled student and 99 other nonsampled (or sampled but nonresponding) students in the population. Atranscript with a sampling weight of 1 represents only the sampled student.
The sampling weights are designed primarily to represent differential sampling and responserates. For example, if a student comes from a subcategory with a sampling rate of 1/10 and a response rateof 1/2, then the student’s transcript might receive a sampling weight of 20. That transcript can be seen asrepresenting the student and 19 other nonsampled and nonresponding students.
From the viewpoint of assigning sampling weights, the most important aspect of the 1998HSTS sample design was the utilization of differential sampling rates. For example, schools with highpercentages of minority students were sampled at a doubled sampling rate, and very small schools weresampled at a lower rate to reduce the costs incurred in fielding the schools (see Chapter 2 for furtherdetails regarding the sample design). Section 6.1 discusses the procedure for assigning sampling weights.
One consequence of the HSTS sample design is its effect on the estimation of samplingvariability. Because of the clustering effects of the multistage design (students within schools, schoolswithin primary sampling units) and because of the effects of certain adjustments to the sampling weights(poststratification and weighting adjustments), observations made on different students cannot beassumed to be independent of one another. As a result, ordinary formulas used to estimate the variance ofsample statistics, based on the assumption of independence, will tend to underestimate the true samplevariability. Three techniques that are widely utilized for variance estimation under those circumstances
___________________________________________________________________________________________________________________________________The 1998 High School Transcript StudyUser's Guide and Technical Report 6-2
are linearization, balanced repeated replication (BRR), and the jackknife. The jackknife procedureprovides reliable variance estimators while being easy for the user to utilize. Any aggregations arecomputed utilizing the original sampling weights and each set of jackknife replicate weights. A simpleformula combines these estimates into a suitable variance estimator.
Two types of weights, HSTS sample weights and linked weights, are needed for these data.HSTS sample weights are designed for any aggregations, including all of the transcripts in the study,whether or not they correspond to assessed NAEP students. The weight of each transcript representsstudents not included in the HSTS Study. Linked weights are designed for any aggregations that onlyinclude transcripts from students who were in a particular NAEP assessment (or who were excluded fromNAEP). In this case, the linked weight assigned to the transcript is designed to represent not only studentsnot included in the HSTS study, but also students included in the HSTS study who were not given thesame assessment.
6.1 The HSTS Sample Weights: An Introduction
In order to make valid inferences about the entire population of graduated grade 12 studentsfrom the sample of student transcripts collected, it is necessary to use the sampling weights. The weightsreflect the probability sampling scheme used to arrive at the sample of students for whom transcripts wererequested. The HSTS weights were constructed without regard to the NAEP participation ornonparticipation status of schools and students. The weights also reflect the impact of samplenonresponse at the school and the student level, and make adjustments for these groups to decrease thepotential bias that might arise through differential nonresponse across population subgroups. Finally,improvements to the precision of weighted estimates result from the application of poststratificationfactors to the sample weights.
Since the derivation of sampling weights and the estimation of sampling variability arestrongly related to the sample design, the reader will need to review the main features of the samplingdesign discussed in Chapters 2 and 3 of this report.
___________________________________________________________________________________________________________________________________The 1998 High School Transcript Study
6-3 User's Guide and Technical Report
The final HSTS and linked student weights were constructed in the following steps:
1. The student base weights (or design unbiased weight) were constructed as thereciprocal of the overall probability of selection. This procedure is discussed inSections 6.3.1 and 6.3.3.
2. School nonresponse factors were computed, adjusting for schools that did notparticipate in the HSTS study. For the linked weights, adjustment factors wereassigned for each session type (writing/civics, reading, and civics trend). The schoolnonresponse factors for the linked weights were also slightly different than thecorresponding HSTS student weight school nonresponse factors, to account forschools that refused to participate in NAEP. This procedure is discussed in Section6.4.
3. Student nonresponse factors were computed, adjusting the weights of “responding”students to account for “nonresponding” students. Definitions of responding andnonresponding students differed for the HSTS weights and the linked weights. Thedefinitions and procedures are described in Section 6.5.
4. Student trimming factors were generated to reduce the mean squared error of theresulting estimates. Another purpose of trimming is to protect against a small numberof large weights from dominating the resulting estimates of small domains of interest.This step is discussed in Section 6.5.
5. The last step was poststratification, the process of adjusting weights proportionally sothat they aggregate within certain subpopulations to independent estimates of thesesubpopulation totals. These independent estimates were obtained from the CurrentPopulation Survey (CPS) estimates for various student subgroups. As the CPSestimate has smaller sampling error associated with it, this adjustment should improvethe quality of the weights. This step is also discussed in Section 6.5.
6.2 The HSTS-NAEP Linked Weights: An Introduction
A primary purpose of the HSTS study is to provide a database for analyzing the relationshipbetween students’ proficiencies, as measured by their NAEP assessment outcomes, and students’ course-taking in their high school careers. In order for a student to be part of this “linked” database, a completedNAEP assessment was required for the student, as well as a completed (and usable) transcript from theHSTS study. In addition, the scope was limited to students who graduated as determined by the HSTS.There were many students for whom a completed transcript was received but no NAEP assessment exists(because either the school or the student refused to participate in NAEP or the student was absent onassessment day). These students can be part of the HSTS database but not the linked database thatrequires both transcripts and assessment results for the same student.
___________________________________________________________________________________________________________________________________The 1998 High School Transcript StudyUser's Guide and Technical Report 6-4
The linked database requires a different set of sampling weights than the HSTS databasealone, as the set of students that qualify for these databases is a subset of the larger HSTS set. Inparticular, the school and student nonresponse adjustments will be larger for the linked weights than forthe HSTS weights. This is so because a student or school had to participate in both the NAEP and theHSTS surveys to qualify as a “respondent” for the linked database. This reduced the number of schooland student responses, thereby increasing the nonresponse adjustment factors.
The sampling weights are computed so that the sample can “represent” in a statistical sensethe full population of students from which the sample is drawn. In particular, the sampling weights willaggregate to the total number of students in the population. Linked weights were computed separately forwriting, 25-minute reading, 50-minute reading, civics, and civics trend assessment students. Eachassessment sample represents the full population, so each of the five sets of assessment-linked weightsaggregate separately to the population totals.
Excluded students were pooled with assessed and absent students in the weighting process.For student nonresponse adjustment, weights corresponding to excluded students with completed andusable transcripts were adjusted to account for excluded students with unusable or missing transcripts.The general weighting process for the linked weights was similar to HSTS and was discussed inSection 6.1.
6.3 Computation of the Base Weights
Sample estimates were computed from the students’ transcripts by aggregating observationsfrom each transcript using the sample weights. If there were 100 percent response to the HSTS survey,and if no trimming and poststratification were carried out, then the sample weights would be equal to thebase weights, which are the reciprocals of the probabilities of selection of that student. The sampleaggregates generated using these base weights would be unbiased estimators of the correspondingquantities in the U.S. population (cite, for example, Cochran (1977), Section 9A.7). As indicatedpreviously, NAEP uses differential sampling rates, deliberately oversampling certain subpopulations toobtain larger samples of respondents from those subgroups, thereby enhancing the precision of estimatesof characteristics of these oversampled subgroups.
___________________________________________________________________________________________________________________________________The 1998 High School Transcript Study
6-5 User's Guide and Technical Report
As a result of oversampling schools, these subpopulations, corresponding to students frompublic schools with high concentrations of black and/or Hispanic students, and students from nonpublicschools, are overrepresented. As a result of oversampling students, subpopulations of black and/orHispanic students from public schools with low concentrations of these groups and SD/LEP students inschools assigned reading sessions, are also overrepresented in the sample. Appropriate estimation ofpopulation characteristics must take disproportionate representation into account. This is accomplished byassigning a weight to each respondent, where the weights approximately account for the sample designand reflect the appropriate proportional representation of the various types of individuals in thepopulation.
6.3.1 Computation of Base Weights: HSTS Weights
The student base weight for the 1998 HSTS sample was computed for each student sampledinto one of the following:
1. A NAEP assessment (including selected students who were later excluded as beingnonassessable) in an HSTS sample school, where student IDs could be matchedbetween NAEP and HSTS files.
2. A new sample due to being in a HSTS school that did not cooperate in NAEP.
3. A new sample due to being in an HSTS- and NAEP-cooperating school, where thestudent ID could not be linked between the two studies.
The HSTS student base weight assigned to a student is the reciprocal of the overallprobability that the student was selected. Thus, the base weight for a student may be expressed as theproduct
WB = PSUWGT_M × QSCHWT12 × SCH_WT12 × TRPSUWT × TRSCHWT × CSBW
where,
PSUWGT_M = The inverse of the probability that the PSU was selected for NAEP. Of the 94 PSUsselected, 22 were certainty PSUs and have a PSU weight of 1.0. For the remaining 72PSUs, the probability of selection was calculated to account for the initial selection ofone PSU per stratum;
= 1, if the private school is from the PSS list frame;
___________________________________________________________________________________________________________________________________The 1998 High School Transcript StudyUser's Guide and Technical Report 6-6
QSCHWT12 = The inverse of the probability that a Catholic, Religious affiliated, or other nonpublicschool was selected for the PSS from the PSS area frame (refer to Section 2.3);
SCH_WT12 = The inverse of the conditional probability, given the NAEP PSU, that the school wasselected for NAEP;
TRPSUWT = The inverse of the conditional probability that the PSU was selected for HSTS, giventhat the PSU was selected for NAEP;
TRSCHWT = The inverse of the conditional probability that the school was selected for HSTS,given that the PSU was selected for HSTS and the school was selected for NAEP (andgiven the school was selected for the PSS (for private schools)); and
CSBW = The inverse of the conditional probability, given the HSTS PSU and school, that thestudent was selected.
Variations in 1998 HSTS in probabilities of selection, and consequently of weights, wereintroduced by design, either to increase the effectiveness of the sample in achieving its goals of reportingfor various subpopulations, or to achieve increased efficiency per unit of cost.
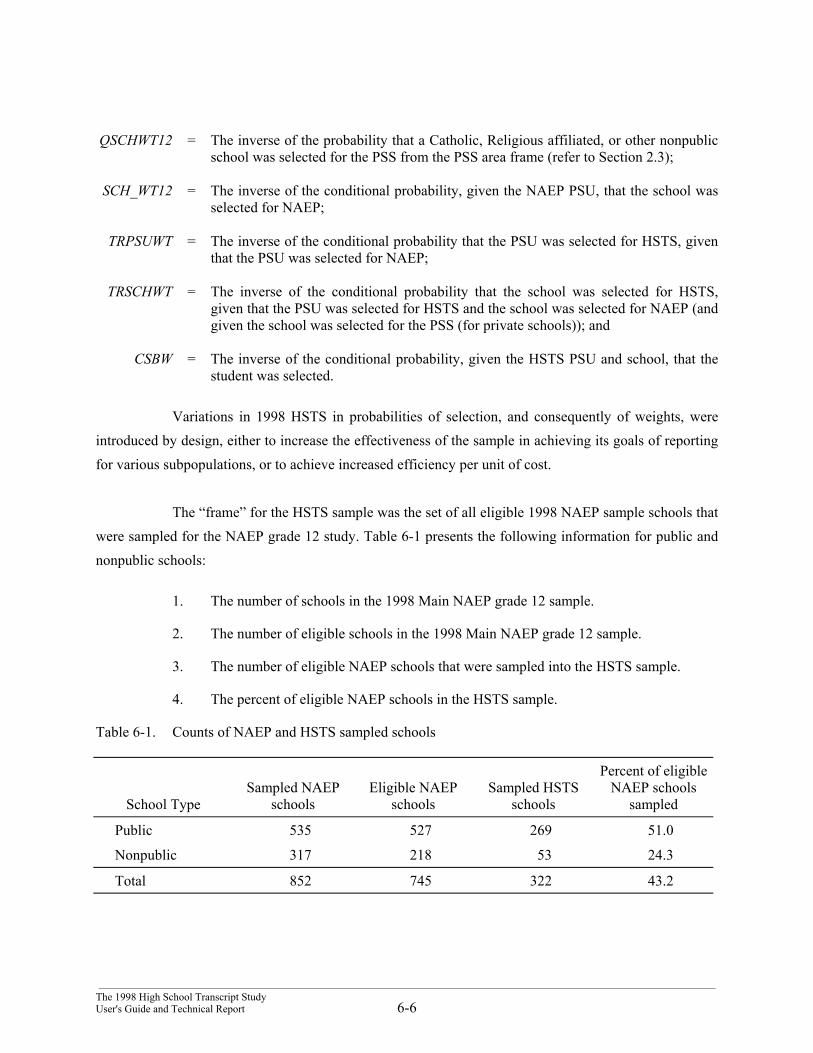
The “frame” for the HSTS sample was the set of all eligible 1998 NAEP sample schools thatwere sampled for the NAEP grade 12 study. Table 6-1 presents the following information for public andnonpublic schools:
1. The number of schools in the 1998 Main NAEP grade 12 sample.
2. The number of eligible schools in the 1998 Main NAEP grade 12 sample.
3. The number of eligible NAEP schools that were sampled into the HSTS sample.
4. The percent of eligible NAEP schools in the HSTS sample.
Table 6-1. Counts of NAEP and HSTS sampled schools
School TypeSampled NAEP
schoolsEligible NAEP
schoolsSampled HSTS
schools
Percent of eligibleNAEP schools
sampled
Public 535 527 269 51.0
Nonpublic 317 218 53 24.3
Total 852 745 322 43.2
___________________________________________________________________________________________________________________________________The 1998 High School Transcript Study
6-7 User's Guide and Technical Report
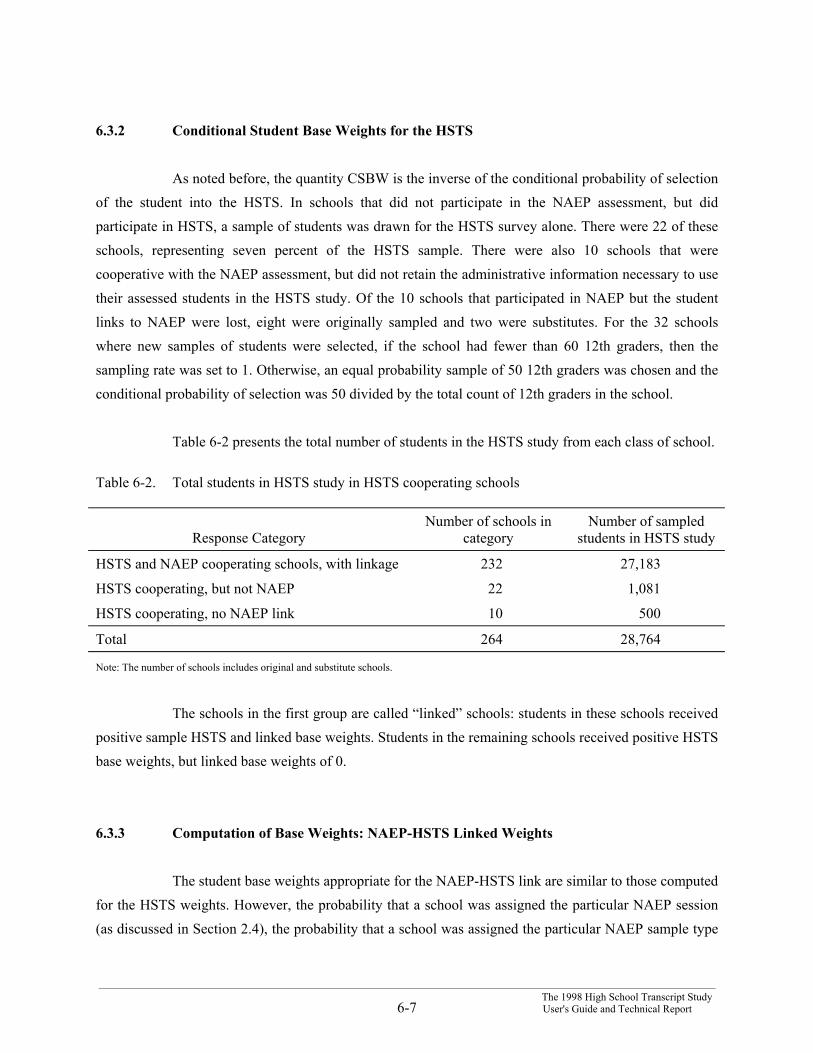
6.3.2 Conditional Student Base Weights for the HSTS
As noted before, the quantity CSBW is the inverse of the conditional probability of selectionof the student into the HSTS. In schools that did not participate in the NAEP assessment, but didparticipate in HSTS, a sample of students was drawn for the HSTS survey alone. There were 22 of theseschools, representing seven percent of the HSTS sample. There were also 10 schools that werecooperative with the NAEP assessment, but did not retain the administrative information necessary to usetheir assessed students in the HSTS study. Of the 10 schools that participated in NAEP but the studentlinks to NAEP were lost, eight were originally sampled and two were substitutes. For the 32 schoolswhere new samples of students were selected, if the school had fewer than 60 12th graders, then thesampling rate was set to 1. Otherwise, an equal probability sample of 50 12th graders was chosen and theconditional probability of selection was 50 divided by the total count of 12th graders in the school.
Table 6-2 presents the total number of students in the HSTS study from each class of school.
Table 6-2. Total students in HSTS study in HSTS cooperating schools
Response CategoryNumber of schools in
categoryNumber of sampled
students in HSTS study
HSTS and NAEP cooperating schools, with linkage 232 27,183
HSTS cooperating, but not NAEP 22 1,081
HSTS cooperating, no NAEP link 10 500
Total 264 28,764
Note: The number of schools includes original and substitute schools.
The schools in the first group are called “linked” schools: students in these schools receivedpositive sample HSTS and linked base weights. Students in the remaining schools received positive HSTSbase weights, but linked base weights of 0.
6.3.3 Computation of Base Weights: NAEP-HSTS Linked Weights
The student base weights appropriate for the NAEP-HSTS link are similar to those computedfor the HSTS weights. However, the probability that a school was assigned the particular NAEP session(as discussed in Section 2.4), the probability that a school was assigned the particular NAEP sample type

___________________________________________________________________________________________________________________________________The 1998 High School Transcript StudyUser's Guide and Technical Report 6-8
(applies to reading, Section 2.4), and the probability that a student was assigned to the particular NAEPassessment (i.e., subject) must also be included as subsampling was done to select final school andstudent samples for each assessment.
Within schools, each student was assigned one of five assessments (to minimize theworkload required for each student). This assignment was random. After this assignment, the student wasevaluated as to eligibility and excluded from assessment if found to be ineligible (because of languageproblems or disabilities).
The linked base weight assigned to a student is the reciprocal of the overall probability thatthe student was selected for a particular assessment. Thus, the base weight for a student may be expressedas the product
LWB = PSUWGT_M × QSCHWT12 × SCH_WT12 × TRPSUWT × TRSCHWT × SA_WT ×SAADJ × STYWT × YRRND_FC × STUSA_WT
where,
PSUWGT_M, QSCHWT12, SCH_WT12, TRPSUWT, and TRSCHWT were explained in Section 6.3.1;
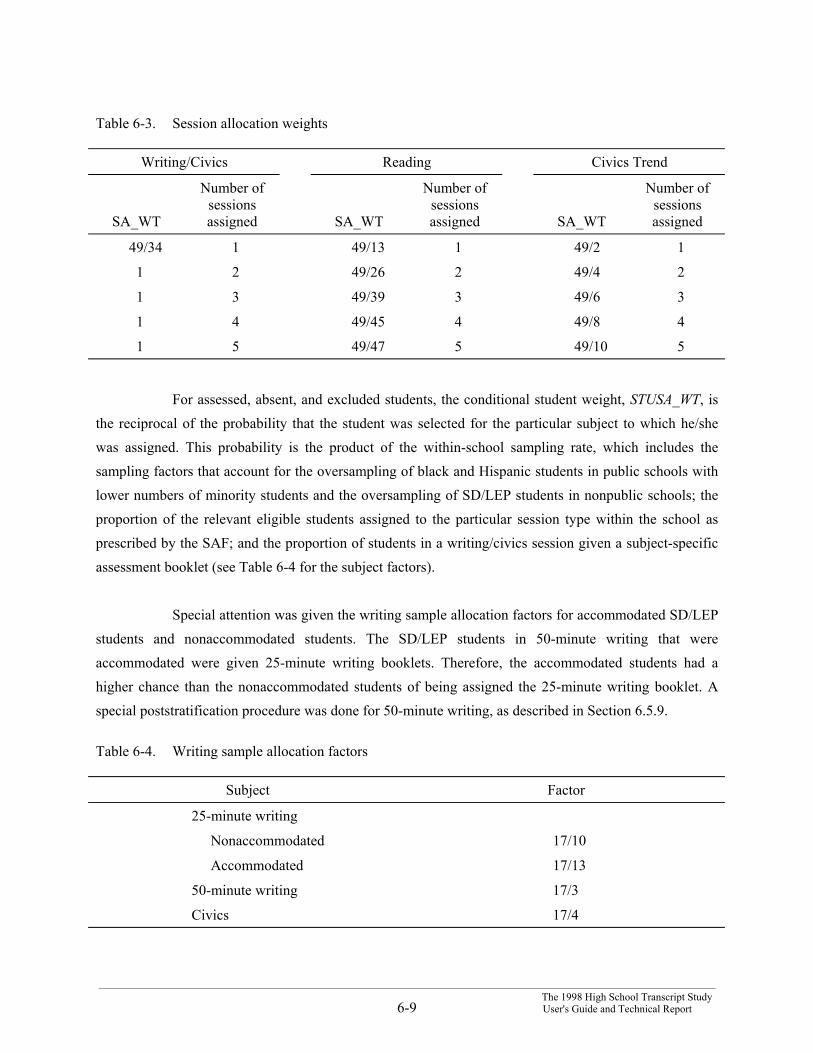
SA_WT = The inverse of the conditional probability, given the sample of NAEP schools in aNAEP PSU, that the school was allocated the specified session type. This is a functionof the session type and the number of sessions allocated to the school. Sessionallocation weights were calculated separately for each session type. The values for thesession allocation weights are summarized in Table 6-3;
SAADJ = The session allocation weights were adjusted for smaller-than-expected schools toaccount for one or more session types that were dropped. The adjustment factor,SAADJ, was computed as the number of sessions assigned divided by the number ofsessions assigned for the session type that was kept;
STYWT = The inverse of the conditional probability, given the sample of NAEP schools in aPSU, that the specified sample type was assigned to the school. The sample typeweight is the reciprocal of the probability that the sample type was assigned to theschool. For reading, the weight is 2, and for other sessions the weight was set to 1;
YRRND_FC = The year-round school factor, which accounts for students not in session for schoolson a year-round system; and
STUSA_WT = The inverse of the conditional probability, given the HSTS school and HSTS PSU,that the student was selected for the specified subject type.
___________________________________________________________________________________________________________________________________The 1998 High School Transcript Study
6-9 User's Guide and Technical Report
Table 6-3. Session allocation weights
Writing/Civics Reading Civics Trend
SA_WT
Number ofsessionsassigned SA_WT
Number ofsessionsassigned SA_WT
Number ofsessionsassigned
49/34 1 49/13 1 49/2 1
1 2 49/26 2 49/4 2
1 3 49/39 3 49/6 3
1 4 49/45 4 49/8 4
1 5 49/47 5 49/10 5
For assessed, absent, and excluded students, the conditional student weight, STUSA_WT, isthe reciprocal of the probability that the student was selected for the particular subject to which he/shewas assigned. This probability is the product of the within-school sampling rate, which includes thesampling factors that account for the oversampling of black and Hispanic students in public schools withlower numbers of minority students and the oversampling of SD/LEP students in nonpublic schools; theproportion of the relevant eligible students assigned to the particular session type within the school asprescribed by the SAF; and the proportion of students in a writing/civics session given a subject-specificassessment booklet (see Table 6-4 for the subject factors).
Special attention was given the writing sample allocation factors for accommodated SD/LEPstudents and nonaccommodated students. The SD/LEP students in 50-minute writing that wereaccommodated were given 25-minute writing booklets. Therefore, the accommodated students had ahigher chance than the nonaccommodated students of being assigned the 25-minute writing booklet. Aspecial poststratification procedure was done for 50-minute writing, as described in Section 6.5.9.
Table 6-4. Writing sample allocation factors
Subject Factor
25-minute writing
Nonaccommodated 17/10
Accommodated 17/13
50-minute writing 17/3
Civics 17/4
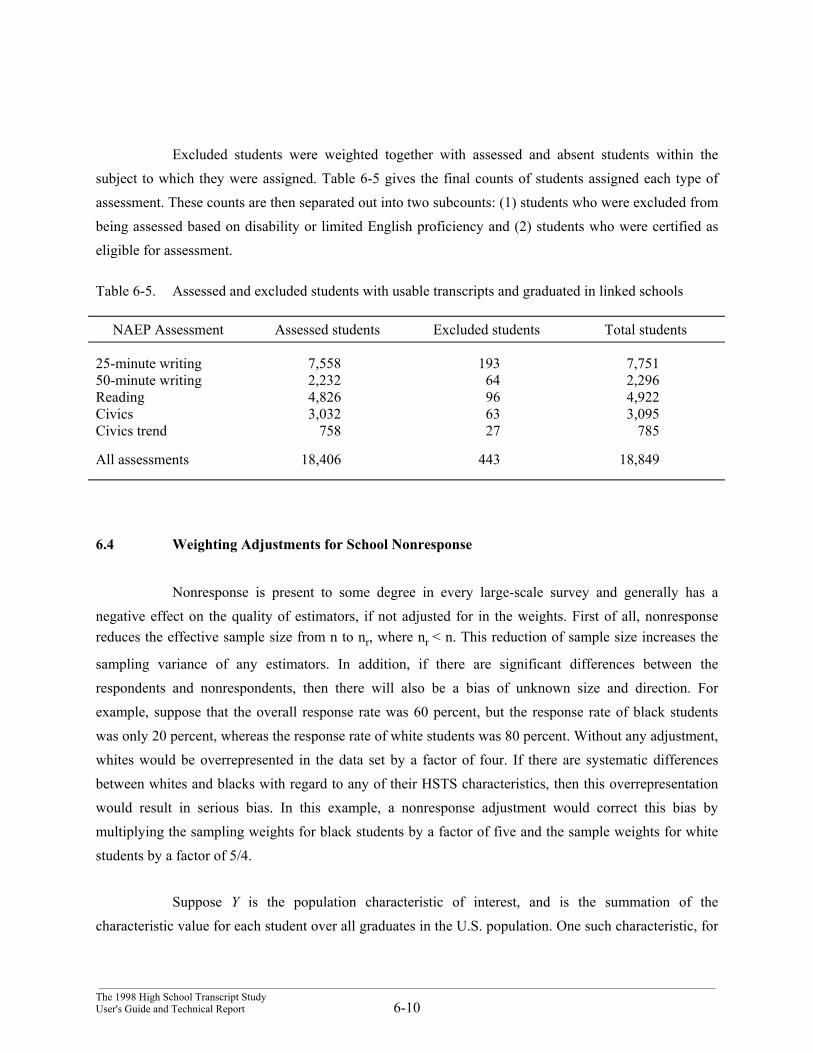
___________________________________________________________________________________________________________________________________The 1998 High School Transcript StudyUser's Guide and Technical Report 6-10
Excluded students were weighted together with assessed and absent students within thesubject to which they were assigned. Table 6-5 gives the final counts of students assigned each type ofassessment. These counts are then separated out into two subcounts: (1) students who were excluded frombeing assessed based on disability or limited English proficiency and (2) students who were certified aseligible for assessment.
Table 6-5. Assessed and excluded students with usable transcripts and graduated in linked schools
NAEP Assessment Assessed students Excluded students Total students
25-minute writing 7,558 193 7,75150-minute writing 2,232 64 2,296Reading 4,826 96 4,922Civics 3,032 63 3,095Civics trend 758 27 785
All assessments 18,406 443 18,849
6.4 Weighting Adjustments for School Nonresponse
Nonresponse is present to some degree in every large-scale survey and generally has anegative effect on the quality of estimators, if not adjusted for in the weights. First of all, nonresponsereduces the effective sample size from n to nr, where nr < n. This reduction of sample size increases the
sampling variance of any estimators. In addition, if there are significant differences between therespondents and nonrespondents, then there will also be a bias of unknown size and direction. Forexample, suppose that the overall response rate was 60 percent, but the response rate of black studentswas only 20 percent, whereas the response rate of white students was 80 percent. Without any adjustment,whites would be overrepresented in the data set by a factor of four. If there are systematic differencesbetween whites and blacks with regard to any of their HSTS characteristics, then this overrepresentationwould result in serious bias. In this example, a nonresponse adjustment would correct this bias bymultiplying the sampling weights for black students by a factor of five and the sample weights for whitestudents by a factor of 5/4.
Suppose Y is the population characteristic of interest, and is the summation of thecharacteristic value for each student over all graduates in the U.S. population. One such characteristic, for
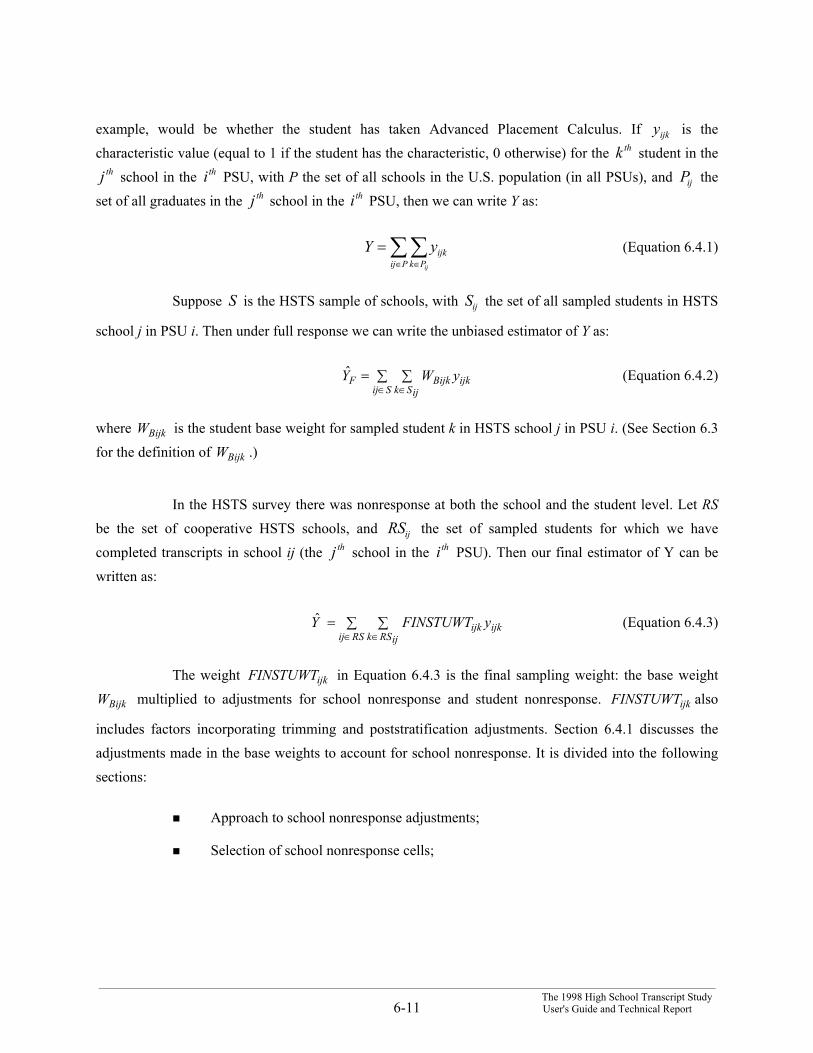
___________________________________________________________________________________________________________________________________The 1998 High School Transcript Study
6-11 User's Guide and Technical Report
example, would be whether the student has taken Advanced Placement Calculus. If yijk is thecharacteristic value (equal to 1 if the student has the characteristic, 0 otherwise) for the k th student in thej th school in the ith PSU, with P the set of all schools in the U.S. population (in all PSUs), and Pij the
set of all graduates in the j th school in the ith PSU, then we can write Y as:
Y yijkk Pij P ij
=∈∈∑∑ (Equation 6.4.1)
Suppose S is the HSTS sample of schools, with Sij the set of all sampled students in HSTS
school j in PSU i. Then under full response we can write the unbiased estimator of Y as:
ijkSij ijSk
BijkF yWY ∑ ∑=∈ ∈
ˆ (Equation 6.4.2)
where BijkW is the student base weight for sampled student k in HSTS school j in PSU i. (See Section 6.3for the definition of BijkW .)
In the HSTS survey there was nonresponse at both the school and the student level. Let RSbe the set of cooperative HSTS schools, and RSij the set of sampled students for which we havecompleted transcripts in school ij (the j th school in the ith PSU). Then our final estimator of Y can bewritten as:
ijkRSij ijRSk
ijk yFINSTUWTY ∑ ∑=∈ ∈
ˆ (Equation 6.4.3)
The weight ijkFINSTUWT in Equation 6.4.3 is the final sampling weight: the base weight
BijkW multiplied to adjustments for school nonresponse and student nonresponse. ijkFINSTUWT also
includes factors incorporating trimming and poststratification adjustments. Section 6.4.1 discusses theadjustments made in the base weights to account for school nonresponse. It is divided into the followingsections:
Approach to school nonresponse adjustments;
Selection of school nonresponse cells;
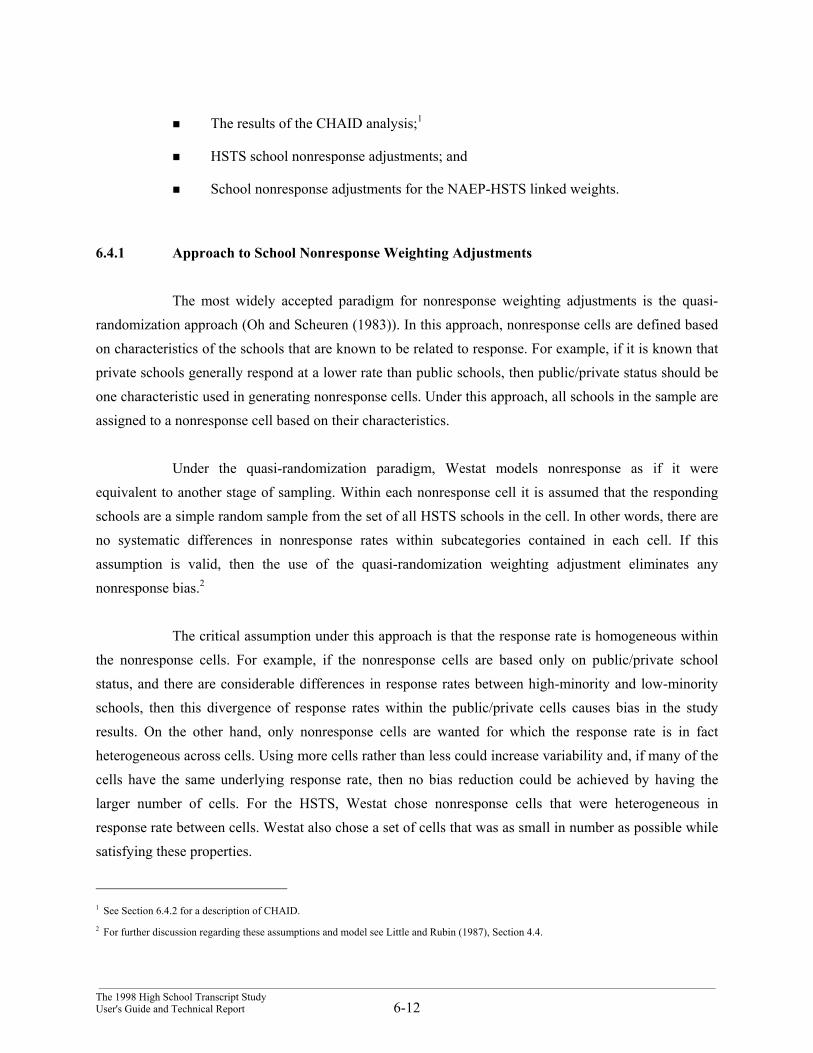
___________________________________________________________________________________________________________________________________The 1998 High School Transcript StudyUser's Guide and Technical Report 6-12
The results of the CHAID analysis;1
HSTS school nonresponse adjustments; and
School nonresponse adjustments for the NAEP-HSTS linked weights.
6.4.1 Approach to School Nonresponse Weighting Adjustments
The most widely accepted paradigm for nonresponse weighting adjustments is the quasi-randomization approach (Oh and Scheuren (1983)). In this approach, nonresponse cells are defined basedon characteristics of the schools that are known to be related to response. For example, if it is known thatprivate schools generally respond at a lower rate than public schools, then public/private status should beone characteristic used in generating nonresponse cells. Under this approach, all schools in the sample areassigned to a nonresponse cell based on their characteristics.
Under the quasi-randomization paradigm, Westat models nonresponse as if it wereequivalent to another stage of sampling. Within each nonresponse cell it is assumed that the respondingschools are a simple random sample from the set of all HSTS schools in the cell. In other words, there areno systematic differences in nonresponse rates within subcategories contained in each cell. If thisassumption is valid, then the use of the quasi-randomization weighting adjustment eliminates anynonresponse bias.2
The critical assumption under this approach is that the response rate is homogeneous withinthe nonresponse cells. For example, if the nonresponse cells are based only on public/private schoolstatus, and there are considerable differences in response rates between high-minority and low-minorityschools, then this divergence of response rates within the public/private cells causes bias in the studyresults. On the other hand, only nonresponse cells are wanted for which the response rate is in factheterogeneous across cells. Using more cells rather than less could increase variability and, if many of thecells have the same underlying response rate, then no bias reduction could be achieved by having thelarger number of cells. For the HSTS, Westat chose nonresponse cells that were heterogeneous inresponse rate between cells. Westat also chose a set of cells that was as small in number as possible whilesatisfying these properties.
1 See Section 6.4.2 for a description of CHAID.2 For further discussion regarding these assumptions and model see Little and Rubin (1987), Section 4.4.

___________________________________________________________________________________________________________________________________The 1998 High School Transcript Study
6-13 User's Guide and Technical Report
6.4.2 Selection of School Nonresponse Cells
All eligible responding schools within each selected nonresponse cell receive the sameschool nonresponse weighting adjustment to their weights. This nonresponse adjustment is formallydefined in Section 6.4.4, Equation 6.4.4. It is important that response rates be as uniform as possiblewithin each nonresponse cell. For example, suppose that the nonresponse cells are based on Censusregion alone, so that the Northeast census region would be one nonresponse cell. Then all schools withinthe Northeast region would receive the same school nonresponse weighting adjustment, say 1.5. Thisnonresponse adjustment would be the reciprocal of a response rate of 2/3.
However, suppose that high-minority schools within this cell have a response rate of 1/5,with low minority schools having a much higher response rate of 9/10. Then low-minority schools wouldbe overrepresented in this sample by a factor of 9/2, and a nonresponse bias would be incurred for anycharacteristic that is related to minority status. The response rate is not uniform within the response cellbut may be uniform within response cells defined by both census region and minority status. In this case,the small number of high minority schools would receive a school nonresponse adjustment of 5, with thelarge number of low-minority schools receiving a school nonresponse adjustment of 1.11. High- and low-minority schools would then be represented correctly in the final estimators.
This need for a uniform response rate within cells requires us to make nonresponse cells assmall as possible to capture every characteristic that may be related to both “response propensity” andsurvey characteristics of interest. At the same time, it is important that the sample sizes within individualresponse cells do not become too small, because this could seriously increase sampling variability. Thus,we need to assign nonresponse cells that are homogeneous in response propensity within cells but alsohave reasonably large sample sizes within each cell.
Four potential nonresponse variables were checked in the analysis.
1. Metropolitan/nonMetropolitan PSU status.
2. NAEP region (see Section 2.2 for a definition of NAEP region).
3. Public/Catholic/nonCatholic private status.
4. High minority status: whether or not the school has greater than 15 percent minoritystudents.
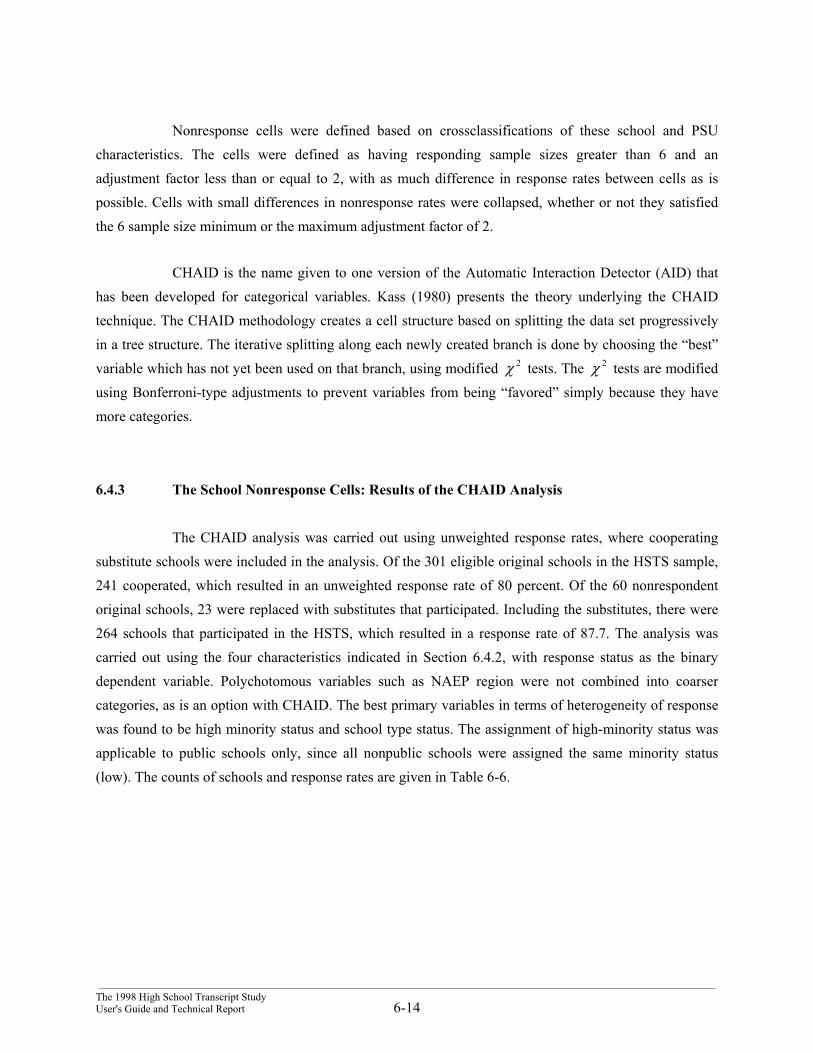
___________________________________________________________________________________________________________________________________The 1998 High School Transcript StudyUser's Guide and Technical Report 6-14
Nonresponse cells were defined based on crossclassifications of these school and PSUcharacteristics. The cells were defined as having responding sample sizes greater than 6 and anadjustment factor less than or equal to 2, with as much difference in response rates between cells as ispossible. Cells with small differences in nonresponse rates were collapsed, whether or not they satisfiedthe 6 sample size minimum or the maximum adjustment factor of 2.
CHAID is the name given to one version of the Automatic Interaction Detector (AID) thathas been developed for categorical variables. Kass (1980) presents the theory underlying the CHAIDtechnique. The CHAID methodology creates a cell structure based on splitting the data set progressivelyin a tree structure. The iterative splitting along each newly created branch is done by choosing the “best”variable which has not yet been used on that branch, using modified χ 2 tests. The χ 2 tests are modifiedusing Bonferroni-type adjustments to prevent variables from being “favored” simply because they havemore categories.
6.4.3 The School Nonresponse Cells: Results of the CHAID Analysis
The CHAID analysis was carried out using unweighted response rates, where cooperatingsubstitute schools were included in the analysis. Of the 301 eligible original schools in the HSTS sample,241 cooperated, which resulted in an unweighted response rate of 80 percent. Of the 60 nonrespondentoriginal schools, 23 were replaced with substitutes that participated. Including the substitutes, there were264 schools that participated in the HSTS, which resulted in a response rate of 87.7. The analysis wascarried out using the four characteristics indicated in Section 6.4.2, with response status as the binarydependent variable. Polychotomous variables such as NAEP region were not combined into coarsercategories, as is an option with CHAID. The best primary variables in terms of heterogeneity of responsewas found to be high minority status and school type status. The assignment of high-minority status wasapplicable to public schools only, since all nonpublic schools were assigned the same minority status(low). The counts of schools and response rates are given in Table 6-6.
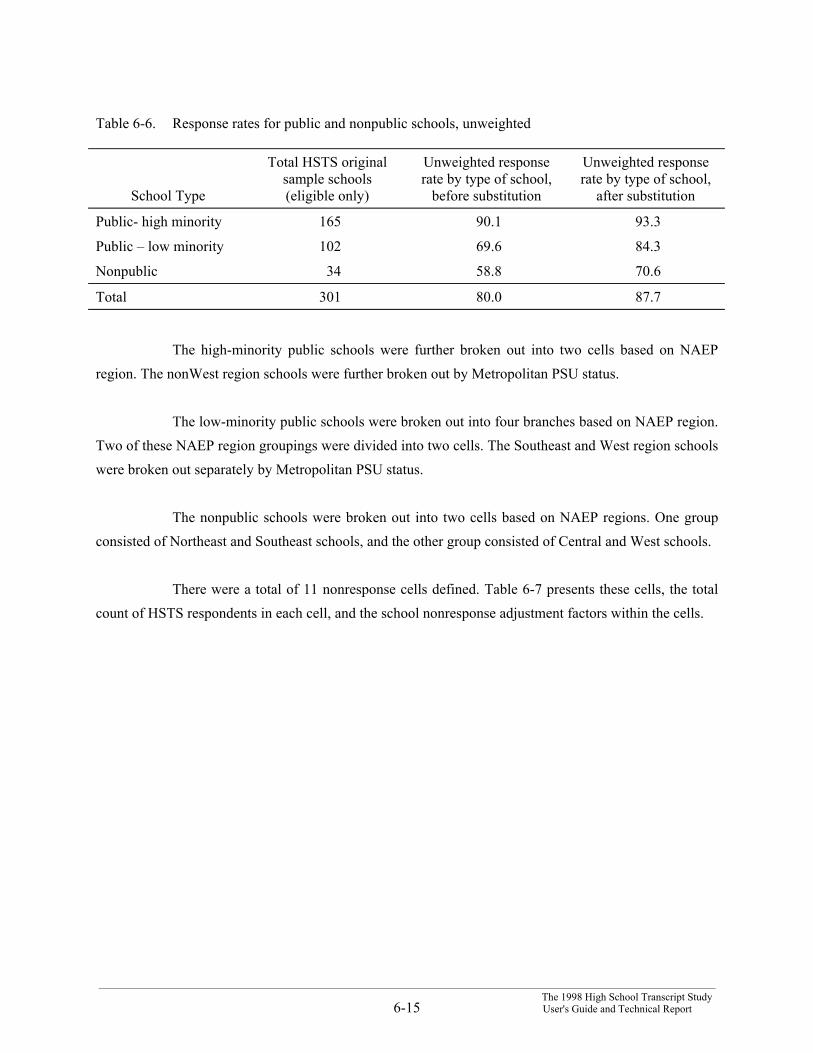
___________________________________________________________________________________________________________________________________The 1998 High School Transcript Study
6-15 User's Guide and Technical Report
Table 6-6. Response rates for public and nonpublic schools, unweighted
School Type
Total HSTS originalsample schools(eligible only)
Unweighted responserate by type of school,
before substitution
Unweighted responserate by type of school,
after substitution
Public- high minority 165 90.1 93.3
Public – low minority 102 69.6 84.3
Nonpublic 34 58.8 70.6
Total 301 80.0 87.7
The high-minority public schools were further broken out into two cells based on NAEPregion. The nonWest region schools were further broken out by Metropolitan PSU status.
The low-minority public schools were broken out into four branches based on NAEP region.Two of these NAEP region groupings were divided into two cells. The Southeast and West region schoolswere broken out separately by Metropolitan PSU status.
The nonpublic schools were broken out into two cells based on NAEP regions. One groupconsisted of Northeast and Southeast schools, and the other group consisted of Central and West schools.
There were a total of 11 nonresponse cells defined. Table 6-7 presents these cells, the totalcount of HSTS respondents in each cell, and the school nonresponse adjustment factors within the cells.
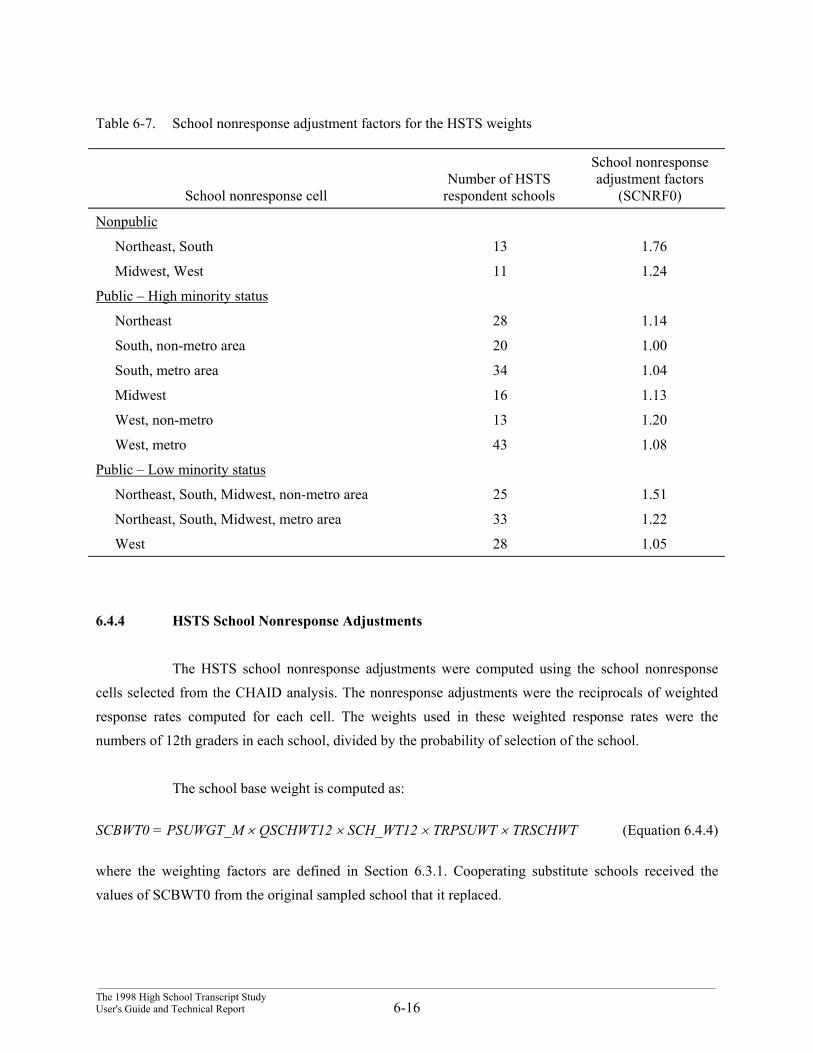
___________________________________________________________________________________________________________________________________The 1998 High School Transcript StudyUser's Guide and Technical Report 6-16
Table 6-7. School nonresponse adjustment factors for the HSTS weights
School nonresponse cellNumber of HSTS
respondent schools
School nonresponseadjustment factors
(SCNRF0)
Nonpublic
Northeast, South 13 1.76
Midwest, West 11 1.24
Public – High minority status
Northeast 28 1.14
South, non-metro area 20 1.00
South, metro area 34 1.04
Midwest 16 1.13
West, non-metro 13 1.20
West, metro 43 1.08
Public – Low minority status
Northeast, South, Midwest, non-metro area 25 1.51
Northeast, South, Midwest, metro area 33 1.22
West 28 1.05
6.4.4 HSTS School Nonresponse Adjustments
The HSTS school nonresponse adjustments were computed using the school nonresponsecells selected from the CHAID analysis. The nonresponse adjustments were the reciprocals of weightedresponse rates computed for each cell. The weights used in these weighted response rates were thenumbers of 12th graders in each school, divided by the probability of selection of the school.
The school base weight is computed as:
SCBWT0 = PSUWGT_M × QSCHWT12 × SCH_WT12 × TRPSUWT × TRSCHWT (Equation 6.4.4)
where the weighting factors are defined in Section 6.3.1. Cooperating substitute schools received thevalues of SCBWT0 from the original sampled school that it replaced.
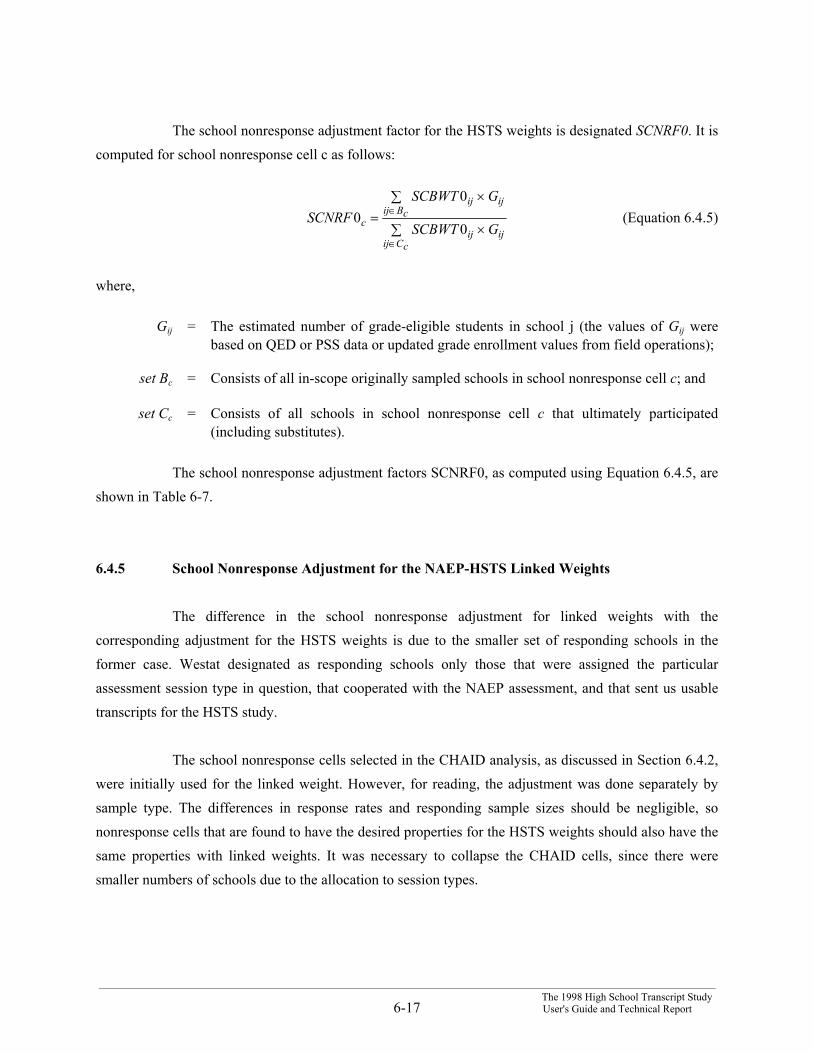
___________________________________________________________________________________________________________________________________The 1998 High School Transcript Study
6-17 User's Guide and Technical Report
The school nonresponse adjustment factor for the HSTS weights is designated SCNRF0. It iscomputed for school nonresponse cell c as follows:
∑ ×
∑ ×=
∈
∈
cCijijij
cBijijij
c GSCBWT
GSCBWTSCNRF
0
00 (Equation 6.4.5)
where,
Gij = The estimated number of grade-eligible students in school j (the values of Gij werebased on QED or PSS data or updated grade enrollment values from field operations);
set Bc = Consists of all in-scope originally sampled schools in school nonresponse cell c; and
set Cc = Consists of all schools in school nonresponse cell c that ultimately participated(including substitutes).
The school nonresponse adjustment factors SCNRF0, as computed using Equation 6.4.5, areshown in Table 6-7.
6.4.5 School Nonresponse Adjustment for the NAEP-HSTS Linked Weights
The difference in the school nonresponse adjustment for linked weights with thecorresponding adjustment for the HSTS weights is due to the smaller set of responding schools in theformer case. Westat designated as responding schools only those that were assigned the particularassessment session type in question, that cooperated with the NAEP assessment, and that sent us usabletranscripts for the HSTS study.
The school nonresponse cells selected in the CHAID analysis, as discussed in Section 6.4.2,were initially used for the linked weight. However, for reading, the adjustment was done separately bysample type. The differences in response rates and responding sample sizes should be negligible, sononresponse cells that are found to have the desired properties for the HSTS weights should also have thesame properties with linked weights. It was necessary to collapse the CHAID cells, since there weresmaller numbers of schools due to the allocation to session types.
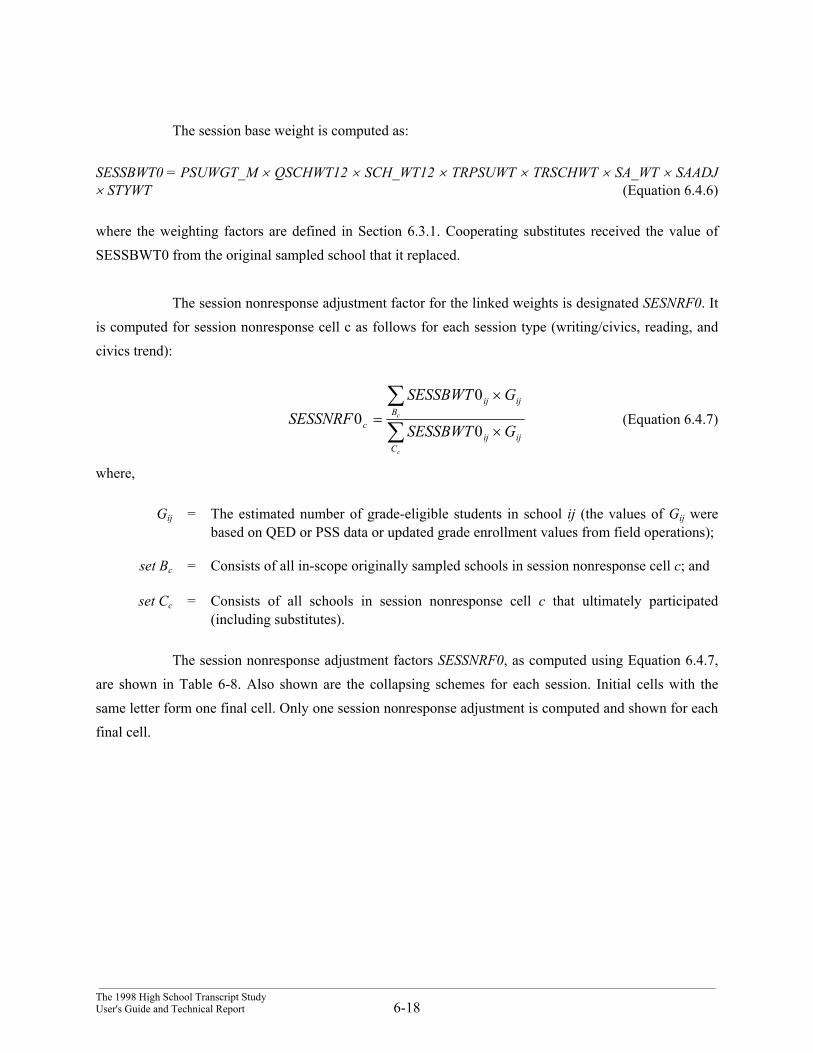
___________________________________________________________________________________________________________________________________The 1998 High School Transcript StudyUser's Guide and Technical Report 6-18
The session base weight is computed as:
SESSBWT0 = PSUWGT_M × QSCHWT12 × SCH_WT12 × TRPSUWT × TRSCHWT × SA_WT × SAADJ× STYWT (Equation 6.4.6)
where the weighting factors are defined in Section 6.3.1. Cooperating substitutes received the value ofSESSBWT0 from the original sampled school that it replaced.
The session nonresponse adjustment factor for the linked weights is designated SESNRF0. Itis computed for session nonresponse cell c as follows for each session type (writing/civics, reading, andcivics trend):
∑∑
×
×=
c
c
Cijij
Bijij
c GSESSBWT
GSESSBWTSESSNRF
0
00 (Equation 6.4.7)
where,
Gij = The estimated number of grade-eligible students in school ij (the values of Gij werebased on QED or PSS data or updated grade enrollment values from field operations);
set Bc = Consists of all in-scope originally sampled schools in session nonresponse cell c; and
set Cc = Consists of all schools in session nonresponse cell c that ultimately participated(including substitutes).
The session nonresponse adjustment factors SESSNRF0, as computed using Equation 6.4.7,are shown in Table 6-8. Also shown are the collapsing schemes for each session. Initial cells with thesame letter form one final cell. Only one session nonresponse adjustment is computed and shown for eachfinal cell.
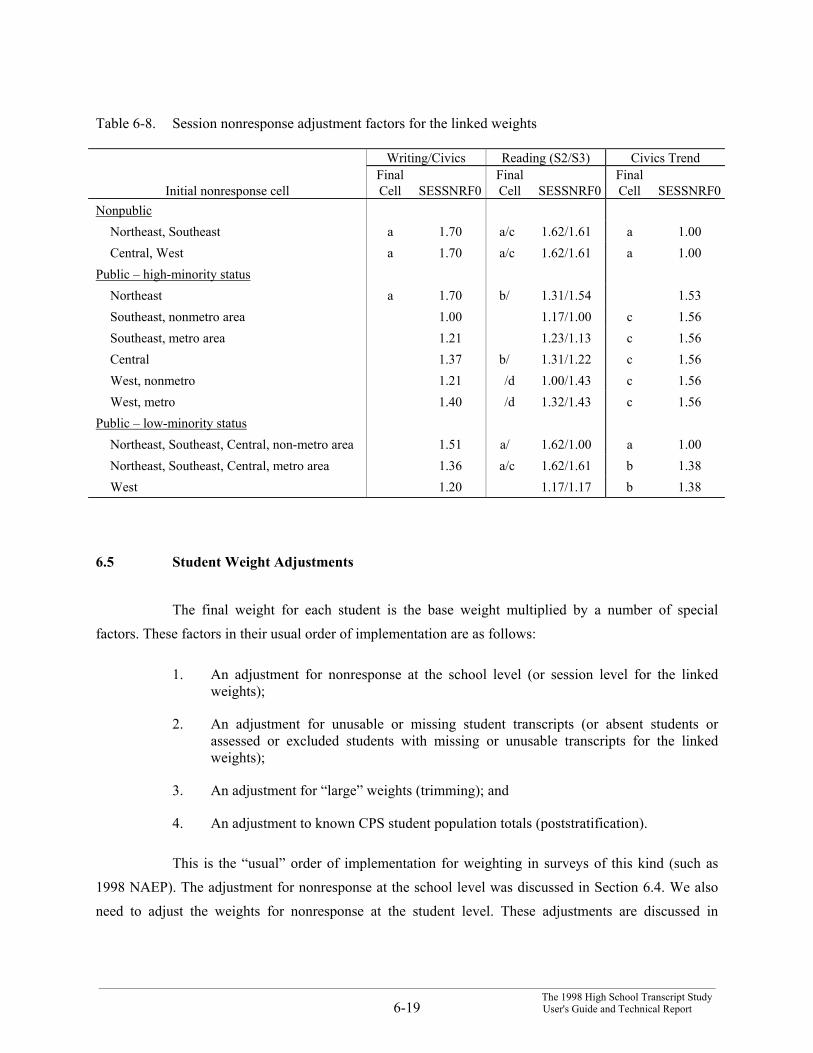
___________________________________________________________________________________________________________________________________The 1998 High School Transcript Study
6-19 User's Guide and Technical Report
Table 6-8. Session nonresponse adjustment factors for the linked weights
Writing/Civics Reading (S2/S3) Civics Trend
Initial nonresponse cellFinalCell SESSNRF0
FinalCell SESSNRF0
FinalCell SESSNRF0
NonpublicNortheast, Southeast a 1.70 a/c 1.62/1.61 a 1.00Central, West a 1.70 a/c 1.62/1.61 a 1.00
Public – high-minority statusNortheast a 1.70 b/ 1.31/1.54 1.53Southeast, nonmetro area 1.00 1.17/1.00 c 1.56Southeast, metro area 1.21 1.23/1.13 c 1.56Central 1.37 b/ 1.31/1.22 c 1.56West, nonmetro 1.21 /d 1.00/1.43 c 1.56West, metro 1.40 /d 1.32/1.43 c 1.56
Public – low-minority statusNortheast, Southeast, Central, non-metro area 1.51 a/ 1.62/1.00 a 1.00Northeast, Southeast, Central, metro area 1.36 a/c 1.62/1.61 b 1.38West 1.20 1.17/1.17 b 1.38
6.5 Student Weight Adjustments
The final weight for each student is the base weight multiplied by a number of specialfactors. These factors in their usual order of implementation are as follows:
1. An adjustment for nonresponse at the school level (or session level for the linkedweights);
2. An adjustment for unusable or missing student transcripts (or absent students orassessed or excluded students with missing or unusable transcripts for the linkedweights);
3. An adjustment for “large” weights (trimming); and
4. An adjustment to known CPS student population totals (poststratification).
This is the “usual” order of implementation for weighting in surveys of this kind (such as1998 NAEP). The adjustment for nonresponse at the school level was discussed in Section 6.4. We alsoneed to adjust the weights for nonresponse at the student level. These adjustments are discussed in
___________________________________________________________________________________________________________________________________The 1998 High School Transcript StudyUser's Guide and Technical Report 6-20
Sections 6.5.1 through 6.5.4. In general practice, adjustment for poststratification is the last step, since thefinal weights should generally aggregate exactly to the poststratification control totals. Thus, anynonresponse adjustments are computed first, followed by a trimming adjustment for large weights,followed by the final poststratification step to generate weights that aggregate exactly to known controltotals.
The trimming adjustments are discussed in Sections 6.5.5 and 6.5.6. For the readingassessment for the linked weights, reporting factors are computed in order to define the reportingpopulations. The calculation of the reporting factors is explained in Section 6.5.7. The poststratificationadjustments are discussed in Sections 6.5.8 and 6.5.9.
6.5.1 Student Nonresponse Adjustment: HSTS Weights
For a small percent of graduated students it was not possible to obtain a transcript. Inaddition, some transcripts were considered unusable, since the number of standardized credits shown onthe transcript was less than the number of credits required to graduate by the school. An adjustment isnecessary in the weights of graduated students with transcripts to account for missing and unusabletranscripts. To do this adjustment correctly, it is necessary to have the complete set of graduated students,with or without transcripts. Students who did not graduate were not included in this adjustment, but theywere retained in the process for poststratification. There are a few students, however, for whom notranscripts were received and the graduation status was unknown. Among these students, a certain percentwas imputed as graduating, based on overall percentages of graduating students. The remainder wereimputed as nongraduating.
The imputation process was a standard hot-deck imputation (see, for example, Little andRubin (1987), Section 4.5.3). For each student with unknown graduation status, a “donor” was randomlyselected (without replacement) from the set of all students with known graduation status from the sameregion, school type, race/ethnicity, age class, school, and gender, in hierarchical order. The tworace/ethnicity categories were (1) white, Asian, or Pacific Islander and (2) black, Hispanic, AmericanIndian, or other. There were two age classes (born before 10/79; born during or after 10/79).
Each student with known graduation status in a cell could be used up to three times as adonor for a student in the same cell with unknown graduation status. If insufficient donors were available
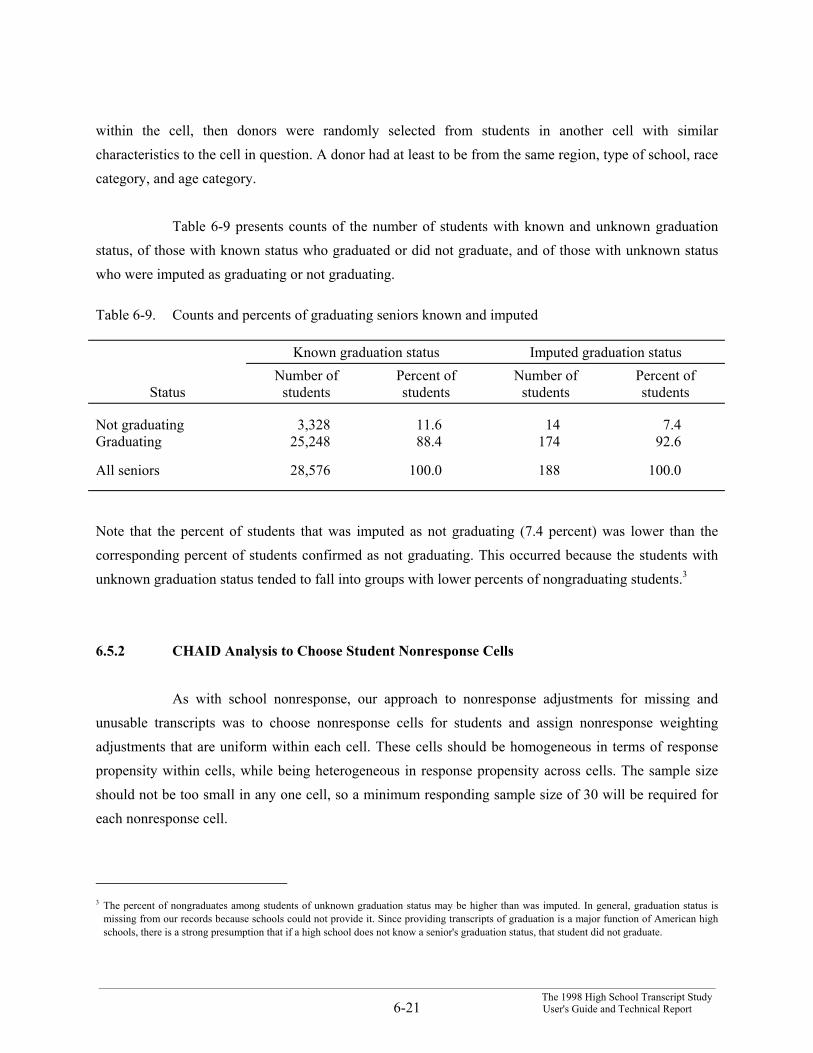
___________________________________________________________________________________________________________________________________The 1998 High School Transcript Study
6-21 User's Guide and Technical Report
within the cell, then donors were randomly selected from students in another cell with similarcharacteristics to the cell in question. A donor had at least to be from the same region, type of school, racecategory, and age category.
Table 6-9 presents counts of the number of students with known and unknown graduationstatus, of those with known status who graduated or did not graduate, and of those with unknown statuswho were imputed as graduating or not graduating.
Table 6-9. Counts and percents of graduating seniors known and imputed
Known graduation status Imputed graduation status
StatusNumber of
studentsPercent ofstudents
Number ofstudents
Percent ofstudents
Not graduating 3,328 11.6 14 7.4Graduating 25,248 88.4 174 92.6
All seniors 28,576 100.0 188 100.0
Note that the percent of students that was imputed as not graduating (7.4 percent) was lower than thecorresponding percent of students confirmed as not graduating. This occurred because the students withunknown graduation status tended to fall into groups with lower percents of nongraduating students.3
6.5.2 CHAID Analysis to Choose Student Nonresponse Cells
As with school nonresponse, our approach to nonresponse adjustments for missing andunusable transcripts was to choose nonresponse cells for students and assign nonresponse weightingadjustments that are uniform within each cell. These cells should be homogeneous in terms of responsepropensity within cells, while being heterogeneous in response propensity across cells. The sample sizeshould not be too small in any one cell, so a minimum responding sample size of 30 will be required foreach nonresponse cell.
3 The percent of nongraduates among students of unknown graduation status may be higher than was imputed. In general, graduation status is
missing from our records because schools could not provide it. Since providing transcripts of graduation is a major function of American highschools, there is a strong presumption that if a high school does not know a senior's graduation status, that student did not graduate.
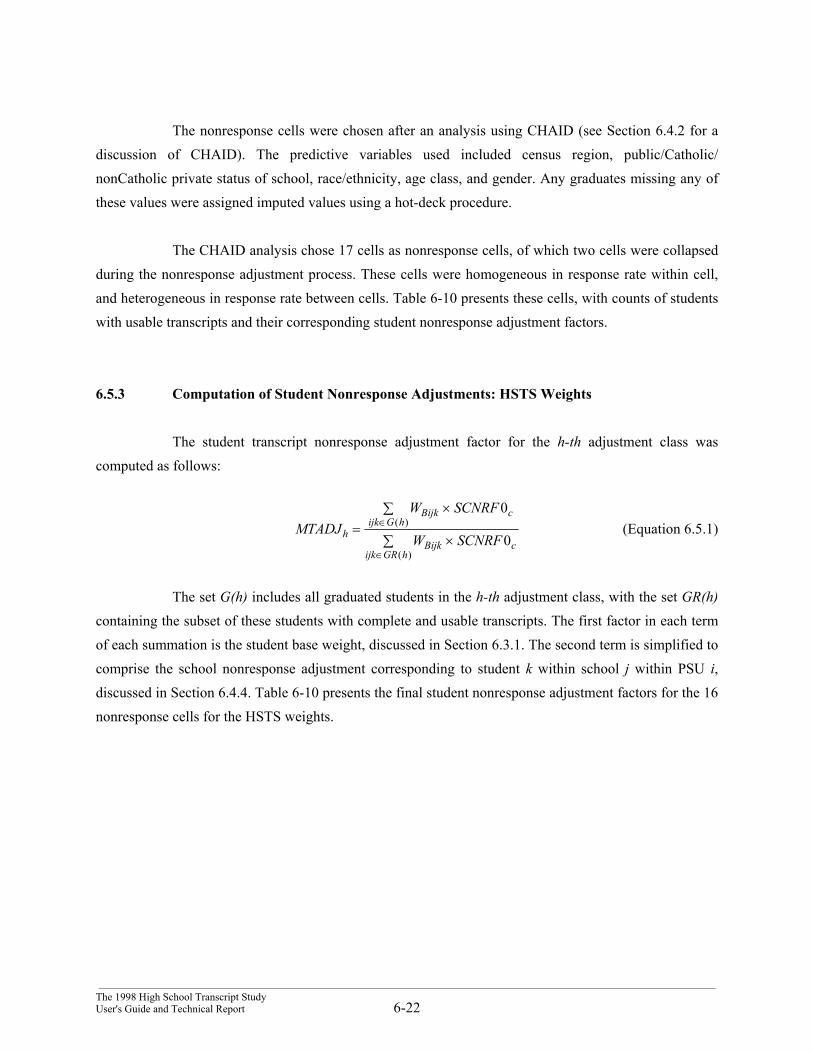
___________________________________________________________________________________________________________________________________The 1998 High School Transcript StudyUser's Guide and Technical Report 6-22
The nonresponse cells were chosen after an analysis using CHAID (see Section 6.4.2 for adiscussion of CHAID). The predictive variables used included census region, public/Catholic/nonCatholic private status of school, race/ethnicity, age class, and gender. Any graduates missing any ofthese values were assigned imputed values using a hot-deck procedure.
The CHAID analysis chose 17 cells as nonresponse cells, of which two cells were collapsedduring the nonresponse adjustment process. These cells were homogeneous in response rate within cell,and heterogeneous in response rate between cells. Table 6-10 presents these cells, with counts of studentswith usable transcripts and their corresponding student nonresponse adjustment factors.
6.5.3 Computation of Student Nonresponse Adjustments: HSTS Weights
The student transcript nonresponse adjustment factor for the h-th adjustment class wascomputed as follows:
∑ ×
∑ ×=
∈
∈
)(
)(
0
0
hGRijkcBijk
hGijkcBijk
h SCNRFW
SCNRFWMTADJ (Equation 6.5.1)
The set G(h) includes all graduated students in the h-th adjustment class, with the set GR(h)containing the subset of these students with complete and usable transcripts. The first factor in each termof each summation is the student base weight, discussed in Section 6.3.1. The second term is simplified tocomprise the school nonresponse adjustment corresponding to student k within school j within PSU i,discussed in Section 6.4.4. Table 6-10 presents the final student nonresponse adjustment factors for the 16nonresponse cells for the HSTS weights.
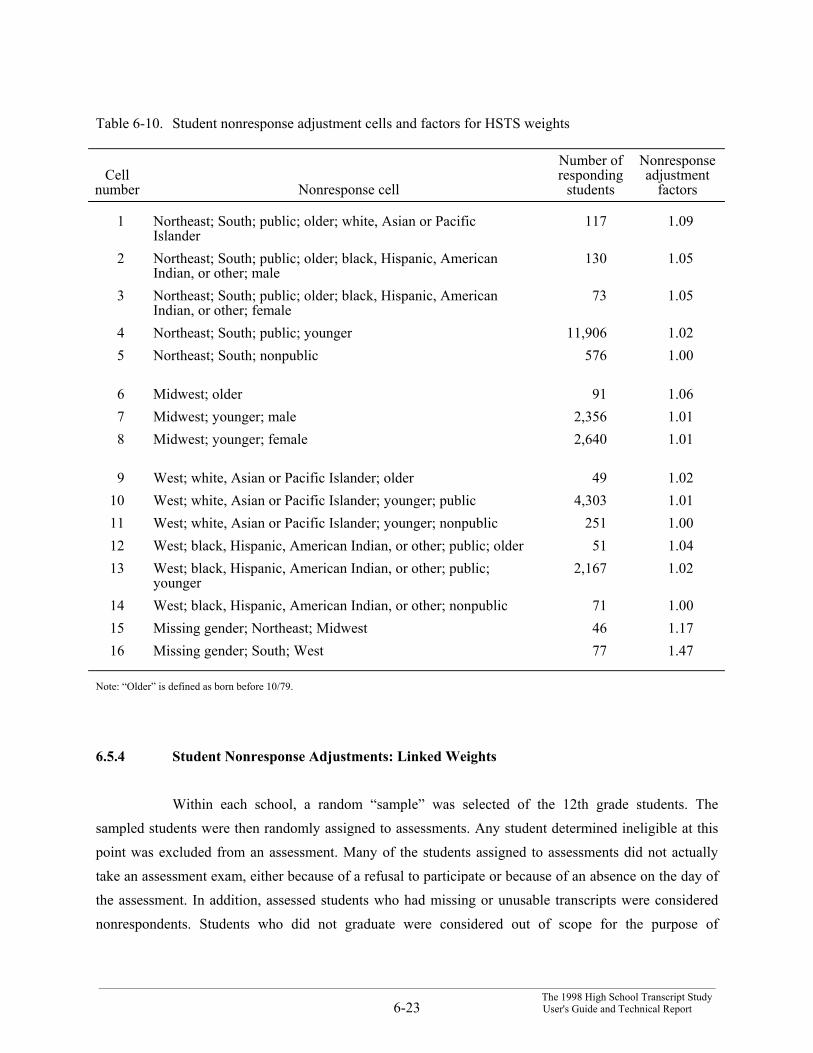
___________________________________________________________________________________________________________________________________The 1998 High School Transcript Study
6-23 User's Guide and Technical Report
Table 6-10. Student nonresponse adjustment cells and factors for HSTS weights
Cellnumber Nonresponse cell
Number ofresponding
students
Nonresponseadjustment
factors
1 Northeast; South; public; older; white, Asian or PacificIslander
117 1.09
2 Northeast; South; public; older; black, Hispanic, AmericanIndian, or other; male
130 1.05
3 Northeast; South; public; older; black, Hispanic, AmericanIndian, or other; female
73 1.05
4 Northeast; South; public; younger 11,906 1.025 Northeast; South; nonpublic 576 1.00
6 Midwest; older 91 1.067 Midwest; younger; male 2,356 1.018 Midwest; younger; female 2,640 1.01
9 West; white, Asian or Pacific Islander; older 49 1.0210 West; white, Asian or Pacific Islander; younger; public 4,303 1.0111 West; white, Asian or Pacific Islander; younger; nonpublic 251 1.0012 West; black, Hispanic, American Indian, or other; public; older 51 1.0413 West; black, Hispanic, American Indian, or other; public;
younger2,167 1.02
14 West; black, Hispanic, American Indian, or other; nonpublic 71 1.0015 Missing gender; Northeast; Midwest 46 1.1716 Missing gender; South; West 77 1.47
Note: “Older” is defined as born before 10/79.
6.5.4 Student Nonresponse Adjustments: Linked Weights
Within each school, a random “sample” was selected of the 12th grade students. Thesampled students were then randomly assigned to assessments. Any student determined ineligible at thispoint was excluded from an assessment. Many of the students assigned to assessments did not actuallytake an assessment exam, either because of a refusal to participate or because of an absence on the day ofthe assessment. In addition, assessed students who had missing or unusable transcripts were considerednonrespondents. Students who did not graduate were considered out of scope for the purpose of
___________________________________________________________________________________________________________________________________The 1998 High School Transcript StudyUser's Guide and Technical Report 6-24
nonresponse adjustment, however, they were retained for poststratification, since the control totals forpoststratification were based on all students, regardless of their graduation status. This section discussesadjustments made in the linked weights for this student-level nonresponse.
As discussed in Section 6.4, nonresponse is a concern in any study because of the possibilitythat the study results will be invalidated by nonresponse bias. Bias could be incurred from a lack ofparticipation from a subset of students, because this group will be “self-selected.” The 1998 HSTS Studymade adjustments to lower this bias using nonresponse adjustments within a selected group ofnonresponse cells. Similar nonresponse cells and the same methodology for determining nonresponseadjustments was used as had been used for the 1998 NAEP assessments. However, the actual nonresponseadjustments for the two studies differ because the set of schools selected for the HSTS study was only asubset of the original set of schools participating in the NAEP assessment.
The nonresponse cells for HSTS were similar to those used for NAEP. The NAEPnonresponse cells are based on the NAEP PSU sampling strata and the age and race/ethnicity of thestudent. The PSU sampling strata are grouped into stratum groupings to the level of region andmetropolitan status for these cells. A dichotomous age status was used for generating nonresponse cells,indicating whether the student was born on or before September 30, 1979 or the student was born later. Adichotomous race/ethnicity status was used for generating nonresponse cells, with the first category white,Asian, or Pacific Islander; and the second category black, Hispanic, American Indian or other.
Nonresponse adjustment cells were formed separately for the excluded students, so thatweights for excluded students with usable transcripts would account for excluded students without usabletranscripts. For the reading assessment, nonresponse adjustment cells were formed separately withinsample types.
Indicate as ST(h) the set of all students assigned to the particular assessment (reading, 25-minute writing, 50-minute writing, civics, civics trend) in the h-th student nonresponse cell, and defineSTR(h) as the corresponding set of students who actually completed the particular assessment in the h-thstudent nonresponse cell. The number of student nonresponse cells formed for each assessment wasreading (59), 25-minute writing (42), 50-minute writing (30), civics (33), and civics trend (11). Thenumber of cells varies by subject due to collapsing rules of a minimum number of 30 responding students,and a maximum adjustment factor of 2.
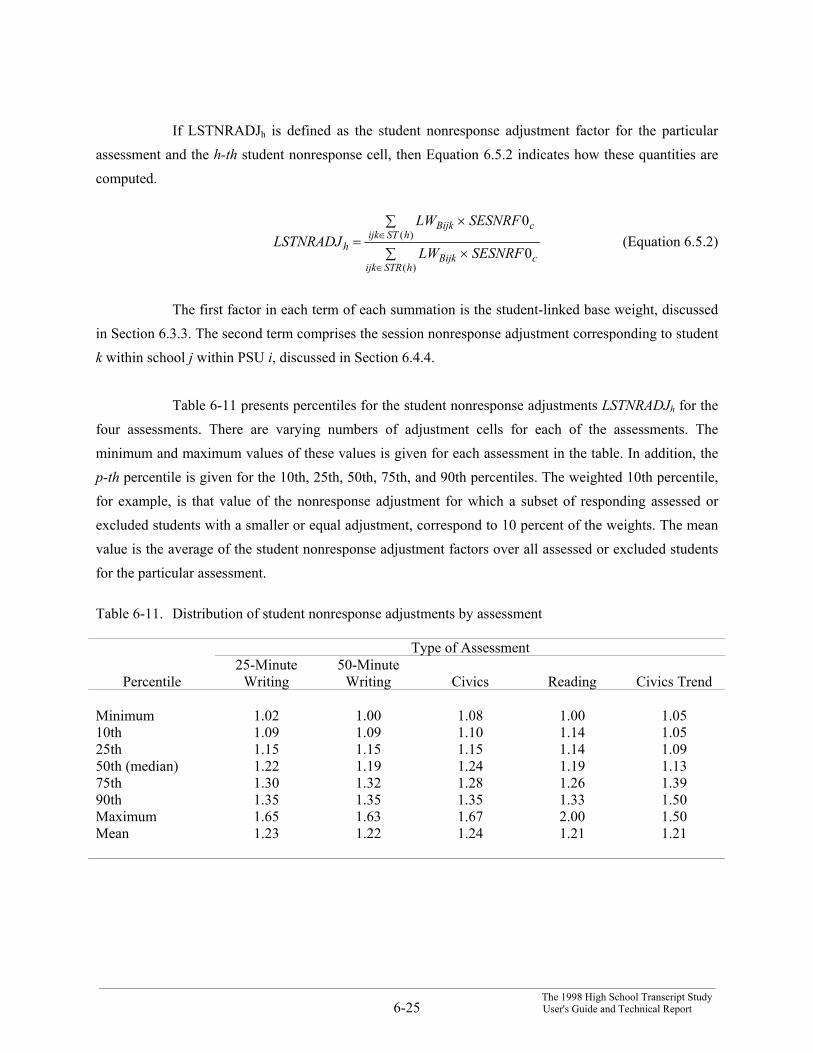
___________________________________________________________________________________________________________________________________The 1998 High School Transcript Study
6-25 User's Guide and Technical Report
If LSTNRADJh is defined as the student nonresponse adjustment factor for the particularassessment and the h-th student nonresponse cell, then Equation 6.5.2 indicates how these quantities arecomputed.
∑ ×
∑ ×=
∈
∈
)(
)(
0
0
hSTRijkcBijk
hSTijkcBijk
h SESNRFLW
SESNRFLWLSTNRADJ (Equation 6.5.2)
The first factor in each term of each summation is the student-linked base weight, discussedin Section 6.3.3. The second term comprises the session nonresponse adjustment corresponding to studentk within school j within PSU i, discussed in Section 6.4.4.
Table 6-11 presents percentiles for the student nonresponse adjustments LSTNRADJh for thefour assessments. There are varying numbers of adjustment cells for each of the assessments. Theminimum and maximum values of these values is given for each assessment in the table. In addition, thep-th percentile is given for the 10th, 25th, 50th, 75th, and 90th percentiles. The weighted 10th percentile,for example, is that value of the nonresponse adjustment for which a subset of responding assessed orexcluded students with a smaller or equal adjustment, correspond to 10 percent of the weights. The meanvalue is the average of the student nonresponse adjustment factors over all assessed or excluded studentsfor the particular assessment.
Table 6-11. Distribution of student nonresponse adjustments by assessment
Type of Assessment
Percentile25-Minute
Writing50-Minute
Writing Civics Reading Civics Trend
Minimum 1.02 1.00 1.08 1.00 1.0510th 1.09 1.09 1.10 1.14 1.0525th 1.15 1.15 1.15 1.14 1.0950th (median) 1.22 1.19 1.24 1.19 1.1375th 1.30 1.32 1.28 1.26 1.3990th 1.35 1.35 1.35 1.33 1.50Maximum 1.65 1.63 1.67 2.00 1.50Mean 1.23 1.22 1.24 1.21 1.21
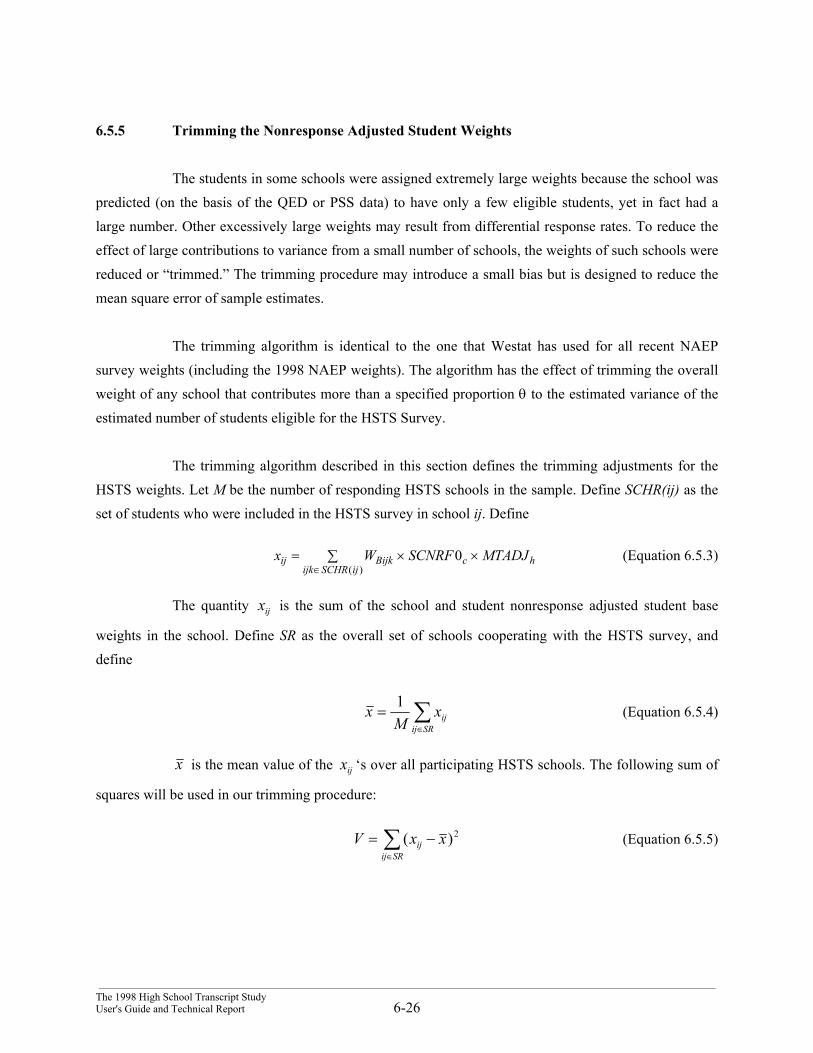
___________________________________________________________________________________________________________________________________The 1998 High School Transcript StudyUser's Guide and Technical Report 6-26
6.5.5 Trimming the Nonresponse Adjusted Student Weights
The students in some schools were assigned extremely large weights because the school waspredicted (on the basis of the QED or PSS data) to have only a few eligible students, yet in fact had alarge number. Other excessively large weights may result from differential response rates. To reduce theeffect of large contributions to variance from a small number of schools, the weights of such schools werereduced or “trimmed.” The trimming procedure may introduce a small bias but is designed to reduce themean square error of sample estimates.
The trimming algorithm is identical to the one that Westat has used for all recent NAEPsurvey weights (including the 1998 NAEP weights). The algorithm has the effect of trimming the overallweight of any school that contributes more than a specified proportion θ to the estimated variance of theestimated number of students eligible for the HSTS Survey.
The trimming algorithm described in this section defines the trimming adjustments for theHSTS weights. Let M be the number of responding HSTS schools in the sample. Define SCHR(ij) as theset of students who were included in the HSTS survey in school ij. Define
0)(
hcijSCHRijk
Bijkij MTADJSCNRFWx ××∑=∈
(Equation 6.5.3)
The quantity xij is the sum of the school and student nonresponse adjusted student base
weights in the school. Define SR as the overall set of schools cooperating with the HSTS survey, anddefine
xM
xijij SR
=∈∑1
(Equation 6.5.4)
x is the mean value of the xij ‘s over all participating HSTS schools. The following sum of
squares will be used in our trimming procedure:
V x xijij SR
= −∈∑ ( )2 (Equation 6.5.5)
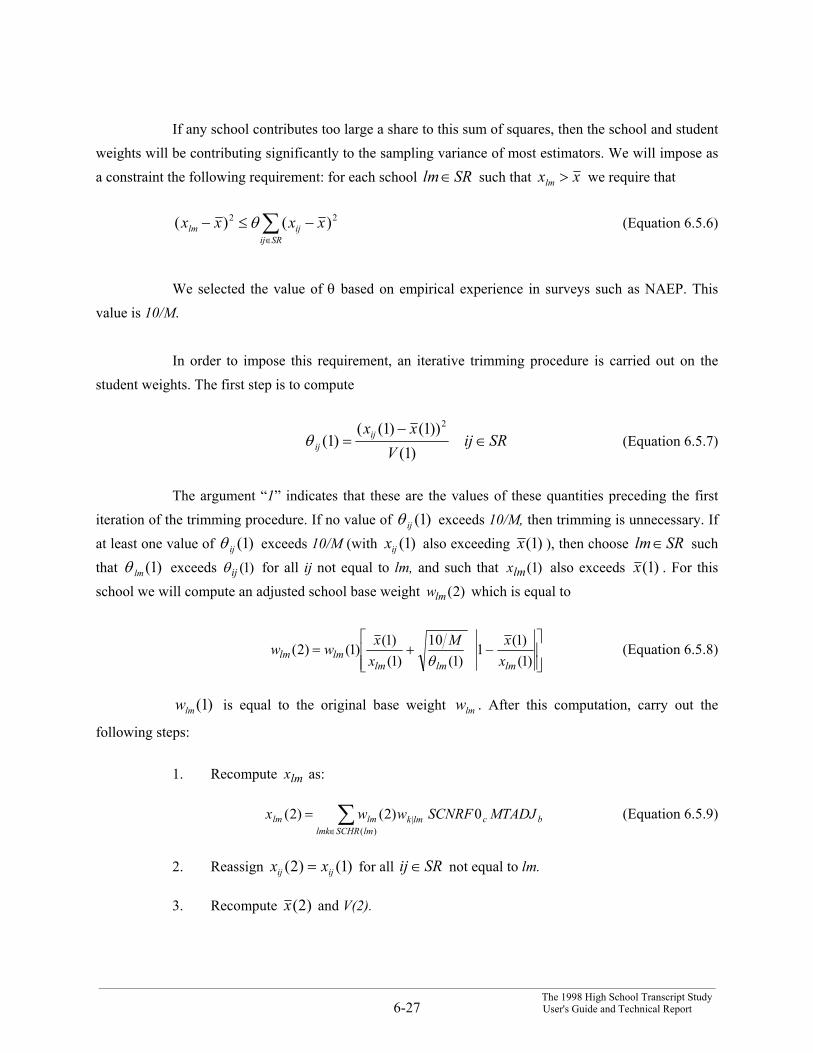
___________________________________________________________________________________________________________________________________The 1998 High School Transcript Study
6-27 User's Guide and Technical Report
If any school contributes too large a share to this sum of squares, then the school and studentweights will be contributing significantly to the sampling variance of most estimators. We will impose asa constraint the following requirement: for each school lm SR∈ such that x xlm > we require that
( ) ( )x x x xlm ijij SR
− ≤ −∈∑2 2θ (Equation 6.5.6)
We selected the value of θ based on empirical experience in surveys such as NAEP. Thisvalue is 10/M.
In order to impose this requirement, an iterative trimming procedure is carried out on thestudent weights. The first step is to compute
θ ijijx x
V( )
( ( ) ( ))( )
11 1
1
2
=−
ij SR∈ (Equation 6.5.7)
The argument “1” indicates that these are the values of these quantities preceding the firstiteration of the trimming procedure. If no value of θ ij ( )1 exceeds 10/M, then trimming is unnecessary. Ifat least one value of θ ij ( )1 exceeds 10/M (with xij ( )1 also exceeding x( )1 ), then choose lm SR∈ suchthat θ lm ( )1 exceeds )1(ijθ for all ij not equal to lm, and such that xlm( )1 also exceeds x( )1 . For thisschool we will compute an adjusted school base weight )2(lmw which is equal to
−+=
)1()1(1
)1(10
)1()1()1()2(
lmlmlmlmlm x
xMxxww
θ(Equation 6.5.8)
wlm( )1 is equal to the original base weight wlm . After this computation, carry out the
following steps:
1. Recompute xlm as:
MTADJSCNRF wwx bclmSCHRlmk
lmklmlm 0)2()2()(
|∑∈
= (Equation 6.5.9)
2. Reassign x xij ij( ) ( )2 1= for all ij SR∈ not equal to lm.
3. Recompute x( )2 and V(2).
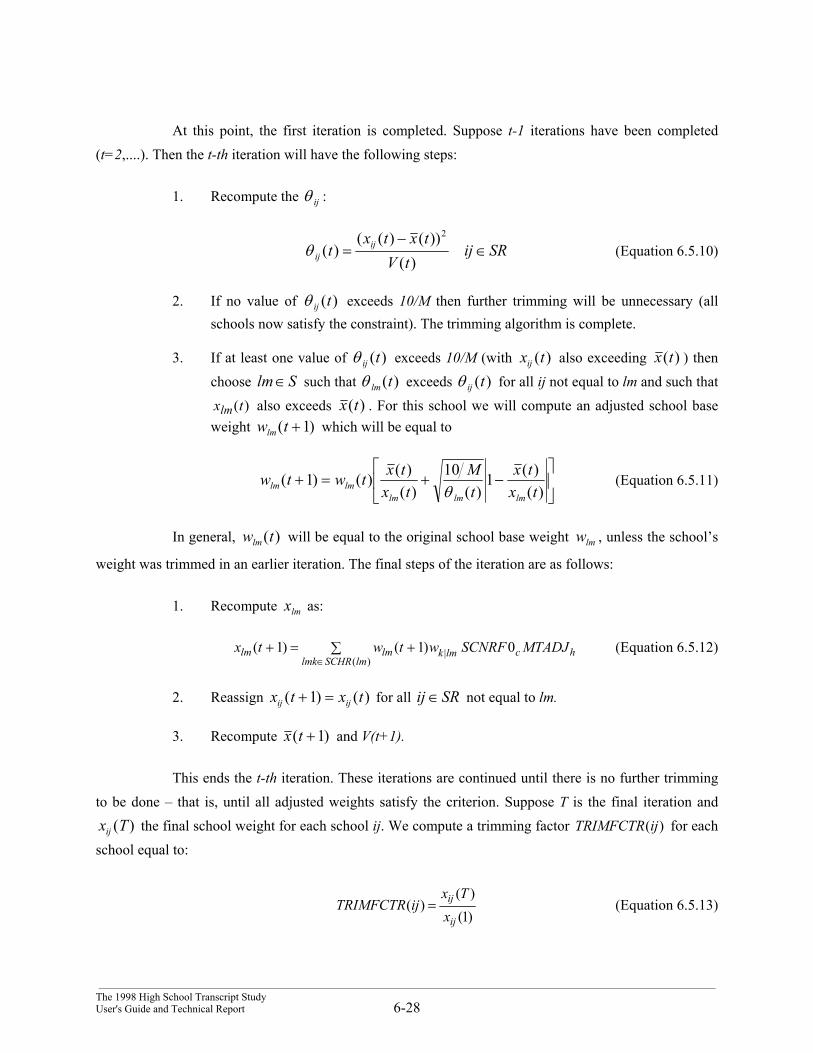
___________________________________________________________________________________________________________________________________The 1998 High School Transcript StudyUser's Guide and Technical Report 6-28
At this point, the first iteration is completed. Suppose t-1 iterations have been completed(t=2,....). Then the t-th iteration will have the following steps:
1. Recompute the θ ij :
θ ijijt
x t x tV t
( )( ( ) ( ))
( )=
− 2
ij SR∈ (Equation 6.5.10)
2. If no value of θ ij t( ) exceeds 10/M then further trimming will be unnecessary (allschools now satisfy the constraint). The trimming algorithm is complete.
3. If at least one value of θ ij t( ) exceeds 10/M (with x tij ( ) also exceeding x t( ) ) thenchoose lm S∈ such that θ lm t( ) exceeds θ ij t( ) for all ij not equal to lm and such thatx tlm( ) also exceeds x t( ) . For this school we will compute an adjusted school baseweight w tlm( )+1 which will be equal to
w t w t x tx t
Mt
x tx tlm lm
lm lm lm
( ) ( ) ( )( ) ( )
( )( )
+ = + −
1 10 1
θ(Equation 6.5.11)
In general, w tlm( ) will be equal to the original school base weight wlm , unless the school’s
weight was trimmed in an earlier iteration. The final steps of the iteration are as follows:
1. Recompute xlm as:
0 )1()1()(
| hclmSCHRlmk
lmklmlm MTADJSCNRFwtwtx ∑ +=+∈
(Equation 6.5.12)
2. Reassign x t x tij ij( ) ( )+ =1 for all ij SR∈ not equal to lm.
3. Recompute x t( )+1 and V(t+1).
This ends the t-th iteration. These iterations are continued until there is no further trimmingto be done – that is, until all adjusted weights satisfy the criterion. Suppose T is the final iteration andx Tij ( ) the final school weight for each school ij. We compute a trimming factor )(ijTRIMFCTR for eachschool equal to:
)1()(
)(ij
ij
xTx
ijTRIMFCTR = (Equation 6.5.13)
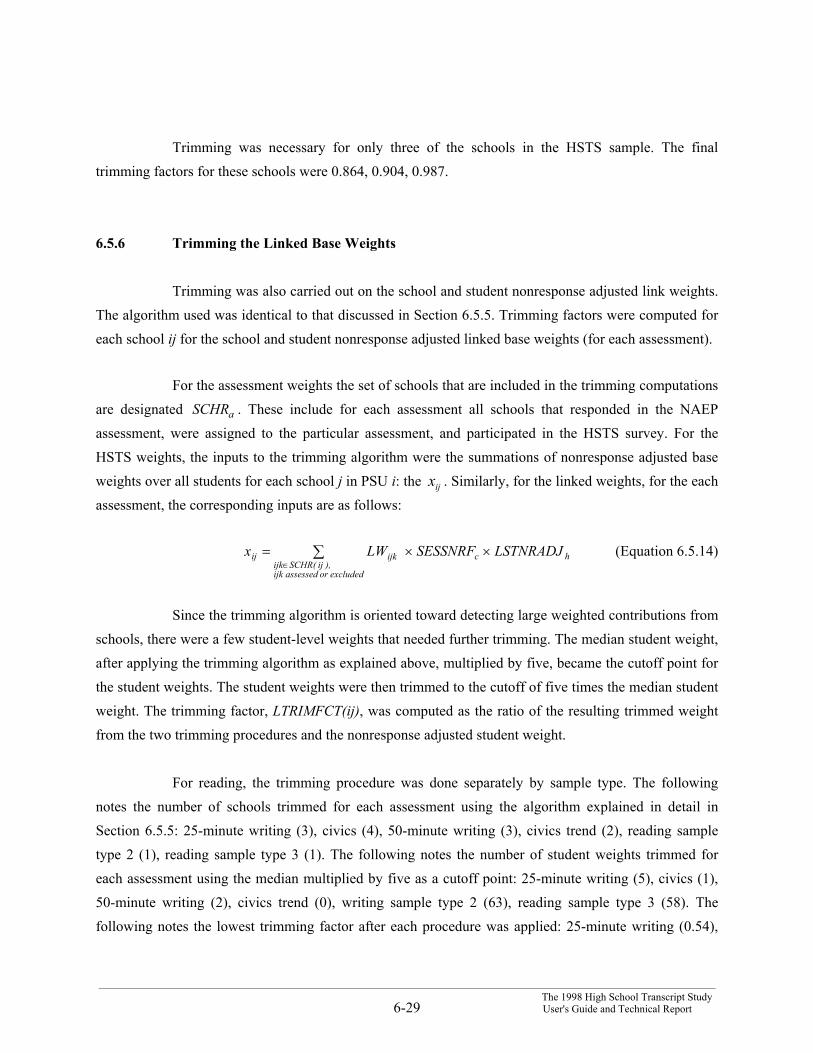
___________________________________________________________________________________________________________________________________The 1998 High School Transcript Study
6-29 User's Guide and Technical Report
Trimming was necessary for only three of the schools in the HSTS sample. The finaltrimming factors for these schools were 0.864, 0.904, 0.987.
6.5.6 Trimming the Linked Base Weights
Trimming was also carried out on the school and student nonresponse adjusted link weights.The algorithm used was identical to that discussed in Section 6.5.5. Trimming factors were computed foreach school ij for the school and student nonresponse adjusted linked base weights (for each assessment).
For the assessment weights the set of schools that are included in the trimming computationsare designated aSCHR . These include for each assessment all schools that responded in the NAEPassessment, were assigned to the particular assessment, and participated in the HSTS survey. For theHSTS weights, the inputs to the trimming algorithm were the summations of nonresponse adjusted baseweights over all students for each school j in PSU i: the xij . Similarly, for the linked weights, for the eachassessment, the corresponding inputs are as follows:
hc
excluded orassessed ijk ),ij(SCHRijk
ijkij LSTNRADJSESSNRF LWx ××= ∑∈
(Equation 6.5.14)
Since the trimming algorithm is oriented toward detecting large weighted contributions fromschools, there were a few student-level weights that needed further trimming. The median student weight,after applying the trimming algorithm as explained above, multiplied by five, became the cutoff point forthe student weights. The student weights were then trimmed to the cutoff of five times the median studentweight. The trimming factor, LTRIMFCT(ij), was computed as the ratio of the resulting trimmed weightfrom the two trimming procedures and the nonresponse adjusted student weight.
For reading, the trimming procedure was done separately by sample type. The followingnotes the number of schools trimmed for each assessment using the algorithm explained in detail inSection 6.5.5: 25-minute writing (3), civics (4), 50-minute writing (3), civics trend (2), reading sampletype 2 (1), reading sample type 3 (1). The following notes the number of student weights trimmed foreach assessment using the median multiplied by five as a cutoff point: 25-minute writing (5), civics (1),50-minute writing (2), civics trend (0), writing sample type 2 (63), reading sample type 3 (58). Thefollowing notes the lowest trimming factor after each procedure was applied: 25-minute writing (0.54),
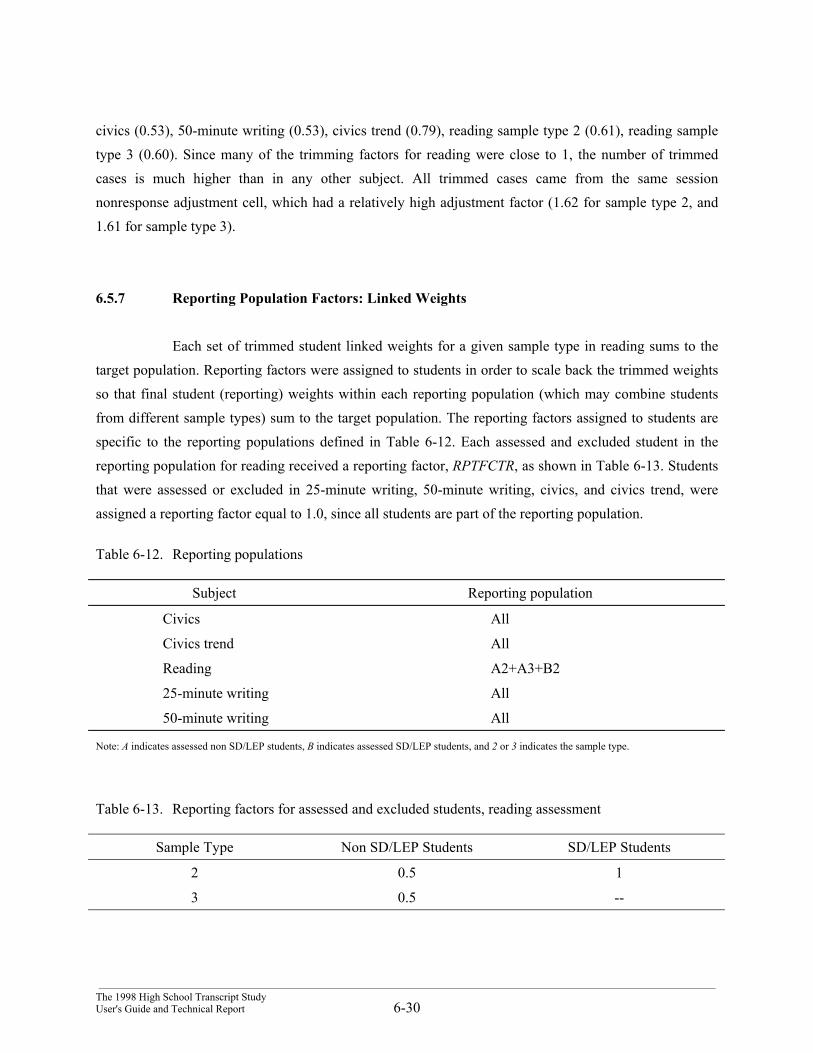
___________________________________________________________________________________________________________________________________The 1998 High School Transcript StudyUser's Guide and Technical Report 6-30
civics (0.53), 50-minute writing (0.53), civics trend (0.79), reading sample type 2 (0.61), reading sampletype 3 (0.60). Since many of the trimming factors for reading were close to 1, the number of trimmedcases is much higher than in any other subject. All trimmed cases came from the same sessionnonresponse adjustment cell, which had a relatively high adjustment factor (1.62 for sample type 2, and1.61 for sample type 3).
6.5.7 Reporting Population Factors: Linked Weights
Each set of trimmed student linked weights for a given sample type in reading sums to thetarget population. Reporting factors were assigned to students in order to scale back the trimmed weightsso that final student (reporting) weights within each reporting population (which may combine studentsfrom different sample types) sum to the target population. The reporting factors assigned to students arespecific to the reporting populations defined in Table 6-12. Each assessed and excluded student in thereporting population for reading received a reporting factor, RPTFCTR, as shown in Table 6-13. Studentsthat were assessed or excluded in 25-minute writing, 50-minute writing, civics, and civics trend, wereassigned a reporting factor equal to 1.0, since all students are part of the reporting population.
Table 6-12. Reporting populations
Subject Reporting population
Civics All
Civics trend All
Reading A2+A3+B2
25-minute writing All
50-minute writing All
Note: A indicates assessed non SD/LEP students, B indicates assessed SD/LEP students, and 2 or 3 indicates the sample type.
Table 6-13. Reporting factors for assessed and excluded students, reading assessment
Sample Type Non SD/LEP Students SD/LEP Students
2 0.5 1
3 0.5 --
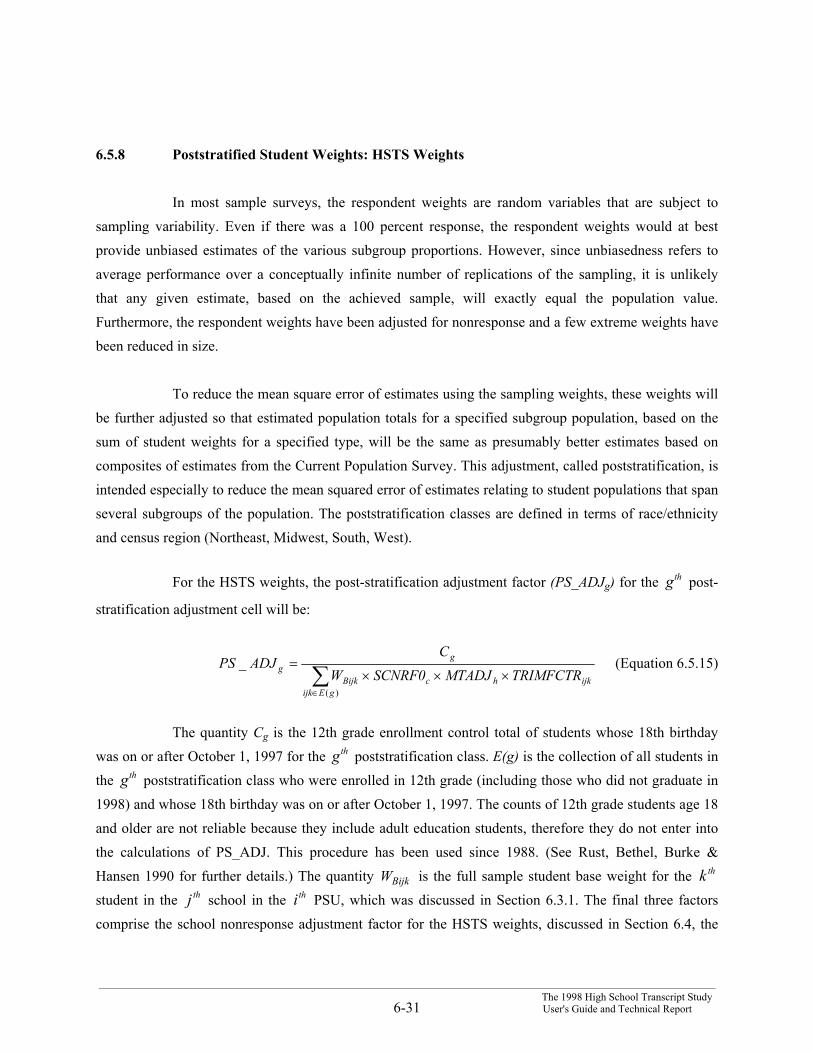
___________________________________________________________________________________________________________________________________The 1998 High School Transcript Study
6-31 User's Guide and Technical Report
6.5.8 Poststratified Student Weights: HSTS Weights
In most sample surveys, the respondent weights are random variables that are subject tosampling variability. Even if there was a 100 percent response, the respondent weights would at bestprovide unbiased estimates of the various subgroup proportions. However, since unbiasedness refers toaverage performance over a conceptually infinite number of replications of the sampling, it is unlikelythat any given estimate, based on the achieved sample, will exactly equal the population value.Furthermore, the respondent weights have been adjusted for nonresponse and a few extreme weights havebeen reduced in size.
To reduce the mean square error of estimates using the sampling weights, these weights willbe further adjusted so that estimated population totals for a specified subgroup population, based on thesum of student weights for a specified type, will be the same as presumably better estimates based oncomposites of estimates from the Current Population Survey. This adjustment, called poststratification, isintended especially to reduce the mean squared error of estimates relating to student populations that spanseveral subgroups of the population. The poststratification classes are defined in terms of race/ethnicityand census region (Northeast, Midwest, South, West).
For the HSTS weights, the post-stratification adjustment factor (PS_ADJg) for the gth post-
stratification adjustment cell will be:
∑∈
×××=
)(
_
gEijkijkhcBijk
gg TRIMFCTRMTADJCNRF0S W
CADJPS (Equation 6.5.15)
The quantity Cg is the 12th grade enrollment control total of students whose 18th birthdaywas on or after October 1, 1997 for the gth poststratification class. E(g) is the collection of all students inthe gth poststratification class who were enrolled in 12th grade (including those who did not graduate in1998) and whose 18th birthday was on or after October 1, 1997. The counts of 12th grade students age 18and older are not reliable because they include adult education students, therefore they do not enter intothe calculations of PS_ADJ. This procedure has been used since 1988. (See Rust, Bethel, Burke &Hansen 1990 for further details.) The quantity BijkW is the full sample student base weight for the k th
student in the j th school in the ith PSU, which was discussed in Section 6.3.1. The final three factorscomprise the school nonresponse adjustment factor for the HSTS weights, discussed in Section 6.4, the
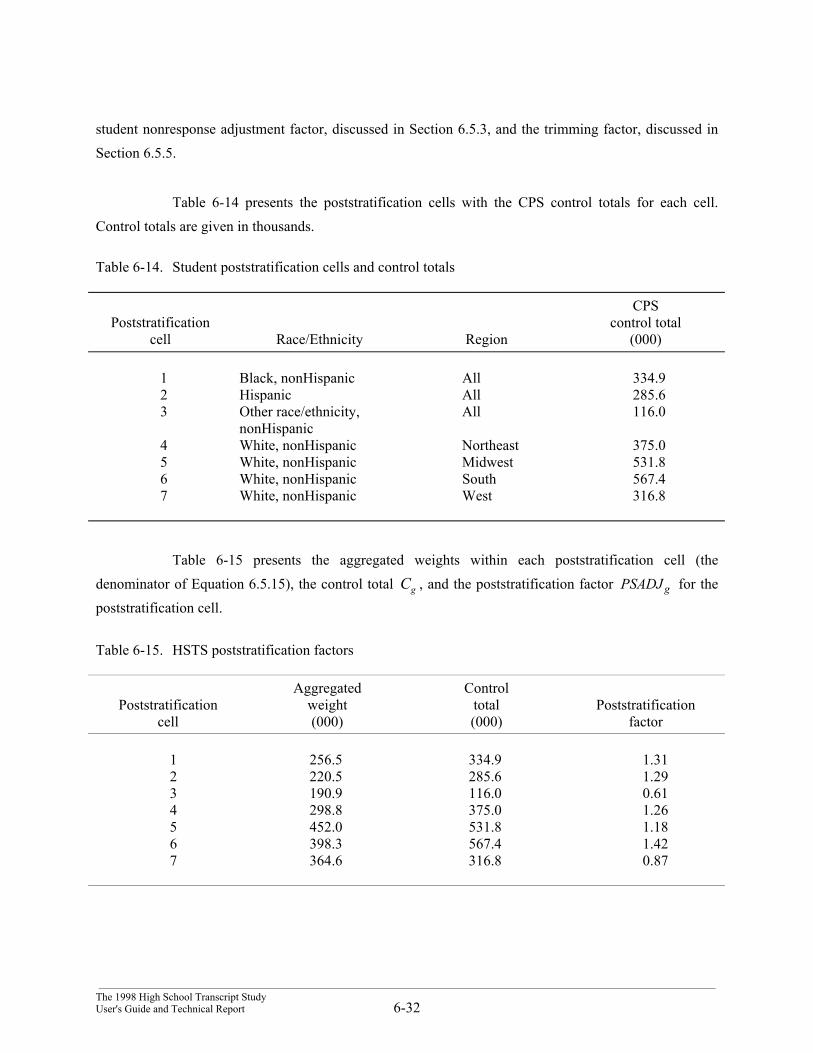
___________________________________________________________________________________________________________________________________The 1998 High School Transcript StudyUser's Guide and Technical Report 6-32
student nonresponse adjustment factor, discussed in Section 6.5.3, and the trimming factor, discussed inSection 6.5.5.
Table 6-14 presents the poststratification cells with the CPS control totals for each cell.Control totals are given in thousands.
Table 6-14. Student poststratification cells and control totals
Poststratificationcell Race/Ethnicity Region
CPScontrol total
(000)
1 Black, nonHispanic All 334.92 Hispanic All 285.63 Other race/ethnicity,
nonHispanicAll 116.0
4 White, nonHispanic Northeast 375.05 White, nonHispanic Midwest 531.86 White, nonHispanic South 567.47 White, nonHispanic West 316.8
Table 6-15 presents the aggregated weights within each poststratification cell (thedenominator of Equation 6.5.15), the control total Cg , and the poststratification factor gPSADJ for thepoststratification cell.
Table 6-15. HSTS poststratification factors
Poststratificationcell
Aggregatedweight(000)
Controltotal(000)
Poststratificationfactor
1 256.5 334.9 1.312 220.5 285.6 1.293 190.9 116.0 0.614 298.8 375.0 1.265 452.0 531.8 1.186 398.3 567.4 1.427 364.6 316.8 0.87
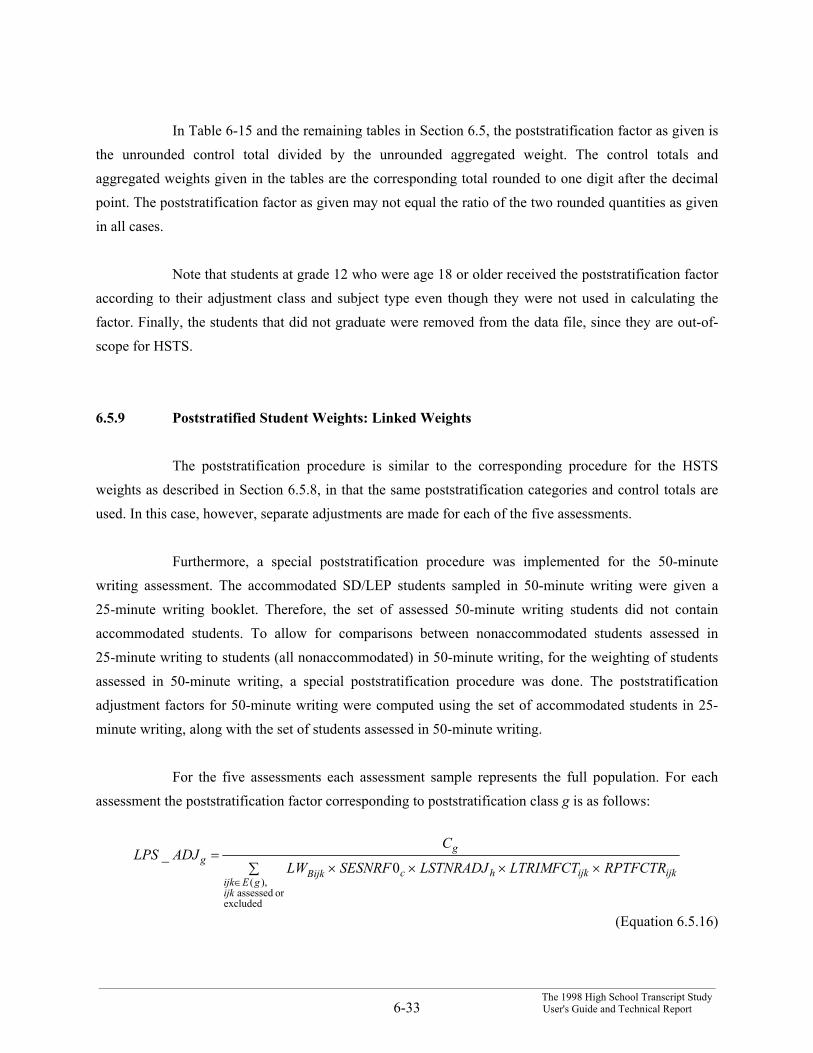
___________________________________________________________________________________________________________________________________The 1998 High School Transcript Study
6-33 User's Guide and Technical Report
In Table 6-15 and the remaining tables in Section 6.5, the poststratification factor as given isthe unrounded control total divided by the unrounded aggregated weight. The control totals andaggregated weights given in the tables are the corresponding total rounded to one digit after the decimalpoint. The poststratification factor as given may not equal the ratio of the two rounded quantities as givenin all cases.
Note that students at grade 12 who were age 18 or older received the poststratification factoraccording to their adjustment class and subject type even though they were not used in calculating thefactor. Finally, the students that did not graduate were removed from the data file, since they are out-of-scope for HSTS.
6.5.9 Poststratified Student Weights: Linked Weights
The poststratification procedure is similar to the corresponding procedure for the HSTSweights as described in Section 6.5.8, in that the same poststratification categories and control totals areused. In this case, however, separate adjustments are made for each of the five assessments.
Furthermore, a special poststratification procedure was implemented for the 50-minutewriting assessment. The accommodated SD/LEP students sampled in 50-minute writing were given a25-minute writing booklet. Therefore, the set of assessed 50-minute writing students did not containaccommodated students. To allow for comparisons between nonaccommodated students assessed in25-minute writing to students (all nonaccommodated) in 50-minute writing, for the weighting of studentsassessed in 50-minute writing, a special poststratification procedure was done. The poststratificationadjustment factors for 50-minute writing were computed using the set of accommodated students in 25-minute writing, along with the set of students assessed in 50-minute writing.
For the five assessments each assessment sample represents the full population. For eachassessment the poststratification factor corresponding to poststratification class g is as follows:
∑ ××××=
∈
excludedor assessed
),( 0
_
ijkgEijk
ijkijkhcBijk
gg RPTFCTRLTRIMFCTLSTNRADJSESNRFLW
CADJLPS
(Equation 6.5.16)
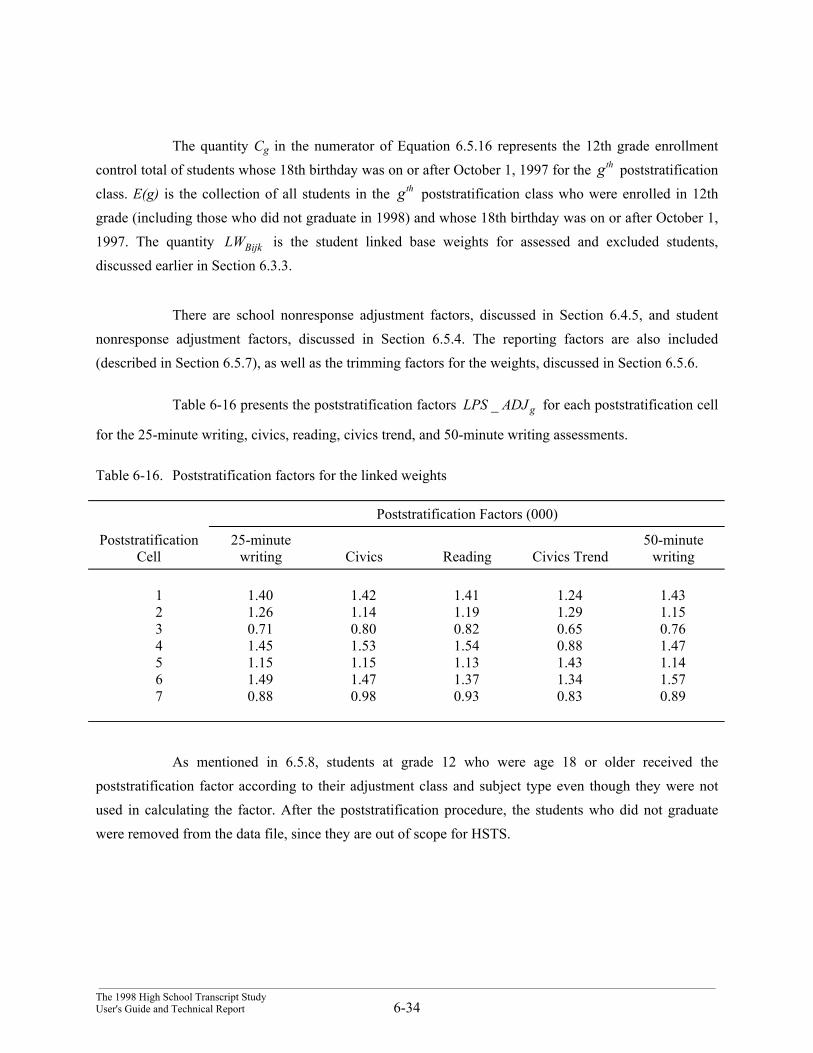
___________________________________________________________________________________________________________________________________The 1998 High School Transcript StudyUser's Guide and Technical Report 6-34
The quantity Cg in the numerator of Equation 6.5.16 represents the 12th grade enrollmentcontrol total of students whose 18th birthday was on or after October 1, 1997 for the gth poststratificationclass. E(g) is the collection of all students in the gth poststratification class who were enrolled in 12thgrade (including those who did not graduate in 1998) and whose 18th birthday was on or after October 1,1997. The quantity BijkLW is the student linked base weights for assessed and excluded students,discussed earlier in Section 6.3.3.
There are school nonresponse adjustment factors, discussed in Section 6.4.5, and studentnonresponse adjustment factors, discussed in Section 6.5.4. The reporting factors are also included(described in Section 6.5.7), as well as the trimming factors for the weights, discussed in Section 6.5.6.
Table 6-16 presents the poststratification factors gADJLPS _ for each poststratification cell
for the 25-minute writing, civics, reading, civics trend, and 50-minute writing assessments.
Table 6-16. Poststratification factors for the linked weights
Poststratification Factors (000)
PoststratificationCell
25-minutewriting Civics Reading Civics Trend
50-minutewriting
1 1.40 1.42 1.41 1.24 1.432 1.26 1.14 1.19 1.29 1.153 0.71 0.80 0.82 0.65 0.764 1.45 1.53 1.54 0.88 1.475 1.15 1.15 1.13 1.43 1.146 1.49 1.47 1.37 1.34 1.577 0.88 0.98 0.93 0.83 0.89
As mentioned in 6.5.8, students at grade 12 who were age 18 or older received thepoststratification factor according to their adjustment class and subject type even though they were notused in calculating the factor. After the poststratification procedure, the students who did not graduatewere removed from the data file, since they are out of scope for HSTS.
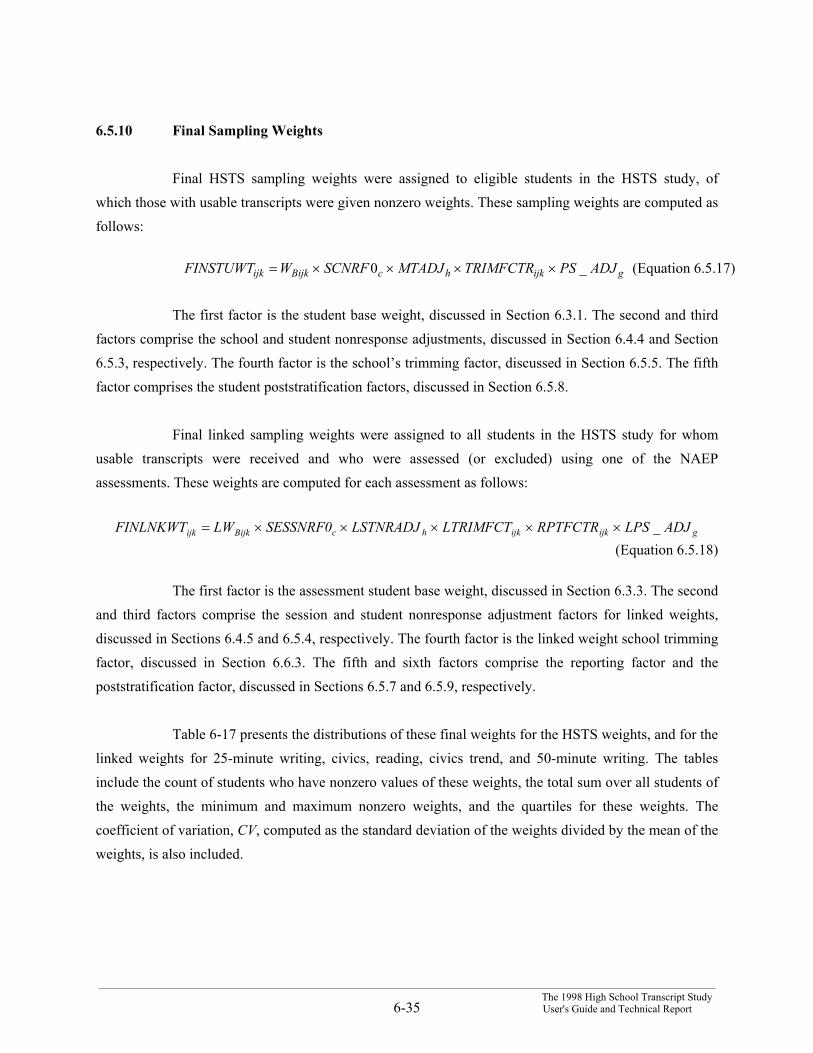
___________________________________________________________________________________________________________________________________The 1998 High School Transcript Study
6-35 User's Guide and Technical Report
6.5.10 Final Sampling Weights
Final HSTS sampling weights were assigned to eligible students in the HSTS study, ofwhich those with usable transcripts were given nonzero weights. These sampling weights are computed asfollows:
_ 0 gijkhcBijkijk ADJPSTRIMFCTRMTADJSCNRFWFINSTUWT ××××= (Equation 6.5.17)
The first factor is the student base weight, discussed in Section 6.3.1. The second and thirdfactors comprise the school and student nonresponse adjustments, discussed in Section 6.4.4 and Section6.5.3, respectively. The fourth factor is the school’s trimming factor, discussed in Section 6.5.5. The fifthfactor comprises the student poststratification factors, discussed in Section 6.5.8.
Final linked sampling weights were assigned to all students in the HSTS study for whomusable transcripts were received and who were assessed (or excluded) using one of the NAEPassessments. These weights are computed for each assessment as follows:
gijkijkhcBijkijk ADJ_LPSRPTFCTRLTRIMFCTLSTNRADJ SESSNRF0LWFINLNKWT ×××××=
(Equation 6.5.18)
The first factor is the assessment student base weight, discussed in Section 6.3.3. The secondand third factors comprise the session and student nonresponse adjustment factors for linked weights,discussed in Sections 6.4.5 and 6.5.4, respectively. The fourth factor is the linked weight school trimmingfactor, discussed in Section 6.6.3. The fifth and sixth factors comprise the reporting factor and thepoststratification factor, discussed in Sections 6.5.7 and 6.5.9, respectively.
Table 6-17 presents the distributions of these final weights for the HSTS weights, and for thelinked weights for 25-minute writing, civics, reading, civics trend, and 50-minute writing. The tablesinclude the count of students who have nonzero values of these weights, the total sum over all students ofthe weights, the minimum and maximum nonzero weights, and the quartiles for these weights. Thecoefficient of variation, CV, computed as the standard deviation of the weights divided by the mean of theweights, is also included.
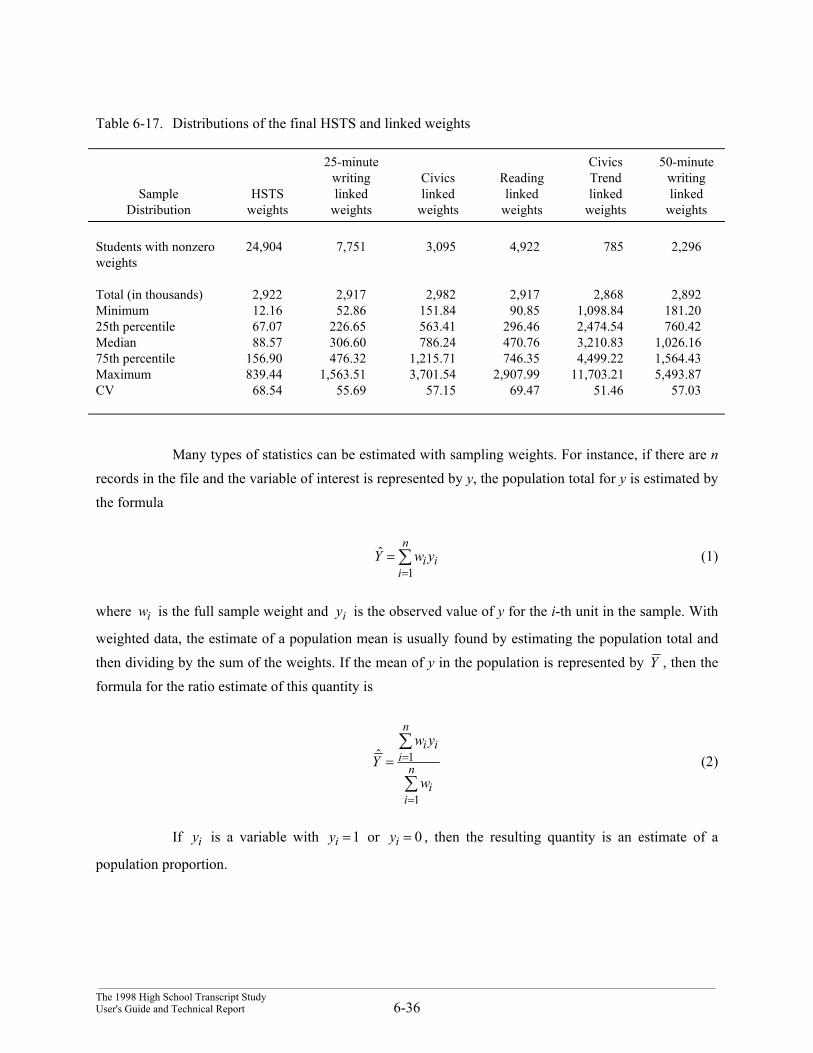
___________________________________________________________________________________________________________________________________The 1998 High School Transcript StudyUser's Guide and Technical Report 6-36
Table 6-17. Distributions of the final HSTS and linked weights
SampleDistribution
HSTSweights
25-minutewritinglinked
weights
Civicslinked
weights
Readinglinked
weights
CivicsTrendlinked
weights
50-minutewritinglinked
weights
Students with nonzeroweights
24,904 7,751 3,095 4,922 785 2,296
Total (in thousands) 2,922 2,917 2,982 2,917 2,868 2,892Minimum 12.16 52.86 151.84 90.85 1,098.84 181.2025th percentile 67.07 226.65 563.41 296.46 2,474.54 760.42Median 88.57 306.60 786.24 470.76 3,210.83 1,026.1675th percentile 156.90 476.32 1,215.71 746.35 4,499.22 1,564.43Maximum 839.44 1,563.51 3,701.54 2,907.99 11,703.21 5,493.87CV 68.54 55.69 57.15 69.47 51.46 57.03
Many types of statistics can be estimated with sampling weights. For instance, if there are nrecords in the file and the variable of interest is represented by y, the population total for y is estimated bythe formula
∑=
=n
iii ywY
1
ˆ (1)
where iw is the full sample weight and iy is the observed value of y for the i-th unit in the sample. With
weighted data, the estimate of a population mean is usually found by estimating the population total andthen dividing by the sum of the weights. If the mean of y in the population is represented by Y , then theformula for the ratio estimate of this quantity is
∑
∑
=
== n
ii
n
iii
w
ywY
1
1ˆ (2)
If iy is a variable with 1=iy or 0=iy , then the resulting quantity is an estimate of a
population proportion.
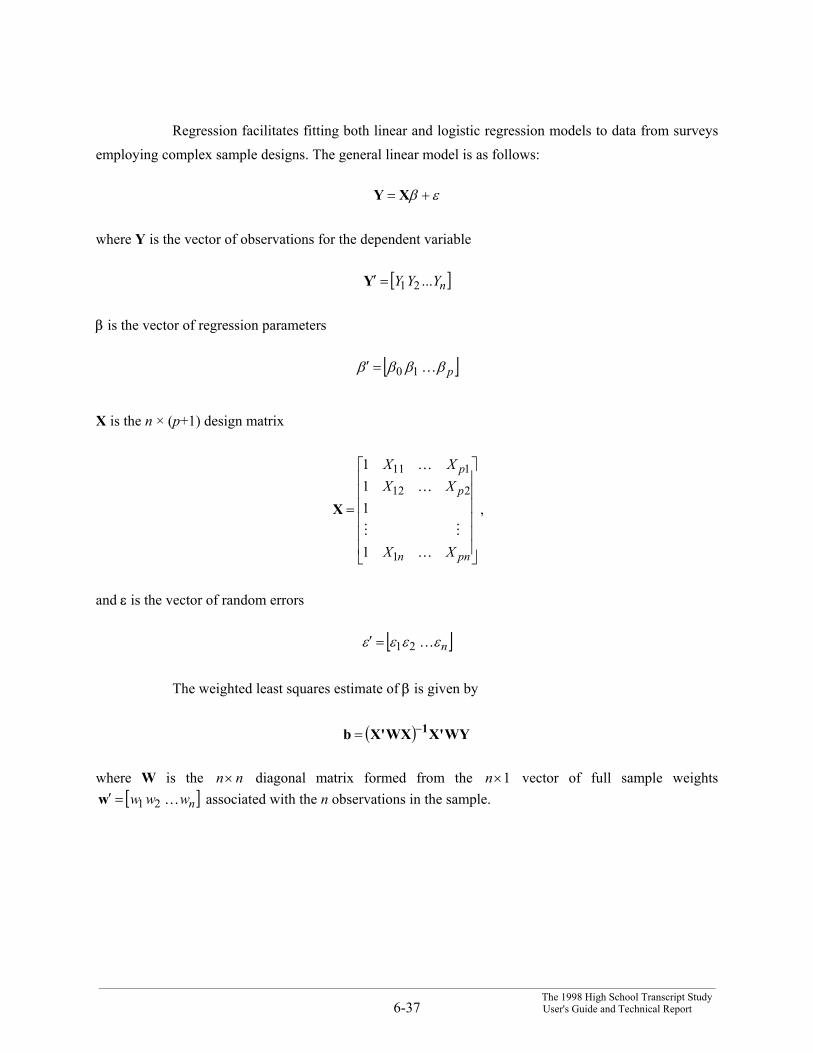
___________________________________________________________________________________________________________________________________The 1998 High School Transcript Study
6-37 User's Guide and Technical Report
Regression facilitates fitting both linear and logistic regression models to data from surveysemploying complex sample designs. The general linear model is as follows:
εβ += XY
where Y is the vector of observations for the dependent variable
[ ]nYYY ...21=′Y
β is the vector of regression parameters
[ ]pββββ K10=′
X is the n × (p+1) design matrix
=
pnn
p
p
XX
XXXX
K
MM
K
K
1
212
111
1
111
X ,
and ε is the vector of random errors
[ ]nεεεε K21=′
The weighted least squares estimate of β is given by
( ) WYX'WXX'b 1−=
where W is the nn× diagonal matrix formed from the 1×n vector of full sample weights[ ]nwww K21=′w associated with the n observations in the sample.
___________________________________________________________________________________________________________________________________The 1998 High School Transcript StudyUser's Guide and Technical Report 6-38
6.6 Variance Estimation
For variance estimation, both the 1998 NAEP survey and the 1998 HSTS survey used thestratified jackknife technique that, as its first step, draws carefully selected subsets of the data. For eachrespondent in each subset, a sampling weight is determined as if the chosen subset were, in fact, theresponding sample. This process generates a set of “replicate” weights for each responding samplemember. These replicate weights are used to compute a series of replicate estimators for each surveycharacteristic. The variability of these replicate estimators around the original estimator gives a reliablemeasure of the sampling variance of the original estimator.
A considerable amount of theoretical and empirical work justifies the jackknife technique asa variance estimation method for surveys such as the 1998 HSTS survey. In cases where the varianceestimator is simple, the jackknife estimator is usually equal to this variance estimator. Thus, in thissituation, the jackknife would be redundant. The jackknife is valuable because it is also reliable as avariance estimator when the “correct” variance cannot be computed at all, as is the case with the 1998HSTS survey. There is a wide range of literature discussing the jackknife; good general overviews of thetheory are provided in Wolter (1985), Chapter 4; Rust (1985); and Kish and Frankel (1974).
The jackknife procedure is generally used at Westat for surveys such as the 1998 HSTSsurvey. Westat has used this method for calculating sampling errors for a wide range of survey designs.Besides being known to be generally reliable, it is relatively straightforward for secondary analysts tocalculate sampling errors appropriately. For any given survey characteristic, an analyst would need onlyto generate a series of estimators using the replicate weights and the original weights. The varianceestimator would then be computed using these “replicate estimators.” In particular, the analyst does notneed to have a complete understanding of the sample design and weighting procedures to calculate thesevariance estimators accurately.
The multi-stage sample design for HSTS was complex and involved stratification, unequalprobabilities of selection, and systematic sampling. Because variance computation needs to incorporatethe HSTS complex design in its calculations, standard routines in software packages such as SAS andSPSS should not be used for computing variances for HSTS.
The replicate weights for HSTS were designed to capture the features of the HSTS sampledesign (i.e., effects from implicit stratification resulting from systematic sampling from a sorted list,
___________________________________________________________________________________________________________________________________The 1998 High School Transcript Study
6-39 User's Guide and Technical Report
effects of PPS sampling), as well as capturing the weighting effects on variance (i.e., nonresponseadjustment, trimming, poststratification). A discussion is provided in Section 6.6.2 on how toapproximate the number of degrees of freedom associated with variance estimates. Attention should begiven to degrees of freedom when analyzing subgroups in HSTS data.
With HSTS data, means and proportions can be computed, along with their varianceestimates. Furthermore, using the replicate weights, one can compute variance estimates for complexfunctions of estimates, including ratios, differences of ratios, and log-odds ratios. For instance, one cancompute standard errors, variances, and confidence intervals for the specified survey estimates andcalculates chi-square tests of independence for two-way tables of weighted frequencies. One can alsocompute estimated coefficients for linear and logistic regression models and perform significance testingof a subset of linear combinations of variables. WesVar is a software package that can compute standarderrors using the replicate weights on the HSTS files. For further documentation on using WesVar, pleaserefer to the WesVar Complex Samples User’s Guide.
The basic idea behind replication is to select subsamples repeatedly from the whole sample,calculate the statistic of interest for each subsample, and then use the variability among these subsampleor replicate statistics to estimate the variance of the full sample statistic. Different ways of creatingsubsamples from the full sample result in different replication methods. The subsamples are calledreplicates and the statistics calculated from these replicates are called replicate estimates. Thecomputations are explained in the next section.
Resulting variances are different depending on the software package being used. Themagnitude of the differences between the results from the software packages depends on several factors,including type of analysis, impact of systematic sampling, and impact of weighting procedures. It isimportant for the user to explain how the standard errors were computed. Furthermore, data users areencouraged to consult the software developers of WesVar, SUDAAN, and STATA.
Broene and Rust (1998) prepared a Westat report to the National Center for EducationStatistics (NCES) documenting their evaluation of statistical software packages for NCES data sets. Atthe time of the evaluation, both SUDAAN and STATA used a linearization approach to varianceestimation; SUDAAN’s latest version includes replication methods. Broene and Rust’s paper mentionsthat SUDAAN is probably the most powerful of the three packages, but may be the most difficult to learn.They conclude that WesVar was both easy to learn and powerful but lacks some of the model fitting
___________________________________________________________________________________________________________________________________The 1998 High School Transcript StudyUser's Guide and Technical Report 6-40
capabilities that SUDAAN has. Furthermore, they mention that Stata is more limited in its survey dataanalysis capabilities and can be slower to run, but it does enable one to easily plot and examine predictedvalues and residuals when model-fitting. They mention that all three packages compute standard errorsfor proportions and for continuous statistics such as means, totals, ratios, and differences in thesequantities. For categorical analysis, SUDAAN and WesVar were recommended.
Since the Broene and Rust report, several enhancements were made to each softwarepackage. Table 6-18 compares some current features of each package (WesVar 4.0 (due for release in thesecond half of 2000), SUDAAN 7.5, and Stata 6.0). Note that Stata is fully programmable, meaning that,if Stata does not already have a specific function, a program may be created to satisfy individual needs.
6.6.1 Computation of Replicate Base Weights
The 1998 HSTS sample was a subsample of the PSUs and schools selected into the 1998NAEP sample. Replicate weights for the HSTS were created carefully by generating random samples ofthe original sample that was drawn for the HSTS. In all, there were 62 replicate weights to be consistentwith other NAEP weighting products. However, the number of “active” replicates for the HSTS is lessthan 62. That is, we created 47 random subsamples (or replicates), and the remaining 15 replicates arecopies of the original sample and do not contribute to the variance estimates. The following paragraphsprovide information as to how to use the replicate weights to calculate variance estimates, and how thereplicate weights were formed.
The estimated sampling variance of a parameter estimator t is the sum of M squareddifferences (where M is the number of replicate weights developed):
2
1)()(ˆ tttarV
M
ii −∑=
=
where ti denotes the estimator of the parameter of interest, obtained using the ith set ofreplicate weights in place of the original sample of full sample weights.
Of the 47 active replicate weights formed, 18 act to reflect the amount of sampling variancecontributed by the noncertainty strata of PSUs, with the remaining 29 replicate weights reflecting thevariance contribution of the certainty PSU samples.
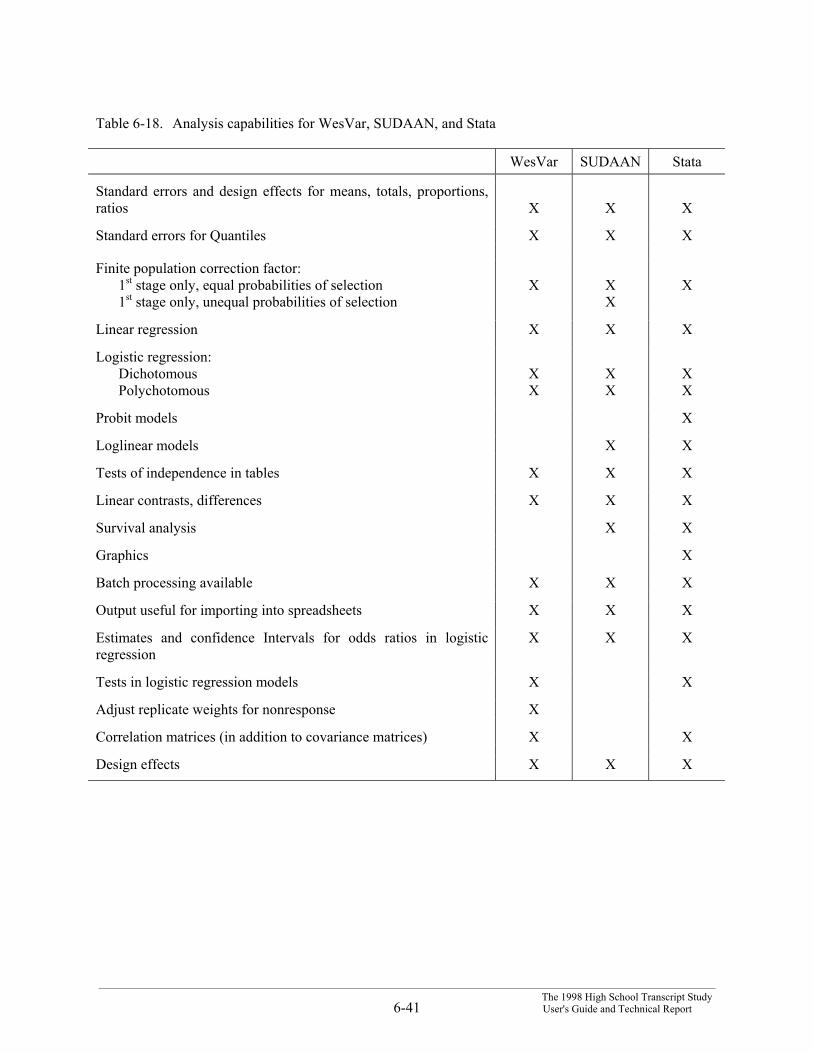
___________________________________________________________________________________________________________________________________The 1998 High School Transcript Study
6-41 User's Guide and Technical Report
Table 6-18. Analysis capabilities for WesVar, SUDAAN, and Stata
WesVar SUDAAN Stata
Standard errors and design effects for means, totals, proportions,ratios X X X
Standard errors for Quantiles X X X
Finite population correction factor:1st stage only, equal probabilities of selection1st stage only, unequal probabilities of selection
X XX
X
Linear regression X X X
Logistic regression:DichotomousPolychotomous
XX
XX
XX
Probit models X
Loglinear models X X
Tests of independence in tables X X X
Linear contrasts, differences X X X
Survival analysis X X
Graphics X
Batch processing available X X X
Output useful for importing into spreadsheets X X X
Estimates and confidence Intervals for odds ratios in logisticregression
X X X
Tests in logistic regression models X X
Adjust replicate weights for nonresponse X
Correlation matrices (in addition to covariance matrices) X X
Design effects X X X
___________________________________________________________________________________________________________________________________The 1998 High School Transcript StudyUser's Guide and Technical Report 6-42
The derivation of the 18 replicate weights reflecting the variance of the noncertainty PSUsinvolved first defining pairs of the 36 selected HSTS PSUs in a manner that models the design as one inwhich two PSUs are drawn with replacement per stratum. This definition of pairs (or variance strata) isundertaken in a manner closely reflective of the actual design, in that PSUs are pairs that are drawn fromsimilar subuniverses. The 36 noncertainty HSTS selected PSUs, drawn from the set of 72 NAEP selectedPSUs, which were drawn from 72 strata, were formed into 18 pairs of PSUs, where the pairs werecomposed of PSUs from adjacent subuniverses. Whereas the actual sample design was to select one PSUwith probability proportional to size from each of 72 strata, and then select a subsample of 36 PSUs fromthe 72 NAEP selected PSUs, for variance estimation purposes the design is regarded as calling for theselection of two PSUs with probability proportional to size with replacement from each of 18 strata. Thisprocedure likely gives a small positive bias to estimates of sampling error.
The procedure for obtaining the 29 active sets of replicate weights to estimate the samplingvariance from the certainty PSUs is analogous. The first stage of sampling in this case is at the schoollevel, and the derivation of replicate weights must reflect appropriately the sampling of schools withincertainty PSUs.
Within the 22 certainty PSUs, a sample of schools was drawn systematically within each.Using the schools listed in order of sample selection within each of eight “combinations” of NAEP regionand type of school (public, nonpublic), successive schools were grouped into variance strata (i.e., PAIR).The number of variance strata within a combination depended on the number of schools in thecombination, or indirectly assigned in proportion to the relative size of the combination. Thus, generallyspeaking, the largest combination was assigned the largest numbers of replicates (or variance strata).When splitting the combinations, the schools were split into groups of (as close as possible) equal size,based on the ordering at the time of sample selection. One variance stratum was assigned to eachreplicate. Within each variance stratum in each combination, schools were alternately numbered 1 or 2starting randomly to arrive at the variance groups.
The student replicate weight for the ith pair of variance units, for the 47 pairs correspondingto values of i from 1 to 47, is computed as follows:
1. Let WB generically represent (in the concept of linked or unlinked weights) the baseweight of a school, as described in Section 6.4, which accounts for the variouscomponents of the selection probability for the school.
___________________________________________________________________________________________________________________________________The 1998 High School Transcript Study
6-43 User's Guide and Technical Report
2. At random, one variance unit in each pair is denoted as unit number 1, while the otheris denoted as unit number 2. The ith replicate base weight Wbi is given by:
pair in unit neither from is schoolthe ifWpair of 2 number unit to belongs schoolthe if W2
pair of 1 number unit to belongs schoolthe ifW
iB
iB
i
Bi ×=0
The idea behind the jackknife method is to create random subsamples from the existing fullsample, then compute the statistic of interest for each of the subsamples and compare each of them to thefull sample estimate in order to measure the sampling variance. The above step is how the school baseweights are reweighted for a random subsample that results from the exclusion of one school among apair of schools. Basically, the random dropping of one school from the full sample creates a randomreduced sample (or replicate sample) of schools.
3. The ith student replicate weight is obtained by applying the various school and studentnonresponse adjustments, the weight trimming, reporting factors (for linked weightsonly), and poststratification to the ith set of replicate base weights, using proceduresidentical to those used to obtain the final student weights from the set of student baseweights.
The computation of final replicate school base weights is discussed in step 2. It is only forthis component that the replicate weights differ from the full sample school weights. The remainingweights and adjustments are computed as they were for the full sample weights. In principle, the replicateweights should repeat the entire process of computing the final weights using the new replicate baseweights. This replication captures any components of variability introduced to the final weights by theseprocesses. This was done for the HSTS and linked weights for all processes (school nonresponse, studentnonresponse, poststratification), except for the trimming step preceding poststratification, and the twoCHAID analyses which selected school and missing transcript nonresponse cells.
The same trimming factors and CHAID categories were used for calculating the replicateweights as for the main weights. The components of variability introduced by these processes should berelatively small, so the complexity of replicating these processes led us to forgo replication of theseprocesses along with the basic nonresponse and poststratification steps. Note that the trimming processwas also not replicated in the development of the 1998 NAEP replicate weights.
___________________________________________________________________________________________________________________________________The 1998 High School Transcript StudyUser's Guide and Technical Report 6-44
6.6.2 Degrees of Freedom of the Variance Estimate
It is important to have an indication of the number of degrees of freedom to attribute to thejackknife variance estimator )(ˆ traV of Var(t). The degrees of freedom of a variance estimator provideinformation on the stability of that estimator: the higher the number of degrees of freedom, the lower thevariability of the estimator. In practical terms, the number of degrees of freedom of the variance estimatorcorresponds to the number of residual degrees of freedom that can be assumed for inferential procedures.
Since the jackknife procedure estimates the sampling variability of the statistic by assessingthe effect of change in the sample at the paired first-stage sampling unit (FSSU) level, the number ofdegrees of freedom of the variance estimator v(t) is at most equal to M, the number of FSSU pairs. Themaximum number of degrees of freedom equals the number of independent pieces of information used togenerate the variance. In the case of data from the HSTS, the pieces of information are 47 squareddifferences ( )t ti −
2 , each supplying at most one degree of freedom (regardless of how many individualswere sampled within any FSSU). Again, there are 62 replicates to be consistent with other NAEPweighting products, however, only 47 are “active” replicates.
The number of degrees of freedom of the sample variance estimator can be strictly less thanthe number of FSSU pairs. For example, suppose that the statistic t is a mean for some subgroup, and nomembers of that subgroup can come from either FSSU in the ith FSSU pair. (Examples of such subgroupsare any PSU-level partitioning of the population, such as region.) In this instance, neither member of theFSSU pair i directly contributes to the estimate of t, so that the pseudoreplicate ti would nearly equal thestatistic t. If the replicate weights used to generate ti had not received poststratification adjustments, theresulting pseudoreplicate ti would be identical to the overall estimate t so that ( )t ti − =2 0 . In this case,such an FSSU pair would impart no information on the variability of the statistic t and thus contribute 0degrees of freedom to the variance.
The approach for the 1998 HSTS survey is to err on the side of being overly conservative inassigning degrees of freedom. For any estimate of the full population, it is recommended that confidenceintervals based on the t distribution with 25 degrees of freedom be used. This is probably conservative,but there is little practical difference between confidence bounds for t distributions with more than 25degrees of freedom.

___________________________________________________________________________________________________________________________________The 1998 High School Transcript Study
6-45 User's Guide and Technical Report
For estimates of subpopulations that are national (not concentrated in a single region),confidence intervals based on the t distribution with 10 degrees of freedom are recommended. Again thisis likely to be conservative for most subpopulations based on gender, race/ethnic status, urban/rural status,and so forth, which are represented within most of the FSSU pairs in the study.

___________________________________________________________________________________________________________________________________ The 1998 High School Transcript Study 7-1 User's Guide and Technical Report
7. 1998 HIGH SCHOOL TRANSCRIPT STUDY DATA FILES
Data from the 1998 High School Transcript Study are organized into eight data files encompassing the different levels of information: (1) Master CSSC File; (2) Course Offerings File; (3) School File; (4) Student File; (5) Linked Weights File; (6) SD/LEP Questionnaire File; (7) Tests and Honors File; and (8) Transcript File. In addition there are four NAEP files that provide information of students’ NAEP testing participation. Except for the Master CSSC File (which is not related to individual schools or students), all files can be linked by PSU and school identifiers. The Student, SD/LEP Questionnaire, Transcript, Linked Weights, and Tests and Honors Files can be linked by student identifiers; and the Master CSSC can be linked to the Course Offerings or Transcript File by CSSC number.
To identify a specific school, the PSU and school IDs must be used in combination. Each
school has a unique PSU/School ID combination and all student IDs are unique. For students in the 232 schools that are fully linked to NAEP, student IDs are their 10-digit NAEP booklet numbers. All other students were assigned unique 10-digit IDs beginning with 990.
Weights, developed using the procedures described in Chapter 3, are contained in the
Student File and the Linked Weights File. Westat has provided the final student weight (FINSTUWT) in the Student File and the final usable linked weight (FINLNKWT) in the Linked Weights File so that data analyses can be weighted up to national totals. The final student weight should be used in analyses involving only transcript data. The weights in the Linked Weights File should be used in analyses involving both transcript data and data obtained from NAEP data files.
There are two versions of the 1998 High School Transcript Study data files: the restricted
use data files and the public use data files. All values in this report are based on the restricted use data files. To ensure the confidentiality of students, data in the School File, Course Offering File, and Transcript File that would identify the state in which a school is located have either been set to missing (as in the FIPS State Code in the School File) or set to generic values (e.g., a course title of “Mississippi History” was set to “State History”). In addition, the number of teachers and enrollment values in the School File and some race/ethnicity values in the Student File have been set to missing. The data in the remaining files are identical in both the restricted use and public use versions.

___________________________________________________________________________________________________________________________________ 1998 High School Transcript Study User's Guide 7-2
Because of confidentiality legislation, secondary users who wish to obtain a copy of the restricted-use data files must apply for an NCES restricted data license. If your organization does not already have a restricted data license, you need to obtain a copy of the “NCES Field Restricted Use Data Procedures Manual.” There is a four-page checklist in this document that details the steps involved in obtaining a license. You may request a copy from the following contact person or you may view and download the manual from the NCES web site at http://nces.ed.gov/statprog/rudman.
Cynthia Barton (202) 502-7307 [email protected]
If your organization already has a restricted data license, you may only need to have it amended to add any additional datasets or to add additional names as authorized users of the data. Note that, in a college or university setting, only faculty can serve as the primary project officer. Graduate students may be listed as authorized users only.
To obtain a restricted data license (or to amend an existing license), a secondary user generally
must send a letter addressed to the Data Security Office, formally requesting the data. The mailing address of the Data Security Office is:
Data Security Office Department of Education/NCES 1990 K Street NW Room 9061 Washington, DC 20006 Please include the following information in your request:
The name of the data set(s) you wish to use;
The purpose for the loan of the data;
The length of time you will need the data;
An affidavit of nondisclosure for each person who will have access to the data, promising to keep the data completely confidential.

___________________________________________________________________________________________________________________________________ The 1998 High School Transcript Study 7-3 User's Guide and Technical Report
7.1 Master CSSC File
The Master CSSC File contains all codes in the modified version of the Classification of Secondary School Courses (CSSC) used in this study. This file is included as part of the Tabulations Report. There are 2,271 records, sorted by CSSC number. In addition to the original 6-digit CSSC codes created in 1982, the file contains the codes added for the 1987, 1990 and 1994 studies and 83 additional codes added or revised during the current study.
The new codes are documented in the Tabulations Report. These codes were added when
courses were encountered on the transcripts that were clearly different from codes already contained in the CSSC. No new 2-digit or 4-digit categories were added during the 1998 transcript study.
A special education flag (SPEDFLAG), an expansion to the CSSC initiated during the 1987
transcript study, was retained as part of the current version of the CSSC. When a course on a transcript was limited in enrollment to special education students, it was coded using the regular CSSC code with a special education indicator of “0” or “2.”1 Any course not so limited has the special education flag set to “1.”
As in the 1990 and 1994 transcript studies, all CSSC entries have been coded with a
sequence flag. A “0” value for the sequence flag indicates that the course is not part of an instructional sequence. A “1” indicates that the course is the first course in an instructional sequence, and a “2” indicates that the course is an advanced course in an instructional sequence (i.e., not the initial course in the sequence). The CSSC Master File is organized by the CSSC code and contains four variables: the CSSC course code, the special education flag, the sequence flag, and the standard course title.
7.2 Course Offerings File
The Course Offerings File is organized by school and contains one record for each course listed in the school’s course catalog or appearing on a student’s transcript as a non-transfer course taken at that school. Each of the 38,359 records contains the PSU, school ID, course title, course CSSC code,
1 The values of the SPEDFLAG variable are as follows: 0 = a functional level course limited in enrollment to special education students; 1 = a
regular course not limited in enrollment to special education students; 2 = a special education course not at the functional level, but limited in enrollment to special education students.

___________________________________________________________________________________________________________________________________ 1998 High School Transcript Study User's Guide 7-4
special education flag, the source of the catalog (e.g., generated from transcripts or from a school-provided catalog) and six additional pieces of information about the course: (1) the location of the course (including various off-campus locations); (2) the language of instruction; (3) whether or not it was remedial or below-grade-level course; (4) whether or not it was an honors-level course; (5) if it was a combination course (i.e., composed of more than one part, requiring more than one CSSC code for accurate description); (6) if it was part of an instructional sequence. The file is sorted by the PSU and school IDs.
The Course Offerings File is a complete listing of courses offered in all participating schools
that provided us with school-level course catalogs. It contains all courses listed in the school-level course catalogs received and any non-transfer courses listed on the transcripts not otherwise appearing in the catalogs. For example, in a school with grades 10 through 12 whose students all take 9th grade in a junior high, the 9th-grade courses are not treated as transfer courses, but appear as if they were offered by the high school. This treatment provides a more balanced picture of the courses available to American students in 4 years of high school than would be provided by treating such courses as transfer courses. For the 18 schools from which we did not receive a catalog, the list of unique course titles appearing on the sampled transcripts is the only available source of course-offering entries. A complete listing of all courses included on the transcripts can be extracted only from the Transcript File, since transfer courses do not appear in the Course Offerings File.
7.3 School File
The School File is sorted by PSU and school ID and contains one record for each of the 264 participating schools. School variables gathered during the Transcript Study are included as well as the school’s responses to the NAEP School Questionnaire (for these schools that participated in NAEP). A copy of the School Questionnaire is in Appendix A.
7.4 Student File
The Student File contains one record for each of the 25,422 graduates who were identified. Since 518 transcripts were not received, full transcript information is included for 24,904 graduated students for whom transcripts were obtained and coded.

___________________________________________________________________________________________________________________________________ The 1998 High School Transcript Study 7-5 User's Guide and Technical Report
Students are identified by PSU, School, and Student ID variables, and the file is sorted by
this group of variables. The file contains the demographic information gathered for each student, sampling information, weights to be used in analysis, and replicate weights for variance estimation. The final student weight for each student is the variable FINSTUWT. The component weights used to derive the final student weight are also included. In addition, the file contains a flag indicating whether or not the student is disabled and a condition variable indicating the specific nature of the disability when applicable.2 The file also contains a series of derived variables including one designating the student’s academic track as academic, vocational, both, or neither, and summaries of the student’s course-taking record by major educational topic.
Note that 518 students for whom no transcripts were obtained had final student weights
(FINSTUWT) of zero. There are 337 students receiving regular or honors diplomas (EXSTAT=1 or 2) whose transcripts do not have enough codable courses to account for at least 75 percent of the Carnegie Units required by their schools to graduate (i.e., GRREQFLG=4) who were given final weights of zero. In other words, only transcripts fully documenting at least 3 years of high school received positive weights. There are 46 students with a GRREQFLG value of 4 who were given positive weights. Thirty-three of these received special education diplomas and 13 received certificates of attendance. Their transcripts fully documented at least 3 years of high school even though the total number of credits is less than 75 percent of the total required for a regular diploma.
The weights included on the Student File are for all students in the study, both those that can
be linked to the NAEP assessment and those that cannot. Analyses of just the linked students must take into account a different set of nonresponse adjustments than the unlinked weights (see Chapter 6). The appropriate weights to be used in such a linked analysis are contained in the Linked Weights File.
2 The values of the disabling condition code are 00-not disabled, 01-multiple disabilities, 02-mentally retarded, 03-hard of hearing, 04-deaf, 05-
speech-impaired, 06-visually impaired/blind, 07-deaf/blind, 08-emotionally disturbed, 09-orthopedically impaired, 10-learning disabled, 11-other disability, and 99-not ascertained.
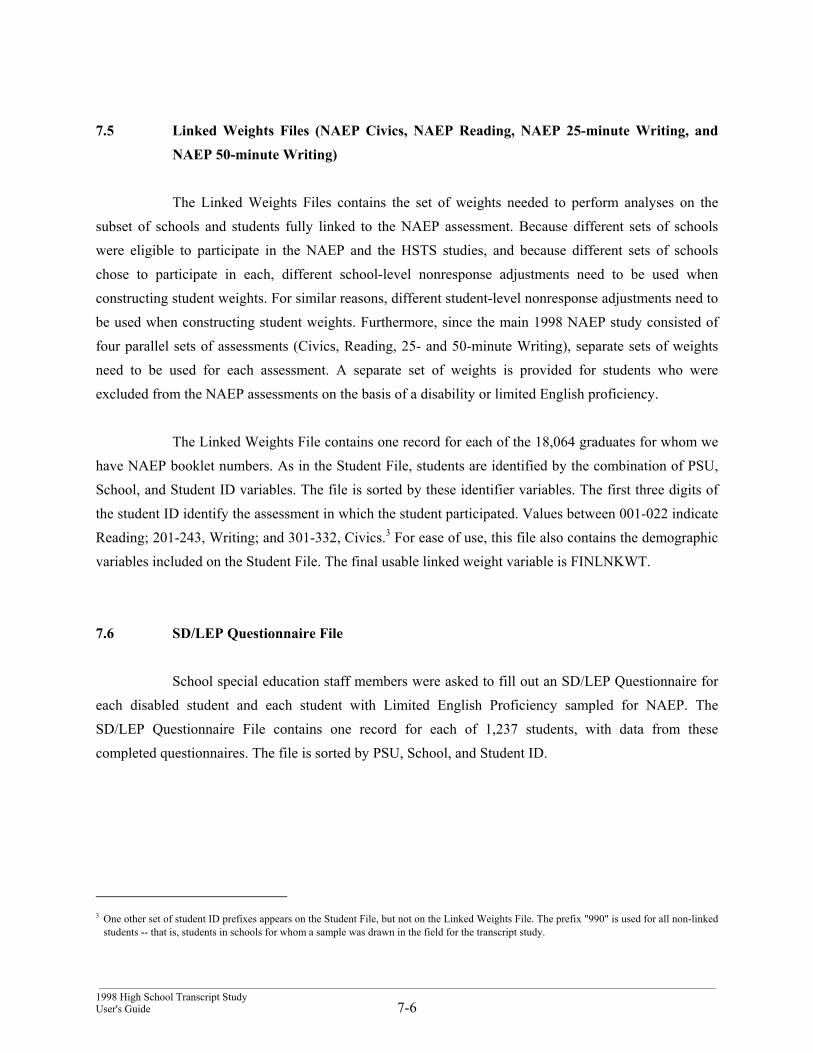
___________________________________________________________________________________________________________________________________ 1998 High School Transcript Study User's Guide 7-6
7.5 Linked Weights Files (NAEP Civics, NAEP Reading, NAEP 25-minute Writing, and NAEP 50-minute Writing)
The Linked Weights Files contains the set of weights needed to perform analyses on the subset of schools and students fully linked to the NAEP assessment. Because different sets of schools were eligible to participate in the NAEP and the HSTS studies, and because different sets of schools chose to participate in each, different school-level nonresponse adjustments need to be used when constructing student weights. For similar reasons, different student-level nonresponse adjustments need to be used when constructing student weights. Furthermore, since the main 1998 NAEP study consisted of four parallel sets of assessments (Civics, Reading, 25- and 50-minute Writing), separate sets of weights need to be used for each assessment. A separate set of weights is provided for students who were excluded from the NAEP assessments on the basis of a disability or limited English proficiency.
The Linked Weights File contains one record for each of the 18,064 graduates for whom we
have NAEP booklet numbers. As in the Student File, students are identified by the combination of PSU, School, and Student ID variables. The file is sorted by these identifier variables. The first three digits of the student ID identify the assessment in which the student participated. Values between 001-022 indicate Reading; 201-243, Writing; and 301-332, Civics.3 For ease of use, this file also contains the demographic variables included on the Student File. The final usable linked weight variable is FINLNKWT.
7.6 SD/LEP Questionnaire File
School special education staff members were asked to fill out an SD/LEP Questionnaire for each disabled student and each student with Limited English Proficiency sampled for NAEP. The SD/LEP Questionnaire File contains one record for each of 1,237 students, with data from these completed questionnaires. The file is sorted by PSU, School, and Student ID.
3 One other set of student ID prefixes appears on the Student File, but not on the Linked Weights File. The prefix "990" is used for all non-linked
students -- that is, students in schools for whom a sample was drawn in the field for the transcript study.
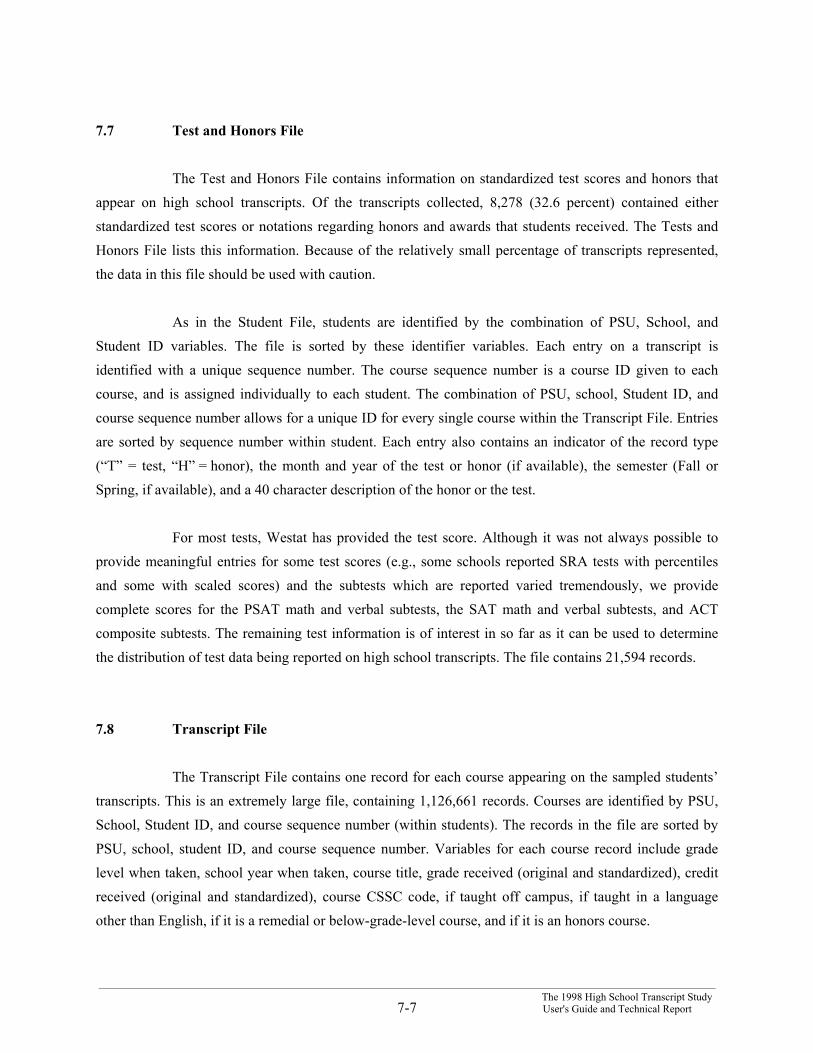
___________________________________________________________________________________________________________________________________ The 1998 High School Transcript Study 7-7 User's Guide and Technical Report
7.7 Test and Honors File
The Test and Honors File contains information on standardized test scores and honors that appear on high school transcripts. Of the transcripts collected, 8,278 (32.6 percent) contained either standardized test scores or notations regarding honors and awards that students received. The Tests and Honors File lists this information. Because of the relatively small percentage of transcripts represented, the data in this file should be used with caution.
As in the Student File, students are identified by the combination of PSU, School, and
Student ID variables. The file is sorted by these identifier variables. Each entry on a transcript is identified with a unique sequence number. The course sequence number is a course ID given to each course, and is assigned individually to each student. The combination of PSU, school, Student ID, and course sequence number allows for a unique ID for every single course within the Transcript File. Entries are sorted by sequence number within student. Each entry also contains an indicator of the record type (“T” = test, “H” = honor), the month and year of the test or honor (if available), the semester (Fall or Spring, if available), and a 40 character description of the honor or the test.
For most tests, Westat has provided the test score. Although it was not always possible to
provide meaningful entries for some test scores (e.g., some schools reported SRA tests with percentiles and some with scaled scores) and the subtests which are reported varied tremendously, we provide complete scores for the PSAT math and verbal subtests, the SAT math and verbal subtests, and ACT composite subtests. The remaining test information is of interest in so far as it can be used to determine the distribution of test data being reported on high school transcripts. The file contains 21,594 records.
7.8 Transcript File
The Transcript File contains one record for each course appearing on the sampled students’ transcripts. This is an extremely large file, containing 1,126,661 records. Courses are identified by PSU, School, Student ID, and course sequence number (within students). The records in the file are sorted by PSU, school, student ID, and course sequence number. Variables for each course record include grade level when taken, school year when taken, course title, grade received (original and standardized), credit received (original and standardized), course CSSC code, if taught off campus, if taught in a language other than English, if it is a remedial or below-grade-level course, and if it is an honors course.
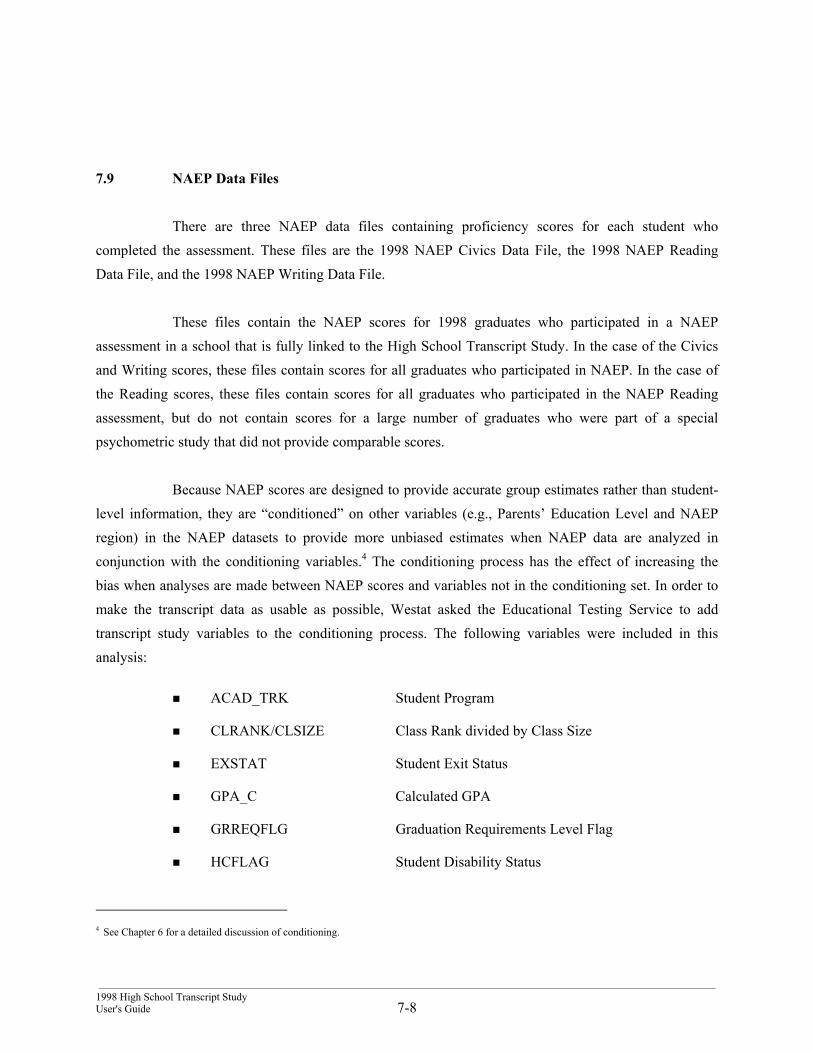
___________________________________________________________________________________________________________________________________ 1998 High School Transcript Study User's Guide 7-8
7.9 NAEP Data Files
There are three NAEP data files containing proficiency scores for each student who completed the assessment. These files are the 1998 NAEP Civics Data File, the 1998 NAEP Reading Data File, and the 1998 NAEP Writing Data File.
These files contain the NAEP scores for 1998 graduates who participated in a NAEP
assessment in a school that is fully linked to the High School Transcript Study. In the case of the Civics and Writing scores, these files contain scores for all graduates who participated in NAEP. In the case of the Reading scores, these files contain scores for all graduates who participated in the NAEP Reading assessment, but do not contain scores for a large number of graduates who were part of a special psychometric study that did not provide comparable scores.
Because NAEP scores are designed to provide accurate group estimates rather than student-
level information, they are “conditioned” on other variables (e.g., Parents’ Education Level and NAEP region) in the NAEP datasets to provide more unbiased estimates when NAEP data are analyzed in conjunction with the conditioning variables.4 The conditioning process has the effect of increasing the bias when analyses are made between NAEP scores and variables not in the conditioning set. In order to make the transcript data as usable as possible, Westat asked the Educational Testing Service to add transcript study variables to the conditioning process. The following variables were included in this analysis:
ACAD_TRK Student Program
CLRANK/CLSIZE Class Rank divided by Class Size
EXSTAT Student Exit Status
GPA_C Calculated GPA
GRREQFLG Graduation Requirements Level Flag
HCFLAG Student Disability Status
4 See Chapter 6 for a detailed discussion of conditioning.
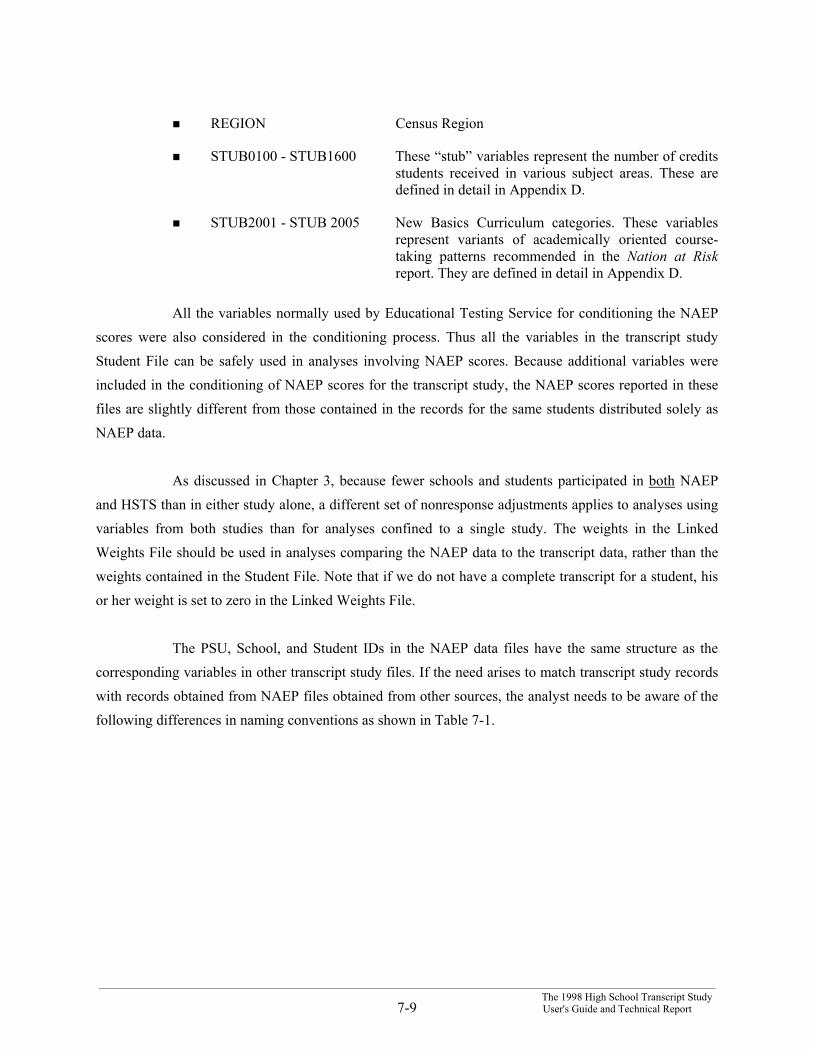
___________________________________________________________________________________________________________________________________ The 1998 High School Transcript Study 7-9 User's Guide and Technical Report
REGION Census Region
STUB0100 - STUB1600 These “stub” variables represent the number of credits students received in various subject areas. These are defined in detail in Appendix D.
STUB2001 - STUB 2005 New Basics Curriculum categories. These variables represent variants of academically oriented course- taking patterns recommended in the Nation at Risk report. They are defined in detail in Appendix D.
All the variables normally used by Educational Testing Service for conditioning the NAEP scores were also considered in the conditioning process. Thus all the variables in the transcript study Student File can be safely used in analyses involving NAEP scores. Because additional variables were included in the conditioning of NAEP scores for the transcript study, the NAEP scores reported in these files are slightly different from those contained in the records for the same students distributed solely as NAEP data.
As discussed in Chapter 3, because fewer schools and students participated in both NAEP
and HSTS than in either study alone, a different set of nonresponse adjustments applies to analyses using variables from both studies than for analyses confined to a single study. The weights in the Linked Weights File should be used in analyses comparing the NAEP data to the transcript data, rather than the weights contained in the Student File. Note that if we do not have a complete transcript for a student, his or her weight is set to zero in the Linked Weights File.
The PSU, School, and Student IDs in the NAEP data files have the same structure as the
corresponding variables in other transcript study files. If the need arises to match transcript study records with records obtained from NAEP files obtained from other sources, the analyst needs to be aware of the following differences in naming conventions as shown in Table 7-1.
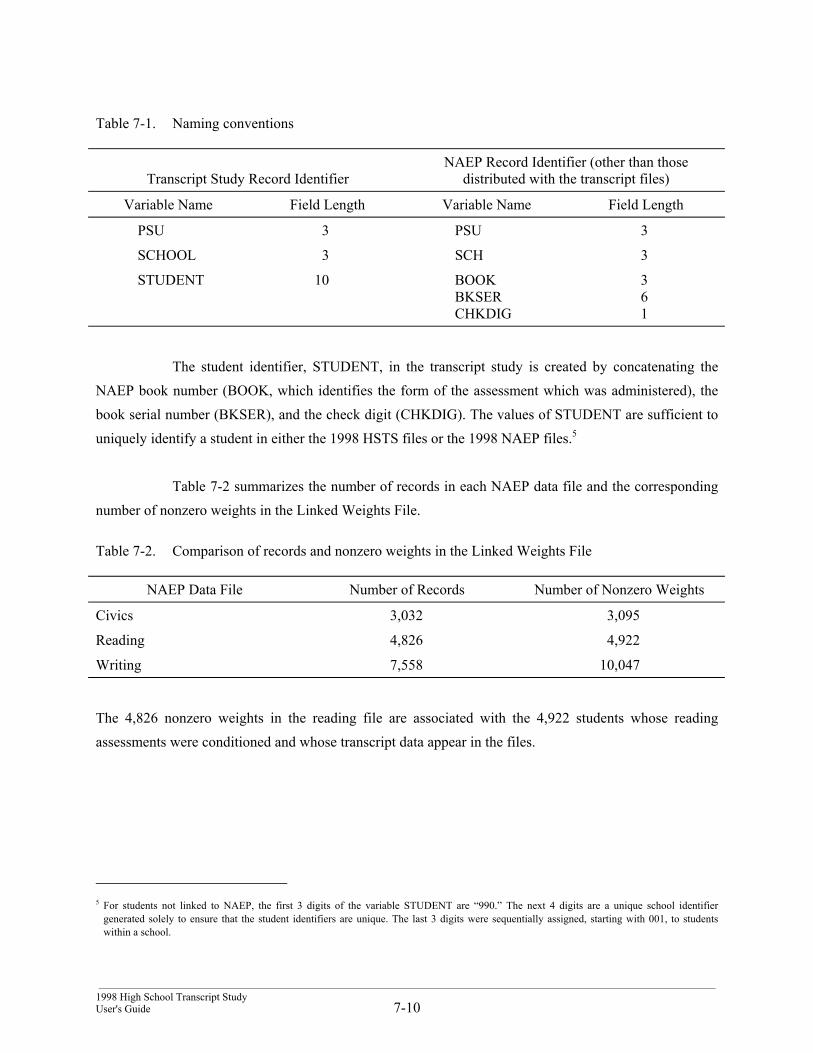
___________________________________________________________________________________________________________________________________ 1998 High School Transcript Study User's Guide 7-10
Table 7-1. Naming conventions
Transcript Study Record Identifier
NAEP Record Identifier (other than those distributed with the transcript files)
Variable Name Field Length Variable Name Field Length
PSU 3 PSU 3
SCHOOL 3 SCH 3
STUDENT 10 BOOK BKSER CHKDIG
3 6 1
The student identifier, STUDENT, in the transcript study is created by concatenating the
NAEP book number (BOOK, which identifies the form of the assessment which was administered), the book serial number (BKSER), and the check digit (CHKDIG). The values of STUDENT are sufficient to uniquely identify a student in either the 1998 HSTS files or the 1998 NAEP files.5
Table 7-2 summarizes the number of records in each NAEP data file and the corresponding
number of nonzero weights in the Linked Weights File.
Table 7-2. Comparison of records and nonzero weights in the Linked Weights File
NAEP Data File Number of Records Number of Nonzero Weights
Civics 3,032 3,095
Reading 4,826 4,922
Writing 7,558 10,047
The 4,826 nonzero weights in the reading file are associated with the 4,922 students whose reading assessments were conditioned and whose transcript data appear in the files.
5 For students not linked to NAEP, the first 3 digits of the variable STUDENT are “990.” The next 4 digits are a unique school identifier
generated solely to ensure that the student identifiers are unique. The last 3 digits were sequentially assigned, starting with 001, to students within a school.
______________________________________________________________________________________________________________________________________
The 1998 High School Transcript Study8-1 User's Guide and Technical Report
8. REFERENCES
Broene, P. and Rust, K. (1998). Strengths and limitations of using SUDAAN, STATA, and WesVarPC forcomputing variances from National Center for Education Statistics data sets. Westat reportprepared under contract for NCES.
Cochran, W.G. (1977). Sampling techniques, 3rd ed. New York: Wiley.
Kass, G.V. (1980). An exploratory technique for investigating large quantities of categorical data. AppliedStatistics, 29, 119-127.
Kish, L. and Frankel, M. (1974). Inference from complex samples. Journal of the Royal StatisticalSociety, Series B, 36, 1-22.
Krenzke, T., Rust, K., Wallace, L., and Yansanah, I. (2000). 1998 NAEP sampling and weighting report.Rockville, MD: Westat.
Krewski, D. and Rao, J. (1981). Inference from stratified samples: properties of linearization, jackknifeand balanced repeated replication. Annals of Statistics, 9, 1010-1019.
Legum, S., Caldwell, N., Goksel, H., Haynes, J., Hynson, C., Rust, K., and Blecher, N. (1993). The 1990High School Transcript Study technical report. Washington, DC: U.S. Department of Education,Office of Educational Research and Improvement NCES 93-117.
Legum, S., Caldwell, N., Davis, B., Haynes, J., Hill, T., Litavecz, S., Rizzo, L., Rust, K., and Vo, N.(1997). The 1994 High School Transcript Study technical report, Washington, DC: U.S.Department of Education, Office of Educational Research and Improvement NCES, 97-262.
Little, R. J. A. and Rubin, D.B. (1987). Statistical analysis with missing data. New York: Wiley.
Ludwig, M.J., Olivetti, L., Sandberg, N., and Waite, B. (1982). A classification of secondary schoolcourses. Alexandria, VA: Evaluation Technologies, Inc.
Morgan, R., Hunt, E., and Carpenter, J. (1991). Classification of instructional programs. NCES 91-396.U.S. Department of Education, Office of Educational Research and Improvement.
National Commission on Excellence in Education (1983). A Nation at risk: The imperative foreducational reform. Washington, DC. (ERIC No. ED 226 006)
Oh, H.L. and Scheuren, F.S. (1983). Weighting adjustments for unit nonresponse. In W.G. Madow, I.Olkin, and D.B. Rubin (Eds.), Incomplete Data in Sample Surveys, Vol. II: Theory and AnnotatedBibliography. New York: Academic Press.
Rust, K. (1985). Variance estimation for complex estimators in sample surveys. Journal of OfficialStatistics, 1(4), 381-397.
Rust, K., Bethel, J., Burke, J., and Hansen, M. (1990). The 1998 National Assessment of EducationalProgress: Sample and weighting procedures, final report. Rockville, MD: Westat.
Wolter, K. (1985). Introduction to variance estimation. New York: Springer-Verlag.