Embed Size (px)
Citation preview

8/6/2019 4th Edition Scoreboard En
http://slidepdf.com/reader/full/4th-edition-scoreboard-en 1/60
THE CONSUMER MARKETS SCOREBOARD Making Markets Work For Consumers4th edition – October 2010
8/6/2019 4th Edition Scoreboard En
http://slidepdf.com/reader/full/4th-edition-scoreboard-en 2/60
Consumer Markets Scoreboard – Maki ng Markets Work For Consumers – SEC(010)157
Neither the European Commission nor any person acti ng on behal o the Commission may be held responsible or the use that may be made o the inormation contained in this publication. The views expressed are purely those o the author and may not in any circumstances be regardedas stating an of cial position o the European Commission.
© photos: www.shutterstock.com/www.istockphoto.com
Additional inormation on the European Union is available on the Internet.It can be accessed through the Europa ser ver (http://europa.eu).© European Union, 010Reproduction is authorised provided the source is acknowledged.
Cataloguing data can be ound at the end o this publication.
Luxembourg: Of ce or Of cial Publications o the European Union, 010ISBN 978-9-79-1449-9doi 10.77/7968
Printed in Belgium
PRINTED ON WHITE CHLORINE-FREE PAPER
Europe Direct is a service to help you fnd answers
to your questions about the European Union
Freephone number (*):
00 800 6 7 8 9 10 11(*) Certain mobile telephone operators do not allow access to 00 800 numbers or these calls may be billed.
8/6/2019 4th Edition Scoreboard En
http://slidepdf.com/reader/full/4th-edition-scoreboard-en 3/60
European Commission
THE CONSUMER MARKETS SCOREBOARD Making Markets Work For Consumers4th edition – October 2010
TABLE OF CONTENTS
1 Background 5
2 The Scoreboard 7
3 Consumer Market Monitoring Results 11
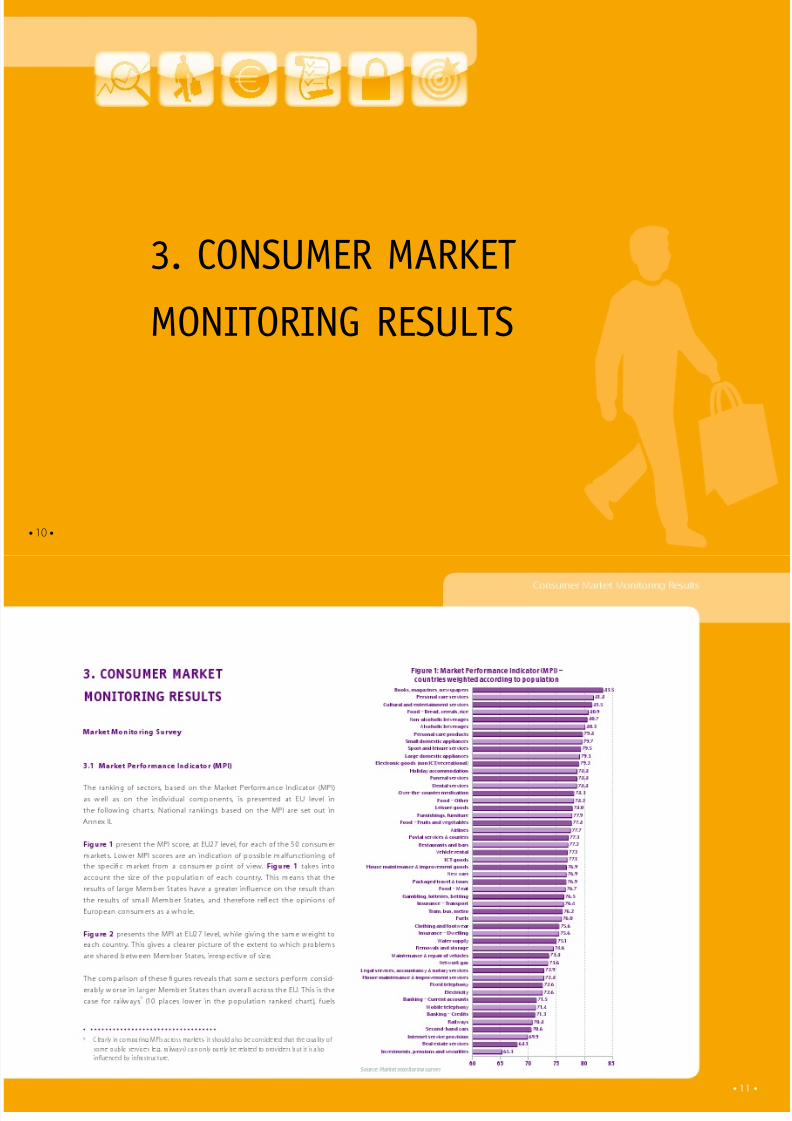
3.1 Market Performance Indicator (MPI) 11
3.2 MPI including Switching 14
3.3 Comparability 14
3.4 Trust 16
3.5 Problems 173.6 Complaints 17
3.7 Overall Satisfac tion 19
3.8 Switching 20
4 Prices 22
5 Complaints 27
6 Safety 31
7 Conclusions and Next Steps 35
Annex I 38
Annex II 46

8/6/2019 4th Edition Scoreboard En
http://slidepdf.com/reader/full/4th-edition-scoreboard-en 4/60
• 4 •
1. BACKGROUND2. THE SCOREBOARD
8/6/2019 4th Edition Scoreboard En
http://slidepdf.com/reader/full/4th-edition-scoreboard-en 5/60
• 5 •
Background
1. BACKGROUND
Innovation and increased ef ciency are key to maintaining and improving
the competitive advantage o the EU.
Consumer policy can play an important role in stimulating both innova-
tion and ef ciency. Eective enorcement o consumer r ights sustains and
can, in some cases, rebuild trust in markets. Empowered consumers, who
can understand the ever more complex choices given to them, can reward
the most ef cient and innovative manuacturers and providers. In contrast,
markets where consumer rights are not protected and where consumers
nd it hard to identiy and compare quality and price may experience
consumer detriment, loss o condence and reduced incentives or quality
improvement and ef ciency.
A recent study has shown that the losses repor ted by European consumers,
as a result o problems or which they had a cause or complaint are esti-
mated to represent approximately 0.3 % o EU’s GDP1
.
Provided they are inormed and condent, Europe’s consumers are poten-
tially its trump card in transorming our economy.
Market monitoring, deployed to analyse how well the economy is working
rom a consumer point o view and to identiy the sectors where ef ciency
improvements are possible, can steer policy to areas where it can pay the
greatest dividends.
The Commission has thereore developed the Consumer Markets
Scoreboard to regularly monitor how the single market is working or
consumers.
The Scoreboard is a key diagnostic tool or implementing the EU2020
strategy2
which recognizes that:
“To gear the single market to serve the Europe 2020 goals requires well unc-
tioning and well-connected markets where competition and consumer access
stimulate growth and innovation.”
The Monti report3
on the single market also highlights that “Consumers
and consumer welare should be at the centre o the next stage o the
single market.”
The Digital Agenda or Europe4
also identied the need to empower
consumers: “the comparability o consumer prices, e.g. through benchmarking,
product testing or price comparison websites, could be improved to drive
competition and to enhance consumer protection.”
The Scoreboard is also essential to identiy how to deliver on the commit-
ment made by President Barroso “to ensure that the benefts o the internal
market get through to the fnal consumer” 5
.
The Scoreboard is designed to reveal which markets have the highest risk
o consumer market malunctioning. In-depth studies o the problematic
markets will ollow, to analyse the problems and identiy solutions.
While each market has its own unique characteristics, there is a need
to compare dierent markets in order to understand the perspective o
Europe’s consumers. The individual characteristics o each market will betaken ully into account in the in-depth studies.
1 Eurostat EB73.3 – orthcoming2 COM(2010) 20203 A New Strategy or the Single Market – May 20104 COM(2010)245 nal5 Political guidelines or the next Commission – José Manuel Barroso
8/6/2019 4th Edition Scoreboard En
http://slidepdf.com/reader/full/4th-edition-scoreboard-en 6/60
• 6 •
Consumer market malunctioning is characterised by the existence o
consumer detriment which can appear even in very competitive markets.
Consumer markets may suer rom malunctioning caused not only by
anticompetitive practices, but also by ailure o traders to comply with
laws designed to protect consumers against raud, misleading or decep-
tive advertising, unair commercial practices and unair contract terms. In
addition, or many goods and services, complex or voluminous inorma-
tion which is dif cult to understand prevents consumers rom making well
inormed decisions. For example, more than a third o European consumers
say that they have dif culties comparing oers rom dierent providers o
various nancial services6
.
Switching has a positive role in stimulating competition in the market
and higher switching rates are linked with less requent price increases6
.
However, the rate o switching tends to be quite low or many services.
6 EB FL243–2009
Background
8/6/2019 4th Edition Scoreboard En
http://slidepdf.com/reader/full/4th-edition-scoreboard-en 7/60
• 7 •
2. THE SCOREBOARD
The Scoreboard is composed o a series o indicators.
COMPLAINTS
The act that consumers take the eort to report “complaints” and that
complaints are shared by several consumers is the most commonly used
indicator o consumer market malunctioning.
Complaints data are collected by public authorities in all Member States
but are not harmonised and so do not allow comparison between markets
or countries. The Commission thereore adopted, in May 2010, a Recom-mendation introducing a harmonized methodology or the classication
and reporting o consumer complaints to the Commission7
. This method-
ology is expected to deliver comparable complaints data, starting in 2011.
As well as indicating which markets have a higher number o complaints,
the data will also indicate common problems across markets.
MARKET MONITORING SURVEY
The market monitoring survey 8
is a pioneering achievement. It provides
comparable consumer opinions, or 27 countries plus Norway, or 50
consumer markets, which cover more than 60 % o budgets (it does notcover housing, most medical products and services or education). Similar
surveys have previously been carried out only at national level or or
a small number o markets. In addition, the survey was conducted only
with consumers who had recent purchasing experience o each market,
ensuring that it reects per tinent experience and not uninormed opinion.
The survey will be repeated in the uture, enabling progress to be tracked
over time. While not capturing all aspec ts o market unctioning, given that
consumer welare is the desired outcome o markets, consumer opinions
are in some ways the acid test o how well a market is working. Such opin-
ions are also used by businesses extensively and thereore give a telling, i
incomplete, picture o market malunctioning.
In order to guarantee representativeness, the survey used random
sampling. The telephone interviews were conducted, between March and
May 2010, on a sample o 500 citizens in each EU Member States (250 or
Malta, Cyprus and Luxembourg) or each market. The EU level results are
based on a condence level o 95 % and are contained within a condence
interval o up to +/- 0.85 %.
The survey covers ve main dimensions o consumer markets: compara-bility, trust, problems and complaints, satisaction and switching.
The “comparability” indicator measures the ability o consumers to
compare products and services oered by businesses and implicitly covers
both price and quality. In markets with high comparability, consumers will
make the best choices and will reward innovation and ef ciency, whereas
markets with low comparability more likely indicate a misallocation o
resources. I consumers are not in a position to maximize their welare
through inormed choice, then the ef ciency even o competitive markets
will be undermined.
The “trust” indicator measures the extent to which consumers eel con-dent that businesses comply with consumer legislation. It indicates the
sectors where consumer trust needs to be strengthened, e.g. through
7 C(2010)3021 nal8 The ull report o the market monitoring survey is available on the website o DG SANCO:
http://ec.europa.eu/consumers/strategy/acts_en.htm. A dashboard providing easy access
to the results is available on https://insight.gk.com
The Scoreboard
8/6/2019 4th Edition Scoreboard En
http://slidepdf.com/reader/full/4th-edition-scoreboard-en 8/60
• 8 •
increased transparency or consumers or better enorcement. Markets
where consumer condence in the law abiding nature o market opera-
tors is low will also tend to penalise honest traders and ultimately lead to
consumer exit rom the market.
The indicator o consumer “satisfaction” reveals whether markets live up
to what consumers want, giving potential clues about the extent o other
ailures not revealed by specic indicators.
The “problem” indicator captures issues which do not appear in tra ditional
complaints statistics. “Complaints” and problems combined provide an
indication o the severity o the problems and o possible consumer detri-
ment by incorporating both the requency o problems and complaints.
“Switching” gives an indication o the level o choice and o consumers’ability to exercise this choice. Low levels o actual switching and the
perceived dif culty o switching are a cause or concern and, in liberalised
sectors, risk neutralising the benets o the liberalisation process. Markets
without switching might exhibit barriers to new entrants, which cripple
competition. At the same time switching is linked to market innovation,
consumer awareness, change o address or personal situation, etc.
Although the survey is comparable or all 50 markets the questions were
adapted to reect:
• the specic name o each market,
• dierences between goods and services,
• the specic time rame or each market,
• the requency o usage and occurrence (e.g. the occurrence o prob-
lems will be based on the “last occasion” or some products or on
“how many times” in a given period o time or continuous service
markets).
The answer is specic to each type o question:
• The answer or “comparability”, “trust”, “satisaction” and “ perceived
ease o switching” was based on scale rom 0 (lowest) to 10
(highest).
• For the “problem” question a “yes/no” answer was used or good
product markets, while respondents were asked the exac t number o
problems in a given timerame or services.
• For the “complaint” question, 5 dierent answers were possible to
indicate to whom the consumer had complained.
• The “actual switching” question has 3 dierent answers, character-
ising the type o switching behaviour: (i) switched services/productsbut stayed with the same provider/supplier, (ii) changed supplier/
provider or (iii) no switching.
The “Don’t know” answer was not available as, based on the initial
screening, respondents only received questions about a market they indi-
cated experience with.
Respondents were required to have experience during the last year,
while some markets, which are used less requently, had a longer time
rame: 2 years or “house maintenance and improvement” goods and
services, all three categories o banking services, large domestic appli-
ances and vehicle rental; 3 years or new and second-hand cars, realestate services, “legal services, accountancy and notary services”, uneral
services as well as “removal and storage services”. A screening ques-
tion was used to select only respondents who had made purchases in
each market.
Some questions were not asked in a ew countries where some markets
do not exist or there is a monopoly that makes the switching question
irrelevant.
The Scoreboard
8/6/2019 4th Edition Scoreboard En
http://slidepdf.com/reader/full/4th-edition-scoreboard-en 9/60
• 9 •
A composite index was calculated based on the results o the survey. The
Market Perormance Indicator (MPI) incorporates: “comparability”, “trust”,
“problems & complaints” and “satisaction”. An additional index (MPIS –
Market Perormance Indicator including Switching) is calculated or the 11
markets where switching data are available. An assumption was made that
all components o these two indexes should be weighted equally.
For the “comparability”, “trust” and “satisfaction” components, the
score was calculated by taking the mean o the answers o all respondents.
The score o the “problems & complaints” component is calculated
by simultaneously taking into account the answers to the problem and
complaint questions:
• When a respondent did not experience any problems (and there-ore automatically did not receive the complaint question), a score
o 10 was assigned to this component.
• When a respondent experienced a problem, but did not complain, a
score o 5 was assigned to this component.
• When a respondent experienced a problem and complained, the
score depended on the recipient o the complaint: a score o 3
when complaining to riends, amily, relatives; a score o 2 when
complaining to a retailer/provider; a score o 2 when complaining
to a manuacturer; a score o 0 when complaining to a third-party
complaints body. This reply reects the severity o the problem asexperienced by the consumer.
The score or the “switching” question is calculated by simultaneously
taking into account the answers to the two switching questions (actual
switching and perceived ease o switching):
• When a respondent did not switch (actual switching question) and
indicated a certain level o perceived ease o switching, the total
score or this component equals the indicated level o the perceived
ease o switching.
• When a respondent did switch and indicated a certain level o
perceived ease o switching, the total score or this component
equals 10 + the indicated level o the perceived ease o switching
divided by 2.
PRICES
Together with more choice and higher quality, the promise o lower prices
through integration, is one o the most important benets the single
market holds out to European citizens. The lack o price convergence is an
important indicator o single market ragmentation. However, local costs,transportation and logistic actors, the impact o local demand, culture
and taste also need to be properly taken into account.
The analysis o price data in the Scoreboard relies on prices o comparable
and representative products in EU countries. The analysis is based on the
standard measures o price dierentiation (the coef cient o var iation) in
relation to the degree o adjustment o prices to the local level o total
consumption expenditure (i.e. the correlation between prices and “actual
individual consumption”) which is a measure o consumer spending
power. The need or urther investigation is thereore greatest in those
sectors where prices seem to diverge widely across EU countries without
reecting the dierent levels o purchasing power in those countries.
Progress has been made since the previous Scoreboard; however, the price
data presented in this Scoreboard remain incomplete and is drawn rom a
variety o sources, with 19 markets, out o 50, being represented to some
extent, because the collection o comparable data on detailed consumer
price levels across the single market has not, until 2008, been considered
a statistical priority. This important task is also quite complex. Eurostat and
national statistical of ces are now working to gather more price data.
The Scoreboard
8/6/2019 4th Edition Scoreboard En
http://slidepdf.com/reader/full/4th-edition-scoreboard-en 10/60
• 10 •
3. CONSUMER MARKETMONITORING RESULTS
8/6/2019 4th Edition Scoreboard En
http://slidepdf.com/reader/full/4th-edition-scoreboard-en 11/60
8/6/2019 4th Edition Scoreboard En
http://slidepdf.com/reader/full/4th-edition-scoreboard-en 12/60
8/6/2019 4th Edition Scoreboard En
http://slidepdf.com/reader/full/4th-edition-scoreboard-en 13/60
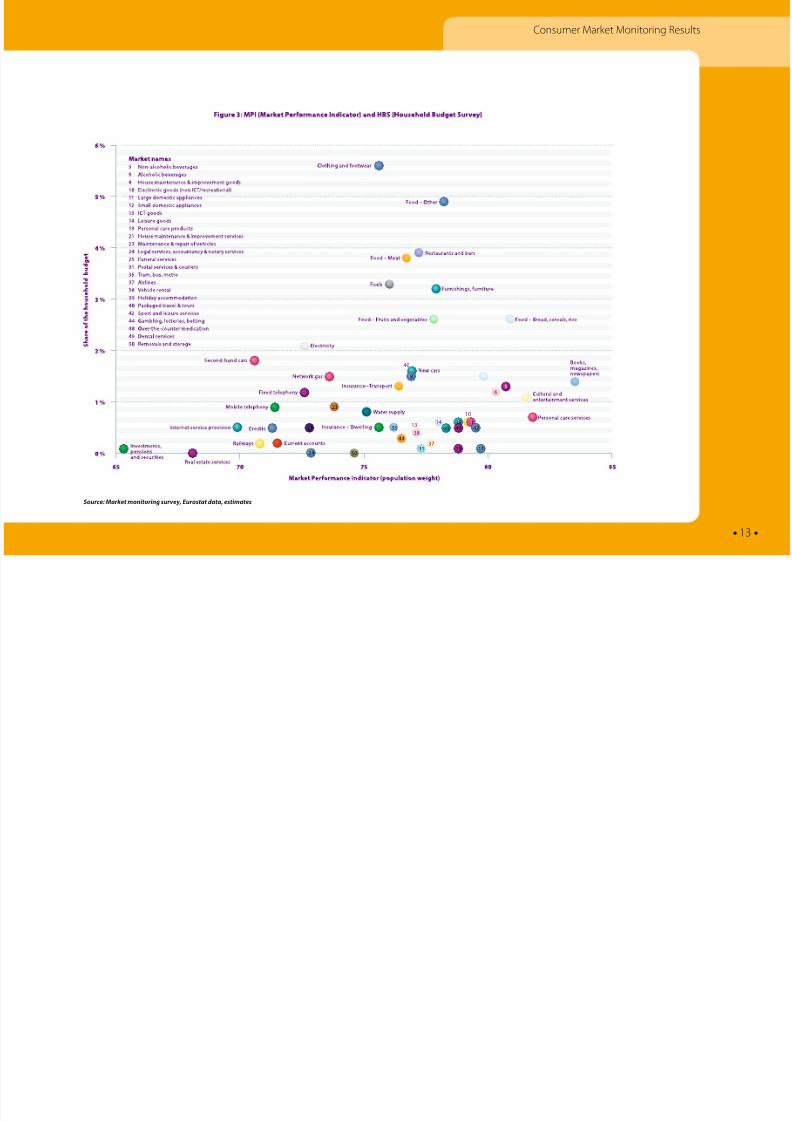
• 13 •
Consumer Market Monitoring Results
Source: Market monitoring survey, Eurostat data, estimates
40
1448
5 1
1
3
35
44
13
38
3137
8
10
504
3949 4
8/6/2019 4th Edition Scoreboard En
http://slidepdf.com/reader/full/4th-edition-scoreboard-en 14/60
• 14 •
Consumer Market Monitoring Results
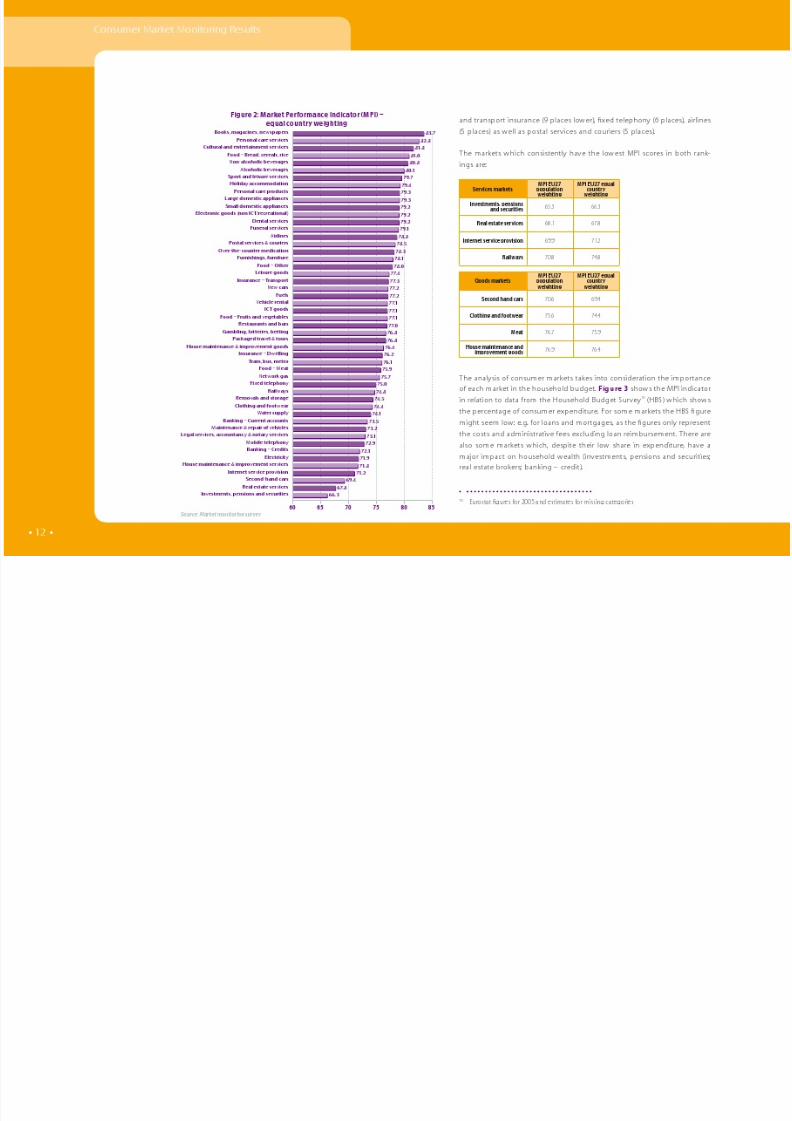
There is a clear tendency towards a higher MPI ranking in the markets
where consumers spend more money. At the same time, the potential
loss to consumers, due to market malunctioning, is higher in the markets
where consumers spend a higher share o their budgets compared with
the markets where they spend less.
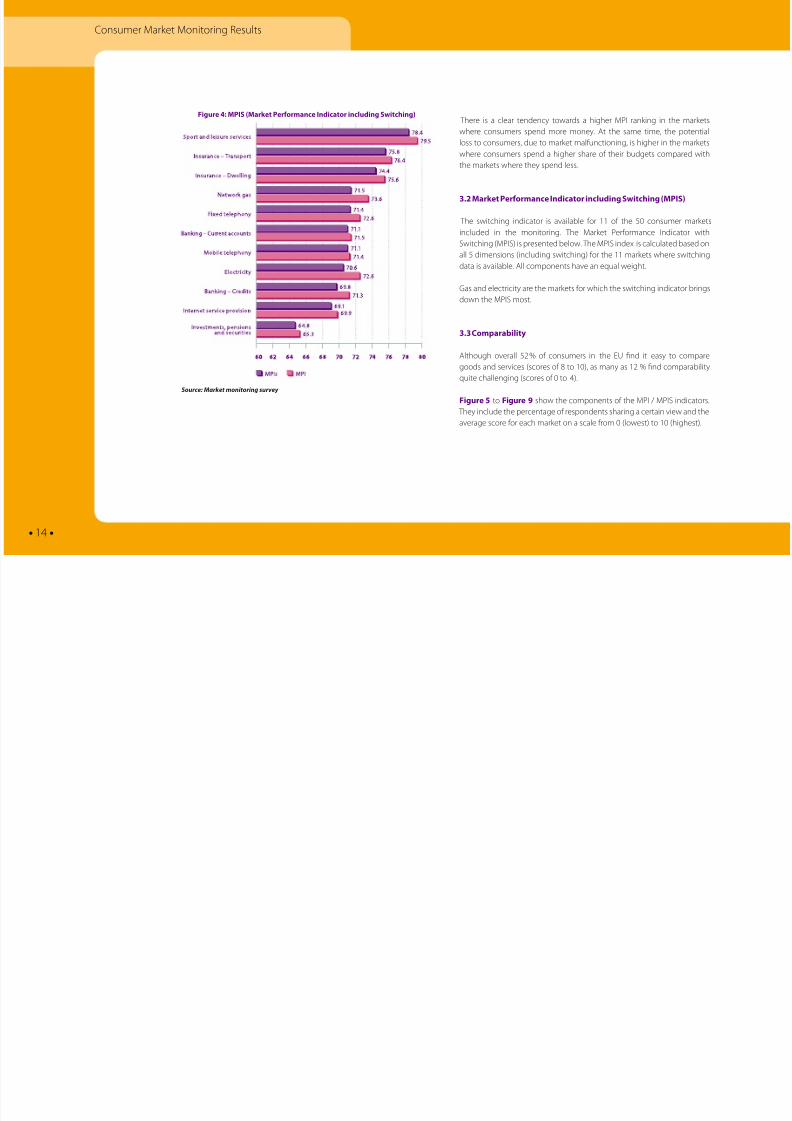
3.2 Market Perormance Indicator including Switching (MPIS)
The switching indicator is available or 11 o the 50 consumer markets
included in the monitoring. The Market Perormance Indicator with
Switching (MPIS) is presented below. The MPIS index is calculated based on
all 5 dimensions (including switching) or the 11 markets where switching
data is available. All components have an equal weight.
Gas and electricity are the markets or which the switching indicator brings
down the MPIS most.
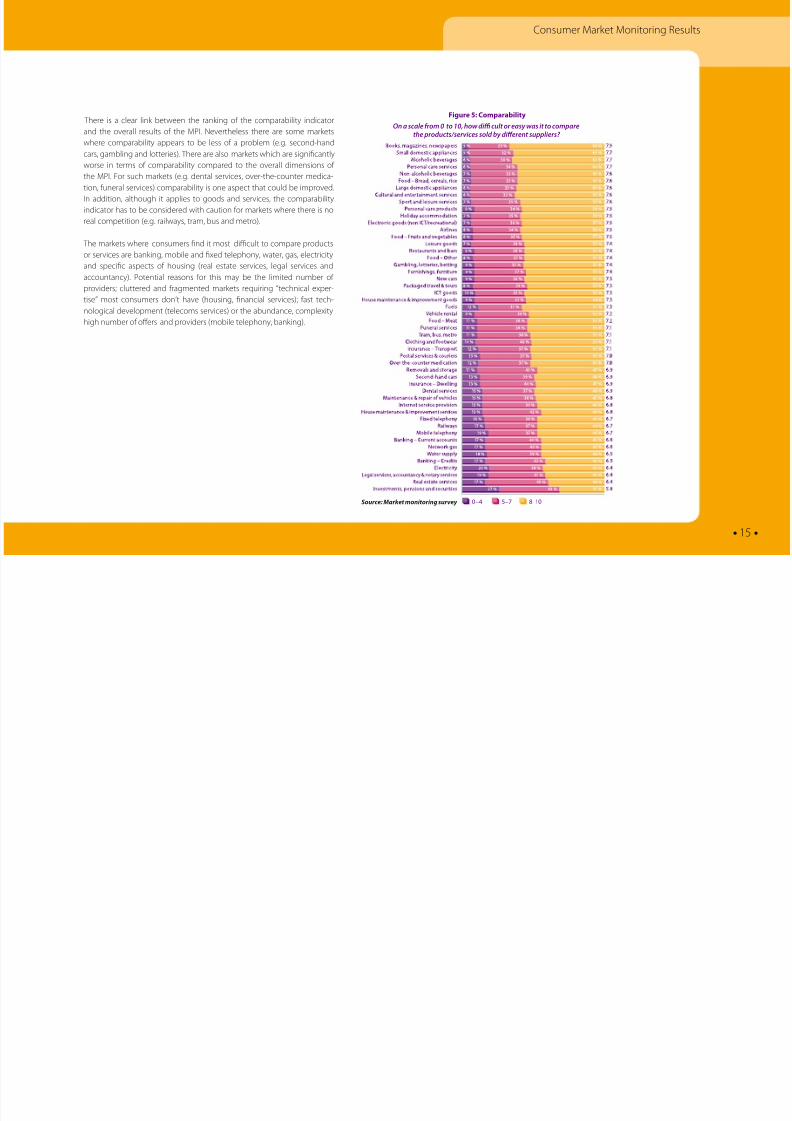
3.3 Comparability
Although overall 52 % o consumers in the EU nd it easy to compare
goods and services (scores o 8 to 10), as many as 12 % nd comparability
quite challenging (scores o 0 to 4).
Figure 5 to Figure 9 show the components o the MPI / MPIS indicators.
They include the percentage o respondents sharing a certain view and theaverage score or each market on a scale rom 0 (lowest) to 10 (highest).
Figure 4: MPIS (Market Perormance Indicator including Switching)
Source: Market monitoring survey
8/6/2019 4th Edition Scoreboard En
http://slidepdf.com/reader/full/4th-edition-scoreboard-en 15/60
• 15 •
Consumer Market Monitoring Results
There is a clear link between the ranking o the comparability indicator
and the overall results o the MPI. Nevertheless there are some markets
where comparability appears to be less o a problem (e.g. second-hand
cars, gambling and lotteries). There are also markets which are signicantly
worse in terms o comparability compared to the overall dimensions o
the MPI. For such markets (e.g. dental services, over-the-counter medica-
tion, uneral services) comparability is one aspect that could be improved.
In addition, although it applies to goods and services, the comparability
indicator has to be considered with caution or markets where there is no
real competition (e.g. railways, tram, bus and metro).
The markets where consumers nd it most dif cult to compare products
or services are banking, mobile and xed telephony, water, gas, electricity
and specic aspects o housing (real estate services, legal services and
accountancy). Potential reasons or this may be the limited number o providers; cluttered and ragmented markets requiring “technical exper-
tise” most consumers don’t have (housing, nancial services); ast tech-
nological development (telecoms services) or the abundance, complexity
high number o oers and providers (mobile telephony, banking).
Figure 5: Comparability
On a scale rom 0 to 10, how di cult or easy was it to comparethe products/services sold by dierent suppliers?
0 – 4 5 – 7 8 –10Source: Market monitoring survey
8/6/2019 4th Edition Scoreboard En
http://slidepdf.com/reader/full/4th-edition-scoreboard-en 16/60
• 16 •
Consumer Market Monitoring Results
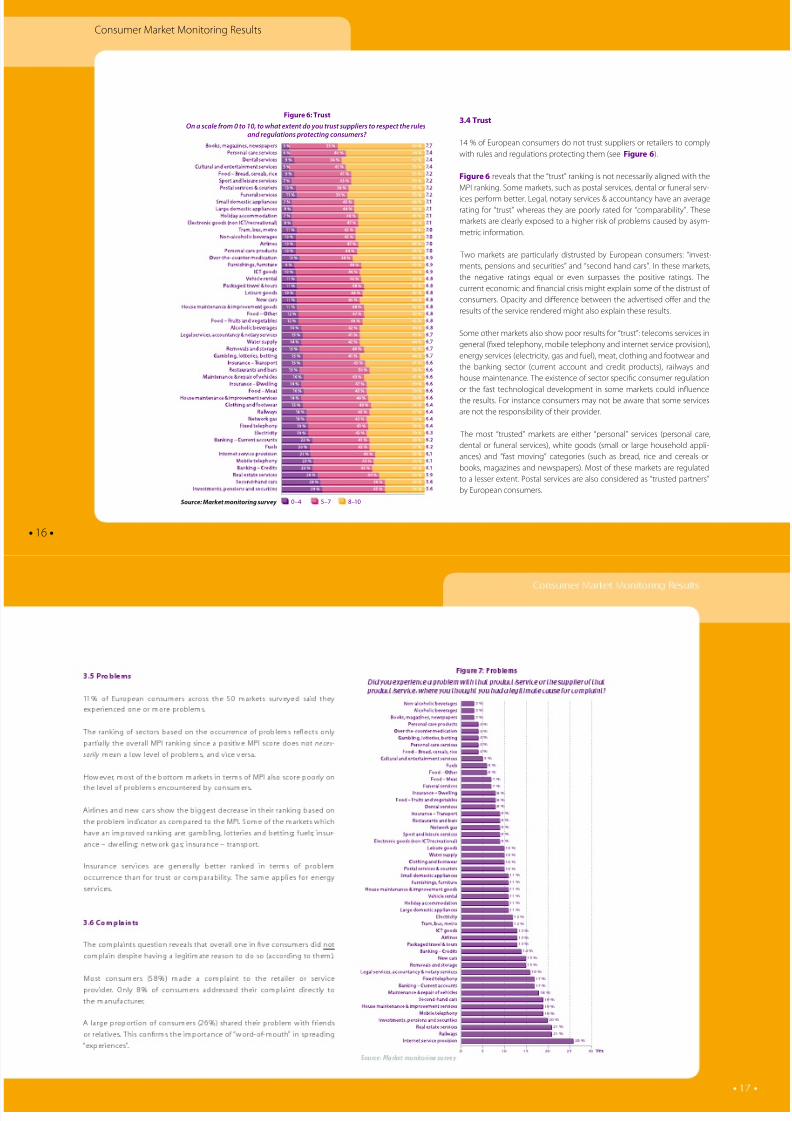
3.4 Trust
14 % o European consumers do not trust suppliers or retailers to comply
with rules and regulations protecting them (see Figure 6).
Figure 6 reveals that the “trust” ranking is not necessarily aligned with the
MPI ranking. Some markets, such as postal services, dental or uneral serv-
ices perorm better. Legal, notary services & accountancy have an average
rating or “trust” whereas they are poorly rated or “comparability”. These
markets are clearly exposed to a higher risk o problems caused by asym-
metric inormation.
Two markets are particularly distrusted by European consumers: “invest-
ments, pensions and securities” and “second hand cars”. In these markets,
the negative ratings equal or even surpasses the positive ratings. Thecurrent economic and nancial crisis might explain some o the distrust o
consumers. Opacity and dierence between the advertised oer and the
results o the service rendered might also explain these results.
Some other markets also show poor results or “trust”: telecoms services in
general (xed telephony, mobile telephony and internet service provision),
energy services (electricity, gas and uel), meat, clothing and ootwear and
the banking sector (current account and credit products), railways and
house maintenance. The existence o sector specic consumer regulation
or the ast technological development in some markets could inuence
the results. For instance consumers may not be aware that some services
are not the responsibility o their provider.
The most “trusted” markets are either “personal” services (personal care,
dental or uneral services), white goods (small or large household appli-
ances) and “ast moving” categories (such as bread, rice and cereals or
books, magazines and newspapers). Most o these markets are regulated
to a lesser extent. Postal services are also considered as “trusted partners”
by European consumers.
Figure 6: Trust
On a scale rom 0 to 10, to what extent do you trust suppliers to respect the rulesand regulations protecting consumers?
0 – 4 5 – 7 8 –10Source: Market monitoring survey
8/6/2019 4th Edition Scoreboard En
http://slidepdf.com/reader/full/4th-edition-scoreboard-en 17/60
8/6/2019 4th Edition Scoreboard En
http://slidepdf.com/reader/full/4th-edition-scoreboard-en 18/60
• 18 •
Consumer Market Monitoring Results
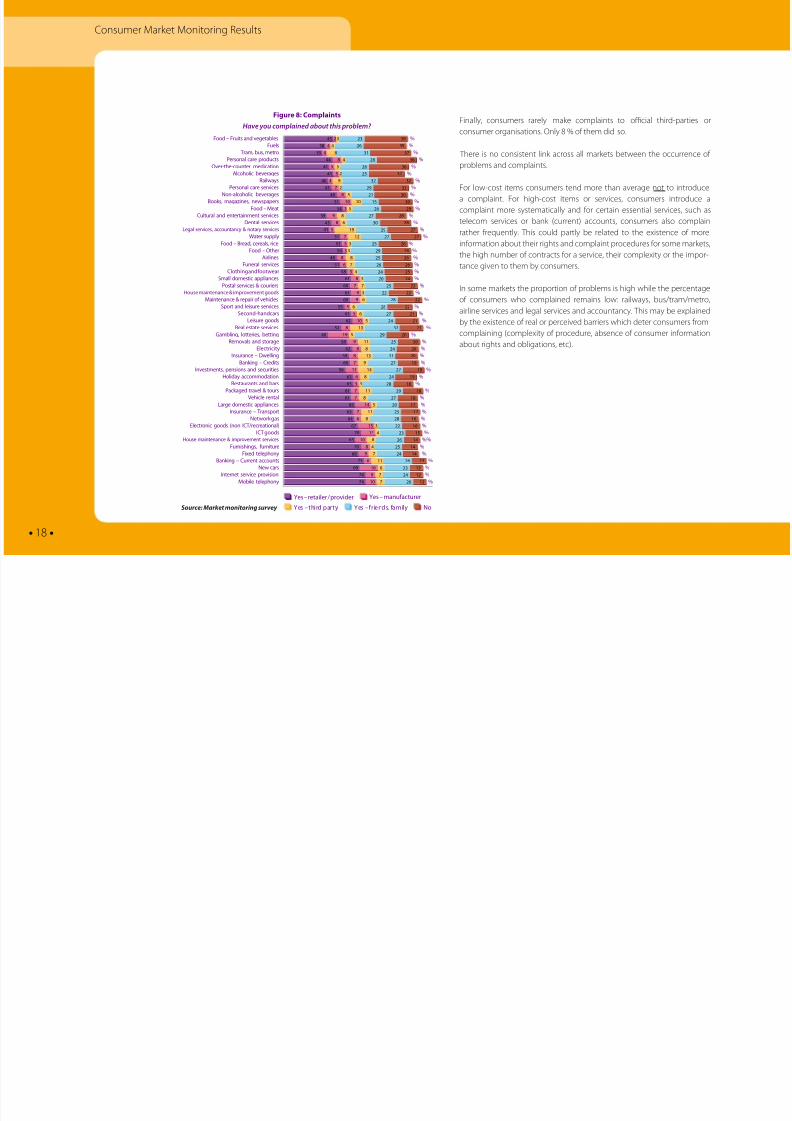
Finally, consumers rarely make complaints to of cial third-parties or
consumer organisations. Only 8 % o them did so.
There is no consistent link across all markets between the occurrence o
problems and complaints.
For low-cost items consumers tend more than average not to introduce
a complaint. For high-cost items or services, consumers introduce a
complaint more systematically and or certain essential services, such as
telecom services or bank (current) accounts, consumers also complain
rather requently. This could partly be related to the existence o more
inormation about their rights and complaint procedures or some markets,
the high number o contracts or a service, their complexity or the impor-
tance given to them by consumers.
In some markets the proportion o problems is high while the percentage
o consumers who complained remains low: railways, bus/tram/metro,
airline services and legal services and accountancy. This may be explained
by the existence o real or perceived barriers which deter consumers rom
complaining (complexity o procedure, absence o consumer inormation
about rights and obligations, etc).
Figure 8: Complaints
Have you complained about this problem?
Food – Fruits and vegetablesFuelsTram, bus, metro
Personal care productsOver-the-counter medication
Alcoholic beveragesRailways
Personal care servicesNon-alcoholic beverages
Books, magazines, newspapersFood – Meat
Cultural and entertainment servicesDental services
Legal services, accountancy & notary servicesWater supply
Food – Bread, cereals, riceFood – Other
AirlinesFuneral services
Clothing and ootwear
Small domestic appliancesPostal services & couriers
House maintenance & improvement goodsMaintenance & repair o vehicles
Sport and leisure servicesSecond-hand cars
Leisure goodsReal estate services
Gambling, lotteries, bettingRemovals and storage
ElectricityInsurance – Dwelling
Banking – CreditsInvestments, pensions and securities
Holiday accommodationRestaurants and bars
Packaged travel & toursVehicle rental
Large domestic appliancesInsurance – Transport
Network gasElectronic goods (non ICT/recreational)
ICT goodsHouse maintenance & improvement services
Furnishings, urnitureFixed telephony
Banking – Current accountsNew cars
Internet service provisionMobile telephony
%%%
%%
%%
%%
%%
%%
%%
%%%%%
%%
%%
%%
%%
%%%%%
%%
%%
%%%
%%%
%%%%
%%%
%
4538
35
44
41
45
40
43
48
51
54
39
43
41
51
53
54
48
51
58
6160
61
60
55
61
6
5
40
58
6
59
60
56
63
63
61
61
65
63
64
67
70
65
70
68
73
69
74
74
4
4
8
5
5
4
7
8
10
3
9
8
5
7
5
3
8
6
5
87
9
9
5
5
10
8
19
9
8
8
7
11
6
5
7
7
14
7
6
15
13
10
8
9
6
16
9
10
34
8
4
5
9
5
10
5
8
6
19
1
3
3
8
7
4
37
3
6
6
6
5
13
5
11
8
13
9
14
8
3
11
8
5
11
8
3
4
8
4
7
11
6
7
7
36
31
8
6
5
3
9
1
15
6
7
30
9
7
5
9
5
6
4
05
8
8
7
4
3
9
5
4
1
7
7
4
8
9
7
0
5
8
3
6
5
4
6
3
4
6
3939
37
36
36
3
3
3
30
30
9
8
8
7
7
6
6
6
6
5
4
1
1
1
0
0
0
0
19
19
19
18
18
18
17
17
16
16
15
14
14
14
13
1
1
1
Yes – retailer / provider
No
Yes – manuacturer
Yes – third party Yes – riends, amilySource: Market monitoring survey

8/6/2019 4th Edition Scoreboard En
http://slidepdf.com/reader/full/4th-edition-scoreboard-en 19/60
• 19 •
Consumer Market Monitoring Results
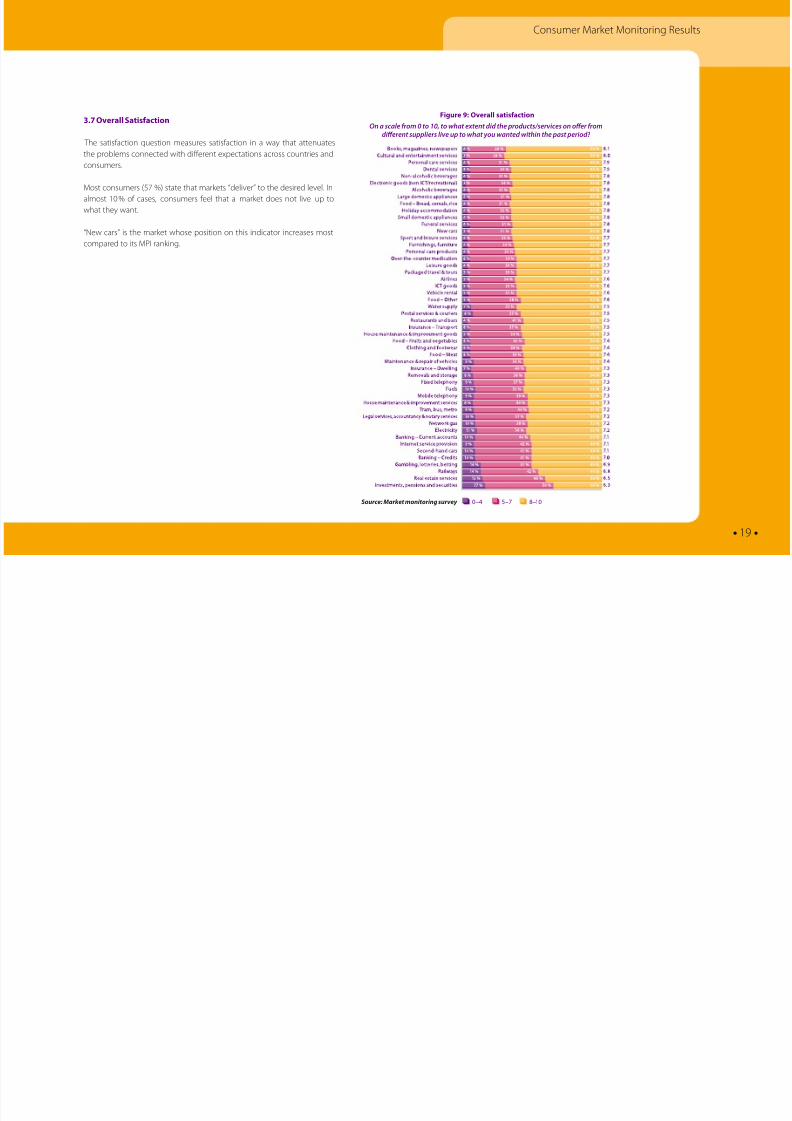
3.7 Overall Satisaction
The satisaction question measures satisaction in a way that attenuatesthe problems connected with dierent expectations across countries and
consumers.
Most consumers (57 %) state that markets “deliver” to the desired level. In
almost 10 % o cases, consumers eel that a market does not live up to
what they want.
“New cars” is the market whose position on this indicator increases most
compared to its MPI ranking.
Figure 9: Overall satisaction
On a scale rom 0 to 10, to what extent did the products/services on oer romdierent suppliers live up to what you wanted within the past period?
0 – 4 5 – 7 8 –10Source: Market monitoring survey
8/6/2019 4th Edition Scoreboard En
http://slidepdf.com/reader/full/4th-edition-scoreboard-en 20/60
Consumer Market Monitoring Results
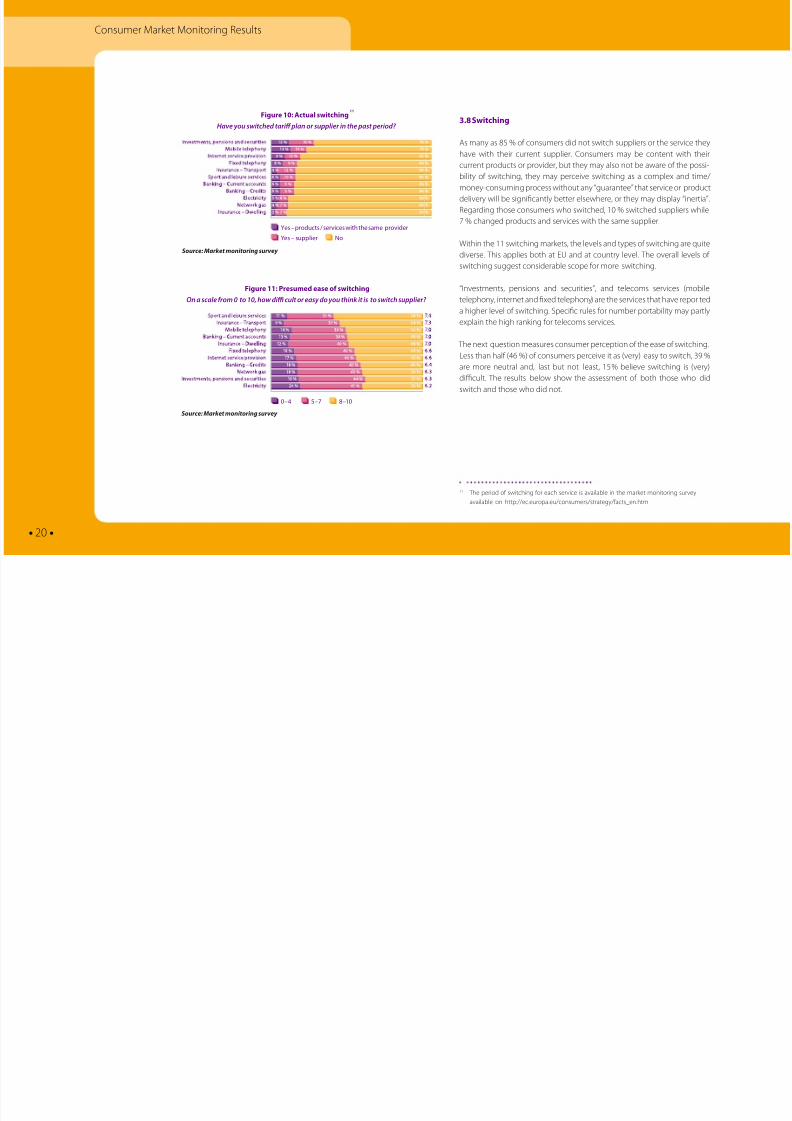
3.8 Switching
As many as 85 % o consumers did not switch suppliers or the service theyhave with their current supplier. Consumers may be content with their
current products or provider, but they may also not be aware o the possi-
bility o switching, they may perceive switching as a complex and time/
money-consuming process without any “guarantee” that service or product
delivery will be signicantly better elsewhere, or they may display “inertia”.
Regarding those consumers who switched, 10 % switched suppliers while
7 % changed products and services with the same supplier.
Within the 11 switching markets, the levels and types o switching are quite
diverse. This applies both at EU and at country level. The overall levels o
switching suggest considerable scope or more switching.
“Investments, pensions and securities”, and telecoms services (mobile
telephony, internet and xed telephony) are the services that have repor ted
a higher level o switching. Specic rules or number portability may partly
explain the high ranking or telecoms services.
The next question measures consumer perception o the ease o switching.
Less than hal (46 %) o consumers perceive it as (very) easy to switch, 39 %
are more neutral and, last but not least, 15 % believe switching is (very)
dif cult. The results below show the assessment o both those who did
switch and those who did not.
11 The period o switching or each service is available in the market monitoring survey
available on http://ec.europa.eu/consumers/strategy/acts_en.htm
• 20 •
Source: Market monitoring survey
Source: Market monitoring survey
Figure 10: Actual switching11
Figure 11: Presumed ease o switching
Have you switched tari plan or supplier in the past period?
On a scale rom 0 to 10, how di cult or easy do you think it is to switch supplier?
0 – 4 5 – 7 8 –10
Yes – products / services with the same provider
Yes – supplier No
8/6/2019 4th Edition Scoreboard En
http://slidepdf.com/reader/full/4th-edition-scoreboard-en 21/60
4. PRICES
• 21 •
8/6/2019 4th Edition Scoreboard En
http://slidepdf.com/reader/full/4th-edition-scoreboard-en 22/60
• 22 •
Prices
Prices are an important outcome or consumers and a major determinanto their purchasing decisions. In the single market price divergence across
Member States, which is not explained by divergent levels o consumer
spending power, by consumer preerences, by product specic taxes, by
local costs, can provide a good indication o the level o ragmentation o
consumer markets.
Diferent sources were used to gather the price data set out in the
ollowing charts.
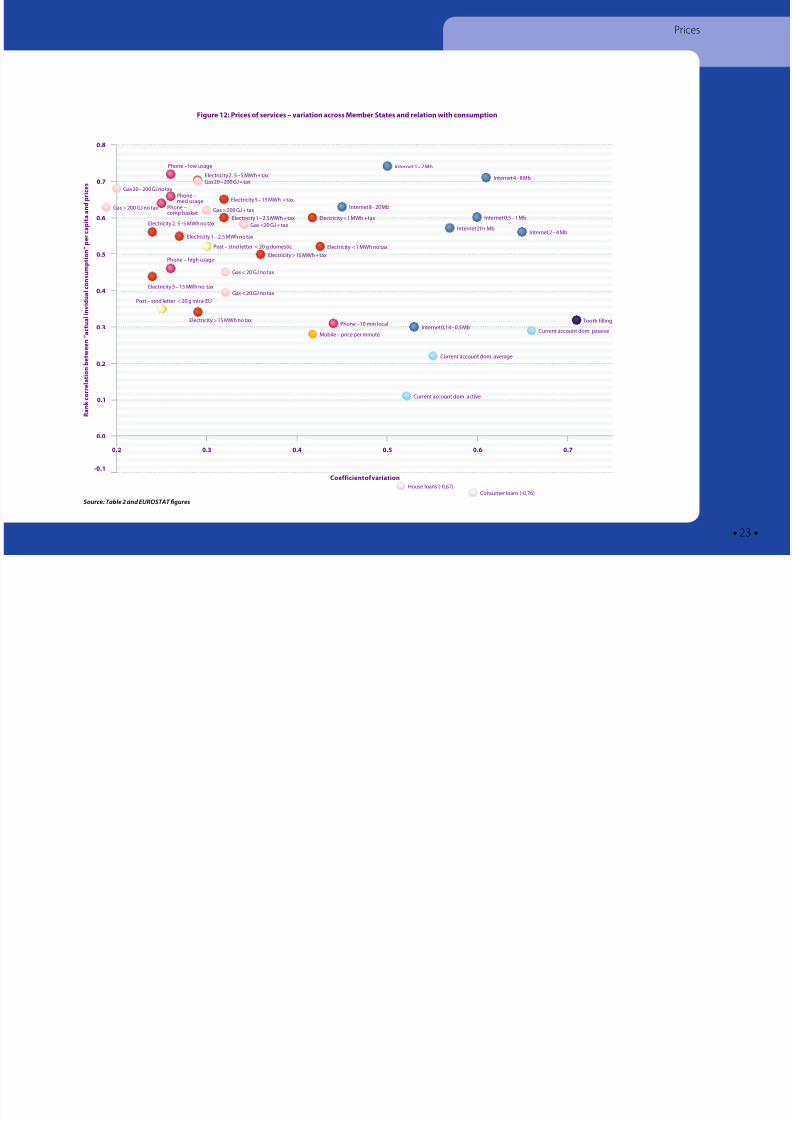
Figure 12 presents on its horizontal axis how much the prices o various
services vary across the EU. The vertical axis shows the strength o the
correlation between how EU countries are ranked based on the price o each service and how EU countries are ranked based on a measure o
consumer spending power. A value o 1 or the correlation means that the
ranking o EU countries based on the price o a service is the same as the
ranking based on consumption; a value o 0 means there is no relation
between the two rankings.
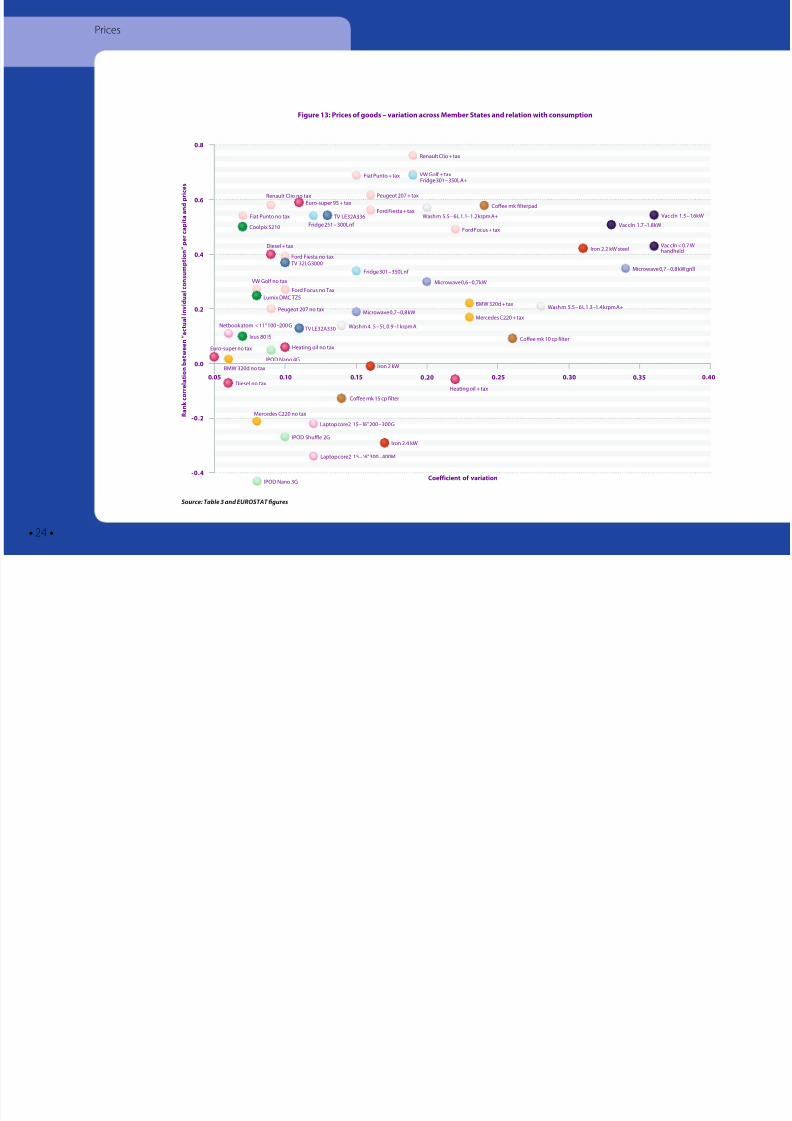
Figure 12 and Figure 13 show that prices o services, in general, show
a wider divergence across EU Member States than prices o goods. This
can be partly explained by the lower tradability o services. When reer-
ring to particular services, the markets which display the largest variability
appear to include internet service provision, tooth lling (dental services)
and current accounts. For the two later markets the variability is not related
to the level o consumption expenditure in EU countries. As regards goods,
cars show a low divergence due to intense competition and the enhanced
potential or cross-border trade, ollowing the enorcement o competi-
tion rules by the Commission. The prices o telecom services are based
on proles and median prices. The interest rates or house and consumer
loans (adjusted or ination) are negatively correlated with the levels o
consumption (i.e. loans appear to be more expensive in countries with
lower consumer spending and vice versa). This can partially reect the
4. PRICES
higher risk premiums and increased costs o unding which are typical inaster growing countries. The data on dental services are very limited and
thereore conclusions should not be drawn on this basis.
Figure 13 reveals that pre-tax car prices tend to be very similar across
Member States, indicating quite close convergence at EU level. Taxes are
responsible or the added variation. Prices o electrical goods tend to
vary more widely and vacuum cleaners have the highest variation across
Member States. Electronic goods such as televisions and media players
vary much less in price across the EU.
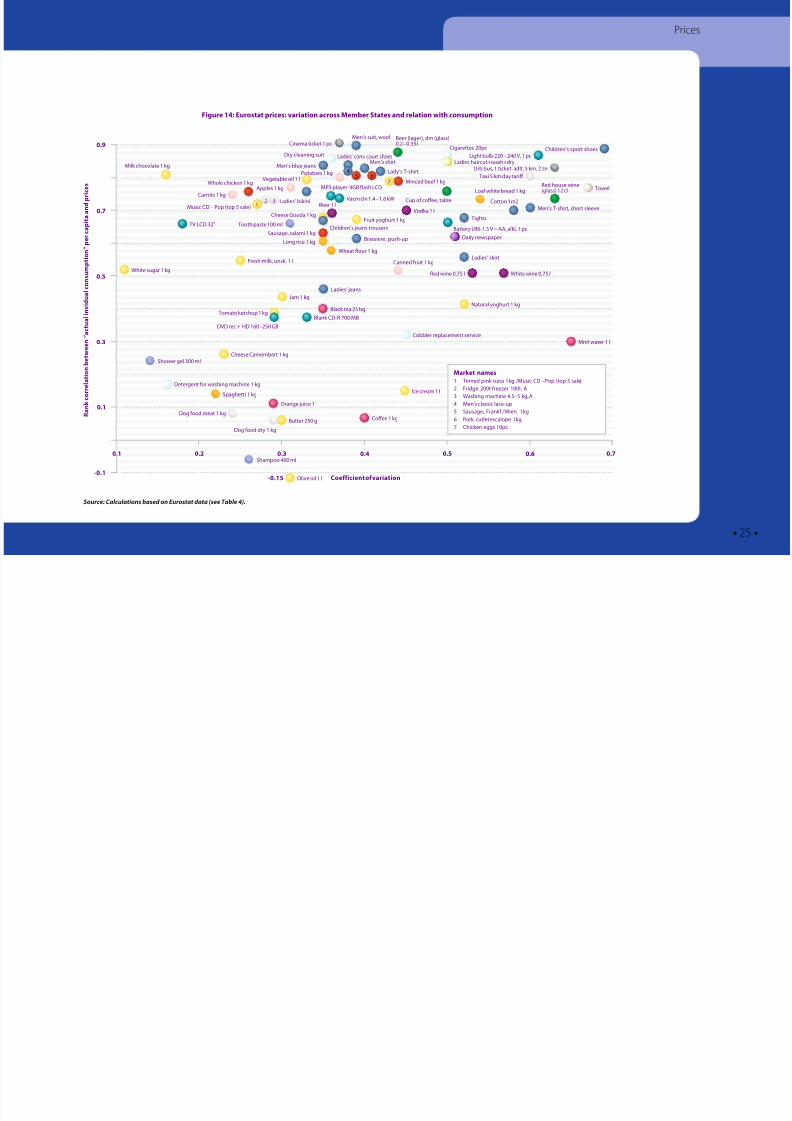
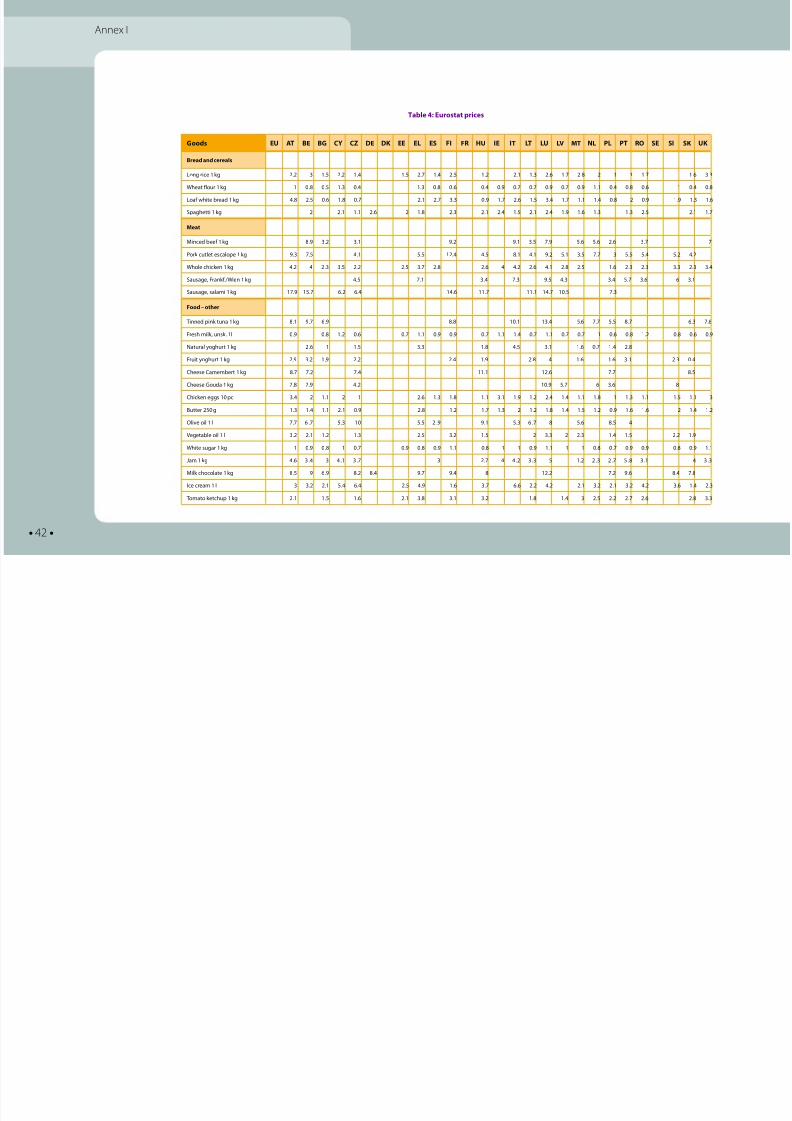
Figure 14 shows prices provided by Eurostat as part o a research project
carried out with the national statistical of ces. The intention is that asuf cient number o products prices will be collected on a regular basis
to allow an assessment o price divergence and ragmentation in retail
markets. Within the 2009 project, prices were collected or 91 products o
which 79 (70 goods and 9 services) were deemed suf ciently comparable
or use. They display a very strong correlation between their prices and
consumption.
There is a clear need to expand the number o collected prices in order to
cover all 50 sectors included in the market monitoring work.
The data were collected as a research project and are experimental. They
come rom the collection or the calculation o Harmonised Indices o
Consumer Prices, which aim at evaluating the evolution o prices over time,
and not comparing price levels between countries. The products included
within the same general product description are thus not necessarily ully
comparable. In diferent countries diferent products may be selected, or
example, those which are most typical or the individual country, and the
products selected may thereore be o diferent quality, or diferent brands
or collected in diferent types o outlets (http://epp.eurostat.ec.europa.eu/
portal/page/portal/hicp/methodology/prices_data_or_market_monitoring).
8/6/2019 4th Edition Scoreboard En
http://slidepdf.com/reader/full/4th-edition-scoreboard-en 23/60
• 23 •
Prices
Figure 12: Prices o services variation across Member States and relation with consumption
0.7
0.6
0.5
0.4
0.3
0.2
0.8
0.1
0.0
-0.1
0.30.2 0.5 0.6 0.70.4
Electricity . 5 – 5 MWh + tax
Gas 0 – 00 GJ no taxPhone –med usage
Gas > 00 GJ no tax
Gas 0 – 00 GJ + tax
Gas > 00 GJ + tax
Gas <0 GJ + tax
Gas < 0 GJ no tax
Gas < 0 GJ no tax
Electricity . 5 – 5 MWh no tax
Electricity 5 – 15 MWh no tax
Electricity 1 – .5 MWh no tax
Post – stnd letter < 0 g domestic
Post – stnd letter < 0 g intra-EU
Electricity > 15 MWh no taxPhone –10 min local
Phone – low usage
Mobile – price per minute
Internet 8 – 0 Mb
Internet 1 – Mb
Internet 4 – 8 Mb
Internet 0,5 – 1 Mb
Internet 0+ MbInternet – 4 Mb
Internet 0,14 – 0,5 Mb
Current account dom. average
House loans (-0,67)
Current account dom. passive
Tooth illing
Current account dom. active
Phone –comp basket
Electricity < 1 MWh + tax
Electricity <1 MWh no tax
Electricity > 15 MWh + tax
Electricity 1 – .5 MWh + tax
Electricity 5 – 15 MWh + tax
Phone – high usage
Source: Table 2 and EUROSTAT fgures
Coeicient o variation
R a n k c o r r e l a t i o n b e t w e e n “ a c t u a l i n v i d u a l c o n s u m p t i o n ” p e r c a p i t a a n d p r i c e s
Consumer loans (-0,76)

8/6/2019 4th Edition Scoreboard En
http://slidepdf.com/reader/full/4th-edition-scoreboard-en 24/60
• 24 •
Prices
Figure 13: Prices o goods variation across Member States and relation with consumption
0.6
0.4
0.2
0.0
0.8
-0.2
-0.4
0.100.05 0.20 0.25 0.30 0.35 0.400.15
Fiat Punto + tax VW Gol + tax
Renault Clio + tax
Ford Focus + tax
Microwave 0,6 – 0,7 kW
Microwave 0,7 – 0,8 kW grill
Microwave 0,7 – 0,8 kW
Netbook atom < 11" 100 – 00 G
Coolpix S10
Peugeot 07 + tax
Ford Fiesta + tax
Renault Clio no tax
Ford Fiesta no tax
Ford Focus no Tax
Laptop core 15 – 16" 00 – 300 G
Laptop core 15 – 16" 300 – 400M
VW Gol no tax
Peugeot 07 no tax
Fiat Punto no tax
Lumix DMC TZ5
Ixus 80 IS
IPOD Nano 4G
IPOD Shule G
IPOD Nano 3G
Euro-super 95 + tax
Diesel no taxHeating oil + tax
Euro-super no tax Heating oil no tax
Diesel + tax
TV LE3A336
TV 3LG3000
TV LE32A330
Fridge 301 – 350L A+
Fridge 301 – 350L n
Fridge 51 – 300L n
Iron kW
Iron .4 kW
Iron . kW steel
BMW 30d no tax
Mercedes C0 + tax
BMW 30d + tax
Mercedes C0 no tax
Wash m 5.5 – 6 L 1.1 – 1. krpm A+
Wash m 4. 5 – 5 L 0.9 – 1 krpm A
Wash m 5.5 – 6 L 1.3 – 1.4 krpm A+
Coee mk ilterpad
Coee mk 10 cp ilter
Coee mk 15 cp ilter
Vac cln 1.5 – 1.6kW
Vac cln < 0.7 Whandheld
Vac cln 1.7 – 1.8kW
Source: Table 3 and EUROSTAT fgures
Coeicient o variation
R a n k c o r r e l a t i o n b e t w e e n “ a c t u a l i n v i d u a l c o n s u m p t i o n ” p e r c a p i t a a n d p r i c e s
8/6/2019 4th Edition Scoreboard En
http://slidepdf.com/reader/full/4th-edition-scoreboard-en 25/60
• 25 •
Prices
Figure 14: Eurostat prices: variation across Member States and relation with consumption
0.7
0.5
0.3
0.9
0.1
-0.1
0.20.1 0.4 0.5 0.6 0.70.3
3
Cheese Gouda 1 kg
Brassiere, push-up
Ladies’ jeans
Sausage, salami 1 kg
White sugar 1 kg
Fresh milk, unsk. 1 l
Cheese Camembert 1 kg
Butter 50 g
Jam 1 kg
Ice cream 1 l
Natural yoghurt 1 kg
Red wine 0,75 l
Cup o coee, table
Fruit yoghurt 1 kgTV LCD 3"
DVD rec + HD 160 – 50 GB
Blank CD-R 700 MB
MP3 player ’4GB lash LCD
Vacm cln 1.4 – 1.6 kW
Olive oil 1 l
Ladies’ skirt
Tights
Daily newspaper
Men’s T-shirt, short sleeve
Children’s sport shoes
Cotton 1m
Ladies’ conv court shoes
Men’s shirt
Lady’s T-shirtMen’s blue jeans
Ladies’ bikini
Men’s suit, wool
Children’s jeans trousers
Whole chicken 1 kg Minced bee 1 kg
Milk chocolate 1 kg
Vegetable oil 1 l
Tomato ketchup 1 kg
Battery LR6-1.5 V = AA, alkl, 1 pc
Light bulb 0 – 40 V, 1 pc
Urb bus, 1 ticket adlt, 5 km, zn
Taxi 5 km day tari
Cinema ticket 1 pc
Dog ood meat 1 kg
Dog ood dry 1 kg
Black tea 5 bg
Orange juice 1 l
Coee 1 kg
Mnrl water 1 l
Shower gel 300 ml
Shampoo 400 ml
Tooth paste 100 ml
Cobbler replacement service
Cigarettes 0pc
Detergent or washing machine 1 kg
Towel
Music CD – Pop (top 5 sale)
Ladies haircut+wash+dry
Canned ruit 1 kg
Carrots 1 kgApples 1 kg
Potatoes 1 kg
Spaghetti 1 kg
Wheat lour 1 kg
Long rice 1 kg
Loa white bread 1 kg
Beer (lager), dm (glass)0. – 0.35 l
Red house wine(glass) 1 cl
White wine 0,75 l
Beer 1 lVodka 1 l
45 6
7
Source: Calculations based on Eurostat data (see Table 4).
Coeicient o variation
R a n k c o r r e l a t i o n b e t w e e n “ a c t u a l i n v i d u a l c o n s u m p t i o n ” p e r c a p i t a a n d p r i c e s
Market names
1 Tinned pink tuna 1 kg / Music CD – Pop (top 5 sale)
Fridge 00 l-reezer 100 l, A
3 Washing machine 4.5 – 5 kg, A
4 Men’s classic lace-up
5 Sausage, Frank. /Wien. 1 kg
6 Pork cutlet escalope 1 kg7 Chicken eggs 10pc
Dry cleaning suit
1
-0.15
8/6/2019 4th Edition Scoreboard En
http://slidepdf.com/reader/full/4th-edition-scoreboard-en 26/60
• 26 •
5. COMPLAINTS
8/6/2019 4th Edition Scoreboard En
http://slidepdf.com/reader/full/4th-edition-scoreboard-en 27/60
• 27 •
Complaints
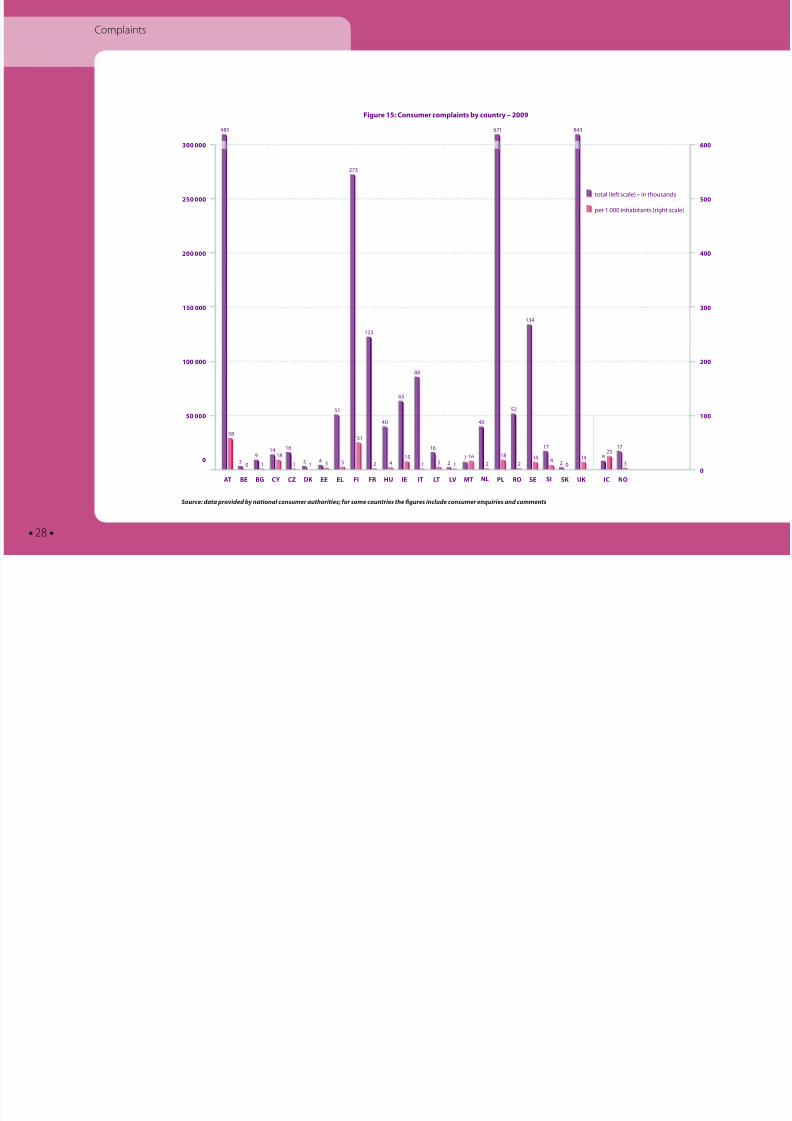
5. COMPLAINTS
At present, complaints data are only available based on the existing
complaints classication methodologies, which tend to vary signicantly
between EU countries. The ollowing data were provided by the members
o the Consumer Markets Experts Group, composed o consumer policy
authorities in the EU and EFTA countries. The data reects the number o
consumer complaints collected by third parties (national authorities, regu-
lators, consumer organisations, etc.).
Some EU countries (DE, ES, LU, PT) did not send complaints data in time or
the publication o the Scoreboard.
The data show that third-party complaint collecting bodies in the UK,Poland and Austria gathered the largest number o complaints. However,
these numbers do not merely reect the prevalence o actual problems
indicated by consumers in the market. They also reveal the eectiveness o
the complaint collecting bodies, the level o consumer empowerment and
willingness to complain when conronted with problems. It is thereore
important to analyse complaints together with additional data in order to
determine i a high number o complaints indicates market malunctioning
or i it only reects the success o consumer policy eorts.
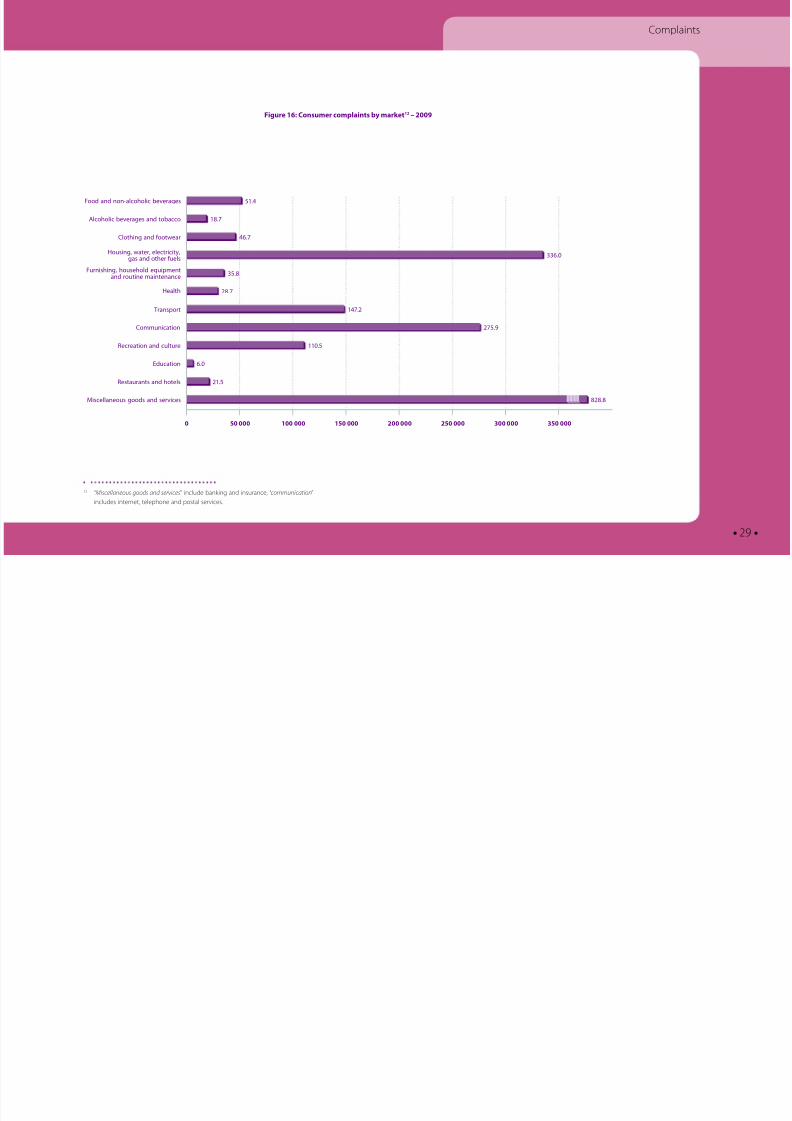
A breakdown by sector o the reported complaints is presented below.

8/6/2019 4th Edition Scoreboard En
http://slidepdf.com/reader/full/4th-edition-scoreboard-en 28/60
• 28 •
Complaints
Figure 15: Consumer complaints by country 2009
600
500
400
300
200
100
0
300 000
250 000
200 000
150 000
100 000
50 000
0
AT CZ FI IT NL SIBE DK FR LT PL SK ICBG EE HU LV RO UK NOCY EL IE MT SE
total (let scale) – in thousands
per 1 000 inhabitants (right scale)
485 671 843
00
5
3
17
5
8
58
39 18
1 1 13 4
16
3
51
5
73
51
13
40 40
4
65
15
88
1 1
16
5 7 16 18
134
14 148
1714
Source: data provided by national consumer authorities; or some countries the fgures include consumer enquiries and comments
8/6/2019 4th Edition Scoreboard En
http://slidepdf.com/reader/full/4th-edition-scoreboard-en 29/60
• 29 •
Complaints
12 “Miscellaneous goods and services” include banking and insurance, “communication”
includes internet, telephone and postal services.
Figure 16: Consumer complaints by market12 2009
336.0
35.8
147.
8.7
75.9
110.5
6.0
1.5
88.8
0 250 000200 000150 000100 00050 000 300 000 350 000
51.4Food and non-alcoholic beverages
18.7Alcoholic beverages and tobacco
46.7Clothing and ootwear
Housing, water, electricity,gas and other uels
Furnishing, household equipmentand routine maintenance
Health
Transport
Communication
Recreation and culture
Education
Restaurants and hotels
Miscellaneous goods and services
8/6/2019 4th Edition Scoreboard En
http://slidepdf.com/reader/full/4th-edition-scoreboard-en 30/60
• 30 •
6. SAFETY
8/6/2019 4th Edition Scoreboard En
http://slidepdf.com/reader/full/4th-edition-scoreboard-en 31/60
• 31 •
Saety
6. SAFETY
Eurobarometer survey data show that saety is one o the main drivers o
consumer choice, with as many as 50 % o consumers considering that
saety is one o the aspects which most requently inuence their purchase
choices in the case o non-ood items13
.
Because the saety data presented below are based on a dierent clas-
sication than the COICOP system used in the Scoreboard, they cannot be
combined in a common indicator. In due course, the data on consumer
complaints will also cover saety issues, giving a clearer picture o potential
saety problems in dierent markets and allowing saety to be incorpo-
rated in an indicator o market malunctioning.
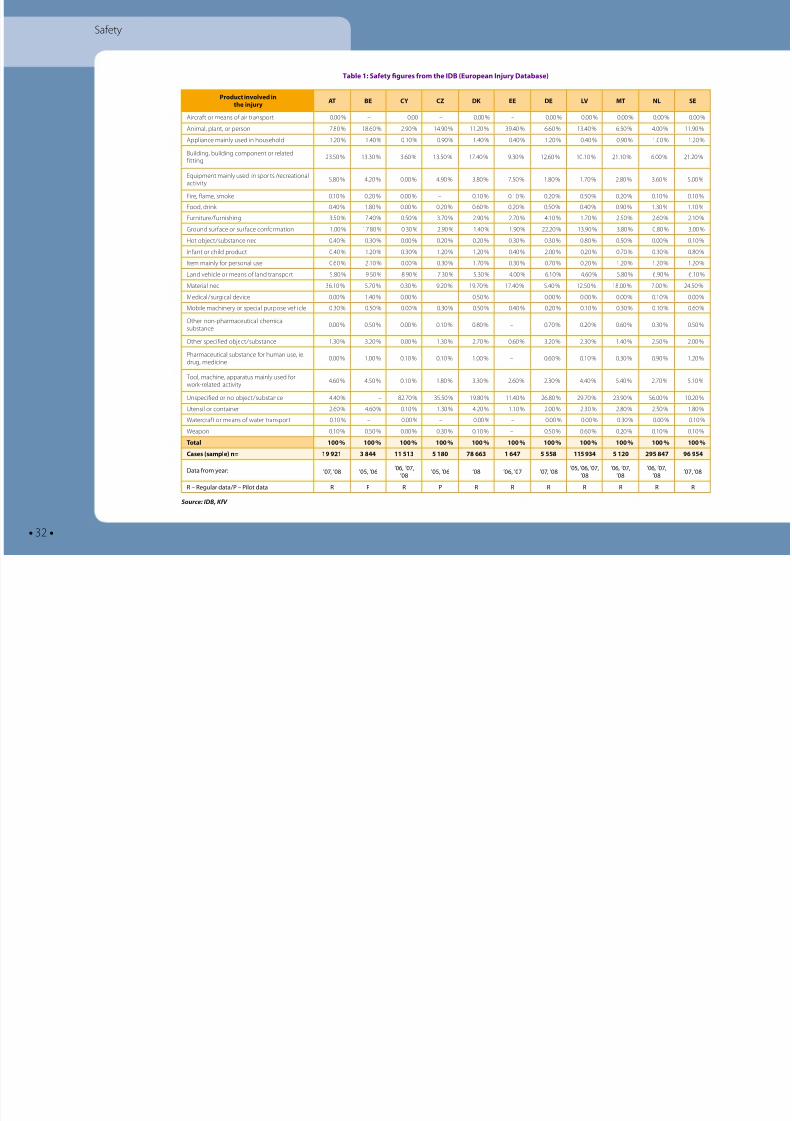
The ollowing data are taken rom the European Injury Database (IDB)
which presents the accident and injury statistics collected by hospitals in
Member States. These data are only a sample o the overall saety incidents
which occur annually in the EU. At present only some EU countries collect
injury statistics.
The cases (sample) represent the number o accidents recorded in the
sample o hospitals participating in the IDB project.
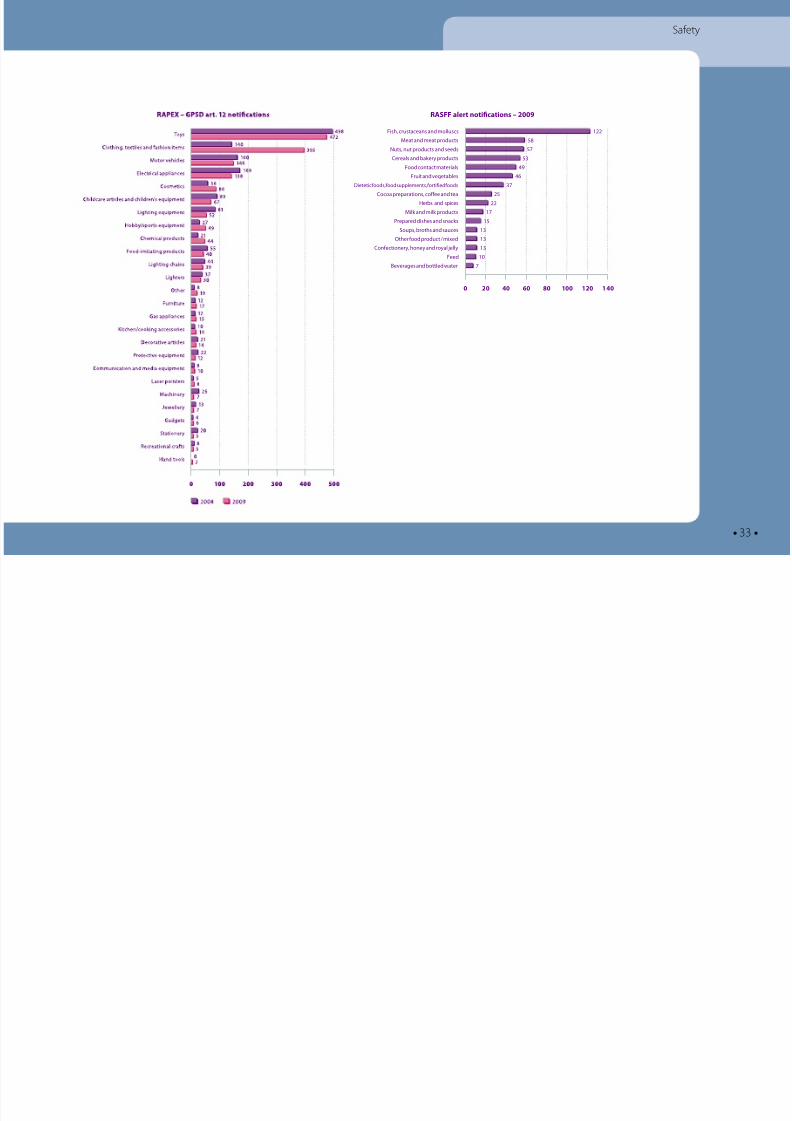
Further indications about the saety o products on the market are
provided by the two EU-wide rapid alert systems which track dangerous
consumer goods: RAPEX14
or non-ood products and RASFF15
or ood and
eed products.
In the ollowing years, the data on prices, complaints and saety will be
urther developed so that they can be integrated with the data rom the
screening survey into an overall market perormance indicator.
13 EB298 – Consumer Protection in the Internal Market, June 200814 RAPEX: Rapid Alert System or non-ood consumer products – 2009 Annual Report15 RASFF: Rapid Alert System or Food and Feed
8/6/2019 4th Edition Scoreboard En
http://slidepdf.com/reader/full/4th-edition-scoreboard-en 32/60
• 32 •
Saety
Product involved inthe injury
AT BE CY CZ DK EE DE LV MT NL SE
Aircrat or means o air transport 0.00 % – 0.00 – 0.00 % – 0.00 % 0.00 % 0.00 % 0.00 % 0.00 %
Animal, plant, or person 7.80 % 18.60 % 2.90 % 14.90 % 11.20 % 39.40 % 6.60 % 13.40 % 6.50 % 4.00 % 11.90 %
Appliance mainly used in household 1.20 % 1.40 % 0.10 % 0.90 % 1.40 % 0.40 % 1.20 % 0.40 % 0.90 % 1.00 % 1.20 %Building, building component or relateditting
23.50 % 13.30 % 3.60 % 13.50 % 17.40 % 9.30 % 12.60 % 10.10 % 21.10 % 6.00 % 21.20 %
Equipment mainly used in spor ts / recreationalactivity
5.80 % 4.20 % 0.00 % 4.90 % 3.80 % 7.50 % 1.80 % 1.70 % 2.80 % 3.60 % 5.00 %
Fire, lame, smoke 0.10 % 0.20 % 0.00 % – 0.10 % 0.10 % 0.20 % 0.50 % 0.20 % 0.10 % 0.10 %
Food, drink 0.40 % 1.80 % 0.00 % 0.20 % 0.60 % 0.20 % 0.50 % 0.40 % 0.90 % 1.30 % 1.10 %
Furniture / urnishing 3.50 % 7.40 % 0.50 % 3.70 % 2.90 % 2.70 % 4.10 % 1.70 % 2.50 % 2.60 % 2.10 %
Ground surace or surace conormation 1.00 % 17.80 % 0.30 % 2.90 % 1.40 % 1.90 % 22.20 % 13.90 % 3.80 % 0.80 % 3.00 %
Hot object / substance nec 0.40 % 0.30 % 0.00 % 0.20 % 0.20 % 0.30 % 0.30 % 0.80 % 0.50 % 0.00 % 0.10 %
Inant or child product 0.40 % 1.20 % 0.30 % 1.20 % 1.20 % 0.40 % 2.00 % 0.20 % 0.70 % 0.30 % 0.80 %
Item mainly or personal use 0.60 % 2.10 % 0.00 % 0.30 % 1.70 % 0.30 % 0.70 % 0.20 % 1.20 % 1.20 % 1.20 %
Land vehicle or means o land transport 5.80 % 9.50 % 8.90 % 7.30 % 5.30 % 4.00 % 6.10 % 4.60 % 5.80 % 6.90 % 6.10 %
Material nec 36.10 % 5.70 % 0.30 % 9.20 % 19.70 % 17.40 % 5.40 % 12.50 % 18.00 % 7.00 % 24.50 %
Medical / surgical device 0.00 % 1.40 % 0.00 % – 0.50 % – 0.00 % 0.00 % 0.00 % 0.10 % 0.00 %
Mobile machinery or special purpose vehicle 0.30 % 0.50 % 0.00 % 0.30 % 0.50 % 0.40 % 0.20 % 0.10 % 0.30 % 0.10 % 0.60 %
Other non-pharmaceutical chemicalsubstance
0.00 % 0.50 % 0.00 % 0.10 % 0.80 % – 0.70 % 0.20 % 0.60 % 0.30 % 0.50 %
Other speciied object / substance 1.30 % 3.20 % 0.00 % 1.30 % 2.70 % 0.60 % 3.20 % 2.30 % 1.40 % 2.50 % 2.00 %
Pharmaceutical substance or human use, ie.drug, medicine
0.00 % 1.00 % 0.10 % 0.10 % 1.00 % – 0.60 % 0.10 % 0.30 % 0.90 % 1.20 %
Tool, machine, apparatus mainly used orwork-related activity
4.60 % 4.50 % 0.10 % 1.80 % 3.30 % 2.60 % 2.30 % 4.40 % 5.40 % 2.70 % 5.10 %
Unspeciied or no object / substance 4.40 % – 82.70 % 35.50 % 19.80 % 11.40 % 26.80 % 29.70 % 23.90 % 56.00 % 10.20 %
Utensil or container 2.60 % 4.60 % 0.10 % 1.30 % 4.20 % 1.10 % 2.00 % 2.30 % 2.80 % 2.50 % 1.80 %
Watercrat or means o water transport 0.10 % – 0.00 % – 0.00 % – 0.00 % 0.00 % 0.30 % 0.00 % 0.10 %
Weapon 0.10 % 0.50 % 0.00 % 0.30 % 0.10 % – 0.50 % 0.60 % 0.20 % 0.10 % 0.10 %
Total 100 % 100 % 100 % 100 % 100 % 100 % 100 % 100 % 100 % 100 % 100 %
Cases (sample) n= 19 921 3 844 11 513 5 180 78 663 1 647 5 558 115 934 5 120 295 847 96 954
Data rom year: ’07, ’08 ’05, ’06’06, ’07,
’08’05, ’06 ’08 ’06, ’07 ’07, ’08
’05, ’06, ’07,’08
’06, ’07,’08
’06, ’07,’08
’07, ’08
R – Regular data / P – Pilot data R P R P R R R R R R R
Table 1: Saety fgures rom the IDB (European Injury Database)
Source: IDB, KV
8/6/2019 4th Edition Scoreboard En
http://slidepdf.com/reader/full/4th-edition-scoreboard-en 33/60
• 33 •
Saety
7Beverages and bottled water
10Feed
13Conectionery, honey and royal jelly
13Other ood product / mixed
13Soups, broths and sauces
15Prepared dishes and snacks
17Milk and milk products
Herbs and spices
5Cocoa preparations, coee and tea
37Dietetic oods, ood supplements, ortiied oods
46Fruit and vegetables
49Food contact materials
53Cereals and bakery products
57Nuts, nut products and seeds
1Fish, crustaceans and molluscs
58Meat and meat products
0 80604020 100 120 140
RASFF alert notifcations 2009
8/6/2019 4th Edition Scoreboard En
http://slidepdf.com/reader/full/4th-edition-scoreboard-en 34/60
• 34 •
7. CONCLUSIONS AND
NEXT STEPS
8/6/2019 4th Edition Scoreboard En
http://slidepdf.com/reader/full/4th-edition-scoreboard-en 35/60
• 35 •
Conclusions and next steps
7. CONCLUSIONS AND NEXT STEPS
The results rom the EU-wide market monitoring survey provide a valuable
new insight in understanding which parts o the single market may not
deliver rom a consumer point o view. A picture emerges o the poten-
tially most problematic sectors as perceived by consumers.
While the data presented in the Scoreboard are only indicators, they
provide a great deal o evidence or a range o urther work at EU and
national level:
• The data give an indication as to where the Commission and
Member States should ocus their eorts and resources to inves-
tigate and analyse consumer markets, through market studies,sectoral enquiries and other market monitoring tools.
• The question on trust gives an indication o where enorcement
priorities should lie.
• The data provide a basis or policy makers at national and EU level
to discuss – i this is not already the case – with representatives o
the sectors concerned the reasons behind the perormance levels
revealed in the study. A deeper analysis o the reasons underlying
in each specic market would help to interpret the results o the
Scoreboard and to identiy the areas where measures need to be
taken.
FOLLOW-UP ACTIONS
The Commission will carry out two market studies every year on the basis
o the Scoreboard, taking into account recent Commission studies on the
relevant sectors. One study on the retail electricity market is due to be
published at the end o this year and a urther study on e-commerce has
recently been launched. Each study will investigate in depth the reasons
behind the gures in the Scoreboard and identiy the main policy issues
to be tackled and possible policy remedies. The Commission will collect
in-depth data about consumer experiences and opinions o the chosen
markets, record actual consumer experiences o the market through
“mystery shopping” and carry out a detailed price collection. Each market
study will seek to involve stakeholders closely and will seek their views
about the possible problems in order to integrate these into the data
collection and analysis. The end result should be a detailed statement o
the problems aced by consumers in the chosen market and the policy
issues to be addressed.
The Scoreboard data show that internet16
service provision is the third worst
ranking market according to the MPI while being the market where the
highest percentage o consumers reported problems (out o the total o
50 markets). The estimated price o internet service provision also shows a
wider variation across Member States which is however correlated with the
total level o consumption in these countries. Internet service provision is
essential or the empowerment o European citizens and the digital single
market. Thereore, this will be the target o one market study. The study
will complement the evidence in the annual reports on the implementa-
tion o e-communication regulation. The impact o the revised regulatory
ramework, which considerably strengthens provisions such as number
16 Among other issues that the market study will need to investigate are: the role o hedonic
eects embedded in the products (i.e. by which consumers get more or the same price)
such as aster internet access or similar prices; the ast-changing nature o the product
due to the very strong innovation o the Internet; the existence o well-known complaint
procedures (sometimes reerred to in subscribers’ bills); or a higher number o contracts
(or example, some people could have a xed and a mobile Internet service or several
mobile subscriptions).
8/6/2019 4th Edition Scoreboard En
http://slidepdf.com/reader/full/4th-edition-scoreboard-en 36/60
• 36 •
Conclusions and next steps
portability, out-o-court dispute resolution and better consumer inorma-
tion, and still needs to be implemented, will also be taken into account.
The second choice or a market study is the market or meat. Meat is one
o the goods markets with the lowest MPI ranking and scores relatively
poorly or consumer trust. It is also a highly regulated requently purchased
product that makes up a considerable share o consumption expenditure.
While other markets ranked poorly, they were not considered or market
studies this year or the ollowing reasons. Two studies are already ongoing
in the eld o investments and the present data validate the decisions to
investigate this market.
A market study in the electr icity market was launched ollowing the second
Scoreboard and the rst Scoreboard triggered a study on the market o current accounts which was published in September 2009.
Markets such as “real estate services” or “legal services, accountancy and
notary services” seem to make up a low proportion o the household
budget and their cross border dimension is limited.
International passenger rail transport has only been liberalised in December
2009 and it may take some time to be achieved. It is vital that passengers
are well-inormed o their rights. The Commission is thereore pursuing
a Passenger Rights Inormation Campaign. Despite the act that many
passengers identiy problems with the operation o rail services, launching
a market study in the rail sector would be premature as liberalisation is
only in its inancy as ar as international transport is concerned and non-
existent or domestic transport.
While vehicle repair seems to be a problematic market, the Commission
has recently published a comprehensive Impact Assessment on the new
competition law ramework or motor vehicles, which includes an in-depth
analysis o the competitive conditions in this and in the second-hand car
market. The Commission has subsequently implemented a new competi-
tion law ramework or the motor vehicle sector that came into orce in
June 2010, which will increase competition in the market or car repair and
maintenance services, by improving independent repairers’ access to thetechnical inormation needed or repairs and by making it easier or both
authorised and independent repairers to use alternative spare parts. As a
consequence, the new rules will improve the conditions or consumers
on the car repair market substantially. As regards second hand cars, their
prices appear to be inuenced by developments in the new car market
which put pressure on the prices o the whole market, or new cars and
second hand cars. The Commission will continue to monitor careully the
developments in the markets or car sales and repair as well as repair and
maintenance service and both the Commission and national competition
authorities will intervene in case o competition shortcomings.
Although “clothing and ootwear” is also a market which perorms poorly,the “meat” market was selected or the in-depth market study because o
its closer link to consumers’ health and wellbeing.
Member States are encouraged to use the national indices in the Score-
board to launch initiatives or the consumer markets which are the most
problematic at national level.
The data in the Scoreboard will be taken into account by the Commis-
sion and Member States in the selection o a topic or the annual “sweep”
organised by the network o Consumer Protection Cooperation authori-
ties. Member States are also encouraged to use the national data on trust
to identiy their enorcement priorities.
The Commission has already written to the EU representatives o all sectors
included in the monitoring work, inviting them to par ticipate in a dialogue
aimed at improving consumer experiences, identiying best practices in
highly ranked markets, nding potential solutions to problems in poorly
ranked markets, as well as improving the market monitoring process and
potentially using the results o this work to stimulate consumer-driven
innovation.
8/6/2019 4th Edition Scoreboard En
http://slidepdf.com/reader/full/4th-edition-scoreboard-en 37/60
• 37 •
Conclusions and next steps
On the basis o the results o the Scoreboard, the Commission will discuss
with the representatives o those markets among the least well perorming
the possible reasons or these results and whether industry-led actions,such as the development o industry codes o conduct, complaint bodies
or alternative dispute resolution mechanisms would be an appropriate
response to complement the application o the competition rules or
sector-specic regulation.
NEXT STEPS FOR THE SCOREBOARD
Although this Scoreboard means a considerable advance on previous
editions, urther progress is needed to develop and enhance the Score-
board, specically along the lines proposed by the European Parliament
in its report17
. In particular:
• Complaints. The Commission will work closely with complaint
bodies to ensure that the Recommendation is implemented.
• Market monitoring survey. Due to budgetary constraints it is
not possible or all 50 markets to be surveyed every year. The most
problematic markets will be surveyed annually in order to monitor
progress. Other markets will be monitored every two years. I addi-
tional resources become available, the survey will also be expanded
to cover consumer perceptions o the strength o competition and
innovation in each market.
• Prices. Eurostat will continue to work closely with national statis-
tical of ces to develop compar able price data across all consumer
markets.
17 European Parliament resolution o 9 March 2010 on consumer protection – T7-0046/2010
8/6/2019 4th Edition Scoreboard En
http://slidepdf.com/reader/full/4th-edition-scoreboard-en 38/60
• 38 •
Annex I
Services EU AT BE BG CY CZ DE DK EE EL ES FI FR HU IE IT LT LU LV MT NL PL PT RO SE SI SK UK
Gas < 0 GJ + tax 1.5 1.4 3. 11.3 19.8 7.1 6. 10.9 19.8 9.7 13.9 18.4 19.4 18. 0.6 0. 9.7 14.9 1.7 7.8 38.1 1.8 7.7 13.
Gas 0 – 00 GJ + tax 15.5 17.6 15.6 11.4 13.4 17. 6. 10.5 15.9 15.7 13.3 16.6 17.9 11.5 13.3 1.5 0.9 11.8 16.6 7.8 5.8 16.6 13 11.8
Gas > 00 GJ + tax 14.3 15.6 14.4 11.7 13. 15.5 6. 10.5 13.1 14 13. 15.7 18.6 10.5 1.3 1.3 19.7 10.9 14.4 7.6 4.3 16.1 13 10.4
Gas < 0 GJ no tax 17. 15.7 18.8 9.4 16.6 0.4 1.8 8.8 17 6.3 11.3 16. 14.3 15.3 18.7 18.4 19.3 1. 0.7 4.7 4.5 17.4 3.3 1.6
Gas 0 – 00 GJ no tax 1.1 1.8 1.5 9.5 11.3 1.8 1.8 8.5 13.7 13.4 10.9 14.6 11.9 9.7 11.6 11.4 1.6 9.7 15.7 4.7 14.7 13.1 10.9 11.3
Gas > 00 GJ no tax 10.9 11. 11.5 9.8 11.1 11.3 1.8 8.5 11.3 11.8 10.7 13.8 11.4 8.8 10.3 11. 11.7 8.9 13.7 4.6 13.5 1.6 11 10
Electricity < 1 MWh +tax 0.4 0.7 0.7 0.08 0.15 0.8 0.36 0.9 0.09 0.11 0.31 0.4 0.16 0.16 0.4 0.9 0.1 0.7 0.11 0.4 0.15 0.33 0.1 0.6 0.8 0.3 0.17
Electricity 1 – .5 MWh +tax 0.18 0.1 0.1 0.08 0.14 0.1 0.5 0.9 0.09 0.09 0.18 0.16 0.14 0.16 0. 0.17 0.1 0.1 0.11 0.18 0.11 0.13 0.18 0.1 0.18 0.16 0.17 0.15
Electricity .5 – 5 MWh +tax 0.16 0.19 0.19 0.08 0.16 0.14 0.3 0.6 0.09 0.11 0.16 0.13 0.1 0.15 0.19 0. 0.09 0.19 0.11 0.16 0.19 0.1 0.16 0.1 0.16 0.14 0.16 0.14
Electricity 5 – 1 5 MWh + tax 0.16 0.17 0.17 0.08 0.16 0.11 0.1 0.3 0.09 0.13 0.15 0.11 0.11 0.14 0.18 0.6 0.09 0.17 0.11 0.17 0.3 0.11 0.14 0.09 0.14 0.13 0.15 0.13
Electricity > 15 MWh +tax 0.15 0.16 0.15 0.08 0.17 0.1 0.1 0.3 0.08 0.16 0.14 0.1 0.1 0.14 0.15 0.3 0.08 0.14 0.1 0.1 0.19 0.11 0.13 0.09 0.13 0.13 0.13 0.13
Electricity < 1 MWh no tax 0.18 0.19 0. 0.07 0.13 0.3 0.5 0.14 0.07 0.1 0.6 0.19 0.1 0.13 0.37 0.08 0.4 0.1 0.3 0.5 0.1 0.9 0.08 0.19 0. 0. 0.16
Electricity 1 – .5 MWh n o tax 0.13 0.15 0.16 0.07 0.1 0.17 0.16 0.14 0.07 0.09 0.15 0.13 0.11 0.13 0. 0.08 0.18 0.1 0.17 0.16 0.1 0.15 0.08 0.1 0.1 0.14 0.15
Electricity .5 – 5 MWh no tax 0.1 0.14 0.14 0.07 0.14 0.11 0.14 0.1 0.07 0.1 0.13 0.1 0.09 0.13 0.17 0.08 0.16 0.1 0.15 0.14 0.09 0.13 0.08 0.1 0.11 0.13 0.14
Electricity 5 – 15 MWh no tax 0.11 0.13 0.1 0.07 0.14 0.09 0.13 0.1 0.07 0.1 0.1 0.09 0.08 0.1 0.16 0.07 0.15 0.1 0.16 0.13 0.09 0.1 0.08 0.09 0.1 0.13 0.1
Electricity > 15 MWh no tax 0.11 0.1 0.11 0.07 0.14 0.08 0.1 0.1 0.06 0.14 0.1 0.07 0.08 0.1 0.14 0.07 0.1 0.1 0. 0.1 0.09 0.11 0.08 0.08 0.1 0.11 0.1
Current acnt. dom. passive 74 100 9 17 7 40 63 38 6 15 105 45 91 8 56 135 11 40 63 53 30 46 6 30 5 44 44 95
Current acnt. dom. average 11 140 58 7 85 95 89 74 51 54 178 104 154 76 8 53 35 57 115 7 46 73 45 83 6 100 74 103
Current acnt. dom. active 159 197 8 43 185 157 115 18 93 11 304 07 3 144 118 40 113 96 19 99 56 114 8 14 18 01 15 111
Internet 0.14 – 0.5 Mb 1.7 36.7 34.43 13.31 1. 4.3 .9 1.88 9.58 8.17 0.48 38.08 11.16 15
Internet 0.5 – 1 Mb 4.17 1 0.17 4 3.18 39.06 9.53 9.5 1 9.4 5 4.61 5.01 3 6.15 1 6.81 0.08 49.67 3.7 11.3 16.79 14
Internet 1 – Mb 34.9 9.43 38 3 0.36 3 4.35 4.93 15.4 16.5 9.01 7.83 39.55 1 1.58 8.9 8.46 1 6.35 17.97 6.1 0.86 1 8.78 1 4.38
Internet – 4 Mb 9.48 7 .56 9.43 67 3 8.81 .7 1 8.59 7.16 35.01 1.45 14.19 6 7.8 1 1.04 19.95 3 3.53 11.3 6.99 17 4 8.5
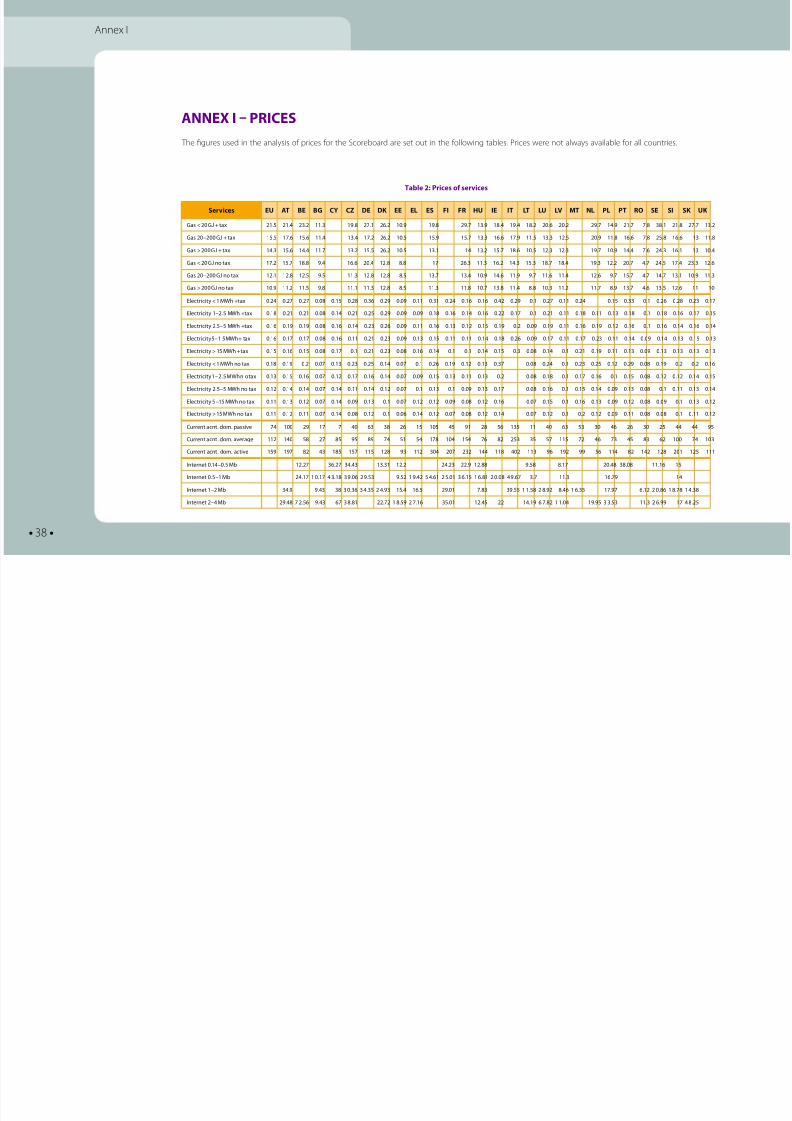
Table 2: Prices o services
ANNEX I – PRICES
The gures used in the analysis o prices or the Scoreboard are set out in the ollowing tables. Prices were not always available or all countries.
8/6/2019 4th Edition Scoreboard En
http://slidepdf.com/reader/full/4th-edition-scoreboard-en 39/60
• 39 •
Annex I
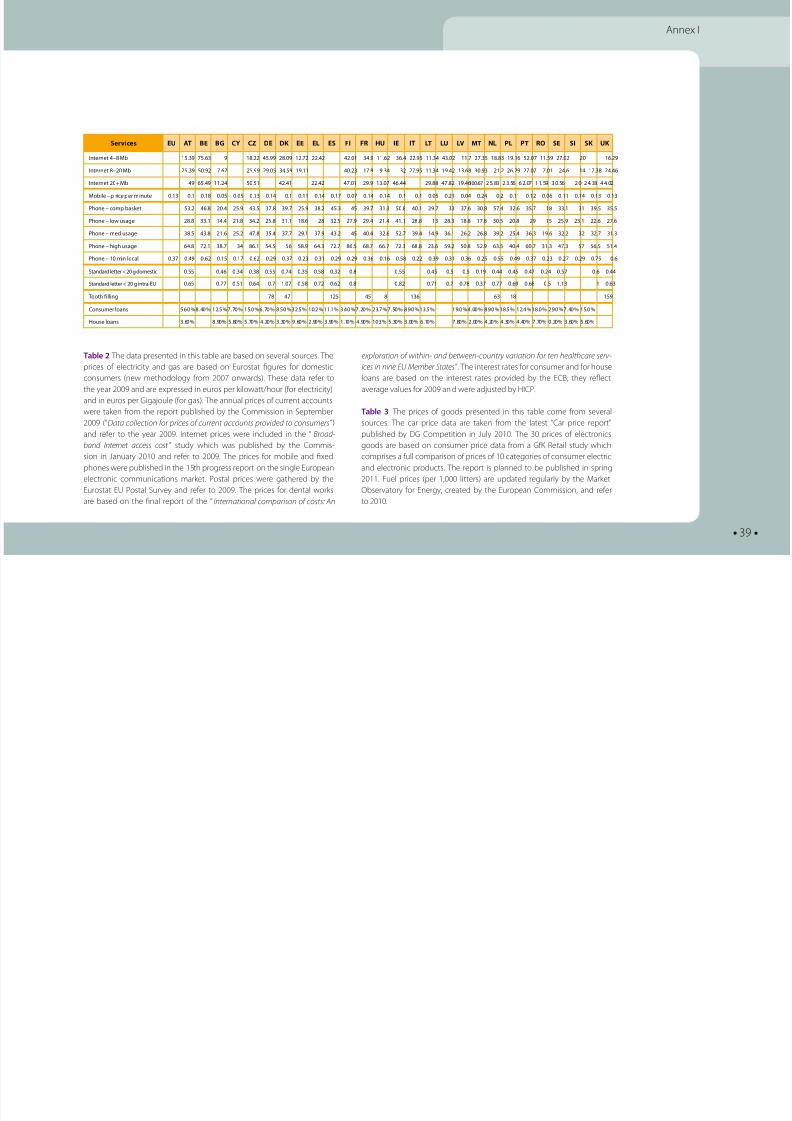
Table 2 The data presented in this table are based on several sources. The
prices o electricity and gas are based on Eurostat gures or domestic
consumers (new methodology rom 2007 onwards). These data reer to
the year 2009 and are expressed in euros per kilowatt/hour (or electricity)
and in euros per Gigajoule (or gas). The annual prices o current accounts
were taken rom the report published by the Commission in September
2009 (“Data collection or prices o current accounts provided to consumers”)
and reer to the year 2009. Internet prices were included in the “ Broad-
band Internet access cost ” study which was published by the Commis-
sion in January 2010 and reer to 2009. The prices or mobile and xed
phones were published in the 15th progress report on the single European
electronic communications market. Postal prices were gathered by the
Eurostat EU Postal Survey and reer to 2009. The prices or dental works
are based on the nal report o the “International comparison o costs: An
exploration o within- and between-country variation or ten healthcare serv-
ices in nine EU Member States”. The interest rates or consumer and or house
loans are based on the interest rates provided by the ECB; they reect
average values or 2009 an d were adjusted by HICP.
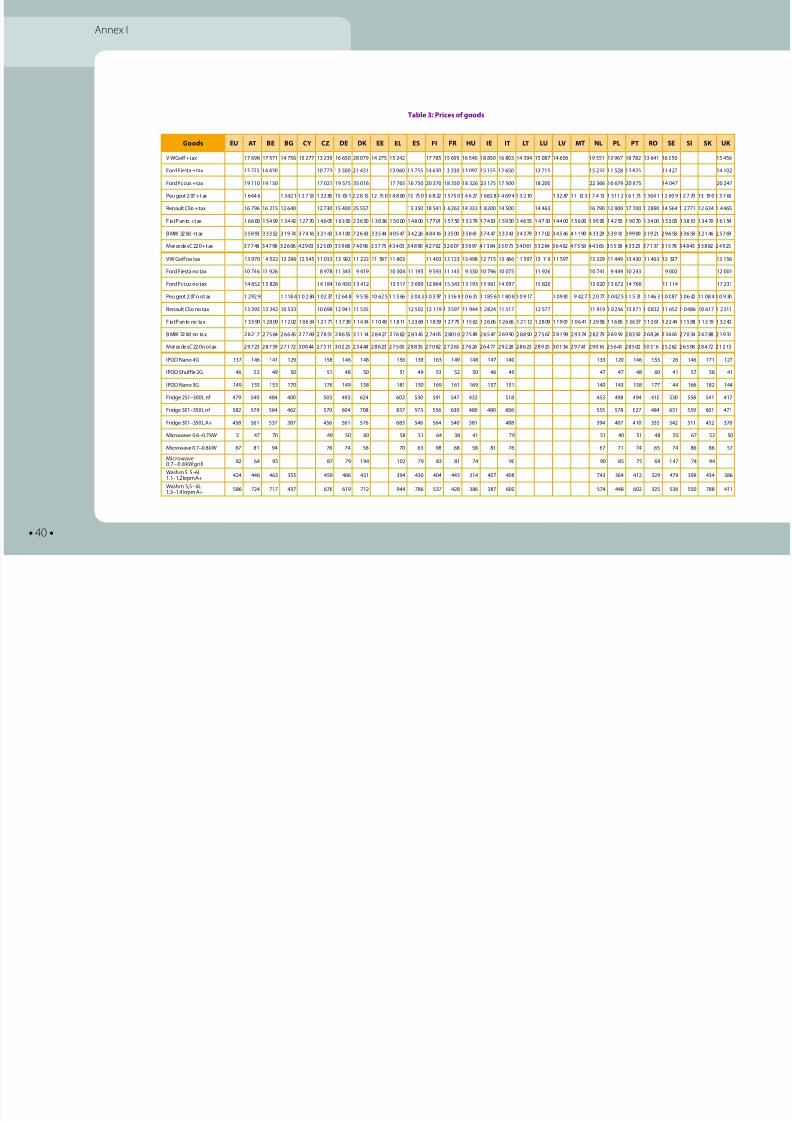
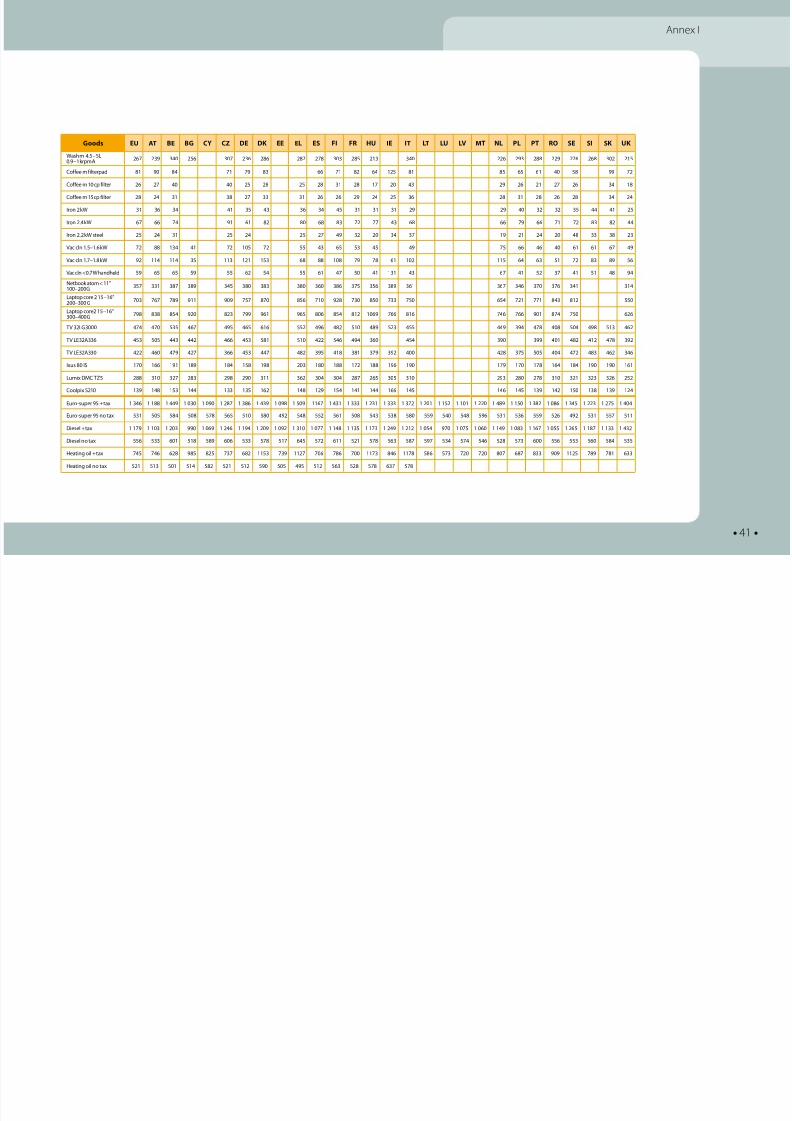
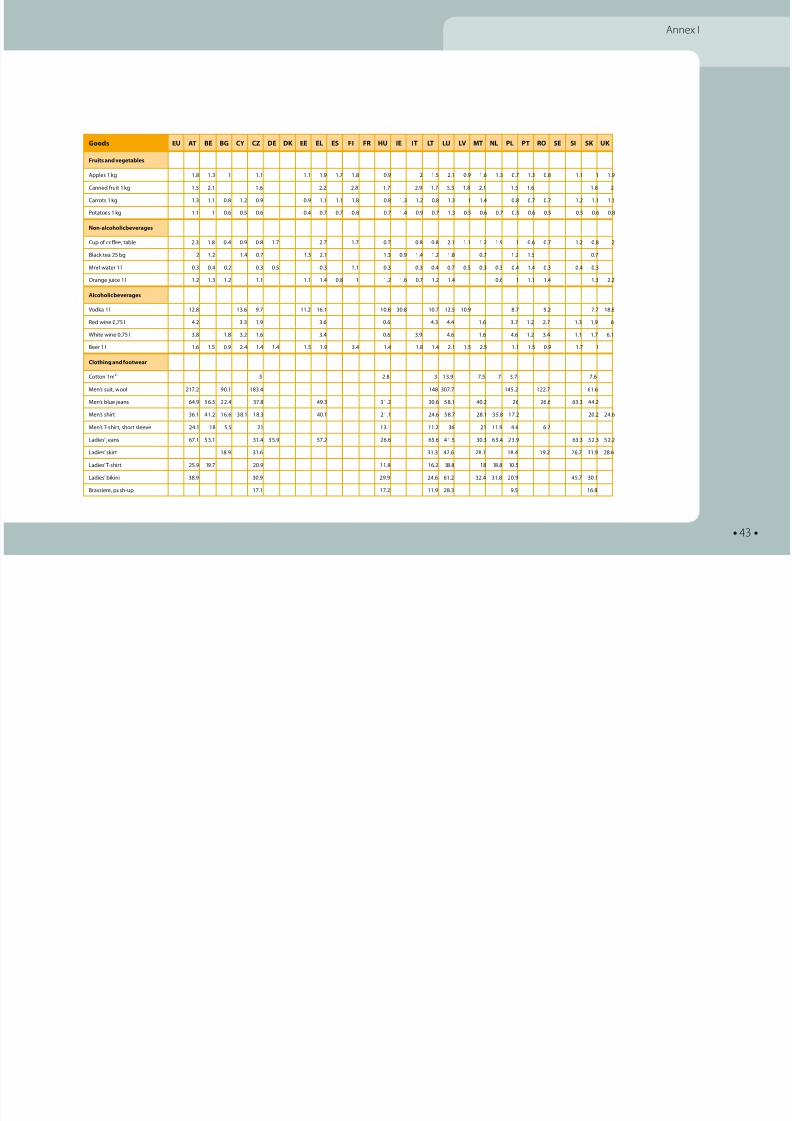
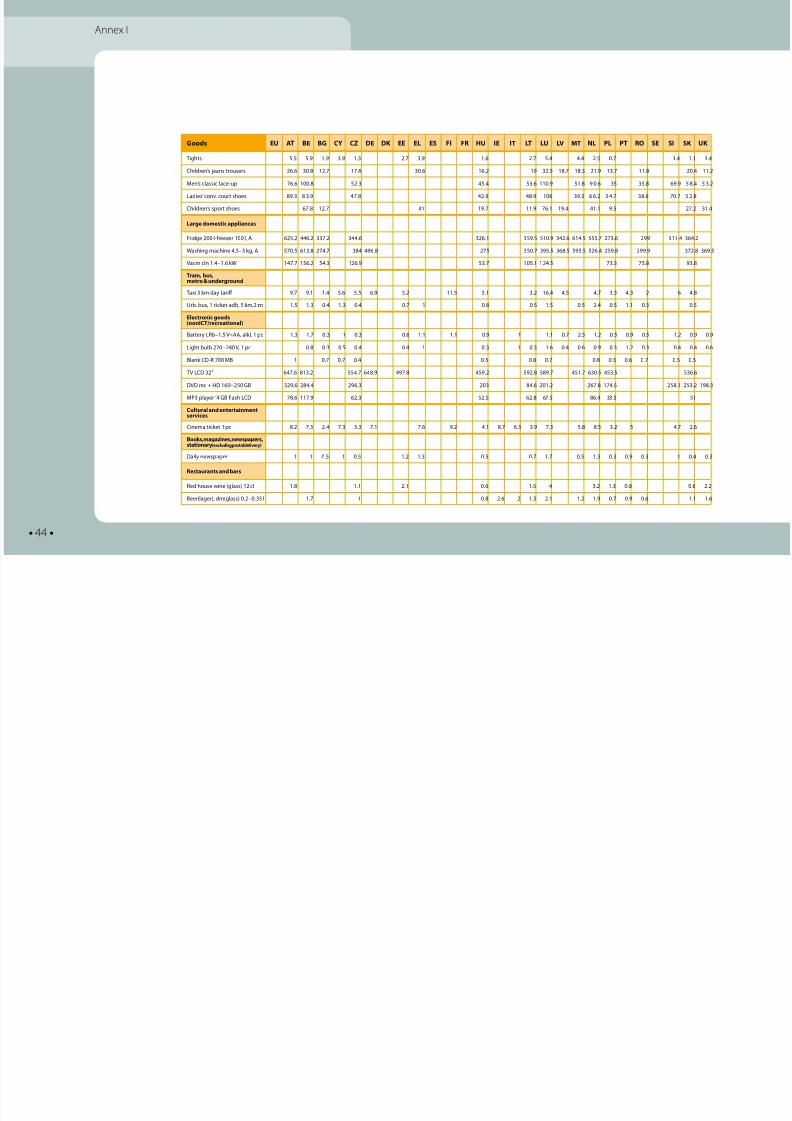
Table 3 The prices o goods presented in this table come rom several
sources. The car price data are taken rom the latest “Car price report”
published by DG Competition in July 2010. The 30 prices o electronics
goods are based on consumer price data rom a GK Retail study which
comprises a ull comparison o prices o 10 categories o consumer electric
and electronic products. The report is planned to be published in spring
2011. Fuel prices (per 1,000 litters) are updated regularly by the Market
Observatory or Energy, created by the European Commission, and reer
to 2010.
Services EU AT BE BG CY CZ DE DK EE EL ES FI FR HU IE IT LT LU LV MT NL PL PT RO SE SI SK UK
Internet 4 – 8 Mb 15.39 75.63 9 18. 45.99 8.09 1.7 .4 4.01 34.9 11.6 36.4 .95 11.34 43.0 11.7 7.35 18.83 19.16 5.07 11.59 7.0 0 16.9
Internet 8 – 0 Mb 5.39 50.9 7.67 5.99 9.05 34.59 19.11 40.3 17.9 9.34 3 7.95 11.34 19.4 13.68 30.93 1. 6.9 7.07 7.01 4.6 14 17.38 4.46
Internet 0+ Mb 49 65.49 11.4 50.51 4.41 .4 47.01 9.9 13.07 46.44 9.88 47.8 19.46 100.67 5. 83 3. 56 6 . 07 1 1. 59 3 0. 56 0 4. 38 4 4. 0
Mobile – p rice per minute 0.13 0.1 0.18 0.05 0.05 0.13 0.14 0.1 0.11 0.14 0.17 0.07 0.14 0.14 0.1 0.1 0.05 0.1 0.04 0.4 0. 0.11 0.1 0.06 0.11 0.14 0.13 0.13
Phone – comp basket 53. 46.8 0.4 5.9 43.5 37.8 39.7 5.9 38. 45.3 45 39.7 31.3 50.8 40.1 9.7 33 37.6 30.8 57.4 3.6 35.7 18 33.1 31 39.5 35.5
Phone – low usage 8.8 33.1 14.4 1.8 34. 5.8 31.1 18.6 8 3.5 7.9 9.4 1.4 41.1 8.8 13 8.3 18.8 17.8 30.5 0.8 9 15 5.9 3.1 .6 7.6
Phone – med usage 38.5 43.8 1.6 5. 47.8 35.4 37.7 9.1 37.9 43. 45 40.4 3.6 5.7 39.4 14.9 36.1 6. 6.8 39. 5.4 36.3 19.6 3. 3 3.7 31.3
Phone – high usage 64.8 7.1 38.7 34 86.1 54.5 56 58.9 64.3 7.7 86.5 68.7 66.7 7.3 68.8 3.6 59. 50.8 5.9 63.5 40.4 60.7 31.3 47.3 57 56.5 51.4
Phone – 10 min local 0.37 0.49 0.6 0.15 0.17 0.6 0.9 0.37 0.3 0.31 0.9 0.9 0.36 0.16 0.58 0. 0.39 0.31 0.36 0.5 0.55 0.49 0.37 0.3 0.7 0.9 0.75 0.6
Standard letter < 0 g domestic 0.55 0.46 0.34 0.38 0.55 0.74 0.35 0.58 0.3 0.8 0.55 0.45 0.5 0.5 0.19 0.44 0.45 0.47 0.4 0.57 0.6 0.44
Standard letter < 0 g intra-EU 0.65 0.77 0.51 0.64 0.7 1.07 0.58 0.7 0.6 0.8 0.8 0.71 0.7 0.78 0.37 0.77 0.69 0.68 0.5 1.13 1 0.63
Tooth illing 78 47 15 45 8 136 63 18 159
Consumer loans 5.60 %8.40 % 1.5 %7.70 % 15.0 %6.70 % 8.50 %3.5 % 10. %11.1 % 3.40 %7.0 % 3.7 %7.50 % 8.90 %13.5 % 19.0 %4.00 % 8.90 %18.5 % 1.4 %18.0 % .90 %7.40 % 15.0 %
House loans 3.60 % 8.90 % 5.80 % 5.70 % 4.0 % 3.30 % 9.60 % .90 % 3.90 % 1.10 % 4.90 % 10.3 % 5.30 % 3.00 % 6.10 % 7.80 % .00 % 4.0 % 4.30 % 4.40 % 7.70 % 0.0 % 3.60 % 5.60 %
8/6/2019 4th Edition Scoreboard En
http://slidepdf.com/reader/full/4th-edition-scoreboard-en 40/60
• 40 •
Goods EU AT BE BG CY CZ DE DK EE EL ES FI FR HU IE IT LT LU LV MT NL PL PT RO SE SI SK UK
V W Gol + tax 17 698 17 571 14 756 15 77 13 39 16 650 8 079 14 75 15 4 17 785 15 695 16 540 18 850 16 803 14 394 15 087 14 606 19 551 13 967 18 78 13 641 16 050 15 456
Ford Fiesta + tax 13 75 14 430 10 773 13 500 1 431 13 060 13 755 14 630 13 330 13 097 15 155 1 650 13 715 15 3 11 58 13 85 11 47 14 10
Ford Focus + tax 19 110 19 150 17 01 19 575 35 016 17 765 16 750 0 370 18 350 18 36 3 175 17 500 18 00 366 16 679 0 875 14 047 0 47
Peu geot 07 + t ax 1 6 44 6 1 3 4 1 1 7 53 1 85 15 05 1 8 15 1 75 0 1 4 8 80 15 75 0 1 6 8 1 5 75 0 1 4 6 7 1 6 8 8 1 4 69 4 1 3 10 1 3 87 11 1 3 1 7 4 13 1 3 11 1 6 1 73 1 3 64 1 1 60 9 1 7 70 13 19 0 1 3 7 65
Renault Clio + tax 16 796 16 15 1 640 1 730 15 400 5 557 15 350 18 541 1 6 6 14 333 1 8 00 14 500 14 463 16 790 1 900 17 700 1 890 14 564 1 771 1 634 1 4 465
F ia t P un to + t ax 1 6 6 00 1 5 4 99 1 3 4 4 1 7 70 1 4 6 05 1 6 3 50 3 6 50 1 3 0 38 1 5 0 00 1 4 8 00 1 7 7 01 1 5 7 50 1 5 3 79 1 7 4 53 1 5 9 50 1 4 6 55 1 4 7 30 1 4 4 00 1 5 6 00 1 9 5 95 1 4 55 1 9 0 70 1 3 4 00 1 5 3 05 1 3 8 10 1 3 4 70 1 6 1 54
B MW 3 0d + t ax 3 5 8 93 3 3 3 5 3 1 9 74 3 7 4 16 3 3 1 43 3 4 1 00 7 6 43 3 3 5 44 4 0 5 47 3 4 6 4 8 4 16 3 3 5 00 3 5 8 61 3 7 4 47 3 3 3 43 3 4 3 79 3 1 7 0 3 4 5 46 4 1 1 90 4 3 3 9 3 3 9 10 3 9 9 00 3 1 9 1 9 6 58 3 3 6 58 3 1 46 5 7 69
Mercedes C0 + tax 37 748 34 798 3 606 4 903 3 500 35 968 74 096 33 775 43 403 34 890 4 76 3 607 35 997 41 384 35 073 34 061 33 64 36 46 47 558 44 365 35 538 43 33 37 137 31 578 34 843 33 88 4 95
VW Gol no tax 13 970 14 5 1 96 1 545 11 033 13 99 11 11 597 11 803 11 403 13 13 13 498 1 715 13 666 11 597 13 119 11 597 13 39 11 449 13 430 11 463 1 337 13 156
Ford Fiesta no tax 10 746 11 96 8 978 11 345 9 419 10 304 11 195 9 593 11 145 9 330 10 796 10 075 11 96 10 741 9 449 10 43 9 00 1 001
Ford Focus no tax 14 65 15 86 14 184 16 450 13 41 13 517 13 690 1 864 15 343 13 193 15 961 14 097 15 86 15 00 13 67 14 766 11 114 17 31
Peu geot 07 n o t ax 1 9 9 1 1 18 4 1 0 84 1 0 37 1 64 8 9 5 55 10 6 5 1 1 5 66 13 04 3 1 0 3 97 1 3 16 9 1 0 6 31 1 1 85 6 1 1 80 8 1 0 9 17 1 0 9 81 9 4 7 1 0 77 1 0 4 5 1 1 5 31 1 1 46 3 1 0 087 1 0 6 4 11 08 4 1 0 9 30
Renault Clio no tax 13 393 13 34 10 533 10 698 1 941 11 535 1 50 1 119 1 3 597 11 944 1 84 11 517 1 577 11 919 1 0 56 13 871 1 0 83 11 65 1 0 486 10 617 1 311
F ia t P un to no ta x 1 3 5 90 1 8 09 1 1 0 1 0 6 34 1 1 71 1 3 7 39 1 1 4 34 1 1 0 49 1 1 8 11 1 3 69 1 1 8 59 1 7 75 1 1 5 6 1 6 06 1 6 65 1 1 1 1 8 09 1 1 9 01 1 0 6 41 1 9 58 1 1 6 85 1 3 6 57 1 1 61 1 44 1 1 5 08 1 1 3 19 1 3 4
B MW 3 0d no ta x 8 17 7 5 64 6 6 45 7 7 69 7 8 51 8 6 55 3 1 1 14 8 4 7 7 6 8 8 3 45 7 4 05 8 01 0 7 5 89 6 5 47 6 9 90 8 8 90 7 5 67 8 1 99 9 3 74 8 79 6 9 59 8 3 9 6 8 4 3 6 63 7 0 34 6 7 88 1 9 31
Mercedes C0 no tax 9 73 8 759 7 17 30 044 7 311 30 5 3 448 8 63 7 505 8 835 7 08 7 63 7 66 6 477 9 8 8 63 8 95 30 134 9 741 9 016 5 641 8 50 30 316 5 6 6 598 8 47 1 13
IPOD Nano 4G 137 146 141 19 158 146 148 156 139 163 149 148 147 140 133 10 146 153 16 146 171 17
IPOD Shule G 46 5 49 50 51 48 50 51 49 53 5 50 46 49 47 47 48 60 41 57 58 41
IPOD Nano 3G 149 155 153 170 176 149 158 181 150 169 161 169 157 151 140 143 158 177 144 166 18 144
Fridge 51 – 300 L n 479 540 484 400 503 493 64 60 530 591 547 43 518 453 498 494 410 530 558 541 417
Fridge 301 – 350 L n 58 579 564 46 570 604 708 837 573 556 630 480 480 606 555 578 67 484 631 559 601 471
Fridge 301 – 350 L A+ 458 561 537 387 456 561 576 683 546 564 540 381 488 394 407 410 335 54 511 45 370
Microwave 0.6–0.7 kW 51 47 70 49 50 60 58 51 64 38 41 79 51 40 51 48 55 67 5 50
Microwave 0.7 – 0.8 kW 67 81 94 76 74 58 70 63 98 68 58 81 76 67 71 74 65 74 86 86 57
Microwave0.7 – 0.8 kW grill 8 64 93 87 79 194 10 79 83 81 74 90 90 85 75 69 147 74 94
Wash m 5. 5 –6L1.1– 1. krpm A+ 44 446 463 355 459 486 431 394 430 404 443 314 407 408 743 364 41 39 479 399 434 386
Wash m 5,5 – 6L1.3 –1.4 krpm A+ 586 74 717 437 676 619 71 944 786 537 48 386 387 600 574 448 60 35 536 550 788 411
Table 3: Prices o goods
Annex I
A I
8/6/2019 4th Edition Scoreboard En
http://slidepdf.com/reader/full/4th-edition-scoreboard-en 41/60
• 41 •
Goods EU AT BE BG CY CZ DE DK EE EL ES FI FR HU IE IT LT LU LV MT NL PL PT RO SE SI SK UKWash m 4.5 – 5L0.9 – 1 krpm A 67 39 340 56 307 36 86 87 78 303 85 13 340 6 93 88 9 76 68 30 15
Coee m ilterpad 81 90 84 71 79 83 66 71 8 64 15 81 85 65 61 40 58 99 7
Coee m 10 cp ilter 6 7 40 40 5 8 5 8 31 8 17 0 43 9 6 1 7 6 34 18
Coee m 15 cp ilter 8 4 31 38 7 33 31 6 6 9 4 5 36 8 31 8 6 8 34 4
Iron kW 31 36 34 41 35 43 36 34 45 31 31 31 9 9 40 3 3 35 44 41 5
Iron .4 kW 67 66 74 91 61 8 80 68 83 7 77 43 68 66 79 66 71 7 83 8 44
Iron . kW steel 5 4 31 5 4 5 7 49 3 0 34 37 19 1 4 0 48 33 38 3
Vac cln 1.5 – 1.6 kW 7 88 134 41 7 105 7 55 43 65 53 45 49 75 66 46 40 61 61 67 49
Vac cln 1.7 – 1.8 kW 9 114 114 35 113 11 153 68 88 108 79 78 61 10 115 64 63 51 7 83 89 56
Vac cln < 0.7 W handheld 59 65 65 59 55 6 54 55 61 47 50 41 131 43 67 41 5 37 41 51 48 94
Netbook atom < 11"100 – 00 G 357 331 387 389 345 380 383 380 360 386 375 356 389 361 367 346 370 376 341 314
Laptop core 15–16"00–300 G 703 767 789 911 909 757 870 856 710 98 730 850 733 750 654 71 771 843 81 550
Laptop core 15–16"300– 400 G 798 838 854 90 83 799 961 965 806 854 81 1069 766 816 746 766 901 874 750 66
TV 3LG3000 474 470 535 467 495 465 616 55 496 48 510 489 53 455 449 394 478 408 504 498 513 46
TV LE3A336 453 505 443 44 466 453 581 510 4 546 494 360 454 390 399 401 48 41 478 39
TV LE3A330 4 460 479 47 366 453 447 48 395 418 381 379 39 400 48 375 505 404 47 483 46 346
Ixus 80 IS 170 166 191 189 184 158 198 03 180 188 17 188 196 190 179 170 178 164 184 190 190 161
Lumix DMC TZ5 88 310 37 83 98 90 311 36 304 304 87 65 305 310 93 80 78 310 31 33 36 5
Coolpix S10 139 148 153 144 133 135 16 148 19 154 141 144 166 145 146 145 139 14 150 138 139 14
Euro-super 95 + tax 1 346 1 188 1 449 1 030 1 090 1 87 1 386 1 439 1 098 1 509 1167 1 431 1 333 1 31 1 333 1 37 1 01 1 15 1 101 1 0 1 489 1 150 1 38 1 086 1 345 1 3 1 75 1 404
Euro-super 95 no tax 531 505 584 508 578 565 510 580 49 548 55 561 508 543 538 580 559 540 548 596 531 536 559 56 49 531 557 511
Diesel + tax 1 179 1 103 1 03 990 1 069 1 46 1 194 1 09 1 09 1 310 1 077 1 148 1 135 1 173 1 49 1 1 1 054 970 1 075 1 060 1 149 1 083 1 167 1 055 1 65 1 187 1 133 1 43
Diesel no tax 556 533 601 518 589 606 533 578 517 645 57 611 51 578 563 587 597 534 574 546 58 573 600 556 553 560 584 535
Heating oil + tax 745 746 68 985 85 737 68 1153 739 117 706 786 700 1173 846 1178 586 573 70 70 807 687 833 909 115 789 781 633
Heating oil no tax 51 513 501 514 58 51 51 590 505 495 51 563 58 578 637 578
Annex I
A I
8/6/2019 4th Edition Scoreboard En
http://slidepdf.com/reader/full/4th-edition-scoreboard-en 42/60
• 42 •
Goods EU AT BE BG CY CZ DE DK EE EL ES FI FR HU IE IT LT LU LV MT NL PL PT RO SE SI SK UK
Bread and cereals
Long rice 1 kg . 3 1.5 . 1.4 1.5 .7 1.4 .5 1. .1 1.3 .6 1.7 .8 1 1 1.7 1.6 3.3
Wheat lour 1 kg 1 0.8 0.5 1.3 0.4 1.3 0.8 0.6 0.4 0.9 0.7 0.7 0.9 0.7 0.9 1.1 0.4 0.8 0.6 1 0.4 0.8
Loa white bread 1 kg 4.8 .5 0.6 1.8 0.7 .1 .7 3.3 0.9 1.7 .6 1.5 3.4 1.7 1.1 1.4 0.8 0.9 1.9 1.3 1.6
Spaghetti 1 kg .1 1.1 .6 1.8 .3 .1 .4 1.5 .1 .4 1.9 1.6 1.3 1.3 .5 .1 1.7
Meat
Minced bee 1 kg 8.9 3. 3.1 9. 9.1 3.5 7.9 5.6 5.6 .6 3.7 7
Pork cutlet escalope 1 kg 9.3 7.5 4.1 5.5 1.4 4.5 8.1 4.1 9. 5.1 3.5 7.7 3 5.5 5.4 5. 4.
Whole chicken 1 kg 4. 4 .3 3.5 . .5 3.7 .8 .6 4 4. .6 4.1 .8 .5 1.6 .3 .3 3.3 .3 3.4
Sausage, Frank./Wien 1 kg 4.5 7.1 3.4 7.3 9.5 4.3 3.4 5.7 3.6 6 3.1Sausage, salami 1 kg 17.9 15.7 6. 6.4 14.6 11.7 11.1 14.7 10.5 7.3
Food other
Tinned pink tuna 1 kg 8.1 9.7 6.9 8.8 10.1 13.4 5.6 7.7 5.5 8.7 6.3 7.6
Fresh milk, unsk. 1l 0.9 0.8 1. 0.6 0.7 1.1 0.9 0.9 0.7 1.1 1.4 0.7 1.1 0.7 0.7 1 0.6 0.8 1. 0.8 0.6 0.9
Natural yoghurt 1 kg .6 1 1.5 3.3 1.8 4.5 3.1 1.6 0.7 1.4 .8
Fruit yoghurt 1 kg .9 3. 1.9 . .4 1.9 .8 4 1.6 1.6 3.1 .3 0.4
Cheese Camembert 1 kg 8.7 7. 7.4 11.1 1.6 7.7 8.5
Cheese Gouda 1 kg 7.8 7.9 4. 10.9 5.7 6 3.6 8
Chicken eggs 10 pc 3.4 1.1 1 .6 1.3 1.8 1.1 3.1 1.9 1. .4 1.4 1.1 1.8 1 1.3 1.1 1.5 1.1 3
Butter 50 g 1.3 1.4 1.1 .1 0.9 .8 1. 1.7 1.3 1. 1.8 1.4 1.5 1. 0.9 1.6 1.6 1.4 1.
Olive oil 1 l 7.7 6 .7 5.3 10 5.5 .9 9.1 5.3 6 .7 8 5.6 8.5 4
Vegetable oil 1 l 3. .1 1. 1.3 .5 3. 1.5 3.3 .3 1.4 1.5 . 1.9
White sugar 1 kg 1 0.9 0.8 1 0.7 0.9 0.8 0.9 1.1 0.8 1 1 0.9 1.1 1 1 0.8 0.7 0.9 0.9 0.8 0.9 1.1
Jam 1 kg 4.6 3 .4 3 4 .1 3 .7 3 .7 4 4 . 3 .3 5 1. .3 .7 5 .8 3 .1 4 3 .3
Milk chocolate 1 kg 8.5 9 6.9 8. 8.4 9.7 9.4 8 1. 7. 9.6 8.4 7.8
Ice cream 1 l 3 3. .1 5.4 6.4 .5 4.9 1.6 3.7 6.6 . 4. .1 3. .1 3. 4. 3.6 1.4 .3
Tomato ketchup 1 kg .1 1.5 1.6 .1 3.8 3.1 3. 1.8 1.4 3 .5 . .7 .6 .8 3.3
Table 4: Eurostat prices
Annex I
Anne I
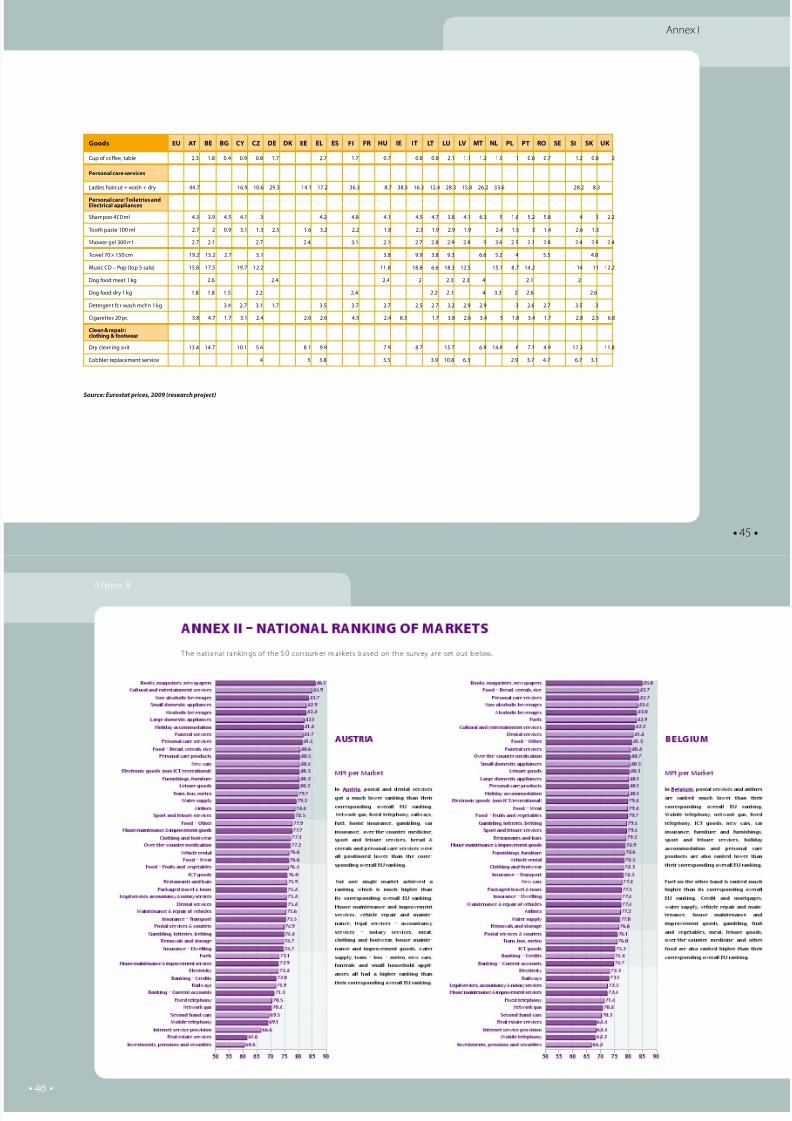
8/6/2019 4th Edition Scoreboard En
http://slidepdf.com/reader/full/4th-edition-scoreboard-en 43/60
• 43 •
Goods EU AT BE BG CY CZ DE DK EE EL ES FI FR HU IE IT LT LU LV MT NL PL PT RO SE SI SK UK
Fruits and vegetables
Apples 1 kg 1.8 1.3 1 1.1 1.1 1.9 1.7 1.8 0.9 1.5 .1 0.9 1.6 1.3 0.7 1.3 0.8 1.1 1 1.9
Canned ruit 1 kg 1.5 .1 1.6 . .8 1.7 .9 1.7 5.3 1.8 .1 1.5 1.6 1.8
Carrots 1 kg 1.3 1.1 0.8 1. 0.9 0.9 1.1 1.1 1.8 0.8 1.3 1. 0.8 1.3 1 1.4 0.8 0.7 0.7 1. 1.1 1.1
Potatoes 1 kg 1.1 1 0.6 0.5 0.6 0.4 0.7 0.7 0.8 0.7 1.4 0.9 0.7 1.3 0.5 0.6 0.7 0.5 0.6 0.5 0.5 0.6 0.8
Non-alcoholic beverages
Cup o coee, table .3 1.8 0.4 0.9 0.8 1.7 .7 1.7 0.7 0.8 0.8 .1 1.1 1. 1.9 1 0.6 0.7 1. 0.8
Black tea 5 bg 1. 1.4 0.7 1.3 .1 1.3 0.9 1.4 1. 1.8 0.7 1. 1.5 0.7
Mnrl water 1 l 0.3 0.4 0. 0.3 0.5 0.3 1.1 0.3 0.3 0.4 0.7 0.5 0.3 0.3 0.4 1.4 0.3 0.4 0.3
Orange juice 1 l 1. 1.3 1. 1.1 1.1 1.4 0.8 1 1. 1.6 0.7 1. 1.4 0.6 1 1.1 1.4 1.3 .
Alcoholic beverages
Vodka 1 l 1.8 13.6 9.7 11. 16.1 10.8 30.8 10.7 1.5 10.9 8.7 9. 7.7 18.6
Red wine 0,75 l 4. 3.3 1.9 3.6 0.6 4.3 4.4 1.6 3.7 1. .7 1.3 1.9 6
White wine 0,75 l 3.8 1.8 3. 1.6 3.4 0.6 3.9 4.6 1.6 4.6 1. 3.4 1.1 1.7 6.1
Beer 1 l 1.6 1.5 0.9 .4 1.4 1.4 1.5 1.9 3.4 1.4 1.8 1.4 .1 1.5 .5 1.1 1.5 0.9 1.7 1
Clothing and ootwear
Cotton 1m2 5 .8 3 13.9 7.5 7 3.7 7.6
Men’s suit, wool 17. 90.1 183.4 148 307.7 145. 1.7 161.6
Men’s blue jeans 64.9 56.5 .4 37.8 49.3 31. 30.6 58.1 40. 6 6.6 63.3 44.
Men’s shirt 36.1 41. 16.6 38.1 18.3 40.1 1.1 4.6 58.7 8.1 35.8 17. 0. 4.6
Men’s T-shirt, short sleeve 4.1 18 5.5 1 13.1 11. 36 1 11.9 4.6 6.7
Ladies’ jeans 67.1 53.1 31.4 35.9 57. 6.6 65.6 41.5 30.3 65.4 3.9 63.3 3.3 5.
Ladies’ skirt 18.9 31.6 31.3 4.6 8.1 18.4 19. 76.7 31.9 8.6
Ladies’T-shirt 5.9 19.7 0.9 11.8 16. 38.8 18 18.8 10.5
Ladies’ bikini 38.9 30.9 9.9 4.6 61. 3.4 31.8 0.9 45.7 30.1
Brassiere, push-up 17.1 17. 11.9 8.3 9.5 16.8
Annex I
Annex I
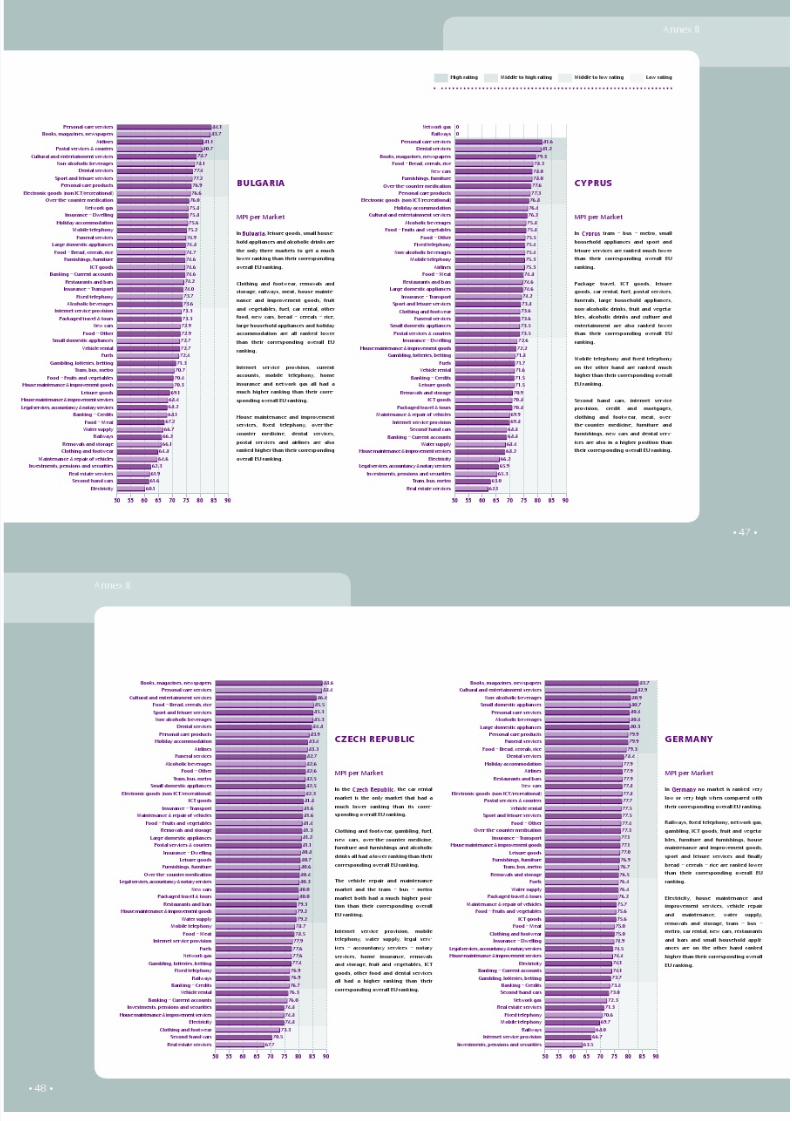
8/6/2019 4th Edition Scoreboard En
http://slidepdf.com/reader/full/4th-edition-scoreboard-en 44/60
• 44 •
Goods EU AT BE BG CY CZ DE DK EE EL ES FI FR HU IE IT LT LU LV MT NL PL PT RO SE SI SK UK
Tights 5.5 5.9 1.9 3.9 1.3 .7 3.9 1.6 .7 5.4 4.4 .5 0.7 3.4 1.1 3.4
Children’s jeans trousers 6.6 30.8 1.7 17.6 30.6 16. 19 3.5 18.7 18.3 1.9 13.7 11.8 0.4 11.
Men’s classic lace-up 76.6 100.8 5.3 45.4 53.6 110.9 51.8 9 0.6 35 35.8 69.9 5 8.4 5 3.
Ladies’ conv. court shoes 89.3 8 3.9 47.8 4.9 48.9 106 39.3 6 6. 3 4.7 38.6 70.7 5 .8
Children’s sport shoes 67.8 1.7 41 19.7 11.9 76.1 19.4 41.1 9.5 7. 31.4
Large domestic appliances
Fridge 00 l-reezer 100 l, A 65. 446. 337. 344.6 36.1 359.5 510.9 34.6 614.5 555.7 73.6 99 511.4 364.
Washing machine 4.5 – 5 kg, A 570.5 613.8 74.7 384 496.8 75 350.7 395.5 368.5 595.5 56.4 59.8 99.9 37.8 369.5
Vacm cln 1.4 – 1.6 kW 147.7 156. 54.3 16.9 53.7 105.1 14.5 73.3 75.8 93.8
Tram, bus,
metro & underground
Taxi 5 km day tari 9.7 9.1 1.4 5.6 5.5 6.9 5. 11.5 5.1 3. 16.4 4.5 4.7 3.3 4.3 6 4.8
Urb. bus, 1 ticket adlt, 5 km, zn 1.5 1.3 0.4 1.3 0.4 0.7 1 0.8 0.5 1.5 0.5 .4 0.5 1.1 0.3 0.5
Electronic goods(nonICT/recreational)
Battery LR6 – 1.5 V=AA, alkl, 1 pc 1.3 1.7 0.3 1 0.3 0.6 1.1 1.1 0.9 1 1.1 0.7 .5 1. 0.5 0.9 0.5 1. 0.9 0.9
Light bulb 0 – 40 V, 1 pc 0.8 0.3 0.5 0.4 0.4 1 0.3 1 0.3 1.6 0.4 0.6 0.9 0.3 1. 0.3 0.4 0.4 0.6
Blank CD-R 700 MB 1 0.7 0.7 0.4 0.5 0.8 0.7 0.8 0.3 0.6 0.7 0.5 0.5
TV LCD 3" 647.6 813. 554.7 648.9 497.8 459. 59.8 589.7 451.7 630.5 453.5 536.6
DVD rec + HD 160 – 50 GB 39.6 84.4 96.3 03 84.6 01. 67.8 174.5 58.1 53. 198.3
MP3 player ’4 GB lash LCD 78.6 117.9 6.3 5.5 6.8 67.5 86.4 33.5 51
Cultural and entertainmentservices
Cinema ticket 1 pc 8. 7.3 .4 7.3 3.3 7.1 7.6 9. 4.1 8.7 6.3 3.9 7.3 5.8 8.5 3. 5 4.7 .6
Books, magazines, newspapers,stationary(excludingpostaldelivery)
Daily newspaper 1 1 0.5 1 0.5 1. 1.3 0.5 0.7 1.7 0.5 1.3 0.3 0.9 0.3 1 0.4 0.3
Restaurants and bars
Red house wine (glass) 1 cl 1.8 1.1 .1 0.6 1.5 4 3. 1.3 0.8 0.6 .
Beer(lager), dm(glass) 0. – 0.35 l 1.7 1 0.8 .6 1.5 .1 1. 1.9 0.7 0.9 0.6 1.1 1.6
Annex I
Annex I
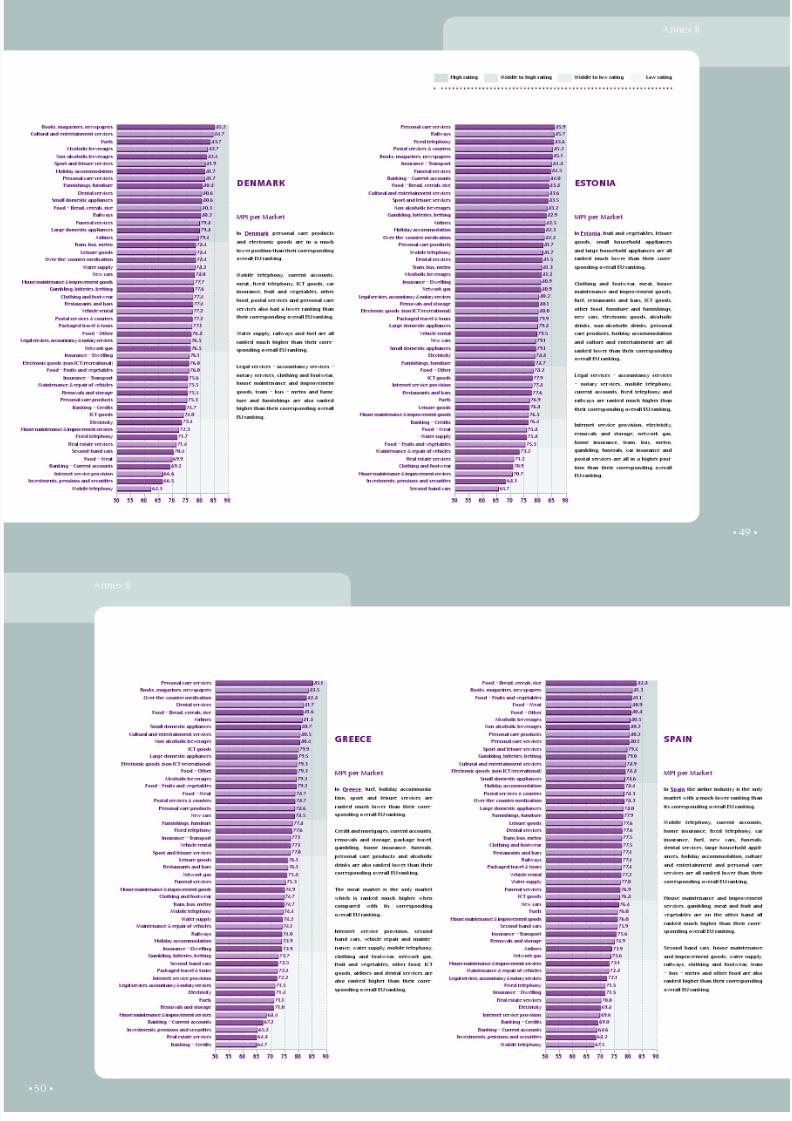
8/6/2019 4th Edition Scoreboard En
http://slidepdf.com/reader/full/4th-edition-scoreboard-en 45/60
• 45 •
Goods EU AT BE BG CY CZ DE DK EE EL ES FI FR HU IE IT LT LU LV MT NL PL PT RO SE SI SK UK
Cup o coee, table .3 1.8 0.4 0.9 0.8 1.7 .7 1.7 0.7 0.8 0.8 .1 1.1 1. 1.9 1 0.6 0.7 1. 0.8
Personal care services
Ladies haircut + wash + dry 44.7 16.9 10.6 9.3 14.1 17. 36.3 8.7 38.5 16.3 1.4 8.3 15.8 6. 33.6 8. 8.3
Personal care: Toiletries andElectrical appliances
Shampoo 400 ml 4.3 3.9 4.5 4.1 3 4. 4.8 4.1 4.5 4.7 3.8 4.1 6.3 5 1.8 5. 5.8 4 3 .
Tooth paste 100 ml .7 0.9 3.1 1.3 .5 1.6 3. . 1.8 .3 1.9 .9 1.9 .4 1.5 3 1.4 .6 1.3
Shower gel 300 ml .7 .1 .7 .4 3.1 .1 .7 .8 .9 .8 3 3.6 .5 .1 .8 .4 .9 .4
Towel 70 × 150 cm 19. 15. .7 5.1 3.8 9.9 3.8 9.3 6.6 5. 4 5.5 4.8
Music CD – Pop (top 5 sale) 15.8 17.5 19.7 1. 11.8 18.8 6.6 18.3 1.5 15.1 8.7 14. 14 11 1.
Dog ood meat 1 kg .6 .4 .4 .3 .3 4 .1 Dog ood dry 1 kg 1.8 1.8 1.5 . .4 . .1 4 3.3 .6 .6
Detergent or wash mchn 1 kg 3.4 .7 3.1 1.7 3.5 3.7 .7 .5 .7 3. .9 .9 3 .6 .7 3.5 3
Cigarettes 0 pc 3.8 4.7 1.7 3.1 .4 .6 .6 4.5 .4 8.3 1.7 3.8 .6 3.4 5 1.8 3.4 1.7 .8 .5 6.8
Clean & repair:clothing & ootwear
Dry cleaning suit 13.4 14.7 10.1 5.6 8.1 9.8 7.9 8.7 15.7 6.8 14.8 6 7.3 4.9 1.3 11.8
Cobbler replacement service 4 5 3.8 3.5 3.9 10.8 6.3 .9 3.7 4.7 6.7 3.1
Source: Eurostat prices, 2009 (research project)
Annex I
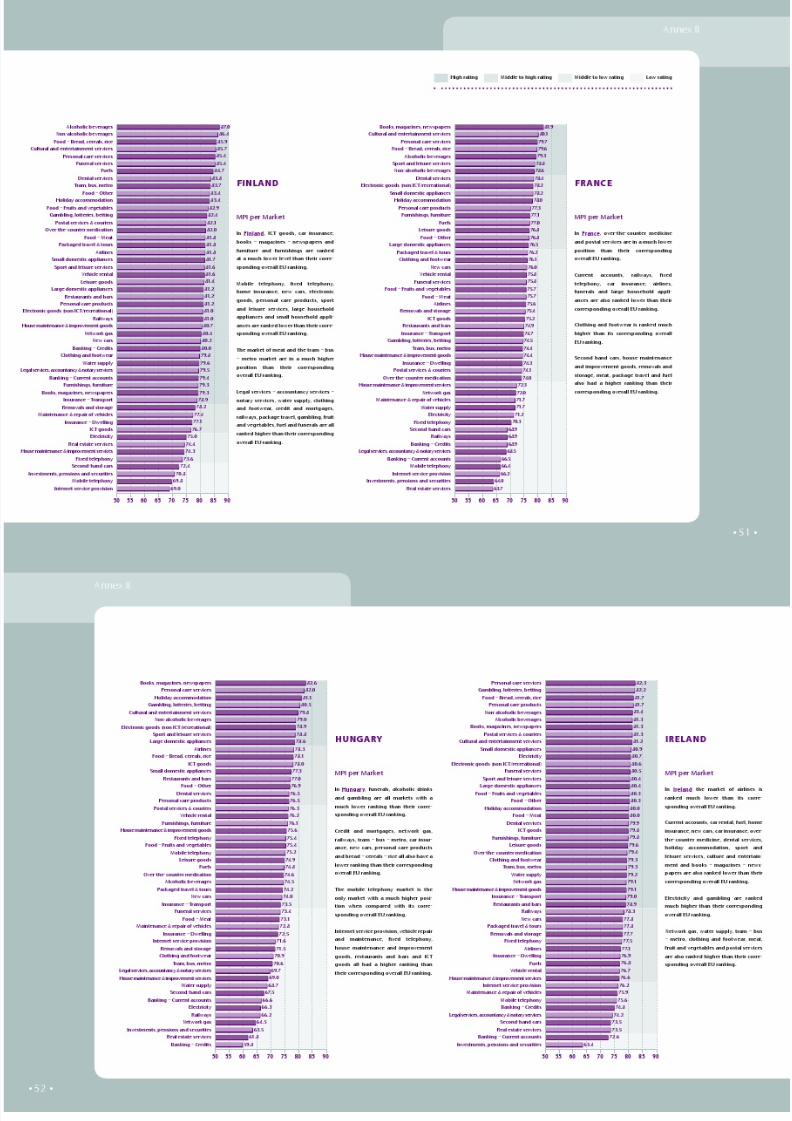
8/6/2019 4th Edition Scoreboard En
http://slidepdf.com/reader/full/4th-edition-scoreboard-en 46/60
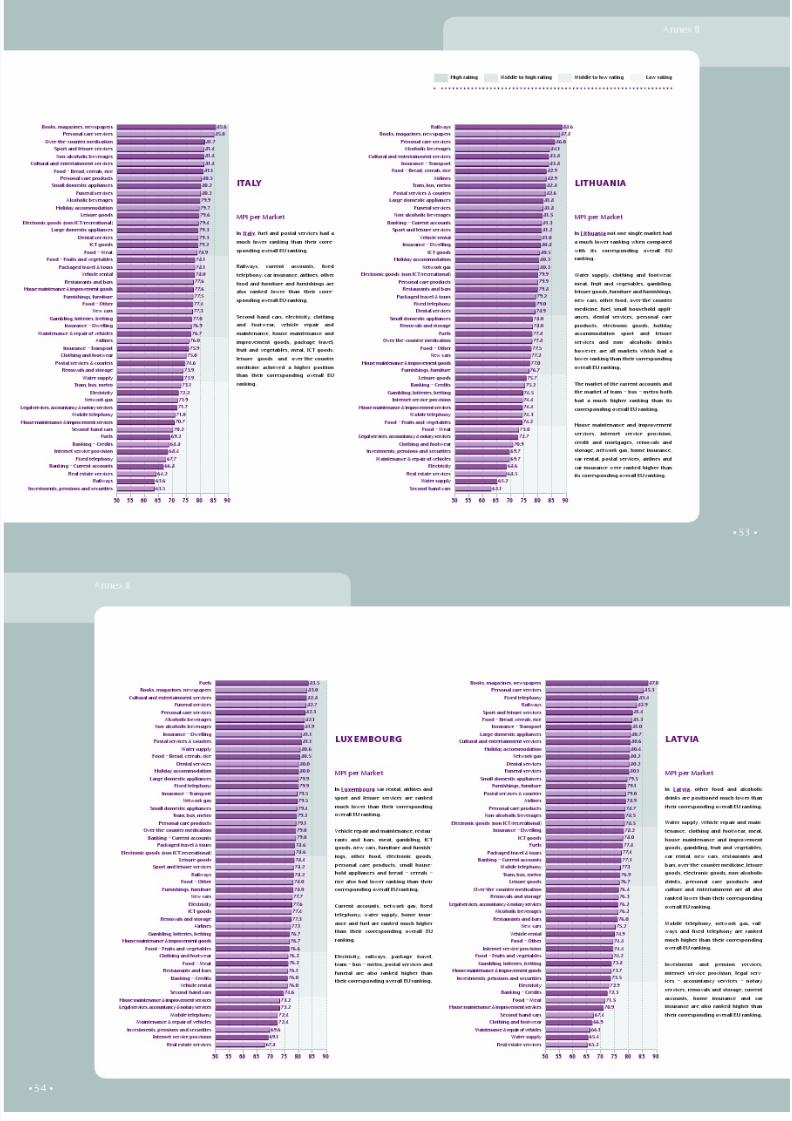
8/6/2019 4th Edition Scoreboard En
http://slidepdf.com/reader/full/4th-edition-scoreboard-en 47/60
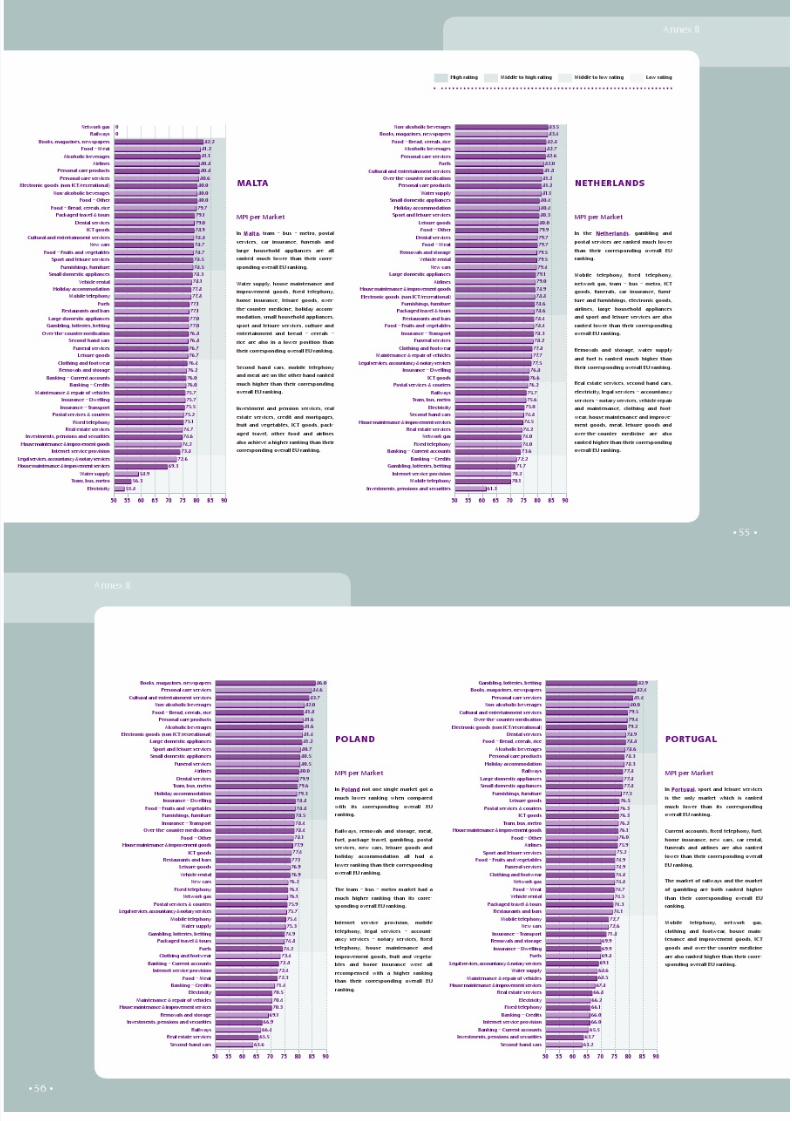
8/6/2019 4th Edition Scoreboard En
http://slidepdf.com/reader/full/4th-edition-scoreboard-en 48/60
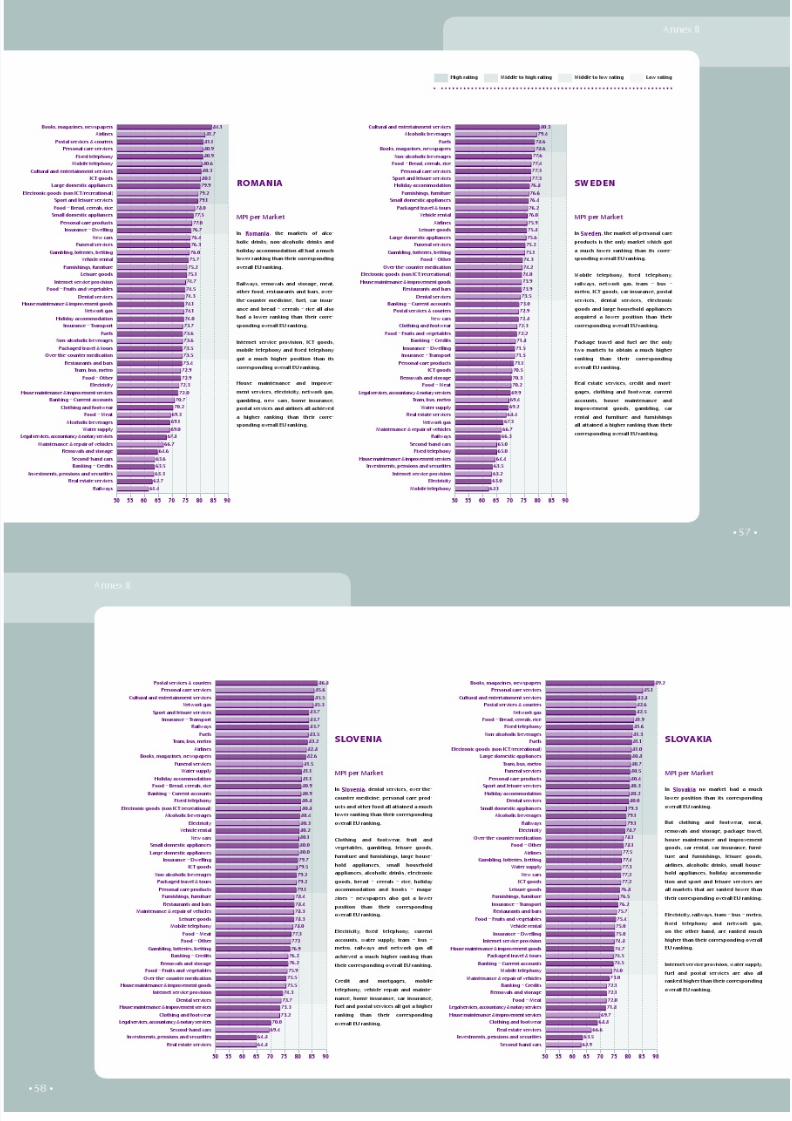
8/6/2019 4th Edition Scoreboard En
http://slidepdf.com/reader/full/4th-edition-scoreboard-en 49/60
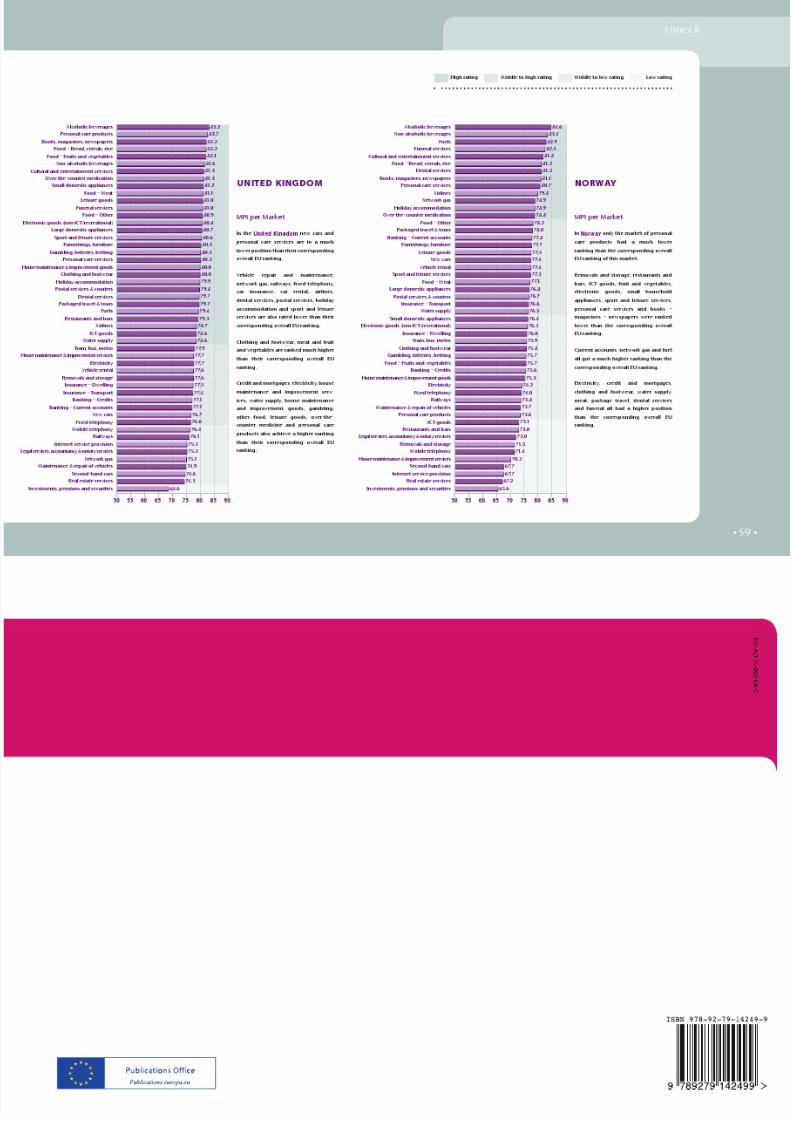
8/6/2019 4th Edition Scoreboard En
http://slidepdf.com/reader/full/4th-edition-scoreboard-en 50/60

8/6/2019 4th Edition Scoreboard En
http://slidepdf.com/reader/full/4th-edition-scoreboard-en 51/60

8/6/2019 4th Edition Scoreboard En
http://slidepdf.com/reader/full/4th-edition-scoreboard-en 52/60

8/6/2019 4th Edition Scoreboard En
http://slidepdf.com/reader/full/4th-edition-scoreboard-en 53/60

8/6/2019 4th Edition Scoreboard En
http://slidepdf.com/reader/full/4th-edition-scoreboard-en 54/60

8/6/2019 4th Edition Scoreboard En
http://slidepdf.com/reader/full/4th-edition-scoreboard-en 55/60

8/6/2019 4th Edition Scoreboard En
http://slidepdf.com/reader/full/4th-edition-scoreboard-en 56/60

8/6/2019 4th Edition Scoreboard En
http://slidepdf.com/reader/full/4th-edition-scoreboard-en 57/60

8/6/2019 4th Edition Scoreboard En
http://slidepdf.com/reader/full/4th-edition-scoreboard-en 58/60

8/6/2019 4th Edition Scoreboard En
http://slidepdf.com/reader/full/4th-edition-scoreboard-en 59/60

8/6/2019 4th Edition Scoreboard En
http://slidepdf.com/reader/full/4th-edition-scoreboard-en 60/60
N D -A O-1 0 - 0 0 2 -E N - C