Embed Size (px)
Citation preview
Table of Contents
UNITED STATESSECURITIES AND EXCHANGE COMMISSION
Washington, D.C. 20549
FORM 10-K☒ ANNUAL REPORT PURSUANT TO SECTION 13 OR 15(d) OF THE SECURITIES EXCHANGE ACT OF 1934
For the fiscal year ended December 31, 2020OR
☐ TRANSITION REPORT PURSUANT TO SECTION 13 OR 15(d) OF THE SECURITIES EXCHANGE ACT OF 1934For the transition period from _____ to_____
Commission file number: 001-37908
CAMPING WORLD HOLDINGS, INC.(Exact name of registrant as specified in its charter)
Delaware (State or other jurisdiction of incorporation or organization)
81-1737145 (I.R.S. Employer Identification No.)
250 Parkway Drive, Suite 270Lincolnshire, IL 60069
(Address of principal executive offices) (Zip Code)Telephone: (847) 808-3000
(Registrant’s telephone number, including area code)
Title of each class Name of each exchange on which registeredClass A Common Stock, Par Value $0.01 Per Share New York Stock Exchange
Securities registered pursuant to Section 12(b) of the Act:
Title of each class Trading Symbol(s) Name of each exchange on which registeredClass A Common Stock,
$0.01 par value per shareCWH New York Stock Exchange
Securities registered pursuant to Section 12(g) of the Act: NoneIndicate by check mark if the registrant is a well-known seasoned issuer, as defined in Rule 405 of the Securities Act. Yes ⌧ No ◻Indicate by check mark if the registrant is not required to file reports pursuant to Section 13 or Section 15(d) of the Exchange Act. Yes ◻ No ⌧Indicate by check mark whether the registrant (1) has filed all reports required to be filed by Section 13 or 15(d) of the Securities Exchange Act of 1934
during the preceding 12 months (or for such shorter period that the registrant was required to file such reports), and (2) has been subject to such filingrequirements for the past 90 days. Yes ⌧ No ◻
Indicate by check mark whether the registrant has submitted electronically every Interactive Data File required to be submitted pursuant to Rule 405 ofRegulation S-T (§232.405 of this chapter) during the preceding 12 months (or for such shorter period that the new registrant was required to submit suchfiles). Yes ⌧ No ◻
Indicate by check mark whether the registrant is a large accelerated filer, an accelerated filer, a non-accelerated filer, a smaller reporting company, or anemerging growth company. See the definitions of “large accelerated filer,” “accelerated filer,” “smaller reporting company,” and “emerging growth company” inRule 12b-2 of the Exchange Act. (Check one):Large accelerated filer ⌧ Accelerated filer ◻ Non-accelerated filer ◻ Smaller reporting company ☐ Emerging growth company ☐
If an emerging growth company, indicate by check mark if the registrant has elected not to use the extended transition period for complying with any new or revised financial accounting standards provided pursuant to Section 13(a) of the Exchange Act. ◻
Indicate by check mark whether the registrant has filed a report on and attestation to its management’s assessment of the effectiveness of its internal control over financial reporting under Section 404(b) of the Sarbanes-Oxley Act (15 U.S.C. 7262(b)) by the registered public accounting firm that prepared or issued its audit report. ☒
Indicate by check mark whether the registrant is a shell company (as defined in Rule 12b-2 of the Exchange Act). Yes ☐ No ⌧The aggregate market value of the voting and non-voting stock held by non-affiliates of the Registrant, as of June 30, 2020, the last business day of the
Registrant’s most recently completed second fiscal quarter, was approximately $885,097,196. Solely for purposes of this disclosure, shares of common stockheld by executive officers and directors of the Registrant as of such date have been excluded because such persons may be deemed to be affiliates.
As of February 22, 2021, the registrant had 43,746,433 shares of Class A common stock outstanding, 44,680,397 shares of Class B common stockoutstanding, and one share of Class C common stock outstanding.
DOCUMENTS INCORPORATED BY REFERENCEPortions of the registrant’s Proxy Statement relating to its 2021 Annual Meeting of Stockholders to be filed with the Securities and Exchange Commission
within 120 days after the end of the fiscal year ended December 31, 2020 are incorporated herein by reference in Part III.
Table of Contents
2
Camping World Holdings, Inc.Form 10-K
For the Fiscal Year Ended December 31, 2020
INDEX
PagePART I
Item 1 Business 7Item 1A Risk Factors 18Item 1B Unresolved Staff Comments 47Item 2 Properties 47Item 3 Legal Proceedings 48Item 4 Mine Safety Disclosures 48
PART IIItem 5 Market for Registrant’s Common Equity, Related Stockholder Matters and Issuer Purchases of
Equity Securities 52Item 6 Selected Financial Data 54Item 7 Management’s Discussion and Analysis of Financial Condition and Results of Operations 58Item 7A Quantitative and Qualitative Disclosures About Market Risk 87Item 8 Financial Statements and Supplementary Data 89Item 9 Changes in and Disagreements with Accountants on Accounting and Financial Disclosure 145Item 9A Controls and Procedures 145Item 9B Other Information 148
PART IIIItem 10 Directors, Executive Officers and Corporate Governance 149Item 11 Executive Compensation 149Item 12 Security Ownership of Certain Beneficial Owners and Management and Related Stockholder
Matters149
Item 13 Certain Relationships and Related Transactions, and Director Independence 150Item 14 Principal Accountant Fees and Services 150
PART IVItem 15 Exhibits and Financial Statement Schedules 151Item 16 Form 10-K Summary 155Signatures 156
Table of Contents
3
Summary of Principal Risk Factors
We operate in a rapidly changing environment that involves a number of risks, some of which are beyond our control.In evaluating our company, you should consider carefully this summary of risks and uncertainties described belowtogether with the other information included in this Annual Report on Form 10-K (“Form 10-K”), including ourconsolidated financial statements and related notes included in Part II, Item 8, “Financial Statements andSupplementary Data” in this Form 10-K. The occurrence of any of the following risks may materially and adverselyaffect our business, financial condition, results of operations and future prospects:
● The COVID-19 pandemic has had, and could have in the future, certain negative impacts on our business,and such impacts may have a material adverse effect on our results of operations, financial condition andcash flows.
● We may not successfully execute or achieve the expected benefits of our 2019 Strategic Shift (as definedbelow) and this program may result in further asset impairment charges and adversely affect the Company’sbusiness.
● Our business is affected by the availability of financing to us and our customers.
● Fuel shortages, or higher prices for fuel, could have a negative effect on our business.
● Our success depends to a significant extent on the well-being, as well as the continued popularity andreputation for quality, of our manufacturers, particularly Thor Industries, Inc. and Forest River, Inc.
● Our business model is impacted by general economic conditions in our markets, and ongoing economic andfinancial uncertainties could cause a decline in consumer spending that could adversely affect our business,financial condition and results of operations.
● Changes in consumer preferences for our products or our failure to gauge those preferences could lead toreduced sales and increased cost of sales and selling, general and administrative expenses.
● Competition in the market for services, protection plans, products and resources targeting the RV lifestyle orRV enthusiast could reduce our revenue and profitability
● Our expansion into new, unfamiliar markets, businesses, product lines or categories presents increased risksthat may prevent us from being profitable in these new markets, businesses, product lines or categories.Delays in opening or acquiring new retail locations could have a material adverse effect on our business,financial condition and results of operations.
● Unforeseen expenses, difficulties, and delays encountered in connection with acquisitions and new storeopenings could inhibit our growth and negatively impact our profitability.
● Failure to maintain the strength and value of our brands could have a material adverse effect on ourbusiness, financial condition and results of operations.
● Our failure to successfully order and manage our inventory to reflect consumer demand in a volatile marketand anticipate changing consumer preferences and buying trends has and may continue to have an adverseeffect on our business, financial condition and results of operations.
● Our same store revenue may fluctuate and may not be a meaningful indicator of future performance.
● Our business is seasonal and this leads to fluctuations in sales and revenues.
● Our ability to operate and expand our business and to respond to changing business and economicconditions will depend on the availability of adequate capital.
● Our Senior Secured Credit Facilities and our Floor Plan Facility contain restrictive covenants that may impairour ability to access sufficient capital and operate our business.
Table of Contents
4
● We primarily rely on five fulfillment and distribution centers for our retail, e-commerce and catalogbusinesses, and, if there is a natural disaster or other serious disruption at any such facility, we may beunable to deliver merchandise effectively to our stores or customers.
● Natural disasters, whether or not caused by climate change, unusual weather conditions, epidemicoutbreaks, terrorist acts or political events could disrupt our business and result in lower sales and otherwiseadversely affect our financial performance.
● We depend on our relationships with third-party providers of services, protection plans, products andresources and a disruption of these relationships or these providers’ operations could have an adverse effecton our business and results of operations.
● Because certain of the products that we sell are manufactured abroad, we may face delays, new or increasedtariffs, increased cost or quality control deficiencies in the importation of these products, which could reduceour net sales and profitability.
● A portion of our net income is from financing, insurance and extended service contracts, which depend onthird-party lenders and insurance companies. We cannot assure you third-party lending institutions willcontinue to provide financing for RV purchases.
● If we are unable to retain senior executives and attract and retain other qualified employees, our businessmight be adversely affected.
● We are subject to risks associated with leasing substantial amounts of space.
● Our private brand offerings expose us to various risks.
● We could incur impairment charges for goodwill, intangible assets or other long-lived assets.
● Our business is subject to numerous federal, state and local regulations and litigation risks.
● We are subject to risks associated with our organizational structure.
● There are risks associated with ownership of our Class A common stock.
BASIS OF PRESENTATION
As used in this Form 10-K, unless the context otherwise requires, references to:
● “we,” “us,” “our,” the “Company,” “Camping World,” “Good Sam” and similar references refer toCamping World Holdings, Inc., and, unless otherwise stated, all of its subsidiaries, including CWGSEnterprises, LLC, which we refer to as “CWGS, LLC” and, unless otherwise stated, all of itssubsidiaries.
● "Active Customer" refers to a customer who has transacted with us in any of the eight most recentlycompleted fiscal quarters prior to the date of measurement. Unless otherwise indicated, the date ofmeasurement is December 31, 2020, our most recently completed fiscal quarter.
● “Continuing Equity Owners” refers collectively to ML Acquisition, funds controlled by CrestviewPartners II GP, L.P. and the Former Profit Unit Holders and each of their permitted transferees thatown common units in CWGS, LLC and who may redeem at each of their options their common unitsfor, at our election (determined solely by our independent directors within the
Table of Contents
5
meaning of the rules of the New York Stock Exchange who are disinterested), cash or newly-issuedshares of our Class A common stock.
● “Crestview” refers to Crestview Advisors, L.L.C., a registered investment adviser to private equityfunds, including funds affiliated with Crestview Partners II GP, L.P.
● “CWGS LLC Agreement” refers to CWGS, LLC’s amended and restated limited liability companyagreement, as amended.
● “Former Equity Owners” refers to those Original Equity Owners controlled by Crestview Partners IIGP, L.P. that have exchanged their direct or indirect ownership interests in CWGS, LLC for shares ofour Class A common stock in connection with the consummation of our initial public offering (“IPO”).
● “Former Profit Unit Holders” refers collectively to our named executive officers (excluding MarcusLemonis and Melvin Flanigan), Andris A. Baltins and K. Dillon Schickli, who are members of ourBoard of Directors, and certain other current and former non-executive employees and formerdirectors, in each case, who held common units of CWGS, LLC pursuant to CWGS, LLC’s equityincentive plan that was in existence prior to our IPO and received common units of CWGS, LLC inexchange for their profit units in CWGS, LLC.
● “ML Acquisition” refers to ML Acquisition Company, LLC, a Delaware limited liability company,indirectly owned by each of Stephen Adams and our Chairman and Chief Executive Officer, MarcusLemonis.
● “ML Related Parties” refers to ML Acquisition and its permitted transferees of common units.
● “ML RV Group” refers to ML RV Group, LLC, a Delaware limited liability company, wholly-owned byour Chairman and Chief Executive Officer, Marcus Lemonis.
● “Original Equity Owners” refers to the direct and certain indirect owners of interests in CWGS, LLC,collectively, prior to the Reorganization Transactions and Recapitalization (as defined in Note 1 –Summary of Significant Accounting Policies and Note 18 – Stockholders’ Equity to our consolidatedfinancial statements included in Part II, Item 8 of this Form 10-K, respectively) conducted inconjunction with our IPO, including ML Acquisition, funds controlled by Crestview Partners II GP, L.P.and the Former Profit Unit Holders.
● “Tax Receivable Agreement” refers to the tax receivable agreement that the Company entered intowith CWGS, LLC, each of the Continuing Equity Owners and Crestview Partners II GP, L.P. inconnection with the Company’s IPO.
Table of Contents
6
CAUTIONARY NOTE REGARDING FORWARD-LOOKING STATEMENTS
This Form 10-K contains forward-looking statements. We intend such forward-looking statements to becovered by the safe harbor provisions for forward-looking statements contained in Section 27A of the Securities Act of1933 and Section 21E of the Securities Exchange Act of 1934. All statements other than statements of historical factscontained in this Form 10-K may be forward-looking statements. Statements regarding our future results of operationsand financial position, business strategy and plans and objectives of management for future operations, including,among others, statements regarding the timeline for and benefits of our 2019 Strategic Shift; expected new retaillocation openings and closures, including greenfield locations and acquired locations; the impact of the COVID-19pandemic on our business; sufficiency of our sources of liquidity and capital and potential need for additionalfinancing; our stock repurchase program; future capital expenditures and debt service obligations; refinancing,retirement or exchange of outstanding debt; expectations regarding industry trends and consumer behavior andgrowth; our ability to capture positive industry trends and pursue growth; our plans to increase new products offeredto our customers and grow our businesses to enhance our visibility with respect to revenue and cash flow, and toincrease our overall profitability; volatility in sales and potential impact of miscalculating the demand for our productsor our product mix; expectations regarding increase of certain expenses in connection with our growth; expectationsregarding our pending litigation, and our plans related to dividend payments, are forward-looking statements. In somecases, you can identify forward-looking statements by terms such as ‘‘may,’’ ‘‘will,’’ ‘‘should,’’ ‘‘expects,’’ ‘‘plans,’’‘‘anticipates,’’ ‘‘could,’’ ‘‘intends,’’ ‘‘targets,’’ ‘‘projects,’’ ‘‘contemplates,’’ ‘‘believes,’’ ‘‘estimates,’’ ‘‘predicts,’’ ‘‘potential’’or ‘‘continue’’ or the negative of these terms or other similar expressions. We have based these forward-lookingstatements largely on our current expectations and projections about future events and trends that we believe mayaffect our financial condition, results of operations, business strategy, short-term and long-term business operationsand objectives, and financial needs. These forward-looking statements are subject to a number of risks, uncertainties,and assumptions, including the important factors described in this Form 10-K under Item 1A. Risk Factors and in ourother filings with the Securities and Exchange Commission (“SEC”), that may cause our actual results, performanceor achievements to differ materially and adversely from those expressed or implied by the forward-looking statements.
Any forward-looking statements made herein speak only as of the date of this Form 10-K, and you should notrely on forward-looking statements as predictions of future events. Although we believe that the expectations reflectedin the forward-looking statements are reasonable, we cannot guarantee that the future results, performance, orachievements reflected in the forward-looking statements will be achieved or occur. We undertake no obligation toupdate any of these forward-looking statements for any reason after the date of this Form 10-K or to conform thesestatements to actual results or revised expectations.
Table of Contents
7
PART I
ITEM 1. BUSINESS
Overview
Camping World Holdings, Inc. (together with its subsidiaries) is America’s largest retailer of recreationalvehicles (“RVs”) and related products and services. Our vision is to build a long-term legacy business that makesRVing fun and easy, and our Camping World and Good Sam brands have been serving RV consumers since 1966.We strive to build long-term value for our customers, employees, and shareholders by combining a unique andcomprehensive assortment of RV products and services with a national network of RV dealerships, service centersand customer support centers along with the industry’s most extensive online presence and a highly-trained andknowledgeable team of associates serving our customers, the RV lifestyle, and the communities in which we operate.We also believe that our Good Sam organization and family of programs and services uniquely enables us to connectwith our customers as stewards of the RV lifestyle. On December 31, 2020, we operated a total of 171 retail locations,with 170 of these selling and/or servicing RVs.
Business Strategy
Key elements of our business strategy are:
Offer a Unique and Comprehensive Assortment of RV Products and Services. We believe our product and serviceofferings represent the best and most comprehensive assortment of services, protection plans, products andresources in the RV industry. Many of our offerings, including our Good Sam services and plans, our private labelRVs, and our private label accessories, are unique to us and have been developed in collaboration with leadingindustry suppliers and RV enthusiasts. With more than 50 years of RV industry experience, 170 retail locations sellingand/or servicing RVs, and 5.3 million Active Customers, we believe our size and scale allows us to deliver exceptionalvalue to our customers.
Operate a National Network of RV Dealerships and Service Centers. As of December 31, 2020, we operated anational network of 170 RV dealerships and/or service centers. The majority of these RV dealerships and servicecenters are conveniently located off major highways and interstates in key RV markets, staffed with knowledgeablelocal team members offering expert advice and a comprehensive assortment of RV-related products and services.Our RV dealerships and service centers are a one-stop-shop for everything RV and give RV consumers peace ofmind that they can find what they need when they need it in their local market or while traveling throughout thecountry.
Focus on Customer Service. We believe customer service is a critical component of our business. Our dealershipsand service centers are staffed with knowledgeable local team members offering expert advice and a wideassortment of products and services. We currently operate call centers in Denver, CO, Bowling Green, KY,Greenville, NC, and Island Lake, IL. All associates at our call centers have been cross trained, and the call centershave redundant services and systems in place in the event of a power or connectivity disruption at one of our callcenter locations. Our goal is that every call – whether to one of our call centers or to a store – will be answeredpromptly by a live person. Our call center specialists are extensively trained to assist customers with complex ordersand provide a level of service that leads to exceptional customer service and long-term customer relationships. In2020, our call centers handled more than 2.6 million calls and responded to over 495,000 emails and social mediacommunications.
Leverage Our Resources and Synergies. Our unique and comprehensive assortment of RV products and services,our national network of RV dealerships and service centers, our network of customer service and contact centers, andour online and e-commerce platforms all work together to service our customers and make RVing fun and easy.When a new customer transacts with us across any of our business areas, the new customer enters our databaseand we leverage customized customer relationship management (“CRM”) tools
Table of Contents
8
and analytics to actively and intelligently engage, service and promote other offerings and the RV lifestyle. We believeour size and scale allows us to deliver exceptional value to our customers.
Stewards of the RV Lifestyle. We believe that our Good Sam organization and family of programs and servicesuniquely enables us to connect with our customers as stewards of the RV lifestyle. Good Sam programs such asextended vehicle warranty programs, roadside assistance plans, vehicle and home insurance programs, and GoodSam TravelAssist travel protection plans help to ensure our customers’ health and safety while traveling, and ourGood Sam Club, co-branded credit card, extended vehicle warranty programs and vehicle protection plans providegreat value to keep our customers’ RVs in top shape while providing a host of discounts and services all designed toenhance the overall customer RV experience. By providing unique programs that promote the health, safety andprotection of the RV community, the Company drives an unparalleled opportunity to build a large, loyal, and growingcommunity of RV enthusiasts to whom we can provide our basket of products and services for years to come.
Background, Restructuring and Recent Developments
Founded in 1966, our Good Sam and Camping World brands have been serving RV owners and outdoorenthusiasts for more than 50 years. Good Sam combined with Camping World in 1997, when the Good Sam Club hadapproximately 911,000 members and Camping World had 26 retail locations. In 2011, Camping World Good Samcombined with FreedomRoads, a successful RV dealership business founded in 2003, to form the largest provider ofproducts and services for RVs in North America. From 2011 to 2020, we continued to expand our footprint of RVdealerships through new store openings and acquisitions.
In May 2017, we acquired certain assets of Gander Mountain Company (“Gander Mountain”) and itsOverton’s, Inc. (“Overton’s”) marine and watersports business through a bankruptcy auction. Prior to the bankruptcy,Gander Mountain operated 160 retail locations and an e-commerce business that serviced the hunting, camping,fishing, shooting sports, and outdoor markets. Following the acquisition, we rebranded the Gander Mountain businessas Gander Outdoors and began opening the rebranded Gander Outdoors stores in December 2017. In 2017 and2018, we also acquired several other specialty retail businesses.
In 2019, we made a strategic decision to refocus our business around our core RV competencies. In Augustof 2019, we divested 13 specialty store locations under the Uncle Dan’s and Rock Creek nameplates. On September3, 2019, our Board of Directors approved a plan to strategically shift our business away from locations where we didnot have the ability or where it was not feasible to sell and/or service RVs (the “2019 Strategic Shift”). As of December31, 2020, the Company has completed the store closures and divestitures relating to the 2019 Strategic Shift. Formore information on the impact to our 2020 and 2019 financial results, please see Note 5 – Restructuring and Long-lived Asset Impairment to our consolidated financial statements included in Part II, Item 8 of this Form 10-K.
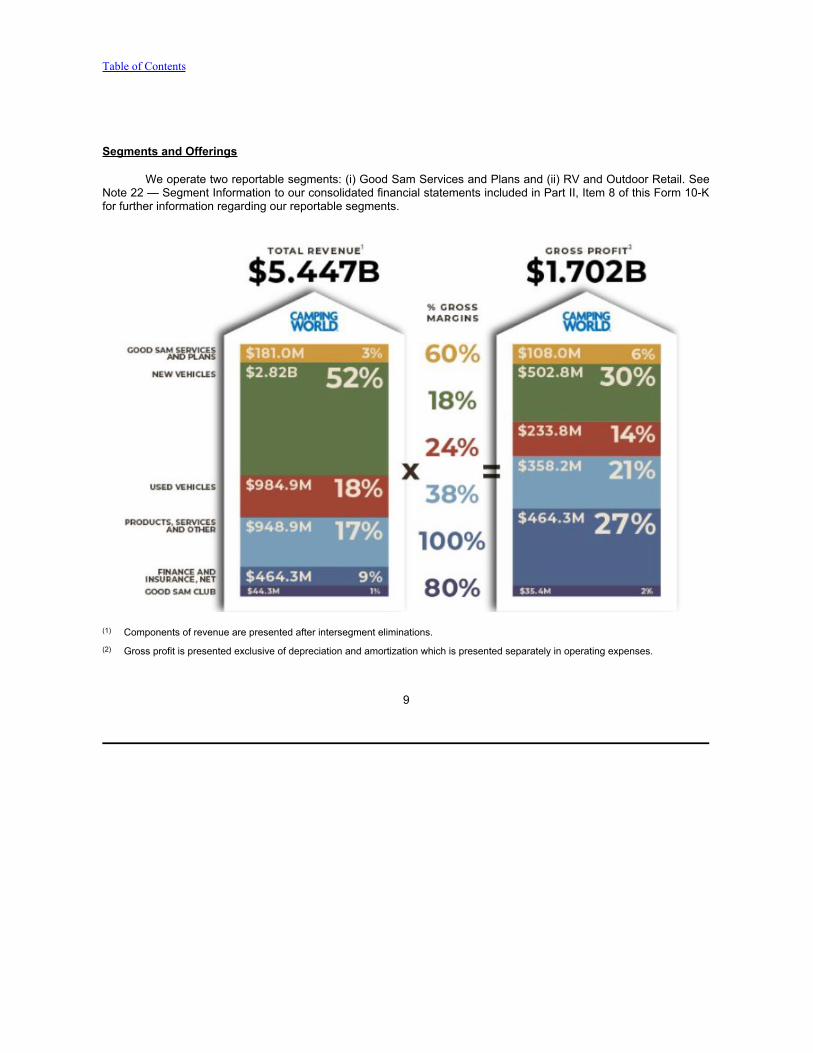
Table of Contents
9
Segments and Offerings
We operate two reportable segments: (i) Good Sam Services and Plans and (ii) RV and Outdoor Retail. SeeNote 22 — Segment Information to our consolidated financial statements included in Part II, Item 8 of this Form 10-Kfor further information regarding our reportable segments.
(1) Components of revenue are presented after intersegment eliminations.(2) Gross profit is presented exclusive of depreciation and amortization which is presented separately in operating expenses.
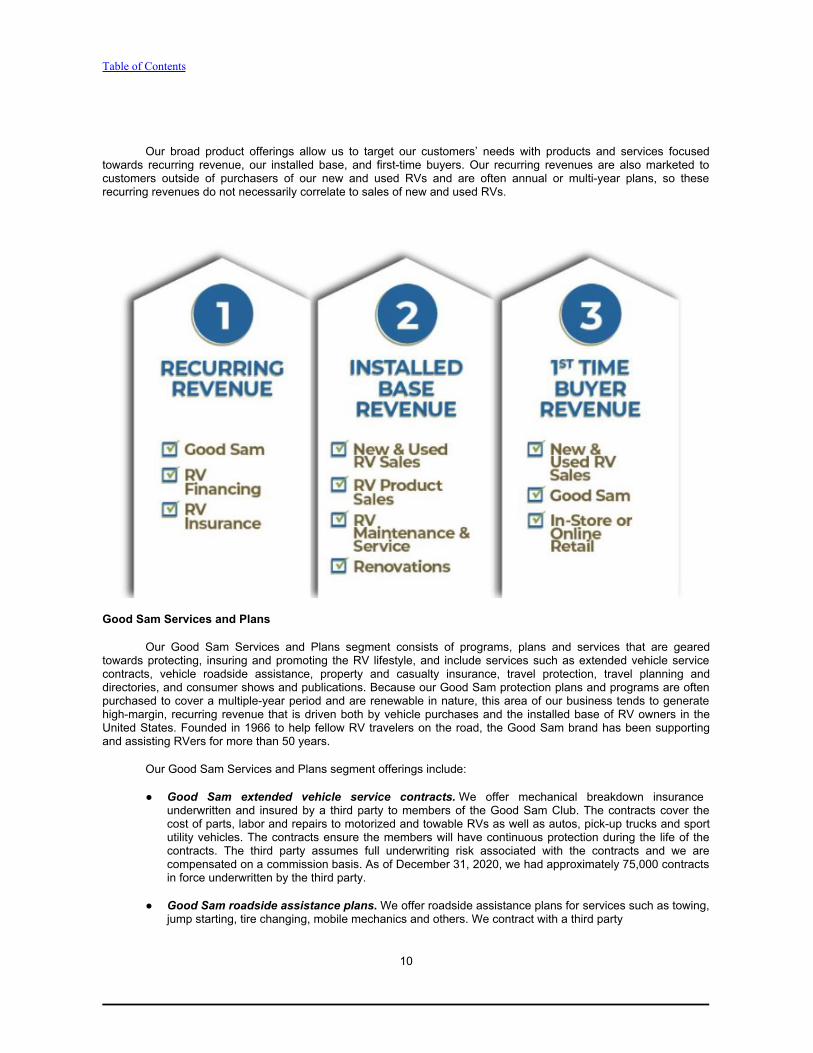
Table of Contents
10
Our broad product offerings allow us to target our customers’ needs with products and services focusedtowards recurring revenue, our installed base, and first-time buyers. Our recurring revenues are also marketed tocustomers outside of purchasers of our new and used RVs and are often annual or multi-year plans, so theserecurring revenues do not necessarily correlate to sales of new and used RVs.
Good Sam Services and Plans
Our Good Sam Services and Plans segment consists of programs, plans and services that are gearedtowards protecting, insuring and promoting the RV lifestyle, and include services such as extended vehicle servicecontracts, vehicle roadside assistance, property and casualty insurance, travel protection, travel planning anddirectories, and consumer shows and publications. Because our Good Sam protection plans and programs are oftenpurchased to cover a multiple-year period and are renewable in nature, this area of our business tends to generatehigh-margin, recurring revenue that is driven both by vehicle purchases and the installed base of RV owners in theUnited States. Founded in 1966 to help fellow RV travelers on the road, the Good Sam brand has been supportingand assisting RVers for more than 50 years.
Our Good Sam Services and Plans segment offerings include:
● Good Sam extended vehicle service contracts. We offer mechanical breakdown insuranceunderwritten and insured by a third party to members of the Good Sam Club. The contracts cover thecost of parts, labor and repairs to motorized and towable RVs as well as autos, pick-up trucks and sportutility vehicles. The contracts ensure the members will have continuous protection during the life of thecontracts. The third party assumes full underwriting risk associated with the contracts and we arecompensated on a commission basis. As of December 31, 2020, we had approximately 75,000 contractsin force underwritten by the third party.
● Good Sam roadside assistance plans. We offer roadside assistance plans for services such as towing,jump starting, tire changing, mobile mechanics and others. We contract with a third party
Table of Contents
11
to handle dispatch calls through its network of tow providers and we pay a fee per incident or call. As ofDecember 31, 2020, we had approximately 679,000 contracts in force under our emergency roadsideassistance plan.
● Good Sam property and casualty insurance programs. We offer property and casualty insurance forRVs and other types of vehicles as well as home insurance underwritten by various insurance providers.We do not share the underwriting risk of the insurance programs and we receive a marketing fee basedon the amount of premium paid to the insurance providers. For the year ended December 31, 2020, wesold, through third-party insurance providers, insurance policies with an aggregate net written premium of$283 million for which we earn a marketing fee.
● Good Sam TravelAssist travel protection. We offer travel protection plans designed to assist travelerswith medical emergency situations. The plans provide 24/7 coverage for emergency medical evacuation,return-home services, emergency medical monitoring, as well as other travel assistance services. Wecontract with a third party to offer travel protection plans through Good Sam TravelAssist, where the thirdparty primarily assumes the underwriting risk through third-party underwriters. As of December 31, 2020,we had approximately 245,000 contracts in force primarily underwritten by the third party’s underwriter.
● Good Sam consumer shows. We offer RV and outdoor related consumer shows designed to promoteand sell RV and outdoor lifestyle and related products and services. During 2020, as a consequence ofCOVID-19, we reduced the number of in-person consumer shows that we promoted and operated to 24consumer shows in 20 cities across 15 states that attracted more than 210,000 visitors. In comparison,during 2019, we promoted and operated 37 consumer shows in 29 cities across 18 states that attractedmore than 285,000 visitors. These shows provide a strategic opportunity to expose first-time buyers andexisting RV and outdoor sports enthusiasts to our products and services.
● Other activities. We produce certain monthly and annual RV focused consumer magazines, and traveland planning directories, and operate the Coast to Coast Club which provides access to and savings atprivate membership campgrounds.
RV and Outdoor Retail
Our RV and Outdoor Retail segment consists of all aspects of our RV dealership operations, which includesselling new and used RVs, assisting with the financing of new and used RVs, selling protection and insurance relatedservices and plans for RVs, servicing and repairing new and used RVs, installing RV parts and accessories, andselling RV and outdoor related products, parts and accessories. Within our RV and Outdoor Retail business, we alsooperate the Good Sam Club, which we believe is the largest membership-based RV organization in the world, withapproximately 2.1 million members as of December 31, 2020. Membership benefits include a variety of discounts,exclusive benefits, specialty publications and other membership benefits, all of which we believe enhance the RVexperience, drive customer engagement and
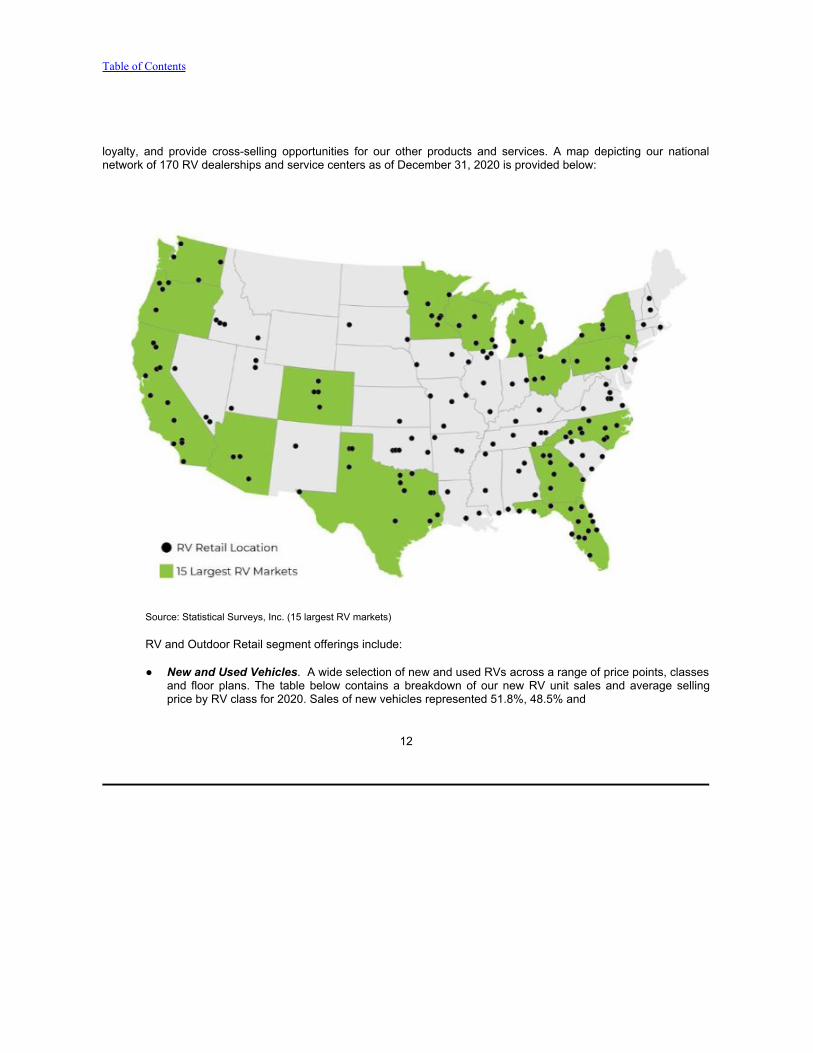
Table of Contents
12
loyalty, and provide cross-selling opportunities for our other products and services. A map depicting our nationalnetwork of 170 RV dealerships and service centers as of December 31, 2020 is provided below:
Source: Statistical Surveys, Inc. (15 largest RV markets)
RV and Outdoor Retail segment offerings include:
● New and Used Vehicles. A wide selection of new and used RVs across a range of price points, classesand floor plans. The table below contains a breakdown of our new RV unit sales and average sellingprice by RV class for 2020. Sales of new vehicles represented 51.8%, 48.5% and
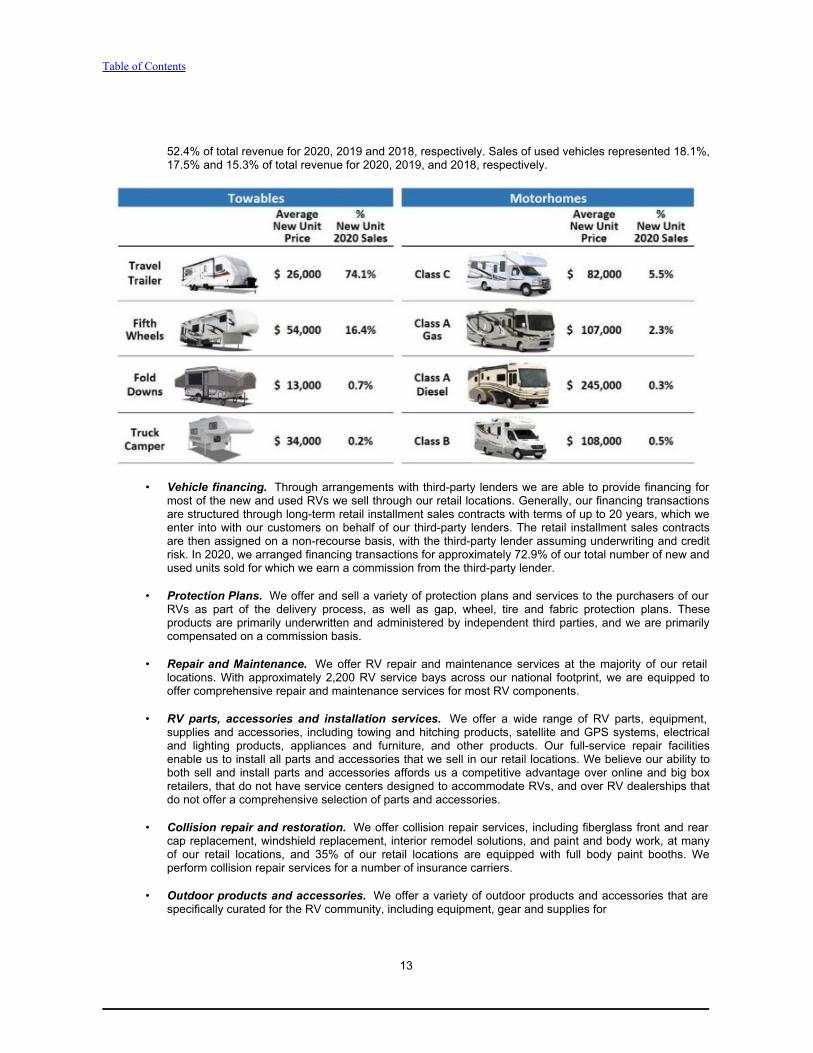
Table of Contents
13
52.4% of total revenue for 2020, 2019 and 2018, respectively. Sales of used vehicles represented 18.1%,17.5% and 15.3% of total revenue for 2020, 2019, and 2018, respectively.
• Vehicle financing. Through arrangements with third-party lenders we are able to provide financing formost of the new and used RVs we sell through our retail locations. Generally, our financing transactionsare structured through long-term retail installment sales contracts with terms of up to 20 years, which weenter into with our customers on behalf of our third-party lenders. The retail installment sales contractsare then assigned on a non-recourse basis, with the third-party lender assuming underwriting and creditrisk. In 2020, we arranged financing transactions for approximately 72.9% of our total number of new andused units sold for which we earn a commission from the third-party lender.
• Protection Plans. We offer and sell a variety of protection plans and services to the purchasers of ourRVs as part of the delivery process, as well as gap, wheel, tire and fabric protection plans. Theseproducts are primarily underwritten and administered by independent third parties, and we are primarilycompensated on a commission basis.
• Repair and Maintenance. We offer RV repair and maintenance services at the majority of our retaillocations. With approximately 2,200 RV service bays across our national footprint, we are equipped tooffer comprehensive repair and maintenance services for most RV components.
• RV parts, accessories and installation services. We offer a wide range of RV parts, equipment,supplies and accessories, including towing and hitching products, satellite and GPS systems, electricaland lighting products, appliances and furniture, and other products. Our full-service repair facilitiesenable us to install all parts and accessories that we sell in our retail locations. We believe our ability toboth sell and install parts and accessories affords us a competitive advantage over online and big boxretailers, that do not have service centers designed to accommodate RVs, and over RV dealerships thatdo not offer a comprehensive selection of parts and accessories.
• Collision repair and restoration. We offer collision repair services, including fiberglass front and rearcap replacement, windshield replacement, interior remodel solutions, and paint and body work, at manyof our retail locations, and 35% of our retail locations are equipped with full body paint booths. Weperform collision repair services for a number of insurance carriers.
• Outdoor products and accessories. We offer a variety of outdoor products and accessories that arespecifically curated for the RV community, including equipment, gear and supplies for
Table of Contents
14
camping, hunting, fishing, skiing, snowboarding, bicycling, skateboarding, marine and watersports andother outdoor activities.
• Good Sam Club. The Good Sam Club is a membership organization that offers savings on a variety ofproducts and services, including products purchased at any of our retail and online stores, discounts onnightly rates at affiliated Good Sam RV parks and other benefits related to the RV lifestyle. We believethe Good Sam Club is the largest membership-based RV enthusiast organization in the world. As ofDecember 31, 2020, there were approximately 2.1 million members in our Good Sam Club.
• Co-branded credit cards. We contract with Visa and Comenity Capital Bank to offer a Good SamRewards Visa® branded credit card, as well as Good Sam private label credit card. Cardholders receiveenhanced rewards points, which are referred to as Good Sam Rewards, for money spent at our retaillocations, on our e-commerce platforms, at gas stations and at private campgrounds across the U.S. andCanada. As of December 31, 2020, we had approximately 199,000 issued and open Good Sam co-branded credit card accounts.
Vehicle Sourcing and Dealer Agreements
We acquire new RVs for retail sale directly from the original equipment manufacturer. Our strategy is topartner with financially sound manufacturers that make high quality products, have adequate manufacturing capacityand distribution, and maintain an appropriate product mix. We have strategic relationships with leading RVmanufacturers, including Thor Industries, Inc. and Forest River, Inc. As of December 31, 2020, Thor Industries andForest River accounted for approximately 69.3% and 27.9%, respectively, of our new RV inventory. In certaininstances, our manufacturing partners produce private label products exclusively available at our RV dealerships andthrough our e-commerce platforms.
Our supply arrangements with manufacturers are typically governed by dealer agreements, which arecustomary in the RV industry, made on a location-by-location basis, and each retail location typically enters intomultiple dealer agreements with multiple manufacturers. Dealer agreements generally give us the right to sell certainRV makes and models within an exclusive designated area. The terms of these dealer agreements typically requireus to, among other things, meet all the requirements and conditions of the manufacturer’s applicable programs,maintain certain minimum inventory requirements and meet certain retail sales objectives, perform services andrepairs for all owners of the manufacturer’s RVs (regardless from whom the RV was purchased) that are still underwarranty, and stock certain of the manufacturer’s parts and accessories needed to service and repair themanufacturer’s RVs, actively advertise and promote the manufacturer’s RVs, and indemnify the manufacturer undercertain circumstances.
We generally acquire used RVs from customers, primarily through trade-ins, as well as through auctions andother sources, and we generally recondition used RVs acquired for retail sale in our parts and service departments.Used RVs that we do not sell at our RV-centric retail locations generally are sold at wholesale prices throughauctions.
We finance the purchase of substantially all of our new RV inventory from manufacturers through our FloorPlan Facility. Used vehicles may also be financed from time to time through our Floor Plan Facility. For moreinformation on our Floor Plan Facility, see “Management's Discussion and Analysis of Financial Condition and Resultsof Operations—Liquidity and Capital Resources—Description of Senior Secured Credit Facilities and Floor PlanFacility” included in Part II, Item 7 of this Form 10-K and Note 4 — Inventories, net and Notes Payable — Floor Plan,net to our audited consolidated financial statements included in Part II, Item 8 of this Form 10-K.
Marketing and Advertising
The lifestyle element of the RV industry and the multi-year nature of many of our products and servicesprovides the opportunity to build long-term relationships with our customers. Our marketing strategies are focused ondeveloping awareness around our brands, products and services, and driving traffic to our stores and websites, andwe utilize a combination of direct mail, email, printed catalogs and flyers, digital, social and
Table of Contents
15
traditional media, as well as online inventory listings to accomplish this. As part of our marketing efforts, we maintaina proprietary database of individuals and customer purchasing data that we utilize for direct mail, email andtelemarketing campaigns. As of December 31, 2020, this database contained over 30 million unique contacts. Inaddition, we are involved in various sponsored sporting event activities. We are the sponsor of the NASCAR CampingWorld Truck Series, Major League Baseball Spring Training, and National Hot Rod Association (“NHRA”) CampingWorld Drag Racing Series plus the naming rights sponsor of Camping World Stadium in Orlando, Florida. We alsohave official partner status for our brands for both Major League Baseball and NASCAR. In September 2020,Camping World and Gander RV introduced our first-ever virtual show, the Ultimate RV Show, which was a virtualomni-channel event that showcased informative videos, promotions, and concerts by popular artists. There were 1.3million viewers that attended the five-day online event. The Ultimate RV Show will continue to be utilized in the futureas an additional means of connecting with consumers and digitizing the purchase experience.
Trademarks and Other Intellectual Property
We own a variety of registered trademarks and service marks related to our brands and our services,protection plans, products and resources, including Good Sam, Camping World, Gander Outdoors, Gander RV, andOverton’s. We also own the copyrights to certain articles in our publications and numerous domain names, includingwww.goodsamclub.com, www.campingworld.com, www.ganderoutdoors.com, www.ganderrv.com,www.overtons.com, www.the-house.com, www.rv.com, among others. We believe that our trademarks and otherintellectual property have significant value and are important to our marketing efforts. We do not know of any materialpending claims of infringement or other challenges to our right to use our intellectual property in the United States orelsewhere. For additional information regarding our intellectual property, see Note 7 – Goodwill and Intangible Assetsto our audited consolidated financial statements included in Part II, Item 8 of this Form 10-K.
Human Capital Resources
Our Talent
As of December 31, 2020, we had 10,907 full-time and 1,040 part-time or seasonal employees. None of ouremployees are represented by a labor union or are party to a collective bargaining agreement, and we have had nolabor-related work stoppages. We believe that our employee relations are generally good.
Development
In November 2020, we launched an entity-wide online training platform with a curriculum that is tailored toeach associate’s job function. This program includes interactive courses such as COVID-19 safety, communication,management, critical thinking, software skills, and workplace harassment and discrimination. Our learning anddevelopment team continues to create proprietary content for this training library.
Our service technicians are critical to providing the high-quality installation and repair services that ourcustomers expect. In 2019, we provided training to 159 technicians and, despite the challenges faced with socialdistancing limitations as a result of COVID-19 safety precautions, we were able to train 101 new technicians on ourlevel 1 course in 2020.
Diversity, Equity, and Inclusion
We strive to make diversity, equity, and inclusion (“DE&I”) a top priority in all areas of our Company. Theseareas include but are not limited to our board of directors, senior management, field operations, and the creation ofcampaigns, products and services. We believe that our Company and our brand should reflect the
Table of Contents
16
increasingly diverse audience of outdoor enthusiasts and our culture should promote respect and dignity of allhumans.
Community Engagement
Since 2013, we have operated the Project Good Samaritan initiative, which encourages our associates toperform eight hours of volunteer work per quarter for a cause that is meaningful to that associate, such as local soupkitchens, food pantries, home building, meal distribution, recycling programs, homeless shelters, veteran programs,and nursing homes. Associates receive paid time off for these volunteer hours. In 2019, 3,364 associates volunteered51,680 hours in their communities under the program. In 2020, 840 associates volunteered 6,268 hours duringJanuary and February before the program was suspended as a safety precaution as a result of the COVID-19pandemic. We plan to reactivate the program when it is safe to do so.
Health and Safety
We maintain a safety program to provide a safe and healthful workplace for our associates. We strive tocomply with all health and safety standards that pertain to our operations. We have created and implementedprocesses to identify, reduce or eliminate physical hazards from the work environment, improve safety communicationand train employees on safe work practices.
In response to the COVID-19 pandemic, we have implemented new health and safety measures at all of ourlocations. We also issued COVID-19 awareness training to our associates to educate associates on how the virus istransmitted, how to monitor for symptoms of the virus, and how to protect themselves and others from increasedspread of the virus. For further discussion, see “Management’s Discussion and Analysis of Financial Condition andResults of Operations — COVID-19” in Item 7 of Part II of this Form 10-K.
Competition
We face competition in all areas of our business. We believe that the principal competitive factors in the RVindustry are breadth and depth of products and services, quality, pricing, availability, convenience, and customerservice. Our competitors vary in size and breadth of their product offerings.
We compete directly or indirectly with the following types of companies:
● other RV dealers selling new and used RVs;
● major national insurance and warranty companies, providers of roadside assistance and providers ofextended vehicle service contracts;
● multi-channel retailers and mass merchandisers, warehouse clubs, discount stores, department storesand other retailers, such as Wal-Mart, Target and Amazon;
● other specialty retailers that compete with us across a significant portion of our merchandising categoriesthrough retail, catalog or e-commerce businesses, such as Bass Pro Shops (including Cabela’s),Sportsman’s Warehouse and REI;
● distributors of assembled RV furniture;
● online retailers; and
● independent, local specialty stores.
Additional competitors may enter the businesses in which we currently operate. Moreover, some of our massmerchandising competitors do not currently compete in many of the product categories we offer but may choose tooffer a broader array of competing products in the future.
Table of Contents
17
COVID-19
The COVID-19 pandemic adversely impacted our business from mid-March through much of April 2020, butshifted to a favorable impact beginning primarily in May 2020. For further discussion, see “Management’s Discussionand Analysis of Financial Condition and Results of Operations — COVID-19” in Item 7 of Part II of this Form 10-K.
Seasonality
Historically, our business has been seasonal. Since recreational vehicles are primarily used by vacationersand campers during times of warmer weather, demand for our products and services tends to be highest in the springand summer months and lowest in the winter months. As a result, our revenue and profitability has historically beenhigher in the second and third quarters than in the first and fourth quarters. On average over the last three yearsended December 31, 2020, we generated 29.9% and 28.9% of our annual revenue in the second and third quarters,respectively, and 20.8% and 20.4% in the first and fourth quarters, respectively. For further discussion, see“Management’s Discussion and Analysis of Financial Condition and Results of Operations — Seasonality” in Item 7 ofPart II of this Form 10-K.
Laws and Regulations
See “Risk Factors — Risks Related to Our Business — Our business is subject to numerous federal, stateand local regulations,” “— Changes in government policies and firearms legislation could adversely affect our results,”“— Our failure to comply with certain environmental regulations could adversely affect our business, financialcondition and results of operations,” and “—Climate change legislation or regulations restricting emission of“greenhouse gases” could result in increased operating costs and reduced demand for RVs we sell” in Item 1A of PartI of this Form 10-K. Although we incur costs to comply with applicable laws and regulations in the ordinary course ofour business, we do not presently anticipate that such costs will have a material effect on our capital expenditures,earnings and competitive position.
Environmental, Health and Safety Regulations
Our operations involve the use, handling, storage and contracting for recycling and/or disposal of materialssuch as motor oil and filters, transmission fluids, antifreeze, refrigerants, paints, thinners, batteries, cleaning products,lubricants, degreasing agents, tires and propane. Consequently, our business is subject to a complex variety offederal, state and local requirements that regulate the environment and public health and safety. For a discussion ofthe impact of COVID-19 on our business, see “Management’s Discussion and Analysis of Financial Condition andResults of Operations — COVID-19” in Item 7 of Part II of this Form 10-K. We do not have any material knownenvironmental commitments or contingencies.
Additional Information
We were incorporated in the State of Delaware in 2016. Our principal executive offices are located at 250Parkway Drive, Suite 270, Lincolnshire, IL 60069 and our telephone number is (847) 808-3000. We make availableour public filings, including annual reports on Form 10-K, quarterly reports on Form 10-Q, current reports on Form 8-K, and any amendments to those reports with the SEC free of charge through our website at www.campingworld.comin the “Investor Relations” section under “Financial Info” as soon as reasonably practicable after we electronically filesuch material with, or furnish such material to, the SEC. The information contained in, or accessible through, ourwebsite does not constitute a part of this Form 10-K.
We intend to use our official Facebook, Twitter, and Instagram accounts, each at the handle@CampingWorld, as a distribution channel of material information about the Company and for complying with ourdisclosure obligations under Regulation FD. The information we post through these social media channels may bedeemed material. Accordingly, investors should subscribe to these accounts, in addition to following our pressreleases, SEC filings and public conference calls and webcasts. These social media channels may be updated fromtime to time. The information we post through these channels is not a part of this Annual Report on Form 10-K.
Table of Contents
18
ITEM 1A. RISK FACTORS
RISK FACTORS
Investing in our common stock involves a high degree of risk. You should consider carefully the risks anduncertainties described below, together with the other information included in this Form 10-K. The occurrence of anyof the following risks may materially and adversely affect our business, financial condition, results of operations andfuture prospects. In these circumstances, the market price of our Class A common stock could decline. Other eventsthat we do not currently anticipate or that we currently deem immaterial may also affect our business, prospects,financial condition and results of operations.
Risks Related to the COVID-19 Pandemic
The COVID-19 pandemic has had, and could have in the future, certain negative impacts on our business,and such impacts may have a material adverse effect on our results of operations, financial condition andcash flows.
The public health crisis caused by the COVID-19 pandemic and the measures being taken by governments,businesses, including us and our vendors, and the public at large to limit COVID-19's spread have had, and couldagain have in the future, certain negative impacts on our business including, without limitation, the following:
● We have faced, and may continue to face, delays in the delivery of certain products from our vendors asa result of shipping delays due to, among other things, additional safety requirements imposed bygovernmental authorities and capacity constraints experienced by our transportation contractors.
● Some of our vendors have experienced, and may experience in the future, temporary facility closures,production slowdowns and disruption to operations as a result of the impact of the COVID-19 pandemicon their respective businesses, such as Thor Industries, Inc.’s temporary closure of its North Americanproduction facilities from late March to early May 2020.
● Disruptions in supply chains may place constraints on our ability to source products, which may increaseour product costs or lead to shortages.
● When governmentally mandated or voluntary stay-at-home guidelines have been put in place, we haveexperienced a decrease in traffic at our retail locations, which resulted in a decrease in the sales ofcertain of our products and services at our retail locations. If stay-at-home or shelter-in-place orders arereinstated, we may again experience negative impacts on our sales that could be more prolonged andmore severe than what we have experienced to date. As stay-at-home restrictions began to ease acrosscertain areas of the country, we experienced significant acceleration in our in-store traffic, leadgeneration, and revenue trends in May continuing throughout the remainder of 2020 and early indicationsappear to show favorable trends continuing into 2021. The industry has seen an influx of new first-timeparticipants because RVs allow people to travel in a safe and socially distant manner during the COVID-19 crisis. These trends may not continue in the future, in particular if the cruise line, air travel and hotelindustries begin to recover. Accordingly, investors are cautioned not to unduly rely on the historicalinformation in this Form 10-K regarding our business, results of operations, financial condition or liquidity.
● National parks and RV parks temporarily closed and may in the future close again in response to theCOVID-19 pandemic, which could cause consumers to use their RVs less frequently and be less inclinedto need or renew certain of our services or purchase products through our e-commerce websites.
Table of Contents
19
● As of December 31, 2020, we temporarily closed two dealerships as a result of COVID-19 and brandingchanges. We anticipate re-opening these the locations in 2021. To the extent the COVID-19 pandemicintensifies or governmental orders change, we may be forced to temporarily close more locations in thefuture.
● Deteriorating economic conditions as a result of the COVID-19 pandemic, such as increasedunemployment, decreases in disposable income, declines in consumer confidence, or economicslowdowns or recessions, could cause a decrease in demand for our products and services.
● We have made temporary changes to our operating procedures at our retail locations and offices. We aretaking measures to protect our customers, employees and facilities, which include, but are not limited to,social distancing, providing employees with face coverings and/or other protective clothing as required,and implementing additional cleaning and sanitization routines. These measures may not be sufficient toprevent the spread of COVID-19 among our employees and, therefore, we may face labor shortagesincluding key positions. Additionally, our employees may not be as efficient while operating under thesetemporary procedures, which could result in additional labor costs.
● Our ability to increase our borrowing capacity may be limited as a result of the COVID-19 pandemic and,if the conditions in the credit markets worsen, our ability to refinance credit arrangements as they maturemay also be limited. As a result, there is no guarantee that we will be able to access additional capital oncommercially reasonable terms or at all.
● The current uncertain market conditions and their actual or perceived effects on our results of operationsand financial condition, along with the current unfavorable economic environment in the United States,may increase the likelihood that one or more of the major independent credit agencies will furtherdowngrade our credit ratings, which could have a negative effect on our borrowing costs.
● Governmental authorities in the United States may increase or impose new income taxes or indirecttaxes, or revise interpretations of existing tax rules and regulations, as a means of financing the costs ofstimulus and other measures enacted or taken, or that may be enacted or taken in the future, to protectpopulations and economies from the impact of the COVID-19 pandemic. Such actions could have anadverse effect on our results of operations and cash flows.
● We rely on third-party service providers and business partners, such as cloud data storage and otherinformation technology service providers, suppliers, distributors, contractors, and other external businesspartners, for certain functions or for services in support of key portions of our operations. These third-party service providers and business partners are subject to risks and uncertainties related to theCOVID-19 pandemic, which may interfere with their ability to fulfill their respective commitments andresponsibilities to us in a timely manner and in accordance with the agreed-upon terms.
● The financial impact of the COVID-19 pandemic may cause one or more of our counterparty financialinstitutions to fail or default on their obligations to us, which could cause us to incur significant losses.
● Deteriorations in our financial results and financial condition as a result of the COVID-19 pandemic couldcause us to default on one or multiple of our credit agreements, including any of the subjectiveacceleration clauses in such agreements. If this occurs, our obligations under the relevant agreementmay be accelerated which would have a material adverse impact on our business, liquidity position andfinancial position.
● We may be required to record significant impairment charges with respect to noncurrent assets, includinggoodwill, other intangible assets, and other long-lived assets whose fair values may be negativelyaffected by the effects of the COVID-19 pandemic on our operations. Also, we may be
Table of Contents
20
required to write off excess or obsolete inventory as a result of the COVID-19 pandemic’s damagingimpacts on our business.
● As a result of the COVID-19 pandemic, including related governmental guidance or directives, we haverequired most office-based employees to work remotely. We may experience reductions in productivityand disruptions to our business routines and heightened cybersecurity risks while our remote work policyremains in place.
● Actions we have taken or may take, or decisions we have made or may make, as a consequence of theCOVID-19 pandemic may result in legal claims or litigation against us.
The resumption of normal business operations after the disruptions caused by the COVID-19 pandemic maybe delayed or constrained by its lingering effects on our consumers, vendors or third-party service providers.
Risks Related to Our Business
We may not successfully execute or achieve the expected benefits of our 2019 Strategic Shift and thisprogram may result in further asset impairment charges and adversely affect the Company's business.
In the third fiscal quarter of 2019, we announced the 2019 Strategic Shift. Implementation of the programmay be costly and disruptive to our business. We may not be able to realize the benefits initially anticipated and theexpected costs may be greater than expected. A variety of factors could cause the Company not to realize some or allof the expected benefits or incur greater costs, including, among others, delays in the anticipated timing of activitiesrelated to the 2019 Strategic Shift, unexpected costs associated with executing the 2019 Strategic Shift, or theCompany's ability to achieve the benefits contemplated by the program. Further, any cost savings that the Companyrealizes may be offset, in whole or in part, by a reduction in revenues or through increases in other expenses. Inaddition, the Company may need to incur further impairment charges to its long-lived assets, including its operatinglease assets, as a result of the 2019 Strategic Shift.
Our business is affected by the availability of financing to us and our customers.
Our business is affected by the availability of financing to us and our customers. Generally, RV dealers,including us, finance their purchases of inventory with financing provided by lending institutions. As of December 31,2020, we had up to $1.38 billion in maximum borrowing capacity under our Seventh Amended and Restated CreditAgreement for floor plan financing (see Note 4 ─ Inventories, net and Notes Payable ─ Floor Plan, net to ourconsolidated financial statements included in Part II, Item 8 of this Form 10-K). A decrease in the availability of thistype of wholesale financing or an increase in the cost of such wholesale financing could prevent us from carryingadequate levels of inventory, which may limit product offerings and could lead to reduced sales and revenues.
Furthermore, many of our customers finance their RV purchases. Consumer credit market conditionscontinue to influence demand, especially for RVs, and may continue to do so. There continue to be fewer lenders,more stringent underwriting and loan approval criteria, and greater down payment requirements than in the past. Ifcredit conditions or the credit worthiness of our customers worsen, and adversely affect the ability of consumers tofinance potential purchases at acceptable terms and interest rates, it could result in a decrease in the sales of ourproducts and have a material adverse effect on our business, financial condition and results of operations.
Fuel shortages, or high prices for fuel, could have a negative effect on our business.
Gasoline or diesel fuel is required for the operation of RVs. There can be no assurance that the supply ofthese petroleum products will continue uninterrupted, that rationing will not be imposed or that the price of or tax onthese petroleum products will not significantly increase in the future. Shortages of gasoline and diesel fuel have had amaterial adverse effect on the RV industry as a whole in the past and any such shortages or substantial increases inthe price of fuel could have a material adverse effect on our business, financial condition or results of operations.
Table of Contents
21
Our success depends to a significant extent on the well-being, as well as the continued popularity andreputation for quality, of our manufacturers, particularly Thor Industries, Inc. and Forest River, Inc.
Thor Industries, Inc. and Forest River, Inc. supplied approximately 69.3% and 27.9%, respectively, of ournew RV inventory as of December 31, 2020. We depend on our manufacturers to provide us with products thatcompare favorably with competing products in terms of quality, performance, safety and advanced features. Anyadverse change in the production efficiency, product development efforts, technological advancement, marketplaceacceptance, reputation, marketing capabilities or financial condition of our manufacturers, particularly ThorIndustries, Inc. and Forest River, Inc., could have a substantial adverse impact on our business. Any difficultiesencountered by any of these manufacturers, resulting from economic, financial, or other factors, could adverselyaffect the quality and amount of products that they are able to supply to us, and the services and support they provideto us.
The interruption or discontinuance of the operations of Thor Industries, Inc. and Forest River, Inc. or othermanufacturers could cause us to experience shortfalls, disruptions, or delays with respect to needed inventory.Although we believe that adequate alternate sources would be available that could replace any manufacturer as aproduct source, those alternate sources may not be available at the time of any interruption, and alternative productsmay not be available at comparable quality and prices.
Our supply arrangements with manufacturers are typically governed by dealer agreements, which arecustomary in the RV industry. Our dealer agreements with manufacturers are generally made on a location-by-location basis, and each retail location typically enters into multiple dealer agreements with multiple manufacturers.These dealer agreements may contain affirmative obligations that we must comply with. Our dealer agreements alsogenerally provide for a one-year term, which is typically renewed annually. For more information on our dealerarrangements, see “Item 1. Business ─ Vehicle Sourcing and Dealer Arrangements” under Part I of this Form 10-K.
In addition, certain of our dealer agreements contain stocking level requirements and certain of our dealeragreements contain contractual provisions concerning minimum advertised product pricing for current model yearunits. Wholesale pricing is generally established on a model year basis and is subject to change at the manufacturer’ssole discretion. In certain cases, manufacturers have, and may continue to establish a suggested retail price, belowwhich we cannot advertise that manufacturer’s RVs. Any change, non-renewal, unfavorable renegotiation ortermination of these arrangements for any reason could adversely affect product availability and cost and our financialperformance.
Our business model is impacted by general economic conditions in our markets, and ongoing economic andfinancial uncertainties could cause a decline in consumer spending that could adversely affect our business,financial condition and results of operations.
As a business that relies on consumer discretionary spending, we have in the past and may in the future beadversely affected if our customers reduce, delay or forego their purchases of our services, protection plans, productsand resources as a result of:
● job losses, lower income levels or other population and employment trends;
● bankruptcies;
● higher consumer debt and interest rates;
● reduced access to credit;
● higher energy and fuel costs;
● relative or perceived cost, availability and comfort of RV use versus other modes of travel, such as airtravel and rail;
Table of Contents
22
● falling home prices;
● lower consumer confidence or discretional consumer spending;
● uncertainty or changes in tax policies and tax rates;
● uncertainty due to national or international security concerns; or
● other general economic conditions, including inflation, deflation and recessions.
We also rely on our retail locations to attract and retain customers and to build our customer database. If weclose retail locations, are unable to open or acquire new retail locations due to general economic conditions orotherwise, or experience declines in customer transactions in our existing retail locations due to general economicconditions or otherwise, our ability to maintain and grow our customer database and our Active Customers will belimited, which could have a material adverse effect on our business, financial condition and results of operation.
Decreases in Active Customers, average spend per customer, or retention and renewal rates for our GoodSam services and plans would negatively affect our financial performance, and a prolonged period of depressedconsumer spending could have a material adverse effect on our business. In prior years, promotional activities anddecreased demand for consumer products affected our profitability and margins, and this negative impact could returnor worsen in future periods. In addition, adverse economic conditions may result in an increase in our operatingexpenses due to, among other things, higher costs of labor, energy, equipment and facilities, as well as higher tariffs.Due to fluctuations in the U.S. economy, our sales, operating and financial results for a particular period are difficult topredict, making it difficult to forecast results for future periods. Additionally, we are subject to economic fluctuations inlocal markets that may not reflect the economic conditions of the U.S. economy. Any of the foregoing factors couldhave a material adverse effect on our business, financial condition and results of operations.
In addition, the success of our recurring Good Sam services and plans depends, in part, on our customers’use of certain RV websites and/or the purchase of services, protection plans, products and resources throughparticipating merchants, as well as the health of the RV industry generally.
In addition, we have faced, and may continue to face, increased competition from other businesses withsimilar product and service offerings during recent periods. For example, our competitors have listed RVs at or belowcost and we have had little visibility into our competitors or manufacturers’ inventories. As a result, we haveresponded and may need to further respond by establishing pricing, marketing and other programs or by seeking outadditional strategic alliances or acquisitions that may be less favorable to us than we could otherwise establish orobtain in more favorable economic environments. Such programs have adversely impacted our gross margin,operating margin and selling, general and administrative expenses. In addition, declines in the national economycould cause merchants who participate in our programs to go out of business. It is likely that, should the number ofmerchants entering bankruptcy rise, the number of uncollectible accounts would also rise. These factors could have amaterial adverse effect on our business, financial condition and results of operations.
Changes in consumer preferences for our products or our failure to gauge those preferences could lead toreduced sales and increased cost of sales and selling, general and administrative expenses.
We cannot be certain that historical consumer preferences for RVs in general, and any related products, willremain unchanged. RVs are generally used for recreational purposes, and demand for our products may be adverselyaffected by competition from other activities that occupy consumers’ leisure time and by changes in consumerlifestyle, usage pattern, or taste. Similarly, an overall decrease in consumer leisure time may reduce consumers’willingness to purchase our products. As described above, during the COVID-19 pandemic, we have seen significantacceleration in our in-store traffic, lead generation, and revenue trends in May continuing throughout the remainder of2020 and early indications appear to show favorable trends continuing into 2021. The industry has seen an influx ofnew first-time participants because RVs allow people to travel in a safe and socially distant manner during theCOVID-19 crisis. These trends may not continue in the future, in
Table of Contents
23
particular if the cruise line, air travel and hotel industries begin to recover. Over the past several years, we have seena shift in our overall sales mix towards new travel trailer vehicles, which has led to declines in our average sellingprice of a new vehicle unit. From 2015 to 2020, new vehicle travel trailer units as a percent of total new vehiclesincreased from 62% to 74% of total new vehicle unit sales and the average selling price of a new vehicle unit hasdeclined from $39,853 to $36,277. The increased popularity of new travel trailer vehicles and the lower price points ofthese units compared to other new vehicle classes, such as motorhomes and fifth wheels, could continue to lower ouraverage selling price of a new vehicle unit and impact our ability to grow same store revenue.
Competition in the market for services, protection plans, products and resources targeting the RV lifestyle orRV enthusiast could reduce our revenues and profitability.
The markets for services, protection plans, products and resources targeting RV, outdoor and active sportsenthusiasts are highly fragmented and competitive. Major competitive factors that drive the RV, outdoor and activesports markets are price, product and service features, technology, performance, reliability, quality, availability,variety, delivery and customer service. We compete directly or indirectly with the following types of companies:
● other RV dealers selling new and used RVs;
● major national insurance and warranty companies, providers of roadside assistance and providers ofextended vehicle service contracts;
● multi-channel retailers and mass merchandisers, warehouse clubs, discount stores, department storesand other retailers, such as Wal-Mart, Target and Amazon;
● other specialty retailers that compete with us across a significant portion of our merchandising categoriesthrough retail, catalog or e-commerce businesses, such as Bass Pro Shops (including Cabela's),Sportsman's Warehouse and REI;
● distributors of assembled RV furniture;
● online retailers; and
● independent, local specialty stores.
Additional competitors may enter the businesses in which we currently operate. Moreover, some of our massmerchandising competitors do not currently compete in many of the product categories we offer, but may choose tooffer a broader array of competing products in the future. Particularly in the larger outdoor goods and services marketoutside the RV market, our competitors may have a larger number of stores and greater market presence, namerecognition and financial, distribution and marketing resources than us. Moreover, some of our competitors may buildnew stores in or near our existing locations. In addition, an increase in the number of aggregator and pricecomparison sites for insurance products may negatively impact our sales of these products. If any of our competitorssuccessfully provides a broader, more efficient or attractive combination of services, protection plans, products andresources to our target customers, our business results could be materially adversely affected. Our inability tocompete effectively with existing or potential competitors could have a material adverse effect on our business,financial condition and results of operations.
Our expansion into new, unfamiliar markets, businesses, products lines or categories presents increasedrisks that may prevent us from being profitable in these new markets, businesses, product lines orcategories. Delays in opening or acquiring new retail locations could have a material adverse effect on ourbusiness, financial condition and results of operations.
In the past, we have acquired new retail locations in new markets and new businesses, product lines orproduct categories. As a result of this and any future expansion, we may have less familiarity with local consumerpreferences and less business, product or category knowledge with respect to new businesses,
Table of Contents
24
product lines or categories, and could encounter difficulties in attracting customers due to a reduced level ofconsumer familiarity with our brands or reduced product or category knowledge. Other factors that may impact ourability to open or acquire new retail locations in new markets and to operate them profitably or acquire newbusinesses, product lines or categories, many of which are beyond our control, include:
● our ability to identify suitable acquisition opportunities or new locations, including our ability to gather andassess demographic and marketing data to determine consumer demand for our products in thelocations we select or accurately assess profitability;
● our ability to negotiate favorable lease agreements;
● our ability to secure product lines;
● delays in the entitlement process, the availability of construction materials and labor for new retaillocations and significant construction delays or cost overruns;
● our ability to secure required third-party or governmental permits and approvals;
● our ability to hire and train skilled store operating personnel, especially management personnel;
● our ability to provide a satisfactory mix of merchandise that is responsive to the needs of our customersliving in the geographic areas where new retail locations are built or acquired;
● our ability to supply new retail locations with inventory in a timely manner;
● our competitors building or leasing retail locations near our retail locations or in locations we haveidentified as targets;
● regional economic and other factors in the geographic areas where we expand; and
Our expansion into new markets, businesses, products or categories such as a purchase of an RV furnituredistributor, may not be supported adequately by our current resources, personnel and systems, and may also createnew distribution and merchandising challenges, including additional strain on our distribution centers, an increase ininformation to be processed by our management information systems and diversion of management attention fromexisting operations. To the extent that we are not able to meet these additional challenges, our sales could decrease,and our operating expenses could increase, which could have a material adverse effect on our business, financialcondition and results of operations.
Finally, the size, timing, and integration of any future new retail location openings or acquisitions or theacquisition of new businesses, product lines or categories may cause substantial fluctuations in our results ofoperations from quarter to quarter. Consequently, our results of operations for any quarter may not be indicative ofthe results that may be achieved for any subsequent quarter or for a full fiscal year. These fluctuations couldadversely affect the market price of our common stock.
As a result of the above factors, we cannot assure you that we will be successful in operating our retaillocations in new markets or acquiring new businesses, product lines or categories on a profitable basis, and ourfailure to do so could have a material adverse effect on our business, financial condition and results of operations.
Unforeseen expenses, difficulties, and delays encountered in connection with acquisitions could inhibit ourgrowth and negatively impact our profitability
Our ability to continue to grow through the acquisition of additional retail locations will depend upon variousfactors, including the following:
● the availability of suitable acquisition candidates at attractive purchase prices;
Table of Contents
25
● the ability to compete effectively for available acquisition opportunities;
● the availability of cash on hand, borrowed funds or Class A common stock with a sufficient market priceto finance the acquisitions;
● the ability to obtain any requisite third-party or governmental approvals; and
● the absence of one or more third parties attempting to impose unsatisfactory restrictions on us inconnection with their approval of acquisitions.
As a part of our strategy, we occasionally engage in discussions with various dealerships and other outdoorlifestyle businesses regarding their potential acquisition by us. In connection with these discussions, we and eachpotential acquisition candidate exchange confidential operational and financial information, conduct due diligenceinquiries, and consider the structure, terms, and conditions of the potential acquisition. Potential acquisitiondiscussions frequently take place over a long period of time and involve difficult business integration and other issues,including in some cases, management succession and related matters. As a result of these and other factors, anumber of potential acquisitions that from time to time appear likely to occur do not result in binding legal agreementsand are not consummated. In addition, we may have disagreements with potential acquisition targets, which couldlead to litigation. Any of these factors or outcomes could result in a material adverse effect on our business, financialcondition and results of operations.
Failure to maintain the strength and value of our brands could have a material adverse effect on ourbusiness, financial condition and results of operations.
Our success depends on the value and strength of our key brands, including Good Sam, Camping World,Gander Outdoors, and Gander RV. These brands are integral to our business as well as to the implementation of ourstrategies for expanding our business. Maintaining, enhancing, promoting and positioning our brands, particularly innew markets where we have limited brand recognition, will depend largely on the success of our marketing andmerchandising efforts and our ability to provide high quality services, protection plans, products and resources and aconsistent, high quality customer experience. Our brands could be adversely affected if we fail to achieve theseobjectives, if we fail to comply with local laws and regulations, if we are subject to publicized litigation or if our publicimage or reputation were to be tarnished by negative publicity. Some of these risks may be beyond our ability tocontrol, such as the effects of negative publicity regarding our manufacturers, suppliers or third-party providers ofservices or negative publicity related to members of management. Any of these events could result in decreases inrevenues. Further, maintaining, enhancing, promoting and positioning our brands’ image may require us to makesubstantial investments, which could adversely affect our cash flow, and which may ultimately be unsuccessful.These factors could have a material adverse effect on our business, financial condition and results of operations.
Our failure to successfully order and manage our inventory to reflect consumer demand in a volatile marketand anticipate changing consumer preferences and buying trends has and may continue to have an adverseeffect on our business, financial condition and results of operations.
Our success depends upon our ability to successfully manage our inventory and to anticipate and respond tomerchandise trends and consumer demands in a timely manner. Our products appeal to consumers who are, or couldbecome, RV owners and/or outdoor and active sports enthusiasts across North America. The preferences of theseconsumers cannot be predicted with certainty and are subject to change. Further, the retail consumer industry, by itsnature, is volatile and sensitive to numerous economic factors, including consumer preferences, competition, marketconditions, general economic conditions and other factors outside of our control. We typically order merchandise wellin advance of the following selling season making it difficult for us to respond rapidly to new or changing producttrends, increases or decreases in consumer demand or changes in prices. If we misjudge either the market for ourmerchandise or our consumers’ purchasing habits in the future, our revenues may decline significantly, and we maynot have sufficient quantities of merchandise to satisfy consumer demand or sales orders, or we may be required todiscount excess inventory, either of which could have a material adverse effect on our business, financial conditionand results of operations. For example, in the normal course of business, we periodically will implement discountingto reduce our excess RV inventory. In addition, we have exited certain non-RV retail categories because we felt thosecategories did not
Table of Contents
26
have sufficient demand or sales margins to justify our inventory levels. These activities have negatively impacted ourgross margin, operating margin and selling, general and administrative expenses.
Our same store revenue may fluctuate and may not be a meaningful indicator of future performance.
Our same store revenue may vary from quarter to quarter. In addition to the above risk factors a number ofadditional factors have historically affected, and will continue to affect, our same store revenue results, including:
● changes or anticipated changes to regulations related to some of the products we sell or to the localitiesin which we operate;
● our ability to provide quality customer service that will increase our conversion of shoppers into payingcustomers;
● atypical weather patterns;
● changes in our product mix;
● changes in sales of Good Sam services and plans and retention and renewal rates for our annuallyrenewing Good Sam services and plans; and
● changes in pricing and average unit sales.
An unanticipated decline in revenues or same store revenue may cause the price of our Class A commonstock to fluctuate significantly.
Our business is seasonal and this leads to fluctuations in sales and revenues.
We have experienced, and expect to continue to experience, variability in revenue, net income and cashflows as a result of annual seasonality in our business. The RV outdoor and active sports specialty retail industriesare cyclical and because RVs are used primarily by vacationers and campers, demand for services, protection plans,products and resources generally declines during the winter season, while sales and profits are generally highestduring the spring and summer months. In addition, unusually severe weather conditions in some geographic areasmay impact demand.
On average, over the three years ended December 31, 2020, we have generated 29.9% and 28.9% of ourannual revenue in the second and third fiscal quarters, respectively, which include the spring and summer months.We have historically incurred additional expenses in the second and third fiscal quarters due to higher purchasevolumes, increased staffing in our retail locations and program costs. If, for any reason, we miscalculate the demandfor our products or our product mix during the second and third fiscal quarters, our sales in these quarters coulddecline, resulting in higher labor costs as a percentage of sales, lower margins and excess inventory, which couldhave a material adverse effect on our business, financial condition and results of operations.
Additionally, SG&A expenses as a percentage of gross profit tend to be higher in the first and fourth quartersdue to the timing of acquisitions and the seasonality of our business. We prefer to acquire new retail locations in thefirst and fourth quarters of each year in order to provide time for the location to be re-modeled and to ramp upoperations ahead of the spring and summer months.
Due to our seasonality, the possible adverse impact from other risks associated with our business, includingatypical weather, consumer spending levels and general business conditions, is potentially greater if any such risksoccur during our peak sales seasons.
Table of Contents
27
Our ability to operate and expand our business and to respond to changing business and economicconditions will depend on the availability of adequate capital.
The operation of our business, the rate of our expansion and our ability to respond to changing business andeconomic conditions depend on the availability of adequate capital, which in turn depends on cash flow generated byour business and, if necessary, the availability of equity or debt capital. We also require sufficient cash flow to meetour obligations under our existing debt agreements. (See “Management's Discussion and Analysis of FinancialCondition and Results of Operations — Liquidity and Capital Resources — Description of Senior Secured CreditFacilities and Floor Plan Facility” in Item 7 of Part II of this Form 10-K). We cannot assure you that our cash flow fromoperations or cash available under our financing agreements, including our $35.0 million revolving credit facility (the“Revolving Credit Facility”) or our floor plan financing through the Seventh Amended and Restated Credit Agreement,as amended (“Floor Plan Facility”), will be sufficient to meet our needs. If we are unable to generate sufficient cashflows from operations in the future, and if availability under our Revolving Credit Facility or our Floor Plan Facility isnot sufficient, or if additional borrowings under our Real Estate Facility are unavailable, we may have to obtainadditional financing. If we obtain additional capital by issuing equity, the interests of our existing stockholders will bediluted. If we incur additional indebtedness, that indebtedness may contain significant financial and other covenantsthat may significantly restrict our operations.
In addition, the United Kingdom’s Financial Conduct Authority, which regulates the London Inter-bank OfferedRate (“LIBOR”), has announced that it intends to stop encouraging or requiring banks to submit LIBOR rates after2021 and in some cases, by mid-2023, and it is unclear if LIBOR will cease to exist or if new methods of calculatingLIBOR will evolve. We currently have the option to determine our interest rate using a formula that includes either theLIBOR rate or an alternate base rate. When LIBOR ceases to exist or the methods of calculating LIBOR change fromtheir current form, we may no longer have the ability to elect the LIBOR rate under our Floor Plan Facility, RevolvingCredit Facility or our term loan facility (the “Term Loan Facility” and together with the Revolving Credit Facility (the“Senior Secured Credit Facilities”) or our current or future indebtedness may be adversely affected. This could impactour interest costs and our ability to borrow additional funds.
Our Senior Secured Credit Facilities and our Floor Plan Facility contain restrictive covenants that may impairour ability to access sufficient capital and operate our business.
Our Senior Secured Credit Facilities and our Floor Plan Facility contain various provisions that limit our abilityto, among other things:
● incur additional indebtedness;
● incur certain liens;
● consolidate or merge;
● alter the business conducted by us and our subsidiaries;
● make investments, loans, advances, guarantees and acquisitions;
● sell assets, including capital stock of our subsidiaries;
● pay dividends on capital stock or redeem, repurchase or retire capital stock or certain otherindebtedness;
● engage in transactions with affiliates; and
● enter into agreements restricting our subsidiaries’ ability to pay dividends.
In addition, the restrictive covenants in our Senior Secured Credit Facilities and our Floor Plan Facility requireus to maintain specified financial ratios and provide for acceleration of the indebtedness thereunder in
Table of Contents
28
the case of certain events of default, which could have a material adverse effect on our business, financial conditionand results of operations. See “Management's Discussion and Analysis of Financial Condition and Results ofOperations — Liquidity and Capital Resources — Description of Senior Secured Credit Facilities and Floor PlanFacility” in Item 7 of Part II of this Form 10-K and Note 9 — Long-Term Debt to our consolidated financial statementsincluded in Item 8 of Part II of this Form 10-K. Our ability to comply with those financial ratios may be affected byevents beyond our control, and our failure to comply with these ratios could result in an event of default. In an event ofdefault, we may not have sufficient funds available, or we may not have access to sufficient capital from othersources, to repay any accelerated debt and our lenders could foreclose on liens which cover substantially all of ourassets.
We primarily rely on five fulfillment and distribution centers for our retail, e-commerce and catalogbusinesses, and, if there is a natural disaster or other serious disruption at any such facility, we may beunable to deliver merchandise effectively to our stores or customers.
We handle almost all of our e-commerce and catalog orders and distribution to our retail stores through fivefulfillment and distribution facilities (see “Item 2. Properties” under Part I of this Form 10-K). Any natural disaster orother serious disruption at any such facility due to fire, tornado, earthquake, flood or any other cause could damageour on-site inventory or impair our ability to use such distribution and fulfillment center. While we maintain businessinterruption insurance, as well as general property insurance, the amount of insurance coverage may not be sufficientto cover our losses in such an event. Any of these occurrences could impair our ability to adequately stock our storesor fulfill customer orders and harm our results of operations.
Natural disasters, whether or not caused by climate change, unusual weather conditions, epidemicoutbreaks, terrorist acts and political events could disrupt business and result in lower sales and otherwiseadversely affect our financial performance.
The occurrence of one or more natural disasters, such as tornadoes, hurricanes, fires, floods, hail storms andearthquakes, unusual weather conditions, epidemic outbreaks such as Ebola, Zika virus, novel coronavirus ormeasles, terrorist attacks or disruptive political events in certain regions where our stores are located could adverselyaffect our business and result in lower sales. Severe weather, such as heavy snowfall or extreme temperatures, maydiscourage or restrict customers in a particular region from traveling to our stores or utilizing our products, therebyreducing our sales and profitability. Natural disasters including tornadoes, hurricanes, floods, hailstorms andearthquakes may damage our stores or other operations, which may materially adversely affect our consolidatedfinancial results. The public health crisis caused by the COVID-19 pandemic and the measures being taken bygovernments, businesses, including us and our vendors, and the public at large to limit COVID-19's spread have had,and could again have in the future, certain negative impacts on our business including product shortages and reducedcustomer demand for our products. In addition to business interruption, our retailing business is subject to substantialrisk of property loss due to the concentration of property at our retail locations. To the extent these events also impactone or more of our key suppliers or result in the closure of one or more of our distribution centers or our corporateheadquarters, we may be unable to maintain inventory balances, maintain delivery schedules or provide other supportfunctions to our stores. Our insurance coverage may also be insufficient to cover all losses related to such events.Any of these events could have a material adverse effect on our business, financial condition and results ofoperations.
We depend on our relationships with third-party providers of services, protection plans, products andresources and a disruption of these relationships or of these providers’ operations could have an adverseeffect on our business and results of operations.
Our business depends in part on developing and maintaining productive relationships with third-partyproviders of services, protection plans, products and resources that we market to our customers. During the yearended December 31, 2020, we sourced our products from over 2,000 domestic and international vendors.Additionally, we rely on certain third-party providers to support our services, protection plans, products and resources,including insurance carriers for our property and casualty insurance and extended service contracts, banks andcaptive financing companies for vehicle financing and refinancing, Comenity Capital Bank as the issuer of our co-branded credit card and a tow provider network for our roadside assistance programs. We cannot accurately predictwhen, or the extent to which, we will experience any disruption in the supply of
Table of Contents
29
products from our vendors or services from our third-party providers. Any such disruption could negatively impact ourability to market and sell our services, protection plans, products and resources, which could have a material adverseeffect on our business, financial condition and results of operations. In addition, Comenity Capital Bank could declineto renew our services agreement or become insolvent and unable to perform our contract, and we may be unable totimely find a replacement bank to provide these services.
We depend on merchandise purchased from our vendors to obtain products for our retail locations. We haveno contractual arrangements providing for continued supply from our key vendors, and our vendors may discontinueselling to us at any time. Changes in commercial practices of our key vendors or manufacturers, such as changes invendor support and incentives or changes in credit or payment terms, could also negatively impact our results. If welose one or more key vendors or are unable to promptly replace a vendor that is unwilling or unable to satisfy ourrequirements with a vendor providing equally appealing products at comparable prices, we may not be able to offerproducts that are important to our merchandise assortment.
We also are subject to risks, such as the price and availability of raw materials, labor disputes, unionorganizing activity, strikes, inclement weather, natural disasters, war and terrorism and adverse general economicand political conditions that might limit our vendors’ ability to provide us with quality merchandise on a timely andcost-efficient basis. We may not be able to develop relationships with new vendors, and products from alternativesources, if any, may be of a lesser quality and more expensive than those we currently purchase. Additionally, oursale of firearms generally, may have an adverse effect on our relationships with one or more of our third-partyproviders, or key suppliers or vendors, and could negatively impact our results. Any delay or failure in offering qualityproducts and services to our customers could have a material adverse effect on our business, financial condition andresults of operations.
We offer emergency roadside assistance to our customers at a fixed price per year and we pay our towprovider network based on usage. If the amount of emergency roadside claims substantially exceeds our estimates orif our tow provider is unable to adequately respond to calls, it could have a material adverse effect on our business,financial condition or results of operations.
With respect to the insurance programs that we offer, we are dependent on the insurance carriers thatunderwrite the insurance to obtain appropriate regulatory approvals and maintain compliance with insuranceregulations. If such carriers are out of compliance, we may be required to use an alternative carrier or products orcease marketing certain products in certain states, which could have a material adverse effect on our business,financial condition and results of operations. If we are required to use an alternative carrier or change our products, itmay materially increase the time required to bring an insurance related product to market. Any disruption in ourservice offerings could harm our reputation and result in customer dissatisfaction.
Additionally, we provide financing to qualified customers through a number of third-party financing providers.If one or more of these third-party providers ceases to provide financing to our customers, provides financing to fewercustomers or no longer provides financing on competitive terms, or if we were unable to replace the current third-partyproviders upon the occurrence of one or more of the foregoing events, it could have a material adverse effect on ourbusiness, financial condition and results of operations.
Because certain of the products that we sell are manufactured abroad, we may face delays, new or increasedtariffs, increased cost or quality control deficiencies in the importation of these products, which couldreduce our net sales and profitability.
A portion of the products that we purchase for resale, including those purchased from domestic suppliers, ismanufactured abroad in China and other countries. In addition, we believe most of our private label merchandise ismanufactured abroad. Trade tensions between the United States and China, and other countries escalated in recentyears. U.S. tariff impositions against Chinese exports have generally been followed by retaliatory Chinese tariffs onU.S. exports to China. We may not be able to mitigate the impacts of any future tariffs, and our business, results ofoperations and financial position would be materially adversely affected. As a result, our foreign imports, in particularimports from China, subject us to the risks of changes in, or the imposition of new import tariffs, duties or quotas, newrestrictions on imports, loss of “most favored nation” status with the United States for a particular foreign country,antidumping or countervailing duty orders, retaliatory actions in response to illegal trade practices, work stoppages,delays in shipment, freight expense
Table of Contents
30
increases, product cost increases due to foreign currency fluctuations or revaluations and economic uncertainties. Ifany of these or other factors were to cause a disruption of trade from the countries in which the suppliers of ourvendors are located or impose additional costs in connection with the purchase of our products, we may be unable toobtain sufficient quantities of products to satisfy our requirements and our results of operations could be adverselyaffected.
To the extent that any foreign manufacturers which supply products to us directly or indirectly utilize qualitycontrol standards, labor practices or other practices that vary from those legally mandated or commonly accepted inthe United States, we could be hurt by any resulting negative publicity or, in some cases, face potential liability.
A portion of our net income is from financing, insurance and extended service contracts, which depend onthird-party lenders and insurance companies. We cannot assure you third-party lending institutions willcontinue to provide financing for RV purchases.
A portion of our net income comes from the fees we receive from lending institutions and insurancecompanies for arranging financing and insurance coverage for our customers unless customers prepay the financingwithin a specified period (generally within six months of making the loan), in which case we are required to rebate (or“chargeback”) all or a portion of the commissions paid to us by the lending institution. Our revenues from financingfees and vehicle service contract fees are recorded net of a reserve for estimated future chargebacks based onhistorical operating results. Lending institutions may change the criteria or terms they use to make loan decisions,which could reduce the number of customers for whom we can arrange financing, or may elect to not continue toprovide these products with respect to RVs. Our customers may also use the internet or other electronic methods tofind financing alternatives. If any of these events occur, we could lose a significant portion of our income and profit.
Furthermore, new and used vehicles may be sold and financed through retail installment sales contractsentered into between us and third-party purchasers. Prior to entering into a retail installment sales contract with athird-party purchaser, we typically have a commitment from a third-party lender for the assignment of such retailinstallment sales contract, subject to final review, approval and verification of the retail installment sales contract,related documentation and the information contained therein. Retail installment sales contracts are typically assignedby us to third-party lenders simultaneously with the execution of the retail installment sales contracts. Contracts intransit represent amounts due from third-party lenders from whom pre-arranged assignment agreements have beendetermined, and to whom the retail installment sales contracts have been assigned. We recognize revenue from thesale of new and used vehicles upon completion of the sale to the customer. Conditions to completing a sale includehaving an agreement with the customer, including pricing, whereby the sales price must be reasonably expected tobe collected and having control transferred to the customer. Funding from the third-party lender is provided uponreceipt, final review, approval and verification of the retail installment sales contract, related documentation and theinformation contained therein. Retail installment sales contracts are typically funded within ten days of the initialapproval of the retail installment sales contract by the third-party lender. Contracts in transit are included in currentassets in our consolidated financial statements included in Item 8 of Part II of this Form 10-K and totaled $48.2 millionand $44.9 million as of December 31, 2020 and December 31, 2019, respectively. Any defaults on these retailinstallment sales contracts could have a material adverse effect on our business, financial condition and results ofoperations.
If we are unable to retain senior executives and attract and retain other qualified employees, our businessmight be adversely affected.
Our success depends in part on our ability to attract, hire, train and retain qualified managerial, sales andmarketing personnel. Competition for these types of personnel is high. We may be unsuccessful in attracting andretaining the personnel we require to conduct our operations successfully and, in such an event, our business couldbe materially and adversely affected. Our success also depends to a significant extent on the continued service andperformance of our senior management team, including our Chairman and Chief Executive Officer, Marcus Lemonis.The loss of any member of our senior management team could impair our ability to execute our business plan andcould therefore have a material adverse effect on our business, results of operations and financial condition.Additionally, certain members of our management team, including
Table of Contents
31
Mr. Lemonis, currently pursue and may continue to pursue other business ventures, which could divert their attentionfrom executing on our business plan and objectives. We do not currently maintain key-man life insurance policies onany member of our senior management team or other key employees.
We are subject to risks associated with leasing substantial amounts of space.
We lease substantially all of the real properties where we have retail operations as well as certain corporateoffices and distribution centers. Our leases generally provide for fixed monthly rentals with escalation clauses andrange from five to twenty years. The profitability of our business is in part dependent on renewing leases for stores indesirable locations and, if necessary, identifying and closing underperforming stores or relocating these stores toalternative locations in a cost-effective manner. Typically, a large portion of a store’s operating expense is the costassociated with leasing the location.
Additionally, over time our current store locations may not continue to be desirable because of changes indemographics within the surrounding area or a decline in shopping traffic, including traffic generated by other nearbystores. Although we have the right to terminate some of our leases under specified conditions by making certainpayments, we may not be able to terminate a particular lease if or when we would like to do so. If we decide to closestores, we are generally required to either continue to pay rent and operating expenses for the balance of the leaseterm or, for certain locations, pay exercise rights to terminate, which in either case could be expensive. Even if we areable to assign or sublease vacated locations where our lease cannot be terminated, we may remain liable on thelease obligations if the assignee or sublessee does not perform.
If we are unable to service our lease expenses or are unable to, on favorable terms, negotiate renewals ofleases at desirable locations or identify and close underperforming locations, we may be forced to seek alternativesites in our target markets, which may be difficult and have a material adverse effect on our business, financialcondition and results of operations.
Our private brand offerings expose us to various risks.
We expect to continue to grow our exclusive private brand offerings through a combination of brands that weown and brands that we license from third parties. We have invested in our development and procurement resourcesand marketing efforts relating to these private brand offerings. Although we believe that our private brand productsoffer value to our customers at each price point and provide us with higher gross margins than comparable third-partybranded products we sell, the expansion of our private brand offerings also subjects us to certain specific risks inaddition to those discussed elsewhere in this section, such as:
● potential mandatory or voluntary product recalls;
● our ability to successfully protect our proprietary rights (including defending against counterfeit, knock offs,grey-market, infringing or otherwise unauthorized goods);
● our ability to successfully navigate and avoid claims related to the proprietary rights of third parties;
● our ability to successfully administer and comply with obligations under license agreements that we have withthe licensors of brands, including, in some instances, certain minimum sales requirements that, if not met,could cause us to lose the licensing rights or pay damages; and
● other risks generally encountered by entities that source, sell and market exclusive branded offerings forretail.
An increase in sales of our private brands may also adversely affect sales of our vendors’ products, whichmay, in turn, adversely affect our relationship with our vendors. Our failure to adequately address some or all of theserisks could have a material adverse effect on our business, results of operations and financial condition.
Table of Contents
32
We could incur asset impairment charges for goodwill, intangible assets or other long-lived assets.
We have a significant amount of goodwill, intangible assets and other long-lived assets. At least annually, wereview goodwill for impairment. Long-lived assets, operating lease assets, identifiable intangible assets and goodwillare also reviewed for impairment whenever events or changes in circumstances indicate the carrying amount of anasset may not be recoverable from future cash flows. These events or circumstances could include a significantchange in the business climate, legal factors, operating performance indicators, competition, sale or disposition of asignificant portion of the business or other factors. If the carrying value of a long-lived asset is considered impaired,an impairment charge is recorded for the amount by which the carrying value of the long-lived asset exceeds its fairvalue. Our determination of future cash flows, future recoverability and fair value of our long-lived assets as well asthe reporting unit fair value used in our goodwill analysis include significant estimates and assumptions. Changes inthose estimates or assumptions or lower than anticipated future financial performance may result in the identificationof an impaired asset and a non-cash impairment charge, which could be material. See Note 5 — Restructuring andLong-lived Asset Impairment to our consolidated financial statements included in Item 8 of Part II of this Form 10-K fora discussion of impairment charges for the year ended December 31, 2020. We may in the future identify additionalimpairment charges and any such charges could adversely affect our business, financial condition and results ofoperations.
Risks related to Regulation and Litigation
Our business is subject to numerous federal, state and local regulations.
Our operations are subject to varying degrees of federal, state and local regulation, including our RV sales,firearms sales, RV financing, outbound telemarketing, direct mail, roadside assistance programs, insurance activities,and the sale of extended service contracts. New regulatory efforts may be proposed from time to time that have amaterial adverse effect on our ability to operate our businesses or our results of operations. For example, in the pasta principal source of leads for our direct response marketing efforts was new vehicle registrations provided by motorvehicle departments in various states. Currently, all states restrict access to motor vehicle registration information.
We are subject to a number of laws and regulations relating to consumer protection, information security,data protection and privacy. Many of these laws and regulations are still evolving and could be interpreted in waysthat could harm our business or limit the services we are able to offer. In the area of information security and dataprotection, the laws in several states in the United States and most countries require companies to implement specificinformation security controls and legal protections to protect certain types of personally identifiable information.Likewise, most states in the United States and most countries have laws in place requiring companies to notify usersif there is a security breach that compromises certain categories of their personally identifiable information. Any failureon our part to comply with these laws may subject us to significant liabilities. For example, the California ConsumerPrivacy Act (“CCPA”) establishes a new privacy framework that expands the definition of personal information,establishes new data privacy rights for consumers residing in the State of California, imposes special rules on thecollection of consumer data from minors, creates new notice obligations and new limits on the sale of personalinformation, and creates a new and potentially severe statutory damages framework for (i) violations of the CCPA and(ii) businesses that fail to implement reasonable security procedures and practices to prevent data breaches.Additionally, a new ballot initiative, the California Privacy Rights Act (“CPRA”), recently passed in California. TheCPRA will impose additional data protection obligations on companies doing business in California, includingadditional consumer rights processes, limitations on data uses, new audit requirements for higher risk data, and optouts for certain uses of sensitive data. It will also create a new California data protection agency authorized to issuesubstantive regulations and could result in increased privacy and information security enforcement. The majority ofthe provisions will go into effect on January 1, 2023, and additional compliance investment and potential businessprocess changes may be required.
We are also subject to federal and numerous state consumer protection and unfair trade practice laws andregulations relating to the sale, transportation and marketing of motor vehicles, including so-called “lemon laws.”Federal, state and local laws and regulations also impose upon vehicle operators various restrictions on the lengthand width of motor vehicles that may be operated in certain jurisdictions or on certain roadways.
Table of Contents
33
Certain jurisdictions also prohibit the sale of vehicles exceeding length restrictions. Federal and state authorities alsohave various environmental control standards relating to air, water, noise pollution and hazardous waste generationand disposal which affect our business and operations.
Areas of our business also affected by laws and regulations include, but are not limited to, labor (includingfederal and state minimum wage increases), advertising, consumer protection, real estate, promotions, quality ofservices, intellectual property, tax, import and export, anti-corruption, anti-competition, environmental, health andsafety. Compliance with these laws and others may be onerous and costly, at times, and may be inconsistent fromjurisdiction to jurisdiction which further complicates compliance efforts.
Furthermore, our property and casualty insurance programs, and our extended service contracts that we offerthrough third-party insurance carriers are subject to various federal and state laws and regulations governing thebusiness of insurance, including, without limitation, laws and regulations governing the administration, underwriting,marketing, solicitation, liability obligations or sale of insurance programs. Any failure by us or our third-party insuranceproviders to comply with current licensing and approval requirements could result in such regulators denying theirinitial or renewal applications for such licenses, modifying the terms of licenses or revoking licenses that theycurrently possess, which could severely inhibit our ability to market these products. Additionally, certain state lawsand regulations govern the form and content of certain disclosures that must be made in connection with the sale,advertising or offer of any insurance program to a consumer. If we fail to comply with these regulations, we may beordered to pay fines or penalties by regulators or to discontinue certain products.
We offer extended service contracts that may be purchased as a supplement to the original purchaser’swarranty. These products are subject to complex federal and state laws and regulations. There can be no assurancethat regulatory authorities in the jurisdictions in which these products are offered will not seek to regulate or restrictthese products. Failure to comply with applicable laws and regulations, including with respect to the transfer ofadministration and liability obligations associated with these extended service contracts to a third party upon purchaseby the customer, could result in fines or other penalties including orders by state regulators to discontinue sales of thewarranty products in one or more jurisdictions. Such a result could materially and adversely affect our business,results of operations and financial condition.
State dealer laws generally provide that a manufacturer may not terminate or refuse to renew a dealeragreement unless it has first provided the dealer with written notice setting forth good cause and stating the groundsfor termination or non-renewal. If such dealer laws are repealed in the states in which we operate, manufacturers maybe able to terminate our dealer agreements without providing advance notice, an opportunity to cure or a showing ofgood cause. Without the protection of state dealer laws, it may also be more difficult for our dealerships to renew theirdealer agreements upon expiration.
In addition, in connection with the sale of firearms in our stores, we must comply with a number of federal andstate laws and regulations related to the sale of firearms and ammunition, including the federal Brady HandgunViolence Prevention Act. If we fail to comply with Bureau of Alcohol, Tobacco, Firearms and Explosives (the “ATF”)rules and regulations, the ATF may limit our growth or business activities, levy fines against us or, ultimately, revokeour license to do business.
Several states currently have laws in effect that are similar to, and in certain cases, more restrictive than,these federal laws. Compliance with all of these regulations is costly and time-consuming. Inadvertent violation of anyof these regulations could cause us to incur fines and penalties and may also lead to restrictions on our ability tomanufacture and sell our products and services and to import or export the products we sell.
We have instituted various and comprehensive policies and procedures to address compliance. However,there can be no assurance that employees, contractors, vendors or our agents will not violate such laws andregulations or our policies and procedures. For more information on the various regulations applicable to ourbusiness, see “Item I. Business—Laws and Regulations” under Part I of this Form 10-K.
Table of Contents
34
Changes in government policies and firearms legislation could adversely affect our financial results.
The sale, purchase, ownership and use of firearms are subject to numerous and varied federal, state andlocal governmental regulations. Federal laws governing firearms include the National Firearms Act, the FederalFirearms Act, the Arms Export Control Act and the Gun Control Act of 1968. These laws generally govern themanufacture, import, export, sale and possession of firearms and ammunition.
Currently, some members of the federal legislature and several state legislatures are considering additionallegislation relating to the regulation of firearms and ammunition. These proposed bills are extremely varied. Ifenacted, such legislation could effectively ban or severely limit the sale of affected firearms or ammunition. Inaddition, if such restrictions are enacted and are incongruent, we could find it difficult, expensive or even practicallyimpossible to comply with them, which could impede the sale of firearms. We cannot assure you that the regulation ofour business activities will not become more restrictive in the future and that any such restriction will not have amaterial adverse effect on our business. For more information on the government policies and firearms legislationapplicable to our business, see “Item I. Business— Laws and Regulations” under Part I of this Form 10-K.
Our failure to comply with certain environmental regulations could adversely affect our business, financialcondition and results of operations.
Our operations involve the use, handling, storage and contracting for recycling and/or disposal of materialssuch as motor oil and filters, transmission fluids, antifreeze, refrigerants, paints, thinners, batteries, cleaning products,lubricants, degreasing agents, tires and propane. Consequently, our business is subject to a complex variety offederal, state and local requirements that regulate the environment, public health and safety, and we may incursignificant costs to comply with such requirements. Our failure to comply with these regulations could cause us tobecome subject to fines and penalties or otherwise have an adverse impact on our business. In addition, we haveindemnified certain of our landlords for any hazardous waste which may be found on or about property we lease. Ifany such hazardous waste were to be found on property that we occupy, a significant claim giving rise to ourindemnity obligation could have a negative effect on our business, financial condition and results of operations.
Climate change legislation or regulations restricting emission of “greenhouse gases” could result inincreased operating costs and reduced demand for the RVs we sell.
The United States Environmental Protection Agency has adopted rules under existing provisions of thefederal Clean Air Act that require a reduction in emissions of greenhouse gases from motor vehicles. The adoption ofany laws or regulations requiring significant increases in fuel economy requirements or new federal or staterestrictions on vehicles and automotive fuels in the United States could adversely affect demand for those vehiclesand could have a material adverse effect on our business, financial condition and results of operations.
A failure in our e-commerce operations, security breaches and cybersecurity risks could disrupt ourbusiness and lead to reduced sales and growth prospects and reputational damage.
Consumers are increasingly embracing shopping online and through mobile commerce applications. As aresult, a growing portion of total consumer expenditures with retailers is occurring online and through mobilecommerce applications and a declining portion of total consumer expenditures is occurring at brick and mortar retaillocations. Our e-commerce business is an important element of our brands and relationship with our customers, andwe expect it to continue to grow. In addition to changing consumer preferences and shifting traffic patterns and buyingtrends in e-commerce, we are vulnerable to additional risks and uncertainties associated with e-commerce sales,including rapid changes in technology, website downtime and other technical failures, security breaches, cyber-attacks, consumer privacy concerns, changes in state tax regimes and government regulation of internet activities.Our failure to successfully respond to these risks and uncertainties could reduce our e-commerce sales, increase ourcosts, diminish our growth prospects and damage our brands, which could negatively impact our results of operationsand stock price.
Table of Contents
35
In addition, there is no guarantee that we will be able to expand our e-commerce business. Our competitorsmay have e-commerce businesses that are substantially larger and more developed than ours, which places us at acompetitive disadvantage. Although we continually update our websites, we may not be successful in implementingimproved website features and there is no guarantee that such improvements will expand our e-commerce business.If we are unable to expand our e-commerce business, our growth plans will suffer, and the price of our common stockcould decline.
We may be unable to enforce our intellectual property rights and we may be accused of infringing theintellectual property rights of third parties which could have a material adverse effect on our business,financial condition and results of operations.
We own a variety of registered trademarks and service marks for the names of our clubs, magazines andother publications. We also own the copyrights to certain articles in our publications. We believe that our trademarkand copyrights have significant value and are important to our marketing efforts. If we are unable to continue toprotect the trademarks and service marks for our proprietary brands, if such marks become generic or if third partiesadopt marks similar to our marks, our ability to differentiate our products and services may be diminished. In the eventthat our trademarks or service marks are successfully challenged by third parties, we could lose brand recognitionand be forced to devote additional resources to advertising and marketing new brands for our products.
From time to time, we may be compelled to protect our intellectual property, which may involve litigation.Such litigation may be time-consuming, expensive and distract our management from running the day-to-dayoperations of our business, and could result in the impairment or loss of the involved intellectual property. There is noguarantee that the steps we take to protect our intellectual property, including litigation when necessary, will besuccessful. The loss or reduction of any of our significant intellectual property rights could diminish our ability todistinguish our products from competitors’ products and retain our market share for our proprietary products. Ourinability to effectively protect our proprietary intellectual property rights could have a material adverse effect on ourbusiness, results of operations and financial condition.
Other parties also may claim that we infringe their proprietary rights. Such claims, whether or not meritorious,may result in the expenditure of significant financial and managerial resources, injunctions against us or the paymentof damages. These claims could have a material adverse effect on our business, financial condition and results ofoperations.
If we are unable to maintain or upgrade our information technology systems or if we are unable to convert toalternate systems in an efficient and timely manner, our operations may be disrupted or become lessefficient.
We depend on a variety of information technology systems for the efficient functioning of our business. Werely on certain hardware, telecommunications and software vendors to maintain and periodically upgrade many ofthese systems so that we can continue to support our business. Various components of our information technologysystems, including hardware, networks, and software, are licensed to us by third-party vendors. We rely extensivelyon our information technology systems to process transactions, summarize results and manage our business.Additionally, because we accept debit and credit cards for payment, we are subject to the Payment Card IndustryData Security Standard (the “PCI Standard”), issued by the Payment Card Industry Security Standards Council. Costsand potential problems and interruptions associated with the implementation of new or upgraded systems andtechnology such as those necessary to maintain compliance with the PCI Standard or with maintenance or adequatesupport of existing systems could also disrupt or reduce the efficiency of our operations. Any material interruptions orfailures in our payment-related systems could have a material adverse effect on our business, financial condition andresults of operations.
Table of Contents
36
Any disruptions to our information technology systems or breaches of our network security could interruptour operations, compromise our reputation, expose us to litigation, government enforcement actions andcostly response measures and could have a material adverse effect on our business, financial condition andresults of operations.
We rely on the integrity, security and successful functioning of our information technology systems andnetwork infrastructure across our operations. We use information technology systems to support product sales, ourGood Sam services and plans, manage procurement and our supply chain, track inventory information at our retaillocations, communicate customer information and aggregate daily sales, margin and promotional information. Wealso use information systems to report and audit our operational results.
We also have access to, collect, or maintain private or confidential information regarding our customers,associates and suppliers, as well as our business. For example, we have over 30 million unique contacts in ourdatabase as of December 31, 2020. This customer database includes information about our approximately 2.1 millionclub members and our 5.3 million Active Customers as of December 31, 2020. In addition, the protection of ourcustomer, club member, associate, supplier and company data is critical to us. The regulatory environmentsurrounding information security and privacy is increasingly demanding, with the frequent imposition of new andconstantly changing requirements across our business. In addition, customers have a high expectation that we willadequately protect their personal information from cyber-attack or other security breaches. A significant breach ofclub member, customer, employee, supplier, or company data could attract a substantial amount of negative mediaattention, damage our club member, customer and supplier relationships and our reputation, and result in lost sales,fines and/or lawsuits.
Our information technology, communication systems and electronic data may be vulnerable to damage orinterruption from earthquakes, acts of war or terrorist attacks, floods, fires, tornadoes, hurricanes, power loss andoutages, computer and telecommunications failures, computer viruses, loss of data, unauthorized data breaches,usage errors by our associates or our contractors or other attempts to harm our systems, including cyber-securityattacks, hacking by third parties, computer viruses or other breaches of cardholder data. Some of our systems are notfully redundant, and our disaster recovery planning cannot account for all eventualities. Any errors or vulnerabilities inour systems, or damage to or failure of our systems, could result in interruptions in our services and non-compliancewith certain regulations or expose us to risk of litigation and liability, which could have a material adverse effect on ourbusiness, financial condition and results of operations.
We maintain insurance to cover costs in the event of a breach, interruption of service, or other cyber-securityevent. Our insurance coverage may be insufficient to cover all losses.
We may be subject to product liability claims if people or property are harmed by the products we sell.
Some of the products we sell may expose us to product liability claims relating to personal injury, death, orenvironmental or property damage, and may require product recalls or other actions. Although we maintain liabilityinsurance, we cannot be certain that our coverage will be adequate for liabilities actually incurred or that insurancewill continue to be available to us on economically reasonable terms, or at all. In addition, some of our agreementswith our vendors and sellers do not indemnify us from product liability. In addition, even if a product liability claim isnot successful or is not fully pursued, the negative publicity surrounding a product recall or any assertion that ourproducts caused property damage or personal injury could damage our brand identity and our reputation with existingand potential consumers and have a material adverse effect on our business, financial condition and results ofoperations.
Any increase in the frequency and size of these claims, as compared to our experience in prior years, maycause the premium that we are required to pay for insurance to increase significantly and may negatively impactfuture insurance costs. It may also increase the amounts we pay in punitive damages, not all of which are covered byour insurance.
Table of Contents
37
We have been named in litigation, which has resulted in substantial costs and may result in reputationalharm and divert management’s attention and resources.
We face legal risks in our business, including claims from disputes with our employees and our formeremployees and claims associated with general commercial disputes, product liability and other matters. Risksassociated with legal liability often are difficult to assess or quantify and their existence and magnitude can remainunknown for significant periods of time.
We have been named in the past, are currently named and may be named in the future as defendants ofclass action lawsuits. For example, we were named as a defendant in a class action lawsuit by Camp Coast to Coastclub members, which alleged certain violations of California’s Unfair Competition Law at Business and ProfessionsCode and other laws, relating to our sale of trip points and certain advertising and marketing materials.
We are currently subject to securities class action litigation and may be subject to similar or other litigation inthe future. Recently, we were also named as a defendant in a putative class action lawsuit filed by two formeremployees, in the State of California and a former employee in the State of Washington, which alleged various wageand hour claims under the California and Washington Labor Codes. We have reached the terms of a preliminarysettlement. For information regarding these lawsuits, refer to Note 13, Commitments and Contingencies – Litigation ofour consolidated financial statements included in Part II, Item 8 of this Form 10-K.
The results of the securities class action lawsuits, shareholder derivative lawsuits, and any other future legalproceedings cannot be predicted with certainty. Regardless of their subject matter or merits, such legal proceedingshave resulted in and are likely to continue to result in significant cost to us, which may not be covered by insurance,may divert the attention of management or may otherwise have an adverse effect on our business, financial conditionand results of operations. Negative publicity from litigation, whether or not resulting in a substantial cost, couldmaterially damage our reputation and could have a material adverse effect on our business, financial condition,results of operations, and the price of our Class A common stock. In addition, such legal proceedings may make itmore difficult to finance our operations.
Risks Relating to Our Organizational Structure
Marcus Lemonis, through his beneficial ownership of our shares directly or indirectly held by ML Acquisitionand ML RV Group, has substantial control over us, including over decisions that require the approval ofstockholders, and his interests, along with the interests of our other Continuing Equity Owners, in ourbusiness may conflict with yours.
As discussed in Note 18 ─ Stockholders’ Equity to our consolidated financial statements included in Item 8 ofPart II of this Form 10-K, we entered into a voting agreement in connection with our IPO with ML AcquisitionCompany, LLC, a Delaware limited liability company, which is indirectly owned by each of Stephen Adams and ourChairman and Chief Executive Officer, Marcus Lemonis (“ML Acquisition”), ML RV Group, LLC, a Delaware limitedliability company, wholly owned by our Chairman and Chief Executive Officer, Marcus Lemonis (“ML RV Group”),CVRV Acquisition LLC and CVRV Acquisition II LLC (the “Voting Agreement”). Subject to the Voting Agreement,Marcus Lemonis, through his beneficial ownership of our shares directly or indirectly held by ML Acquisition and MLRV Group, may approve or disapprove substantially all transactions and other matters requiring approval by ourstockholders, such as a merger, consolidation, dissolution or sale of all or substantially all of our assets, the issuanceor redemption of certain additional equity interests, and the election of directors including transactions that may not bein the best interests of holders of our Class A common stock or, conversely, prevent the consummation oftransactions that may be in the best interests of holders of our Class A common stock.
In addition, pursuant to the Voting Agreement, Crestview Advisors, L.L.C., a registered investment adviser toprivate equity funds, including funds affiliated with Crestview Partners II GP, L.P. (“Crestview”) currently has the rightto designate one of our directors (the “Crestview Director”). Each of ML Acquisition and ML RV Group has agreed tovote, or cause to vote, all of their outstanding shares of our Class A common stock, Class B common stock and ClassC common stock at any annual or special meeting of stockholders in
Table of Contents
38
which directors are elected, so as to cause the election of the Crestview Director. In addition, the ML Related Partiesalso currently have the right to designate four of our directors (the “ML Acquisition Directors”). Moreover, ML RVGroup has the right to designate one director for as long as it holds our one share of Class C common stock (the “MLRV Director”). As described in the Voting Agreement, these designation rights are subject to change based on therelevant parties’ ownership of Class A common stock. Funds controlled by Crestview Partners II GP, L.P. haveagreed to vote, or cause to vote, all of their outstanding shares of our Class A common stock and Class B commonstock at any annual or special meeting of stockholders in which directors are elected, so as to cause the election ofthe ML Acquisition Directors and the ML RV Director. Additionally, pursuant to the Voting Agreement, we are requiredto take commercially reasonable action to cause (i) the Board of Directors to be comprised at least of nine directors;(ii) the individuals designated in accordance with the terms of the Voting Agreement to be included in the slate ofnominees to be elected to the board of directors at the next annual or special meeting of stockholders of theCompany at which directors are to be elected and at each annual meeting of stockholders of the Company thereafterat which a director’s term expires; (iii) the individuals designated in accordance with the terms of the VotingAgreement to fill the applicable vacancies on the board of directors; and (iv) a ML Acquisition Director or the ML RVDirector to be the chairperson of the board of directors (as defined in our amended and restated bylaws). The VotingAgreement allows for the board of directors to reject the nomination, appointment or election of a particular director ifsuch nomination, appointment or election would constitute a breach of the board of directors’ fiduciary duties to theCompany’s stockholders or does not otherwise comply with any requirements of our amended and restated certificateof incorporation or our amended and restated bylaws or the charter for, or related guidelines of, the board of directors’nominating and corporate governance committee.
The Voting Agreement further provides that, for so long as the ML Related Parties, directly or indirectly,beneficially own, in the aggregate, 22.5% or more of our Class A common stock (assuming that all outstandingcommon units in CWGS, LLC are redeemed for newly-issued shares of our Class A common stock on a one-for-onebasis), the approval of the ML Related Parties will be required for certain corporate actions. These actions include:(1) a change of control; (2) acquisitions or dispositions of assets above $100 million; (3) the issuance of securities ofCamping World Holdings, Inc. or any of its subsidiaries (other than under equity incentive plans that have receivedthe prior approval of our board of directors); (4) material amendments to our certificate of incorporation or bylaws; and(5) any change in the size of the board of directors. The Voting Agreement also provides that, for so long as the MLRelated Parties, directly or indirectly, beneficially own, in the aggregate, 28% or more of our Class A common stock(assuming that all outstanding common units of CWGS, LLC are redeemed for newly-issued shares of our Class Acommon stock, on a one-for-one basis), the approval of the ML Related Parties, as applicable, will be required for thehiring and termination of our Chief Executive Officer; provided, however, that the approval of the ML Related Partiesis only required at such time as Marcus Lemonis no longer serves as our Chief Executive Officer. These rights mayprevent the consummation of transactions that may be in the best interests of holders of our Class A common stock.
Our amended and restated certificate of incorporation provides that the doctrine of “corporate opportunity”does not apply with respect to any director or stockholder who is not employed by us or our affiliates.
The doctrine of corporate opportunity generally provides that a corporate fiduciary may not develop anopportunity using corporate resources, acquire an interest adverse to that of the corporation or acquire property thatis reasonably incident to the present or prospective business of the corporation or in which the corporation has apresent or expectancy interest, unless that opportunity is first presented to the corporation and the corporationchooses not to pursue that opportunity. The doctrine of corporate opportunity is intended to preclude officers ordirectors or other fiduciaries from personally benefiting from opportunities that belong to the corporation. Ouramended and restated certificate of incorporation provides that the doctrine of “corporate opportunity” does not applywith respect to any director or stockholder who is not employed by us or our affiliates. Any director or stockholder whois not employed by us or our affiliates therefore has no duty to communicate or present corporate opportunities to us,and has the right to either hold any corporate opportunity for their (and their affiliates’) own account and benefit or torecommend, assign or otherwise transfer such corporate opportunity to persons other than us, including to anydirector or stockholder who is not employed by us or our affiliates.
Table of Contents
39
As a result, certain of our stockholders, directors and their respective affiliates are not prohibited fromoperating or investing in competing businesses. We therefore may find ourselves in competition with certain of ourstockholders, directors or their respective affiliates, and we may not have knowledge of, or be able to pursue,transactions that could potentially be beneficial to us. Accordingly, we may lose a corporate opportunity or suffercompetitive harm, which could negatively impact our business or prospects.
We are a “controlled company” within the meaning of the NYSE listing requirements and, as a result, qualifyfor, and rely on, exemptions from certain corporate governance requirements. Our stockholders do not havethe same protections afforded to stockholders of companies that are subject to such corporate governancerequirements.
Pursuant to the terms of the Voting Agreement, Marcus Lemonis, through his beneficial ownership of ourshares directly or indirectly held by ML Acquisition and ML RV Group, and certain funds controlled by CrestviewPartners II GP, L.P., in the aggregate, have more than 50% of the voting power for the election of directors, and, as aresult, we are considered a “controlled company” for the purposes of the New York Stock Exchange (the “NYSE”)listing requirements. As such, we qualify for, and rely on, exemptions from certain corporate governancerequirements, including the requirements to have a majority of independent directors on our board of directors, anentirely independent nominating and corporate governance committee, an entirely independent compensationcommittee or to perform an annual performance evaluation of the nominating and corporate governance andcompensation committees.
The corporate governance requirements and specifically the independence standards are intended to ensurethat directors who are considered independent are free of any conflicting interest that could influence their actions asdirectors. We have utilized, and intend to continue to utilize, certain exemptions afforded to a “controlled company.”As a result, we are not subject to certain corporate governance requirements, including that a majority of our board ofdirectors consists of “independent directors,” as defined under the rules of the NYSE. In addition, we are not requiredto have a nominating and corporate governance committee or compensation committee that is composed entirely ofindependent directors with a written charter addressing the committee’s purpose and responsibilities or to conductannual performance evaluations of the nominating and corporate governance and compensation committees andcurrently we do not have an entirely independent nominating and corporate governance committee. Accordingly, ourstockholders do not have the same protections afforded to stockholders of companies that are subject to all of thecorporate governance requirements of the NYSE.
Our principal asset is our interest in CWGS, LLC, and accordingly, we depend on distributions fromCWGS, LLC to pay dividends, taxes and expenses, including payments under the Tax Receivable Agreement.CWGS, LLC’s ability to make such distributions may be subject to various limitations and restrictions.
We are a holding company and had no material assets as of December 31, 2020, other than our ownershipof 42,226,389 common units, representing a 47.4% economic interest in the business of CWGS, LLC, and cash of$37.4 million. We have no independent means of generating revenue or cash flow, and our ability to pay dividends inthe future, if any, will be dependent upon the financial results and cash flows of CWGS, LLC and its subsidiaries anddistributions we receive from CWGS, LLC. There can be no assurance that our subsidiaries will generate sufficientcash flow to dividend or distribute funds to us or that applicable state law and contractual restrictions, includingnegative covenants in our debt instruments, will permit such dividends or distributions.
CWGS, LLC is treated as a partnership for U.S. federal income tax purposes and, as such, is not subject toany entity-level U.S. federal income tax. Instead, taxable income is allocated to holders of its common units, includingus. As a result, we incur income taxes on our allocable share of any net taxable income of CWGS, LLC. Under theterms of the CWGS LLC Agreement, CWGS, LLC is obligated to make tax distributions to holders of its commonunits, including us, except to the extent such distributions would render CWGS, LLC insolvent or are otherwiseprohibited by law or our Senior Secured Credit Facilities, our Floor Plan Facility or any of our future debt agreements.In addition to tax expenses, we will also incur expenses related to our operations, our interests in CWGS, LLC andrelated party agreements, including payment obligations under the Tax Receivable Agreement, and expenses andcosts of being a public company, all of which could be
Table of Contents
40
significant. We intend, as its managing member, to cause CWGS, LLC to make distributions in an amount sufficient toallow us to pay our taxes and operating expenses, including any ordinary course payments due under the TaxReceivable Agreement. However, CWGS, LLC’s ability to make such distributions may be subject to variouslimitations and restrictions including, but not limited to, restrictions on distributions that would either violate anycontract or agreement to which CWGS, LLC is then a party, including debt agreements, or any applicable law, or thatwould have the effect of rendering CWGS, LLC insolvent. If CWGS, LLC does not have sufficient funds to pay taxdistributions or other liabilities to fund our operations, we may have to borrow funds, which could materially adverselyaffect our liquidity and financial condition and subject us to various restrictions imposed by any such lenders. To theextent that we are unable to make payments under the Tax Receivable Agreement for any reason, such paymentswill be deferred and will accrue interest until paid; provided, however, that nonpayment for a specified period mayconstitute a material breach of a material obligation under the Tax Receivable Agreement and therefore mayaccelerate payments due under the Tax Receivable Agreement. If CWGS, LLC does not have sufficient funds tomake distributions, our ability to declare and pay cash dividends may also be restricted or impaired. See “— RisksRelating to Ownership of Our Class A Common Stock.”
Our Tax Receivable Agreement with the Continuing Equity Owners and Crestview Partners II GP, L.P.requires us to make cash payments to them in respect of certain tax benefits to which we may becomeentitled, and the amounts that we may be required to pay could be significant.
In connection with our IPO, we entered into a Tax Receivable Agreement with CWGS, LLC, each of theContinuing Equity Owners and Crestview Partners II GP, L.P. which confers certain benefits upon the ContinuingEquity Owners and Crestview Partners II GP, L.P. that do not benefit the holders of our Class A common stock to thesame extent as it benefits such Continuing Equity Owners and Crestview Partners II GP, L.P. Pursuant to the TaxReceivable Agreement, we are required to make cash payments to the Continuing Equity Owners and CrestviewPartners II GP, L.P. equal to 85% of the tax benefits, if any, that we actually realize, or in some circumstances aredeemed to realize as a result of (i) increases in tax basis resulting from the purchase of common units from CrestviewPartners II GP, L.P. in exchange for Class A common stock in connection with the consummation of the IPO and therelated corporate reorganization transactions and any future redemptions that are funded by Camping WorldHoldings, Inc. or exchanges of common units and (ii) certain other tax benefits attributable to payments under the TaxReceivable Agreement. The amount of the cash payments that we may be required to make under the TaxReceivable Agreement could be significant. Payments under the Tax Receivable Agreement will be based on the taxreporting positions that we determine, which tax reporting positions are subject to challenge by taxing authorities. Anypayments made by us to the Continuing Equity Owners and Crestview Partners II GP, L.P. under the Tax ReceivableAgreement will generally reduce the amount of overall cash flow that might have otherwise been available to us. Tothe extent that we are unable to make timely payments under the Tax Receivable Agreement for any reason, theunpaid amounts will be deferred and will accrue interest until paid by us. Nonpayment for a specified period mayconstitute a material breach of a material obligation under the Tax Receivable Agreement and therefore mayaccelerate payments due under the Tax Receivable Agreement. Furthermore, our future obligation to make paymentsunder the Tax Receivable Agreement could make us a less attractive target for an acquisition, particularly in the caseof an acquirer that cannot use some or all of the tax benefits that may be deemed realized under the Tax ReceivableAgreement. The payments under the Tax Receivable Agreement are also not conditioned upon the Continuing EquityOwners or Crestview Partners II GP, L.P. maintaining a continued ownership interest in CWGS, LLC.
Additional liabilities under the Tax Receivable Agreement may be required to be recorded when CWGS, LLCunits are exchanged in the future. Such amounts of cash payments that the Company may be required to make underthe Tax Receivable Agreement for such future exchanges could be significant. The amount of liabilities to be recordedin the future for such exchanges is dependent on a variety of factors including future stock prices, tax rates in effect,and the Company’s ability to utilize the tax benefits created as a result of the futures of CWGS, LLC units. Thesignificance of these factors and related uncertainty associated with the related liabilities makes estimation of futurepotential amounts under the Tax Receivable Agreement impractical to determine.
Table of Contents
41
The amounts that we may be required to pay to the Continuing Equity Owners and CrestviewPartners II GP, L.P. under the Tax Receivable Agreement may be accelerated in certain circumstances andmay also significantly exceed the actual tax benefits that we ultimately realize.
The Tax Receivable Agreement provides that if certain mergers, asset sales, other forms of businesscombination, or other changes of control were to occur, if we materially breach any of our material obligations underthe Tax Receivable Agreement or if, at any time, we elect an early termination of the Tax Receivable Agreement, thenthe Tax Receivable Agreement will terminate and our obligations, or our successor’s obligations, to make paymentsunder the Tax Receivable Agreement would accelerate and become immediately due and payable. The amount dueand payable in those circumstances is determined based on certain assumptions, including an assumption that wewould have sufficient taxable income to fully utilize all potential future tax benefits that are subject to the TaxReceivable Agreement. We may need to incur debt to finance payments under the Tax Receivable Agreement to theextent our cash resources are insufficient to meet our obligations under the Tax Receivable Agreement as a result oftiming discrepancies or otherwise.
As a result of the foregoing, (i) we could be required to make cash payments to the Continuing EquityOwners and Crestview Partners II GP, L.P. that are greater than the specified percentage of the actual benefits weultimately realize in respect of the tax benefits that are subject to the Tax Receivable Agreement and (ii) we would berequired to make an immediate cash payment equal to the present value of the anticipated future tax benefits that arethe subject of the Tax Receivable Agreement, which payment may be made significantly in advance of the actualrealization, if any, of such future tax benefits. In these situations, our obligations under the Tax Receivable Agreementcould have a substantial negative impact on our liquidity and could have the effect of delaying, deferring or preventingcertain mergers, asset sales, other forms of business combination, or other changes of control. There can be noassurance that we will be able to finance our obligations under the Tax Receivable Agreement.
We will not be reimbursed for any payments made to the Continuing Equity Owners and CrestviewPartners II GP, L.P. under the Tax Receivable Agreement in the event that any tax benefits are disallowed.
We will not be reimbursed for any cash payments previously made to the Continuing Equity Owners andCrestview Partners II GP, L.P. pursuant to the Tax Receivable Agreement if any tax benefits initially claimed by us aresubsequently challenged by a taxing authority and are ultimately disallowed. Instead, any excess cash paymentsmade by us to a Continuing Equity Owner or Crestview Partners II GP, L.P. will be netted against any future cashpayments that we might otherwise be required to make under the terms of the Tax Receivable Agreement. However,a challenge to any tax benefits initially claimed by us may not arise for a number of years following the initial time ofsuch payment or, even if challenged early, such excess cash payment may be greater than the amount of future cashpayments that we might otherwise be required to make under the terms of the Tax Receivable Agreement and, as aresult, there might not be future cash payments from which to net against. The applicable U.S. federal income taxrules are complex and factual in nature, and there can be no assurance that the IRS or a court will not disagree withour tax reporting positions. As a result, it is possible that we could make cash payments under the Tax ReceivableAgreement that are substantially greater than our actual cash tax savings.
Our organizational structure may cause us to be subject to IRS audit, which may result in the assessment ofinterest and penalties.
We consolidate CWGS, LLC, which, as a limited liability company, is not subject to U.S. federal incometaxes. Rather, the partnership’s taxable income flows through to the owners, who are responsible for paying theapplicable income taxes on the income allocated to them. For tax years beginning on or after January 1, 2018, theCompany is subject to partnership audit rules enacted as part of the Bipartisan Budget Act of 2015 (the “CentralizedPartnership Audit Regime”). Under the Centralized Partnership Audit Regime, any IRS audit of CWGS, LLC would beconducted at the CWGS, LLC level, and if the IRS determines an adjustment is necessary, the default rule is thatCWGS, LLC would pay an “imputed underpayment” including interest and penalties, if applicable. CWGS, LLC mayinstead elect to make a “push-out” election, in which case the partners for the year that is under audit would berequired to take into account the adjustments on their own personal income tax returns.
Table of Contents
42
Our operating agreement stipulates that CWGS, LLC is indemnified by members for any payment made torelevant taxing authorities under the Centralized Partnership Audit Regime. It is intended that any paymentCWGS, LLC makes on behalf of its current members will be reflected as a distribution, rather than tax expense, at thetime that such distribution is declared.
Risks Relating to Ownership of Our Class A Common Stock
The Continuing Equity Owners (through common units) own interests in CWGS, LLC, and the ContinuingEquity Owners have the right to redeem their interests in CWGS, LLC pursuant to the terms of the CWGS LLCAgreement for newly-issued shares of Class A common stock or cash.
At December 31, 2020, we had an aggregate of 206,916,992 shares of Class A common stock authorized butunissued, including 46,816,787 shares of Class A common stock issuable, at our election, upon redemption ofCWGS, LLC common units held by the Continuing Equity Owners. In connection with our IPO, CWGS, LLC enteredinto the CWGS LLC Agreement, and subject to certain restrictions set forth therein, the Continuing Equity Owners areentitled to have their common units redeemed from time to time at each of their options for, at our election(determined solely by our independent directors (within the meaning of the rules of the NYSE) who are disinterested),newly-issued shares of our Class A common stock on a one-for-one basis or a cash payment equal to a volumeweighted average market price of one share of Class A common stock for each common unit redeemed, in each casein accordance with the terms of the CWGS LLC Agreement; provided that, at our election (determined solely by ourindependent directors (within the meaning of the rules of the NYSE) who are disinterested), we may effect a directexchange of such Class A common stock or such cash, as applicable, for such common units. The Continuing EquityOwners may exercise such redemption right for as long as their common units remain outstanding. In connection withour IPO, we also entered into a Registration Rights Agreement pursuant to which the shares of Class A commonstock issued upon such redemption and the shares of Class A common stock issued to the Former Equity Owners inconnection with the corporate reorganization transactions entered into in connection therewith will be eligible forresale, subject to certain limitations set forth therein. The market price of shares of our Class A common stock coulddecline as a result of these redemptions or sales, or as a result of the perception that they could occur.
You may be diluted by future issuances of additional Class A common stock or common units in connectionwith our incentive plans, acquisitions or otherwise; future sales of such shares in the public market, or theexpectations that such sales may occur, could lower our stock price.
Our amended and restated certificate of incorporation authorizes us to issue shares of our Class A commonstock and options, rights, warrants and appreciation rights relating to our Class A common stock for the considerationand on the terms and conditions established by our board of directors in its sole discretion, whether in connection withacquisitions or otherwise.
We have reserved shares for issuance under our 2016 Incentive Award Plan (the “2016 Plan”) in an amountequal to 12,984,318 shares of Class A common stock as of December 31, 2020, including shares of Class A commonstock issuable pursuant to 470,377 stock options and 3,391,740 restricted stock units that were granted to certain ofour directors and certain of our employees. Any Class A common stock that we issue, including under our 2016 Planor other equity incentive plans that we may adopt in the future, would dilute the percentage ownership of holders ofour Class A common stock.
In the future, we may also issue additional securities if we need to raise capital, including, but not limited to,in connection with acquisitions, which could constitute a material portion of our then-outstanding shares of Class Acommon stock.
Our ability to pay regular and special dividends on our Class A common stock is subject to the discretion ofour board of directors and may be limited by our structure and statutory restrictions.
Beginning in the third quarter of 2020, CWGS, LLC increased its regular quarterly cash distribution to itscommon unit holders from approximately $0.08 per common unit to $0.09 per common unit. CWGS, LLC intends tocontinue to make such quarterly cash distributions. We have used in the past, and intend to continue
Table of Contents
43
to use, all of the proceeds from such distributions on our common units to declare cash dividends on our Class Acommon stock.
CWGS, LLC is required to make cash distributions in accordance with the CWGS LLC Agreement in anamount sufficient for us to pay any expenses incurred by us in connection with the regular quarterly cash dividend,along with any of our other operating expenses and other obligations. In addition, we have paid, and currently intendto pay, a special cash dividend of all or a portion of the Excess Tax Distribution to the holders of our Class A commonstock from time to time, subject to the discretion of our board of directors. However, the payment of future dividendson our Class A common stock will be subject to our discretion as the sole managing member of CWGS, LLC, thediscretion of our board of directors and will depend on, among other things, our results of operations, financialcondition, level of indebtedness, capital requirements, contractual restrictions, restrictions in our debt agreements andin any preferred stock, business prospects and other factors that our board of directors may deem relevant.Additionally, our ability to distribute any Excess Tax Distribution will also be subject to no early termination oramendment of the Tax Receivable Agreement, as well as the amount of tax distributions actually paid to us and ouractual tax liability. As a consequence of these limitations and restrictions, we may not be able to make, or may haveto reduce or eliminate, the payment of dividends on our Class A common stock. Additionally, any change in the levelof our dividends or the suspension of the payment thereof could adversely affect the market price of our Class Acommon stock. For additional information on our payments of dividends, see "Item 5. Market for Registrant’sCommon Equity, Related Stockholder Matters and Issuer Purchases of Equity Securities—Dividend Policy" underPart II of this Form 10-K.
Delaware law and certain provisions in our amended and restated certificate of incorporation may preventefforts by our stockholders to change the direction or management of our company.
We are a Delaware corporation, and the anti-takeover provisions of Delaware law impose variousimpediments to the ability of a third party to acquire control of us, even if a change of control would be beneficial toour existing stockholders. In addition, our amended and restated certificate of incorporation and our amended andrestated bylaws contain provisions that may make the acquisition of our Company more difficult without the approvalof our board of directors, including, but not limited to, the following:
● our Board of Directors is classified into three classes, each of which serves for a staggered three-yearterm;
● a majority of our stockholders or a majority of our board of directors may call special meetings of ourstockholders, and at such time as the ML Related Parties, directly or indirectly, beneficially own in theaggregate, less than 27.5% of all of the outstanding common units of CWGS, LLC, only the chairpersonof our board of directors or a majority of our board of directors may call special meetings of ourstockholders;
● we have authorized undesignated preferred stock, the terms of which may be established and shares ofwhich may be issued without stockholder approval;
● any action required or permitted to be taken by our stockholders at an annual meeting or special meetingof stockholders may be taken without a meeting, without prior notice and without a vote, if a writtenconsent is signed by the holders of our outstanding shares of common stock representing not less thanthe minimum number of votes that would be necessary to authorize such action at a meeting at which alloutstanding shares of common stock entitled to vote thereon, and at such time as the ML RelatedParties, directly or indirectly, beneficially own in the aggregate, less than 27.5% of all of the outstandingcommon units of CWGS, LLC, any action required or permitted to be taken by our stockholders at anannual meeting or special meeting of stockholders may not be taken by written consent in lieu of ameeting;
● our amended and restated certificate of incorporation may be amended or repealed by the affirmativevote of a majority of the votes which all our stockholders would be eligible to cast in an election ofdirectors and our amended and restated bylaws may be amended or repealed by a majority vote of ourboard of directors or by the affirmative vote of a majority of the votes which all
Table of Contents
44
our stockholders would be eligible to cast in an election of directors, and at such time as the ML RelatedParties, directly or indirectly, beneficially own in the aggregate, less than 27.5% of all of the outstandingcommon units of CWGS, LLC, our amended and restated certificate of incorporation and our amendedand restated bylaws may be amended or repealed by the affirmative vote of the holders of at least662/3% of the votes which all our stockholders would be entitled to cast in any annual election of directorsand our amended and restated bylaws may also be amended or repealed by a majority vote of our boardof directors;
● we require advance notice and duration of ownership requirements for stockholder proposals; and
● we have opted out of Section 203 of the Delaware General Corporation Law of the State of Delaware(the “DGCL”), however, our amended and restated certificate of incorporation contains provisions thatare similar to Section 203 of the DGCL (except with respect to ML Acquisition and Crestview and any oftheir respective affiliates and any of their respective direct or indirect transferees of Class B commonstock).
These provisions could discourage, delay or prevent a transaction involving a change in control of ourcompany. These provisions could also discourage proxy contests and make it more difficult for you and otherstockholders to elect directors of your choosing and cause us to take other corporate actions you desire, includingactions that you may deem advantageous, or negatively affect the trading price of our Class A common stock. Inaddition, because our board of directors is responsible for appointing the members of our management team, theseprovisions could in turn affect any attempt by our stockholders to replace current members of our management team.
Please see “— Risks Relating to Our Organizational Structure — Marcus Lemonis, through his beneficialownership of our shares directly or indirectly held by ML Acquisition and ML RV Group, has substantial control overus, including over decisions that require the approval of stockholders, and his interests, along with the interests of ourother Continuing Equity Owners, in our business may conflict with yours.”
Our amended and restated certificate of incorporation provides, subject to certain exceptions, that the Courtof Chancery of the State of Delaware will be the sole and exclusive forum for certain stockholder litigationmatters, which could limit our stockholders’ ability to obtain a favorable judicial forum for disputes with us orour directors, officers, employees or stockholders.
Our amended and restated certificate of incorporation provides, subject to limited exceptions, that the Courtof Chancery of the State of Delaware will, to the fullest extent permitted by law, be the sole and exclusive forum for(i) any derivative action or proceeding brought on our behalf; (ii) any action asserting a claim of breach of a fiduciaryduty owed by any of our directors, officers or other employees to us or our stockholders; (iii) any action asserting aclaim against us, any director or our officers or employees arising pursuant to any provision of the DGCL, ouramended and restated certificate of incorporation or our amended and restated bylaws; or (iv) any action asserting aclaim against us, any director or our officers or employees that is governed by the internal affairs doctrine. Any personor entity purchasing or otherwise acquiring any interest in shares of our capital stock are deemed to have notice ofand to have consented to the provisions of our amended and restated certificate of incorporation described above.This choice of forum provision may limit a stockholder’s ability to bring a claim in a judicial forum that it finds favorablefor disputes with us or any of our directors, officers, other employees or stockholders which may discourage lawsuitswith respect to such claims. Alternatively, if a court were to find the choice of forum provision in our amended andrestated certificate of incorporation to be inapplicable or unenforceable in an action, we may incur additional costsassociated with resolving such action in other jurisdictions, which could materially adversely affect our business,financial condition and results of operations.
We may issue shares of preferred stock in the future, which could make it difficult for another company toacquire us or could otherwise adversely affect holders of our Class A common stock, which could depressthe price of our Class A common stock.
Our amended and restated certificate of incorporation authorizes us to issue one or more series of preferredstock. Our board of directors will have the authority to determine the preferences, limitations and
Table of Contents
45
relative rights of the shares of preferred stock and to fix the number of shares constituting any series and thedesignation of such series, without any further vote or action by our stockholders. Our preferred stock could be issuedwith voting, liquidation, dividend and other rights superior to the rights of our Class A common stock. The potentialissuance of preferred stock may delay or prevent a change in control of us, discouraging bids for our Class Acommon stock at a premium to the market price, and materially and adversely affect the market price and the votingand other rights of the holders of our Class A common stock.
Material weaknesses in our internal control over financial reporting could have a significant adverse effect onour business and the price of our common stock.
In connection with the preparation of our financial statements and the audit of our financial results for 2018,we had identified material weaknesses in our internal controls relating to insufficient technical resources to properlydesign and operate internal controls over financial reporting. Although the material weaknesses have beenremediated as of December 31, 2019, there can be no assurance that we will not identify additional materialweaknesses in the future.
In future periods, if additional material weaknesses in our internal control over financial reporting areidentified, we may be required to restate our financial statements and could be subject to regulatory scrutiny, a loss ofpublic and investor confidence, and to litigation from investors and stockholders, which could have a material adverseeffect on our business and the price of our Class A common stock.
In addition, if we do not maintain adequate financial and management personnel, processes and controls, wemay not be able to manage our business effectively or accurately report our financial performance on a timely basis,which could cause a decline in our common stock price and adversely affect our results of operations and financialcondition. Failure to comply with the Sarbanes-Oxley Act could potentially subject us to sanctions or investigations bythe SEC, the NYSE or other regulatory authorities, which would require additional financial and managementresources.
General Risk Factors
Unanticipated changes in effective tax rates or adverse outcomes resulting from examination of our incomeor other tax returns could adversely affect our operating results and financial condition.
We are subject to income taxes in the United States, and our tax liabilities will be subject to the allocation ofexpenses in differing jurisdictions. Our future effective tax rates could be subject to volatility or adversely affected by anumber of factors, including:
● changes in the valuation of our deferred tax assets and liabilities;
● expected timing and amount of the release of any tax valuation allowances;
● tax effects of equity-based compensation;
● costs related to intercompany restructurings; or
● changes in tax laws, regulations or interpretations thereof.
In addition, we may be subject to audits of our income, sales and other transaction taxes byU.S. federal and state authorities. Outcomes from these audits could have an adverse effect on ouroperating results and financial condition.
Table of Contents
46
Our Class A common stock price may be volatile or may decline regardless of our operatingperformance.
Volatility in the market price of our Class A common stock may prevent you from being able tosell your shares at or above the price you paid for such shares. Many factors, which are outside ourcontrol, may cause the market price of our Class A common stock to fluctuate significantly, includingthose described elsewhere in this “Risk Factors” section and this Form 10-K, as well as the following:
● our operating and financial performance and prospects;
● our quarterly or annual earnings or those of other companies in our industry compared to marketexpectations;
● conditions that impact demand for our services;
● future announcements concerning our business or our competitors’ businesses;
● the public’s reaction to our press releases, other public announcements and filings with the SEC;
● the size of our public float;
● coverage by or changes in financial estimates by securities analysts or failure to meet their expectations;
● market and industry perception of our success, or lack thereof, in pursuing our growth strategy;
● strategic actions by us or our competitors, such as acquisitions or restructurings;
● changes in laws or regulations which adversely affect our industry or us;
● changes in accounting standards, policies, guidance, interpretations or principles;
● changes in senior management or key personnel;
● issuances, exchanges or sales, or expected issuances, exchanges or sales of our capital stock;
● changes in our dividend policy;
● adverse resolution of new or pending litigation against us; and
● changes in general market, economic and political conditions in the United States and global economiesor financial markets, including those resulting from natural disasters, terrorist attacks, acts of war andresponses to such events.
If securities analysts do not publish research or reports about our company, or if they issueunfavorable commentary about us or our industry or downgrade our Class A common stock,the price of our Class A common stock could decline.
The trading market for our Class A common stock depends in part on the research and reports that third-party securities analysts publish about our company and our industry. If one or more analysts cease coverage of ourcompany, we could lose visibility in the market. In addition, one or more of these analysts could downgrade ourClass A common stock or issue other negative commentary about our company or our industry. As a result of one ormore of these factors, the trading price of our Class A common stock could decline.
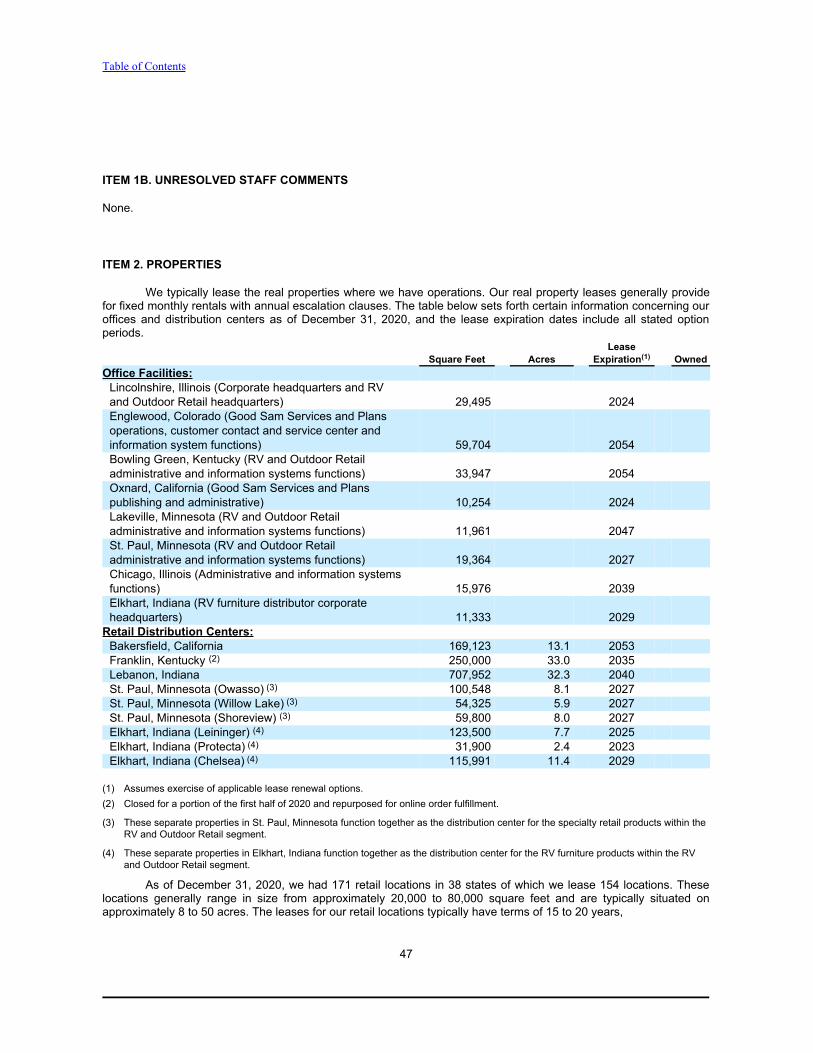
Table of Contents
47
ITEM 1B. UNRESOLVED STAFF COMMENTS
None.
ITEM 2. PROPERTIES
We typically lease the real properties where we have operations. Our real property leases generally providefor fixed monthly rentals with annual escalation clauses. The table below sets forth certain information concerning ouroffices and distribution centers as of December 31, 2020, and the lease expiration dates include all stated optionperiods.
Square Feet Acres Lease
Expiration(1) OwnedOffice Facilities:
Lincolnshire, Illinois (Corporate headquarters and RVand Outdoor Retail headquarters) 29,495 2024Englewood, Colorado (Good Sam Services and Plansoperations, customer contact and service center andinformation system functions) 59,704 2054Bowling Green, Kentucky (RV and Outdoor Retailadministrative and information systems functions) 33,947 2054Oxnard, California (Good Sam Services and Planspublishing and administrative) 10,254 2024Lakeville, Minnesota (RV and Outdoor Retailadministrative and information systems functions) 11,961 2047St. Paul, Minnesota (RV and Outdoor Retailadministrative and information systems functions) 19,364 2027Chicago, Illinois (Administrative and information systemsfunctions) 15,976 2039Elkhart, Indiana (RV furniture distributor corporateheadquarters) 11,333 2029
Retail Distribution Centers:Bakersfield, California 169,123 13.1 2053Franklin, Kentucky (2) 250,000 33.0 2035Lebanon, Indiana 707,952 32.3 2040St. Paul, Minnesota (Owasso) (3) 100,548 8.1 2027St. Paul, Minnesota (Willow Lake) (3) 54,325 5.9 2027St. Paul, Minnesota (Shoreview) (3) 59,800 8.0 2027Elkhart, Indiana (Leininger) (4) 123,500 7.7 2025Elkhart, Indiana (Protecta) (4) 31,900 2.4 2023Elkhart, Indiana (Chelsea) (4) 115,991 11.4 2029
(1) Assumes exercise of applicable lease renewal options.(2) Closed for a portion of the first half of 2020 and repurposed for online order fulfillment.
(3) These separate properties in St. Paul, Minnesota function together as the distribution center for the specialty retail products within theRV and Outdoor Retail segment.
(4) These separate properties in Elkhart, Indiana function together as the distribution center for the RV furniture products within the RVand Outdoor Retail segment.
As of December 31, 2020, we had 171 retail locations in 38 states of which we lease 154 locations. Theselocations generally range in size from approximately 20,000 to 80,000 square feet and are typically situated onapproximately 8 to 50 acres. The leases for our retail locations typically have terms of 15 to 20 years,
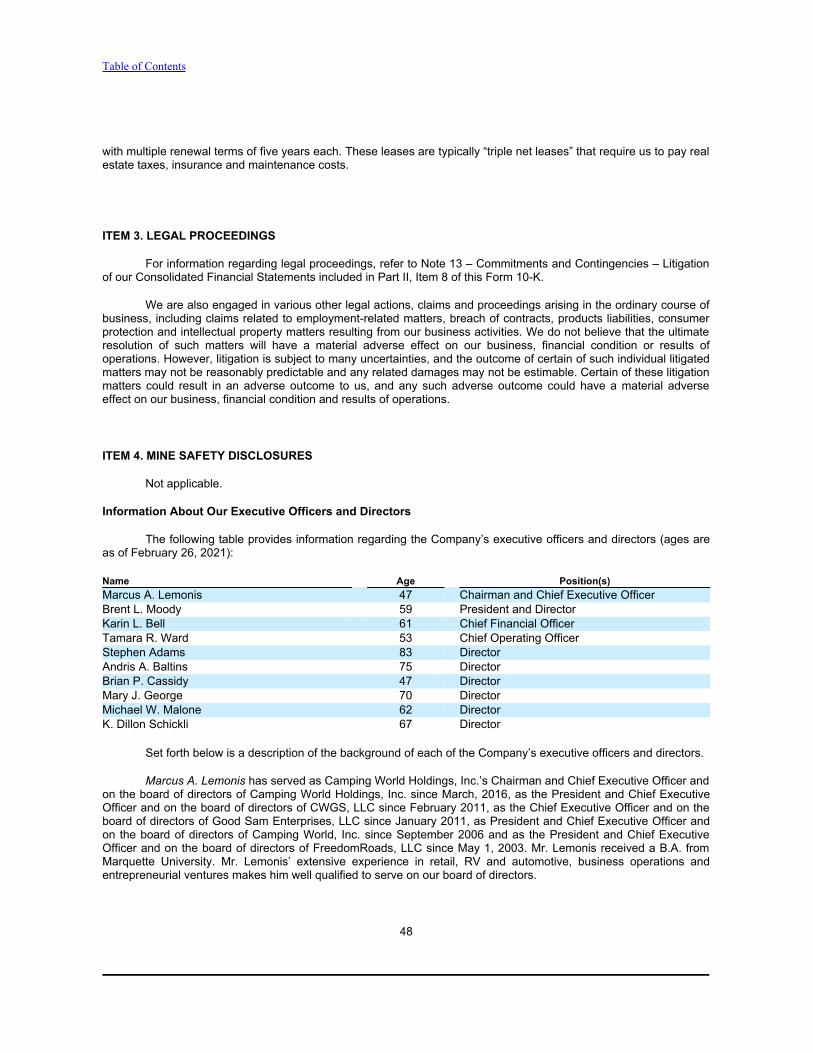
Table of Contents
48
with multiple renewal terms of five years each. These leases are typically “triple net leases” that require us to pay realestate taxes, insurance and maintenance costs.
ITEM 3. LEGAL PROCEEDINGS
For information regarding legal proceedings, refer to Note 13 – Commitments and Contingencies – Litigationof our Consolidated Financial Statements included in Part II, Item 8 of this Form 10-K.
We are also engaged in various other legal actions, claims and proceedings arising in the ordinary course ofbusiness, including claims related to employment-related matters, breach of contracts, products liabilities, consumerprotection and intellectual property matters resulting from our business activities. We do not believe that the ultimateresolution of such matters will have a material adverse effect on our business, financial condition or results ofoperations. However, litigation is subject to many uncertainties, and the outcome of certain of such individual litigatedmatters may not be reasonably predictable and any related damages may not be estimable. Certain of these litigationmatters could result in an adverse outcome to us, and any such adverse outcome could have a material adverseeffect on our business, financial condition and results of operations.
ITEM 4. MINE SAFETY DISCLOSURES
Not applicable.
Information About Our Executive Officers and Directors
The following table provides information regarding the Company’s executive officers and directors (ages areas of February 26, 2021):
Name Age Position(s)Marcus A. Lemonis 47 Chairman and Chief Executive OfficerBrent L. Moody 59 President and DirectorKarin L. Bell 61 Chief Financial OfficerTamara R. Ward 53 Chief Operating OfficerStephen Adams 83 DirectorAndris A. Baltins 75 DirectorBrian P. Cassidy 47 DirectorMary J. George 70 DirectorMichael W. Malone 62 DirectorK. Dillon Schickli 67 Director
Set forth below is a description of the background of each of the Company’s executive officers and directors.
Marcus A. Lemonis has served as Camping World Holdings, Inc.’s Chairman and Chief Executive Officer andon the board of directors of Camping World Holdings, Inc. since March, 2016, as the President and Chief ExecutiveOfficer and on the board of directors of CWGS, LLC since February 2011, as the Chief Executive Officer and on theboard of directors of Good Sam Enterprises, LLC since January 2011, as President and Chief Executive Officer andon the board of directors of Camping World, Inc. since September 2006 and as the President and Chief ExecutiveOfficer and on the board of directors of FreedomRoads, LLC since May 1, 2003. Mr. Lemonis received a B.A. fromMarquette University. Mr. Lemonis’ extensive experience in retail, RV and automotive, business operations andentrepreneurial ventures makes him well qualified to serve on our board of directors.
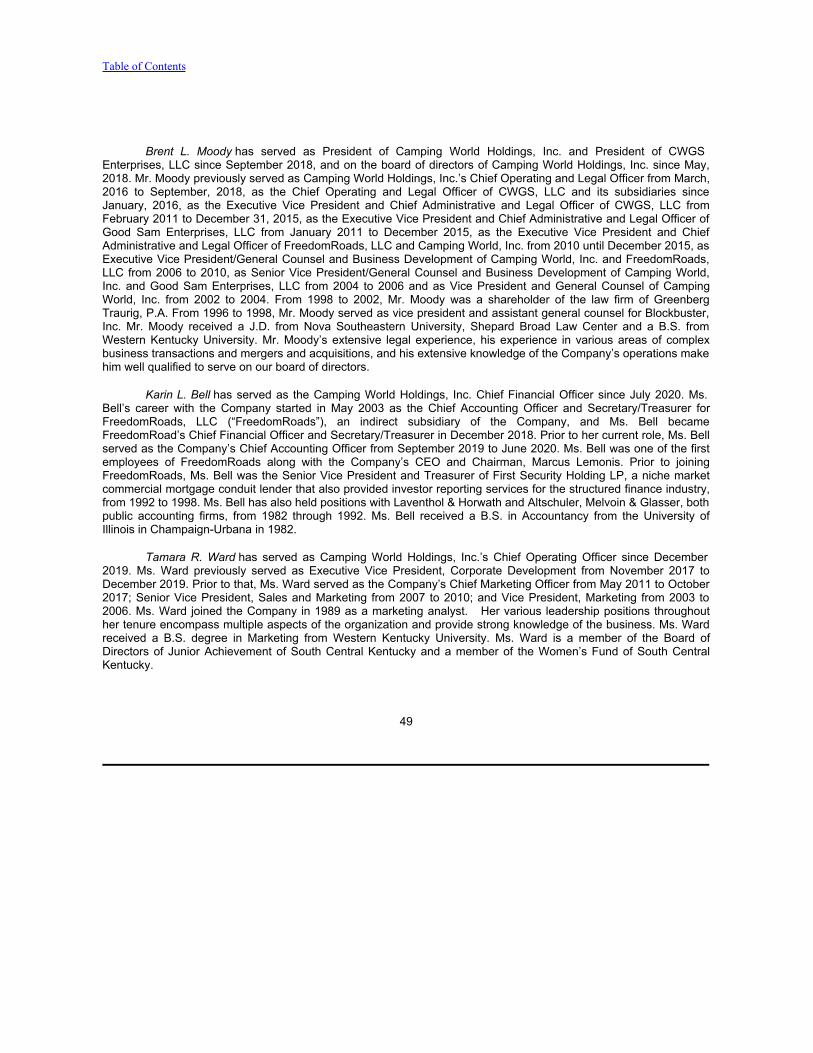
Table of Contents
49
Brent L. Moody has served as President of Camping World Holdings, Inc. and President of CWGSEnterprises, LLC since September 2018, and on the board of directors of Camping World Holdings, Inc. since May,2018. Mr. Moody previously served as Camping World Holdings, Inc.’s Chief Operating and Legal Officer from March,2016 to September, 2018, as the Chief Operating and Legal Officer of CWGS, LLC and its subsidiaries sinceJanuary, 2016, as the Executive Vice President and Chief Administrative and Legal Officer of CWGS, LLC fromFebruary 2011 to December 31, 2015, as the Executive Vice President and Chief Administrative and Legal Officer ofGood Sam Enterprises, LLC from January 2011 to December 2015, as the Executive Vice President and ChiefAdministrative and Legal Officer of FreedomRoads, LLC and Camping World, Inc. from 2010 until December 2015, asExecutive Vice President/General Counsel and Business Development of Camping World, Inc. and FreedomRoads,LLC from 2006 to 2010, as Senior Vice President/General Counsel and Business Development of Camping World,Inc. and Good Sam Enterprises, LLC from 2004 to 2006 and as Vice President and General Counsel of CampingWorld, Inc. from 2002 to 2004. From 1998 to 2002, Mr. Moody was a shareholder of the law firm of GreenbergTraurig, P.A. From 1996 to 1998, Mr. Moody served as vice president and assistant general counsel for Blockbuster,Inc. Mr. Moody received a J.D. from Nova Southeastern University, Shepard Broad Law Center and a B.S. fromWestern Kentucky University. Mr. Moody’s extensive legal experience, his experience in various areas of complexbusiness transactions and mergers and acquisitions, and his extensive knowledge of the Company’s operations makehim well qualified to serve on our board of directors.
Karin L. Bell has served as the Camping World Holdings, Inc. Chief Financial Officer since July 2020. Ms.Bell’s career with the Company started in May 2003 as the Chief Accounting Officer and Secretary/Treasurer forFreedomRoads, LLC (“FreedomRoads”), an indirect subsidiary of the Company, and Ms. Bell becameFreedomRoad’s Chief Financial Officer and Secretary/Treasurer in December 2018. Prior to her current role, Ms. Bellserved as the Company’s Chief Accounting Officer from September 2019 to June 2020. Ms. Bell was one of the firstemployees of FreedomRoads along with the Company’s CEO and Chairman, Marcus Lemonis. Prior to joiningFreedomRoads, Ms. Bell was the Senior Vice President and Treasurer of First Security Holding LP, a niche marketcommercial mortgage conduit lender that also provided investor reporting services for the structured finance industry,from 1992 to 1998. Ms. Bell has also held positions with Laventhol & Horwath and Altschuler, Melvoin & Glasser, bothpublic accounting firms, from 1982 through 1992. Ms. Bell received a B.S. in Accountancy from the University ofIllinois in Champaign-Urbana in 1982.
Tamara R. Ward has served as Camping World Holdings, Inc.’s Chief Operating Officer since December2019. Ms. Ward previously served as Executive Vice President, Corporate Development from November 2017 toDecember 2019. Prior to that, Ms. Ward served as the Company’s Chief Marketing Officer from May 2011 to October2017; Senior Vice President, Sales and Marketing from 2007 to 2010; and Vice President, Marketing from 2003 to2006. Ms. Ward joined the Company in 1989 as a marketing analyst. Her various leadership positions throughouther tenure encompass multiple aspects of the organization and provide strong knowledge of the business. Ms. Wardreceived a B.S. degree in Marketing from Western Kentucky University. Ms. Ward is a member of the Board ofDirectors of Junior Achievement of South Central Kentucky and a member of the Women’s Fund of South CentralKentucky.
Table of Contents
50
Stephen Adams has served on the board of directors of Camping World Holdings, Inc. since March, 2016, asthe chairman of the board of directors of CWGS, LLC since February 2011, as the chairman of the board of directorsof Good Sam Enterprises, LLC since December 1988, as the chairman of the board of directors of Camping World,Inc. since April 1997 and as the chairman of the board of directors of FreedomRoads Holding Company, LLC sinceFebruary 3, 2005. In addition, Mr. Adams is the chairman of the board of directors and the controlling shareholder ofAdams Outdoor Advertising, Inc., which operates an outdoor media advertising business. From November 2011 untilApril 2012, Mr. Adams inadvertently failed to timely file ownership reports on Forms 4 and 5 and as of the end ofcalendar year 2011, as of May 15, 2012 and as of the end of calendar year 2012, Mr. Adams mistakenly failed totimely file Schedule 13G amendments with respect to an entity in which he unknowingly accumulated an interest inexcess of 5%. As a result, the Securities and Exchange Commission entered an order on September 10, 2014,pursuant to which Mr. Adams agreed to cease and desist from committing or causing any violations of therequirements of Section 13(d) and 16(a) of the Exchange Act and certain of the rules promulgated thereunder andpaid a civil money penalty to the SEC without admitting or denying the findings therein. In August 2009, Affinity Bank,a California depositary institution in which Mr. Adams indirectly owned a controlling interest, was closed by theCalifornia Department of Financial Institutions and the Federal Deposit Insurance Corporation was appointed as thereceiver. Mr. Adams received an M.B.A. from the Stanford Graduate School of Business and a B.S. from YaleUniversity. Mr. Adams’ long association with the Company as a chairman of the board of directors of several of itssubsidiaries since he acquired Good Sam Enterprises, LLC in 1988 and his current or former ownership of a variety ofbusinesses with significant assets and operations during his over 40 year business career, during which time he hashad substantial experience in providing management oversight and strategic direction, make him well qualified toserve on our board of directors.
Andris A. Baltins has served on the board of directors of Camping World Holdings, Inc. since March, 2016, onthe board of directors of CWGS, LLC since February 2011 and on the board of directors of Good Sam Enterprises,LLC since February 2006. He has been a member of the law firm of Kaplan, Strangis and Kaplan, P.A. since 1979.Mr. Baltins serves as a director of various private and nonprofit corporations, including Adams Outdoor Advertising,Inc., which is controlled by Mr. Adams. Mr. Baltins previously served as a director of Polaris Industries, Inc. from 1995until 2011. Mr. Baltins received a J.D. from the University of Minnesota Law School and a B.A. from Yale University.Mr. Baltins’ over 40-year legal career as an advisor to numerous public and private companies and his experience inthe areas of complex business transactions, mergers and acquisitions and corporate law make him well qualified toserve on our board of directors.
Brian P. Cassidy has served on the board of directors of Camping World Holdings, Inc. since March 2016and on the board of directors of CWGS, LLC since March 2011. Mr. Cassidy is a Partner at Crestview, which hejoined in 2004, and currently serves as head of Crestview’s media and communications strategy. Mr. Cassidy hasserved as a director of WideOpenWest, Inc., a public company, since December 2015, and has served as a directorof various private companies, including Hornblower Holdings since April 2018, Congruex LLC since November 2017,and Industrial Media since October 2012. Mr. Cassidy previously served as a director of Cumulus Media, Inc., apublic company, from May 2014 until March 2017, and served as a director of various private companies, includingNEP Group, Inc. from December 2012 to October 2018 and Interoute Communications Holdings from April 2015 toMay 2018. He was also involved with Crestview’s investments in Charter Communications, Inc. and InsightCommunications, Inc. Prior to joining Crestview, Mr. Cassidy worked in private equity at Boston Ventures, where heinvested in companies in the media and communications, entertainment and business services industries. Previously,he worked as the acting chief financial officer of one of Boston Ventures’ portfolio companies. Prior to that time, Mr.Cassidy was an investment banking analyst at Alex, Brown & Sons, where he completed a range of financing andmergers and acquisitions assignments for companies in the consumer and business services sectors. Mr. Cassidyreceived an M.B.A. from the Stanford Graduate School of Business and an A.B. in Physics from Harvard College. Mr.Cassidy’s private equity investment and company oversight experience and background with respect to acquisitions,debt financings and equity financings make him well qualified to serve on our board of directors.
Table of Contents
51
Mary J. George has served on the board of directors of Camping World Holdings, Inc. since January 2017.Ms. George has also served as executive chairman of Ju-Ju-Be, a retailer of premium diaper bags and other babyproducts since January 2018. Ms. George has been a founding partner of Morningstar Capital Investments, LLC, aninvestment firm, since 2001. Ms. George served as chief executive officer and a director at Easton Hockey HoldingsInc., a private manufacturer of ice hockey equipment, from August 2014 to December 2016. From 2002 to 2015, Ms.George held various positions, including co-chairman (2002 to 2009) and vice chairman (2009 to 2015), at BellAutomotive Products, Inc., a private manufacturer of automotive accessories. From 1994 to 2004, Ms. George heldvarious positions, including chief operating officer (1995 to 1998), chief executive officer (1998 to 2000), andchairman (2000 to 2004), at Bell Sports Inc., a formerly public helmet manufacturer. Ms. George also currently servesor previously served as a director of various public and private companies, including Image Entertainment, Inc., aformerly public independent distributor of home entertainment programming, from 2010 to 2012, Oakley, Inc., a publicsports equipment and lifestyle accessories manufacturer, from 2004 to 2007, BRG Sports Inc. since 2013, 3 DayBlinds Inc. from 2007 to 2015, and Oreck Corporation from 2008 to 2012. Ms. George’s experience in sales,marketing and general management in the consumer products industry, as well as success in the development ofinternationally renowned branded products, provides our board of directors with greater insight in the areas of productbranding and strategic growth in the consumer products industry, and make her well-qualified to serve on our board ofdirectors.
Michael W. Malone has served on the board of directors of Camping World Holdings, Inc. since May 2019.Mr. Malone was Vice President, Finance and Chief Financial Officer of Polaris Industries Inc. ("Polaris"), amanufacturer of power sports vehicles, from January 1997 to July 2015 and retired from Polaris in March 2016. FromJanuary 1997 to January 2010, Mr. Malone also served as Corporate Secretary. Mr. Malone was Vice President andTreasurer of Polaris from December 1994 to January 1997 and was Chief Financial Officer and Treasurer of apredecessor company of Polaris from January 1993 to December 1994. Mr. Malone joined Polaris in 1984 after fouryears with Arthur Andersen LLP. Mr. Malone has served on the board and on the Audit (chair), Finance andNominating and Governance Committees of Armstrong Flooring, Inc., a public company, since October 2016 as wellas the boards of various non-profit organizations. Mr. Malone previously served on the board of Stevens EquipmentSupply LLC, a private company, from May 2011 until October 2020. Mr. Malone received a B.A. in accounting andbusiness administration from St. John's University (Collegeville, Minnesota). Mr. Malone's experiences as the formerChief Financial Officer of a public company, his public company board experience, and his in-depth knowledge of theoutdoor lifestyle industry make him well qualified to serve on our board of directors.
K. Dillon Schickli has served on the board of directors of Camping World Holdings, Inc. since March 2016and on the board of directors of CWGS, LLC since August 2011. Mr. Schickli previously served on the board ofdirectors of CWGS, LLC from 1990 until 1995 and was chief operating officer of Affinity Group, Inc., the predecessorof Good Sam Enterprises, LLC, from 1993 until 1995. Previously, Mr. Schickli was a co-investor with Crestview in DSWaters Group, Inc. (“DS Waters”) and served as vice chairman of its board of directors until it was sold to CottCorporation in December 2014. Prior to that time, Mr. Schickli was the chief executive officer of DS Waters from June2010 until February 2013 and subsequently led the buyout of the business by Crestview. Mr. Schickli also previouslyled the buyout of DS Waters from Danone Group & Suntory Ltd. in November 2005 and was also a co investor in DSWaters with Kelso & Company. Mr. Schickli served as co-chief executive officer and chief financial officer of DSWaters from November 2005 until June 2010, when he became the sole chief executive officer. Mr. Schickli startedhis business career in the capital planning and acquisitions group of the Pepsi Cola Company after he received hisM.B.A. from the University of Chicago. Mr. Schickli received a B.A. from Carleton College in 1975. Mr. Schickli’s longassociation with, and knowledge of, the Company, extensive experience serving as a director of other businesses,operating experience as a chief executive officer and his experience as a private equity investor with respect toacquisitions, debt financings, equity and financings make him well qualified to serve on our board of directors.
Table of Contents
52
PART II
ITEM 5. MARKET FOR REGISTRANT’S COMMON EQUITY, RELATED STOCKHOLDER MATTERS AND ISSUERPURCHASES OF EQUITY SECURITIES
Market Information
Our Class A common stock is traded on the New York Stock Exchange under the symbol “CWH.” There is nopublic trading market for our Class B common stock and Class C common stock.
Holders of Record
As of February 12, 2021, there were 5 and 41,329 stockholders of record and beneficial holders, respectively,of our Class A common stock. As of February 15, 2021, there were two and one stockholders of record of our Class Bcommon stock and Class C common stock, respectively.
Dividend Policy
CWGS, LLC has made a regular quarterly cash distribution to its common unit holders of approximately$0.08 per common unit between the three months ended December 31, 2016 and the three months ended June 30,2020. On July 20, 2020, our Board of Directors approved the increase of the quarterly dividend to $0.09 per share ofClass A common stock from $0.08 per share. Accordingly, during the three months ended September 30, 2020 andDecember 31, 2020, we paid regular quarterly cash dividends of $0.09 per share of our Class A common stock.CWGS, LLC intends to continue to make such quarterly cash distributions, to the extent permitted by law. We haveused in the past, and intend to continue to use, to the extent permitted by law, all of the proceeds from suchdistribution on our common units to pay a regular quarterly cash dividend of approximately $0.09 per share on ourClass A common stock, subject to our discretion as the sole managing member of CWGS, LLC and the discretion ofour board of directors. CWGS, LLC is required to make cash distributions in accordance with the CWGS LLCAgreement in an amount sufficient for us to pay any expenses incurred by us in connection with the regular quarterlycash dividend, along with any of our other operating expenses and other obligations. Holders of our Class B commonstock and Class C common stock are not entitled to participate in any dividends declared by our board of directors.We believe that our cash and cash equivalents and cash provided by operating activities will be sufficient for CWGS,LLC to make this regular quarterly cash distribution for at least the next twelve months.
In addition, the CWGS LLC Agreement requires tax distributions to be made by CWGS, LLC to its members,including us. In general, tax distributions are made on a quarterly basis, to each member of CWGS, LLC, including us,based on such member's allocable share of the taxable income of CWGS, LLC (which, in our case, will be determinedwithout regard to any Basis Adjustments described in our Tax Receivable Agreement) and an assumed tax ratebased on the highest combined federal, state, and local tax rate that may potentially apply to any one of CWGS,LLC's members (46.70% in 2020, 2019 and 2018), regardless of the actual final tax liability of any such member.Based on the current applicable effective tax rates, we expect that (i) the assumed tax rate that will be used forpurposes of determining tax distributions from CWGS, LLC will exceed our actual combined federal, state and localtax rate (assuming no changes in corporate tax rates) and (ii) the annual amount of tax distributions paid to us willexceed the sum of (A) our actual annual tax liability and (B) the annual amount payable by us under the TaxReceivable Agreement (assuming no early termination of the Tax Receivable Agreement) (such excess in clauses (A)and (B), collectively referred to herein as the "Excess Tax Distribution"). We currently intend to pay a special cashdividend of all or a portion of the Excess Tax Distribution to the holders of our Class A common stock from time totime subject to the discretion of our board of directors.
Our ability to pay cash dividends on our Class A common stock depends on, among other things, our resultsof operations, financial condition, level of indebtedness, capital requirements, contractual restrictions, restrictions inour debt agreements and in any preferred stock, restrictions under applicable law, the extent to which suchdistributions would render CWGS, LLC insolvent, our business prospects and other factors that our
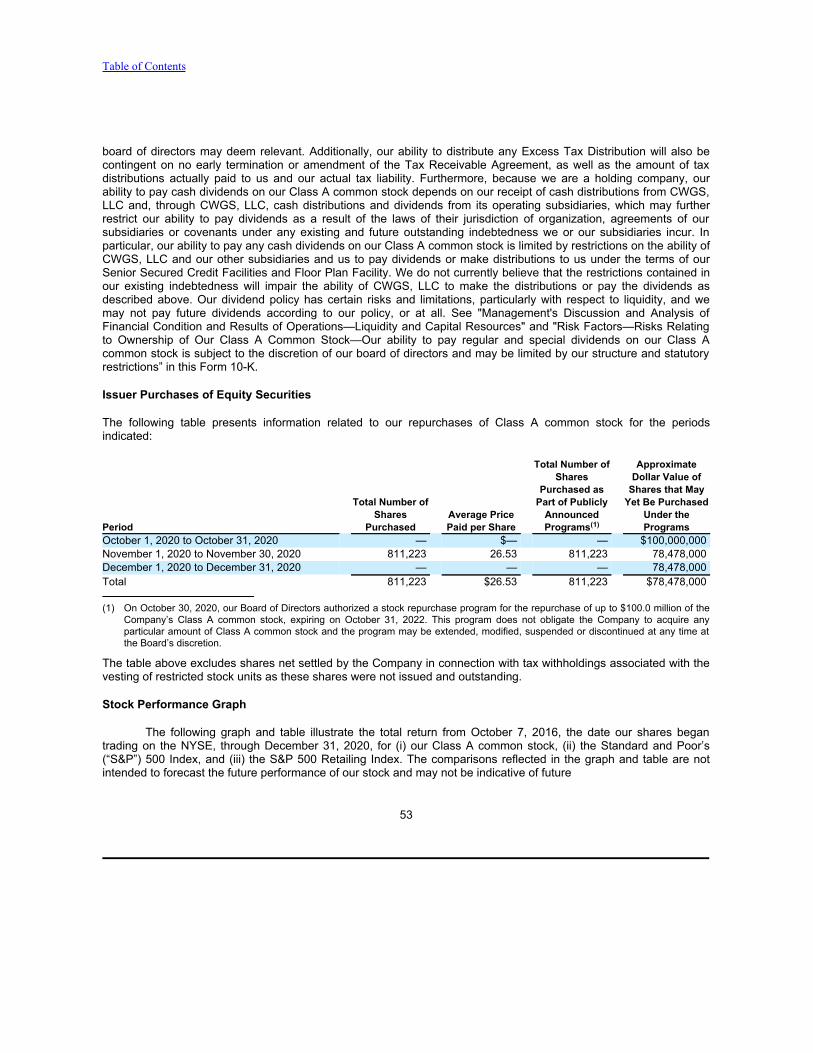
Table of Contents
53
board of directors may deem relevant. Additionally, our ability to distribute any Excess Tax Distribution will also becontingent on no early termination or amendment of the Tax Receivable Agreement, as well as the amount of taxdistributions actually paid to us and our actual tax liability. Furthermore, because we are a holding company, ourability to pay cash dividends on our Class A common stock depends on our receipt of cash distributions from CWGS,LLC and, through CWGS, LLC, cash distributions and dividends from its operating subsidiaries, which may furtherrestrict our ability to pay dividends as a result of the laws of their jurisdiction of organization, agreements of oursubsidiaries or covenants under any existing and future outstanding indebtedness we or our subsidiaries incur. Inparticular, our ability to pay any cash dividends on our Class A common stock is limited by restrictions on the ability ofCWGS, LLC and our other subsidiaries and us to pay dividends or make distributions to us under the terms of ourSenior Secured Credit Facilities and Floor Plan Facility. We do not currently believe that the restrictions contained inour existing indebtedness will impair the ability of CWGS, LLC to make the distributions or pay the dividends asdescribed above. Our dividend policy has certain risks and limitations, particularly with respect to liquidity, and wemay not pay future dividends according to our policy, or at all. See "Management's Discussion and Analysis ofFinancial Condition and Results of Operations—Liquidity and Capital Resources" and "Risk Factors—Risks Relatingto Ownership of Our Class A Common Stock—Our ability to pay regular and special dividends on our Class Acommon stock is subject to the discretion of our board of directors and may be limited by our structure and statutoryrestrictions” in this Form 10-K.
Issuer Purchases of Equity Securities
The following table presents information related to our repurchases of Class A common stock for the periodsindicated:
Period
Total Number ofShares
Purchased Average PricePaid per Share
Total Number ofShares
Purchased asPart of Publicly
AnnouncedPrograms(1)
ApproximateDollar Value of
Shares that MayYet Be Purchased
Under thePrograms
October 1, 2020 to October 31, 2020 — $— — $100,000,000November 1, 2020 to November 30, 2020 811,223 26.53 811,223 78,478,000December 1, 2020 to December 31, 2020 — — — 78,478,000Total 811,223 $26.53 811,223 $78,478,000
(1) On October 30, 2020, our Board of Directors authorized a stock repurchase program for the repurchase of up to $100.0 million of theCompany’s Class A common stock, expiring on October 31, 2022. This program does not obligate the Company to acquire anyparticular amount of Class A common stock and the program may be extended, modified, suspended or discontinued at any time atthe Board’s discretion.
The table above excludes shares net settled by the Company in connection with tax withholdings associated with thevesting of restricted stock units as these shares were not issued and outstanding.
Stock Performance Graph
The following graph and table illustrate the total return from October 7, 2016, the date our shares begantrading on the NYSE, through December 31, 2020, for (i) our Class A common stock, (ii) the Standard and Poor’s(“S&P”) 500 Index, and (iii) the S&P 500 Retailing Index. The comparisons reflected in the graph and table are notintended to forecast the future performance of our stock and may not be indicative of future
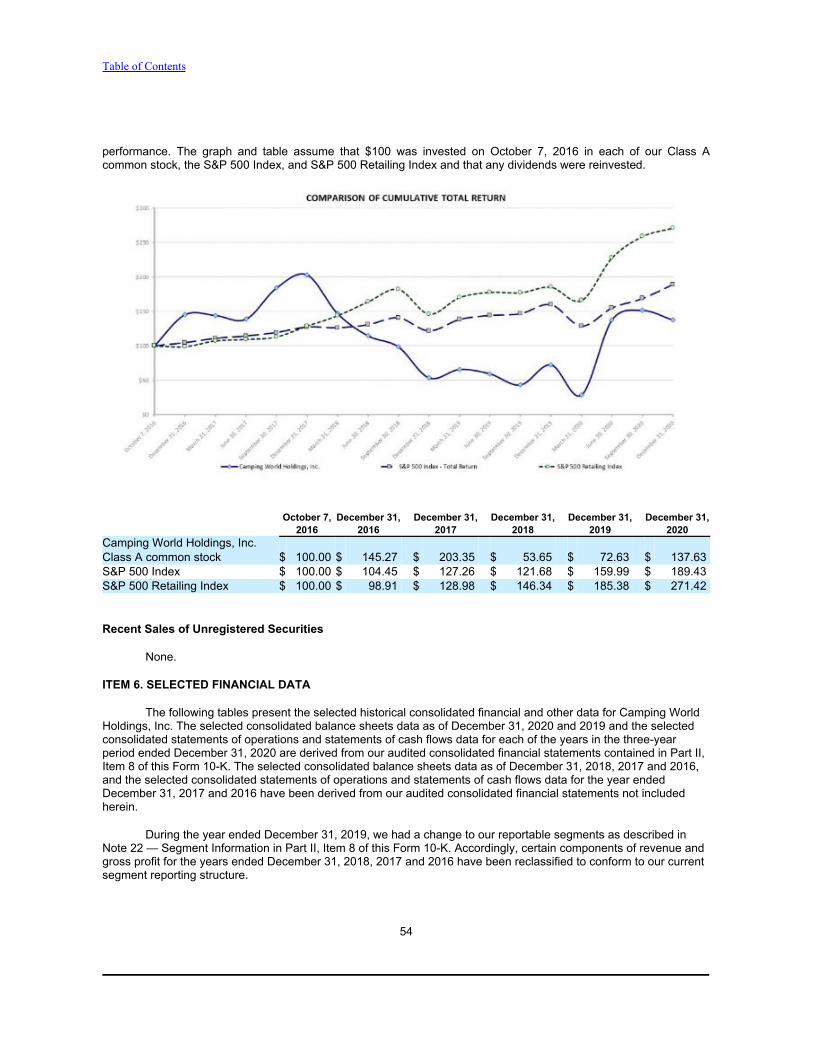
Table of Contents
54
performance. The graph and table assume that $100 was invested on October 7, 2016 in each of our Class Acommon stock, the S&P 500 Index, and S&P 500 Retailing Index and that any dividends were reinvested.
October 7, December 31, December 31, December 31, December 31, December 31,2016 2016 2017 2018 2019 2020
Camping World Holdings, Inc.Class A common stock $ 100.00 $ 145.27 $ 203.35 $ 53.65 $ 72.63 $ 137.63S&P 500 Index $ 100.00 $ 104.45 $ 127.26 $ 121.68 $ 159.99 $ 189.43S&P 500 Retailing Index $ 100.00 $ 98.91 $ 128.98 $ 146.34 $ 185.38 $ 271.42
Recent Sales of Unregistered Securities
None.
ITEM 6. SELECTED FINANCIAL DATA
The following tables present the selected historical consolidated financial and other data for Camping WorldHoldings, Inc. The selected consolidated balance sheets data as of December 31, 2020 and 2019 and the selectedconsolidated statements of operations and statements of cash flows data for each of the years in the three-yearperiod ended December 31, 2020 are derived from our audited consolidated financial statements contained in Part II,Item 8 of this Form 10-K. The selected consolidated balance sheets data as of December 31, 2018, 2017 and 2016,and the selected consolidated statements of operations and statements of cash flows data for the year endedDecember 31, 2017 and 2016 have been derived from our audited consolidated financial statements not includedherein.
During the year ended December 31, 2019, we had a change to our reportable segments as described inNote 22 — Segment Information in Part II, Item 8 of this Form 10-K. Accordingly, certain components of revenue andgross profit for the years ended December 31, 2018, 2017 and 2016 have been reclassified to conform to our currentsegment reporting structure.
Table of Contents
55
Our financial statements for the year ended December 31, 2017 reflect the provisional impact of the U.S. TaxCuts and Jobs Act of 2017 that significantly revised the U.S. corporate income tax by, among other things, loweringthe statutory corporate tax rate from 35% to 21% and eliminating certain deductions.
Our financial statements for the year ended December 31, 2018 reflect the adoption of Accounting StandardsCodification (“ASC”) No. 606, Revenue from Contracts with Customers as described in Note 2 — Revenue in Part II,Item 8 of this Form 10-K, which also removed the guidance for capitalization of direct response advertising that is nowexpensed as incurred.
Our financial statements for the year ended December 31, 2019 reflect the adoption of ASC No. 842, Leasesas described in Note 1 — Summary of Significant Accounting Policies — Recently Adopted AccountingPronouncements in Part II, Item 8 of this Form 10-K. Additionally, our financial statements for the year endedDecember 31, 2019 reflect long-lived asset impairments and restructuring charges as described in Note 5 —Restructuring and Long-lived Asset Impairment in Part II, Item 8 of this Form 10-K.
Subsequent to the IPO and the related reorganization transactions, Camping World Holdings, Inc. has been aholding company whose principal asset is its equity interest in CWGS, LLC. As the sole managing member of CWGS,LLC, Camping World Holdings, Inc. operates and controls all of the business and affairs of CWGS, LLC, and, throughCWGS, LLC, conducts its business. As a result, the Company consolidates CWGS, LLC’s financial results andreports a non-controlling interest related to the common units not owned by Camping World Holdings, Inc. Suchconsolidation has been reflected for all periods presented. Our selected historical consolidated financial and otherdata does not reflect what our financial position, results of operations and cash flows would have been had we been aseparate, stand-alone public company during those periods.
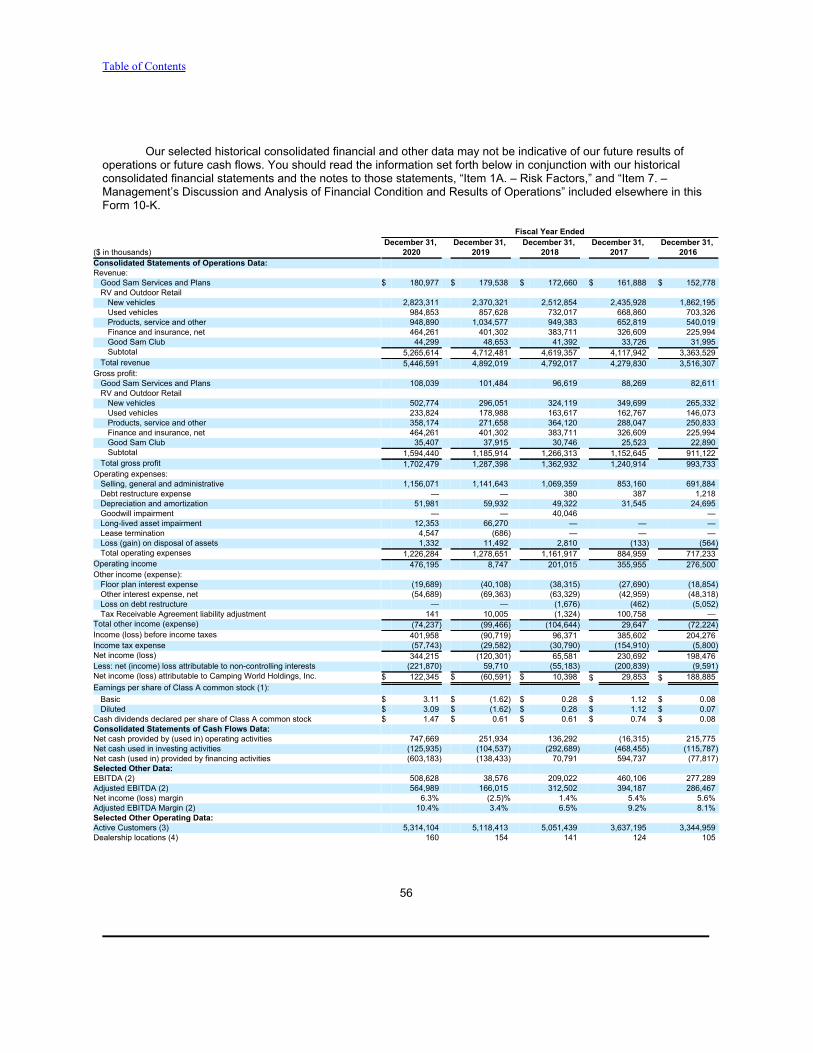
Table of Contents
56
Our selected historical consolidated financial and other data may not be indicative of our future results ofoperations or future cash flows. You should read the information set forth below in conjunction with our historicalconsolidated financial statements and the notes to those statements, “Item 1A. – Risk Factors,” and “Item 7. –Management’s Discussion and Analysis of Financial Condition and Results of Operations” included elsewhere in thisForm 10-K.
Fiscal Year EndedDecember 31, December 31, December 31, December 31, December 31,
($ in thousands) 2020 2019 2018 2017 2016Consolidated Statements of Operations Data:Revenue:
Good Sam Services and Plans $ 180,977 $ 179,538 $ 172,660 $ 161,888 $ 152,778RV and Outdoor Retail
New vehicles 2,823,311 2,370,321 2,512,854 2,435,928 1,862,195Used vehicles 984,853 857,628 732,017 668,860 703,326Products, service and other 948,890 1,034,577 949,383 652,819 540,019Finance and insurance, net 464,261 401,302 383,711 326,609 225,994Good Sam Club 44,299 48,653 41,392 33,726 31,995Subtotal 5,265,614 4,712,481 4,619,357 4,117,942 3,363,529
Total revenue 5,446,591 4,892,019 4,792,017 4,279,830 3,516,307Gross profit:
Good Sam Services and Plans 108,039 101,484 96,619 88,269 82,611RV and Outdoor Retail
New vehicles 502,774 296,051 324,119 349,699 265,332Used vehicles 233,824 178,988 163,617 162,767 146,073Products, service and other 358,174 271,658 364,120 288,047 250,833Finance and insurance, net 464,261 401,302 383,711 326,609 225,994Good Sam Club 35,407 37,915 30,746 25,523 22,890Subtotal 1,594,440 1,185,914 1,266,313 1,152,645 911,122
Total gross profit 1,702,479 1,287,398 1,362,932 1,240,914 993,733Operating expenses:
Selling, general and administrative 1,156,071 1,141,643 1,069,359 853,160 691,884Debt restructure expense — — 380 387 1,218Depreciation and amortization 51,981 59,932 49,322 31,545 24,695Goodwill impairment — — 40,046 —Long-lived asset impairment 12,353 66,270 — — —Lease termination 4,547 (686) — — —Loss (gain) on disposal of assets 1,332 11,492 2,810 (133) (564)Total operating expenses 1,226,284 1,278,651 1,161,917 884,959 717,233
Operating income 476,195 8,747 201,015 355,955 276,500Other income (expense):
Floor plan interest expense (19,689) (40,108) (38,315) (27,690) (18,854)Other interest expense, net (54,689) (69,363) (63,329) (42,959) (48,318)Loss on debt restructure — — (1,676) (462) (5,052)Tax Receivable Agreement liability adjustment 141 10,005 (1,324) 100,758 —
Total other income (expense) (74,237) (99,466) (104,644) 29,647 (72,224)Income (loss) before income taxes 401,958 (90,719) 96,371 385,602 204,276Income tax expense (57,743) (29,582) (30,790) (154,910) (5,800)Net income (loss) 344,215 (120,301) 65,581 230,692 198,476Less: net (income) loss attributable to non-controlling interests (221,870) 59,710 (55,183) (200,839) (9,591)Net income (loss) attributable to Camping World Holdings, Inc. $ 122,345 $ (60,591) $ 10,398 $ 29,853 $ 188,885Earnings per share of Class A common stock (1):
Basic $ 3.11 $ (1.62) $ 0.28 $ 1.12 $ 0.08Diluted $ 3.09 $ (1.62) $ 0.28 $ 1.12 $ 0.07
Cash dividends declared per share of Class A common stock $ 1.47 $ 0.61 $ 0.61 $ 0.74 $ 0.08Consolidated Statements of Cash Flows Data:Net cash provided by (used in) operating activities 747,669 251,934 136,292 (16,315) 215,775Net cash used in investing activities (125,935) (104,537) (292,689) (468,455) (115,787)Net cash (used in) provided by financing activities (603,183) (138,433) 70,791 594,737 (77,817)Selected Other Data:EBITDA (2) 508,628 38,576 209,022 460,106 277,289Adjusted EBITDA (2) 564,989 166,015 312,502 394,187 286,467Net income (loss) margin 6.3% (2.5)% 1.4% 5.4% 5.6%Adjusted EBITDA Margin (2) 10.4% 3.4% 6.5% 9.2% 8.1%Selected Other Operating Data:Active Customers (3) 5,314,104 5,118,413 5,051,439 3,637,195 3,344,959Dealership locations (4) 160 154 141 124 105
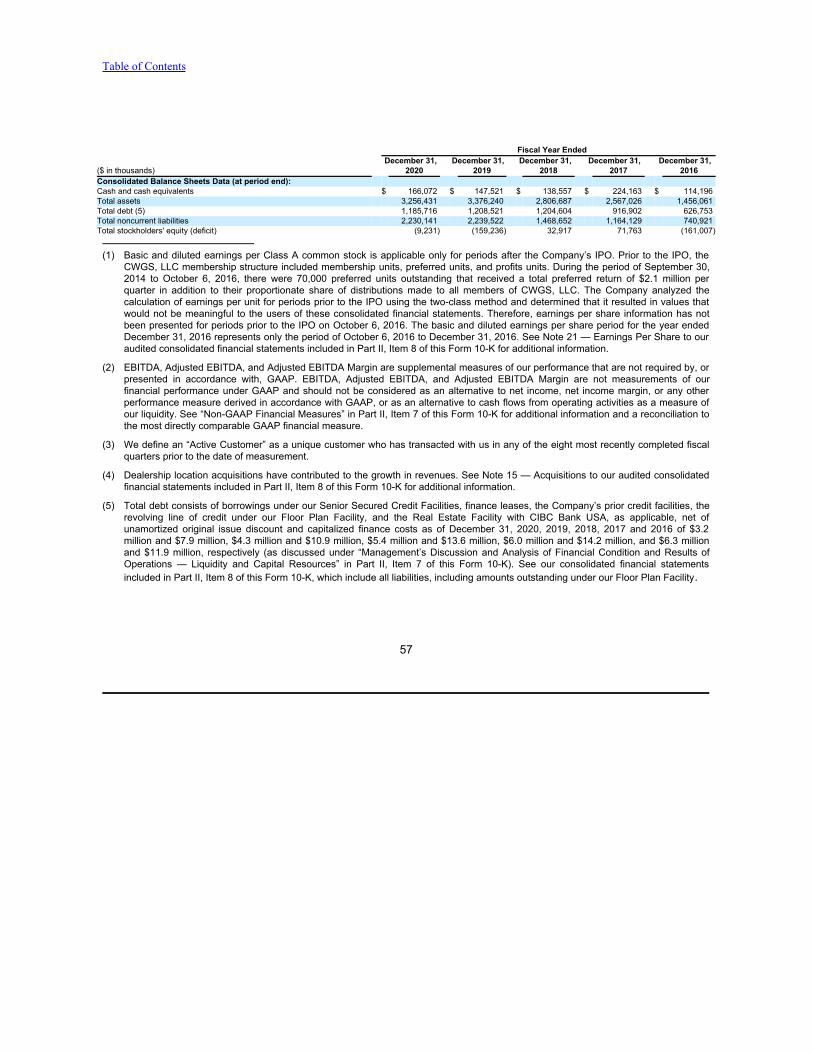
Table of Contents
57
Fiscal Year EndedDecember 31, December 31, December 31, December 31, December 31,
($ in thousands) 2020 2019 2018 2017 2016Consolidated Balance Sheets Data (at period end):Cash and cash equivalents $ 166,072 $ 147,521 $ 138,557 $ 224,163 $ 114,196Total assets 3,256,431 3,376,240 2,806,687 2,567,026 1,456,061Total debt (5) 1,185,716 1,208,521 1,204,604 916,902 626,753Total noncurrent liabilities 2,230,141 2,239,522 1,468,652 1,164,129 740,921Total stockholders' equity (deficit) (9,231) (159,236) 32,917 71,763 (161,007)
(1) Basic and diluted earnings per Class A common stock is applicable only for periods after the Company’s IPO. Prior to the IPO, theCWGS, LLC membership structure included membership units, preferred units, and profits units. During the period of September 30,2014 to October 6, 2016, there were 70,000 preferred units outstanding that received a total preferred return of $2.1 million perquarter in addition to their proportionate share of distributions made to all members of CWGS, LLC. The Company analyzed thecalculation of earnings per unit for periods prior to the IPO using the two-class method and determined that it resulted in values thatwould not be meaningful to the users of these consolidated financial statements. Therefore, earnings per share information has notbeen presented for periods prior to the IPO on October 6, 2016. The basic and diluted earnings per share period for the year endedDecember 31, 2016 represents only the period of October 6, 2016 to December 31, 2016. See Note 21 — Earnings Per Share to ouraudited consolidated financial statements included in Part II, Item 8 of this Form 10-K for additional information.
(2) EBITDA, Adjusted EBITDA, and Adjusted EBITDA Margin are supplemental measures of our performance that are not required by, orpresented in accordance with, GAAP. EBITDA, Adjusted EBITDA, and Adjusted EBITDA Margin are not measurements of ourfinancial performance under GAAP and should not be considered as an alternative to net income, net income margin, or any otherperformance measure derived in accordance with GAAP, or as an alternative to cash flows from operating activities as a measure ofour liquidity. See “Non-GAAP Financial Measures” in Part II, Item 7 of this Form 10-K for additional information and a reconciliation tothe most directly comparable GAAP financial measure.
(3) We define an “Active Customer” as a unique customer who has transacted with us in any of the eight most recently completed fiscalquarters prior to the date of measurement.
(4) Dealership location acquisitions have contributed to the growth in revenues. See Note 15 — Acquisitions to our audited consolidatedfinancial statements included in Part II, Item 8 of this Form 10-K for additional information.
(5) Total debt consists of borrowings under our Senior Secured Credit Facilities, finance leases, the Company’s prior credit facilities, therevolving line of credit under our Floor Plan Facility, and the Real Estate Facility with CIBC Bank USA, as applicable, net ofunamortized original issue discount and capitalized finance costs as of December 31, 2020, 2019, 2018, 2017 and 2016 of $3.2million and $7.9 million, $4.3 million and $10.9 million, $5.4 million and $13.6 million, $6.0 million and $14.2 million, and $6.3 millionand $11.9 million, respectively (as discussed under “Management’s Discussion and Analysis of Financial Condition and Results ofOperations — Liquidity and Capital Resources” in Part II, Item 7 of this Form 10-K). See our consolidated financial statementsincluded in Part II, Item 8 of this Form 10-K, which include all liabilities, including amounts outstanding under our Floor Plan Facility.
Table of Contents
58
ITEM 7. MANAGEMENT’S DISCUSSION AND ANALYSIS OF FINANCIAL CONDITION AND RESULTS OFOPERATIONS
The following discussion and analysis of our financial condition and results of operations should be readtogether with our Consolidated Financial Statements and related notes included in Part II, Item 8 of this Form 10-K.This discussion contains forward-looking statements based upon current plans, expectations and beliefs involvingrisks and uncertainties. Our actual results may differ materially from those anticipated in these forward-lookingstatements as a result of various important factors, including those set forth under “Risk Factors” included in Part I,Item 1A of this Form 10-K, the “Cautionary Note Regarding Forward-Looking Statements” and in other parts of thisForm 10-K. Except to the extent that differences among reportable segments are material to an understanding of ourbusiness taken as a whole, we present the discussion in Management’s Discussion and Analysis of FinancialCondition and Results of Operations on a consolidated basis.
For purposes of this Form 10-K, we define an "Active Customer" as a customer who has transacted with us inany of the eight most recently completed fiscal quarters prior to the date of measurement. Unless otherwise indicated,the date of measurement is December 31, 2020, our most recently completed fiscal quarter.
In this Item 7, we discuss the results of operations for the years ended December 31, 2020 and 2019 andcomparisons of the year ended December 31, 2020 to the year ended December 31, 2019. Discussions of the resultsof operations for the year ended December 31, 2018 and comparisons of the year ended December 31, 2019 to theyear ended December 31, 2018 can be found in “Management’s Discussion and Analysis of Financial Condition andResults of Operations” in Part II, Item 7 of our Annual Report on Form 10-K for the year ended December 31, 2019filed with the Securities and Exchange Commission (“SEC”) on February 28, 2020.
Overview
Camping World Holdings, Inc. (together with its subsidiaries) is America’s largest retailer of recreational RVsand related products and services. Our vision is to build a long-term legacy business that makes RVing fun and easy,and our Camping World and Good Sam brands have been serving RV consumers since 1966. We strive to build long-term value for our customers, employees, and shareholders by combining a unique and comprehensive assortment ofRV products and services with a national network of RV dealerships, service centers and customer support centersalong with the industry’s most extensive online presence and a highly-trained and knowledgeable team of associatesserving our customers, the RV lifestyle, and the communities in which we operate. We also believe that our GoodSam organization and family of programs and services uniquely enables us to connect with our customers asstewards of the RV lifestyle. On December 31, 2020, we operated a total of 171 retail locations, with 170 of theseselling and/or servicing RVs. See Note 1 ─ Summary of Significant Accounting Policies ─ Description of the Businessto our consolidated financial statements included in Part II, Item 8 of this Form 10-K.
With the COVID-19 crisis (see “COVID-19” below) causing many state and local governments to issue “stay-at-home” and “shelter-in-place” restrictions in mid-to-late March, sales and traffic levels across the RV industrydeclined significantly in March 2020. In response to the COVID-19 pandemic, many RV manufacturers, including ThorIndustries, Forest River, Inc., and Winnebago Industries, temporarily suspended production from late March to mid-May. This led to a 44.6% decrease in wholesale shipments of new RVs for the three month period of March, April,and May 2020, according to the RV Industry Association’s survey of manufacturers. The Company had taken steps toadd new private label lines, expand its relationships with smaller RV manufacturers, and acquire used inventory fromdistressed sellers to help manage risks in its supply chain. In conjunction with the stay-at-home and shelter-in-placerestrictions enacted in many areas, the Company saw significant sequential declines in its overall customer trafficlevels and its overall revenues from the mid-March to mid-to-late April 2020 timeframe. In the latter part of April, theCompany began to see significant improvements in its online web traffic levels and number of electronic leads, and inearly May, the Company began to see improvements in its overall revenue levels. As the stay-at-home restrictionsbegan to ease across certain areas of the country, the Company experienced significant acceleration in its in-storeand online traffic, lead generation, and revenue trends in May continuing throughout the remainder of 2020 and earlyindications appear to show favorable trends continuing into 2021.
Table of Contents
59
On September 15, 2020 we announced a number of initiatives heading into 2021, including plans to launch apeer-to-peer RV rental service, and a mobile RV technician marketplace, as well as plans to acquire RV dealerships.These initiatives continue to keep RVs as the focal point while expanding our value proposition to the customer and,in particular, to our 2.1 million active Good Sam members.
Segments
We operate two reportable segments: (i) Good Sam Services and Plans, and (ii) RV and Outdoor Retail. Weidentify our reporting segments based on the organizational units used by management to monitor performance andmake operating decisions. The Company previously had three reportable segments: (i) Consumer Services andPlans; (ii) Dealership, and (iii) Retail. In the first quarter of 2019, we realigned the structure of our internal organizationin a manner that caused the composition of our reportable segments to change. Our reportable segment financialinformation has been recast to reflect the updated reportable segment structure for all periods presented. See Note 1— Summary of Significant Accounting Policies — Description of the Business and Note 22 — Segment Information toour consolidated financial statements included in Part II, Item 8 of this Form 10-K for further information regarding ourreportable segments.
For the years ended December 31, 2020, 2019, and 2018, we generated 3.3%, 3.7%, and 3.6% of our totalrevenue and 6.4%, 7.9%, and 7.1% of our total gross profit from our Good Sam Services and Plans segment,respectively. For the years ended December 31, 2020, 2019, and 2018, we generated 96.7%, 96.3%, and 96.4% ofour total revenue and 93.6%, 92.1%, and 92.9% of our total gross profit from our RV and Outdoor Retail segment,respectively.
COVID-19
As discussed in Note 1 ─ Summary of Significant Accounting Policies ─ COVID-19 to our consolidatedfinancial statements included in Part II, Item 8 of this Form 10-K, the COVID-19 pandemic adversely impacted ourbusiness from mid-March through much of April 2020, but shifted to a favorable impact beginning primarily in May2020.
In response to the pandemic, we have implemented preparedness plans to keep our employees andcustomers safe, which include social distancing, providing employees with face coverings and/or other protectiveclothing as required, implementing additional cleaning and sanitization routines, and work-from-home orders for asignificant portion of our workforce. The majority of our retail locations have continued to operate as essentialbusinesses and consequently have remained open to serve our customers through the pandemic, and we continue tooperate our e-commerce business. As of December 31, 2020, we have temporarily closed two of our dealerships as aresult of COVID-19 and branding changes. These two dealerships are expected to reopen in 2021. We temporarilyreduced salaries and hours throughout the Company, including for our executive officers and implemented headcountand other cost reductions primarily from the middle of March 2020 through the middle of May 2020, in an attempt tobetter align expenses with the initially expected reduced sales resulting from the impact of COVID-19 on ourbusiness. Most of these temporary salary reductions ended in May 2020 as the adverse impacts of the pandemicbegan to decline and we increased hours for certain employees and reinstated many positions from the initialheadcount reductions as the demand for our products increased.
In conjunction with the stay-at-home and shelter-in-place restrictions enacted in many areas, we sawsignificant sequential declines in overall customer traffic levels and overall revenues from the mid-March to mid-to-lateApril 2020 timeframe. In the latter part of April, we began to see a significant improvement in online web traffic levels,and in early May, we began to see improvements in overall revenue levels. As the stay-at-home restrictions began toease across certain areas of the country, we experienced significant acceleration in our in-store traffic and revenuetrends in May and continuing throughout the remainder of 2020 and early indications appear to show favorable trendscontinuing into 2021. We believe that the demand will remain elevated as consumers continue to view RVs as anopportunity to work and school remotely.
Table of Contents
60
We have been implementing marketing and operational plans to optimize our leadership position through thepandemic, regardless of the ultimate timing and slope of the recovery curve. We have adapted our sales practices toaccommodate customers’ safety concerns in this COVID-19 environment, such as offering virtual tours of RVs andproviding home delivery options. As a consequence of COVID-19, we held fewer consumer shows and events during2020 than in 2019 and we debuted our first virtual show in 2020.
If stay-at-home and shelter-in-place restrictions are put back into place or as other modes of transportationand vacation options recover from the impact of COVID-19, the increased demand for our products may not besustained. We are unable to accurately quantify the future impact that COVID-19 may have on our business, resultsof operations and liquidity due to numerous uncertainties, including the severity of the disease, the duration of thepandemic, including additional waves of infection and the effectiveness and availability of vaccines, the economicimpact of the pandemic, actions that may be taken by governmental authorities and other as yet unanticipatedconsequences. In addition, there could be weakening demand for items that are not basic goods, and our supplychain could be disrupted in the future as a result of the outbreak, such as if Thor Industries, Inc. were to again closeits North American production facilities as it did from late March to early May 2020. Any of these events could have amaterially adverse impact on our operating results.
Key Performance Indicators
We evaluate the results of our overall business based on a variety of factors, including the number of ActiveCustomers and Good Sam members, revenue and same store revenue, vehicle units, and same store vehicle units,gross profit and gross profit per vehicle sold, gross margin, finance and insurance per vehicle (“PV”), vehicle inventoryturnover, and Adjusted EBITDA and Adjusted EBITDA margin. Sales of new vehicles generally result in a lower grossprofit margin than other areas of our business, including used vehicles, repair service and installation work, RVequipment and accessories, outdoor equipment and accessories and finance and insurance products.
Same store revenue. Same store revenue measures the performance of a retail location during the currentreporting period against the performance of the same retail location in the corresponding period of the previous year.Our same store revenue calculations for a given period include only those stores that were open both at the end ofthe corresponding period and at the beginning of the preceding fiscal year. As of December 31, 2020, 2019, and2018, we had a base of 142, 132, and 118 same stores, respectively. For the years ended December 31, 2020, 2019and 2018 our aggregate same store revenue was $4.5 billion, $3.7 billion, and $3.9 billion, respectively. With samestore revenue driven by the number of transactions and the average transaction price, changes in our mix of newvehicle sales has and will likely continue to negatively impact our new vehicle same store revenue. Over the pastseveral years, we have seen a shift in our overall mix of new RV sales towards travel trailer vehicles, which tend tocarry lower average selling prices than other classes of new RV vehicles. From 2015 to 2020, new vehicle traveltrailer units have increased from 62% to 74% of total new vehicle unit sales and the average selling price of a newvehicle unit has declined from $39,853 to $36,277. The increased popularity of new travel trailer vehicles and thelower price points of these units compared to other new vehicle classes such as motorhomes and fifth wheels couldcontinue to lower our average selling price of a new vehicle unit and impact our same store revenue.
Gross Profit and Gross Margins. Gross profit is our total revenue less our total costs applicable to revenue.Our total costs applicable to revenue primarily consists of the cost of goods and cost of sales, exclusive ofdepreciation and amortization. Gross margin is gross profit as a percentage of revenue.
Our gross profit is variable in nature and generally follows changes in our revenue. While gross margins forour RV and Outdoor Retail segment are lower than gross margins for our Good Sam Services and Plans, thissegment generates significant gross profit and is our primary means of acquiring new customers, to whom we thencross sell our higher margin products and services with recurring revenue. We believe the overall growth of our RVand Outdoor Retail segments will allow us to continue to drive growth in gross profit due to our ability to cross sell ourGood Sam Services and Plans to our increasing Active Customer base. Gross margin in our RV and Outdoor Retailsegment was negatively impacted in 2018 and 2017 by the opening of Gander Outdoors locations and in 2019 by the2019 Strategic Shift.
Table of Contents
61
Adjusted EBITDA and Adjusted EBITDA Margin. Adjusted EBITDA and Adjusted EBITDA Margin are someof the primary metrics management uses to evaluate the financial performance of our business. Adjusted EBITDAand Adjusted EBITDA Margin are also frequently used by analysts, investors, and other interested parties to evaluatecompanies in our industry. Adjusted EBITDA and Adjusted EBITDA Margin are non-GAAP metrics. We use AdjustedEBITDA and Adjusted EBITDA Margin to supplement GAAP measures of performance as follows:
• as a measurement of operating performance to assist us in comparing the operating performance of ourbusiness on a consistent basis, and remove the impact of items not directly resulting from our coreoperations;
• for planning purposes, including the preparation of our internal annual operating budget and financialprojections; and
• to evaluate the performance and effectiveness of our operational strategies.
For the definitions of Adjusted EBITDA and Adjusted EBITDA Margin, a reconciliation of Adjusted EBITDA tonet income, a reconciliation of Adjusted EBITDA Margin to net income margin, and a further discussion of how weutilize these non-GAAP financial measures and their limitations, see “Non-GAAP Financial Measures” below.
Industry Trends
After several years of strong growth, the overall RV industry experienced decelerating demand for newvehicles in 2018 and 2019. Along with the decelerating demand trends, wholesale shipments of new RV vehiclesdeclined 16.0% in 2019 according to the RV Industry Association’s survey of manufacturers. In late 2019, the demandfor new RVs across the overall RV industry began improving. Wholesale shipments of new RVs increased 13.2% inthe first two months of 2020 according to the RV Industry Association’s survey of manufacturers but then there was asix to eight week shutdown by RV manufacturers last spring which resulted in an 18.7% decrease in wholesaleshipments for the first half of 2020. Wholesale shipments of RVs for the second half of 2020 increased 34.2% overthe comparable period in 2019. For the year ended December 31, 2020 total RV shipments increased 6.0% versusthe comparable period in 2019, with the travel trailer group showing the largest increase.
With the COVID-19 crisis causing many state and local governments to issue “stay-at-home” and “shelter-in-place” restrictions in mid-to-late March, sales and traffic levels across the RV industry declined significantly in April2020. In response to the COVID-19 pandemic, many RV manufacturers, including Thor Industries, Forest River, Inc.,and Winnebago Industries, temporarily suspended production from late March to mid-May. This led to a 44.6%decrease in wholesale shipments of new RVs for the three month period of March, April, and May 2020, according tothe RV Industry Association’s survey of manufacturers.
Longer term, however, we believe the increase in the number of light-weight towable RV models offered bythe manufacturers, the increase in the number of pickup trucks and sport utility vehicles in operation, the ease oftowing, the affordability of many of the light-weight RVs, the savings RVs offer on a variety of vacation costs, anincrease in the pool of potential RV customers due to an aging baby boomer and millennial demographic, and theincreased RV ownership among younger consumers are positive long-term secular trends driving the growth of theRV industry and the installed base of RV owners.
In addition, we believe the growth in the number of U.S. camping households bodes well for the long-termgrowth of the RV industry. The 2020 North American Camping Report estimated that the total number of campinghouseholds in the U.S. has increased by more than 9.7 million over the past six years to 82 million. Campers areincreasing the amount of time they camp each year, with the number of campers who camp three times or more eachyear increasing by 82% since 2014. Over the past six years, an increasing number of campers have said that theyuse an RV as their primary camping accommodation. From 2014 to 2019, the number of campers using an RV tocamp increased from 21% to an estimated 27%.
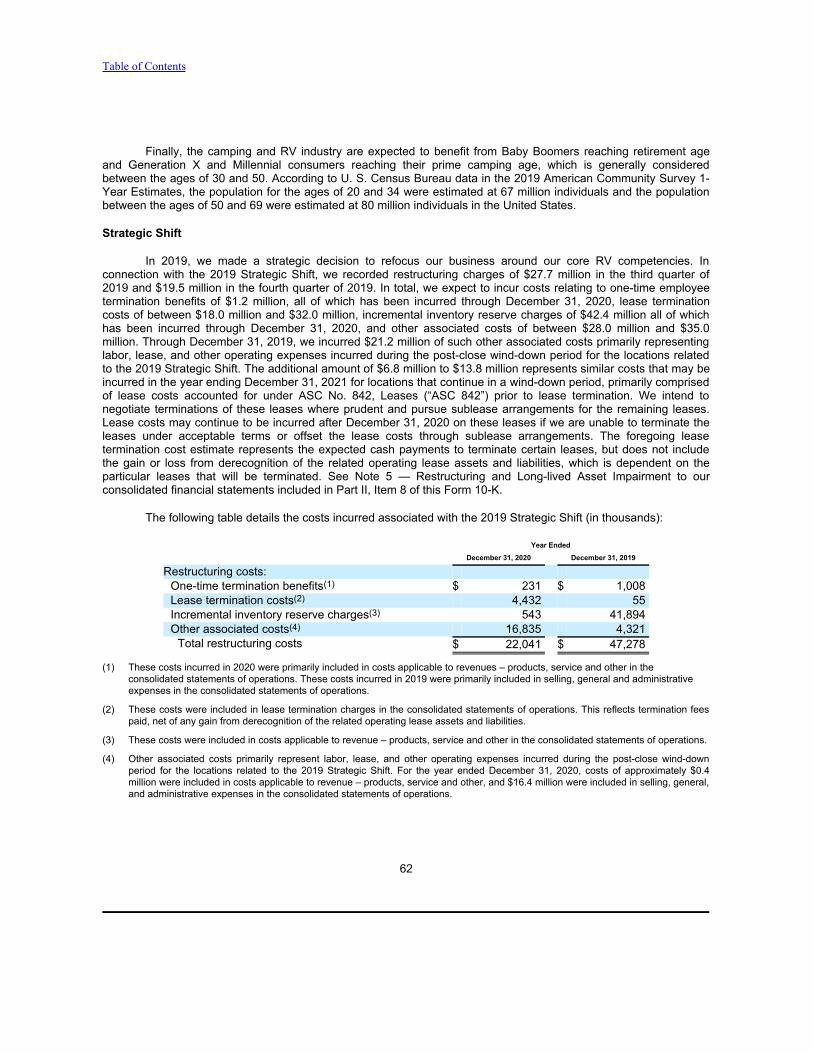
Table of Contents
62
Finally, the camping and RV industry are expected to benefit from Baby Boomers reaching retirement ageand Generation X and Millennial consumers reaching their prime camping age, which is generally consideredbetween the ages of 30 and 50. According to U. S. Census Bureau data in the 2019 American Community Survey 1-Year Estimates, the population for the ages of 20 and 34 were estimated at 67 million individuals and the populationbetween the ages of 50 and 69 were estimated at 80 million individuals in the United States.
Strategic Shift
In 2019, we made a strategic decision to refocus our business around our core RV competencies. Inconnection with the 2019 Strategic Shift, we recorded restructuring charges of $27.7 million in the third quarter of2019 and $19.5 million in the fourth quarter of 2019. In total, we expect to incur costs relating to one-time employeetermination benefits of $1.2 million, all of which has been incurred through December 31, 2020, lease terminationcosts of between $18.0 million and $32.0 million, incremental inventory reserve charges of $42.4 million all of whichhas been incurred through December 31, 2020, and other associated costs of between $28.0 million and $35.0million. Through December 31, 2019, we incurred $21.2 million of such other associated costs primarily representinglabor, lease, and other operating expenses incurred during the post-close wind-down period for the locations relatedto the 2019 Strategic Shift. The additional amount of $6.8 million to $13.8 million represents similar costs that may beincurred in the year ending December 31, 2021 for locations that continue in a wind-down period, primarily comprisedof lease costs accounted for under ASC No. 842, Leases (“ASC 842”) prior to lease termination. We intend tonegotiate terminations of these leases where prudent and pursue sublease arrangements for the remaining leases.Lease costs may continue to be incurred after December 31, 2020 on these leases if we are unable to terminate theleases under acceptable terms or offset the lease costs through sublease arrangements. The foregoing leasetermination cost estimate represents the expected cash payments to terminate certain leases, but does not includethe gain or loss from derecognition of the related operating lease assets and liabilities, which is dependent on theparticular leases that will be terminated. See Note 5 — Restructuring and Long-lived Asset Impairment to ourconsolidated financial statements included in Part II, Item 8 of this Form 10-K.
The following table details the costs incurred associated with the 2019 Strategic Shift (in thousands):
Year EndedDecember 31, 2020 December 31, 2019
Restructuring costs:One-time termination benefits(1) $ 231 $ 1,008Lease termination costs(2) 4,432 55Incremental inventory reserve charges(3) 543 41,894Other associated costs(4) 16,835 4,321
Total restructuring costs $ 22,041 $ 47,278
(1) These costs incurred in 2020 were primarily included in costs applicable to revenues – products, service and other in theconsolidated statements of operations. These costs incurred in 2019 were primarily included in selling, general and administrativeexpenses in the consolidated statements of operations.
(2) These costs were included in lease termination charges in the consolidated statements of operations. This reflects termination feespaid, net of any gain from derecognition of the related operating lease assets and liabilities.
(3) These costs were included in costs applicable to revenue – products, service and other in the consolidated statements of operations.
(4) Other associated costs primarily represent labor, lease, and other operating expenses incurred during the post-close wind-downperiod for the locations related to the 2019 Strategic Shift. For the year ended December 31, 2020, costs of approximately $0.4million were included in costs applicable to revenue – products, service and other, and $16.4 million were included in selling, general,and administrative expenses in the consolidated statements of operations.
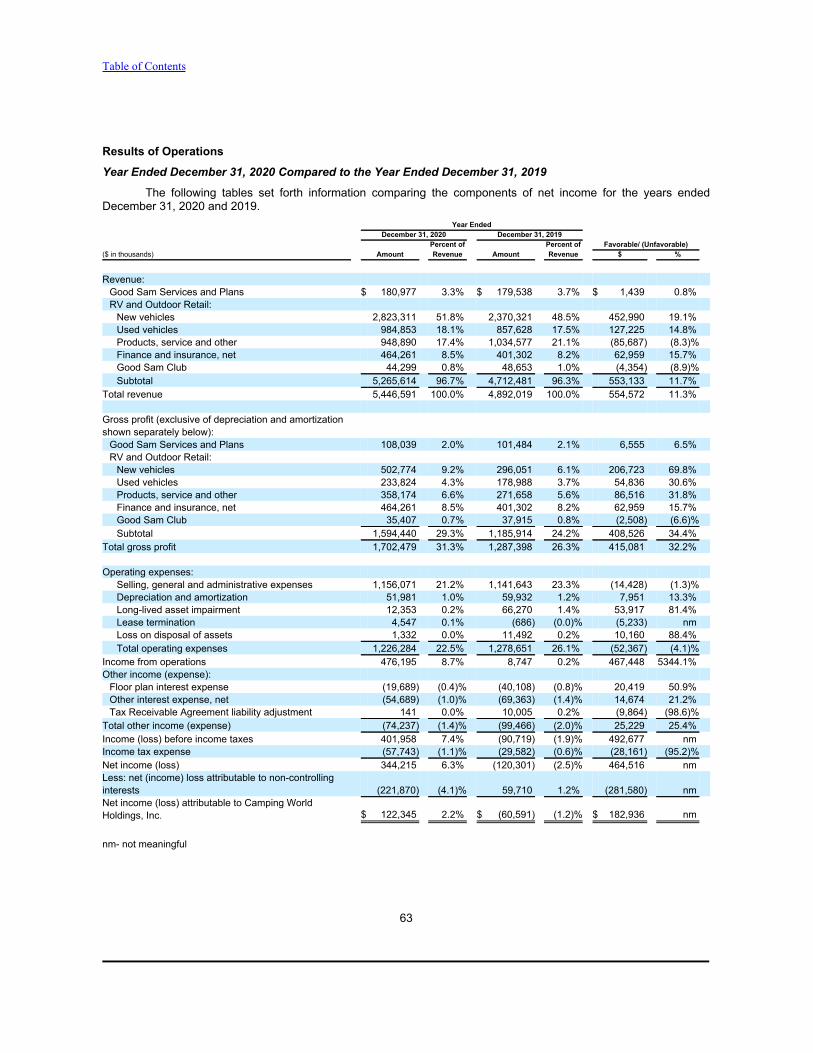
Table of Contents
63
Results of OperationsYear Ended December 31, 2020 Compared to the Year Ended December 31, 2019
The following tables set forth information comparing the components of net income for the years endedDecember 31, 2020 and 2019.
Year EndedDecember 31, 2020 December 31, 2019
Percent of Percent of Favorable/ (Unfavorable)($ in thousands) Amount Revenue Amount Revenue $ %
Revenue: Good Sam Services and Plans $ 180,977 3.3% $ 179,538 3.7% $ 1,439 0.8%RV and Outdoor Retail:
New vehicles 2,823,311 51.8% 2,370,321 48.5% 452,990 19.1%Used vehicles 984,853 18.1% 857,628 17.5% 127,225 14.8%Products, service and other 948,890 17.4% 1,034,577 21.1% (85,687) (8.3)%Finance and insurance, net 464,261 8.5% 401,302 8.2% 62,959 15.7%Good Sam Club 44,299 0.8% 48,653 1.0% (4,354) (8.9)%Subtotal 5,265,614 96.7% 4,712,481 96.3% 553,133 11.7%
Total revenue 5,446,591 100.0% 4,892,019 100.0% 554,572 11.3%
Gross profit (exclusive of depreciation and amortizationshown separately below):
Good Sam Services and Plans 108,039 2.0% 101,484 2.1% 6,555 6.5%RV and Outdoor Retail:
New vehicles 502,774 9.2% 296,051 6.1% 206,723 69.8%Used vehicles 233,824 4.3% 178,988 3.7% 54,836 30.6%Products, service and other 358,174 6.6% 271,658 5.6% 86,516 31.8%Finance and insurance, net 464,261 8.5% 401,302 8.2% 62,959 15.7%Good Sam Club 35,407 0.7% 37,915 0.8% (2,508) (6.6)%Subtotal 1,594,440 29.3% 1,185,914 24.2% 408,526 34.4%
Total gross profit 1,702,479 31.3% 1,287,398 26.3% 415,081 32.2%
Operating expenses:Selling, general and administrative expenses 1,156,071 21.2% 1,141,643 23.3% (14,428) (1.3)%Depreciation and amortization 51,981 1.0% 59,932 1.2% 7,951 13.3%Long-lived asset impairment 12,353 0.2% 66,270 1.4% 53,917 81.4%Lease termination 4,547 0.1% (686) (0.0)% (5,233) nm Loss on disposal of assets 1,332 0.0% 11,492 0.2% 10,160 88.4%Total operating expenses 1,226,284 22.5% 1,278,651 26.1% (52,367) (4.1)%
Income from operations 476,195 8.7% 8,747 0.2% 467,448 5344.1%Other income (expense):
Floor plan interest expense (19,689) (0.4)% (40,108) (0.8)% 20,419 50.9%Other interest expense, net (54,689) (1.0)% (69,363) (1.4)% 14,674 21.2%Tax Receivable Agreement liability adjustment 141 0.0% 10,005 0.2% (9,864) (98.6)%
Total other income (expense) (74,237) (1.4)% (99,466) (2.0)% 25,229 25.4%Income (loss) before income taxes 401,958 7.4% (90,719) (1.9)% 492,677 nmIncome tax expense (57,743) (1.1)% (29,582) (0.6)% (28,161) (95.2)%Net income (loss) 344,215 6.3% (120,301) (2.5)% 464,516 nmLess: net (income) loss attributable to non-controllinginterests (221,870) (4.1)% 59,710 1.2% (281,580) nmNet income (loss) attributable to Camping WorldHoldings, Inc. $ 122,345 2.2% $ (60,591) (1.2)% $ 182,936 nm
nm- not meaningful
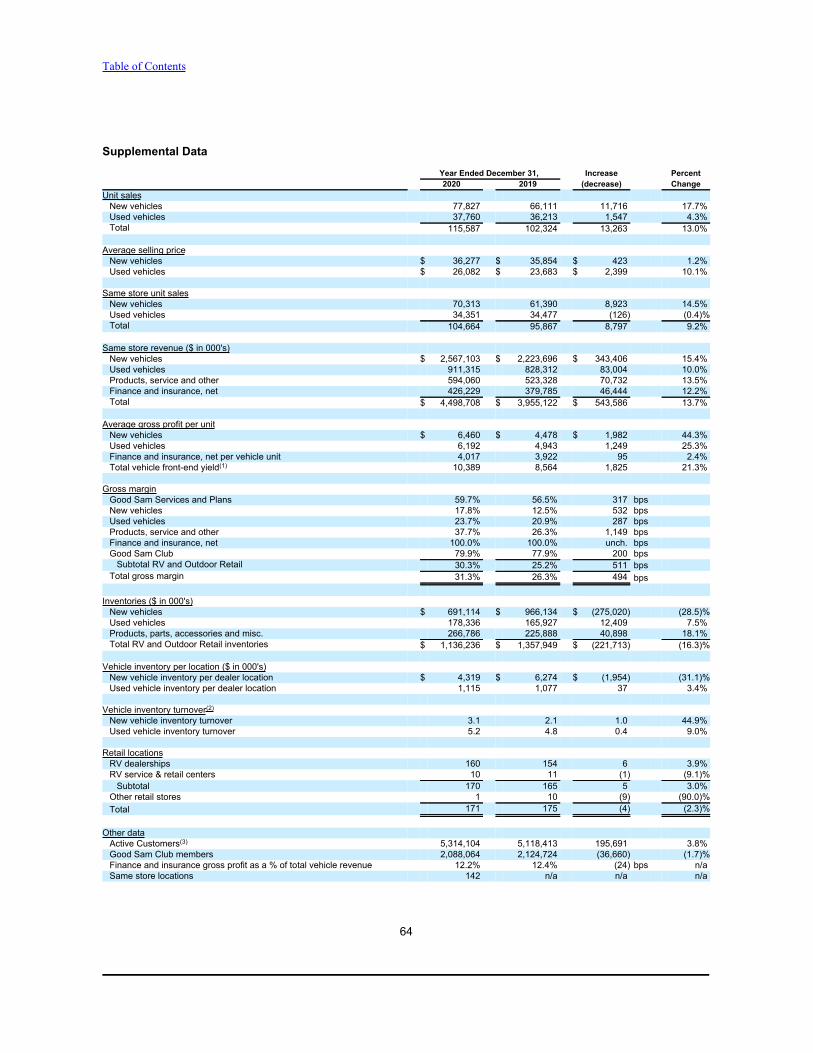
Table of Contents
64
Supplemental DataYear Ended December 31, Increase Percent2020 2019 (decrease) Change
Unit sales New vehicles 77,827 66,111 11,716 17.7%Used vehicles 37,760 36,213 1,547 4.3%Total 115,587 102,324 13,263 13.0%
Average selling priceNew vehicles $ 36,277 $ 35,854 $ 423 1.2%Used vehicles $ 26,082 $ 23,683 $ 2,399 10.1%
Same store unit salesNew vehicles 70,313 61,390 8,923 14.5%Used vehicles 34,351 34,477 (126) (0.4)%Total 104,664 95,867 8,797 9.2%
Same store revenue ($ in 000's)New vehicles $ 2,567,103 $ 2,223,696 $ 343,406 15.4%Used vehicles 911,315 828,312 83,004 10.0%Products, service and other 594,060 523,328 70,732 13.5%Finance and insurance, net 426,229 379,785 46,444 12.2%Total $ 4,498,708 $ 3,955,122 $ 543,586 13.7%
Average gross profit per unitNew vehicles $ 6,460 $ 4,478 $ 1,982 44.3%Used vehicles 6,192 4,943 1,249 25.3%Finance and insurance, net per vehicle unit 4,017 3,922 95 2.4%Total vehicle front-end yield(1) 10,389 8,564 1,825 21.3%
Gross marginGood Sam Services and Plans 59.7% 56.5% 317 bpsNew vehicles 17.8% 12.5% 532 bpsUsed vehicles 23.7% 20.9% 287 bpsProducts, service and other 37.7% 26.3% 1,149 bpsFinance and insurance, net 100.0% 100.0% unch. bpsGood Sam Club 79.9% 77.9% 200 bps
Subtotal RV and Outdoor Retail 30.3% 25.2% 511 bpsTotal gross margin 31.3% 26.3% 494 bps
Inventories ($ in 000's)New vehicles $ 691,114 $ 966,134 $ (275,020) (28.5)%Used vehicles 178,336 165,927 12,409 7.5%Products, parts, accessories and misc. 266,786 225,888 40,898 18.1%Total RV and Outdoor Retail inventories $ 1,136,236 $ 1,357,949 $ (221,713) (16.3)%
Vehicle inventory per location ($ in 000's)New vehicle inventory per dealer location $ 4,319 $ 6,274 $ (1,954) (31.1)%Used vehicle inventory per dealer location 1,115 1,077 37 3.4%
Vehicle inventory turnover(2)
New vehicle inventory turnover 3.1 2.1 1.0 44.9%Used vehicle inventory turnover 5.2 4.8 0.4 9.0%
Retail locationsRV dealerships 160 154 6 3.9%RV service & retail centers 10 11 (1) (9.1)%
Subtotal 170 165 5 3.0%Other retail stores 1 10 (9) (90.0)%Total 171 175 (4) (2.3)%
Other dataActive Customers(3) 5,314,104 5,118,413 195,691 3.8%Good Sam Club members 2,088,064 2,124,724 (36,660) (1.7)%Finance and insurance gross profit as a % of total vehicle revenue 12.2% 12.4% (24) bps n/aSame store locations 142 n/a n/a n/a
Table of Contents
65
(1) Front end yield is calculated as gross profit from new vehicles, used vehicles and finance and insurance (net), divided by combined newand used retail unit revenue.
(2) Inventory turnover calculated as vehicle costs applicable to revenue divided by the average of beginning and ending vehicle inventory.
(3) An Active Customer is a customer who has transacted with us in any of the eight most recently completed fiscal quarters prior to thedate of measurement.
Total revenue was $5.4 billion for 2020, an increase of $554.6 million, or 11.3%, from $4.9 billion for 2019.The increase in total revenue was driven by a $553.1 million, or 11.7%, increase in RV and Outdoor Retail revenue,and a $1.4 million, or 0.8%, increase in Good Sam Services and Plans revenue.
Total gross profit was $1.7 billion for 2020, an increase of $415.1 million, or 32.2%, from $1.3 billion for 2019.The increase in total gross profit was driven by a $408.5 million, or 34.4%, increase in RV and Outdoor Retail grossprofit, and a $6.6 million, or 6.5%, increase in Good Sam Services and Plans gross profit.
Income from operations was $476.2 million for 2020, an increase of $467.4 million from $8.7 million for 2019.The increase in income from operations was primarily driven by a $415.1 million increase in gross profit, a $53.9million decrease in long-lived asset impairment, a decrease of approximately $10.1 million in loss on disposal ofassets, and a decrease of approximately $7.9 million in depreciation and amortization, partially offset by an increaseof $14.4 million in selling, general and administrative expenses, and a $5.2 million increase in lease terminationexpense.
Total other expenses were $74.2 million for 2020, a decrease of $25.2 million, or 25.4% from $99.5 billion for2019. The decrease in other expenses was driven by a $20.4 million decrease in floor plan interest expense, and a$14.7 million decrease in other interest expense, partially offset by a $9.9 million favorable adjustment in TaxReceivable Agreement Liability in 2019, which did not reoccur in 2020.
As a result of the above factors, income before income taxes was $402.0 million for 2020 compared to lossbefore income taxes of $90.7 million for 2019. Income tax expense was $57.7 million for 2020, an increase of $28.2million from $29.6 million for 2019. As a result, net income was $344.2 million for 2020 compared to net loss of$120.3 million for 2019.
Good Sam Services and Plans
Good Sam Services and Plans revenue was $181.0 million for 2020, an increase of $1.4 million, or 0.8%,from $179.5 million for 2019. The $1.4 million increase was primarily attributable to $2.4 million from increasedcontracts in force from our roadside assistance programs, $1.8 million from increased contracts in force for ourextended vehicle warranty programs, $1.6 million from increased contracts in force for our vehicle insurance products,and $1.1 million from increased RV financing loan volume, partially offset by a $2.4 million decrease from 13 fewerconsumer shows, and decreases in advertising revenue of $1.4 million from the magazine group and $1.7 million forthe annual directory.
Good Sam Services and Plans gross profit was $108.0 million for 2020, an increase of $6.6 million, or 6.5%,from $101.5 million for 2019. The increase in gross profit was primarily attributable to $4.2 million from increasedpolicies in force and reduced marketing expenses for our extended vehicle programs, $3.2 million of increasedpolicies in force and reduced program expenses in our roadside assistance programs, and $1.2 million fromincreased loan volume for our RV financing, partially offset by $1.1 million of reduced gross profit from reducedconsumer shows, $0.8 million from the annual directory and $0.1 million from other services and plans.
RV and Outdoor Retail:
New Vehicles
New vehicle revenue was $2.8 billion for 2020, an increase of $453.0 million, or 19.1%, from $2.4 billion for2019. The increase was primarily due to a 17.7% increase in vehicle units sold and a 1.2% increase in
Table of Contents
66
average selling price per vehicle, driven by increases in nearly all product types. On a same store basis, new vehiclerevenue increased 15.4% to $2.6 billion in 2020 from $2.2 billion in 2019.
New vehicle gross profit increased 69.8%, or $206.7 million, to $502.8 million for 2020 from $296.1 million for2019. The increase was primarily due to a 44.3% increase in average gross profit per vehicle sold and by a 17.7%increase in vehicle units sold. Gross margin increased 532 basis points to 17.8% in 2020 from 12.5% in 2019. Theincrease was primarily due to higher towable and motorized gross margins resulting from lower supply frommanufacturers and outsized demand from consumers turning to RVing as a vacation alternative.
Used Vehicles
Used vehicle revenue increased 14.8%, or $127.2 million, to $984.9 million for 2020 from $857.6 million for2019. The increase was primarily due to a 10.1% increase in average selling price per vehicle sold, and a 4.3%increase in vehicle units sold, driven mostly by towable units where a dip in trade-in rates through a portion of theyear compressed inventory levels while product demand remained high. On a same store basis, used vehicle revenueincreased 10.0% to $911.3 million in 2020 from $828.3 million in 2019.
Used vehicle gross profit increased 30.6%, or $54.8 million, to $223.8 million in 2020 from $179.0 million in2019. The increase was primarily from a 25.3% increase in average gross profit per vehicle sold and a 4.3% increasein vehicle units sold. Used vehicle gross margin increased 287 basis points to 23.7% in 2020 from 20.9% in 2019.The increase was driven by nearly all types of towable units as a result of strength in the used market.
Products, Service and Other
Products, service and other revenue decreased 8.3%, or $85.7 million, to $948.9 million in 2020 from $1.0billion in 2019. The decrease was driven by store closures related to the 2019 Strategic Shift, partially offset byimprovements in same store sales. On a same store basis, products, service and other revenue increased 13.5% to$594.1 million for 2020 from $523.3 million in 2019.
Products, service and other gross profit increased 31.8%, or $86.5 million, to $358.2 million in 2020 from$271.7 million in 2019. The increase was driven by the 2019 Strategic Shift inventory liquidation charge of $27.3million in 2019 and improved margin at the remaining locations. Product, service and other gross margin increased to37.7% in 2020 from 26.3% in 2019. The increase was primarily due to a sales mix shift towards higher margin legacyRV products and the 2019 Strategic Shift inventory liquidation charge of $27.3 million in 2019.
Finance and Insurance, net
Finance and insurance, net revenue increased 15.7%, or $63.0 million to $464.3 million in 2020 from $401.3million for 2019, primarily due to increased volume of vehicles sold. Finance and insurance, net as a percentage ofnew and used vehicle revenue decreased to 12.2% for 2020 from 12.4% for 2019. On a same store basis, financeand insurance, net revenue increased 12.2%, or $46.4 million, to $426.2 million in 2020 versus $379.8 million in 2019.
Good Sam Club
Good Sam Club revenue decreased 8.9%, or $4.4 million, to $44.3 million in 2020 from $48.7 million in 2019.The decrease resulted from a reduced number of members and reduced royalty fees from the credit card related tofewer retail locations that resulted from store closures related to the 2019 Strategic Shift.
Good Sam Club gross profit decreased 6.6%, or $2.5 million, to $35.4 million in 2020 from $37.9 million in2019. The decrease was primarily due to a reduced number of members from the decreased number of stores as aresult of the store closures related to the 2019 Strategic Shift. Gross margin increased to 79.9% in 2020 from 77.9%in 2019 primarily due to reduced club marketing expenses.
Table of Contents
67
Selling, general and administrative
Selling, general and administrative expenses increased 1.3%, or $14.4 million, to $1.2 billion in 2020 from$1.1 billion for 2019. The $14.4 million increase was primarily due to a $46.7 million increase in wage-relatedexpenses attributable in large part to variable pay on increased gross profit, partially offset by an $18.1 milliondecrease in advertising as the Company shifted towards a more digitally-driven marketing approach, $8.1 milliondecrease in personal and real property expense primarily due to closed stores as a result of the 2019 Strategic Shift,and a $6.1 million decrease in other store and corporate overhead expenses. Selling, general and administrativeexpenses as a percentage of total gross profit decreased to 67.9% in 2020 from 88.7% in 2019.
Depreciation and amortization
Depreciation and amortization decreased 13.3%, or $8.0 million, to $52.0 million in 2020 from $59.9 millionfor 2019 due to reduction in capital expenditures in 2020 and the asset impairment related to the 2019 Strategic Shiftin 2019.
Long-lived asset impairment
As discussed in Note 5 – Restructuring and Long-lived Asset Impairment to our consolidated financialstatements included in Part II, Item 8 of this Form 10-K, we recognized $12.4 million of long-lived asset impairmentsin 2020, of which $12.3 million related to the 2019 Strategic Shift discussed above, and $66.3 million of long-livedasset impairments during 2019, of which $57.4 million was related to the 2019 Strategic Shift.
Lease termination
Lease termination expense increased $5.2 million to $4.5 million in 2020 from a lease termination benefit of$0.7 million in 2019, related primarily to lease terminations in connection with the 2019 Strategic Shift discussedabove.
Floor plan interest expense
Floor plan interest expense decreased 50.9%, or $20.4 million, to $19.7 million for 2020 from $40.1 million in2019. The decrease was primarily due to a 169 basis point decrease in the average floor plan borrowing rate, and a22.3% decrease in average floor plan borrowings driven by lower average inventory levels.
Other interest expense, net
Other interest expense decreased 21.2%, or $14.7 million, to $54.7 million in 2020 from $69.4 million for2019. The decrease was primarily due to a 113 basis point decrease in the average interest rate.
Tax Receivable Agreement liability adjustment
The Tax Receivable Agreement liability adjustment for 2020 and 2019 was a benefit of $0.1 million and $10.0million, respectively, which represented an adjustment for lower enacted state income tax rates in both periods.
Income tax expense
Income tax expense increased 95.2%, or $28.2 million, to $57.7 million in 2020 compared to $29.6 million for2019. The increase was primarily due to higher income generated at CWGS, LLC for which the Company is subject toU.S. federal and state taxes on its allocable share, partially offset by operating losses recorded by Camping World,Inc. (“CW”) for which no tax benefit can be recognized.
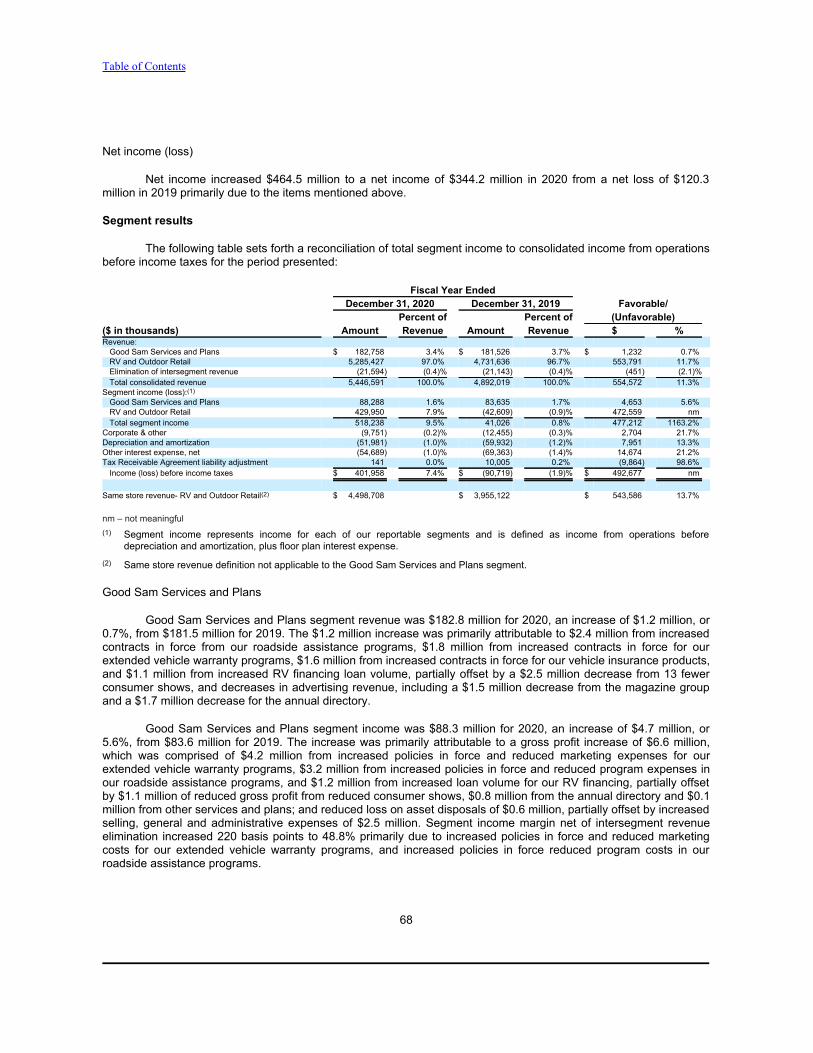
Table of Contents
68
Net income (loss)
Net income increased $464.5 million to a net income of $344.2 million in 2020 from a net loss of $120.3million in 2019 primarily due to the items mentioned above.
Segment results
The following table sets forth a reconciliation of total segment income to consolidated income from operationsbefore income taxes for the period presented:
Fiscal Year EndedDecember 31, 2020 December 31, 2019 Favorable/
Percent of Percent of (Unfavorable)($ in thousands) Amount Revenue Amount Revenue $ % Revenue:
Good Sam Services and Plans $ 182,758 3.4% $ 181,526 3.7% $ 1,232 0.7%RV and Outdoor Retail 5,285,427 97.0% 4,731,636 96.7% 553,791 11.7%Elimination of intersegment revenue (21,594) (0.4)% (21,143) (0.4)% (451) (2.1)%Total consolidated revenue 5,446,591 100.0% 4,892,019 100.0% 554,572 11.3%
Segment income (loss):(1)
Good Sam Services and Plans 88,288 1.6% 83,635 1.7% 4,653 5.6%RV and Outdoor Retail 429,950 7.9% (42,609) (0.9)% 472,559 nmTotal segment income 518,238 9.5% 41,026 0.8% 477,212 1163.2%
Corporate & other (9,751) (0.2)% (12,455) (0.3)% 2,704 21.7%Depreciation and amortization (51,981) (1.0)% (59,932) (1.2)% 7,951 13.3%Other interest expense, net (54,689) (1.0)% (69,363) (1.4)% 14,674 21.2%Tax Receivable Agreement liability adjustment 141 0.0% 10,005 0.2% (9,864) 98.6%
Income (loss) before income taxes $ 401,958 7.4% $ (90,719) (1.9)% $ 492,677 nm
Same store revenue- RV and Outdoor Retail(2) $ 4,498,708 $ 3,955,122 $ 543,586 13.7%
nm – not meaningful(1) Segment income represents income for each of our reportable segments and is defined as income from operations before
depreciation and amortization, plus floor plan interest expense.(2) Same store revenue definition not applicable to the Good Sam Services and Plans segment.
Good Sam Services and Plans
Good Sam Services and Plans segment revenue was $182.8 million for 2020, an increase of $1.2 million, or0.7%, from $181.5 million for 2019. The $1.2 million increase was primarily attributable to $2.4 million from increasedcontracts in force from our roadside assistance programs, $1.8 million from increased contracts in force for ourextended vehicle warranty programs, $1.6 million from increased contracts in force for our vehicle insurance products,and $1.1 million from increased RV financing loan volume, partially offset by a $2.5 million decrease from 13 fewerconsumer shows, and decreases in advertising revenue, including a $1.5 million decrease from the magazine groupand a $1.7 million decrease for the annual directory.
Good Sam Services and Plans segment income was $88.3 million for 2020, an increase of $4.7 million, or5.6%, from $83.6 million for 2019. The increase was primarily attributable to a gross profit increase of $6.6 million,which was comprised of $4.2 million from increased policies in force and reduced marketing expenses for ourextended vehicle warranty programs, $3.2 million from increased policies in force and reduced program expenses inour roadside assistance programs, and $1.2 million from increased loan volume for our RV financing, partially offsetby $1.1 million of reduced gross profit from reduced consumer shows, $0.8 million from the annual directory and $0.1million from other services and plans; and reduced loss on asset disposals of $0.6 million, partially offset by increasedselling, general and administrative expenses of $2.5 million. Segment income margin net of intersegment revenueelimination increased 220 basis points to 48.8% primarily due to increased policies in force and reduced marketingcosts for our extended vehicle warranty programs, and increased policies in force reduced program costs in ourroadside assistance programs.
Table of Contents
69
RV and Outdoor Retail segment
RV and Outdoor Retail segment revenue was $5.3 billion for 2020, an increase of $553.8 million, or 11.7%,from $4.7 billion for 2019. The increase was primarily due to a 17.7% increase in new vehicle units sold and a 4.4%increase in average selling price per vehicle, driven by increases in nearly all product types, led by single and doubleaxle travel trailers.
RV and Outdoor Retail segment income was $430.0 million for 2020, an increase of $472.6 million, fromsegment loss of $42.6 million for 2019. The increase was primarily due to a $408.5 million increase in gross profitprimarily from higher towable and motorized gross margins resulting from lower supply from manufacturers andoutsized demand from consumers turning to RVing as a vacation alternative and increased strength of the usedvehicle market, a $53.9 million reduction in long-lived asset impairment, a $20.4 million decrease in floor plan interestexpense, and a $9.5 million reduction in loss on disposal of assets, partially offset by an increase of approximately$14.5 million in selling, general and administrative expenses resulting from commissions on increased revenuepartially offset by a reduction resulting from the 2019 Strategic Shift, and a $5.2 million increase in lease terminationexpense. Segment income margin net of intersegment revenue elimination increased to 8.2% from a segment lossmargin of 0.90% in 2019 primarily due to the impact of the 2019 Strategic Shift.
Corporate and other expenses
Corporate and other expenses were $9.8 million for 2020, a decrease of $2.7 million, or 21.7%, from $12.5million for 2019. The decrease was primarily due to reduced professional fees.
Tax Receivable Agreement liability adjustment
The Tax Receivable Agreement liability adjustment for 2020 and 2019 was a benefit of $0.1 million and $10.0million, respectively, which represented an adjustment for lower enacted state income tax rates in both periods.
Non-GAAP Financial Measures
To supplement our consolidated financial statements, which are prepared and presented in accordance withaccounting principles generally accepted in the United States (“GAAP”), we use the following non-GAAP financialmeasures: EBITDA, Adjusted EBITDA, Adjusted EBITDA Margin, Adjusted Net Income Attributable to Camping WorldHoldings, Inc. – Basic, Adjusted Net Income Attributable to Camping World Holdings, Inc. – Diluted, AdjustedEarnings Per Share – Basic, and Adjusted Earnings Per Share – Diluted (collectively the "Non-GAAP FinancialMeasures"). We believe that these Non-GAAP Financial Measures, when used in conjunction with GAAP financialmeasures, provide useful information about operating results, enhance the overall understanding of past financialperformance and future prospects, and allow for greater transparency with respect to the key metrics we use in ourfinancial and operational decision making. These Non-GAAP Financial Measures are also frequently used byanalysts, investors and other interested parties to evaluate companies in the Company’s industry. The presentation ofthis financial information is not intended to be considered in isolation or as a substitute for, or superior to, the financialinformation prepared and presented in accordance with GAAP, and they should not be construed as an inference thatthe Company’s future results will be unaffected by any items adjusted for in these non-GAAP Financial Measures. Inevaluating these non-GAAP Financial Measures, you should be aware that in the future the Company may incurexpenses that are the same as or similar to some of those adjusted in this presentation. The Non-GAAP FinancialMeasures that we use are not necessarily comparable to similarly titled measures used by other companies due todifferent methods of calculation.
EBITDA, Adjusted EBITDA, and Adjusted EBITDA Margin
We define “EBITDA” as net income before other interest expense, net (excluding floor plan interest expense),provision for income tax expense and depreciation and amortization. We define “Adjusted EBITDA” as EBITDAfurther adjusted for the impact of certain noncash and other items that we do not consider in our evaluation of ongoingoperating performance. These items include, among other things, long-lived asset
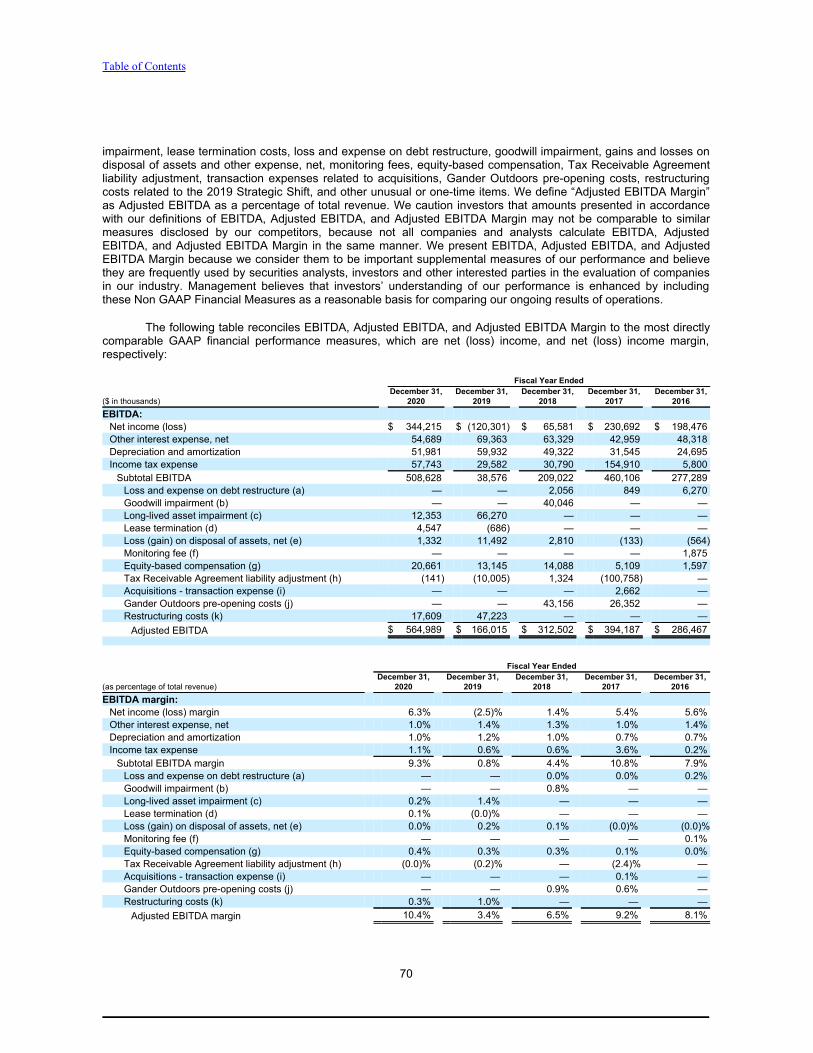
Table of Contents
70
impairment, lease termination costs, loss and expense on debt restructure, goodwill impairment, gains and losses ondisposal of assets and other expense, net, monitoring fees, equity-based compensation, Tax Receivable Agreementliability adjustment, transaction expenses related to acquisitions, Gander Outdoors pre-opening costs, restructuringcosts related to the 2019 Strategic Shift, and other unusual or one-time items. We define “Adjusted EBITDA Margin”as Adjusted EBITDA as a percentage of total revenue. We caution investors that amounts presented in accordancewith our definitions of EBITDA, Adjusted EBITDA, and Adjusted EBITDA Margin may not be comparable to similarmeasures disclosed by our competitors, because not all companies and analysts calculate EBITDA, AdjustedEBITDA, and Adjusted EBITDA Margin in the same manner. We present EBITDA, Adjusted EBITDA, and AdjustedEBITDA Margin because we consider them to be important supplemental measures of our performance and believethey are frequently used by securities analysts, investors and other interested parties in the evaluation of companiesin our industry. Management believes that investors’ understanding of our performance is enhanced by includingthese Non GAAP Financial Measures as a reasonable basis for comparing our ongoing results of operations.
The following table reconciles EBITDA, Adjusted EBITDA, and Adjusted EBITDA Margin to the most directlycomparable GAAP financial performance measures, which are net (loss) income, and net (loss) income margin,respectively:
Fiscal Year EndedDecember 31, December 31, December 31, December 31, December 31,
($ in thousands) 2020 2019 2018 2017 2016EBITDA:
Net income (loss) $ 344,215 $ (120,301) $ 65,581 $ 230,692 $ 198,476Other interest expense, net 54,689 69,363 63,329 42,959 48,318Depreciation and amortization 51,981 59,932 49,322 31,545 24,695Income tax expense 57,743 29,582 30,790 154,910 5,800
Subtotal EBITDA 508,628 38,576 209,022 460,106 277,289Loss and expense on debt restructure (a) — — 2,056 849 6,270Goodwill impairment (b) — — 40,046 — —Long-lived asset impairment (c) 12,353 66,270 — — —Lease termination (d) 4,547 (686) — — —Loss (gain) on disposal of assets, net (e) 1,332 11,492 2,810 (133) (564)Monitoring fee (f) — — — — 1,875Equity-based compensation (g) 20,661 13,145 14,088 5,109 1,597Tax Receivable Agreement liability adjustment (h) (141) (10,005) 1,324 (100,758) —Acquisitions - transaction expense (i) — — — 2,662 —Gander Outdoors pre-opening costs (j) — — 43,156 26,352 —Restructuring costs (k) 17,609 47,223 — — —
Adjusted EBITDA $ 564,989 $ 166,015 $ 312,502 $ 394,187 $ 286,467
Fiscal Year EndedDecember 31, December 31, December 31, December 31, December 31,
(as percentage of total revenue) 2020 2019 2018 2017 2016EBITDA margin:
Net income (loss) margin 6.3% (2.5)% 1.4% 5.4% 5.6%Other interest expense, net 1.0% 1.4% 1.3% 1.0% 1.4%Depreciation and amortization 1.0% 1.2% 1.0% 0.7% 0.7%Income tax expense 1.1% 0.6% 0.6% 3.6% 0.2%
Subtotal EBITDA margin 9.3% 0.8% 4.4% 10.8% 7.9%Loss and expense on debt restructure (a) — — 0.0% 0.0% 0.2%Goodwill impairment (b) — — 0.8% — —Long-lived asset impairment (c) 0.2% 1.4% — — —Lease termination (d) 0.1% (0.0)% — — —Loss (gain) on disposal of assets, net (e) 0.0% 0.2% 0.1% (0.0)% (0.0)%Monitoring fee (f) — — — — 0.1%Equity-based compensation (g) 0.4% 0.3% 0.3% 0.1% 0.0%Tax Receivable Agreement liability adjustment (h) (0.0)% (0.2)% — (2.4)% —Acquisitions - transaction expense (i) — — — 0.1% —Gander Outdoors pre-opening costs (j) — — 0.9% 0.6% —Restructuring costs (k) 0.3% 1.0% — — —
Adjusted EBITDA margin 10.4% 3.4% 6.5% 9.2% 8.1%
Table of Contents
71
(a) Represents the loss and expense incurred on debt restructure and financing expense incurred from the Third Amendment to theCredit Agreement in 2018, the First and Second Amendment to the Senior Credit Facilities in 2017, the write-off of a portion of theoriginal issue discount, capitalized finance costs from the Previous Term Loan Facilities, and rating agency fees and legal expensesrelated to the Previous Term Loan Facilities in 2016.
(b) Represents a goodwill impairment charge of $40.0 million related to the RV and Outdoor Retail segment in the fourth quarter of 2018.See Note 7 - Goodwill and Intangible Assets to our audited consolidated financial statements in Part II, Item 8 of this Form 10-K foradditional information.
(c) Represents long-lived asset impairment charges related to the RV and Outdoor Retail segment, which primarily relate to locationsaffected by the 2019 Strategic Shift. See Note 5 – Restructuring and Long-lived Asset Impairment to our consolidated financialstatements included in Part II, Item 8 of this Form 10-K for additional information.
(d) Represents the loss (gain) on the termination of operating leases relating primarily to the 2019 Strategic Shift, net of leasetermination fees. See Note 5 – Restructuring and Long-lived Asset Impairment to our consolidated financial statements included inPart II, Item 8 of this Form 10-K for additional information.
(e) Represents an adjustment to eliminate (i) losses on the disposal or sale of real estate at closed retail locations in 2020 and 2019 and(ii) the gains and losses on disposal and sales of various assets.
(f) Represents monitoring fees paid pursuant to a monitoring agreement to Crestview and Stephen Adams. The monitoring agreementwas terminated on October 6, 2016 in connection with our IPO.
(g) Represents non-cash equity-based compensation expense relating to employees, directors, and consultants of the Company.
(h) Represents an adjustment to eliminate the gains on remeasurement of the Tax Receivable Agreement primarily due to changes inour effective income tax rate and the transfer of certain assets from GSS Enterprises LLC (“GSS”) to Camping World, Inc. (“CW”).
(i) Represent transaction expenses, primarily legal costs, associated with acquisitions into new or complementary markets, including theGander Mountain acquisition. This amount excludes transaction expenses related to the acquisition of RV dealerships, consumershows, and other RV and Outdoor Retail segment business acquisitions which are considered recurring in nature.
(j) Represents pre-opening store costs associated with the Gander Outdoors store openings, which is comprised of 1) GanderOutdoors-specific corporate and retail overhead, 2) distribution center expenses, and 3) store-level startup expenses. As discussedin Note 15 - Acquisitions to our consolidated financial statements included in Part II, Item 8 of this Form 10-K, the Company incurredsignificant costs related to the initial rollout of Gander Outdoors locations. Based on the nature of the acquisition through abankruptcy auction and the large quantity of retail locations opened and to be opened in a very compressed timeframe, the Companydoes not deem the pre-opening store costs for the initial rollout of Gander Outdoors locations to be normal, recurring charges. TheCompany does not intend to adjust for pre-opening store costs other than for the initial rollout of Gander Outdoors.
(k) Represents restructuring costs relating to our 2019 Strategic Shift. These restructuring costs include one-time employee terminationbenefits relating to retail store or distribution center closures/divestitures, incremental inventory reserve charges, and otherassociated costs. These costs exclude lease termination costs, which are presented separately (see (d) above). See Note 5 –Restructuring and Long-lived Asset Impairment to our consolidated financial statements included in Part II, Item 8 of this Form 10-Kfor additional information.
Adjusted Net Income Attributable to Camping World Holdings, Inc. and Adjusted Earnings Per Share
We define “Adjusted Net Income Attributable to Camping World Holdings, Inc. – Basic” as net incomeattributable to Camping World Holdings, Inc. adjusted for the impact of certain non-cash and other items that we donot consider in our evaluation of ongoing operating performance. These items include, among other things, long-livedasset impairment, lease termination costs, loss and expense on debt restructure, goodwill impairment, gains andlosses on disposal of assets and other expense, net, equity-based compensation, Tax Receivable Agreement liabilityadjustment, transaction expenses related to acquisitions, Gander Outdoors pre-opening costs, restructuring costsrelated to the 2019 Strategic Shift, other unusual or one-time items, the income tax expense effect of theseadjustments, and the effect of net income attributable to non-controlling interests from these adjustments.
We define “Adjusted Net Income Attributable to Camping World Holdings, Inc. – Diluted” as Adjusted NetIncome Attributable to Camping World Holdings, Inc. – Basic adjusted for the reallocation of net income attributable tonon-controlling interests from stock options and restricted stock units, if dilutive, or the assumed exchange, if dilutive,of all outstanding common units in CWGS, LLC for shares of newly-issued Class A common stock of Camping WorldHoldings, Inc.
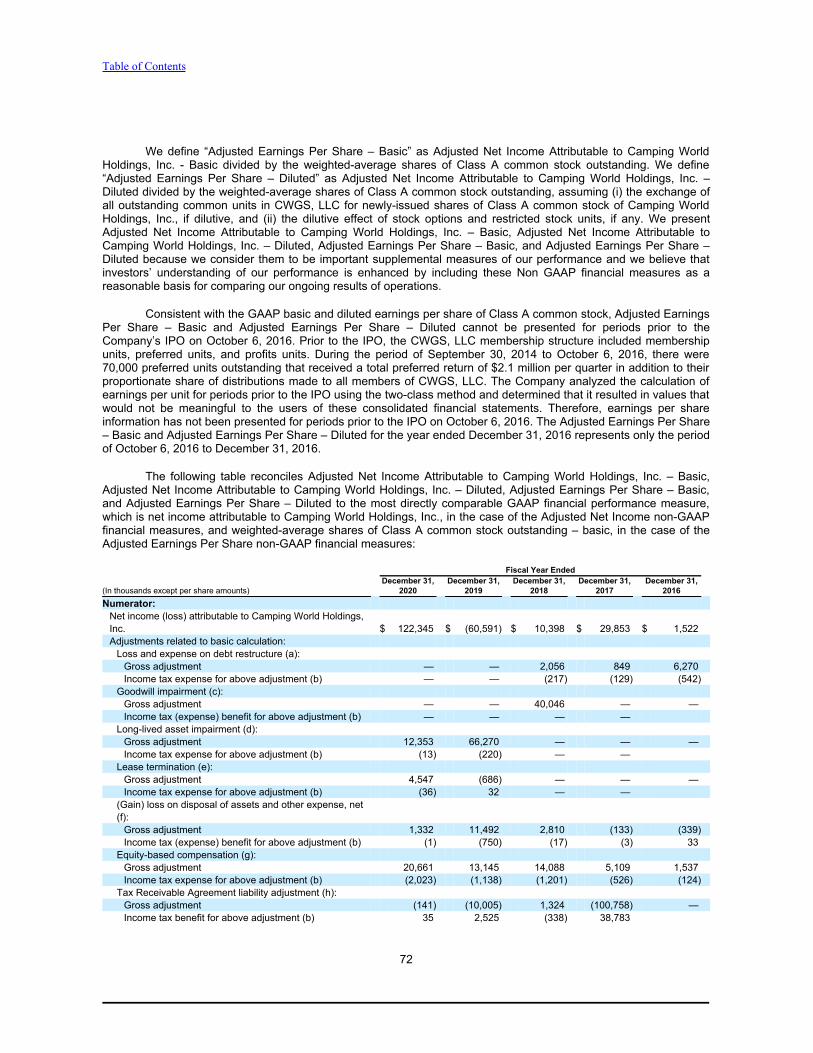
Table of Contents
72
We define “Adjusted Earnings Per Share – Basic” as Adjusted Net Income Attributable to Camping WorldHoldings, Inc. - Basic divided by the weighted-average shares of Class A common stock outstanding. We define“Adjusted Earnings Per Share – Diluted” as Adjusted Net Income Attributable to Camping World Holdings, Inc. –Diluted divided by the weighted-average shares of Class A common stock outstanding, assuming (i) the exchange ofall outstanding common units in CWGS, LLC for newly-issued shares of Class A common stock of Camping WorldHoldings, Inc., if dilutive, and (ii) the dilutive effect of stock options and restricted stock units, if any. We presentAdjusted Net Income Attributable to Camping World Holdings, Inc. – Basic, Adjusted Net Income Attributable toCamping World Holdings, Inc. – Diluted, Adjusted Earnings Per Share – Basic, and Adjusted Earnings Per Share –Diluted because we consider them to be important supplemental measures of our performance and we believe thatinvestors’ understanding of our performance is enhanced by including these Non GAAP financial measures as areasonable basis for comparing our ongoing results of operations.
Consistent with the GAAP basic and diluted earnings per share of Class A common stock, Adjusted EarningsPer Share – Basic and Adjusted Earnings Per Share – Diluted cannot be presented for periods prior to theCompany’s IPO on October 6, 2016. Prior to the IPO, the CWGS, LLC membership structure included membershipunits, preferred units, and profits units. During the period of September 30, 2014 to October 6, 2016, there were70,000 preferred units outstanding that received a total preferred return of $2.1 million per quarter in addition to theirproportionate share of distributions made to all members of CWGS, LLC. The Company analyzed the calculation ofearnings per unit for periods prior to the IPO using the two-class method and determined that it resulted in values thatwould not be meaningful to the users of these consolidated financial statements. Therefore, earnings per shareinformation has not been presented for periods prior to the IPO on October 6, 2016. The Adjusted Earnings Per Share– Basic and Adjusted Earnings Per Share – Diluted for the year ended December 31, 2016 represents only the periodof October 6, 2016 to December 31, 2016.
The following table reconciles Adjusted Net Income Attributable to Camping World Holdings, Inc. – Basic,Adjusted Net Income Attributable to Camping World Holdings, Inc. – Diluted, Adjusted Earnings Per Share – Basic,and Adjusted Earnings Per Share – Diluted to the most directly comparable GAAP financial performance measure,which is net income attributable to Camping World Holdings, Inc., in the case of the Adjusted Net Income non-GAAPfinancial measures, and weighted-average shares of Class A common stock outstanding – basic, in the case of theAdjusted Earnings Per Share non-GAAP financial measures:
Fiscal Year EndedDecember 31, December 31, December 31, December 31, December 31,
(In thousands except per share amounts) 2020 2019 2018 2017 2016 Numerator:
Net income (loss) attributable to Camping World Holdings,Inc. $ 122,345 $ (60,591) $ 10,398 $ 29,853 $ 1,522Adjustments related to basic calculation:
Loss and expense on debt restructure (a):Gross adjustment — — 2,056 849 6,270Income tax expense for above adjustment (b) — — (217) (129) (542)
Goodwill impairment (c):Gross adjustment — — 40,046 — —Income tax (expense) benefit for above adjustment (b) — — — —
Long-lived asset impairment (d):Gross adjustment 12,353 66,270 — — —Income tax expense for above adjustment (b) (13) (220) — —
Lease termination (e):Gross adjustment 4,547 (686) — — —Income tax expense for above adjustment (b) (36) 32 — —
(Gain) loss on disposal of assets and other expense, net(f):
Gross adjustment 1,332 11,492 2,810 (133) (339)Income tax (expense) benefit for above adjustment (b) (1) (750) (17) (3) 33
Equity-based compensation (g):Gross adjustment 20,661 13,145 14,088 5,109 1,537Income tax expense for above adjustment (b) (2,023) (1,138) (1,201) (526) (124)
Tax Receivable Agreement liability adjustment (h):Gross adjustment (141) (10,005) 1,324 (100,758) —Income tax benefit for above adjustment (b) 35 2,525 (338) 38,783
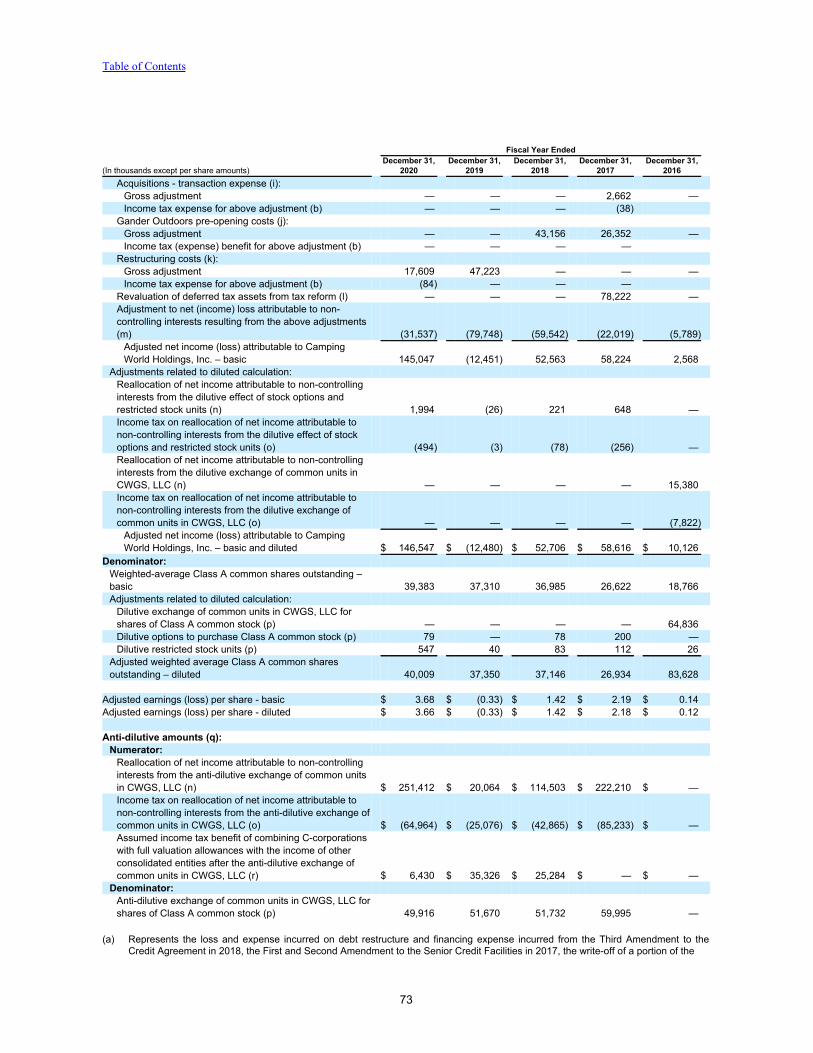
Table of Contents
73
Fiscal Year EndedDecember 31, December 31, December 31, December 31, December 31,
(In thousands except per share amounts) 2020 2019 2018 2017 2016 Acquisitions - transaction expense (i):
Gross adjustment — — — 2,662 —Income tax expense for above adjustment (b) — — — (38)
Gander Outdoors pre-opening costs (j):Gross adjustment — — 43,156 26,352 —Income tax (expense) benefit for above adjustment (b) — — — —
Restructuring costs (k):Gross adjustment 17,609 47,223 — — —Income tax expense for above adjustment (b) (84) — — —
Revaluation of deferred tax assets from tax reform (l) — — — 78,222 —Adjustment to net (income) loss attributable to non-controlling interests resulting from the above adjustments(m) (31,537) (79,748) (59,542) (22,019) (5,789)
Adjusted net income (loss) attributable to CampingWorld Holdings, Inc. – basic 145,047 (12,451) 52,563 58,224 2,568
Adjustments related to diluted calculation:Reallocation of net income attributable to non-controllinginterests from the dilutive effect of stock options andrestricted stock units (n) 1,994 (26) 221 648 —Income tax on reallocation of net income attributable tonon-controlling interests from the dilutive effect of stockoptions and restricted stock units (o) (494) (3) (78) (256) —Reallocation of net income attributable to non-controllinginterests from the dilutive exchange of common units inCWGS, LLC (n) — — — — 15,380Income tax on reallocation of net income attributable tonon-controlling interests from the dilutive exchange ofcommon units in CWGS, LLC (o) — — — — (7,822)
Adjusted net income (loss) attributable to CampingWorld Holdings, Inc. – basic and diluted $ 146,547 $ (12,480) $ 52,706 $ 58,616 $ 10,126
Denominator:Weighted-average Class A common shares outstanding –basic 39,383 37,310 36,985 26,622 18,766Adjustments related to diluted calculation:
Dilutive exchange of common units in CWGS, LLC forshares of Class A common stock (p) — — — — 64,836Dilutive options to purchase Class A common stock (p) 79 — 78 200 —Dilutive restricted stock units (p) 547 40 83 112 26
Adjusted weighted average Class A common sharesoutstanding – diluted 40,009 37,350 37,146 26,934 83,628
Adjusted earnings (loss) per share - basic $ 3.68 $ (0.33) $ 1.42 $ 2.19 $ 0.14Adjusted earnings (loss) per share - diluted $ 3.66 $ (0.33) $ 1.42 $ 2.18 $ 0.12
Anti-dilutive amounts (q):Numerator:
Reallocation of net income attributable to non-controllinginterests from the anti-dilutive exchange of common unitsin CWGS, LLC (n) $ 251,412 $ 20,064 $ 114,503 $ 222,210 $ —Income tax on reallocation of net income attributable tonon-controlling interests from the anti-dilutive exchange ofcommon units in CWGS, LLC (o) $ (64,964) $ (25,076) $ (42,865) $ (85,233) $ —Assumed income tax benefit of combining C-corporationswith full valuation allowances with the income of otherconsolidated entities after the anti-dilutive exchange ofcommon units in CWGS, LLC (r) $ 6,430 $ 35,326 $ 25,284 $ — $ —
Denominator:Anti-dilutive exchange of common units in CWGS, LLC forshares of Class A common stock (p) 49,916 51,670 51,732 59,995 —
(a) Represents the loss and expense incurred on debt restructure and financing expense incurred from the Third Amendment to theCredit Agreement in 2018, the First and Second Amendment to the Senior Credit Facilities in 2017, the write-off of a portion of the

Table of Contents
74
original issue discount, capitalized finance costs from the Previous Term Loan Facilities, and rating agency fees and legal expensesrelated to the Previous Term Loan Facilities in 2016.
(b) Represents the current and deferred income tax expense or benefit effect of the above adjustments, many of which are related toentities with full valuation allowances for which no tax benefit can be currently recognized. This assumption uses effective tax ratesbetween 25.0% and 25.5% for the adjustments for 2020, 2019 and 2018 and 38.5% for the adjustments in 2017 and 2016, whichrepresents the estimated tax rate that would apply had the above adjustments been included in the determination of our non-GAAPmetric.
(c) Represents a goodwill impairment charge of $40.0 million related to the RV and Outdoor Retail segment in the fourth quarter of2018. See Note 7 - Goodwill and Intangible Assets to our audited consolidated financial statements in Part II, Item 8 of this Form 10-K for additional information.
(d) Represents long-lived asset impairment charges related to the RV and Outdoor Retail segment, which primarily relate to locationsaffected by the 2019 Strategic Shift. See Note 5 – Restructuring and Long-lived Asset Impairment to our consolidated financialstatements included in Part II, Item 8 of this Form 10-K for additional information.
(e) Represents the loss (gain) on the termination of operating leases relating primarily to the 2019 Strategic Shift, net of leasetermination costs. See Note 5 – Restructuring and Long-lived Asset Impairment to our consolidated financial statements included inPart II, Item 8 of this Form 10-K for additional information.
(f) Represents an adjustment to eliminate (i) losses on the disposal or sale of real estate at closed retail locations in 2020 and 2019 and(ii) the gains and losses on disposal and sales of various assets.
(g) Represents non-cash equity-based compensation expense relating to employees, directors, and consultants of the Company.
(h) Represents an adjustment to eliminate the gains on remeasurement of the Tax Receivable Agreement primarily due to changes inour effective income tax rate and the transfer of certain assets from GSS to CW. See Note 11 – Income Taxes to our consolidatedfinancial statements included in Part II, Item 8 of this Form 10-K for additional information.
(i) Represents transaction expenses, primarily legal costs, associated with acquisitions into new or complementary markets, includingthe Gander Mountain acquisition. This amount excludes transaction expenses related to the acquisition of RV dealerships, and otherRV and Outdoor Retail segment business acquisitions.
(j) Represents pre-opening store costs associated with the Gander Outdoors store openings, which is comprised of 1) GanderOutdoors-specific corporate and retail overhead, 2) distribution center expenses, and 3) store-level startup expenses. The Companyincurred significant costs related to the initial rollout of Gander Outdoors locations. Based on the nature of the acquisition through abankruptcy auction and the large quantity of retail locations opened and to be opened in a very compressed timeframe, the Companydoes not deem the pre-opening store costs for the initial rollout of Gander Outdoors locations to be normal, recurring charges. TheCompany does not intend to adjust for pre-opening store costs other than for the initial rollout of Gander Outdoors.
(k) Represents restructuring costs relating to our 2019 Strategic Shift. These restructuring costs include one-time employee terminationbenefits relating to retail store or distribution center closures/divestitures, incremental inventory reserve charges, and otherassociated costs. These costs exclude lease termination costs, which are presented separately (see (e) above). See Note 5 –Restructuring and Long-lived Asset Impairment to our consolidated financial statements included in Part II, Item 8 of this Form 10-Kfor additional information.
(l) This amount relates to the remeasurement of federal net deferred tax assets resulting from the permanent reduction in the U.S.statutory corporate tax rate to 21% from 35% under the U.S. Tax Cuts and Jobs Act of 2017 (the “2017 Tax Act”).
(m) Represents the adjustment to net (income) loss attributable to non-controlling interests resulting from the above adjustments thatimpact the net income of CWGS, LLC. This adjustment uses the non-controlling interest’s weighted average ownership of CWGS,LLC of 55.9%, 58.1%, 58.3% and 69.3% for the years ended December 31, 2020, 2019, 2018 and 2017, respectively, and 77.6% forthe post-IPO period of 2016.
(n) Represents the reallocation of net income attributable to non-controlling interests from the impact of the assumed change inownership of CWGS, LLC from stock options, restricted stock units, and/or common units of CWGS, LLC.
(o) Represents the income tax expense effect of the above adjustment for reallocation of net income attributable to non-controllinginterests. This assumption uses effective tax rates between 25.0% and 25.5% for the adjustments for 2020, 2019 and 2018 and38.5% for the adjustments in 2017 and 2016, which represents the estimated tax rate that would apply had the above adjustmentsbeen included in the determination of our non-GAAP metric.
(p) Represents the impact to the denominator for stock options, restricted stock units, and/or common units of CWGS, LLC.
(q) The below amounts have not been considered in our adjusted earnings per share – diluted amounts as the effect of these items areanti-dilutive.
(r) Represents adjustments to reflect the income tax benefit of losses of consolidated C-corporations that under the Company’s currentequity structure cannot be used against the income of other consolidated subsidiaries of CWGS, LLC. Subsequent to the exchangeof all common units in CWGS, LLC, the Company believes certain actions could be taken such that the C-corporations’ losses couldoffset income of other consolidated subsidiaries. The adjustment reflects the income tax benefit assuming effective tax rates between25.0% and 25.5% for the adjustments for 2020, 2019 and 2018 for the losses experienced by the consolidated C-corporations forwhich valuation allowances have been recorded. No assumed release of valuation allowance established for previous periods areincluded in these amounts. Prior to 2018, the Company did not consider the losses of these C-corporations with valuation allowancesto be significant and the Company did not retroactively adjust 2017 or 2016 for these amounts, which were $4.4 million for the yearended December 31, 2017 and $2.4 million for the post-IPO period of 2016.

Table of Contents
75
Uses and Limitations of Non-GAAP Financial Measures
Management and our board of directors use the Non-GAAP Financial Measures:
● as a measurement of operating performance because they assist us in comparing the operatingperformance of our business on a consistent basis, as they remove the impact of items not directlyresulting from our core operations;
● for planning purposes, including the preparation of our internal annual operating budget and financialprojections;
● to evaluate the performance and effectiveness of our operational strategies; and
● to evaluate our capacity to fund capital expenditures and expand our business.
By providing these Non-GAAP Financial Measures, together with reconciliations, we believe we areenhancing investors’ understanding of our business and our results of operations, as well as assisting investors inevaluating how well we are executing our strategic initiatives. In addition, our Senior Secured Credit Facilities useEBITDA to measure our compliance with covenants such as the consolidated leverage ratio. The Non-GAAPFinancial Measures have limitations as analytical tools, and should not be considered in isolation, or as an alternativeto, or a substitute for net income or other financial statement data presented in our consolidated financial statementsincluded elsewhere in this Form 10-K as indicators of financial performance. Some of the limitations are:
● such measures do not reflect our cash expenditures, or future requirements for capital expenditures orcontractual commitments;
● such measures do not reflect changes in, or cash requirements for, our working capital needs;
● some of such measures do not reflect the interest expense, or the cash requirements necessary toservice interest or principal payments on our debt;
● some of such measures do not reflect our tax expense or the cash requirements to pay our taxes;
● although depreciation and amortization are non-cash charges, the assets being depreciated andamortized will often have to be replaced in the future and such measures do not reflect any cashrequirements for such replacements; and
● other companies in our industry may calculate such measures differently than we do, limiting theirusefulness as comparative measures.
Due to these limitations, the Non-GAAP Financial Measures should not be considered as measures ofdiscretionary cash available to us to invest in the growth of our business. We compensate for these limitations byrelying primarily on our GAAP results and using these Non GAAP Financial Measures only supplementally. As notedin the tables above, certain of the Non-GAAP Financial Measures include adjustments for long-lived assetimpairment, lease termination costs, loss and expense on debt restructure, goodwill impairment, gains and losses ondisposal of assets and other expense, net, equity-based compensation, Tax Receivable Agreement liability,transaction expenses related to acquisitions, Gander Outdoors pre-opening costs, restructuring costs relating to the2019 Strategic Shift, other unusual or one-time items, and the income tax expense effect described above, asapplicable. It is reasonable to expect that certain of these items will occur in future periods. However, we believethese adjustments are appropriate because the amounts recognized can vary significantly from period to period, donot directly relate to the ongoing operations of our business and complicate comparisons of our internal operatingresults and operating results of other companies over time. In addition, these certain Non-GAAP Financial Measuresadjust for other items that we do not expect to regularly record in periods after the IPO, including monitoring fees.Each of the normal recurring adjustments and other adjustments described in this paragraph and in the reconciliationtables above help management with a
Table of Contents
76
measure of our core operating performance over time by removing items that are not related to day to day operations.
Liquidity and Capital Resources
General
Our primary requirements for liquidity and capital have been working capital, inventory management,acquiring and building new retail locations, the improvement and expansion of existing retail locations, debt service,distributions to holders of equity interests in CWGS, LLC and our Class A common stock, and general corporateneeds. These cash requirements have historically been met through cash provided by operating activities, cash andcash equivalents, proceeds from registered offerings of our Class A common stock, borrowings under our SeniorSecured Credit Facilities (as defined below), borrowings under our Floor Plan Facility (as defined below) andborrowings under our Real Estate Facility (as defined below).
As a public company, our additional liquidity needs include public company costs, payment of regular andspecial cash dividends, any exercise of the redemption right by the Continuing Equity Owners from time to time(should we elect to exchange common units for a cash payment), our stock repurchase program as described below,payments under the Tax Receivable Agreement, and state and federal taxes to the extent not reduced as a result ofthe Tax Receivable Agreement. The Continuing Equity Owners may exercise such redemption right for as long astheir common units remain outstanding. Although the actual timing and amount of any payments that may be madeunder the Tax Receivable Agreement will vary, we expect that the payments that we will be required to make to theContinuing Equity Owners, Former Profits Unit Holders, and Crestview Partners II GP, L.P. will be significant. Anypayments made by us to Continuing Equity Owners, Former Profits Unit Holders, and Crestview Partners II GP, L.P.under the Tax Receivable Agreement will generally reduce the amount of overall cash flow that might have otherwisebeen available to us or to CWGS, LLC and, to the extent that we are unable to make payments under the TaxReceivable Agreement for any reason, the unpaid amounts generally will be deferred and will accrue interest untilpaid by us; provided, however, that nonpayment for a specified period may constitute a material breach of a materialobligation under the Tax Receivable Agreement and therefore may accelerate payments due under the TaxReceivable Agreement. For a discussion of the Tax Receivable Agreement, see Note 11 — Income Taxes to ouraudited consolidated financial statements included in Part II, Item 8 of this Form 10-K.
On October 30, 2020, our board of directors authorized a stock repurchase program for the repurchase of upto $100.0 million of our Class A common stock, expiring on October 31, 2022. Repurchases under the program aresubject to any applicable limitations on the availability of funds to be distributed to the Company by CWGS, LLC tofund repurchase and may be made in the open market, in privately negotiated transactions or otherwise, with theamount and timing of repurchases to be determined at our discretion, depending on market conditions and corporateneeds. Open market repurchases will be structured to occur in accordance with applicable federal securities laws,including within the pricing and volume requirements of Rule 10b-18 under the Securities Exchange Act of 1934, asamended. We may also, from time to time, enter into Rule 10b5-1 plans to facilitate repurchases of our shares underthis authorization. This program does not obligate us to acquire any particular amount of Class A common stock andthe program may be extended, modified, suspended or discontinued at any time at the Board’s discretion. We expectto fund the repurchases using cash on hand. During the year ended December 31, 2020, we repurchased 811,223shares of our Class A common stock for $21.5 million, including broker commissions. As of December 31, 2020,$78.5 million is available under the stock repurchase program to repurchase additional shares of our Class Acommon stock.
CWGS, LLC intends to make a regular quarterly cash distribution to its common unit holders, including us,and we intend to use all of the proceeds from such distribution on our common units to pay a regular quarterly cashdividend on our Class A common stock, subject to our discretion as the sole managing member of CWGS, LLC andthe discretion of our board of directors. During each of the three month periods during the year ended December 31,2019 and the three months ended March 31, 2020, and June 30, 2020, we paid a regular quarterly cash dividend of$0.08 per share of our Class A common stock. On July 20, 2020, our board of directors approved the increase of thequarterly dividend to $0.09 per share of Class A common stock from $0.08 per share. Accordingly, during each of thethree months ended September 30, 2020 and December 31, 2020, we paid a regular quarterly cash dividend of $0.09per share of our Class A common stock. CWGS, LLC
Table of Contents
77
is required to make cash distributions in accordance with the CWGS LLC Agreement in an amount sufficient for us topay any expenses incurred by us in connection with the regular quarterly cash dividend, along with any of our otheroperating expenses and other obligations.
In addition, we currently intend to pay a special cash dividend of all or a portion of the Excess TaxDistribution (as defined under “Dividend Policy” included in Part II, Item 5 of this Form 10-K) to the holders of ourClass A common stock from time to time subject to the discretion of our board of directors as described under“Dividend Policy” included in Part II, Item 5 of this Form 10-K. During each of the three month periods during the yearended December 31, 2019 and the three months ended March 31, 2020 and June 30, 2020, we paid a special cashdividend of $0.0732 per share of our Class A common stock. Additionally, on July 20, 2020, our board of directorsincreased the quarterly special cash dividend to $0.08 per share of Class A common stock from $0.0732 per share.Accordingly, during the three months ended September 30, 2020, we paid a special dividend of $0.08 per share ofour Class A common stock. Moreover, on September 17, 2020, our board of directors increased the quarterly specialcash dividend to $0.14 per share of Class A common stock from $0.08 per share beginning with the three monthsended December 31, 2020. Additionally, on November 18, 2020, our board of directors approved a $0.77 per share ofClass A common stock one-time special cash dividend. These special dividends are typically funded by theaccumulated tax distributions received by CWH from CWGS, LLC that are in excess of the corporate income taxespayable by CWH and current payment obligations under the TRA liability. In December 2020, CWGS, LLC paid anadditional $0.20 per common unit distribution to partially fund the $0.77 per share of Class A common stock one-timespecial cash dividend discussed above. Our dividend policy has certain risks and limitations particularly with respectto liquidity, and we may not pay future dividends according to our policy, or at all. See “Dividend Policy” included inPart II, Item 5 of this Form 10-K and “Risk Factors ─ Risks Relating to Ownership of Our Class A Common Stock ─“Our ability to pay regular and special dividends on our Class A common stock is subject to the discretion of our boardof directors and may be limited by our structure and statutory restrictions” included in Part I, Item 1A of this Form 10-K.
We have currently identified over 20 markets that would be attractive for both acquisition and greenfieldopportunities in 2021. This expansion could require in excess of $150.0 million for a combination of businessacquisitions and capital expenditures relating to land, buildings, and improvements. Factors that could impact thequantity of locations or the cost to acquire or open those locations include, but are not limited to, our ability to locatepotential acquisition targets or greenfield locations in a geographic area and at a cost that meet our success criteria;continued strong cash flow generation from our operations to fund these acquisitions and new locations; andavailability of financing on our Floor Plan Facility.
During the year ended December 31, 2020, we incurred long-lived asset impairment charges of $12.4 million,including $12.3 million primarily in connection with the 2019 Strategic Shift. We expect that none of the foregoingcharges will result in future cash expenditures. Additionally, in connection with the 2019 Strategic Shift, we haveincurred or expect to incur costs relating to one-time employee termination benefits as outlined in Note 5 ─Restructuring and Long-Lived Asset Impairment to our consolidated financial statements included in Part II, Item 8 ofthis Form 10-K.
There is significant uncertainty surrounding the impact of the COVID-19 pandemic on our results ofoperations and cash flows. As a result, we initially took proactive steps to increase cash available on-hand, including,but not limited to, reducing cash expenditures, including wage reductions through a combination of temporary salaryreductions, layoffs, and furloughs; negotiating payment deferrals with lessors, reducing marketing and promotionalexpenses; and delaying strategic capital expenditures. We had negotiated lease payment deferrals with numerouslandlords amounting to approximately $14.0 million from 2020 into 2021. As demand for our products accelerated andour cash position improved, we repaid these deferred lease payment amounts in full prior to June 30, 2020 and mostof the temporary salary reductions ended in May 2020. Additionally, as a result of our improved cash position, wemade voluntary principal payments in June 2020 of $9.6 million on our Term Loan Facility and $20.0 million on ourRevolving Credit Facility. We are continually monitoring the COVID-19 pandemic and its potential impacts on ourbusiness. If stay-at-home and shelter-in-place restrictions are put back into place, we may choose to re-implementcost reduction measures.
We believe that our sources of liquidity and capital including cash provided by operating activities, additionalborrowings under our Floor Plan Facility, and borrowings under our Revolving Credit Facility will be
Table of Contents
78
sufficient to finance our continued operations, growth strategy, including the opening of any additional retail locations,regular and special quarterly cash dividends (as described above), required payments for our obligations under theTax Receivable Agreement, and additional expenses we expect to incur for at least the next twelve months. However,we cannot assure you that our cash provided by operating activities, cash and cash equivalents or cash availableunder our Revolving Credit Facility or our Floor Plan Facility, including the potential additional borrowings notedabove, will be sufficient to meet our future needs. If we are unable to generate sufficient cash flows from operations inthe future, including as a result of the impact of the COVID-19 pandemic on our business and if availability under ourRevolving Credit Facility or our Floor Plan Facility is not sufficient, we may have to obtain additional financing. If weobtain additional capital by issuing equity, the interests of our existing stockholders will be diluted. If we incuradditional indebtedness, that indebtedness may impose significant financial and other covenants that maysignificantly restrict our operations. We cannot assure you that we could obtain refinancing or additional financing onfavorable terms or at all, including the expected additional borrowings noted above and particularly in light of theeconomic uncertainty due to the COVID-19 pandemic. See “Risk Factors — Risks Related to our Business — Ourability to operate and expand our business and to respond to changing business and economic conditions will dependon the availability of adequate capital” included in Part I, Item 1A of this Form 10-K.
As of December 31, 2020, we had working capital of $458.7 million, including $166.1 million of cash and cashequivalents. Our working capital reflects the cash provided by deferred revenue reported under current liabilities of$88.2 million as of December 31, 2020, which reduces working capital. Deferred revenue primarily consists of cashcollected for club memberships in advance of services to be provided, which is deferred and recognized as revenueover the life of the membership, and deferred revenue for the annual guide. We use net proceeds from this deferredmembership revenue to lower our long-term borrowings and finance our working capital needs. Our Floor Plan Facilityincludes a flooring line aggregate interest reduction (“FLAIR”) offset account that allows us to transfer cash as anoffset to the payable under the Floor Plan Facility. The FLAIR offset account at December 31, 2020 was $133.6million, $124.4 million of which could have been withdrawn while remaining in compliance with the financial covenantsof the Floor Plan Facility.
Seasonality
We have experienced, and expect to continue to experience, variability in revenue, net income, and cashflows as a result of annual seasonality in our business. Because RVs are used primarily by vacationers and campers,demand for services, protection plans, products, and resources generally declines during the winter season, whilesales and profits are generally highest during the spring and summer months. In addition, unusually severe weatherconditions in some geographic areas may impact demand.
We generate a disproportionately higher amount of our annual revenue in our second and third fiscalquarters, respectively, which include the spring and summer months. We incur additional expenses in the second andthird fiscal quarters due to higher purchase volumes, increased staffing in our retail locations and program costs. If,for any reason, we miscalculate the demand for our products or our product mix during the second and third fiscalquarters, our sales in these quarters could decline, resulting in higher labor costs as a percentage of sales, lowermargins and excess inventory, which could cause our annual results of operations to suffer and our stock price todecline.
Additionally, SG&A expenses as a percentage of gross profit tend to be higher in the first and fourth quartersdue to the timing of acquisitions and the seasonality of our business. We prefer to acquire new retail locations in thefirst and fourth quarters of each year in order to provide time for the location to be re-modeled and to ramp upoperations ahead of the spring and summer months. The timing of our acquisitions in the first and fourth quarters,coupled with generally lower revenue in these quarters has historically resulted in SG&A expenses as a percentage ofgross profit being higher in these quarters.
Due to our seasonality, the possible adverse impact from other risks associated with our business, includingatypical weather, consumer spending levels and general business conditions, is potentially greater if any such risksoccur during our peak sales seasons. See “Risk Factors — Risks Related to our Business — Our business isseasonal and this leads to fluctuations in sales and revenues” included in Part I, Item 1A of this Form 10-K.
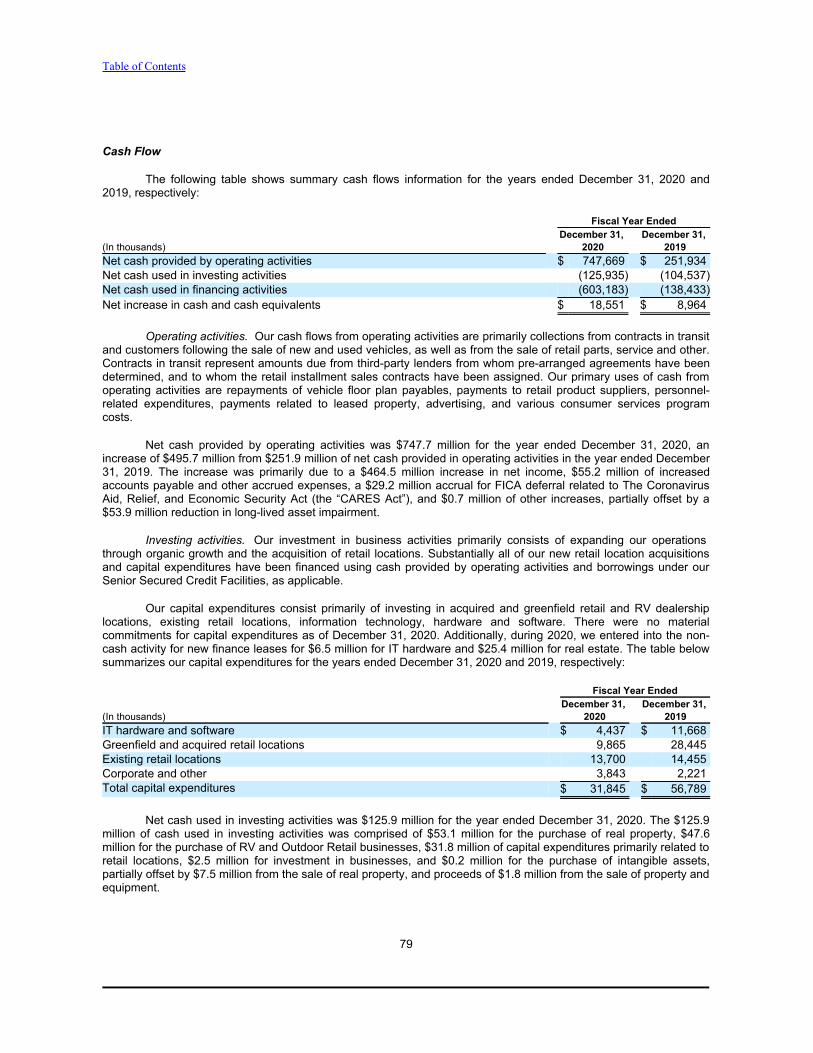
Table of Contents
79
Cash Flow
The following table shows summary cash flows information for the years ended December 31, 2020 and2019, respectively:
Fiscal Year EndedDecember 31, December 31,
(In thousands) 2020 2019Net cash provided by operating activities $ 747,669 $ 251,934Net cash used in investing activities (125,935) (104,537)Net cash used in financing activities (603,183) (138,433)Net increase in cash and cash equivalents $ 18,551 $ 8,964
Operating activities. Our cash flows from operating activities are primarily collections from contracts in transitand customers following the sale of new and used vehicles, as well as from the sale of retail parts, service and other.Contracts in transit represent amounts due from third-party lenders from whom pre-arranged agreements have beendetermined, and to whom the retail installment sales contracts have been assigned. Our primary uses of cash fromoperating activities are repayments of vehicle floor plan payables, payments to retail product suppliers, personnel-related expenditures, payments related to leased property, advertising, and various consumer services programcosts.
Net cash provided by operating activities was $747.7 million for the year ended December 31, 2020, anincrease of $495.7 million from $251.9 million of net cash provided in operating activities in the year ended December31, 2019. The increase was primarily due to a $464.5 million increase in net income, $55.2 million of increasedaccounts payable and other accrued expenses, a $29.2 million accrual for FICA deferral related to The CoronavirusAid, Relief, and Economic Security Act (the “CARES Act”), and $0.7 million of other increases, partially offset by a$53.9 million reduction in long-lived asset impairment.
Investing activities. Our investment in business activities primarily consists of expanding our operationsthrough organic growth and the acquisition of retail locations. Substantially all of our new retail location acquisitionsand capital expenditures have been financed using cash provided by operating activities and borrowings under ourSenior Secured Credit Facilities, as applicable.
Our capital expenditures consist primarily of investing in acquired and greenfield retail and RV dealershiplocations, existing retail locations, information technology, hardware and software. There were no materialcommitments for capital expenditures as of December 31, 2020. Additionally, during 2020, we entered into the non-cash activity for new finance leases for $6.5 million for IT hardware and $25.4 million for real estate. The table belowsummarizes our capital expenditures for the years ended December 31, 2020 and 2019, respectively:
Fiscal Year EndedDecember 31, December 31,
(In thousands) 2020 2019IT hardware and software $ 4,437 $ 11,668Greenfield and acquired retail locations 9,865 28,445Existing retail locations 13,700 14,455Corporate and other 3,843 2,221Total capital expenditures $ 31,845 $ 56,789
Net cash used in investing activities was $125.9 million for the year ended December 31, 2020. The $125.9million of cash used in investing activities was comprised of $53.1 million for the purchase of real property, $47.6million for the purchase of RV and Outdoor Retail businesses, $31.8 million of capital expenditures primarily related toretail locations, $2.5 million for investment in businesses, and $0.2 million for the purchase of intangible assets,partially offset by $7.5 million from the sale of real property, and proceeds of $1.8 million from the sale of property andequipment.
Table of Contents
80
Net cash used in investing activities was $104.5 million for year ended December 31, 2019. The$104.5 million of cash used in investing activities included capital expenditures of $56.8 million, acquisition of retaillocations of $48.4 million, and purchases of real property of $31.6 million, partially offset by proceeds from the saleand leaseback of real property and the sale of property and equipment of $28.2 million and $4.1 million, respectively.
Financing activities. Our financing activities primarily consist of proceeds from the issuance of debt and therepayment of principal and debt issuance costs.
Our net cash used in financing activities was $603.2 million for the year ended December 31, 2020. The$603.2 million of cash used in financing activities was primarily due to $324.5 million of payments under the FloorPlan Facility, $137.0 million of distributions to CWGS, LLC common unit holders, $61.0 million of dividends paid onClass A common stock, $39.1 million of payments on long-term debt, $21.5 million for repurchases of Class Acommon stock to treasury stock, $20.0 million of payments on credit facilities, and $4.7 million of payments related toRSU shares withheld for taxes, partially offset by proceeds from exercise of stock options of $4.6 million.
Our net cash used in financing activities was $138.4 million for the year ended December 31, 2019. The$138.4 million of cash used in financing activities was primarily due to distributions to CWGS, LLC common unitholders of $70.2 million, net payments under the Floor Plan Facility of $44.0 million, dividends paid on Class Acommon stock of $22.9 million, and net payment of debt of $13.7 million, partially offset by proceeds from long-termdebt of $11.7 million, and other financing sources of $0.7 million.
Description of Senior Secured Credit Facilities, Floor Plan Facility and Real Estate Facility
As of December 31, 2020 and 2019, we had outstanding debt in the form of our Senior Secured CreditFacilities (as defined below), our Floor Plan Facility (as defined below), and our Real Estate Facility (as definedbelow). We may from time to time seek to refinance, retire or exchange our outstanding debt. Such refinancings,repayments or exchanges, if any, will depend on prevailing market conditions, our liquidity requirements, contractualrestrictions and other factors. The amounts involved may be material. For additional information regarding our interestrate risk and interest rate hedging instruments, see “Quantitative and Qualitative Disclosures About Market Risk” inPart II, Item 7A of this Form 10-K.
Senior Secured Credit Facilities
As of December 31, 2020 and 2019, CWGS Group, LLC (the “Borrower”), an indirect subsidiary of theCompany, was party to a credit agreement (as amended from time to time, the “Credit Agreement”) for a seniorsecured credit facility (the “Senior Secured Credit Facilities”). The Senior Secured Credit Facilities consist of a $1.19billion term loan facility (the “Term Loan Facility”) and a $35.0 million revolving credit facility (the “Revolving CreditFacility”). The Term Loan Facility requires mandatory principal payments in equal quarterly installments of $3.0million. The Revolving Credit Facility matures on November 8, 2021, and the Term Loan Facility matures onNovember 8, 2023. As of December 31, 2020, the average interest rate on the Term Loan Facility was 3.5%.
The Credit Agreement for our Senior Secured Credit Facilities requires the “Borrower” and its subsidiaries tocomply on a quarterly basis with a maximum Total Leverage Ratio (as defined in the Credit Agreement), whichcovenant is in effect only if, as of the end of each calendar quarter, the aggregate amount of borrowings under therevolving credit facility (including swingline loans), letters of credit and unreimbursed letter of credit disbursementsoutstanding at such time (minus the lesser of (a) $5.0 million and (b) letters of credit outstanding) is greater than 30%of the aggregate amount of the Revolving Lenders’ Revolving Commitments (minus the lesser of (a) $5.0 million and(b) letters of credit outstanding), as defined in the Credit Agreement. As of December 31, 2020, we were not subjectto this covenant as borrowings under the Revolving Credit Facility did not exceed the 30% threshold. To the extentthat we are unable to comply with the maximum Total Leverage Ratio in the future, we would be unable to borrowunder the Revolving Credit Facility and may need to seek alternative sources of financing in order to operate andfinance our business as we deem appropriate. The Company’s borrowing capacity under the Revolving Credit Facilityat December 31, 2020 was limited to $29.1 million of borrowings. We were in compliance with all applicable debtcovenants at December
Table of Contents
81
31, 2020 and 2019. On June 30, 2020, the Borrower made a $9.6 million voluntary principal payment on the TermLoan Facility. Additionally, the Borrower is required to prepay the term loan borrowings in an aggregate amount up to50% of excess cash flow, as defined in the Credit Agreement, for such fiscal year depending on the Total LeverageRatio. As of December 31, 2020, we were not required to make an additional excess cash flow payment.
See Note 9 — Long-Term Debt to our consolidated financial statements included in Part II, Item 8 of thisForm 10-K for a further discussion of the terms of the Senior Secured Credit Facilities.
Floor Plan Facility
As of December 31, 2020 and 2019, FreedomRoads, LLC (“FR”), an indirect subsidiary of the Company,maintained floor plan financing through the Seventh Amended and Restated Credit Agreement (as amended, the“Floor Plan Facility”). On October 8, 2019, FR entered into a Second Amendment to the Seventh Amended andRestated Credit Agreement, (the “Second Amendment’). The applicable borrowing rate margin on LIBOR and baserate loans ranges from 2.05% to 2.50% and 0.55% and 1.00%, respectively, based on the consolidated current ratioat FR. At December 31, 2020, the Floor Plan Facility allowed FR to borrow (a) up to $1.38 billion under a floor planfacility, (b) up to $15.0 million under a letter of credit facility and (c) up to a maximum amount outstanding of $48.0million under the revolving line of credit, which maximum amount outstanding decreases by $3.0 million on the lastday of each fiscal quarter. The maturity date of the Floor Plan Facility is March 15, 2023.
On May 12, 2020, FR entered into a Third Amendment to the Seventh Amended and Restated CreditAgreement (“Third Amendment”) that provides FR with a one-time option to request a temporary four-month reduction(“Current Ratio Reduction Period”) of the minimum Consolidated Current Ratio (as defined in the Floor Plan Facility)at any time during 2020 and the first seven days of 2021. FR did not exercise that option. During the Current RatioReduction Period, the applicable borrowing rate margin on LIBOR and base rate loans ranges from 2.05% to 3.00%and 0.55% and 1.50%, respectively, based on the Consolidated Current Ratio at FR. From May 12, 2020 through July31, 2020, FR was not allowed to draw further Revolving Credit Loans (as defined in the Floor Plan Facility). On June29, 2020, FR made a voluntary $20.0 million principal payment on the revolving line of credit. The borrowings underthe floor plan credit agreement bear interest at one-month LIBOR plus 2.05% as of December 31, 2020 and at one-month LIBOR plus 2.15% for the years ended December 31, 2019 and December 31, 2018. LIBOR was 0.15%,1.71% and 2.35% as of December 31, 2020, 2019, and 2018, respectively.
The credit agreement governing the Floor Plan Facility contains certain financial covenants, which we were incompliance with at December 31, 2020 and 2019.
See Note 4 – Inventories, net and Notes Payable — Floor Plan, net to our consolidated financial statementsincluded in Part II, Item 8 of this Form 10-K for a further discussion of the terms of the Floor Plan Facility.
Real Estate Facility
As of December 31, 2020 and 2019, Camping World Property, Inc. (the ‘‘Real Estate Borrower’’), an indirectwholly-owned subsidiary of CWGS, LLC, and CIBC Bank USA (“Lender”), was party to a loan and security agreementfor a real estate credit facility with an aggregate maximum principal amount of $21.5 million (“Real Estate Facility”).
The Real Estate Facility is subject to certain cross default provisions, a debt service coverage ratio, and othercustomary covenants which we were in compliance with at December 31, 2020 and 2019.
The outstanding principal of the Real Estate Facility was $4.5 million and $19.7 million as of December 31,2020 and 2019, respectively. As of December 31, 2020, the interest rate on the Real Estate Facility was 3.00% with acommitment fee of 0.50% of the aggregate unused principal amount of the Real Estate Facility. As of December 31,2020, the Company had zero additional capacity under the Real Estate Facility.
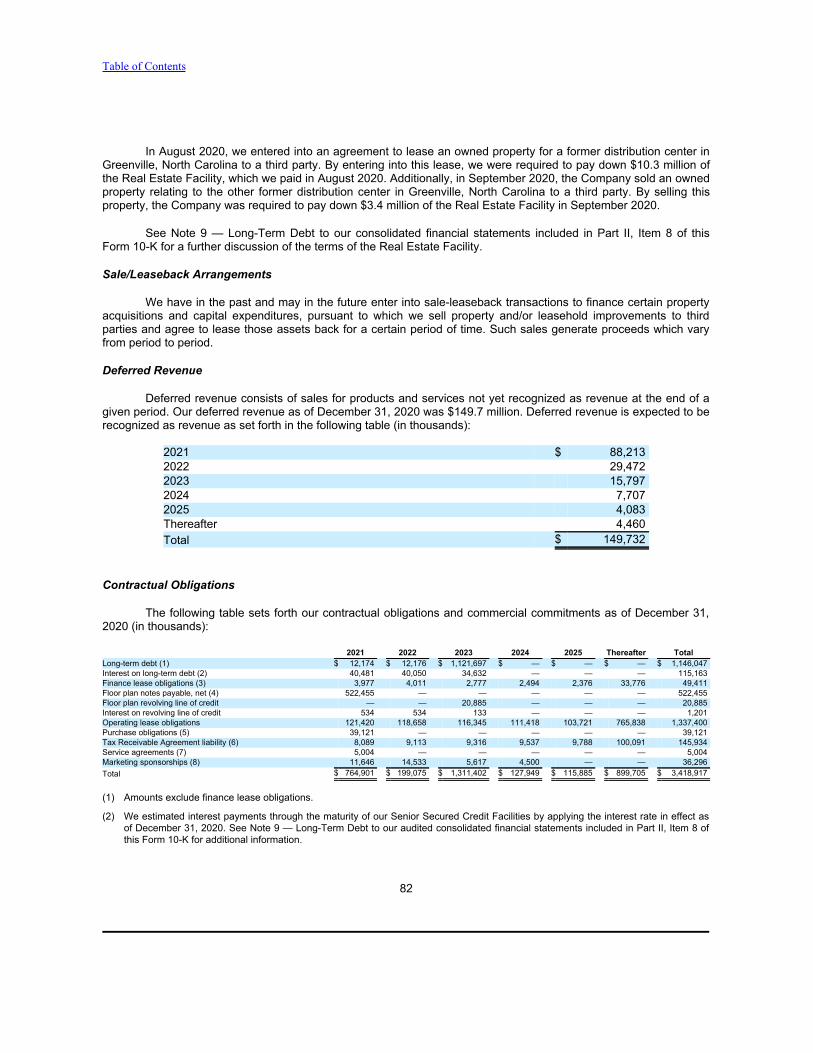
Table of Contents
82
In August 2020, we entered into an agreement to lease an owned property for a former distribution center inGreenville, North Carolina to a third party. By entering into this lease, we were required to pay down $10.3 million ofthe Real Estate Facility, which we paid in August 2020. Additionally, in September 2020, the Company sold an ownedproperty relating to the other former distribution center in Greenville, North Carolina to a third party. By selling thisproperty, the Company was required to pay down $3.4 million of the Real Estate Facility in September 2020.
See Note 9 — Long-Term Debt to our consolidated financial statements included in Part II, Item 8 of thisForm 10-K for a further discussion of the terms of the Real Estate Facility.
Sale/Leaseback Arrangements
We have in the past and may in the future enter into sale-leaseback transactions to finance certain propertyacquisitions and capital expenditures, pursuant to which we sell property and/or leasehold improvements to thirdparties and agree to lease those assets back for a certain period of time. Such sales generate proceeds which varyfrom period to period.
Deferred Revenue
Deferred revenue consists of sales for products and services not yet recognized as revenue at the end of agiven period. Our deferred revenue as of December 31, 2020 was $149.7 million. Deferred revenue is expected to berecognized as revenue as set forth in the following table (in thousands):
2021 $ 88,2132022 29,4722023 15,7972024 7,7072025 4,083Thereafter 4,460Total $ 149,732
Contractual Obligations
The following table sets forth our contractual obligations and commercial commitments as of December 31,2020 (in thousands):
2021 2022 2023 2024 2025 Thereafter TotalLong-term debt (1) $ 12,174 $ 12,176 $ 1,121,697 $ — $ — $ — $ 1,146,047Interest on long-term debt (2) 40,481 40,050 34,632 — — — 115,163Finance lease obligations (3) 3,977 4,011 2,777 2,494 2,376 33,776 49,411Floor plan notes payable, net (4) 522,455 — — — — — 522,455Floor plan revolving line of credit — — 20,885 — — — 20,885Interest on revolving line of credit 534 534 133 — — — 1,201Operating lease obligations 121,420 118,658 116,345 111,418 103,721 765,838 1,337,400Purchase obligations (5) 39,121 — — — — — 39,121Tax Receivable Agreement liability (6) 8,089 9,113 9,316 9,537 9,788 100,091 145,934Service agreements (7) 5,004 — — — — — 5,004Marketing sponsorships (8) 11,646 14,533 5,617 4,500 — — 36,296Total $ 764,901 $ 199,075 $ 1,311,402 $ 127,949 $ 115,885 $ 899,705 $ 3,418,917
(1) Amounts exclude finance lease obligations.
(2) We estimated interest payments through the maturity of our Senior Secured Credit Facilities by applying the interest rate in effect asof December 31, 2020. See Note 9 — Long-Term Debt to our audited consolidated financial statements included in Part II, Item 8 ofthis Form 10-K for additional information.
Table of Contents
83
(3) Amounts represent undiscounted cash flows for property and equipment finance leases. See Note 10 — Lease Obligations to ouraudited consolidated financial statements included in Part II, Item 8 of this Form 10-K for additional information.
(4) Floor plan notes payable, net are revolving financing arrangements and the Floor Plan Facility matures on March 15, 2023. Paymentsare generally made as required pursuant to the Floor Plan Facility discussed above under “— Description of Senior Secured CreditFacilities and Floor Plan Facility — Floor Plan Facility.”
(5) Amounts primarily represent purchase commitments relating to the procurement of RV inventories that have been approved by theFloor Plan Facility. See Note 4 — Inventories, net and Notes Payable — Floorplan to our audited consolidated financial statementsincluded in Part II, Item 8 of this Form 10-K for additional information.
(6) Amounts represent the estimated payments under the Tax Receivable Agreement. See Note 11 — Income Taxes to our auditedconsolidated financial statements included in Part II, Item 8 of this Form 10-K for additional information.
(7) Service agreements are multi-year agreements for services at agreed upon amounts for each year. See Note 13 — Commitments andContingencies to our audited consolidated financial statements included in Part II, Item 8 of this Form 10-K for additional information.
(8) Marketing sponsorship agreements are multi-year sponsorship agreements at agreed upon amounts each year per the agreements.See Note 13 — Commitments and Contingencies to our audited consolidated financial statements included in Part II, Item 8 of thisForm 10-K for additional information.
Off-Balance Sheet Arrangements
As of December 31, 2020, we did not have any off-balance sheet arrangements other than short-term leasesnot included in our lease obligation. We do not have transactions with unconsolidated entities, such as entities oftenreferred to as structured finance or special purpose entities, whereby we have financial guarantees, subordinatedretained interests, derivative instruments, or other contingent arrangements that expose us to material continuingrisks, contingent liabilities, or any other obligation under a variable interest in an unconsolidated entity that providesfinancing, liquidity, market risk, or credit risk support to us.
Recent Accounting Pronouncements
See discussion of recently adopted and recently issued accounting pronouncements in Note 1 — Summaryof Significant Accounting Policies to our consolidated financial statements in Part II, Item 8 of this Form 10-K.
Critical Accounting Policies and Estimates
We prepare our consolidated financial statements in conformity with GAAP. The preparation of thesefinancial statements requires us to make estimates and assumptions that affect the reported amounts of assets andliabilities and disclosure of contingent assets and liabilities at the date of the financial statements, and the reportedamounts of revenue and expenses during the reporting period. Actual results could differ from those estimates.Critical accounting policies are those that management believes are both most important to the portrayal of ourfinancial condition and operating results, and require management’s most difficult, subjective or complex judgments,often as a result of the need to make estimates about the effect of matters that are inherently uncertain. We base ourestimates on historical experience, outside advice from parties believed to be experts in such matters, and on variousother assumptions that are believed to be reasonable under the circumstances, the results of which form the basis formaking judgments about the carrying value of assets and liabilities that are not readily apparent from other sources.Judgments and uncertainties affecting the application of those policies may result in materially different amountsbeing reported under different conditions or using different assumptions. Our significant accounting policies can befound in Note 1 — Summary of Significant Accounting Policies to our consolidated financial statements included inPart II, Item 8 of this Form 10-K. We consider the following policies to be the most critical in understanding thejudgments that are involved in preparing our consolidated financial statements.
Revenue Recognition
Revenues are recognized by the Company when control of the promised goods or services is transferred toits customers in an amount that reflects the consideration the Company expects to be entitled to in exchange forthose goods or services. Sales and other taxes collected from the customer concurrent with revenue-producingactivities are excluded from revenue. Incidental items that are immaterial in the context of the contract are recognizedas expense. The Company’s contracts with customers may include multiple
Table of Contents
84
performance obligations. For such arrangements, the Company allocates revenue to each performance obligationbased on its relative stand-alone selling price. The Company generally determines stand-alone selling prices basedon the prices charged to customers or using the adjusted market assessment approach. The Company presentsdisaggregated revenue on its consolidated statements of operations.
Good Sam Services and Plans revenue consists of revenue from publications, consumer shows, andmarketing fees from various consumer services and plans. Roadside Assistance (“RA”) revenues are deferred andrecognized over the contractual life of the membership. RA claim expenses are recognized when incurred. Marketingfees for finance, insurance, extended service and other similar products are recognized as variable consideration, netof estimated cancellations, if applicable, when a product is sold or financing has been arranged. These marketingfees are recorded net as we are acting as an agent in the transaction. The related estimate for cancellations on themarketing fees for multi-year finance and insurance products utilize actuarial analysis to estimate the exposure.Promotional expenses consist primarily of direct mail advertising expenses and renewal expenses and are expensedat the time related materials are mailed. Newsstand sales of publications and related expenses are recorded asvariable consideration at the time of delivery, net of estimated returns. Subscription sales of publications are reflectedin income over the lives of the subscriptions. The related selling expenses are expensed as incurred. Advertisingrevenues and related expenses are recorded at the time of delivery. Revenue and related expenses for consumershows are recognized when the show occurs.
RV and Outdoor Retail revenue consists of sales of new and used RVs, sales of RV products, parts andservice and other products, distribution of RV furniture, and commissions on the related finance and insurancecontracts. Revenue from the sale of recreational vehicles is recognized upon completion of the sale to the customer.Conditions to completing a sale include having an agreement with the customer, including pricing, whereby the salesprice must be reasonably expected to be collected and having control transferred to the customer.
RV and Outdoor Retail revenue from parts, service and other products sales is recognized over time as workis completed and when parts are delivered to our customers. For these service and parts revenues recorded overtime, the Company utilizes a method that considers total costs incurred to date and the applicable margin in relationto total expected efforts to complete our performance obligation in order to determine the appropriate amount ofrevenue to recognize over time.
Finance and insurance revenue is recorded net, since the Company is acting as an agent in the transaction,and is recognized when a finance and insurance product contract payment has been received or financing has beenarranged. The proceeds the Company receives for arranging financing contracts, and selling insurance and servicecontracts, are subject to chargebacks if the customer terminates the respective contract earlier than a stated period.In the case of insurance and service contracts, the stated period typically extends from one to five years with therefundable commission balance declining over the contract term. These proceeds are recorded as variableconsideration, net of estimated chargebacks. Chargebacks are estimated based on ultimate future cancellation ratesby product type and year sold using a combination of actuarial methods and leveraging our historical experience fromthe past eight years, adjusted for new consumer trends. The chargeback liabilities included in the estimate of variableconsideration totaled $58.9 million and $48.3 million as of December 31, 2020 and December 31, 2019, respectively.
Good Sam Club revenue consists of revenue club membership fees and royalty fees from co-branded creditcards. Membership revenue is generated from annual, multiyear and lifetime memberships. The revenue andexpenses associated with these memberships are deferred and amortized over the membership period. Unearnedrevenue and profit are subject to revisions as the membership progresses to completion. Revisions to membershipperiod estimates would change the amount of income and expense amortized in future accounting periods. Forlifetime memberships, an 18-year period is used, which is the actuarially determined estimated fulfillment period.Royalty revenue is earned under the terms of an arrangement with a third-party credit card provider based on apercentage of the Company’s co-branded credit card portfolio retail spending with such third-party credit card providerand for acquiring new cardholders.
Table of Contents
85
Contracts in Transit
Contracts in transit consist of amounts due from non-affiliated financing institutions on retail finance contractsfrom vehicle sales for the portion of the vehicle sales price financed by our customers. These retail installment salescontracts are typically funded within ten days of the initial approval of the retail installment sales contract by the third-party lender. Contracts in transit are included in current assets in our consolidated financial statements and totaled$48.2 million and $44.9 million as of December 31, 2020, and December 31, 2019, respectively.
Inventories, net
Dealership inventories consist primarily of new and used vehicles held for sale valued using the specific-identification method and valued at the lower of cost or net realizable value. Cost includes purchase costs,reconditioning costs, dealer-installed accessories, and freight. For vehicles accepted in trades, the cost is the fairvalue of such used vehicles at the time of the trade-in. Dealership parts and accessories are valued at the lower ofcost or net realizable value. Retail parts, accessories and other inventories primarily consist of retail travel and leisurespecialty merchandise and are stated at lower of cost or net realizable value. RV furniture for distribution are stated atlower of cost or net realizable value.
In assessing lower of cost or net realizable value for inventory, we typically consider (i) the aging of theinventory item, (ii) historical sales experience of the inventory item, and (iii) current market conditions and trends forthe inventory item. We also review and consider the following metrics related to sales of inventory items (both on arecent and longer-term historical basis): (i) days of supply in our inventory, and (ii) average selling price if sold at lessthan original cost. We then determine the appropriate level of reserve required to reduce our inventory to the lower ofcost or market and record the resulting adjustment in the period in which we determine a loss has occurred. If futuredemand or market conditions for our products are less favorable than forecasted or if unforeseen circumstancesnegatively impact the utility of inventory, we may be required to record additional write-downs, which would negativelyaffect the results of operations in the period when the write-downs are recorded.
Goodwill and Other Intangible Assets
Goodwill is reviewed at least annually for impairment, and more often when impairment indicators arepresent. We have the option to first assess qualitative factors to determine whether it is more likely than not that thefair value of a reporting unit is less than its net book value. The qualitative analysis used contains inherentuncertainties, including significant estimates and assumptions related to growth rates, projected earnings and cost ofcapital. We are subject to financial risk to the extent that our assets and goodwill become impaired due todeterioration of the underlying businesses. The risk of an asset impairment loss may increase to the extent theunderlying businesses’ earnings or projected earnings decline. During the fourth quarter of 2020, we performed ourannual impairment assessment of the carrying value of our goodwill. The fair value of our reporting units significantlyexceeded the carrying value of its net assets. As a result, we were not required to record an impairment of goodwillrelating to our reporting units. See Note 7 — Goodwill and Intangible Assets to our consolidated financial statementsincluded in Part II, Item 8 of this Form 10-K. Finite-lived intangibles are recorded at cost, net of accumulatedamortization and, if applicable, impairment charges. Finite-lived intangible assets consist of membership andcustomer lists with weighted average useful lives of approximately 5.3 years, trademarks and trade names withweighted average useful lives of approximately 15.0 years, supplier lists with weighted-average useful lives of 5.0years, and websites with weighted-average useful lives of approximately 8.3 years. The weighted-average useful lifeof all our finite-lived intangible assists is approximately 12.8 years.
Long-Lived Assets
Long lived assets are included in property and equipment, which also includes capitalized software costs tobe held and used. For our major software systems, such as our accounting and membership systems, our capitalizedcosts may include some internal or external costs to configure, install and test the software during the applicationdevelopment stage. We do not capitalize preliminary project costs, nor do we capitalize training, data conversioncosts, maintenance or post development stage costs. Our long-lived assets are reviewed for impairment wheneverevents or changes in circumstances indicate that the carrying amount of an
Table of Contents
86
asset may not be recoverable. Our long-lived asset groups exist predominantly at the individual location level and theassociated impairment analysis involves the comparison of an asset group’s estimated future undiscounted cashflows over its remaining useful life to its respective carrying value, which primarily includes furniture, equipment,leasehold improvements, and operating lease assets. For long-lived asset groups identified with carrying values notrecoverable by future undiscounted cash flows, impairment charges are recognized to the extent the sum of thediscounted future cash flows from the use of the asset group is less than the carrying value. The impairment charge isallocated to the individual long-lived assets within an asset group; however, an individual long-lived asset is notimpaired below its individual fair value, if readily determinable. The measurement of any impairment loss includesestimation of the fair value of the asset group’s respective operating lease assets, which includes estimates of marketrental rates based on comparable lease transactions.
Income Taxes
We apply the provisions of ASC No. 740, “Income Taxes” (“ASC 740”). Under ASC 740, deferred tax assetsand liabilities are determined based on differences between the financial reporting and tax bases of assets andliabilities and are measured using the enacted tax rates and laws that will be in effect when the differences areexpected to reverse. We record a valuation allowance to reduce our deferred tax assets to the amount that is morelikely than not to be realized. In evaluating our ability to recover our deferred tax assets, we consider all availablepositive and negative evidence, including our operating results, ongoing tax planning and forecasts of future taxableincome on a jurisdiction-by-jurisdiction basis. In accordance with ASC 740, we recognize, in our consolidated financialstatements, the impact of our tax positions that are more likely than not to be sustained upon examination based onthe technical merits of the positions. The Company recognizes interest and penalties for uncertain tax positions inincome tax expense.
We are subject to federal and state income taxes. Tax laws, regulations, and administrative practices invarious jurisdictions may be subject to significant change, with or without notice, due to economic, political, and otherconditions, and significant judgment is required in evaluating and estimating our provision and accruals for thesetaxes. In addition, a number of jurisdictions in which we are subject to tax have pursued or are actively pursuingchanges to their tax laws applicable to corporate taxpayers, such as the 2017 Tax Act. The 2017 Tax Act was signedinto law on December 22, 2017. The 2017 Tax Act significantly revised the U.S. corporate income tax by, amongother things, lowering the statutory corporate tax rate from 35% to 21% and eliminating certain deductions. For theyear ended December 31, 2020, there were no significant impacts on estimated values of the Tax ReceivableAgreement liability and the Company’s deferred tax assets as a result of any recent tax law changes.
We are subject to U.S. federal, state and local income taxes with respect to our allocable share of anytaxable income of CWGS, LLC and are taxed at the prevailing corporate tax rates. CWGS, LLC is currently treated asa partnership for U.S. federal and most applicable state and local income tax purposes and, as such is generally notsubject to any U.S. federal entity-level income taxes with the exception of certain subsidiaries, which areSubchapter C corporations. Taxable income or loss of a partnership is passed through to and included in the taxableincome of its owners for U.S. federal income tax purposes. However, CWGS, LLC may be liable for various otherstate and local taxes. Pursuant to the CWGS LLC Agreement, CWGS, LLC will generally make pro rata taxdistributions to holders of common units in an amount sufficient to fund all or part of their tax obligations with respectto the taxable income of CWGS, LLC that is allocated to them.
Table of Contents
87
Tax Receivable Agreement Liability
As described in Note 11 — Income Taxes to the consolidated financial statements included in Part II, Item 8of this Form 10-K, we are a party to the Tax Receivable Agreement under which we are contractually committed topay the Continuing Equity Owners 85% of the amount of any tax benefits that we actually realize, or in some casesare deemed to realize, as a result of certain transactions (the “TRA Payments”). Amounts payable under the TaxReceivable Agreement are contingent upon, among other things, (i) generation of future taxable income over the termof the Tax Receivable Agreement and (ii) future changes in tax laws. If we do not generate sufficient taxable incomein the aggregate over the term of the Tax Receivable Agreement to utilize the tax benefits, then we would not berequired to make the related TRA Payments. Therefore, we would only recognize a liability for TRA Payments if wedetermine if it is probable that we will generate sufficient future taxable income over the term of the Tax ReceivableAgreement to utilize the related tax benefits. Estimating future taxable income is inherently uncertain and requiresjudgment. In projecting future taxable income, we consider our historical results and incorporate certain assumptions,including projected retail location openings, revenue growth, and operating margins, among others. As of December31, 2020, our Tax Receivable Agreement liability was recorded at $145.9 million after decreasing the liability by $0.1million in the year ended December 31, 2020 to reflect our future tax benefit primarily as a result of the reduction inenacted state income tax rates. During the year ended December 31, 2020, the Tax Receivable Agreement liabilitywas further adjusted to reflect new transactions, net of cash payments made. We concluded it is probable that wewould have sufficient future taxable income to utilize the related tax benefits of the liability recorded. If we determinein the future that we will not be able to fully utilize all or part of the related tax benefits, we would derecognize theportion of the liability related the benefits not expected to be utilized.
Additionally, we estimate the amount of TRA Payments expected to be paid within the next 12 months andclassify this amount as current on our Consolidated Balance Sheets. This determination is based on our estimate oftaxable income for the next fiscal year. To the extent our estimate differs from actual results, we may be requiredreclassify portions of our liabilities under the Tax Receivable Agreement between current and non-current.
ITEM 7a. QUANTITATIVE AND QUALITATIVE DISCLOSURES OF MARKET RISK
We are exposed to market risk from changes in inflation and interest rates. All of these market risks arise inthe normal course of business, as we do not engage in speculative trading activities. The following analysis providesquantitative information regarding these risks.
Impact of Inflation
We believe that inflation over the last three fiscal years has not had a significant impact on our operations;however, we cannot assure you there will be no such effect in the future. Our leases require us to pay taxes,maintenance, repairs, insurance and utilities, all of which are generally subject to inflationary increases. Additionally,the cost of remodeling acquired retail locations and constructing new retail locations is subject to inflationary increasein the costs of labor and material, which results in higher rent expense on new retail locations. Finally, we financesubstantially all of our inventory through various revolving floor plan arrangements with interest rates that vary basedon various benchmarks. Such rates have historically increased during periods of increasing inflation.
Interest Rate Risk
Our operating results are subject to risk from interest rate fluctuations on our Senior Secured Credit Facilities,our Floor Plan Facility and our Real Estate Facility, which carry variable interest rates. Interest rate risk is theexposure to loss resulting from changes in the level of interest rates and the spread between different interest rates.Our Senior Secured Credit Facilities includes the Term Loan Facility and the Revolving Credit Facility with advancestied to a borrowing base and which bear interest at variable rates. Additionally, under our Floor Plan Facilities wehave the ability to draw on revolving floor plan arrangements, which bear interest at variable rates. Because ourSenior Secured Credit Facilities, Floor Plan Facility and Real Estate Facility bear interest at variable rates, we areexposed to market risks relating to changes in interest rates. Interest rate risk is highly sensitive due to many factors,including U.S. monetary and tax policies, U.S. and international
Table of Contents
88
economic factors and other factors beyond our control. As of December 31, 2020, we had no outstanding borrowingsunder our Revolving Credit Facility aside from letters of credit in the aggregate amount of $5.9 million outstandingunder the Revolving Credit Facility; $1.1 billion of variable rate debt outstanding under our Term Loan Facility, net of$3.2 million of unamortized original issue discount and $7.9 million of finance costs; $522.5 million in outstandingborrowings under our Floor Plan Facility, and $20.9 million under the Floor Plan Facility revolving line of credit; and$4.5 million in borrowings under our Real Estate Facility, net of $13,000 of unamortized finance costs. Based onDecember 31, 2020 debt levels, an increase or decrease of 1% in the effective interest rate would cause an increaseor decrease in interest expense under our Term Loan Facility of $12.1 million or $0, respectively, over the next 12months, an increase or decrease of 1% in the effective rate would cause an increase or decrease in interest underour Floor Plan Facility of approximately $5.4 million over the next 12 months, and an increase or decrease of 1% inthe effective rate would cause an increase or decrease in interest under our Real Estate Facility of approximately$45,000 over the next 12 months. We do not use derivative financial instruments for speculative or trading purposes,but this does not preclude our adoption of specific hedging strategies in the future.
Table of Contents
89
ITEM 8. FINANCIAL STATEMENTS AND SUPPLEMENTARY DATA
Camping World Holdings, Inc. and SubsidiariesConsolidated Financial Statements
Years Ended December 31, 2020, 2019, and 2018
Contents
Report of Independent Registered Public Accounting Firm – Deloitte & Touche LLP 90
Consolidated Financial StatementsConsolidated Balance Sheets 93Consolidated Statements of Operations 94Consolidated Statements of Stockholders’ Deficit 95Consolidated Statements of Cash Flows 97Notes to Consolidated Financial Statements 99
Table of Contents
90
REPORT OF INDEPENDENT REGISTERED PUBLIC ACCOUNTING FIRM
To the Stockholders and the Board of Directors of Camping World Holdings, Inc. and subsidiaries
Opinion on the Financial Statements
We have audited the accompanying consolidated balance sheets of Camping World Holdings, Inc. and subsidiaries(the "Company") as of December 31, 2020 and 2019, the related consolidated statements of operations, stockholders'deficit, and cash flows, for each of the three years in the period ended December 31, 2020, and the related notes andthe schedules listed in the Index at Item 15(a)(2) (collectively referred to as the "financial statements"). In our opinion,the financial statements present fairly, in all material respects, the financial position of the Company as of December31, 2020 and 2019, and the results of its operations and its cash flows for each of the three years in the period endedDecember 31, 2020, in conformity with accounting principles generally accepted in the United States of America.
We have also audited, in accordance with the standards of the Public Company Accounting Oversight Board (UnitedStates) (PCAOB), the Company's internal control over financial reporting as of December 31, 2020, based on criteriaestablished in Internal Control — Integrated Framework (2013) issued by the Committee of Sponsoring Organizationsof the Treadway Commission and our report dated February 26, 2021, expressed an unqualified opinion on theCompany's internal control over financial reporting.
Change in Accounting Principle
As discussed in Note 1 to the financial statements, the Company changed its method of accounting for leasingtransactions in 2019 due to the adoption of Accounting Standards Codification Topic 842, Leases, using the modifiedretrospective approach.
Basis for Opinion
These financial statements are the responsibility of the Company's management. Our responsibility is to express anopinion on the Company's financial statements based on our audits. We are a public accounting firm registered withthe PCAOB and are required to be independent with respect to the Company in accordance with the U.S. federalsecurities laws and the applicable rules and regulations of the Securities and Exchange Commission and the PCAOB.
We conducted our audits in accordance with the standards of the PCAOB. Those standards require that we plan andperform the audit to obtain reasonable assurance about whether the financial statements are free of materialmisstatement, whether due to error or fraud. Our audits included performing procedures to assess the risks ofmaterial misstatement of the financial statements, whether due to error or fraud, and performing procedures thatrespond to those risks. Such procedures included examining, on a test basis, evidence regarding the amounts anddisclosures in the financial statements. Our audits also included evaluating the accounting principles used andsignificant estimates made by management, as well as evaluating the overall presentation of the financial statements.We believe that our audits provide a reasonable basis for our opinion.
Critical Audit Matters
The critical audit matters communicated below are matters arising from the current-period audit of the financialstatements that were communicated or required to be communicated to the audit committee and that (1) relate toaccounts or disclosures that are material to the financial statements and (2) involved our especially challenging,subjective, or complex judgments. The communication of critical audit matters does not alter in any way our opinionon the financial statements, taken as a whole, and we are not, by communicating the critical audit matters below,providing separate opinions on the critical audit matters or on the accounts or disclosures to which they relate.
Table of Contents
91
Finance and Insurance, Net — Revenue Recognition — Refer to Note 1 to the consolidated financialstatements
Critical Audit Matter Description
The Company acts as an agent in selling certain insurance and service contracts with multi-year terms to customerson behalf of third-party insurance providers. The proceeds the Company receives for selling these contracts aresubject to chargebacks of such proceeds if the customer terminates the respective contract earlier than a statedperiod. These customer proceeds are recorded as variable consideration, net of estimated chargebacks. Estimatedchargebacks depend on ultimate future cancellation rates, determined by management by product type and year soldusing a combination of actuarial methods and leveraging the Company’s historical experience from the past eightyears, adjusted for new consumer trends. As of December 31, 2020, the Company recorded $58.9 million inchargeback liabilities related to these dealership insurance and service contracts.
Given the judgment involved in estimating the ultimate future cancellation rates used to estimate the chargebackliabilities, auditing this assumption required a high degree of auditor judgment, including the use of our actuarialspecialists, in performing audit procedures to evaluate the reasonableness of management’s estimate.
How the Critical Audit Matter Was Addressed in the Audit
Our audit procedures related to the ultimate future cancellation rates included the following, among others:
● We tested the effectiveness of controls over management's review of the ultimate future cancellation ratesused to estimate the chargeback liabilities.
● We read standard insurance policies for each policy type, including agreements and amendments betweeninsurance providers and the Company to understand the arrangements in effect.
● With the assistance of our actuarial specialists, we developed a range of the ultimate liability estimates basedon independent estimated ultimate future cancellation rates utilizing current economic factors and comparingsuch range to the liability estimate determined by management.
● We evaluated the reasonableness of the ultimate future cancellation rates used by comparing the recordedliability amounts, determined based on estimated ultimate future cancellation rates, and related refundamounts, reflective of actual chargebacks paid to insurance providers, over historical and current periods.
Long-Lived Asset Impairment — Refer to Notes 1 and 5 to the consolidated financial statements
Critical Audit Matter Description
The Company performs an analysis of the carrying value of long-lived assets for impairment whenever events orchanges in circumstances indicate that the carrying value of the long-lived assets may not be recoverable. TheCompany’s long-lived asset groups are comprised of property and equipment, net, and operating lease right-of-useassets (“ROU assets”) that exist predominantly at the individual location level (a ”location”). For locations identifiedwith carrying values not recoverable by future undiscounted cash flows, impairment charges are measured based onthe excess of carrying value over the location’s fair value, subject to certain limitations. Fair value is determined, asapplicable, as the sum of the discounted projected future cash flows from the use of the location’s assets. Theresulting impairment is allocated to the individual long-lived assets within the asset group up to the individual asset’sfair value, if readily determinable. As a result, the measurement of any impairment loss includes estimation of the fairvalue of the location’s ROU assets, which requires management to consider estimates of market rental rates basedon comparable lease transactions. As of December 31, 2020, the Company had $367.9 million in property andequipment, net and $769.5 million in ROU assets. During the year ended December 31, 2020, the Companyrecognized $12.4 million of long-lived asset impairments.
Table of Contents
92
We identified the impairment of the carrying value of long-lived assets as a critical audit matter. For locations withindicators of impairment, a high degree of auditor judgment and an increased extent of effort was required whenperforming audit procedures to evaluate the reasonableness of management’s estimates of projected future cashflows and market rental rates, including the use of valuation specialists in evaluating management’s estimates ofmarket rental rates and in identifying comparable market rental rate assumptions based on the specific geographicareas and characteristics of the respective locations.
How the Critical Audit Matter Was Addressed in the Audit
Our audit procedures related to the evaluation of projected future cash flows and the market rental rate assumptionsfor locations with impairment indicators included the following, among others:
● We tested the effectiveness of controls over management’s review of the analysis of carrying value of long-lived assets for impairment, including assumptions of projected future cash flows and current market rentalrates for applicable locations.
● We evaluated the reasonableness of management’s projected future cash flows and market rental rateassumptions by performing the following procedures for selected locations:
● We compared the minimum future cash flows required to recover the carrying value of the location tohistorical chain-wide average cash flows for comparable locations under similar economiccircumstances and relevant location characteristics.
● We evaluated the consistency of projected future cash flows with other relevant information obtainedin our audit, such as internal budgets and forecasts.
● With the assistance of our valuation specialists:
◾ We compared the lease datapoints (e.g., lease start date, square footage, rent per squarefoot) used in the Company’s estimate to an independent industry database where suchinformation was publicly available.
◾ We identified additional comparable lease datapoints of similar square footage to thelocation in the related geographic market, and calculated a range of rent per square foot andaverage rent per square foot for similar lease types.
◾ We evaluated the reasonableness of the market rental rate assumption by comparing to therespective market data, considering the level of similarity of the location with the age, sizeand proximity of the comparable lease datapoints.
◾ Where available, we compared the rent per square foot for sublease offers and currentnegotiations with potential tenants to the market rental rate assumption for the relatedlocations to determine if the market rental rate assumption is reasonably supported by thecurrent offers on the actual property.
/s/ Deloitte & Touche LLP
Los Angeles, CaliforniaFebruary 26, 2021
We have served as the Company's auditor since 2018.
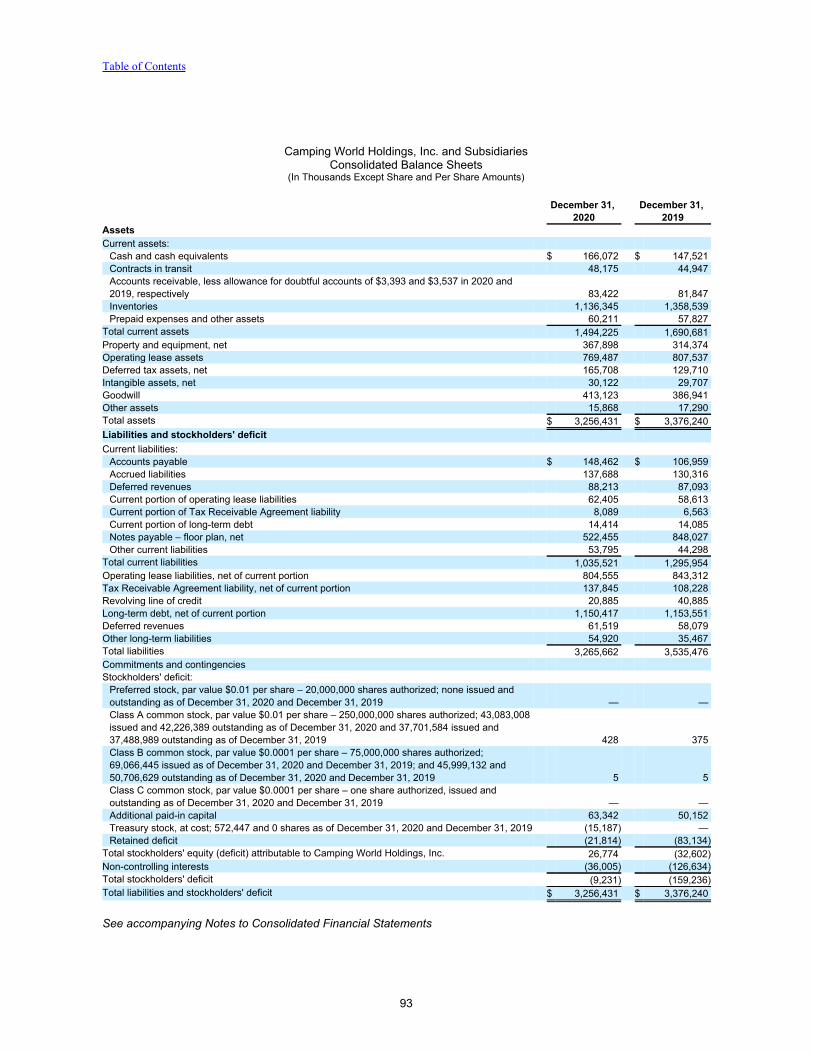
Table of Contents
93
Camping World Holdings, Inc. and SubsidiariesConsolidated Balance Sheets
(In Thousands Except Share and Per Share Amounts)
December 31, December 31, 2020 2019
AssetsCurrent assets:
Cash and cash equivalents $ 166,072 $ 147,521Contracts in transit 48,175 44,947Accounts receivable, less allowance for doubtful accounts of $3,393 and $3,537 in 2020 and2019, respectively 83,422 81,847Inventories 1,136,345 1,358,539Prepaid expenses and other assets 60,211 57,827
Total current assets 1,494,225 1,690,681Property and equipment, net 367,898 314,374Operating lease assets 769,487 807,537Deferred tax assets, net 165,708 129,710Intangible assets, net 30,122 29,707Goodwill 413,123 386,941Other assets 15,868 17,290Total assets $ 3,256,431 $ 3,376,240Liabilities and stockholders' deficitCurrent liabilities:
Accounts payable $ 148,462 $ 106,959Accrued liabilities 137,688 130,316Deferred revenues 88,213 87,093Current portion of operating lease liabilities 62,405 58,613Current portion of Tax Receivable Agreement liability 8,089 6,563Current portion of long-term debt 14,414 14,085Notes payable – floor plan, net 522,455 848,027Other current liabilities 53,795 44,298
Total current liabilities 1,035,521 1,295,954Operating lease liabilities, net of current portion 804,555 843,312Tax Receivable Agreement liability, net of current portion 137,845 108,228Revolving line of credit 20,885 40,885Long-term debt, net of current portion 1,150,417 1,153,551Deferred revenues 61,519 58,079Other long-term liabilities 54,920 35,467Total liabilities 3,265,662 3,535,476Commitments and contingenciesStockholders' deficit:
Preferred stock, par value $0.01 per share – 20,000,000 shares authorized; none issued andoutstanding as of December 31, 2020 and December 31, 2019 — —Class A common stock, par value $0.01 per share – 250,000,000 shares authorized; 43,083,008issued and 42,226,389 outstanding as of December 31, 2020 and 37,701,584 issued and37,488,989 outstanding as of December 31, 2019 428 375Class B common stock, par value $0.0001 per share – 75,000,000 shares authorized;69,066,445 issued as of December 31, 2020 and December 31, 2019; and 45,999,132 and50,706,629 outstanding as of December 31, 2020 and December 31, 2019 5 5Class C common stock, par value $0.0001 per share – one share authorized, issued andoutstanding as of December 31, 2020 and December 31, 2019 — —Additional paid-in capital 63,342 50,152Treasury stock, at cost; 572,447 and 0 shares as of December 31, 2020 and December 31, 2019 (15,187) —Retained deficit (21,814) (83,134)
Total stockholders' equity (deficit) attributable to Camping World Holdings, Inc. 26,774 (32,602)Non-controlling interests (36,005) (126,634)Total stockholders' deficit (9,231) (159,236)Total liabilities and stockholders' deficit $ 3,256,431 $ 3,376,240
See accompanying Notes to Consolidated Financial Statements

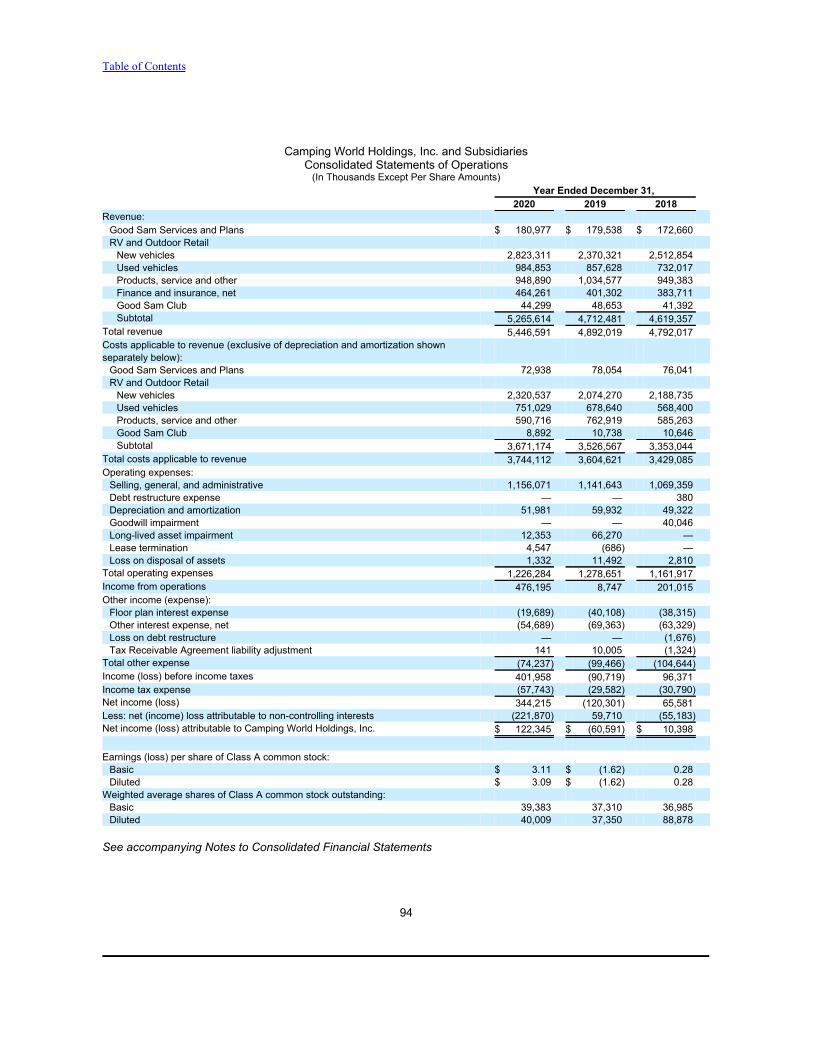
Table of Contents
94
Camping World Holdings, Inc. and SubsidiariesConsolidated Statements of Operations
(In Thousands Except Per Share Amounts)Year Ended December 31,
2020 2019 2018Revenue:
Good Sam Services and Plans $ 180,977 $ 179,538 $ 172,660RV and Outdoor Retail
New vehicles 2,823,311 2,370,321 2,512,854Used vehicles 984,853 857,628 732,017Products, service and other 948,890 1,034,577 949,383Finance and insurance, net 464,261 401,302 383,711Good Sam Club 44,299 48,653 41,392Subtotal 5,265,614 4,712,481 4,619,357
Total revenue 5,446,591 4,892,019 4,792,017Costs applicable to revenue (exclusive of depreciation and amortization shownseparately below):
Good Sam Services and Plans 72,938 78,054 76,041RV and Outdoor Retail
New vehicles 2,320,537 2,074,270 2,188,735Used vehicles 751,029 678,640 568,400Products, service and other 590,716 762,919 585,263Good Sam Club 8,892 10,738 10,646Subtotal 3,671,174 3,526,567 3,353,044
Total costs applicable to revenue 3,744,112 3,604,621 3,429,085Operating expenses:
Selling, general, and administrative 1,156,071 1,141,643 1,069,359Debt restructure expense — — 380Depreciation and amortization 51,981 59,932 49,322Goodwill impairment — — 40,046Long-lived asset impairment 12,353 66,270 —Lease termination 4,547 (686) —Loss on disposal of assets 1,332 11,492 2,810
Total operating expenses 1,226,284 1,278,651 1,161,917Income from operations 476,195 8,747 201,015Other income (expense):
Floor plan interest expense (19,689) (40,108) (38,315)Other interest expense, net (54,689) (69,363) (63,329)Loss on debt restructure — — (1,676)Tax Receivable Agreement liability adjustment 141 10,005 (1,324)
Total other expense (74,237) (99,466) (104,644)Income (loss) before income taxes 401,958 (90,719) 96,371Income tax expense (57,743) (29,582) (30,790)Net income (loss) 344,215 (120,301) 65,581Less: net (income) loss attributable to non-controlling interests (221,870) 59,710 (55,183)Net income (loss) attributable to Camping World Holdings, Inc. $ 122,345 $ (60,591) $ 10,398
Earnings (loss) per share of Class A common stock:Basic $ 3.11 $ (1.62) 0.28Diluted $ 3.09 $ (1.62) 0.28
Weighted average shares of Class A common stock outstanding:Basic 39,383 37,310 36,985Diluted 40,009 37,350 88,878
See accompanying Notes to Consolidated Financial Statements
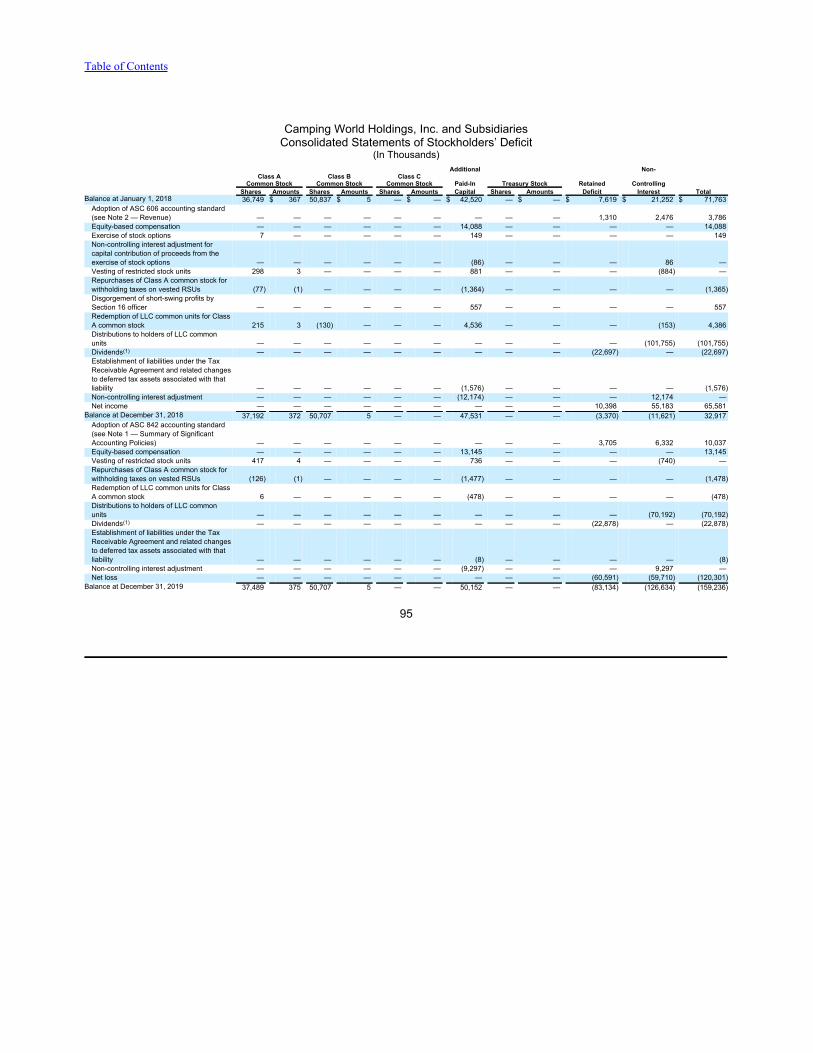
Table of Contents
95
Camping World Holdings, Inc. and SubsidiariesConsolidated Statements of Stockholders’ Deficit
(In Thousands)Additional Non-
Class ACommon Stock
Class BCommon Stock
Class CCommon Stock Paid-In Treasury Stock Retained Controlling
Shares Amounts Shares Amounts Shares Amounts Capital Shares Amounts Deficit Interest TotalBalance at January 1, 2018 36,749 $ 367 50,837 $ 5 — $ — $ 42,520 — $ — $ 7,619 $ 21,252 $ 71,763
Adoption of ASC 606 accounting standard(see Note 2 — Revenue) — — — — — — — — — 1,310 2,476 3,786Equity-based compensation — — — — — — 14,088 — — — — 14,088Exercise of stock options 7 — — — — — 149 — — — — 149Non-controlling interest adjustment forcapital contribution of proceeds from theexercise of stock options — — — — — — (86) — — — 86 —Vesting of restricted stock units 298 3 — — — — 881 — — — (884) —Repurchases of Class A common stock forwithholding taxes on vested RSUs (77) (1) — — — — (1,364) — — — — (1,365)Disgorgement of short-swing profits bySection 16 officer — — — — — — 557 — — — — 557Redemption of LLC common units for ClassA common stock 215 3 (130) — — — 4,536 — — — (153) 4,386Distributions to holders of LLC commonunits — — — — — — — — — — (101,755) (101,755)Dividends(1) — — — — — — — — — (22,697) — (22,697)Establishment of liabilities under the TaxReceivable Agreement and related changesto deferred tax assets associated with thatliability — — — — — — (1,576) — — — — (1,576)Non-controlling interest adjustment — — — — — — (12,174) — — — 12,174 —Net income — — — — — — — — — 10,398 55,183 65,581
Balance at December 31, 2018 37,192 372 50,707 5 — — 47,531 — — (3,370) (11,621) 32,917Adoption of ASC 842 accounting standard(see Note 1 — Summary of SignificantAccounting Policies) — — — — — — — — — 3,705 6,332 10,037Equity-based compensation — — — — — — 13,145 — — — — 13,145Vesting of restricted stock units 417 4 — — — — 736 — — — (740) —Repurchases of Class A common stock forwithholding taxes on vested RSUs (126) (1) — — — — (1,477) — — — — (1,478)Redemption of LLC common units for ClassA common stock 6 — — — — — (478) — — — — (478)Distributions to holders of LLC commonunits — — — — — — — — — — (70,192) (70,192)Dividends(1) — — — — — — — — — (22,878) — (22,878)Establishment of liabilities under the TaxReceivable Agreement and related changesto deferred tax assets associated with thatliability — — — — — — (8) — — — — (8)Non-controlling interest adjustment — — — — — — (9,297) — — — 9,297 —Net loss — — — — — — — — — (60,591) (59,710) (120,301)
Balance at December 31, 2019 37,489 375 50,707 5 — — 50,152 — — (83,134) (126,634) (159,236)
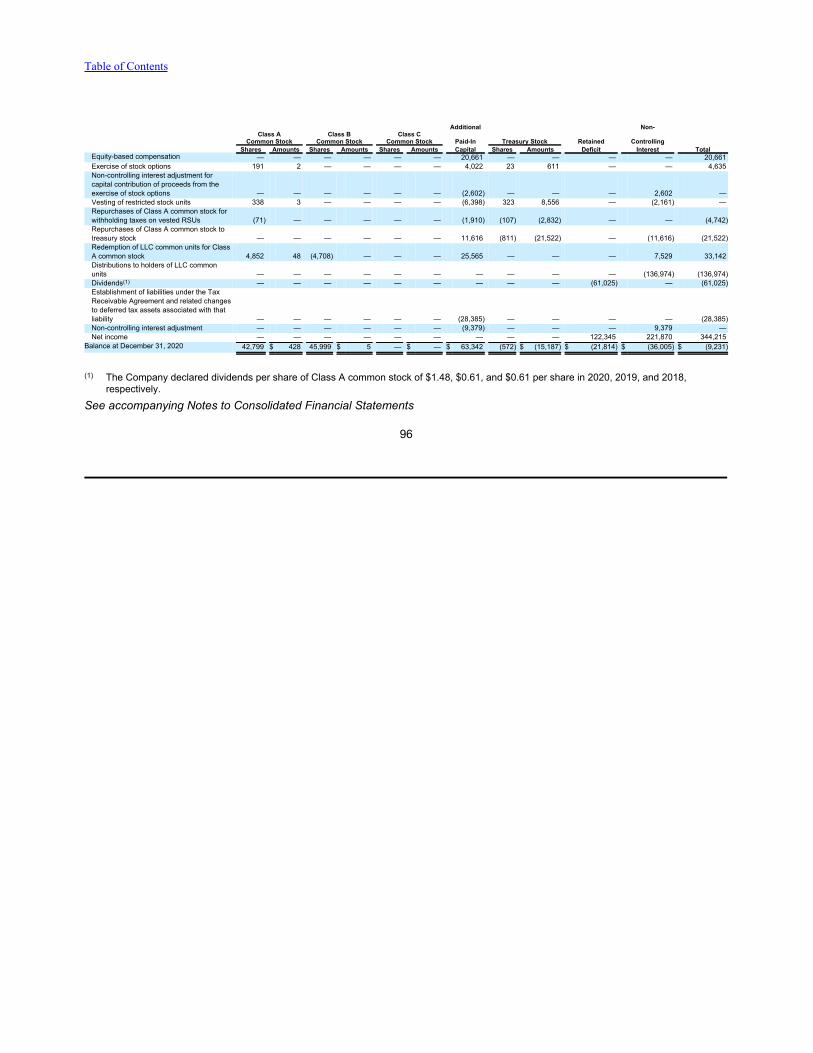
Table of Contents
96
Additional Non-Class A
Common StockClass B
Common StockClass C
Common Stock Paid-In Treasury Stock Retained Controlling Shares Amounts Shares Amounts Shares Amounts Capital Shares Amounts Deficit Interest Total
Equity-based compensation — — — — — — 20,661 — — — — 20,661Exercise of stock options 191 2 — — — — 4,022 23 611 — — 4,635Non-controlling interest adjustment forcapital contribution of proceeds from theexercise of stock options — — — — — — (2,602) — — — 2,602 —Vesting of restricted stock units 338 3 — — — — (6,398) 323 8,556 — (2,161) —Repurchases of Class A common stock forwithholding taxes on vested RSUs (71) — — — — — (1,910) (107) (2,832) — — (4,742)Repurchases of Class A common stock totreasury stock — — — — — — 11,616 (811) (21,522) — (11,616) (21,522)Redemption of LLC common units for ClassA common stock 4,852 48 (4,708) — — — 25,565 — — — 7,529 33,142Distributions to holders of LLC commonunits — — — — — — — — — — (136,974) (136,974)Dividends(1) — — — — — — — — — (61,025) — (61,025)Establishment of liabilities under the TaxReceivable Agreement and related changesto deferred tax assets associated with thatliability — — — — — — (28,385) — — — — (28,385)Non-controlling interest adjustment — — — — — — (9,379) — — — 9,379 —Net income — — — — — — — — — 122,345 221,870 344,215
Balance at December 31, 2020 42,799 $ 428 45,999 $ 5 — $ — $ 63,342 (572) $ (15,187) $ (21,814) $ (36,005) $ (9,231)
(1) The Company declared dividends per share of Class A common stock of $1.48, $0.61, and $0.61 per share in 2020, 2019, and 2018,respectively.
See accompanying Notes to Consolidated Financial Statements
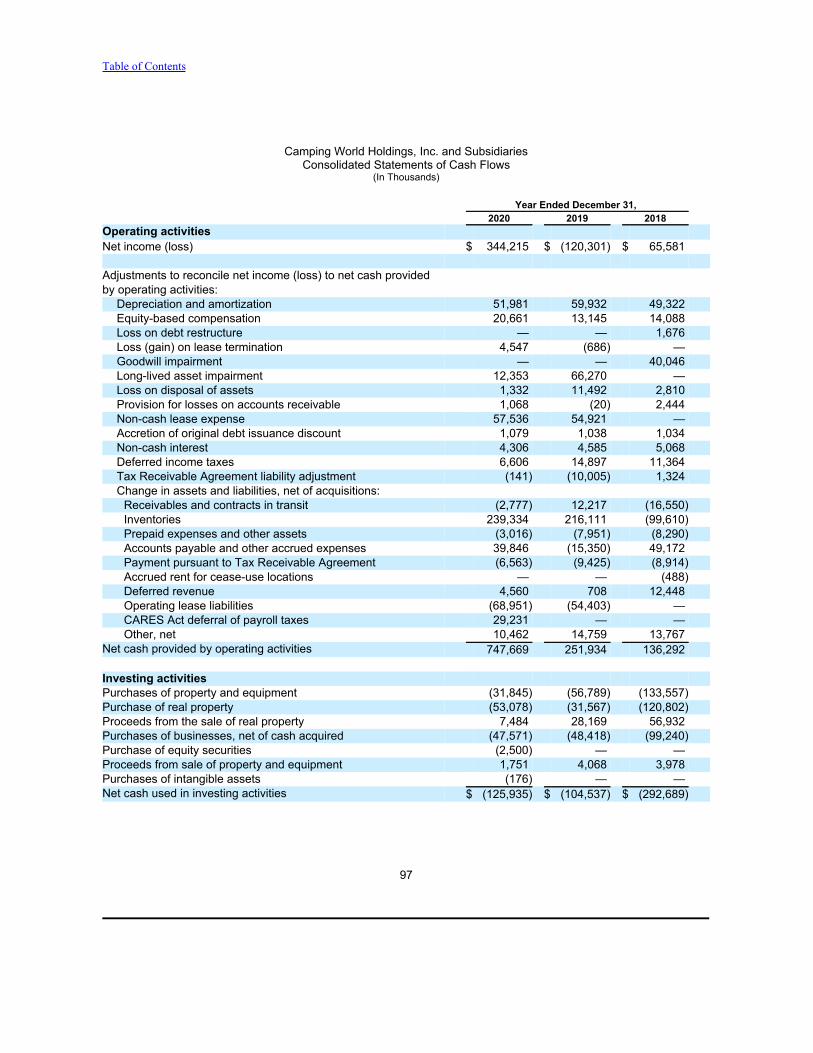
Table of Contents
97
Camping World Holdings, Inc. and SubsidiariesConsolidated Statements of Cash Flows
(In Thousands)
Year Ended December 31, 2020 2019 2018
Operating activitiesNet income (loss) $ 344,215 $ (120,301) $ 65,581
Adjustments to reconcile net income (loss) to net cash providedby operating activities:
Depreciation and amortization 51,981 59,932 49,322Equity-based compensation 20,661 13,145 14,088Loss on debt restructure — — 1,676Loss (gain) on lease termination 4,547 (686) —Goodwill impairment — — 40,046Long-lived asset impairment 12,353 66,270 —Loss on disposal of assets 1,332 11,492 2,810Provision for losses on accounts receivable 1,068 (20) 2,444Non-cash lease expense 57,536 54,921 —Accretion of original debt issuance discount 1,079 1,038 1,034Non-cash interest 4,306 4,585 5,068Deferred income taxes 6,606 14,897 11,364Tax Receivable Agreement liability adjustment (141) (10,005) 1,324Change in assets and liabilities, net of acquisitions:
Receivables and contracts in transit (2,777) 12,217 (16,550)Inventories 239,334 216,111 (99,610)Prepaid expenses and other assets (3,016) (7,951) (8,290)Accounts payable and other accrued expenses 39,846 (15,350) 49,172Payment pursuant to Tax Receivable Agreement (6,563) (9,425) (8,914)Accrued rent for cease-use locations — — (488)Deferred revenue 4,560 708 12,448Operating lease liabilities (68,951) (54,403) —CARES Act deferral of payroll taxes 29,231 — —Other, net 10,462 14,759 13,767
Net cash provided by operating activities 747,669 251,934 136,292
Investing activitiesPurchases of property and equipment (31,845) (56,789) (133,557)Purchase of real property (53,078) (31,567) (120,802)Proceeds from the sale of real property 7,484 28,169 56,932Purchases of businesses, net of cash acquired (47,571) (48,418) (99,240)Purchase of equity securities (2,500) — —Proceeds from sale of property and equipment 1,751 4,068 3,978Purchases of intangible assets (176) — —Net cash used in investing activities $ (125,935) $ (104,537) $ (292,689)
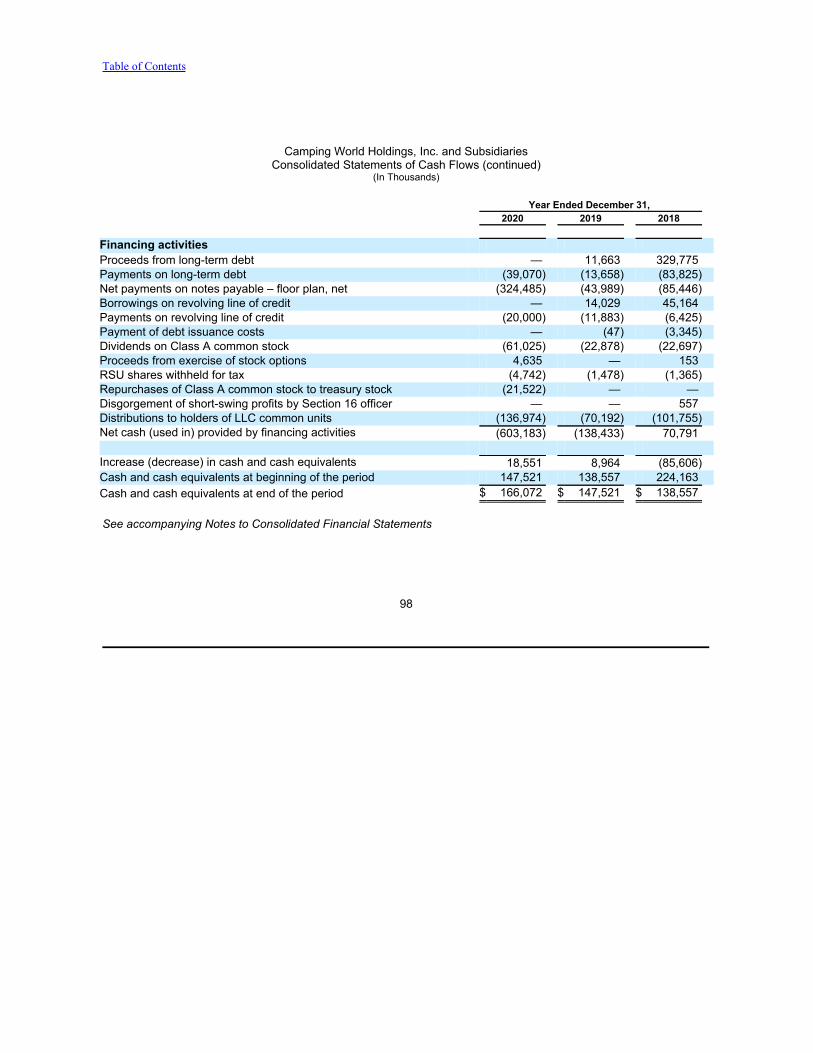
Table of Contents
98
Camping World Holdings, Inc. and SubsidiariesConsolidated Statements of Cash Flows (continued)
(In Thousands)
Year Ended December 31, 2020 2019 2018
Financing activitiesProceeds from long-term debt — 11,663 329,775Payments on long-term debt (39,070) (13,658) (83,825)Net payments on notes payable – floor plan, net (324,485) (43,989) (85,446)Borrowings on revolving line of credit — 14,029 45,164Payments on revolving line of credit (20,000) (11,883) (6,425)Payment of debt issuance costs — (47) (3,345)Dividends on Class A common stock (61,025) (22,878) (22,697)Proceeds from exercise of stock options 4,635 — 153RSU shares withheld for tax (4,742) (1,478) (1,365)Repurchases of Class A common stock to treasury stock (21,522) — —Disgorgement of short-swing profits by Section 16 officer — — 557Distributions to holders of LLC common units (136,974) (70,192) (101,755)Net cash (used in) provided by financing activities (603,183) (138,433) 70,791
Increase (decrease) in cash and cash equivalents 18,551 8,964 (85,606)Cash and cash equivalents at beginning of the period 147,521 138,557 224,163Cash and cash equivalents at end of the period $ 166,072 $ 147,521 $ 138,557
See accompanying Notes to Consolidated Financial Statements
Table of Contents
99
Camping World Holdings, Inc. and Subsidiaries
Notes to Consolidated Financial Statements
December 31, 2020
1. Summary of Significant Accounting Policies
Principles of Consolidation and Basis of Presentation
The consolidated financial statements include the accounts of Camping World Holdings, Inc. (“CWH”) and itssubsidiaries (collectively, the “Company”), and are presented in accordance with accounting principles generallyaccepted in the United States (“GAAP”). All intercompany accounts and transactions of the Company and itssubsidiaries have been eliminated in consolidation.
CWH was formed on March 8, 2016 as a Delaware corporation for the purpose of facilitating an initial publicoffering (the “IPO”) and other related transactions in order to carry on the business of CWGS Enterprises, LLC(“CWGS, LLC”). CWGS, LLC was formed in March 2011 when it received, through contribution from its then parentcompany, all of the membership interests of Affinity Group Holding, LLC and FreedomRoads Holding Company, LLC(“FreedomRoads”). The IPO and related reorganization transactions that occurred on October 6, 2016 resulted inCWH as the sole managing member of CWGS, LLC, with CWH having sole voting power in and control of themanagement of CWGS, LLC (see Note 18 — Stockholders’ Equity). Despite its position as sole managing member ofCWGS, LLC, CWH has a minority economic interest in CWGS, LLC. As of December 31, 2020, 2019, and 2018,CWH owned 47.4%, 42.0% and 41.9%, respectively, of CWGS, LLC. Accordingly, the Company consolidates thefinancial results of CWGS, LLC and reports a non-controlling interest in its consolidated financial statements.
The Company does not have any components of other comprehensive income recorded within itsconsolidated financial statements and, therefore, does not separately present a statement of comprehensive incomein its consolidated financial statements.
COVID-19
A novel strain of coronavirus was declared a pandemic by the World Health Organization in March 2020. Todate, COVID-19 has surfaced in nearly all regions of the world and resulted in travel restrictions and businessslowdowns or shutdowns in affected areas. Many affected areas have begun the process of easing restrictions andreopening certain businesses often under new operating guidelines, although new waves of infection may lead to anincrease in such restrictions or closures.
In conjunction with the stay-at-home and shelter-in-place restrictions enacted in many areas, the Companysaw significant sequential declines in its overall customer traffic levels and its overall revenues from the mid-March tomid-to-late April 2020 timeframe. In the latter part of April, the Company began to see a significant improvement in itsonline web traffic levels and number of electronic leads, and in early May, the Company began to see improvementsin its overall revenue levels. As the stay-at-home restrictions began to ease across certain areas of the country, theCompany experienced significant acceleration in its in-store and online traffic, lead generation, and revenue trends inMay continuing throughout the remainder of 2020 and early indications appear to show favorable trends continuinginto 2021.
Table of Contents
100
In order to offset the initially expected adverse impact of COVID-19 and better align expenses with reducedsales in the middle of March 2020 and early April 2020, the Company temporarily reduced salaries and hoursthroughout the business, including for its executive officers, and implemented headcount and other cost reductions.Most of these temporary salary reductions ended in May 2020 as the adverse impacts of the pandemic began todecline and the Company increased hours for certain employees and reinstated many positions from the initialheadcount reductions as the demand for the Company’s products increased. The Company also negotiated leasepayment deferrals with numerous landlords amounting to approximately $14.0 million from 2020 into 2021. Asdemand for all products accelerated and the Company’s cash position improved, the Company repaid these rentdeferrals in full prior to June 30, 2020. The Company has also taken steps to add new private label lines, expand itsrelationships with smaller recreational vehicle (“RV”) manufacturers, and acquire used inventory from distressedsellers to help manage risks in its supply chain.
Throughout the pandemic, the majority of the Company’s retail locations have continued to operate asessential businesses and the Company has continued to operate its e-commerce business. As a consequence ofCOVID-19, the Company had held fewer consumer shows and events during 2020 than in 2019. Since March 2020,the Company has implemented preparedness plans to keep its employees and customers safe, which include socialdistancing, providing employees with face coverings and/or other protective clothing as required, implementingadditional cleaning and sanitization routines, and work-from-home directives for a significant portion of the Company’sworkforce.
Description of the Business
Camping World Holdings, Inc., together with its subsidiaries, is America’s largest retailer of RVs and relatedproducts and services. As noted above, CWGS, LLC is a holding company and operates through its subsidiaries. TheCompany has the following two reportable segments: (i) Good Sam Services and Plans and (ii) RV and OutdoorRetail. Within the Good Sam Services and Plans segment, the Company primarily derives revenue from the sale ofthe following offerings: emergency roadside assistance plans; property and casualty insurance programs; travel assistprograms; extended vehicle service contracts; vehicle financing and refinancing assistance; consumer shows andevents; and consumer publications and directories. Within the RV and Outdoor Retail segment, the Companyprimarily derives revenue from the sale of new and used RVs; commissions on the finance and insurance contractsrelated to the sale of RVs; the sale of RV services and maintenance work; the sale of RV parts, accessories, andsupplies; the sale of outdoor products, equipment, gear and supplies; business to business distribution of RVfurniture, and the sale of Good Sam Club memberships and co-branded credit cards. The Company operates anational network of RV dealerships and service centers as well as a comprehensive e-commerce platform, primarilyunder the Camping World and Gander RV & Outdoors brands, and markets its products and services primarily to RVand outdoor enthusiasts.
In 2019, the Company made a strategic decision to refocus its business around its core RV competencies,and on September 3, 2019, the board of directors approved a strategic plan to shift the business away from locationsthat did not have the ability or where it was not feasible to sell and/or service RVs (the “2019 Strategic Shift”) (seeNote 5 – Restructuring and Long-lived Asset Impairment). This resulted in the sale, closure or divestiture of 34 non-RV retail stores and the liquidation of approximately $108 million of non-RV related inventory in 2019.
The table below summarizes the Company’s retail store openings, closings, divestitures, conversions andnumber of locations from December 31, 2019 to December 31, 2020:
RV RV Service & OtherDealerships Retail Centers Retail Stores Total
Number of store locations as of December 31, 2019 154 11 10 175Opened 9 — — 9Closed / divested (3) — (8) (11)Temporarily closed(1) (2) — — (2)Converted 2 (1) (1) —
Number of store locations as of December 31, 2020 160 10 1 171
(1) These locations are temporarily closed in response to the COVID-19 pandemic.
Table of Contents
101
Use of Estimates
The preparation of these financial statements in conformity with GAAP requires management to makeestimates and assumptions that affect the reported amounts of assets and liabilities and disclosure of contingentassets and liabilities at the date of the financial statements and the reported amounts of revenue and expenses duringthe reporting period. Actual results may differ from those estimates. In preparing these financial statements,management has made its best estimates and judgments of certain amounts included in the financial statements,giving due consideration to materiality. The Company bases its estimates and judgments on historical experience andother assumptions that management believes are reasonable. However, application of these accounting policiesinvolves the exercise of judgment and use of assumptions as to future uncertainties, including those uncertaintiesarising from COVID-19, and, as a result, actual results could differ materially from these estimates. The Companyperiodically evaluates estimates and assumptions used in the preparation of the financial statements and makeschanges on a prospective basis when adjustments are necessary. Significant estimates made in the accompanyingconsolidated financial statements include certain assumptions related to accounts receivable, inventory, goodwill,intangible assets, long-lived assets, long-lived asset impairments, program cancellation reserves, chargebacks, andaccruals related to estimated tax liabilities, product return reserves, and other liabilities.
Cash and Cash Equivalents
The Company considers all short-term, highly liquid investments purchased with an original maturity date ofthree months or less to be cash equivalents. The carrying amount approximates fair value because of the short-termmaturity of these instruments. Outstanding checks that are in excess of the cash balances at certain banks areincluded in accrued liabilities in the consolidated balance sheets, and changes in the amounts are reflected inoperating cash flows in the accompanying consolidated statement of cash flows.
Contracts in Transit, Accounts Receivable and Current Expected Credit Losses
Contracts in transit consist of amounts due from non-affiliated financing institutions on retail finance contractsfrom vehicle sales for the portion of the vehicle sales price financed by the Company’s customers. These retailinstallment sales contracts are typically funded within ten days of the initial approval of the retail installment salescontract by the third-party lender.
Accounts receivable are stated at realizable value, net of an allowance for doubtful accounts, which includesa reserve for expected credit losses. Accounts receivable balances due in excess of one year was $8.2 million atDecember 31, 2020 and $8.6 million at December 31, 2019, which are included in other assets in the consolidatedbalance sheets.
The allowance for doubtful accounts is based on management’s assessment of the collectability of itscustomer accounts. The Company regularly reviews the composition of the accounts receivable aging, historical baddebts, changes in payment patterns, customer creditworthiness, current economic trends, and reasonable andsupportable forecasts about the future. Relevant risk characteristics include customer size and historical losspatterns. Management has evaluated the expected credit losses related to contracts in transit and determined that noallowance for doubtful accounts was required at December 31, 2020. No allowance for doubtful accounts related tocontracts in transit was required at December 31, 2019. Management additionally has evaluated the expected creditlosses related to accounts receivable and determined that allowances of approximately $3.4 million as of December31, 2020 and $3.5 million as of December 31, 2019 for uncollectible accounts were required.
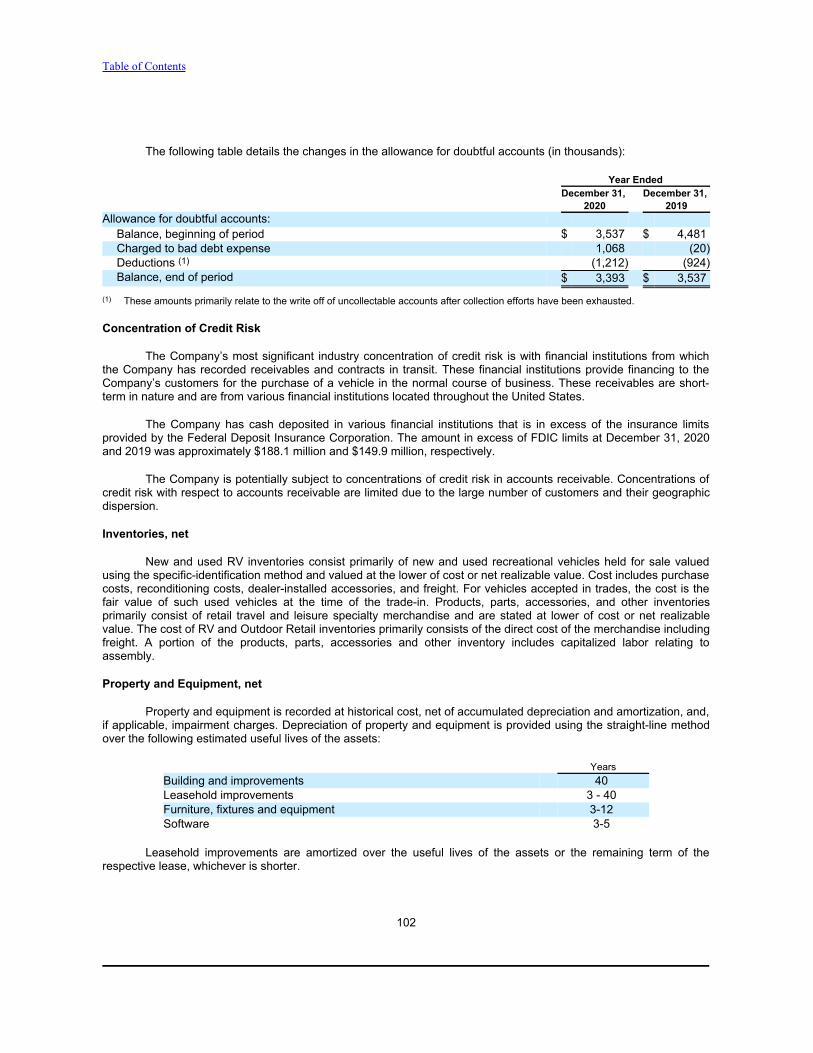
Table of Contents
102
The following table details the changes in the allowance for doubtful accounts (in thousands):
Year EndedDecember 31, December 31,
2020 2019Allowance for doubtful accounts:
Balance, beginning of period $ 3,537 $ 4,481Charged to bad debt expense 1,068 (20)Deductions (1) (1,212) (924)Balance, end of period $ 3,393 $ 3,537
(1) These amounts primarily relate to the write off of uncollectable accounts after collection efforts have been exhausted.
Concentration of Credit Risk
The Company’s most significant industry concentration of credit risk is with financial institutions from whichthe Company has recorded receivables and contracts in transit. These financial institutions provide financing to theCompany’s customers for the purchase of a vehicle in the normal course of business. These receivables are short-term in nature and are from various financial institutions located throughout the United States.
The Company has cash deposited in various financial institutions that is in excess of the insurance limitsprovided by the Federal Deposit Insurance Corporation. The amount in excess of FDIC limits at December 31, 2020and 2019 was approximately $188.1 million and $149.9 million, respectively.
The Company is potentially subject to concentrations of credit risk in accounts receivable. Concentrations ofcredit risk with respect to accounts receivable are limited due to the large number of customers and their geographicdispersion.
Inventories, net
New and used RV inventories consist primarily of new and used recreational vehicles held for sale valuedusing the specific-identification method and valued at the lower of cost or net realizable value. Cost includes purchasecosts, reconditioning costs, dealer-installed accessories, and freight. For vehicles accepted in trades, the cost is thefair value of such used vehicles at the time of the trade-in. Products, parts, accessories, and other inventoriesprimarily consist of retail travel and leisure specialty merchandise and are stated at lower of cost or net realizablevalue. The cost of RV and Outdoor Retail inventories primarily consists of the direct cost of the merchandise includingfreight. A portion of the products, parts, accessories and other inventory includes capitalized labor relating toassembly.
Property and Equipment, net
Property and equipment is recorded at historical cost, net of accumulated depreciation and amortization, and,if applicable, impairment charges. Depreciation of property and equipment is provided using the straight-line methodover the following estimated useful lives of the assets:
YearsBuilding and improvements 40Leasehold improvements 3 - 40Furniture, fixtures and equipment 3-12Software 3-5
Leasehold improvements are amortized over the useful lives of the assets or the remaining term of therespective lease, whichever is shorter.
Table of Contents
103
Leases
After the adoption of Accounting Standards Codification (“ASC”) 842, Leases (“ASC 842”) on January 1,2019 the Company recognizes a right-of-use (“ROU”) asset and a lease liability on the balance sheet for operatingleases (with the exception of short-term leases based on the practical expedient elected by the Company) at thecommencement date, in addition to finance leases that were previously also required to be recognized on the balancesheet, and recognizes expenses on the income statement in a similar manner to the previous guidance in ASC 840,Leases (“ASC 840”) (see Note 10 — Lease Obligations).
Goodwill and Other Intangible Assets
Goodwill is reviewed at least annually for impairment, and more often when impairment indicators are present(see Note 7 – Goodwill and Intangible Assets). Finite-lived intangibles are recorded at cost, net of accumulatedamortization and, if applicable, impairment charges.
Long-Lived Assets
Long lived assets are included in property and equipment, which also includes capitalized software costs tobe held and used. For the Company’s major software systems, such as its accounting and membership systems, itscapitalized costs may include some internal or external costs to configure, install and test the software during theapplication development stage. The Company does not capitalize preliminary project costs, nor does it capitalizetraining, data conversion costs, maintenance or post development stage costs. The Company’s long-lived assets arereviewed for impairment whenever events or changes in circumstances indicate that the carrying amount of an assetmay not be recoverable. The Company’s long-lived asset groups exist predominantly at the individual location leveland the associated impairment analysis involves the comparison of an asset group’s estimated future undiscountedcash flows over its remaining useful life to its respective carrying value, which primarily includes furniture, equipment,leasehold improvements, and operating lease assets. For long-lived asset groups identified with carrying values notrecoverable by future undiscounted cash flows, impairment charges are recognized to the extent the sum of thediscounted future cash flows from the use of the asset group is less than the carrying value. The impairment charge isallocated to the individual long-lived assets within an asset group; however, an individual long-lived asset is notimpaired below its individual fair value, if readily determinable. The measurement of any impairment loss includesestimation of the fair value of the asset group’s respective operating lease assets, which includes estimates of marketrental rates based on comparable lease transactions.
Long-Term Debt
The fair value of the Company’s long-term debt is estimated based on the quoted market prices for the sameor similar issues or on the current rates offered for debt of the same or similar remaining maturities.
Revenue Recognition
Revenues are recognized by the Company when control of the promised goods or services is transferred toits customers in an amount that reflects the consideration the Company expects to be entitled to in exchange forthose goods or services. Sales and other taxes collected from the customer concurrent with revenue-producingactivities are excluded from revenue. Incidental items that are immaterial in the context of the contract are recognizedas expense. The Company’s contracts with customers may include multiple performance obligations. For sucharrangements, the Company allocates revenue to each performance obligation based on its relative stand-aloneselling price. The Company generally determines stand-alone selling prices based on the prices charged tocustomers or using the adjusted market assessment approach. The Company presents disaggregated revenue on itsconsolidated statements of operations.
Good Sam Services and Plans revenue consists of revenue from publications, consumer shows, andmarketing fees from various consumer services and plans. Roadside Assistance (“RA”) revenues are deferred andrecognized over the contractual life of the membership. RA claim expenses are recognized when incurred. Marketingfees for finance, insurance, extended service and other similar products are recognized as variable consideration, netof estimated cancellations, if applicable, when a product contract payment has been received
Table of Contents
104
or financing has been arranged. These marketing fees are recorded net as the Company acts as an agent in thetransaction. The related estimate for cancellations on the marketing fees for multi-year finance and insuranceproducts utilize actuarial analysis to estimate the exposure. Promotional expenses consist primarily of direct mailadvertising expenses and renewal expenses and are expensed at the time related materials are mailed. Newsstandsales of publications and related expenses are recorded as variable consideration at the time of delivery, net ofestimated returns. Subscription sales of publications are reflected in income over the lives of the subscriptions. Therelated selling expenses are expensed as incurred. Advertising revenues and related expenses are recorded at thetime of delivery. Revenue and related expenses for consumer shows are recognized when the show occurs.
RV vehicle revenue consists of sales of new and used recreational vehicles, sales of RV parts and services,and commissions on the related finance and insurance contracts. Revenue from the sale of recreational vehicles isrecognized upon completion of the sale to the customer. Conditions to completing a sale include having anagreement with the customer, including pricing, whereby the sales price must be reasonably expected to be collectedand having control transferred to the customer.
Revenue from RV-related parts, service and other products sales is recognized over time as work iscompleted, and when parts or other products are delivered to the Company’s customers. For service and partsrevenues recorded over time, the Company utilizes a method that considers total costs incurred to date and theapplicable margin in relation to total expected efforts to complete our performance obligation in order to determine theappropriate amount of revenue to recognize over time.
Finance and insurance revenue is recorded net, since the Company is acting as an agent in the transaction,and is recognized when a finance and insurance product contract payment has been received or financing has beenarranged. The proceeds the Company receives for arranging financing contracts, selling extended service contracts,and selling other products, are subject to chargebacks if the customer terminates the respective contract earlier thana stated period. In the case of insurance and service contracts, the stated period typically extends from one to fiveyears with the refundable commission balance declining over the contract term. These proceeds are recorded asvariable consideration, net of estimated chargebacks. Chargebacks are estimated based on ultimate futurecancellation rates by product type and year sold using a combination of actuarial methods and leveraging theCompany’s historical experience from the past eight years, adjusted for new consumer trends. The chargebackliabilities included in the estimate of variable consideration totaled $58.9 million and $48.3 million as of December 31,2020 and December 31, 2019, respectively.
The remaining RV and Outdoor retail revenue consists of sales of products, service and other products,including RV accessories and supplies, RV furniture, camping, hunting, fishing, skiing, snowboarding, bicycling,skateboarding, marine and watersport equipment and supplies. Revenue from products, service and other isrecognized over time as work is completed, and when parts or other products are delivered to the Company’scustomers. For service and parts revenues recorded over time, the Company utilizes a method that considers totalcosts incurred to date and the applicable margin in relation to total expected efforts to complete our performanceobligation in order to determine the appropriate amount of revenue to recognize over time. E-commerce sales arerecognized when the product is shipped and recorded as variable consideration, net of anticipated merchandisereturns which reduce revenue and cost of sales in the period that the related sales are recorded.
Good Sam Club revenue consists of revenue from club membership fees and royalty fees from co-brandedcredit cards. Membership revenue is generated from annual, multiyear and lifetime memberships. The revenue andexpenses associated with these memberships are deferred and amortized over the membership period. Unearnedrevenue and profit are subject to revisions as the membership progresses to completion. Revisions to membershipperiod estimates would change the amount of income and expense amortized in future accounting periods. Forlifetime memberships, an 18-year period is used, which is the actuarially determined estimated fulfillment period.Royalty revenue is earned under the terms of an arrangement with a third-party credit card provider based on apercentage of the Company’s co-branded credit card portfolio retail spending with such third-party credit card providerand for acquiring new cardholders.
The Company does not adjust the promised amount of consideration for the effects of a significant financingcomponent if the Company expects, at contract inception, that the period of time between payment
Table of Contents
105
and transfer of the promised goods or services will be one year or less. The Company expenses sales commissionswhen incurred in cases where the amortization period of those otherwise capitalized sales commissions would havebeen one year or less. The Company does not disclose the value of unsatisfied performance obligations for revenuestreams for (i) contracts with an original expected length of one year or less and (ii) contracts for which the Companyrecognizes revenue at the amount to which it has the right to invoice for services performed. The Company accountsfor shipping and handling as activities to fulfill the promise to transfer the good to the customer and does not evaluatewhether shipping and handling is a separate performance obligation.
Parts and Service Internal Profit
The Company’s parts and service departments recondition the majority of used vehicles acquired by theCompany’s used vehicle departments and perform minor preparatory work on new vehicles acquired by theCompany’s new vehicle departments. The parts and service departments charge the new and used vehicledepartments as if they were third parties in order to account for total activity performed by that department. Therevenue and costs applicable to revenue associated with the internal work performed by the Company’s parts andservice departments are eliminated in consolidation. The Company maintains a reserve for internal work order profitson vehicles that remain in inventories.
Advertising Expense
Advertising expenses are expensed as incurred. Advertising expenses for the years ended December 31,2020, 2019 and 2018 were $96.3 million, $117.8 million and $112.4 million, respectively.
Vendor Allowances
As a component of the Company’s consolidated procurement program, the Company frequently enters intocontracts with vendors that provide for payments of rebates or other allowances. These vendor payments arereflected in the carrying value of the inventory when earned or as progress is made toward earning the rebate orallowance and as a component of cost of sales as the inventory is sold. Certain of these vendor contracts provide forrebates and other allowances that are contingent upon the Company meeting specified performance measures suchas a cumulative level of purchases over a specified period of time. Such contingent rebates and other allowances aregiven accounting recognition at the point at which achievement of the specified performance measures are deemed tobe probable and reasonably estimable.
Shipping and Handling Fees and Costs
The Company reports shipping and handling costs billed to customers as a component of revenues, andrelated costs are reported as a component of costs applicable to revenues. For the years ended December 31, 2020,2019, and 2018, $8.2 million, $6.2 million, and $4.9 million of shipping and handling fees, respectively, were includedin the RV and Outdoor Retail segment as revenue.
Income Taxes
The Company recognizes deferred tax assets and liabilities based on the asset and liability method, whichrequires an adjustment to the deferred tax asset or liability to reflect income tax rates currently in effect. When incometax rates increase or decrease, a corresponding adjustment to income tax expense is recorded by applying the ratechange to the cumulative temporary differences. The Company recognizes the tax benefit from an uncertain taxposition in accordance with accounting guidance on accounting for uncertainty in income taxes. The Companyclassifies interest and penalties relating to income taxes as income tax expense. See Note 11 — Income Taxes foradditional information.
Table of Contents
106
Recently Adopted Accounting Pronouncements
In June 2016, the Financial Accounting Standards Board (the “FASB”) issued Accounting Standards Update(“ASU”) No. 2016-13, Financial Instruments - Credit Losses (Topic 326) (“ASU 2016-13”). This standard requires theuse of a forward-looking expected loss impairment model for trade and other receivables, held-to-maturity debtsecurities, loans and other instruments. This standard also requires impairments and recoveries for available-for-saledebt securities to be recorded through an allowance account and revises certain disclosure requirements. In April2019, the FASB issued ASU 2019-04, Codification Improvements, which provides guidance on accounting for creditlosses on accrued interest receivable balances and guidance on including recoveries when estimating the allowance.In May 2019, the FASB issued ASU 2019-05, Targeted Transition Relief, which allows entities with an option to electfair value for certain instruments upon adoption of Topic 326. The standard is effective for public companies for fiscalyears, and interim periods within those fiscal years, beginning after December 15, 2019. The Company adopted ASU2016-13 on January 1, 2020 and the adoption did not materially impact its condensed consolidated financialstatements.
In August 2018, the FASB issued ASU No. 2018-15, Customer’s Accounting for Implementation CostsIncurred in a Cloud Computing Arrangement That Is a Service Contract (“ASU 2018-15”). This standard aligns theaccounting for implementation costs incurred in a cloud computing arrangement that is a service arrangement (i.e.,hosting arrangement) with the guidance on capitalizing costs in ASC 350-40, Internal-Use Software. The ASU permitseither a prospective or retrospective transition approach. The standard will be effective for fiscal years, and interimperiods within those fiscal years, beginning after December 15, 2019. The Company adopted ASU 2018-15 onJanuary 1, 2020 using the prospective transition approach and the adoption did not materially impact its condensedconsolidated financial statements.
In March 2020, the FASB issued ASU No. 2020-04, Reference Rate Reform (Topic 848) (“ASU 2020-04”).This standard, effective for reporting periods through December 31, 2022, provides accounting relief for contractmodifications that replace an interest rate impacted by reference rate reform (e.g., London Interbank Offered Rate(“LIBOR”)) with a new alternative reference rate. The guidance is applicable to investment securities, receivables,loans, debt, leases, derivatives and hedge accounting elections and other contractual arrangements. The Companyadopted ASU 2020-04 as of January 1, 2020 and the adoption did not materially impact its condensed consolidatedfinancial statements.
Recently Issued Accounting Pronouncements
In December 2019, the FASB issued ASU No. 2019-12, Income Taxes (Topic 740): Simplifying theAccounting for Income Taxes (“ASU 2019-12”). This standard reduces complexity by removing specific exceptions togeneral principles related to intraperiod tax allocations, ownership changes in foreign investments, and interim periodincome tax accounting for year-to-date losses that exceed anticipated losses. This standard also simplifies accountingfor franchise taxes that are partially based on income, transactions with a government that result in a step up in thetax basis of goodwill, separate financial statements of legal entities that are not subject to tax, and enacted changesin tax laws in interim periods. The standard is effective for public companies for fiscal years, and interim periods withinthose fiscal years, beginning after December 15, 2020, with early adoption permitted. The ASU permits either aretrospective basis or a modified retrospective transition approach. The Company does not expect that the adoptionof the provisions of this ASU will have a material impact on its consolidated financial statements.
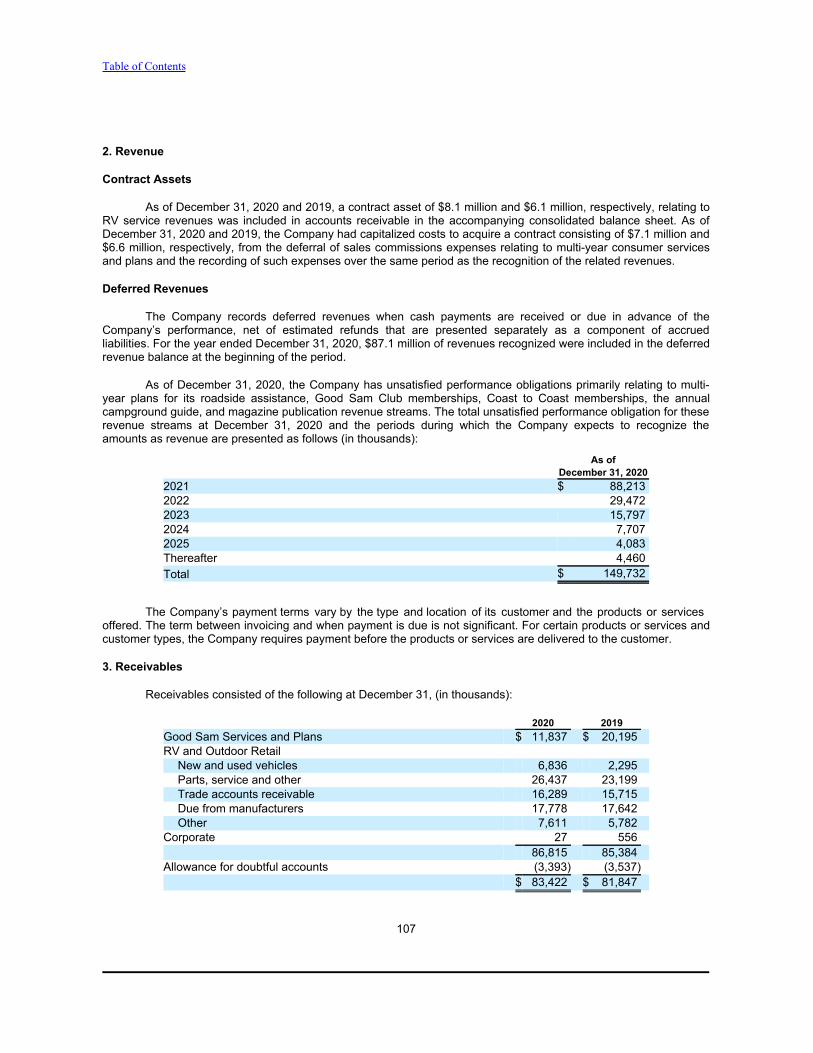
Table of Contents
107
2. Revenue
Contract Assets
As of December 31, 2020 and 2019, a contract asset of $8.1 million and $6.1 million, respectively, relating toRV service revenues was included in accounts receivable in the accompanying consolidated balance sheet. As ofDecember 31, 2020 and 2019, the Company had capitalized costs to acquire a contract consisting of $7.1 million and$6.6 million, respectively, from the deferral of sales commissions expenses relating to multi-year consumer servicesand plans and the recording of such expenses over the same period as the recognition of the related revenues.
Deferred Revenues
The Company records deferred revenues when cash payments are received or due in advance of theCompany’s performance, net of estimated refunds that are presented separately as a component of accruedliabilities. For the year ended December 31, 2020, $87.1 million of revenues recognized were included in the deferredrevenue balance at the beginning of the period.
As of December 31, 2020, the Company has unsatisfied performance obligations primarily relating to multi-year plans for its roadside assistance, Good Sam Club memberships, Coast to Coast memberships, the annualcampground guide, and magazine publication revenue streams. The total unsatisfied performance obligation for theserevenue streams at December 31, 2020 and the periods during which the Company expects to recognize theamounts as revenue are presented as follows (in thousands):
As of December 31, 2020
2021 $ 88,2132022 29,4722023 15,7972024 7,7072025 4,083Thereafter 4,460Total $ 149,732
The Company’s payment terms vary by the type and location of its customer and the products or servicesoffered. The term between invoicing and when payment is due is not significant. For certain products or services andcustomer types, the Company requires payment before the products or services are delivered to the customer.
3. Receivables
Receivables consisted of the following at December 31, (in thousands):
2020 2019Good Sam Services and Plans $ 11,837 $ 20,195RV and Outdoor Retail
New and used vehicles 6,836 2,295Parts, service and other 26,437 23,199Trade accounts receivable 16,289 15,715Due from manufacturers 17,778 17,642Other 7,611 5,782
Corporate 27 55686,815 85,384
Allowance for doubtful accounts (3,393) (3,537)$ 83,422 $ 81,847
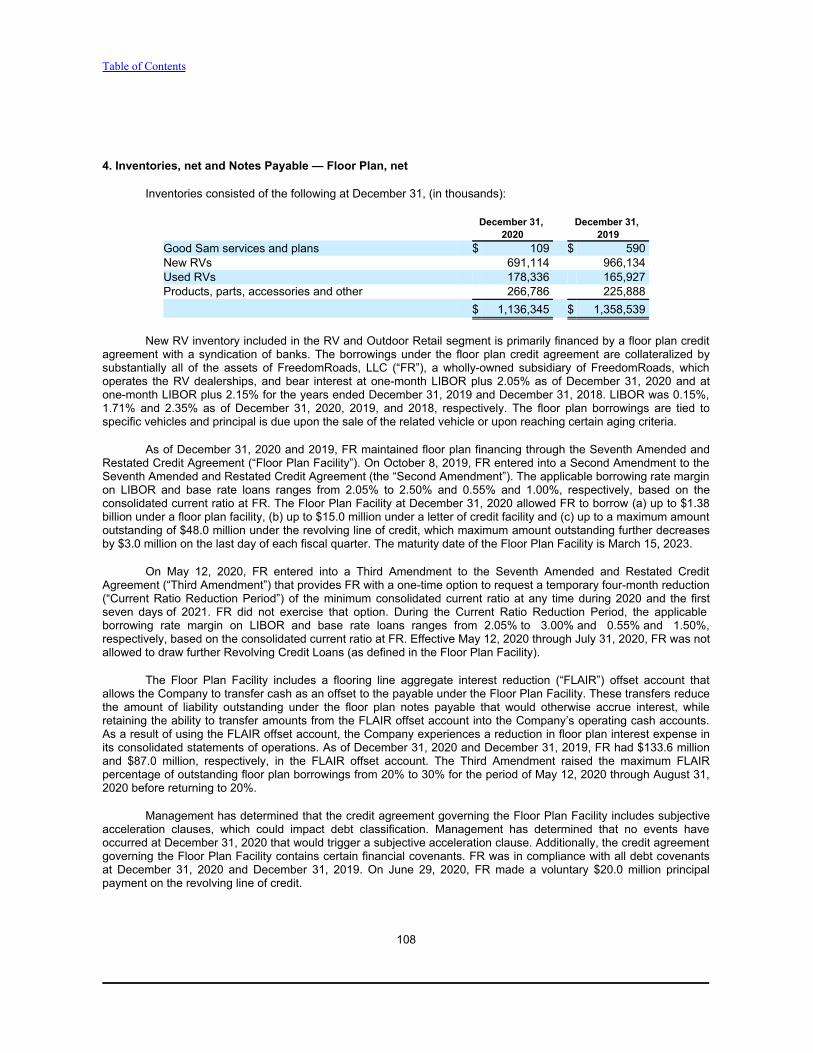
Table of Contents
108
4. Inventories, net and Notes Payable — Floor Plan, net
Inventories consisted of the following at December 31, (in thousands):
December 31, December 31, 2020 2019
Good Sam services and plans $ 109 $ 590New RVs 691,114 966,134Used RVs 178,336 165,927Products, parts, accessories and other 266,786 225,888
$ 1,136,345 $ 1,358,539
New RV inventory included in the RV and Outdoor Retail segment is primarily financed by a floor plan creditagreement with a syndication of banks. The borrowings under the floor plan credit agreement are collateralized bysubstantially all of the assets of FreedomRoads, LLC (“FR”), a wholly-owned subsidiary of FreedomRoads, whichoperates the RV dealerships, and bear interest at one-month LIBOR plus 2.05% as of December 31, 2020 and atone-month LIBOR plus 2.15% for the years ended December 31, 2019 and December 31, 2018. LIBOR was 0.15%,1.71% and 2.35% as of December 31, 2020, 2019, and 2018, respectively. The floor plan borrowings are tied tospecific vehicles and principal is due upon the sale of the related vehicle or upon reaching certain aging criteria.
As of December 31, 2020 and 2019, FR maintained floor plan financing through the Seventh Amended andRestated Credit Agreement (“Floor Plan Facility”). On October 8, 2019, FR entered into a Second Amendment to theSeventh Amended and Restated Credit Agreement (the “Second Amendment”). The applicable borrowing rate marginon LIBOR and base rate loans ranges from 2.05% to 2.50% and 0.55% and 1.00%, respectively, based on theconsolidated current ratio at FR. The Floor Plan Facility at December 31, 2020 allowed FR to borrow (a) up to $1.38billion under a floor plan facility, (b) up to $15.0 million under a letter of credit facility and (c) up to a maximum amountoutstanding of $48.0 million under the revolving line of credit, which maximum amount outstanding further decreasesby $3.0 million on the last day of each fiscal quarter. The maturity date of the Floor Plan Facility is March 15, 2023.
On May 12, 2020, FR entered into a Third Amendment to the Seventh Amended and Restated CreditAgreement (“Third Amendment”) that provides FR with a one-time option to request a temporary four-month reduction(“Current Ratio Reduction Period”) of the minimum consolidated current ratio at any time during 2020 and the firstseven days of 2021. FR did not exercise that option. During the Current Ratio Reduction Period, the applicableborrowing rate margin on LIBOR and base rate loans ranges from 2.05% to 3.00% and 0.55% and 1.50%,respectively, based on the consolidated current ratio at FR. Effective May 12, 2020 through July 31, 2020, FR was notallowed to draw further Revolving Credit Loans (as defined in the Floor Plan Facility).
The Floor Plan Facility includes a flooring line aggregate interest reduction (“FLAIR”) offset account thatallows the Company to transfer cash as an offset to the payable under the Floor Plan Facility. These transfers reducethe amount of liability outstanding under the floor plan notes payable that would otherwise accrue interest, whileretaining the ability to transfer amounts from the FLAIR offset account into the Company’s operating cash accounts.As a result of using the FLAIR offset account, the Company experiences a reduction in floor plan interest expense inits consolidated statements of operations. As of December 31, 2020 and December 31, 2019, FR had $133.6 millionand $87.0 million, respectively, in the FLAIR offset account. The Third Amendment raised the maximum FLAIRpercentage of outstanding floor plan borrowings from 20% to 30% for the period of May 12, 2020 through August 31,2020 before returning to 20%.
Management has determined that the credit agreement governing the Floor Plan Facility includes subjectiveacceleration clauses, which could impact debt classification. Management has determined that no events haveoccurred at December 31, 2020 that would trigger a subjective acceleration clause. Additionally, the credit agreementgoverning the Floor Plan Facility contains certain financial covenants. FR was in compliance with all debt covenantsat December 31, 2020 and December 31, 2019. On June 29, 2020, FR made a voluntary $20.0 million principalpayment on the revolving line of credit.
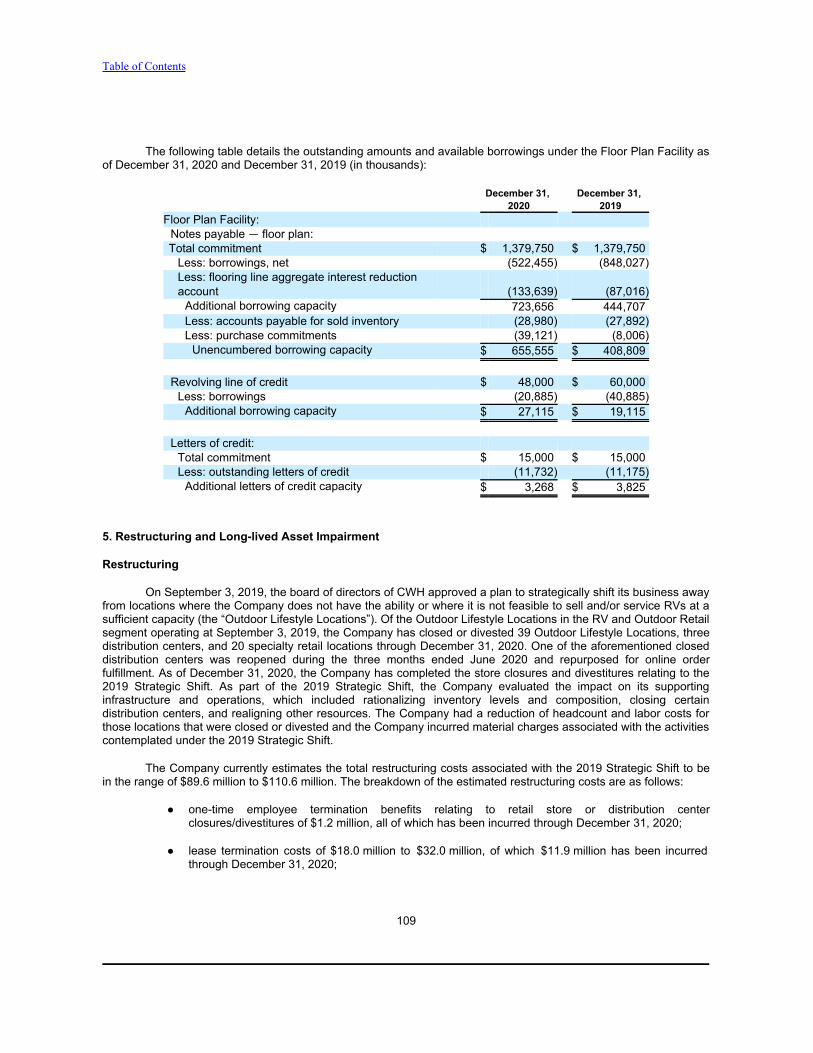
Table of Contents
109
The following table details the outstanding amounts and available borrowings under the Floor Plan Facility asof December 31, 2020 and December 31, 2019 (in thousands):
December 31, December 31, 2020 2019
Floor Plan Facility:Notes payable — floor plan:Total commitment $ 1,379,750 $ 1,379,750
Less: borrowings, net (522,455) (848,027)Less: flooring line aggregate interest reductionaccount (133,639) (87,016)
Additional borrowing capacity 723,656 444,707Less: accounts payable for sold inventory (28,980) (27,892)Less: purchase commitments (39,121) (8,006)
Unencumbered borrowing capacity $ 655,555 $ 408,809
Revolving line of credit $ 48,000 $ 60,000Less: borrowings (20,885) (40,885)
Additional borrowing capacity $ 27,115 $ 19,115
Letters of credit:Total commitment $ 15,000 $ 15,000Less: outstanding letters of credit (11,732) (11,175)
Additional letters of credit capacity $ 3,268 $ 3,825
5. Restructuring and Long-lived Asset Impairment
Restructuring
On September 3, 2019, the board of directors of CWH approved a plan to strategically shift its business awayfrom locations where the Company does not have the ability or where it is not feasible to sell and/or service RVs at asufficient capacity (the “Outdoor Lifestyle Locations”). Of the Outdoor Lifestyle Locations in the RV and Outdoor Retailsegment operating at September 3, 2019, the Company has closed or divested 39 Outdoor Lifestyle Locations, threedistribution centers, and 20 specialty retail locations through December 31, 2020. One of the aforementioned closeddistribution centers was reopened during the three months ended June 2020 and repurposed for online orderfulfillment. As of December 31, 2020, the Company has completed the store closures and divestitures relating to the2019 Strategic Shift. As part of the 2019 Strategic Shift, the Company evaluated the impact on its supportinginfrastructure and operations, which included rationalizing inventory levels and composition, closing certaindistribution centers, and realigning other resources. The Company had a reduction of headcount and labor costs forthose locations that were closed or divested and the Company incurred material charges associated with the activitiescontemplated under the 2019 Strategic Shift.
The Company currently estimates the total restructuring costs associated with the 2019 Strategic Shift to bein the range of $89.6 million to $110.6 million. The breakdown of the estimated restructuring costs are as follows:
● one-time employee termination benefits relating to retail store or distribution centerclosures/divestitures of $1.2 million, all of which has been incurred through December 31, 2020;
● lease termination costs of $18.0 million to $32.0 million, of which $11.9 million has been incurredthrough December 31, 2020;
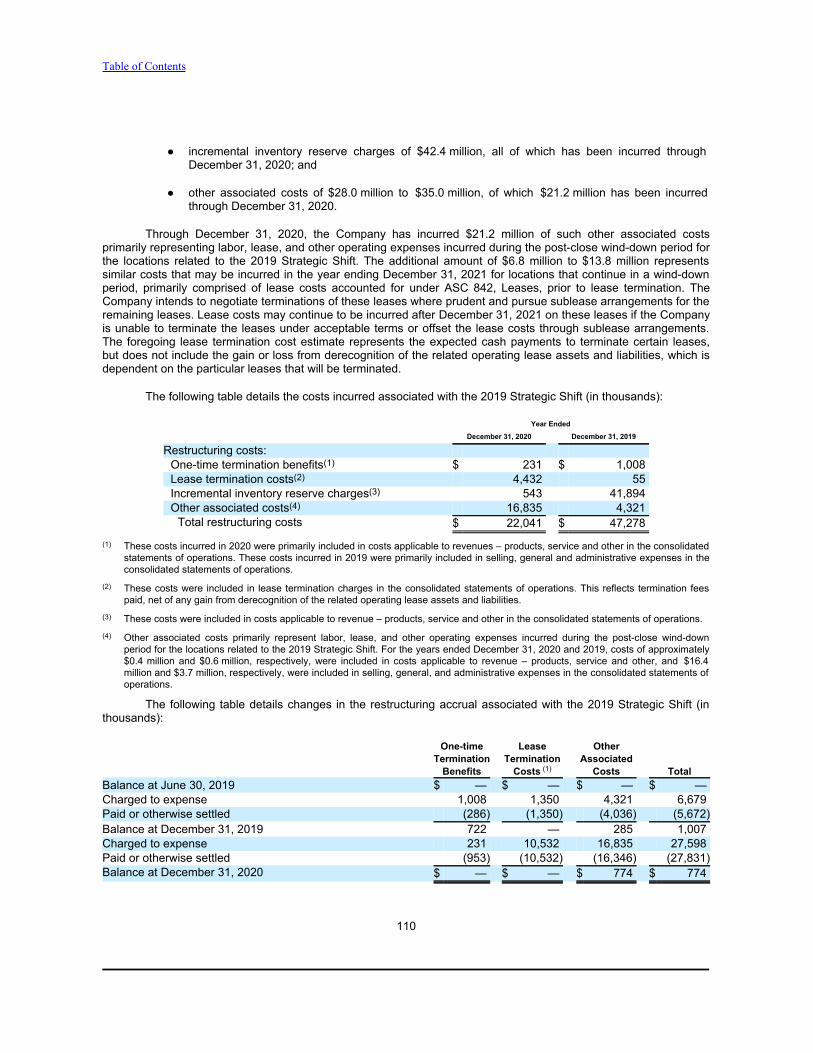
Table of Contents
110
● incremental inventory reserve charges of $42.4 million, all of which has been incurred throughDecember 31, 2020; and
● other associated costs of $28.0 million to $35.0 million, of which $21.2 million has been incurredthrough December 31, 2020.
Through December 31, 2020, the Company has incurred $21.2 million of such other associated costsprimarily representing labor, lease, and other operating expenses incurred during the post-close wind-down period forthe locations related to the 2019 Strategic Shift. The additional amount of $6.8 million to $13.8 million representssimilar costs that may be incurred in the year ending December 31, 2021 for locations that continue in a wind-downperiod, primarily comprised of lease costs accounted for under ASC 842, Leases, prior to lease termination. TheCompany intends to negotiate terminations of these leases where prudent and pursue sublease arrangements for theremaining leases. Lease costs may continue to be incurred after December 31, 2021 on these leases if the Companyis unable to terminate the leases under acceptable terms or offset the lease costs through sublease arrangements.The foregoing lease termination cost estimate represents the expected cash payments to terminate certain leases,but does not include the gain or loss from derecognition of the related operating lease assets and liabilities, which isdependent on the particular leases that will be terminated.
The following table details the costs incurred associated with the 2019 Strategic Shift (in thousands):
Year EndedDecember 31, 2020 December 31, 2019
Restructuring costs:One-time termination benefits(1) $ 231 $ 1,008Lease termination costs(2) 4,432 55Incremental inventory reserve charges(3) 543 41,894Other associated costs(4) 16,835 4,321
Total restructuring costs $ 22,041 $ 47,278(1) These costs incurred in 2020 were primarily included in costs applicable to revenues – products, service and other in the consolidated
statements of operations. These costs incurred in 2019 were primarily included in selling, general and administrative expenses in theconsolidated statements of operations.
(2) These costs were included in lease termination charges in the consolidated statements of operations. This reflects termination feespaid, net of any gain from derecognition of the related operating lease assets and liabilities.
(3) These costs were included in costs applicable to revenue – products, service and other in the consolidated statements of operations.(4) Other associated costs primarily represent labor, lease, and other operating expenses incurred during the post-close wind-down
period for the locations related to the 2019 Strategic Shift. For the years ended December 31, 2020 and 2019, costs of approximately$0.4 million and $0.6 million, respectively, were included in costs applicable to revenue – products, service and other, and $16.4million and $3.7 million, respectively, were included in selling, general, and administrative expenses in the consolidated statements ofoperations.
The following table details changes in the restructuring accrual associated with the 2019 Strategic Shift (inthousands):
One-time Lease Other Termination Termination Associated Benefits Costs (1) Costs Total
Balance at June 30, 2019 $ — $ — $ — $ —Charged to expense 1,008 1,350 4,321 6,679Paid or otherwise settled (286) (1,350) (4,036) (5,672)Balance at December 31, 2019 722 — 285 1,007Charged to expense 231 10,532 16,835 27,598Paid or otherwise settled (953) (10,532) (16,346) (27,831)Balance at December 31, 2020 $ — $ — $ 774 $ 774
Table of Contents
111
(1) Lease termination costs excludes the $1.3 million and the $6.1 million of gains from the derecognition of the operating lease assetsand liabilities relating to the terminated leases as part of the 2019 Strategic Shift for the six months ended December 31, 2019 and forthe year ended December 31, 2020, respectively.
The Company evaluated the requirements of ASC No. 205-20, Presentation of Financial Statements –Discontinued Operations relative to the 2019 Strategic Shift and determined that discontinued operations treatment isnot applicable. Accordingly, the results of operations of the locations impacted by the 2019 Strategic Shift arereported as part of continuing operations in the accompanying consolidated financial statements.
Long-lived Asset Impairment
During the year ended December 31, 2020, the Company had indicators of impairment of the long-livedassets for certain of its locations. For locations that failed the recoverability test based on an analysis of undiscountedcash flows, the Company estimated the fair value of the locations based on a discounted cash flow analysis. Afterperforming the long-lived asset impairment test for these locations, the Company determined that certain locationswithin the RV and Outdoor Retail segment had long-lived assets that were impaired. The long-lived asset impairmentcharge, subject to limitations described below, was calculated as the amount that the carrying value of the locationsexceeded the estimated fair value. The calculated long-lived asset impairment charge was allocated to each of thecategories of long-lived assets at each location pro rata based on the long-lived assets’ carrying values, except thatindividual assets cannot be impaired below their individual fair values when that fair value can be determined withoutundue cost and effort. For most of these locations, the operating lease right-of-use assets and furniture andequipment were written down to their individual fair values and the remaining impairment charge was allocated to theremaining long-lived assets up to the fair value estimated on these assets based on liquidation value estimates.
During the year ended December 31, 2020, the Company identified indicators of impairment at previouslyclosed stores in certain markets. After performing the long-lived asset impairment test using updated assumptions forthese locations, the Company determined that 19 locations within the RV and Outdoor Retail segment had long-livedassets that were impaired. The Company recorded the following long-lived asset impairment charges: $2.4 millionrelated to leasehold improvements, $2.6 million related to furniture and equipment, $1.5 million related to buildings,and $5.9 million operating lease right-of-use assets. Of the $12.4 million long-lived asset impairment charge duringthe year ended December 31, 2020, $12.3 million related to the 2019 Strategic Shift discussed above.
For the year ended December 31, 2019, the Company recorded the following long-lived asset impairmentcharges: $20.8 million related to leasehold improvements, $28.6 million related to furniture and equipment, and $16.9million operating lease right-of-use assets. Of the $66.3 million long-lived asset impairment charge during the yearended December 31, 2019, $57.4 million was related to the 2019 Strategic Shift discussed above.
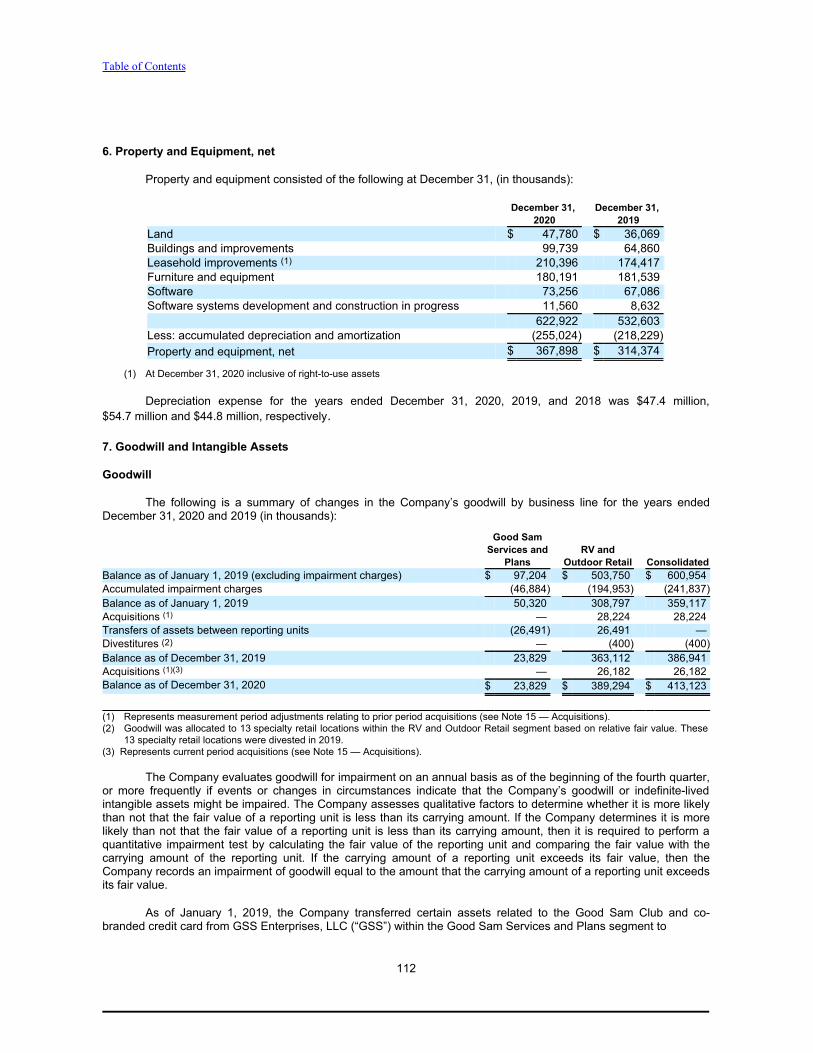
Table of Contents
112
6. Property and Equipment, net
Property and equipment consisted of the following at December 31, (in thousands):
December 31, December 31, 2020 2019
Land $ 47,780 $ 36,069Buildings and improvements 99,739 64,860Leasehold improvements (1) 210,396 174,417Furniture and equipment 180,191 181,539Software 73,256 67,086Software systems development and construction in progress 11,560 8,632
622,922 532,603Less: accumulated depreciation and amortization (255,024) (218,229)Property and equipment, net $ 367,898 $ 314,374
(1) At December 31, 2020 inclusive of right-to-use assets
Depreciation expense for the years ended December 31, 2020, 2019, and 2018 was $47.4 million,$54.7 million and $44.8 million, respectively.
7. Goodwill and Intangible Assets
Goodwill
The following is a summary of changes in the Company’s goodwill by business line for the years endedDecember 31, 2020 and 2019 (in thousands):
Good SamServices and RV and
Plans Outdoor Retail ConsolidatedBalance as of January 1, 2019 (excluding impairment charges) $ 97,204 $ 503,750 $ 600,954Accumulated impairment charges (46,884) (194,953) (241,837)Balance as of January 1, 2019 50,320 308,797 359,117Acquisitions (1) — 28,224 28,224Transfers of assets between reporting units (26,491) 26,491 —Divestitures (2) — (400) (400)Balance as of December 31, 2019 23,829 363,112 386,941Acquisitions (1)(3) — 26,182 26,182Balance as of December 31, 2020 $ 23,829 $ 389,294 $ 413,123
(1) Represents measurement period adjustments relating to prior period acquisitions (see Note 15 — Acquisitions).(2) Goodwill was allocated to 13 specialty retail locations within the RV and Outdoor Retail segment based on relative fair value. These
13 specialty retail locations were divested in 2019.(3) Represents current period acquisitions (see Note 15 — Acquisitions).
The Company evaluates goodwill for impairment on an annual basis as of the beginning of the fourth quarter,or more frequently if events or changes in circumstances indicate that the Company’s goodwill or indefinite-livedintangible assets might be impaired. The Company assesses qualitative factors to determine whether it is more likelythan not that the fair value of a reporting unit is less than its carrying amount. If the Company determines it is morelikely than not that the fair value of a reporting unit is less than its carrying amount, then it is required to perform aquantitative impairment test by calculating the fair value of the reporting unit and comparing the fair value with thecarrying amount of the reporting unit. If the carrying amount of a reporting unit exceeds its fair value, then theCompany records an impairment of goodwill equal to the amount that the carrying amount of a reporting unit exceedsits fair value.
As of January 1, 2019, the Company transferred certain assets related to the Good Sam Club and co-branded credit card from GSS Enterprises, LLC (“GSS”) within the Good Sam Services and Plans segment to
Table of Contents
113
CWI, Inc. (“CWI”) within the RV and Outdoor Retail segment. This resulted in a transfer of $26.5 million of goodwillfrom the Good Sam Services and Plans segment to the RV and Outdoor Retail segment based on relative fair valueas of January 1, 2019 of the portion of the reporting unit transferred.
During the three months ended March 31, 2020, the Company determined that a triggering event for aninterim goodwill impairment test of its RV and Outdoor Retail reporting unit had occurred as a result of the decline inthe market price of the Company’s Class A common stock and the potential impact of COVID-19 on the Company’sbusiness. As a result of the interim goodwill impairment test, the Company determined that the fair value of the RVand Outdoor Retail reporting unit was substantially above its respective carrying amount, therefore, no goodwillimpairment was recorded.
In the fourth quarter of 2020 and 2019, the Company performed its annual goodwill impairment test of the RVand Outdoor Retail, the Good Sam Show, and GSS Enterprise reporting units. The RV and Outdoor Retail reportingunit is comprised of the entire RV and Outdoor Retail segment. The Good Sam Show and GSS Enterprise reportingunits are comprised of a portion of the Good Sam Services and Plans Segment. These annual goodwill impairmenttests resulted in the determination that the estimated fair value of these reporting units exceeded their carrying value.Therefore, no impairment charge was recorded during the years ended December 31, 2020 and 2019. The Companyestimated the fair value of these reporting units using a combination of the guideline public company method underthe market approach and the discounted cash flow analysis method under the income approach.
In the fourth quarter of 2018, the Company performed its annual goodwill impairment test, which resulted inthe determination that the carrying value of the former Retail reporting unit, which was comprised of the entire Retailsegment as previously reported, exceeded its estimated fair value by an amount that exceeded the reporting unit’sgoodwill balance. The excess of the carrying value over the estimated fair value of this reporting unit was primarilydue to a decline in segment income leading to lower expected future cash flows for this reporting unit. The Companyrecorded an impairment charge of $40.0 million in the fourth quarter of 2018 related to this reporting unit. The formerRetail reporting unit goodwill was reduced to zero.
Additionally in the fourth quarter of 2018, the Company performed its annual goodwill impairment test of theDealership reporting unit, which was comprised of the entire former Dealership segment as previously reported andthe Good Sam Show and GSS Enterprise reporting units, which was comprised a portion of the Good Sam Servicesand Plans segment as previously reported. The Company did not record any impairment of goodwill for theDealership, Good Sam Show and GSS Enterprise reporting units during the year ended December 31, 2018.
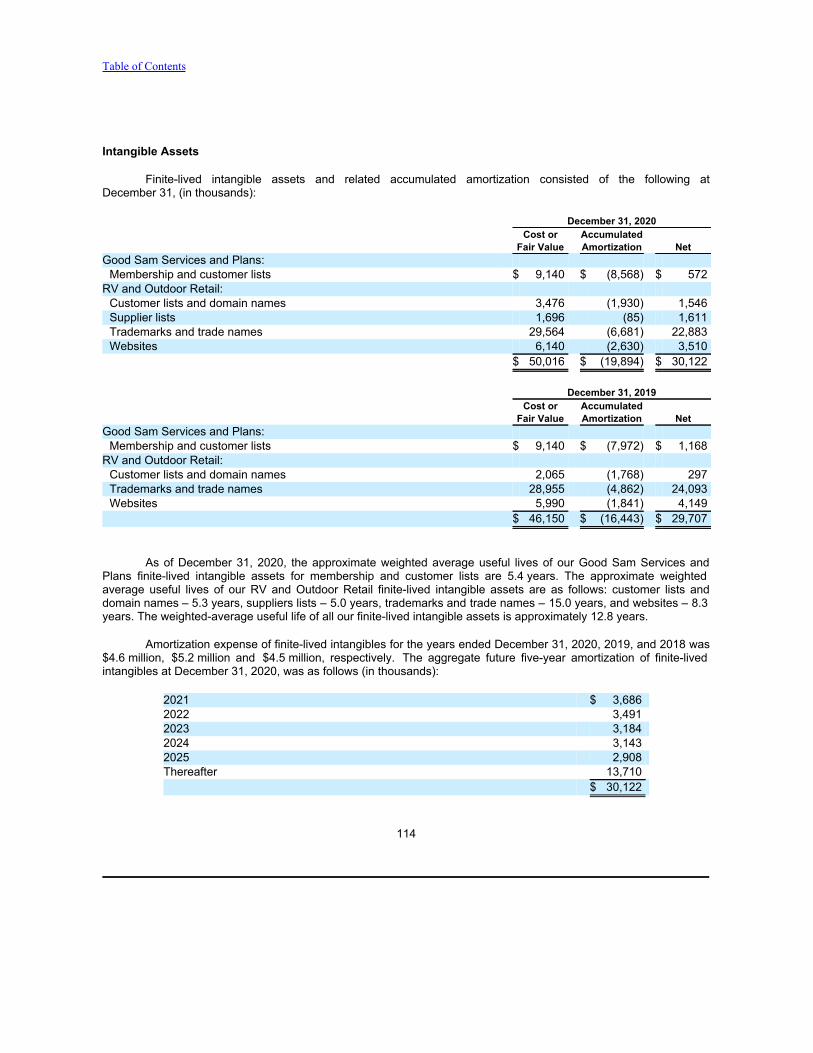
Table of Contents
114
Intangible Assets
Finite-lived intangible assets and related accumulated amortization consisted of the following atDecember 31, (in thousands):
December 31, 2020Cost or Accumulated
Fair Value Amortization NetGood Sam Services and Plans:
Membership and customer lists $ 9,140 $ (8,568) $ 572RV and Outdoor Retail:
Customer lists and domain names 3,476 (1,930) 1,546Supplier lists 1,696 (85) 1,611Trademarks and trade names 29,564 (6,681) 22,883Websites 6,140 (2,630) 3,510
$ 50,016 $ (19,894) $ 30,122
December 31, 2019Cost or Accumulated
Fair Value Amortization NetGood Sam Services and Plans:
Membership and customer lists $ 9,140 $ (7,972) $ 1,168RV and Outdoor Retail:
Customer lists and domain names 2,065 (1,768) 297Trademarks and trade names 28,955 (4,862) 24,093Websites 5,990 (1,841) 4,149
$ 46,150 $ (16,443) $ 29,707
As of December 31, 2020, the approximate weighted average useful lives of our Good Sam Services andPlans finite-lived intangible assets for membership and customer lists are 5.4 years. The approximate weightedaverage useful lives of our RV and Outdoor Retail finite-lived intangible assets are as follows: customer lists anddomain names – 5.3 years, suppliers lists – 5.0 years, trademarks and trade names – 15.0 years, and websites – 8.3years. The weighted-average useful life of all our finite-lived intangible assets is approximately 12.8 years.
Amortization expense of finite-lived intangibles for the years ended December 31, 2020, 2019, and 2018 was$4.6 million, $5.2 million and $4.5 million, respectively. The aggregate future five-year amortization of finite-livedintangibles at December 31, 2020, was as follows (in thousands):
2021 $ 3,6862022 3,4912023 3,1842024 3,1432025 2,908Thereafter 13,710
$ 30,122
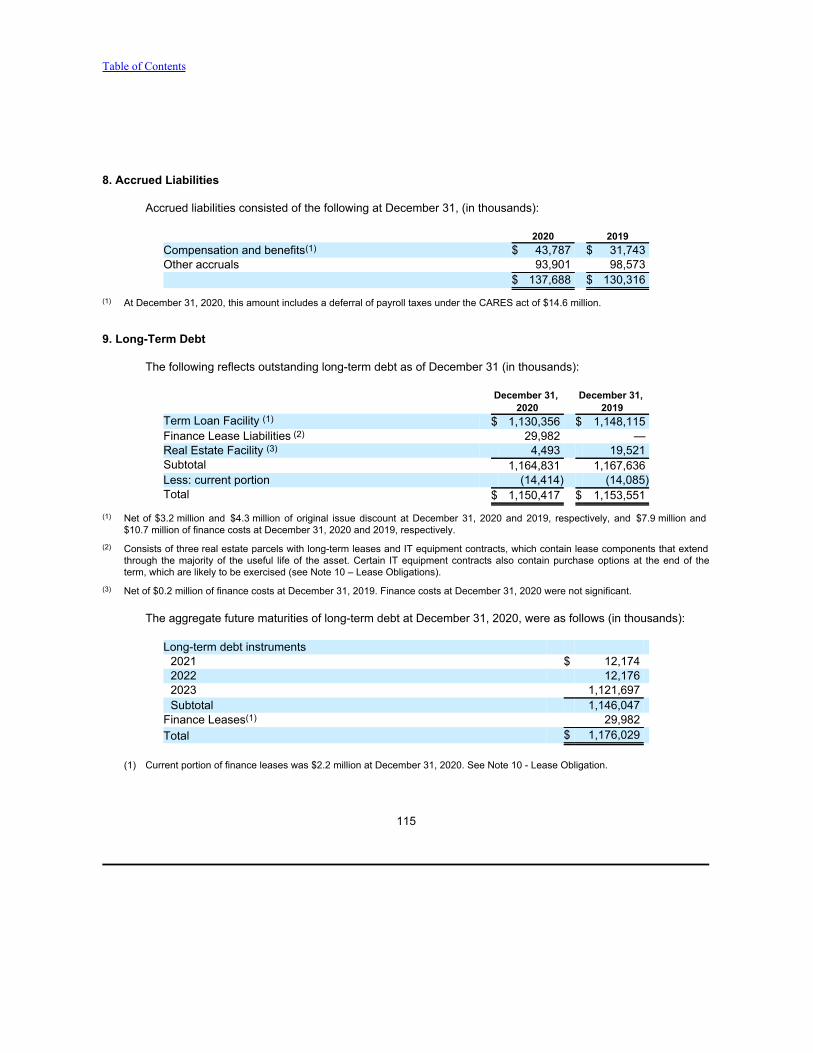
Table of Contents
115
8. Accrued Liabilities
Accrued liabilities consisted of the following at December 31, (in thousands):
2020 2019Compensation and benefits(1) $ 43,787 $ 31,743Other accruals 93,901 98,573
$ 137,688 $ 130,316(1) At December 31, 2020, this amount includes a deferral of payroll taxes under the CARES act of $14.6 million.
9. Long-Term Debt
The following reflects outstanding long-term debt as of December 31 (in thousands):
December 31, December 31, 2020 2019
Term Loan Facility (1) $ 1,130,356 $ 1,148,115Finance Lease Liabilities (2) 29,982 —Real Estate Facility (3) 4,493 19,521Subtotal 1,164,831 1,167,636Less: current portion (14,414) (14,085)Total $ 1,150,417 $ 1,153,551
(1) Net of $3.2 million and $4.3 million of original issue discount at December 31, 2020 and 2019, respectively, and $7.9 million and$10.7 million of finance costs at December 31, 2020 and 2019, respectively.
(2) Consists of three real estate parcels with long-term leases and IT equipment contracts, which contain lease components that extendthrough the majority of the useful life of the asset. Certain IT equipment contracts also contain purchase options at the end of theterm, which are likely to be exercised (see Note 10 – Lease Obligations).
(3) Net of $0.2 million of finance costs at December 31, 2019. Finance costs at December 31, 2020 were not significant.
The aggregate future maturities of long-term debt at December 31, 2020, were as follows (in thousands):
Long-term debt instruments 2021 $ 12,1742022 12,1762023 1,121,697Subtotal 1,146,047
Finance Leases(1) 29,982Total $ 1,176,029
(1) Current portion of finance leases was $2.2 million at December 31, 2020. See Note 10 - Lease Obligation.
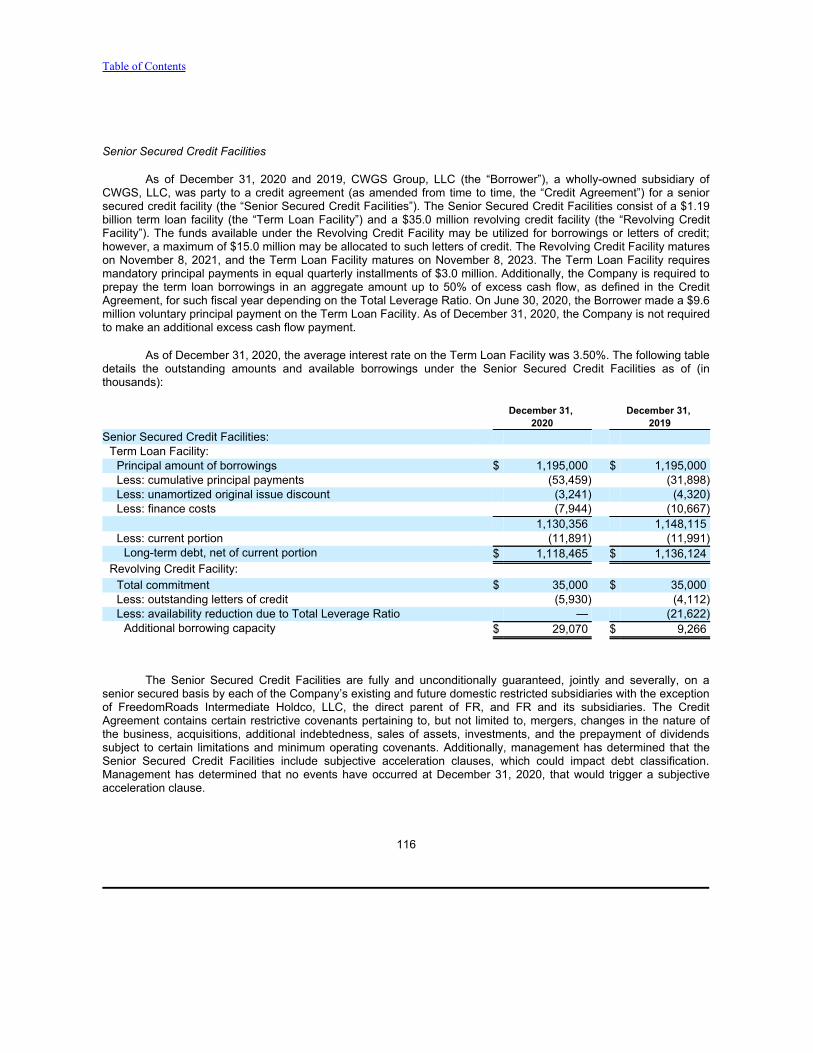
Table of Contents
116
Senior Secured Credit Facilities
As of December 31, 2020 and 2019, CWGS Group, LLC (the “Borrower”), a wholly-owned subsidiary ofCWGS, LLC, was party to a credit agreement (as amended from time to time, the “Credit Agreement”) for a seniorsecured credit facility (the “Senior Secured Credit Facilities”). The Senior Secured Credit Facilities consist of a $1.19billion term loan facility (the “Term Loan Facility”) and a $35.0 million revolving credit facility (the “Revolving CreditFacility”). The funds available under the Revolving Credit Facility may be utilized for borrowings or letters of credit;however, a maximum of $15.0 million may be allocated to such letters of credit. The Revolving Credit Facility matureson November 8, 2021, and the Term Loan Facility matures on November 8, 2023. The Term Loan Facility requiresmandatory principal payments in equal quarterly installments of $3.0 million. Additionally, the Company is required toprepay the term loan borrowings in an aggregate amount up to 50% of excess cash flow, as defined in the CreditAgreement, for such fiscal year depending on the Total Leverage Ratio. On June 30, 2020, the Borrower made a $9.6million voluntary principal payment on the Term Loan Facility. As of December 31, 2020, the Company is not requiredto make an additional excess cash flow payment.
As of December 31, 2020, the average interest rate on the Term Loan Facility was 3.50%. The following tabledetails the outstanding amounts and available borrowings under the Senior Secured Credit Facilities as of (inthousands):
December 31, December 31, 2020 2019
Senior Secured Credit Facilities:Term Loan Facility:
Principal amount of borrowings $ 1,195,000 $ 1,195,000Less: cumulative principal payments (53,459) (31,898)Less: unamortized original issue discount (3,241) (4,320)Less: finance costs (7,944) (10,667)
1,130,356 1,148,115Less: current portion (11,891) (11,991)
Long-term debt, net of current portion $ 1,118,465 $ 1,136,124Revolving Credit Facility:
Total commitment $ 35,000 $ 35,000Less: outstanding letters of credit (5,930) (4,112)Less: availability reduction due to Total Leverage Ratio — (21,622)
Additional borrowing capacity $ 29,070 $ 9,266
The Senior Secured Credit Facilities are fully and unconditionally guaranteed, jointly and severally, on asenior secured basis by each of the Company’s existing and future domestic restricted subsidiaries with the exceptionof FreedomRoads Intermediate Holdco, LLC, the direct parent of FR, and FR and its subsidiaries. The CreditAgreement contains certain restrictive covenants pertaining to, but not limited to, mergers, changes in the nature ofthe business, acquisitions, additional indebtedness, sales of assets, investments, and the prepayment of dividendssubject to certain limitations and minimum operating covenants. Additionally, management has determined that theSenior Secured Credit Facilities include subjective acceleration clauses, which could impact debt classification.Management has determined that no events have occurred at December 31, 2020, that would trigger a subjectiveacceleration clause.
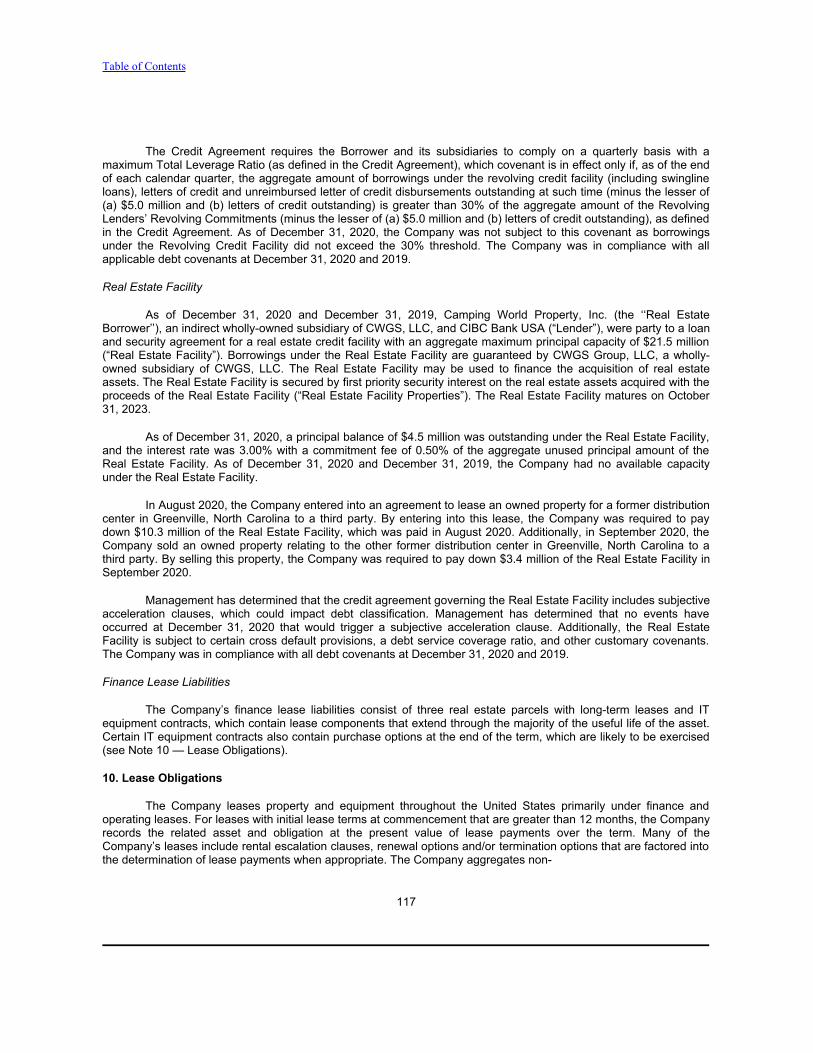
Table of Contents
117
The Credit Agreement requires the Borrower and its subsidiaries to comply on a quarterly basis with amaximum Total Leverage Ratio (as defined in the Credit Agreement), which covenant is in effect only if, as of the endof each calendar quarter, the aggregate amount of borrowings under the revolving credit facility (including swinglineloans), letters of credit and unreimbursed letter of credit disbursements outstanding at such time (minus the lesser of(a) $5.0 million and (b) letters of credit outstanding) is greater than 30% of the aggregate amount of the RevolvingLenders’ Revolving Commitments (minus the lesser of (a) $5.0 million and (b) letters of credit outstanding), as definedin the Credit Agreement. As of December 31, 2020, the Company was not subject to this covenant as borrowingsunder the Revolving Credit Facility did not exceed the 30% threshold. The Company was in compliance with allapplicable debt covenants at December 31, 2020 and 2019.
Real Estate Facility
As of December 31, 2020 and December 31, 2019, Camping World Property, Inc. (the ‘‘Real EstateBorrower’’), an indirect wholly-owned subsidiary of CWGS, LLC, and CIBC Bank USA (“Lender”), were party to a loanand security agreement for a real estate credit facility with an aggregate maximum principal capacity of $21.5 million(“Real Estate Facility”). Borrowings under the Real Estate Facility are guaranteed by CWGS Group, LLC, a wholly-owned subsidiary of CWGS, LLC. The Real Estate Facility may be used to finance the acquisition of real estateassets. The Real Estate Facility is secured by first priority security interest on the real estate assets acquired with theproceeds of the Real Estate Facility (“Real Estate Facility Properties”). The Real Estate Facility matures on October31, 2023.
As of December 31, 2020, a principal balance of $4.5 million was outstanding under the Real Estate Facility,and the interest rate was 3.00% with a commitment fee of 0.50% of the aggregate unused principal amount of theReal Estate Facility. As of December 31, 2020 and December 31, 2019, the Company had no available capacityunder the Real Estate Facility.
In August 2020, the Company entered into an agreement to lease an owned property for a former distributioncenter in Greenville, North Carolina to a third party. By entering into this lease, the Company was required to paydown $10.3 million of the Real Estate Facility, which was paid in August 2020. Additionally, in September 2020, theCompany sold an owned property relating to the other former distribution center in Greenville, North Carolina to athird party. By selling this property, the Company was required to pay down $3.4 million of the Real Estate Facility inSeptember 2020.
Management has determined that the credit agreement governing the Real Estate Facility includes subjectiveacceleration clauses, which could impact debt classification. Management has determined that no events haveoccurred at December 31, 2020 that would trigger a subjective acceleration clause. Additionally, the Real EstateFacility is subject to certain cross default provisions, a debt service coverage ratio, and other customary covenants.The Company was in compliance with all debt covenants at December 31, 2020 and 2019.
Finance Lease Liabilities
The Company’s finance lease liabilities consist of three real estate parcels with long-term leases and ITequipment contracts, which contain lease components that extend through the majority of the useful life of the asset.Certain IT equipment contracts also contain purchase options at the end of the term, which are likely to be exercised(see Note 10 — Lease Obligations).
10. Lease Obligations
The Company leases property and equipment throughout the United States primarily under finance andoperating leases. For leases with initial lease terms at commencement that are greater than 12 months, the Companyrecords the related asset and obligation at the present value of lease payments over the term. Many of theCompany’s leases include rental escalation clauses, renewal options and/or termination options that are factored intothe determination of lease payments when appropriate. The Company aggregates non-
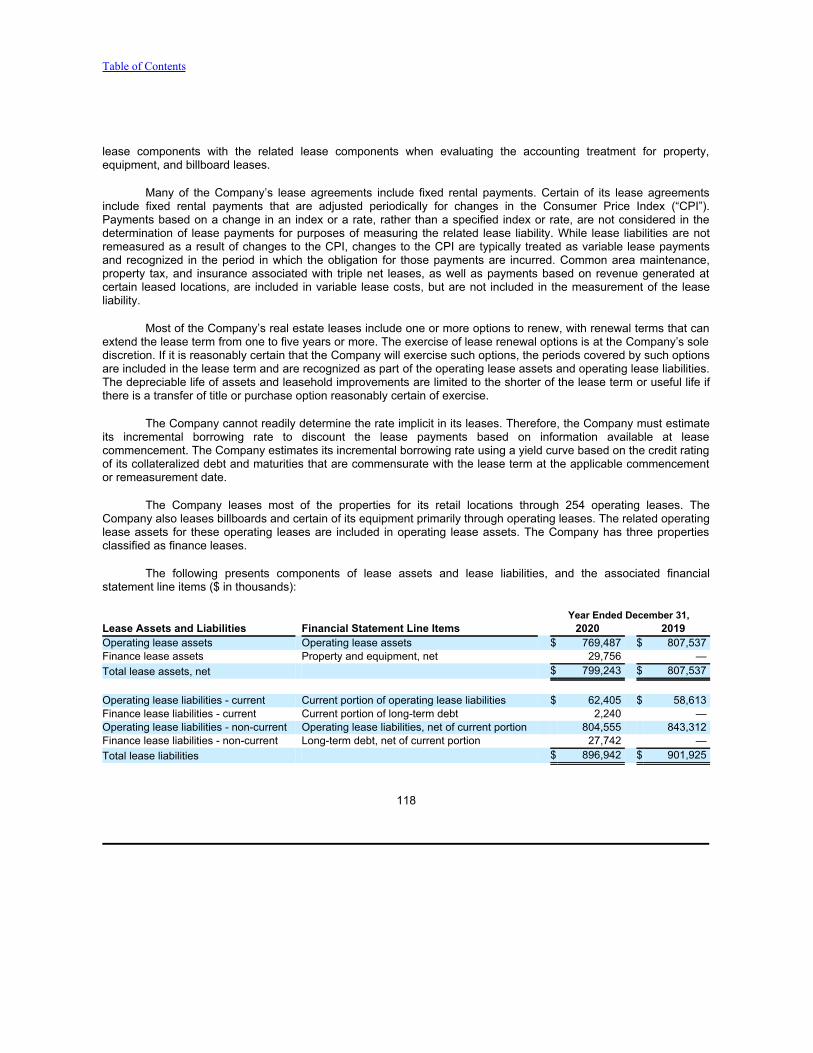
Table of Contents
118
lease components with the related lease components when evaluating the accounting treatment for property,equipment, and billboard leases.
Many of the Company’s lease agreements include fixed rental payments. Certain of its lease agreementsinclude fixed rental payments that are adjusted periodically for changes in the Consumer Price Index (“CPI”).Payments based on a change in an index or a rate, rather than a specified index or rate, are not considered in thedetermination of lease payments for purposes of measuring the related lease liability. While lease liabilities are notremeasured as a result of changes to the CPI, changes to the CPI are typically treated as variable lease paymentsand recognized in the period in which the obligation for those payments are incurred. Common area maintenance,property tax, and insurance associated with triple net leases, as well as payments based on revenue generated atcertain leased locations, are included in variable lease costs, but are not included in the measurement of the leaseliability.
Most of the Company’s real estate leases include one or more options to renew, with renewal terms that canextend the lease term from one to five years or more. The exercise of lease renewal options is at the Company’s solediscretion. If it is reasonably certain that the Company will exercise such options, the periods covered by such optionsare included in the lease term and are recognized as part of the operating lease assets and operating lease liabilities.The depreciable life of assets and leasehold improvements are limited to the shorter of the lease term or useful life ifthere is a transfer of title or purchase option reasonably certain of exercise.
The Company cannot readily determine the rate implicit in its leases. Therefore, the Company must estimateits incremental borrowing rate to discount the lease payments based on information available at leasecommencement. The Company estimates its incremental borrowing rate using a yield curve based on the credit ratingof its collateralized debt and maturities that are commensurate with the lease term at the applicable commencementor remeasurement date.
The Company leases most of the properties for its retail locations through 254 operating leases. TheCompany also leases billboards and certain of its equipment primarily through operating leases. The related operatinglease assets for these operating leases are included in operating lease assets. The Company has three propertiesclassified as finance leases.
The following presents components of lease assets and lease liabilities, and the associated financialstatement line items ($ in thousands):
Year Ended December 31, Lease Assets and Liabilities Financial Statement Line Items 2020 2019Operating lease assets Operating lease assets $ 769,487 $ 807,537Finance lease assets Property and equipment, net 29,756 —Total lease assets, net $ 799,243 $ 807,537
Operating lease liabilities - current Current portion of operating lease liabilities $ 62,405 $ 58,613Finance lease liabilities - current Current portion of long-term debt 2,240 —Operating lease liabilities - non-current Operating lease liabilities, net of current portion 804,555 843,312Finance lease liabilities - non-current Long-term debt, net of current portion 27,742 —Total lease liabilities $ 896,942 $ 901,925
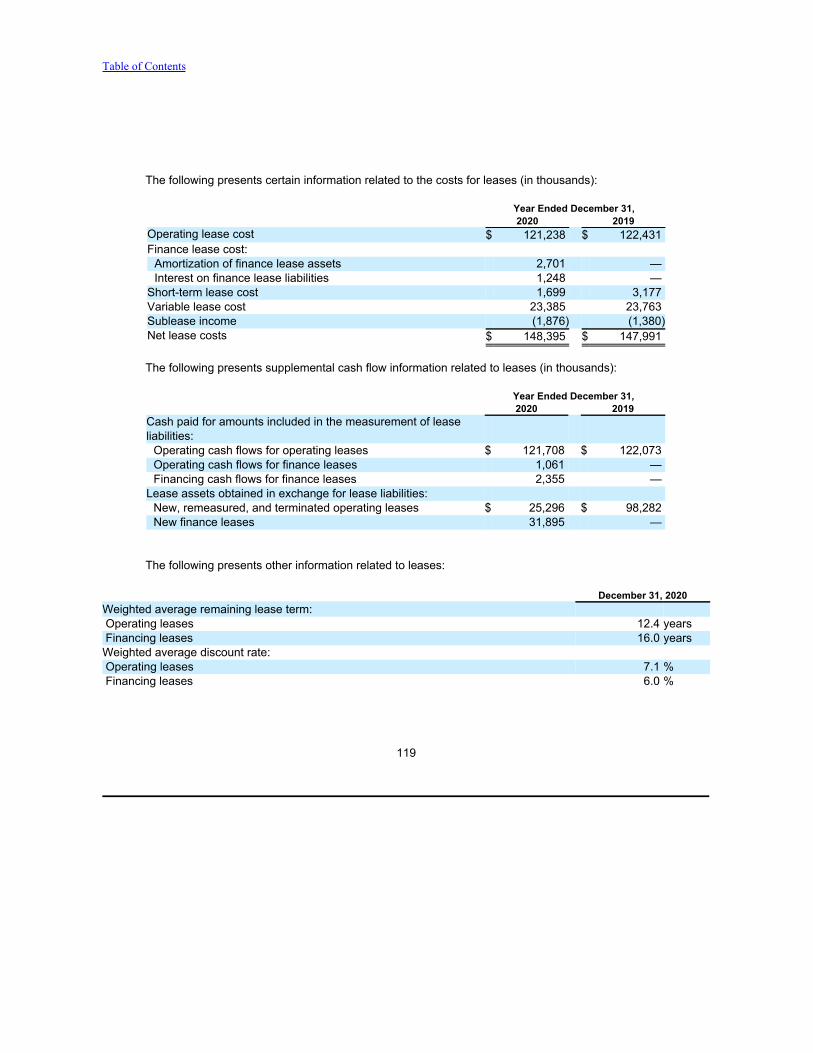
Table of Contents
119
The following presents certain information related to the costs for leases (in thousands):
Year Ended December 31, 2020 2019
Operating lease cost $ 121,238 $ 122,431Finance lease cost:
Amortization of finance lease assets 2,701 —Interest on finance lease liabilities 1,248 —
Short-term lease cost 1,699 3,177Variable lease cost 23,385 23,763Sublease income (1,876) (1,380)Net lease costs $ 148,395 $ 147,991
The following presents supplemental cash flow information related to leases (in thousands):
Year Ended December 31, 2020 2019
Cash paid for amounts included in the measurement of leaseliabilities:
Operating cash flows for operating leases $ 121,708 $ 122,073Operating cash flows for finance leases 1,061 —Financing cash flows for finance leases 2,355 —
Lease assets obtained in exchange for lease liabilities:New, remeasured, and terminated operating leases $ 25,296 $ 98,282New finance leases 31,895 —
The following presents other information related to leases:
December 31, 2020Weighted average remaining lease term: Operating leases 12.4 years Financing leases 16.0 yearsWeighted average discount rate: Operating leases 7.1 % Financing leases 6.0 %
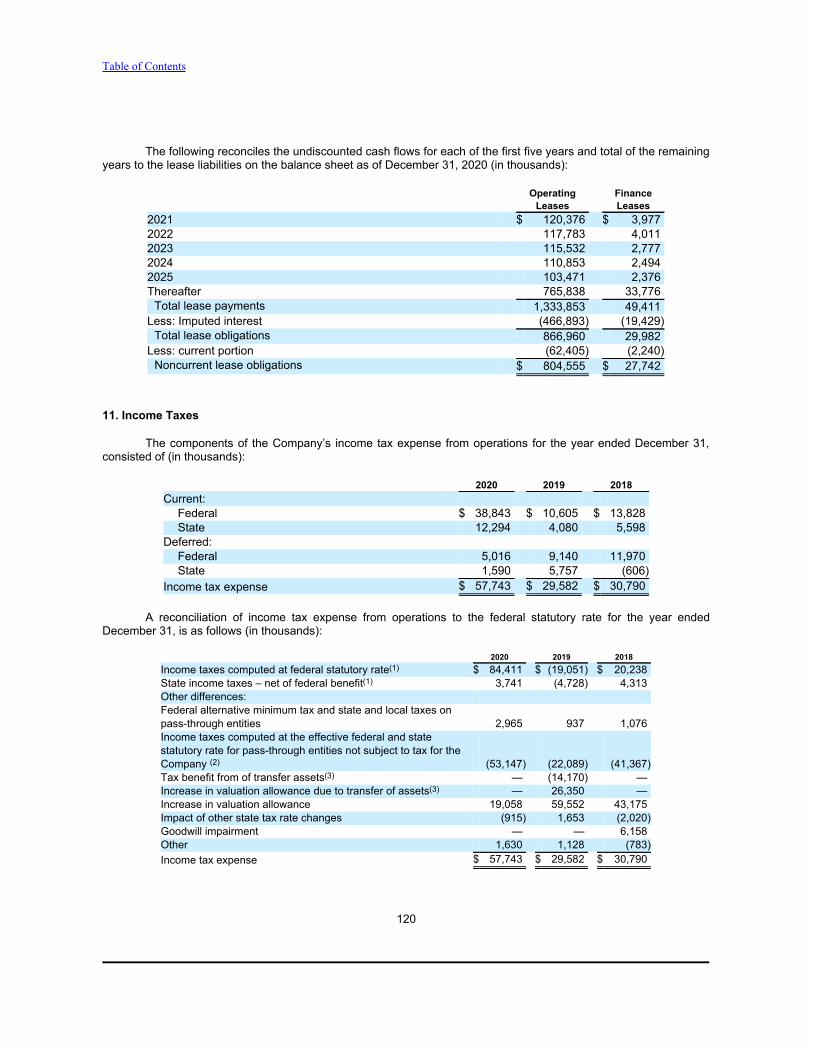
Table of Contents
120
The following reconciles the undiscounted cash flows for each of the first five years and total of the remainingyears to the lease liabilities on the balance sheet as of December 31, 2020 (in thousands):
Operating Finance Leases Leases
2021 $ 120,376 $ 3,9772022 117,783 4,0112023 115,532 2,7772024 110,853 2,4942025 103,471 2,376Thereafter 765,838 33,776
Total lease payments 1,333,853 49,411Less: Imputed interest (466,893) (19,429)
Total lease obligations 866,960 29,982Less: current portion (62,405) (2,240)
Noncurrent lease obligations $ 804,555 $ 27,742
11. Income Taxes
The components of the Company’s income tax expense from operations for the year ended December 31,consisted of (in thousands):
2020 2019 2018Current:
Federal $ 38,843 $ 10,605 $ 13,828State 12,294 4,080 5,598
Deferred:Federal 5,016 9,140 11,970State 1,590 5,757 (606)
Income tax expense $ 57,743 $ 29,582 $ 30,790
A reconciliation of income tax expense from operations to the federal statutory rate for the year endedDecember 31, is as follows (in thousands):
2020 2019 2018Income taxes computed at federal statutory rate(1) $ 84,411 $ (19,051) $ 20,238State income taxes – net of federal benefit(1) 3,741 (4,728) 4,313Other differences:Federal alternative minimum tax and state and local taxes onpass-through entities 2,965 937 1,076Income taxes computed at the effective federal and statestatutory rate for pass-through entities not subject to tax for theCompany (2) (53,147) (22,089) (41,367)Tax benefit from of transfer assets(3) — (14,170) —Increase in valuation allowance due to transfer of assets(3) — 26,350 —Increase in valuation allowance 19,058 59,552 43,175Impact of other state tax rate changes (915) 1,653 (2,020)Goodwill impairment — — 6,158Other 1,630 1,128 (783)Income tax expense $ 57,743 $ 29,582 $ 30,790
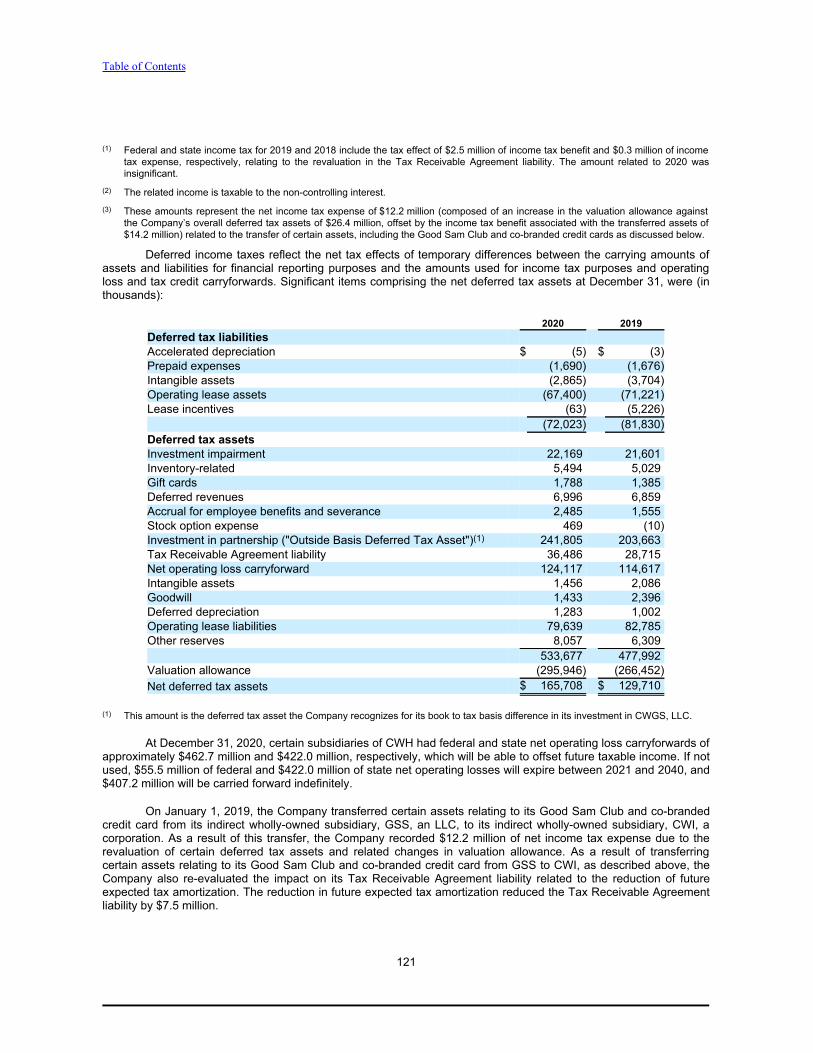
Table of Contents
121
(1) Federal and state income tax for 2019 and 2018 include the tax effect of $2.5 million of income tax benefit and $0.3 million of incometax expense, respectively, relating to the revaluation in the Tax Receivable Agreement liability. The amount related to 2020 wasinsignificant.
(2) The related income is taxable to the non-controlling interest.(3) These amounts represent the net income tax expense of $12.2 million (composed of an increase in the valuation allowance against
the Company’s overall deferred tax assets of $26.4 million, offset by the income tax benefit associated with the transferred assets of$14.2 million) related to the transfer of certain assets, including the Good Sam Club and co-branded credit cards as discussed below.
Deferred income taxes reflect the net tax effects of temporary differences between the carrying amounts ofassets and liabilities for financial reporting purposes and the amounts used for income tax purposes and operatingloss and tax credit carryforwards. Significant items comprising the net deferred tax assets at December 31, were (inthousands):
2020 2019Deferred tax liabilitiesAccelerated depreciation $ (5) $ (3)Prepaid expenses (1,690) (1,676)Intangible assets (2,865) (3,704)Operating lease assets (67,400) (71,221)Lease incentives (63) (5,226)
(72,023) (81,830)Deferred tax assetsInvestment impairment 22,169 21,601Inventory-related 5,494 5,029Gift cards 1,788 1,385Deferred revenues 6,996 6,859Accrual for employee benefits and severance 2,485 1,555Stock option expense 469 (10)Investment in partnership ("Outside Basis Deferred Tax Asset")(1) 241,805 203,663Tax Receivable Agreement liability 36,486 28,715Net operating loss carryforward 124,117 114,617Intangible assets 1,456 2,086Goodwill 1,433 2,396Deferred depreciation 1,283 1,002Operating lease liabilities 79,639 82,785Other reserves 8,057 6,309
533,677 477,992Valuation allowance (295,946) (266,452)Net deferred tax assets $ 165,708 $ 129,710
(1) This amount is the deferred tax asset the Company recognizes for its book to tax basis difference in its investment in CWGS, LLC.
At December 31, 2020, certain subsidiaries of CWH had federal and state net operating loss carryforwards ofapproximately $462.7 million and $422.0 million, respectively, which will be able to offset future taxable income. If notused, $55.5 million of federal and $422.0 million of state net operating losses will expire between 2021 and 2040, and$407.2 million will be carried forward indefinitely.
On January 1, 2019, the Company transferred certain assets relating to its Good Sam Club and co-brandedcredit card from its indirect wholly-owned subsidiary, GSS, an LLC, to its indirect wholly-owned subsidiary, CWI, acorporation. As a result of this transfer, the Company recorded $12.2 million of net income tax expense due to therevaluation of certain deferred tax assets and related changes in valuation allowance. As a result of transferringcertain assets relating to its Good Sam Club and co-branded credit card from GSS to CWI, as described above, theCompany also re-evaluated the impact on its Tax Receivable Agreement liability related to the reduction of futureexpected tax amortization. The reduction in future expected tax amortization reduced the Tax Receivable Agreementliability by $7.5 million.
Table of Contents
122
As further described in Note 1 — Summary of Significant Accounting Policies — COVID-19, in response tothe COVID-19 pandemic, many governments have enacted or are contemplating measures to provide aid andeconomic stimulus. These measures may include deferring the due dates of income tax and payroll tax payments orother changes to their income and non-income-based tax laws. The Coronavirus Aid, Relief, and Economic SecurityAct (the “CARES Act”), which was enacted on March 27, 2020 in the U.S., includes measures to assist companies,including temporary changes to income and non-income-based tax laws. For the year ended December 31, 2020,there were no material impacts to the Company’s consolidated financial statements as it relates to COVID-19measures other than the deferral of non-income-based payroll taxes under the CARES Act of $29.2 million as ofDecember 31, 2020, of which $14.6 million was included in other current liabilities and $14.6 million was included inother long-term liabilities in the consolidated balance sheets.
At December 31, 2020, the Company determined that all of its deferred tax assets (except those of CampingWorld Inc. (“CW”) and the Outside Basis Deferred Tax Asset discussed below) are more likely than not to be realized.The valuation allowance for CW increased by $19.7 million in the year ended December 31, 2020, compared to anincrease of $79.7 million in the year ended December 31, 2019, primarily as a result of increased operating lossesincurred during 2020. Since it was determined that CW would not have sufficient taxable income in the current orcarryforward periods under the tax law to realize the future tax benefits of its deferred tax assets, it continues tomaintain a full valuation allowance. The Company maintains a partial valuation allowance against the Outside BasisDeferred Tax Asset pertaining to the portion that is not amortizable for tax purposes, since the Company would likelyonly realize the non-amortizable portion of the Outside Basis Deferred Tax Asset if the investment in CWGS, LLC wasdivested. The partial valuation allowance for the Outside Basis Deferred Tax Asset increased by $9.8 million in theyear ended December 31, 2020, compared to an increase of $6.2 million in the year ended December 31, 2019. Theincrease in the year ended December 31, 2020 was primarily the result of increased ownership, net of a reduction inenacted state income tax rates. The Company and its subsidiaries file U.S. federal income tax returns and tax returnsin various states. The Company is not under any material audits in any jurisdiction. With few exceptions, theCompany is no longer subject to U.S. federal, state, and local income tax examinations by tax authorities for yearsbefore 2017.
As of December 31, 2020 and 2019, the Company recorded $2.7 million and $0.3 million, respectively,related to uncertain tax positions. The Company does not expect the total amount of unrecognized tax benefits tosignificantly change in the next 12 months.
The Company is party to a tax receivable agreement (the “Tax Receivable Agreement”) that provides for thepayment by the Company to the Continuing Equity Owners and Crestview Partners II GP, L.P. of 85% of the amountof tax benefits, if any, the Company actually realizes, or in some circumstances is deemed to realize, as a result of (i)increases in the tax basis from the purchase of common units from Crestview Partners II GP, L.P. in exchange forClass A common stock in connection with the consummation of the IPO and the related transactions and any futureredemptions that are funded by the Company and any future redemptions or exchanges of common units byContinuing Equity Owners as described above and (ii) certain other tax benefits attributable to payments made underthe Tax Receivable Agreement. The above payments are predicated on CWGS, LLC making an election underSection 754 of the Internal Revenue Code effective for each tax year in which a redemption or exchange (including adeemed exchange) of common units for cash or stock occur. These tax benefit payments are not conditioned uponone or more of the Continuing Equity Owners or Crestview Partners II GP, L.P. maintaining a continued ownershipinterest in CWGS, LLC. In general, the Continuing Equity Owners’ or Crestview Partners II GP, L.P.’s rights under theTax Receivable Agreement are assignable, including to transferees of its common units in CWGS, LLC (other thanthe Company as transferee pursuant to a redemption or exchange of common units in CWGS, LLC). The Companyexpects to benefit from the remaining 15% of the tax benefits, if any, which may be realized. During the twelvemonths ended December 31, 2020 and 2019, 4,852,497 and 5,725 common units in CWGS, LLC, respectively, wereexchanged for Class A common stock subject to the provisions of the Tax Receivable Agreement. The Companyrecognized a liability for the Tax Receivable Agreement payments due to those parties that redeemed common units,representing 85% of the aggregate tax benefits the Company expects to realize from the tax basis increases relatedto the exchange, after concluding it was probable that the Tax Receivable Agreement payments would be paid basedon estimates of future taxable income. As of December 31, 2020, and December 31, 2019, the amount of TaxReceivable Agreement payments due under the Tax Receivable Agreement was $145.9 million and $114.8
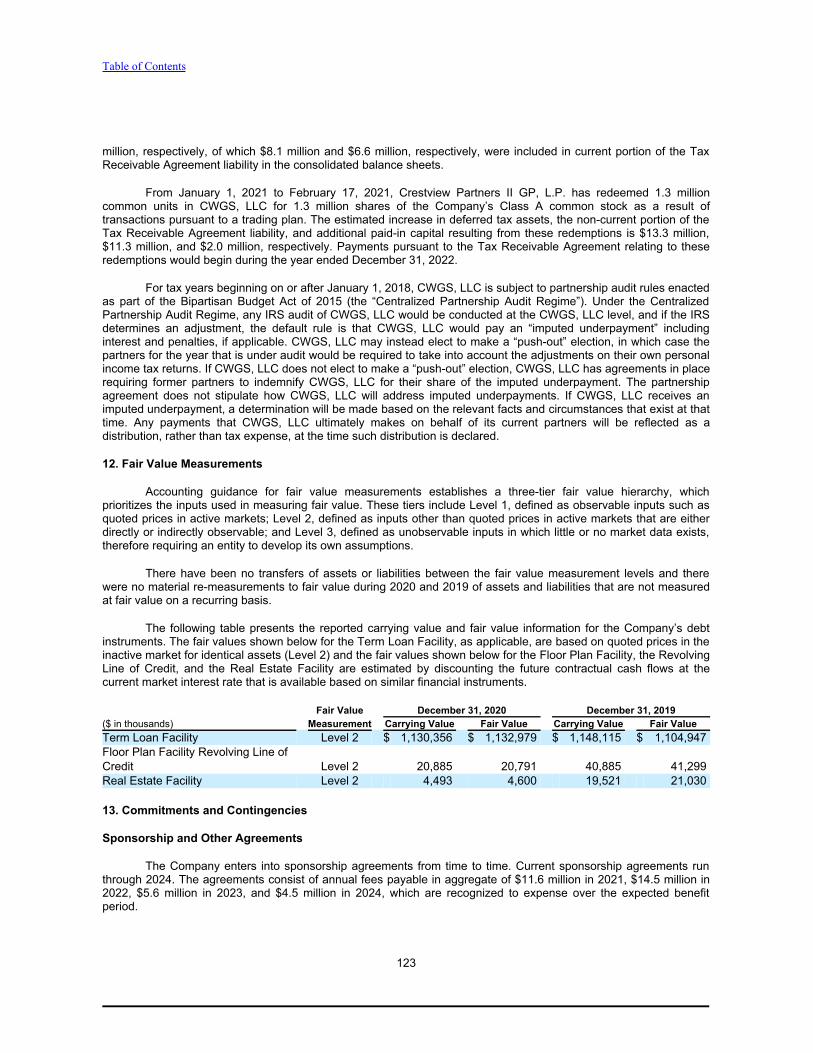
Table of Contents
123
million, respectively, of which $8.1 million and $6.6 million, respectively, were included in current portion of the TaxReceivable Agreement liability in the consolidated balance sheets.
From January 1, 2021 to February 17, 2021, Crestview Partners II GP, L.P. has redeemed 1.3 millioncommon units in CWGS, LLC for 1.3 million shares of the Company’s Class A common stock as a result oftransactions pursuant to a trading plan. The estimated increase in deferred tax assets, the non-current portion of theTax Receivable Agreement liability, and additional paid-in capital resulting from these redemptions is $13.3 million,$11.3 million, and $2.0 million, respectively. Payments pursuant to the Tax Receivable Agreement relating to theseredemptions would begin during the year ended December 31, 2022.
For tax years beginning on or after January 1, 2018, CWGS, LLC is subject to partnership audit rules enactedas part of the Bipartisan Budget Act of 2015 (the “Centralized Partnership Audit Regime”). Under the CentralizedPartnership Audit Regime, any IRS audit of CWGS, LLC would be conducted at the CWGS, LLC level, and if the IRSdetermines an adjustment, the default rule is that CWGS, LLC would pay an “imputed underpayment” includinginterest and penalties, if applicable. CWGS, LLC may instead elect to make a “push-out” election, in which case thepartners for the year that is under audit would be required to take into account the adjustments on their own personalincome tax returns. If CWGS, LLC does not elect to make a “push-out” election, CWGS, LLC has agreements in placerequiring former partners to indemnify CWGS, LLC for their share of the imputed underpayment. The partnershipagreement does not stipulate how CWGS, LLC will address imputed underpayments. If CWGS, LLC receives animputed underpayment, a determination will be made based on the relevant facts and circumstances that exist at thattime. Any payments that CWGS, LLC ultimately makes on behalf of its current partners will be reflected as adistribution, rather than tax expense, at the time such distribution is declared.
12. Fair Value Measurements
Accounting guidance for fair value measurements establishes a three-tier fair value hierarchy, whichprioritizes the inputs used in measuring fair value. These tiers include Level 1, defined as observable inputs such asquoted prices in active markets; Level 2, defined as inputs other than quoted prices in active markets that are eitherdirectly or indirectly observable; and Level 3, defined as unobservable inputs in which little or no market data exists,therefore requiring an entity to develop its own assumptions.
There have been no transfers of assets or liabilities between the fair value measurement levels and therewere no material re-measurements to fair value during 2020 and 2019 of assets and liabilities that are not measuredat fair value on a recurring basis.
The following table presents the reported carrying value and fair value information for the Company’s debtinstruments. The fair values shown below for the Term Loan Facility, as applicable, are based on quoted prices in theinactive market for identical assets (Level 2) and the fair values shown below for the Floor Plan Facility, the RevolvingLine of Credit, and the Real Estate Facility are estimated by discounting the future contractual cash flows at thecurrent market interest rate that is available based on similar financial instruments.
Fair Value December 31, 2020 December 31, 2019($ in thousands) Measurement Carrying Value Fair Value Carrying Value Fair ValueTerm Loan Facility Level 2 $ 1,130,356 $ 1,132,979 $ 1,148,115 $ 1,104,947Floor Plan Facility Revolving Line ofCredit Level 2 20,885 20,791 40,885 41,299Real Estate Facility Level 2 4,493 4,600 19,521 21,030
13. Commitments and Contingencies
Sponsorship and Other Agreements
The Company enters into sponsorship agreements from time to time. Current sponsorship agreements runthrough 2024. The agreements consist of annual fees payable in aggregate of $11.6 million in 2021, $14.5 million in2022, $5.6 million in 2023, and $4.5 million in 2024, which are recognized to expense over the expected benefitperiod.
Table of Contents
124
The Company entered into a subscription agreement for a customer relationship management softwareapplication in 2014. The subscription agreement was amended on October 28, 2016 and again October 18, 2017.The amended subscription agreement for future software services consists of annual fees payable as follows: $4.5million in 2019, $4.8 million in 2020, and $5.0 million in 2021. Expense is recognized ratably over the term of theagreement.
Self-Insurance Program
Self-insurance reserves represent amounts established as a result of insurance programs under which theCompany self-insures portions of the business risks. The Company carries substantial premium-paid, traditional risktransfer insurance for various business risks. The Company self-insures and establishes reserves for the retention onworkers’ compensation insurance, general liability, automobile liability, professional errors and omission liability, andemployee health claims. The self-insured claims liability was approximately $19.6 million and $18.4 million atDecember 31, 2020 and 2019, respectively. The determination of such claims and expenses and the appropriatenessof the related liability are continually reviewed and updated. The self-insurance accruals are calculated by actuariesand are based on claims filed and include estimates for claims incurred but not yet reported. Projections of futurelosses, including incurred but not reported losses, are inherently uncertain because of the random nature of insuranceclaims and could be substantially affected if occurrences and claims differ significantly from these assumptions andhistorical trends. In addition, the Company has obtained letters of credit as required by insurance carriers. As ofDecember 31, 2020 and 2019, these letters of credit were approximately $17.7 million and $15.3 million, respectively.This includes $11.7 million and $11.2 million as of December 31, 2020 and 2019, respectively, issued under the FloorPlan Facility (see Note 4 — Inventories, net and Notes Payable — Floor Plan, net), and the balance issued under theCompany’s Senior Secured Credit Facilities (see Note 9 — Long-Term Debt).
Litigation
On October 19, 2018, a purported stockholder of the Company filed a putative class action lawsuit, captionedRonge v. Camping World Holdings, Inc. et al., in the United States District Court for the Northern District of Illinoisagainst the Company, certain of its officers and directors, and Crestview Partners II GP, L.P. and Crestview Advisors,L.L.C. (the “Ronge Complaint”). On October 25, 2018, a different purported stockholder of the Company filed aputative class action lawsuit, captioned Strougo v. Camping World Holdings, Inc. et al., in the United States DistrictCourt for the Northern District of Illinois against the Company, certain of its officers and directors, and CrestviewPartners II GP, L.P. and Crestview Advisors, L.L.C. (the “Strougo Complaint”).
The Ronge and Strougo Complaints were consolidated and lead plaintiffs (the “Ronge Lead Plaintiffs”)appointed by the court. On February 27, 2019, the Ronge lead plaintiffs filed a consolidated complaint against theCompany, certain of its officers, directors, Crestview Partners II GP, L.P. and Crestview Advisors, L.L.C., and theunderwriters of the May and October 2017 secondary offerings of the Company’s Class A common stock (the“Consolidated Complaint”). The Consolidated Complaint alleged violations of Sections 11 and 12(a)(2) of theSecurities Act of 1933, as well as Section 10(b) of the Securities Exchange Act of 1934, as amended, and Rule 10b-5thereunder, based on allegedly materially misleading statements or omissions of material facts necessary to makecertain statements not misleading related to the business, operations, and management of the Company. Additionally,it alleged that certain of the Company’s officers and directors, Crestview Partners II GP, L.P., and Crestview Advisors,L.L.C. violated Section 15 of the Securities Act of 1933 and Section 20(a) of the Securities Exchange Act of 1934, asamended, by allegedly acting as controlling persons of the Company. On March 12, 2020, Ronge Lead Plaintiffs filedan Amended Consolidated Complaint, adding those allegations contained in the Geis Complaint (defined below). OnMarch 13, 2020, Ronge Lead Plaintiffs filed an unopposed motion for preliminary approval of class action settlement,which the Court granted on April 7, 2020. On August 5, 2020, the Court granted final approval of the class actionsettlement and the case was dismissed with prejudice. The settlement was paid directly by the Company’s insurancecarriers.
On December 12, 2018, a putative class action complaint styled International Union of Operating EngineersBenefit Funds of Eastern Pennsylvania and Delaware v. Camping World Holdings Inc., et al. was filed in the SupremeCourt of the State of New York, New York County, on behalf of all purchasers of Camping World Class A commonstock issued pursuant and/or traceable to a secondary offering of such securities in
Table of Contents
125
October 2017 (“IUOE Complaint”). The IUOE Complaint named as defendants the Company, and certain of itsofficers and directors, among others, and alleged violations of Sections 11, 12(a), and 15 of the Securities Act of 1933based on allegedly materially misleading statements or omissions of material facts necessary to make certainstatements not misleading. On July 13, 2020, the parties entered into a confidential settlement agreement resolvingthe named plaintiff’s claims. The putative class’s claims were duplicative of certain claims in the Ronge casedescribed above, and thus were included in the settlement agreement that the Ronge court approved at thesettlement hearing on August 5, 2020. The Court entered an order of final dismissal on September 8, 2020.
On February 22, 2019, a putative class action complaint styled Daniel Geis v. Camping World Holdings, Inc.,et al. was filed in the Circuit Court of Cook County, Illinois, Chancery Division, on behalf of all purchasers of CampingWorld Class A common stock in and/or traceable to the Company’s initial public offering on October 6, 2016 (“GeisComplaint”). The Geis Complaint named as defendants the Company, certain of its officers and directors, and theunderwriters of the offering, and alleged violations of Sections 11, 12(a)(2), and 15 of the Securities Act of 1933based on allegedly materially misleading statements or omissions of material facts necessary to make certainstatements not misleading. The Geis plaintiff became a plaintiff in Ronge, and the Geis putative class’s claims wereduplicative of certain claims in the Ronge case described above, and thus were included in the settlement agreementthat the Ronge court approved on August 5, 2020. The Court entered an order of final dismissal on August 18, 2020.
On March 5, 2019, a shareholder derivative suit styled Hunnewell v. Camping World Holdings, Inc., et al.,was filed in the Court of Chancery of the State of Delaware, alleging breaches of fiduciary duty for alleged failure toimplement effective disclosure controls and internal controls over financial reporting and to properly oversee certainacquisitions and for alleged insider trading (the “Hunnewell Complaint”).
On April 17, 2019, a shareholder derivative suit styled Lincolnshire Police Pension Fund v. Camping WorldHoldings, Inc., et al., was filed in the Court of Chancery of the State of Delaware, alleging breaches of fiduciary dutyfor alleged failure to implement effective disclosure controls and internal controls over financial reporting and toproperly oversee certain acquisitions and for alleged insider trading and unjust enrichment for compensation receivedduring that time (the “LPPF Complaint”). The LPPF Complaint names the Company as nominal defendant, andnames certain of the Company’s officers and directors, among others, as defendants and seeks compensatorydamages, extraordinary equitable and/or injunctive relief, restitution and disgorgement, attorneys’ fees and costs, andany other and further relief the court deems just and proper. On May 30, 2019, the Court granted the parties’ jointmotion to consolidate the Hunnewell and LPPF Complaints (as well as any future filed actions relating to the subjectmatter) and stay the newly consolidated action pending the resolution of defendants’ motion to dismiss in the Rongeaction. Following the Ronge court’s approval of settlement and entry of a final judgment and order dismissing theRonge action with prejudice, on August 31, 2020, the parties filed a stipulation and proposed order designating theLPPF Complaint as the operative complaint in the consolidated action, and setting forth a schedule for defendants torespond to that Complaint, which the Court granted. On October 30, 2020, the Company, along with the otherdefendants, moved to dismiss this action. On December 30, 2020, the Court granted the parties’ stipulated schedulefor Plaintiffs to file an amended complaint. On January 7, 2021, Plaintiffs filed their Amended Complaint, allegingsubstantially same claims and seeking the same relief. Defendants’ response to the Amended Complaint is due to befiled on or before March 8, 2021.
On August 6, 2019, two shareholder derivative suits, styled Janssen v. Camping World Holdings, Inc., et al.,and Sandler v. Camping World Holdings, Inc. et al., were filed in the U.S. District Court of Delaware. Both actionsname the Company as a nominal defendant, and name certain of the Company’s officers and directors, CrestviewPartners II GP, L.P. and Crestview Advisors, L.L.C. as defendants, and allege: (i) violations of Section 14(a) of theSecurities Exchange Act for issuing proxy statements that allegedly omitted material information and allegedlyincluded materially false and misleading financial statements; (ii) violations of Section 10(b) and 20(a) of theSecurities Exchange Act of 1934, seeking contribution for causing the Company to issue allegedly false andmisleading statements and/or allegedly omit material information in public statements and/or the Company’s filingsconcerning the Company’s financial performance, the effectiveness of internal controls to ensure accurate financialreporting, and the success and profitability of the integration and rollout of Gander Outdoors (now Gander RV) stores;(iii) breaches of fiduciary duty, unjust enrichment, abuse of control, and gross mismanagement for allegedly causingor allowing the Company to disseminate to Camping World
Table of Contents
126
shareholders materially misleading and inaccurate information through the Company’s SEC filings; and (iv) breach offiduciary duties for alleged insider selling and misappropriation of information (together, the “Janssen and SandlerComplaints”). The Janssen and Sandler Complaints seek restitutionary and/or compensatory damages, injunctiverelief, disgorgement of all profits, benefits, and other compensation obtained by the certain of the Company’s officersand directors, attorneys’ fees and costs, and any other and further relief the court deems just and proper. OnSeptember 25, 2019, the Court granted the parties’ joint motion to consolidate the action and stay the action pendingresolution of defendants’ motion to dismiss in the Ronge action. Following the Ronge court’s approval of settlementand entry of a final judgment and order dismissing the Ronge action with prejudice, the case remains stayed while theparties confer regarding the schedule for further proceedings in the action.
On May 28, 2020, Kamela Woodings (“Woodings”), in her representative capacity under the Private AttorneyGeneral Action (“PAGA”) filed a lawsuit styled Woodings v. FreedomRoads, LLC in Los Angeles County SuperiorCourt against FreedomRoads, LLC in which she alleged that she and the putative class members often performed off-the-clock work for which they were not adequately compensated, and alleged the following causes of action: Violationof California Labor Code Sections 2698, et seq, (Private Attorney General Act of 2004), which includes allegations of(1) Failure to Pay Minimum Wage, (2) Failure to Pay Overtime, (3) Failure to Provide Meal Periods, (4) Failure toProvide Rest Breaks, (5) Failure to Timely Wage Upon Termination, (6) Failure to Timely Pay Wages DuringEmployment, (7) Failure to Provide Complete And Accurate Wage Statements, and (8) Failure to Keep AccurateBusiness Records (the “PAGA Complaint”). The PAGA Complaint seeks civil penalties and attorneys’ fees and costspursuant to California Labor Code Section 2699.
On June 25, 2020, Woodings filed a class action complaint styled Woodings v. FreedomRoads, LLC in LosAngeles County Superior Court against FreedomRoads, LLC in which Woodings alleged that she and the putativeclass members, all of FreedomRoads, LLC’s non-exempt California employees, were not appropriately compensatedfor all wages earned in the form of commission, and that she and the putative class members often performed off-the-clock work for which they were not adequately compensated. Woodings also alleged the following causes of action:(1) Violation of California Labor Code §§ 1194, 1197, and 1197.1 (unpaid minimum wages); (2) Violation of CaliforniaLabor Code §§ 1198 (unpaid overtime); (3) Violation of California Labor Code § 226.7 (unpaid meal periodpremiums); (4) Violation of California Labor Code § 226.7 (unpaid rest period premiums); (5) Violation of CaliforniaLabor Code §§ 201 and 202 (final wages not timely paid); (6) Violation of California Labor Code § 226(a) (non-compliant wage statements); (7) Fraud; (8) Negligent Misrepresentation; (9) Breach of Contract; (10) Accounting; and(11) Violation of California Business and Professions Code §§ 17200, et seq., with the following sub-claims of (a)Failure to Pay Overtime, (b) Failure to Provide Meal Periods, (c) Failure to Provide Rest Periods, (d) Failure to PayMinimum Wages, (e) Failure to Timely Wage Upon Termination, (f) Failure to Timely Pay Wages During Employment,(g) Failure to Keep Complete and Accurate Payroll Records, and (h) Failure to Pay Commissions seeking certificationas a class action, monetary damages including general unpaid wages, unpaid wages at overtime wage rates,premium wages for meal and rest breaks not provided, general and special damages, actual, consequential andincidental losses and damages, statutory wage penalties, punitive damages, pre-judgment interest, attorneys’ feesand costs, liquidated damages, and non-monetary damages including an accounting of FreedomRoads, LLC’srevenues, costs and profits in connection with each sale of goods made by the putative class members and theappointment of a receiver to receive, manage and distribute any funds disgorged from FreedomRoads, LLC as maybe determined to have been wrongly acquired by FreedomRoads, LLC, and any other and further relief the courtdeems just and proper (“Class Action”).
On August 6, 2020, the Class Action was removed to the U.S. District Court for the Central District ofCalifornia. On August 27, 2020, Woodings amended the Class Action to add a second plaintiff, Jodi Dormaier,representing a Washington subclass of all non-exempt FreedomRoads, LLC employees, in an amended lawsuitstyled Kamela Woodings and Jodi Dormaier v. FreedomRoads, LLC (the “Amended Class Action”). The AmendedClass Action alleged the following additional causes of action: Violation of Wash. Rev. Code §§ 49.46.090 and49.46.090 (failure to pay minimum wage); Violation of Wash. Rev. Code § 49.46.130 (failure to pay overtime);Violation of Wash. Rev. Code §§ 49.12.020 (failure to provide meal breaks); Violation of Wash. Rev. Code §§49.12.020 (failure to provide rest breaks); Violation of Wash. Rev. Code §§ 49.48.010 (payment of wages upontermination); and Violation of Wash. Rev. Code §§ 49.52.050 (willful exemplary damages) seeking class certification,damages and restitution for all unpaid wages and other injuries to Woodings,
Table of Contents
127
Dormeir, and the putative class, pre-judgment interest, declaratory judgment establishing a violation of CaliforniaLabor Code, California Business and Professional Code §§ 17200, et seq., Revised Code of Washington and otherlaws of the States of California and Washington, and public policy, compensatory damages including lost wages,earnings, liquidated damages, and other employee benefits together with interest, restitution, recovery of all money,actual damages and all other sums of money owed to Woodings, Dormaier, and the putative class members, togetherwith interest, an accounting of FreedomRoads, LLC’s revenues, costs, and profits in connection with each sale ofgoods and services made by Woodings, Dormaier, and the putative class, and reasonable attorneys’ fees and costs,and any other and further relief the court deems just and proper.
On January 18, 2021, the parties entered into a preliminary agreement to settle the Amended Class Actionand the PAGA Complaint subject to the terms of a long-form settlement agreement to be executed by the parties andapproval by the courts. As of December 31, 2020, the Company had a reserve totaling $4.0 million for estimatedlosses related to this matter.
No assurance can be made that these or similar suits will not result in a material financial exposure in excessof insurance coverage, which could have a material adverse effect upon the Company’s financial condition andresults of operations.
From time to time, the Company is involved in other litigation arising in the normal course of businessoperations.
Employment Agreements
The Company has employment agreements with certain officers. The agreements include, among otherthings, an annual bonus based on adjusted earnings before interest, taxes, depreciation and amortization, and up toone year’s severance pay beyond termination date.
14. Related Party Transactions
Transactions with Directors, Equity Holders and Executive Officers
FR leases various retail locations from managers and officers. During 2020, 2019 and 2018, the related partylease expense for these locations was $2.0 million, $2.2 million and $1.9 million, respectively.
In January 2012, FR entered into a lease (the “Original Lease”) for the offices in Lincolnshire, Illinois, whichwas amended as of March 2013 (the “First Amendment”). The Original Lease base rent was $29,000 per month thatwas amended to $31,500 per month in March 2013 by virtue of the First Amendment and is subject to annualincreases. As of November 1, 2019, by way of the Second Amendment to the Office Lease, (together with the OriginalLease and the First Amendment, collectively, the “Office Lease”), the Company began leasing additional space for anadditional monthly base rent of $5,200. The Company’s Chairman and Chief Executive Officer has personallyguaranteed the Office Lease.
Other Transactions
Cumulus Media Inc. (“Cumulus Media”) has provided radio advertising for the Company through CumulusMedia’s subsidiary, Westwood One, Inc. Crestview Partners II GP, L.P., an affiliate of CVRV, was the beneficialowner of Cumulus Media’s Class A common stock until approximately June 6, 2018, according to Crestview PartnersII GP, L.P.’s most recently filed Schedule 13D amendment with respect to the company. For the year endedDecember 31, 2018, the Company incurred Cumulus Media expenses of $0.3 million for the aforementionedadvertising services. Cumulus Media was not a related party in the years ended December 31, 2019 and 2020.
The Company does business with certain companies in which Mr. Lemonis has a direct or indirect materialinterest. The Company purchased fixtures for interior store sets at the Company’s retail locations from PreciseGraphix. Mr. Lemonis has a 67% economic interest in Precise Graphix. The Company incurred expenses fromPrecise Graphix of $0.3 million, $1.4 million and $5.6 million for the years ended December 31,

Table of Contents
128
2020, 2019 and 2018, respectively. The Company purchased point of purchase and visual merchandise displays fromJD Custom Design (“JD Custom”) for use in Camping World’s retail store operations. Mr. Lemonis is a holder of 52%of the combined voting power in JD Custom and the Company paid JD Custom $0, $0 and $0.4 million for the yearsended December 31, 2020, 2019 and 2018, respectively.
The Company does business with certain companies in which Stephen Adams, a member of the Company’sboard of directors, has a direct or indirect material interest. The Company from time to time purchases advertisingservices from Adams Radio of Fort Wayne LLC (“Adams Radio”), in which Mr. Adams has an indirect 90% interest.The Company paid Adams Radio $0 million, $0.2 million, and $0.2 million for the years ended December 31, 2020,2019 and 2018, respectively.
The Company paid Kaplan, Strangis and Kaplan, P.A., of which Andris A. Baltins is a member, and amember of the Company’s board of directors, $0.2 million, $0.3 million and $0.3 million for the years ended December31, 2020, 2019 and 2018, respectively, for legal services.
15. Acquisitions
In 2020 and 2019, subsidiaries of the Company acquired the assets or stock of multiple RV dealerships thatconstituted businesses under accounting rules. The Company used a combination of cash and floor plan financing tocomplete the acquisitions. The Company considers acquisitions of independent dealerships to be a fast and capitalefficient alternative to opening new retail locations to expand its business and grow its customer base. Additionally, inOctober 2020, the RV and Outdoor Retail segment acquired the assets of an RV furniture distributor. The Companyexpects to benefit from synergies from this RV furniture distributor acquisition with its private label RV offerings,installation services, and retail offerings. The acquired businesses were recorded at their estimated fair values underthe acquisition method of accounting. The balance of the purchase prices in excess of the fair values of net assetsacquired were recorded as goodwill.
In 2019, the RV and Outdoor Retail segment acquired the assets of various RV dealerships comprised of fivelocations for an aggregate purchase price of approximately $48.4 million. The purchases were partially fundedthrough $13.9 million of borrowings under the Floor Plan Facility revolving line of credit.
In 2020, the RV and Outdoor Retail segment acquired the assets of various RV dealerships comprised ofnine locations for an aggregate purchase price of approximately $37.9 million plus real property of $53.1 million. Thepurchases were partially funded through $10.3 million of borrowings under the Floor Plan Facility revolving line ofcredit. Three of these acquired locations will open in 2021. Additionally, in October 2020, the RV and Outdoor Retailsegment acquired the assets of an RV furniture distributor for $9.7 million in cash.
For the years ended December 31, 2020 and 2019, the Company purchased real property of $53.1 millionand $31.6 million, respectively, of which $34.1 million and $2.9 million, respectively, was from parties related to thesellers of the businesses.
The estimated fair values of the assets acquired and liabilities assumed for the acquisitions of dealershipsand the RV furniture distributor consist of the following:
Year Ended December 31, ($ in thousands) 2020 2019Tangible assets (liabilities) acquired (assumed):
Accounts receivable, net $ 3,094 $ —Inventories, net 17,211 19,856Prepaid expenses and other assets 643 95Property and equipment, net 1,077 359Operating lease assets 1,859 —Finance lease asset 2,373 —Accounts payable (1,628) (2)
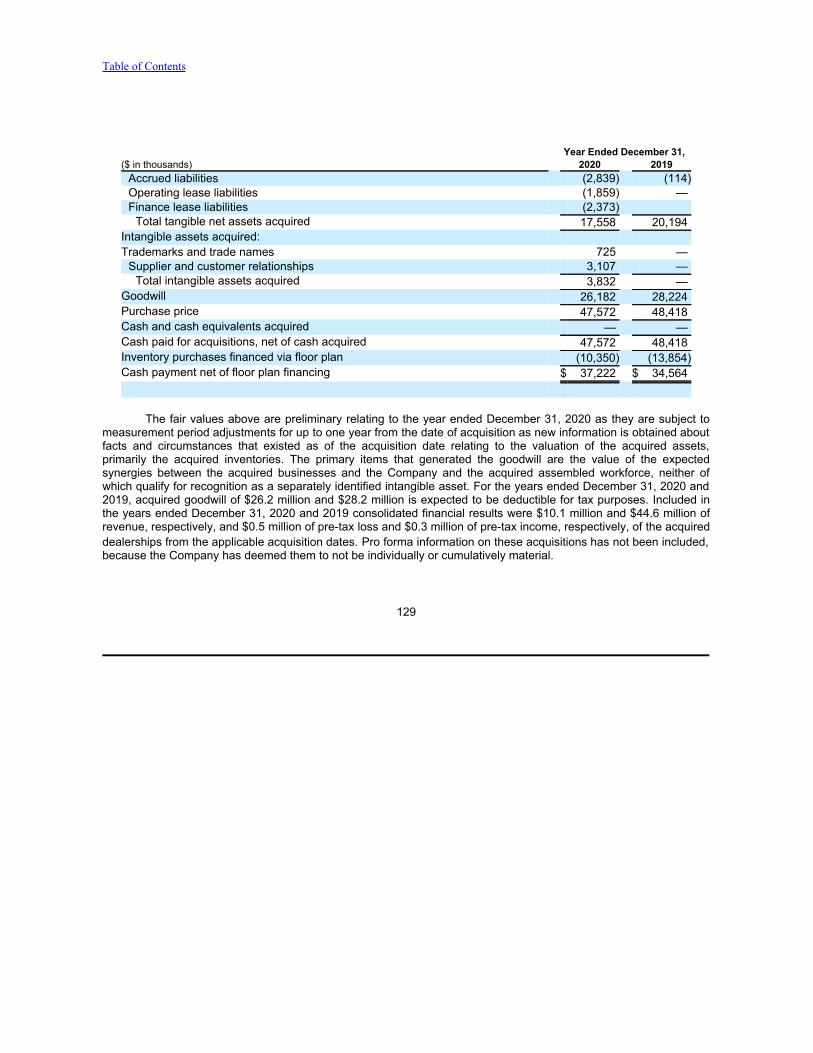
Table of Contents
129
Year Ended December 31, ($ in thousands) 2020 2019
Accrued liabilities (2,839) (114)Operating lease liabilities (1,859) —Finance lease liabilities (2,373)
Total tangible net assets acquired 17,558 20,194Intangible assets acquired:Trademarks and trade names 725 —
Supplier and customer relationships 3,107 —Total intangible assets acquired 3,832 —
Goodwill 26,182 28,224Purchase price 47,572 48,418Cash and cash equivalents acquired — —Cash paid for acquisitions, net of cash acquired 47,572 48,418Inventory purchases financed via floor plan (10,350) (13,854)Cash payment net of floor plan financing $ 37,222 $ 34,564
The fair values above are preliminary relating to the year ended December 31, 2020 as they are subject tomeasurement period adjustments for up to one year from the date of acquisition as new information is obtained aboutfacts and circumstances that existed as of the acquisition date relating to the valuation of the acquired assets,primarily the acquired inventories. The primary items that generated the goodwill are the value of the expectedsynergies between the acquired businesses and the Company and the acquired assembled workforce, neither ofwhich qualify for recognition as a separately identified intangible asset. For the years ended December 31, 2020 and2019, acquired goodwill of $26.2 million and $28.2 million is expected to be deductible for tax purposes. Included inthe years ended December 31, 2020 and 2019 consolidated financial results were $10.1 million and $44.6 million ofrevenue, respectively, and $0.5 million of pre-tax loss and $0.3 million of pre-tax income, respectively, of the acquireddealerships from the applicable acquisition dates. Pro forma information on these acquisitions has not been included,because the Company has deemed them to not be individually or cumulatively material.
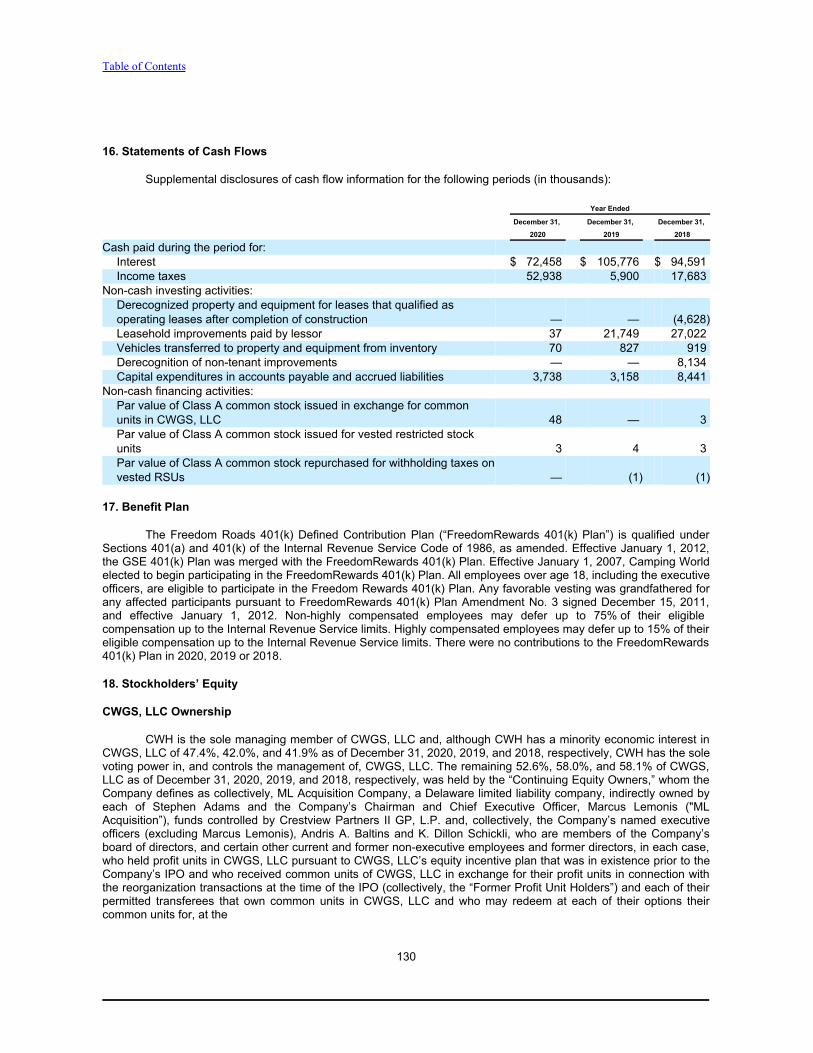
Table of Contents
130
16. Statements of Cash Flows
Supplemental disclosures of cash flow information for the following periods (in thousands):
Year Ended
December 31, December 31, December 31, 2020 2019 2018
Cash paid during the period for:Interest $ 72,458 $ 105,776 $ 94,591Income taxes 52,938 5,900 17,683
Non-cash investing activities:Derecognized property and equipment for leases that qualified asoperating leases after completion of construction — — (4,628)Leasehold improvements paid by lessor 37 21,749 27,022Vehicles transferred to property and equipment from inventory 70 827 919Derecognition of non-tenant improvements — — 8,134Capital expenditures in accounts payable and accrued liabilities 3,738 3,158 8,441
Non-cash financing activities:Par value of Class A common stock issued in exchange for commonunits in CWGS, LLC 48 — 3Par value of Class A common stock issued for vested restricted stockunits 3 4 3Par value of Class A common stock repurchased for withholding taxes onvested RSUs — (1) (1)
17. Benefit Plan
The Freedom Roads 401(k) Defined Contribution Plan (“FreedomRewards 401(k) Plan”) is qualified underSections 401(a) and 401(k) of the Internal Revenue Service Code of 1986, as amended. Effective January 1, 2012,the GSE 401(k) Plan was merged with the FreedomRewards 401(k) Plan. Effective January 1, 2007, Camping Worldelected to begin participating in the FreedomRewards 401(k) Plan. All employees over age 18, including the executiveofficers, are eligible to participate in the Freedom Rewards 401(k) Plan. Any favorable vesting was grandfathered forany affected participants pursuant to FreedomRewards 401(k) Plan Amendment No. 3 signed December 15, 2011,and effective January 1, 2012. Non-highly compensated employees may defer up to 75% of their eligiblecompensation up to the Internal Revenue Service limits. Highly compensated employees may defer up to 15% of theireligible compensation up to the Internal Revenue Service limits. There were no contributions to the FreedomRewards401(k) Plan in 2020, 2019 or 2018.
18. Stockholders’ Equity
CWGS, LLC Ownership
CWH is the sole managing member of CWGS, LLC and, although CWH has a minority economic interest inCWGS, LLC of 47.4%, 42.0%, and 41.9% as of December 31, 2020, 2019, and 2018, respectively, CWH has the solevoting power in, and controls the management of, CWGS, LLC. The remaining 52.6%, 58.0%, and 58.1% of CWGS,LLC as of December 31, 2020, 2019, and 2018, respectively, was held by the “Continuing Equity Owners,” whom theCompany defines as collectively, ML Acquisition Company, a Delaware limited liability company, indirectly owned byeach of Stephen Adams and the Company’s Chairman and Chief Executive Officer, Marcus Lemonis ("MLAcquisition”), funds controlled by Crestview Partners II GP, L.P. and, collectively, the Company’s named executiveofficers (excluding Marcus Lemonis), Andris A. Baltins and K. Dillon Schickli, who are members of the Company’sboard of directors, and certain other current and former non-executive employees and former directors, in each case,who held profit units in CWGS, LLC pursuant to CWGS, LLC’s equity incentive plan that was in existence prior to theCompany’s IPO and who received common units of CWGS, LLC in exchange for their profit units in connection withthe reorganization transactions at the time of the IPO (collectively, the “Former Profit Unit Holders”) and each of theirpermitted transferees that own common units in CWGS, LLC and who may redeem at each of their options theircommon units for, at the
Table of Contents
131
Company’s election (determined solely by the Company’s independent directors (within the meaning of the rules ofthe New York Stock Exchange) who are disinterested), cash or newly issued shares of the Company’s Class Acommon stock. Accordingly, the Company consolidated the financial results of CWGS, LLC and reported a non-controlling interest in its consolidated financial statements. In accordance with the CWGS LLC Agreement, CWGS,LLC has made cash distributions to all common unit holders of CWGS, LLC in an amount sufficient for 1) CWH to payits regular quarterly cash dividend to holders of its Class A common stock and 2) the common unit holders of CWGS,LLC to pay their income tax obligation on their allocated portion of CWGS, LLC income at the highest tax rate for allcommon unit holders of CWGS, LLC. The payment of these cash distributions by CWGS, LLC to Continuing EquityOwners are recorded as distributions to holders of CWGS, LLC common units in the accompanying ConsolidatedStatements of Stockholders’ Deficit and Consolidated Statements of Cash Flows. The payment of these cashdistributions by CWGS, LLC to CWH are within the consolidated group and, therefore, are not included in thedistributions to holders of CWGS LLC common units in the accompanying Consolidated Statements of Stockholders’Deficit and Consolidated Statements of Cash Flows.
Common Stock Economic and Voting Rights
Each share of the Company’s Class A common stock and Class B common stock entitles its holders to onevote per share on all matters presented to the Company’s stockholders generally; provided that, for as long as MLAcquisition Company, LLC, a Delaware limited liability company, indirectly owned by each of Stephen Adams and theCompany’s Chairman and Chief Executive Officer, Marcus Lemonis, and its permitted transferees of common units(collectively, the “ML Related Parties”), directly or indirectly, beneficially own in the aggregate 27.5% or more of all ofthe outstanding common units of CWGS, LLC, the shares of Class B common stock held by the ML Related Partieswill entitle the ML Related Parties to the number of votes necessary such that the ML Related Parties, in theaggregate, cast 47% of the total votes eligible to be cast by all of the Company’s stockholders on all matterspresented to a vote of the Company’s stockholders generally. Additionally, the one share of Class C common stockentitles its holder to the number of votes necessary such that the holder casts 5% of the total votes eligible to be castby all of the Company’s stockholders on all matters presented to a vote of the Company’s stockholders generally. Theone share of Class C common stock is owned by ML RV Group, LLC, a Delaware limited liability company, wholly-owned by the Company’s Chairman and Chief Executive Officer, Marcus Lemonis.
Holders of the Company’s Class B and Class C common stock are not entitled to receive dividends and willnot be entitled to receive any distributions upon the liquidation, dissolution or winding up of the Company. Shares ofClass B common stock may only be issued to the extent necessary to maintain the one-to-one ratio between thenumber of common units of CWGS, LLC held by funds controlled by Crestview Partners II GP, L.P. and the MLRelated Parties (the “Class B Common Owners”) and the number of shares of Class B common stock held by theClass B Common Owners. Shares of Class B common stock are transferable only together with an equal number ofcommon units of CWGS, LLC. Only permitted transferees of common units held by the Class B Common Owners willbe permitted transferees of Class B common stock. Shares of Class B common stock will be canceled on a one-for-one basis upon the redemption or exchange any of the outstanding common units of CWGS, LLC held by the Class BCommon Owners. Upon the occurrence of certain change in control events, the Class C common stock would nolonger have any voting rights, such share of the Company’s Class C common stock will be cancelled for noconsideration and will be retired, and the Company will not reissue such share of Class C common stock.
The Company must, at all times, maintain a one-to-one ratio between the number of outstanding shares ofClass A common stock and the number of common units of CWGS, LLC owned by CWH (subject to certainexceptions for treasury shares and shares underlying certain convertible or exchangeable securities).
Table of Contents
132
Short-Swing Profit Disgorgement
In May 2018, the Company received an aggregate of $557,000 from short-swing profit disgorgement remittedby ML Acquisition Company, LLC, of which Marcus A. Lemonis, Chairman and Chief Executive Officer of theCompany, is the sole director, which is included as an increase to additional paid-in capital in the consolidatedstatement of stockholders’ equity and as a financing activity in the consolidated statement of cash flows.
Stock Repurchase Program
On October 30, 2020, the Company’s Board of Directors authorized a stock repurchase program for therepurchase of up to $100.0 million of the Company’s Class A common stock, expiring on October 31, 2022.Repurchases under the program are subject to any applicable limitations on the availability of funds to be distributedto the Company by CWGS, LLC to fund repurchases and may be made in the open market, in privately negotiatedtransactions or otherwise, with the amount and timing of repurchases to be determined at the Company’s discretion,depending on market conditions and corporate needs. Open market repurchases will be structured to occur inaccordance with applicable federal securities laws, including within the pricing and volume requirements of Rule 10b-18 under the Securities Exchange Act of 1934, as amended. The Company may also, from time to time, enter intoRule 10b5-1 plans to facilitate repurchases of its shares under this authorization. This program does not obligate theCompany to acquire any particular amount of Class A common stock and the program may be extended, modified,suspended or discontinued at any time at the Board’s discretion. The Company expects to fund the repurchasesusing cash on hand.
During the year ended December 31, 2020, the Company repurchased 811,223 shares of Class A commonstock under this program for approximately $21.5 million, including commissions paid, at a weighted average priceper share of $26.53, which is recorded as treasury stock on the consolidated balance sheets. Class A common stockheld as treasury stock is not considered outstanding. During the year ended December 31, 2020, the Companyreissued 238,776 shares of Class A common stock from treasury stock to settle the exercises of stock options andvesting of restricted stock units. As of December 31, 2020, the remaining approved amount for repurchases of ClassA common stock under the share repurchase program was approximately $78.5 million.
19. Non-Controlling Interests
As described in Note 18 — Stockholders’ Equity, CWH is the sole managing member of CWGS, LLC and, asa result, consolidates the financial results of CWGS, LLC. The Company reports a non-controlling interestrepresenting the common units of CWGS, LLC held by Continuing Equity Owners. Changes in CWH’s ownershipinterest in CWGS, LLC while CWH retains its controlling interest in CWGS, LLC will be accounted for as equitytransactions. As such, future redemptions or direct exchanges of common units of CWGS, LLC by the ContinuingEquity Owners will result in a change in ownership and reduce or increase the amount recorded as non-controllinginterest and increase or decrease additional paid-in capital when CWGS, LLC has positive or negative net assets,respectively. At December 31, 2020 and 2019, CWGS, LLC had negative net assets, which resulted in negative non-controlling interest amounts on the consolidated balance sheets. At the end of each period, the Company will record anon-controlling interest adjustment to additional paid-in capital such that the non-controlling interest on theconsolidated balance sheet is equal to the non-controlling interest’s ownership share of the underlying CWGS, LLCnet assets (see the consolidated statement of stockholders’ deficit).
As of December 31, 2020 and December 31, 2019, there were 89,043,176 and 89,158,273 common units ofCWGS, LLC interests outstanding, respectively, of which CWH owned 42,226,389 and 37,488,989 common units ofCWGS, LLC, respectively, representing 47.4% and 42.0% ownership interest in CWGS, LLC., respectively, and theContinuing Equity Owners owned 46,816,787 and 51,669,284 common units of CWGS, LLC, respectively,representing 52.6% and 58.0% ownership interests in CWGS, LLC, respectively.
During the year ended December 31, 2020, the funds controlled by Crestview Partners II GP, L.P. redeemed4.7 million common units of CWGS, LLC in exchange for 4.7 million shares of the Company’s Class A common stock,which also resulted in the cancellation of 4.7 million shares of the Company’s Class B
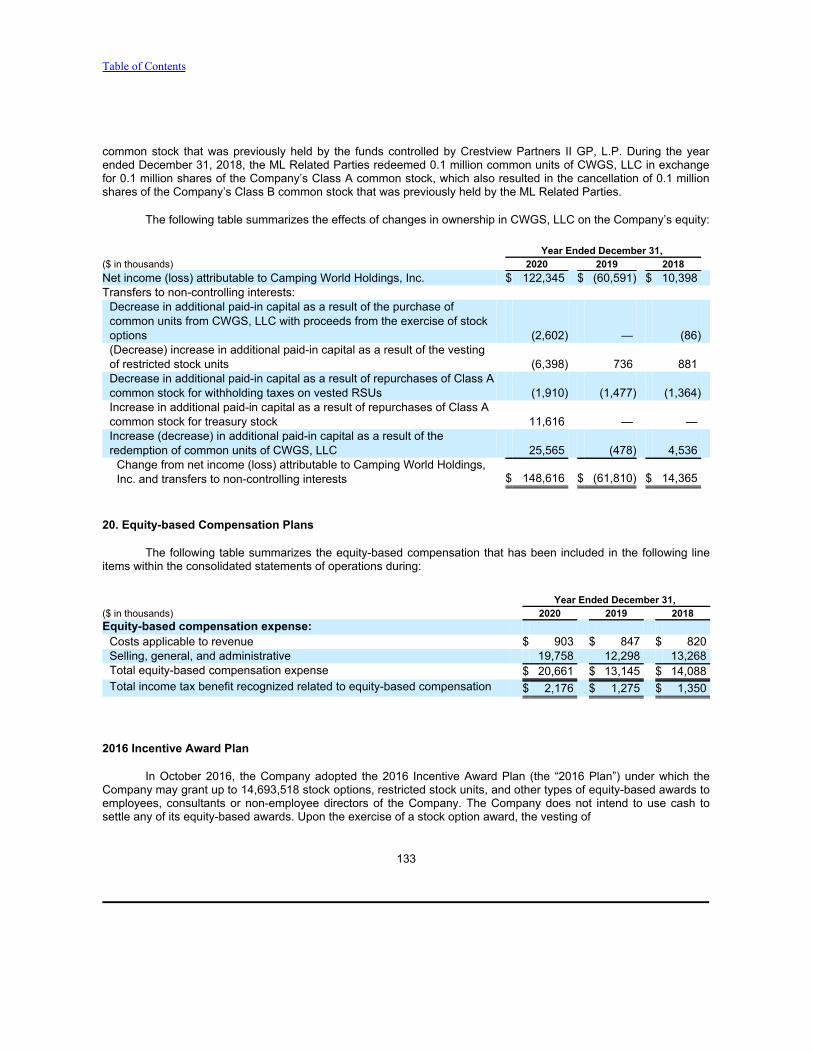
Table of Contents
133
common stock that was previously held by the funds controlled by Crestview Partners II GP, L.P. During the yearended December 31, 2018, the ML Related Parties redeemed 0.1 million common units of CWGS, LLC in exchangefor 0.1 million shares of the Company’s Class A common stock, which also resulted in the cancellation of 0.1 millionshares of the Company’s Class B common stock that was previously held by the ML Related Parties.
The following table summarizes the effects of changes in ownership in CWGS, LLC on the Company’s equity:
Year Ended December 31, ($ in thousands) 2020 2019 2018 Net income (loss) attributable to Camping World Holdings, Inc. $ 122,345 $ (60,591) $ 10,398Transfers to non-controlling interests:
Decrease in additional paid-in capital as a result of the purchase ofcommon units from CWGS, LLC with proceeds from the exercise of stockoptions (2,602) — (86)(Decrease) increase in additional paid-in capital as a result of the vestingof restricted stock units (6,398) 736 881Decrease in additional paid-in capital as a result of repurchases of Class Acommon stock for withholding taxes on vested RSUs (1,910) (1,477) (1,364)Increase in additional paid-in capital as a result of repurchases of Class Acommon stock for treasury stock 11,616 — —Increase (decrease) in additional paid-in capital as a result of theredemption of common units of CWGS, LLC 25,565 (478) 4,536
Change from net income (loss) attributable to Camping World Holdings,Inc. and transfers to non-controlling interests $ 148,616 $ (61,810) $ 14,365
20. Equity-based Compensation Plans
The following table summarizes the equity-based compensation that has been included in the following lineitems within the consolidated statements of operations during:
Year Ended December 31, ($ in thousands) 2020 2019 2018Equity-based compensation expense:
Costs applicable to revenue $ 903 $ 847 $ 820Selling, general, and administrative 19,758 12,298 13,268Total equity-based compensation expense $ 20,661 $ 13,145 $ 14,088Total income tax benefit recognized related to equity-based compensation $ 2,176 $ 1,275 $ 1,350
2016 Incentive Award Plan
In October 2016, the Company adopted the 2016 Incentive Award Plan (the “2016 Plan”) under which theCompany may grant up to 14,693,518 stock options, restricted stock units, and other types of equity-based awards toemployees, consultants or non-employee directors of the Company. The Company does not intend to use cash tosettle any of its equity-based awards. Upon the exercise of a stock option award, the vesting of
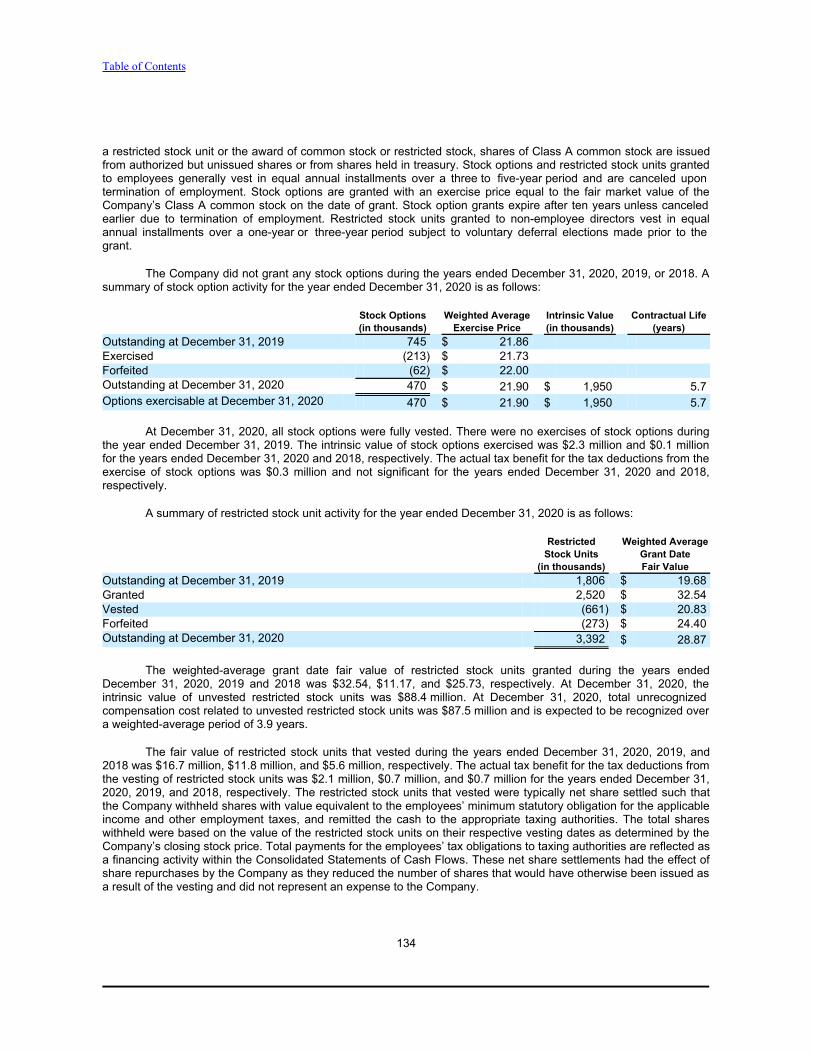
Table of Contents
134
a restricted stock unit or the award of common stock or restricted stock, shares of Class A common stock are issuedfrom authorized but unissued shares or from shares held in treasury. Stock options and restricted stock units grantedto employees generally vest in equal annual installments over a three to five-year period and are canceled upontermination of employment. Stock options are granted with an exercise price equal to the fair market value of theCompany’s Class A common stock on the date of grant. Stock option grants expire after ten years unless canceledearlier due to termination of employment. Restricted stock units granted to non-employee directors vest in equalannual installments over a one-year or three-year period subject to voluntary deferral elections made prior to thegrant.
The Company did not grant any stock options during the years ended December 31, 2020, 2019, or 2018. Asummary of stock option activity for the year ended December 31, 2020 is as follows:
Stock Options Weighted Average Intrinsic Value Contractual Life (in thousands) Exercise Price (in thousands) (years)
Outstanding at December 31, 2019 745 $ 21.86Exercised (213) $ 21.73Forfeited (62) $ 22.00Outstanding at December 31, 2020 470 $ 21.90 $ 1,950 5.7Options exercisable at December 31, 2020 470 $ 21.90 $ 1,950 5.7
At December 31, 2020, all stock options were fully vested. There were no exercises of stock options duringthe year ended December 31, 2019. The intrinsic value of stock options exercised was $2.3 million and $0.1 millionfor the years ended December 31, 2020 and 2018, respectively. The actual tax benefit for the tax deductions from theexercise of stock options was $0.3 million and not significant for the years ended December 31, 2020 and 2018,respectively.
A summary of restricted stock unit activity for the year ended December 31, 2020 is as follows:
Restricted Weighted AverageStock Units Grant Date
(in thousands) Fair ValueOutstanding at December 31, 2019 1,806 $ 19.68Granted 2,520 $ 32.54Vested (661) $ 20.83Forfeited (273) $ 24.40Outstanding at December 31, 2020 3,392 $ 28.87
The weighted-average grant date fair value of restricted stock units granted during the years endedDecember 31, 2020, 2019 and 2018 was $32.54, $11.17, and $25.73, respectively. At December 31, 2020, theintrinsic value of unvested restricted stock units was $88.4 million. At December 31, 2020, total unrecognizedcompensation cost related to unvested restricted stock units was $87.5 million and is expected to be recognized overa weighted-average period of 3.9 years.
The fair value of restricted stock units that vested during the years ended December 31, 2020, 2019, and2018 was $16.7 million, $11.8 million, and $5.6 million, respectively. The actual tax benefit for the tax deductions fromthe vesting of restricted stock units was $2.1 million, $0.7 million, and $0.7 million for the years ended December 31,2020, 2019, and 2018, respectively. The restricted stock units that vested were typically net share settled such thatthe Company withheld shares with value equivalent to the employees’ minimum statutory obligation for the applicableincome and other employment taxes, and remitted the cash to the appropriate taxing authorities. The total shareswithheld were based on the value of the restricted stock units on their respective vesting dates as determined by theCompany’s closing stock price. Total payments for the employees’ tax obligations to taxing authorities are reflected asa financing activity within the Consolidated Statements of Cash Flows. These net share settlements had the effect ofshare repurchases by the Company as they reduced the number of shares that would have otherwise been issued asa result of the vesting and did not represent an expense to the Company.
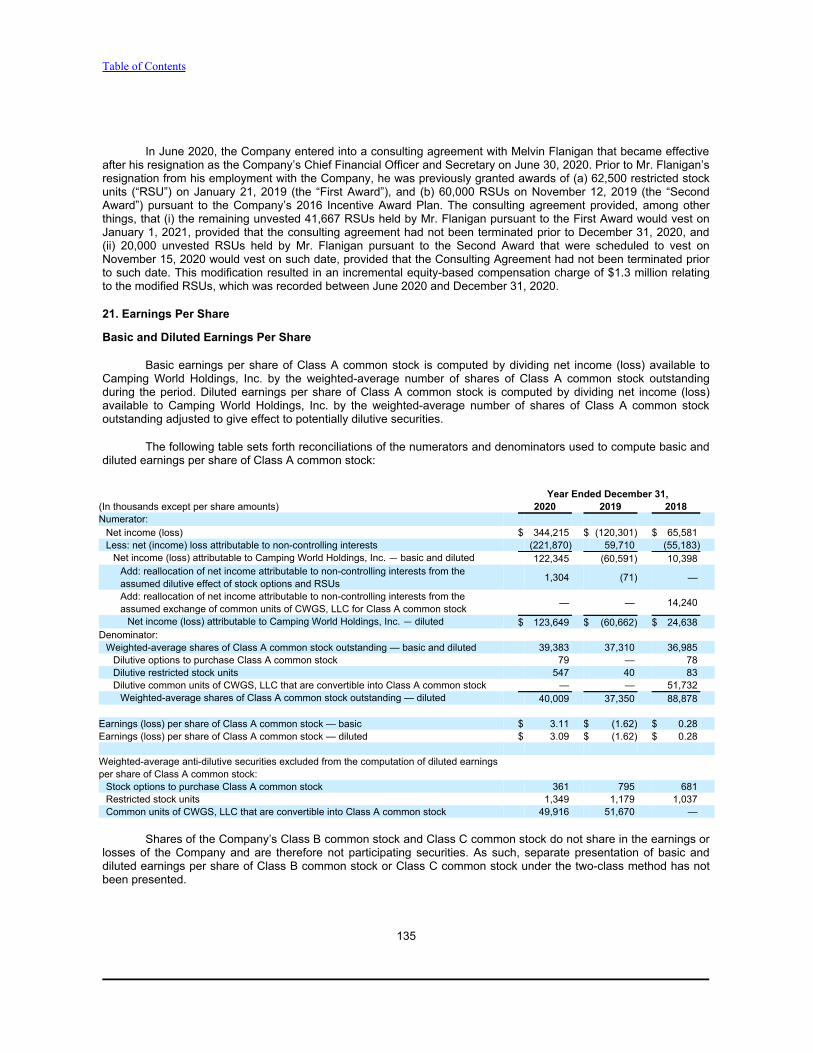
Table of Contents
135
In June 2020, the Company entered into a consulting agreement with Melvin Flanigan that became effectiveafter his resignation as the Company’s Chief Financial Officer and Secretary on June 30, 2020. Prior to Mr. Flanigan’sresignation from his employment with the Company, he was previously granted awards of (a) 62,500 restricted stockunits (“RSU”) on January 21, 2019 (the “First Award”), and (b) 60,000 RSUs on November 12, 2019 (the “SecondAward”) pursuant to the Company’s 2016 Incentive Award Plan. The consulting agreement provided, among otherthings, that (i) the remaining unvested 41,667 RSUs held by Mr. Flanigan pursuant to the First Award would vest onJanuary 1, 2021, provided that the consulting agreement had not been terminated prior to December 31, 2020, and(ii) 20,000 unvested RSUs held by Mr. Flanigan pursuant to the Second Award that were scheduled to vest onNovember 15, 2020 would vest on such date, provided that the Consulting Agreement had not been terminated priorto such date. This modification resulted in an incremental equity-based compensation charge of $1.3 million relatingto the modified RSUs, which was recorded between June 2020 and December 31, 2020.
21. Earnings Per Share
Basic and Diluted Earnings Per Share
Basic earnings per share of Class A common stock is computed by dividing net income (loss) available toCamping World Holdings, Inc. by the weighted-average number of shares of Class A common stock outstandingduring the period. Diluted earnings per share of Class A common stock is computed by dividing net income (loss)available to Camping World Holdings, Inc. by the weighted-average number of shares of Class A common stockoutstanding adjusted to give effect to potentially dilutive securities.
The following table sets forth reconciliations of the numerators and denominators used to compute basic anddiluted earnings per share of Class A common stock:
Year Ended December 31, (In thousands except per share amounts) 2020 2019 2018Numerator:
Net income (loss) $ 344,215 $ (120,301) $ 65,581Less: net (income) loss attributable to non-controlling interests (221,870) 59,710 (55,183)
Net income (loss) attributable to Camping World Holdings, Inc. — basic and diluted 122,345 (60,591) 10,398Add: reallocation of net income attributable to non-controlling interests from theassumed dilutive effect of stock options and RSUs 1,304 (71) —
Add: reallocation of net income attributable to non-controlling interests from theassumed exchange of common units of CWGS, LLC for Class A common stock — — 14,240
Net income (loss) attributable to Camping World Holdings, Inc. — diluted $ 123,649 $ (60,662) $ 24,638Denominator:
Weighted-average shares of Class A common stock outstanding — basic and diluted 39,383 37,310 36,985Dilutive options to purchase Class A common stock 79 — 78Dilutive restricted stock units 547 40 83Dilutive common units of CWGS, LLC that are convertible into Class A common stock — — 51,732
Weighted-average shares of Class A common stock outstanding — diluted 40,009 37,350 88,878
Earnings (loss) per share of Class A common stock — basic $ 3.11 $ (1.62) $ 0.28Earnings (loss) per share of Class A common stock — diluted $ 3.09 $ (1.62) $ 0.28
Weighted-average anti-dilutive securities excluded from the computation of diluted earningsper share of Class A common stock:
Stock options to purchase Class A common stock 361 795 681Restricted stock units 1,349 1,179 1,037Common units of CWGS, LLC that are convertible into Class A common stock 49,916 51,670 —
Shares of the Company’s Class B common stock and Class C common stock do not share in the earnings orlosses of the Company and are therefore not participating securities. As such, separate presentation of basic anddiluted earnings per share of Class B common stock or Class C common stock under the two-class method has notbeen presented.
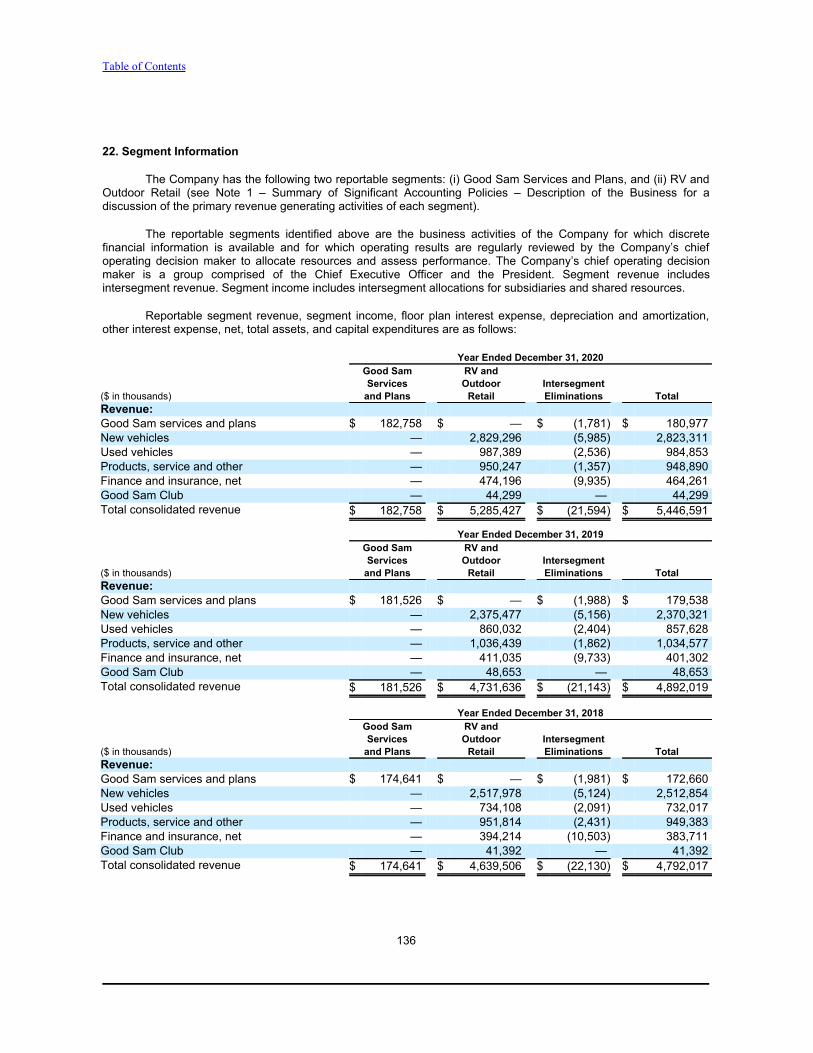
Table of Contents
136
22. Segment Information
The Company has the following two reportable segments: (i) Good Sam Services and Plans, and (ii) RV andOutdoor Retail (see Note 1 – Summary of Significant Accounting Policies – Description of the Business for adiscussion of the primary revenue generating activities of each segment).
The reportable segments identified above are the business activities of the Company for which discretefinancial information is available and for which operating results are regularly reviewed by the Company’s chiefoperating decision maker to allocate resources and assess performance. The Company’s chief operating decisionmaker is a group comprised of the Chief Executive Officer and the President. Segment revenue includesintersegment revenue. Segment income includes intersegment allocations for subsidiaries and shared resources.
Reportable segment revenue, segment income, floor plan interest expense, depreciation and amortization,other interest expense, net, total assets, and capital expenditures are as follows:
Year Ended December 31, 2020Good Sam RV andServices Outdoor Intersegment
($ in thousands) and Plans Retail Eliminations TotalRevenue:Good Sam services and plans $ 182,758 $ — $ (1,781) $ 180,977New vehicles — 2,829,296 (5,985) 2,823,311Used vehicles — 987,389 (2,536) 984,853Products, service and other — 950,247 (1,357) 948,890Finance and insurance, net — 474,196 (9,935) 464,261Good Sam Club — 44,299 — 44,299Total consolidated revenue $ 182,758 $ 5,285,427 $ (21,594) $ 5,446,591
Year Ended December 31, 2019Good Sam RV andServices Outdoor Intersegment
($ in thousands) and Plans Retail Eliminations TotalRevenue:Good Sam services and plans $ 181,526 $ — $ (1,988) $ 179,538New vehicles — 2,375,477 (5,156) 2,370,321Used vehicles — 860,032 (2,404) 857,628Products, service and other — 1,036,439 (1,862) 1,034,577Finance and insurance, net — 411,035 (9,733) 401,302Good Sam Club — 48,653 — 48,653Total consolidated revenue $ 181,526 $ 4,731,636 $ (21,143) $ 4,892,019
Year Ended December 31, 2018Good Sam RV andServices Outdoor Intersegment
($ in thousands) and Plans Retail Eliminations TotalRevenue:Good Sam services and plans $ 174,641 $ — $ (1,981) $ 172,660New vehicles — 2,517,978 (5,124) 2,512,854Used vehicles — 734,108 (2,091) 732,017Products, service and other — 951,814 (2,431) 949,383Finance and insurance, net — 394,214 (10,503) 383,711Good Sam Club — 41,392 — 41,392Total consolidated revenue $ 174,641 $ 4,639,506 $ (22,130) $ 4,792,017

Table of Contents
137
Year Ended December 31, ($ in thousands) 2020 2019 2018Segment income (loss):(1)
Good Sam Services and Plans $ 88,288 $ 83,635 $ 81,138RV and Outdoor Retail 429,950 (42,609) 138,085
Total segment income 518,238 41,026 219,223Corporate & other (9,751) (12,455) (6,821)Depreciation and amortization (51,981) (59,932) (49,322)Other interest expense, net (54,689) (69,363) (63,329)Tax Receivable Agreement liability adjustment 141 10,005 (1,324)Loss and expense on debt restructure — — (2,056)
Income (loss) before income taxes $ 401,958 $ (90,719) $ 96,371
(1) Segment income is defined as income from operations before depreciation and amortization plus floor plan interest expense. TheCompany has recast certain prior period amounts to conform to the two segments presented in 2019.
Year Ended December 31, ($ in thousands) 2020 2019 2018 Depreciation and amortization:
Good Sam Services and Plans $ 3,474 $ 4,304 $ 3,328RV and Outdoor Retail 48,507 55,628 45,406Subtotal 51,981 59,932 48,734Corporate & other — — 588Total depreciation and amortization $ 51,981 $ 59,932 $ 49,322
Year Ended December 31, ($ in thousands) 2020 2019 2018 Other interest expense, net:
Good Sam Services and Plans $ 5 $ (1) $ 4RV and Outdoor Retail 8,081 8,941 8,073Subtotal 8,086 8,940 8,077Corporate & other 46,603 60,423 55,252Total other interest expense, net $ 54,689 $ 69,363 $ 63,329
As of December 31, ($ in thousands) 2020 2019 2018 Assets:
Good Sam Services and Plans $ 140,825 $ 138,360 $ 146,012RV and Outdoor Retail 2,881,637 3,047,652 2,467,519Subtotal 3,022,462 3,186,012 2,613,531Corporate & other 233,969 190,228 193,156Total assets $ 3,256,431 $ 3,376,240 $ 2,806,687
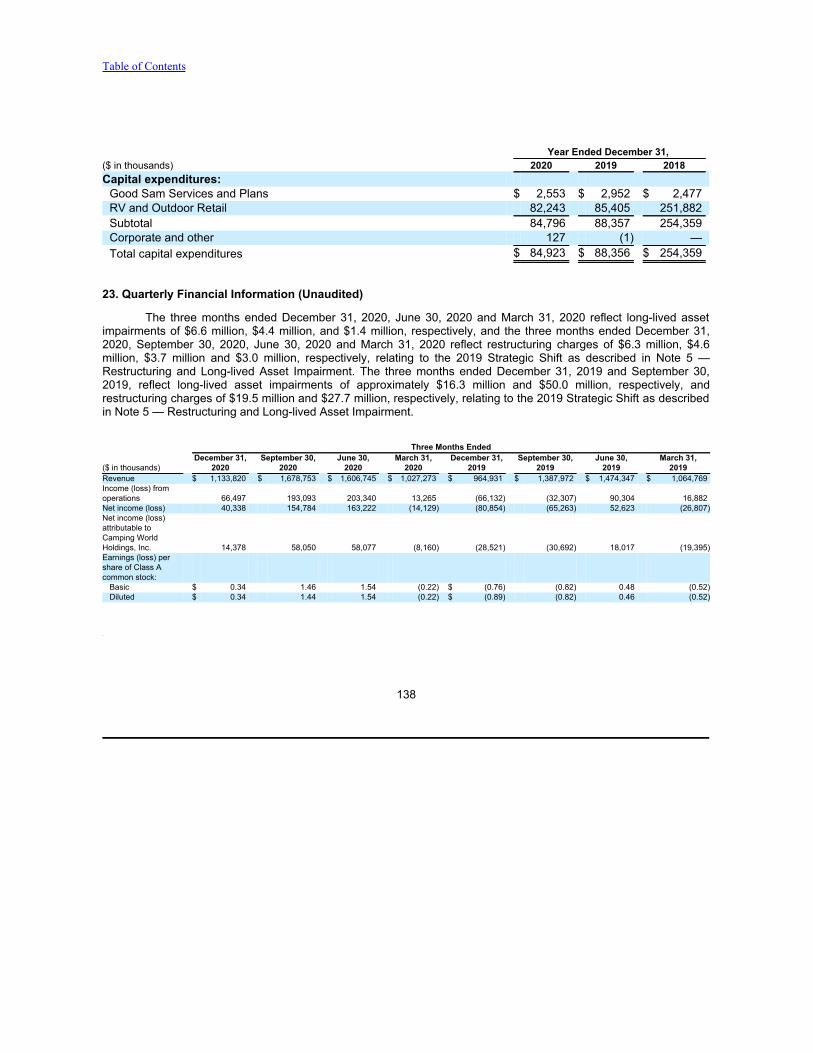
Table of Contents
138
Year Ended December 31, ($ in thousands) 2020 2019 2018 Capital expenditures:
Good Sam Services and Plans $ 2,553 $ 2,952 $ 2,477RV and Outdoor Retail 82,243 85,405 251,882Subtotal 84,796 88,357 254,359Corporate and other 127 (1) —Total capital expenditures $ 84,923 $ 88,356 $ 254,359
23. Quarterly Financial Information (Unaudited)
The three months ended December 31, 2020, June 30, 2020 and March 31, 2020 reflect long-lived assetimpairments of $6.6 million, $4.4 million, and $1.4 million, respectively, and the three months ended December 31,2020, September 30, 2020, June 30, 2020 and March 31, 2020 reflect restructuring charges of $6.3 million, $4.6million, $3.7 million and $3.0 million, respectively, relating to the 2019 Strategic Shift as described in Note 5 —Restructuring and Long-lived Asset Impairment. The three months ended December 31, 2019 and September 30,2019, reflect long-lived asset impairments of approximately $16.3 million and $50.0 million, respectively, andrestructuring charges of $19.5 million and $27.7 million, respectively, relating to the 2019 Strategic Shift as describedin Note 5 — Restructuring and Long-lived Asset Impairment.
Three Months EndedDecember 31, September 30, June 30, March 31, December 31, September 30, June 30, March 31,
($ in thousands) 2020 2020 2020 2020 2019 2019 2019 2019Revenue $ 1,133,820 $ 1,678,753 $ 1,606,745 $ 1,027,273 $ 964,931 $ 1,387,972 $ 1,474,347 $ 1,064,769Income (loss) fromoperations 66,497 193,093 203,340 13,265 (66,132) (32,307) 90,304 16,882Net income (loss) 40,338 154,784 163,222 (14,129) (80,854) (65,263) 52,623 (26,807)Net income (loss)attributable toCamping WorldHoldings, Inc. 14,378 58,050 58,077 (8,160) (28,521) (30,692) 18,017 (19,395)Earnings (loss) pershare of Class Acommon stock:
Basic $ 0.34 1.46 1.54 (0.22) $ (0.76) (0.82) 0.48 (0.52)Diluted $ 0.34 1.44 1.54 (0.22) $ (0.89) (0.82) 0.46 (0.52)
(1)
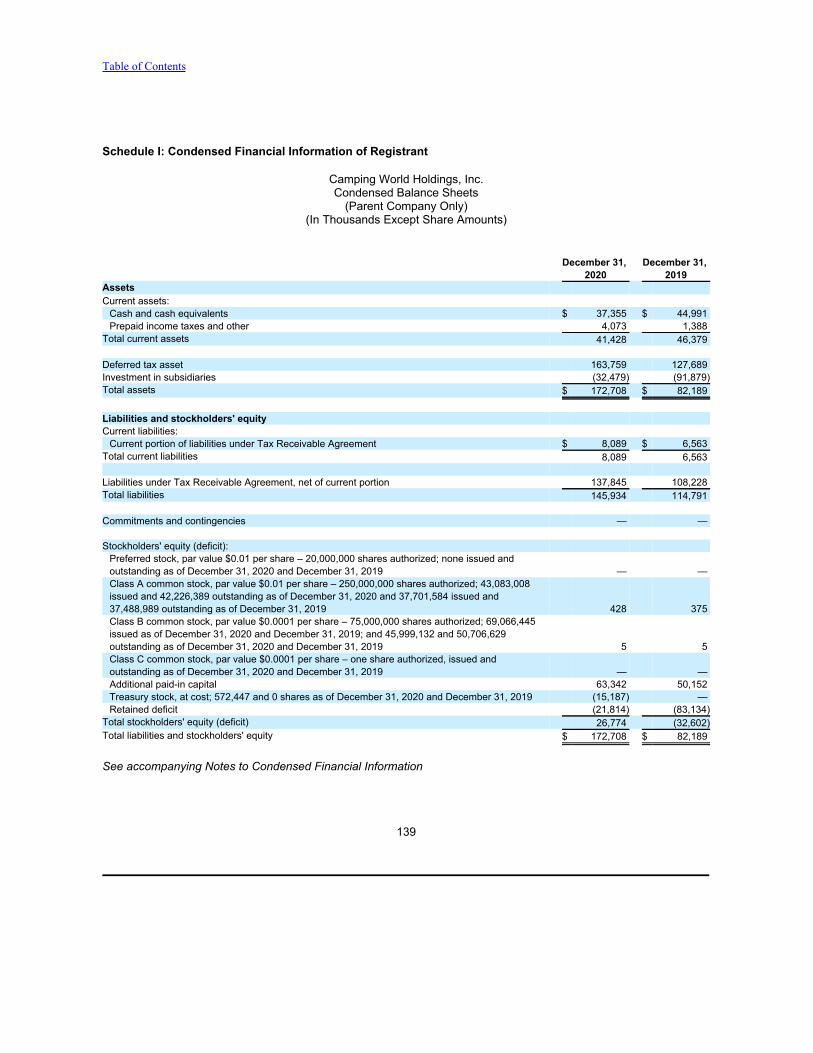
Table of Contents
139
Schedule I: Condensed Financial Information of Registrant
Camping World Holdings, Inc.Condensed Balance Sheets
(Parent Company Only)(In Thousands Except Share Amounts)
December 31, December 31, 2020 2019
AssetsCurrent assets:
Cash and cash equivalents $ 37,355 $ 44,991Prepaid income taxes and other 4,073 1,388
Total current assets 41,428 46,379
Deferred tax asset 163,759 127,689Investment in subsidiaries (32,479) (91,879)Total assets $ 172,708 $ 82,189
Liabilities and stockholders' equityCurrent liabilities:
Current portion of liabilities under Tax Receivable Agreement $ 8,089 $ 6,563Total current liabilities 8,089 6,563
Liabilities under Tax Receivable Agreement, net of current portion 137,845 108,228Total liabilities 145,934 114,791
Commitments and contingencies — —
Stockholders' equity (deficit):Preferred stock, par value $0.01 per share – 20,000,000 shares authorized; none issued andoutstanding as of December 31, 2020 and December 31, 2019 — —Class A common stock, par value $0.01 per share – 250,000,000 shares authorized; 43,083,008issued and 42,226,389 outstanding as of December 31, 2020 and 37,701,584 issued and37,488,989 outstanding as of December 31, 2019 428 375Class B common stock, par value $0.0001 per share – 75,000,000 shares authorized; 69,066,445issued as of December 31, 2020 and December 31, 2019; and 45,999,132 and 50,706,629outstanding as of December 31, 2020 and December 31, 2019 5 5Class C common stock, par value $0.0001 per share – one share authorized, issued andoutstanding as of December 31, 2020 and December 31, 2019 — —Additional paid-in capital 63,342 50,152Treasury stock, at cost; 572,447 and 0 shares as of December 31, 2020 and December 31, 2019 (15,187) —Retained deficit (21,814) (83,134)
Total stockholders' equity (deficit) 26,774 (32,602)Total liabilities and stockholders' equity $ 172,708 $ 82,189
See accompanying Notes to Condensed Financial Information
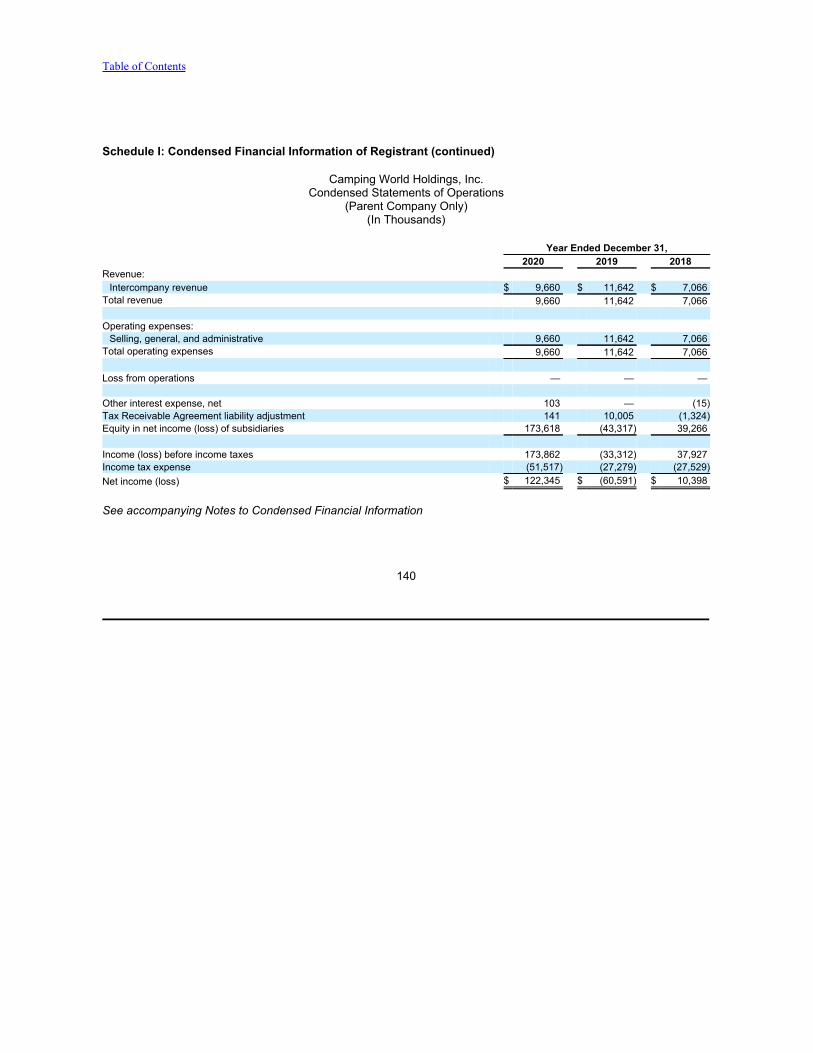
Table of Contents
140
Schedule I: Condensed Financial Information of Registrant (continued)
Camping World Holdings, Inc.Condensed Statements of Operations
(Parent Company Only)(In Thousands)
Year Ended December 31, 2020 2019 2018
Revenue:Intercompany revenue $ 9,660 $ 11,642 $ 7,066
Total revenue 9,660 11,642 7,066
Operating expenses:Selling, general, and administrative 9,660 11,642 7,066
Total operating expenses 9,660 11,642 7,066
Loss from operations — — —
Other interest expense, net 103 — (15)Tax Receivable Agreement liability adjustment 141 10,005 (1,324)Equity in net income (loss) of subsidiaries 173,618 (43,317) 39,266
Income (loss) before income taxes 173,862 (33,312) 37,927Income tax expense (51,517) (27,279) (27,529)Net income (loss) $ 122,345 $ (60,591) $ 10,398
See accompanying Notes to Condensed Financial Information
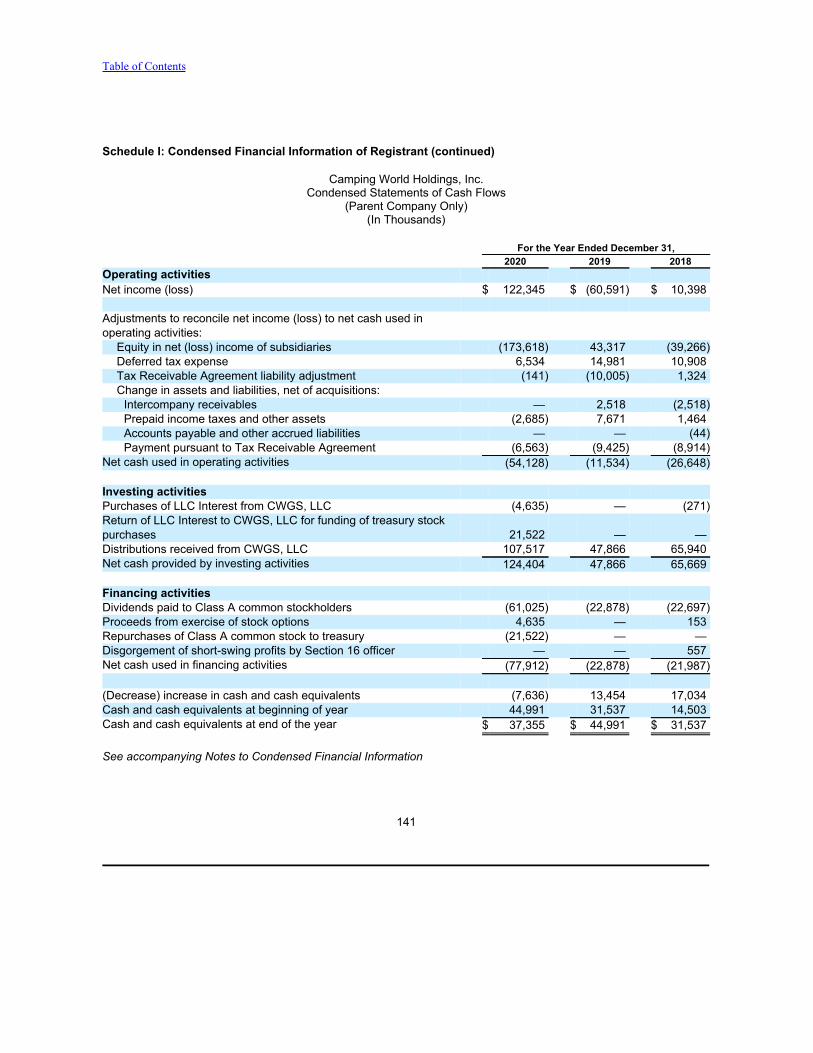
Table of Contents
141
Schedule I: Condensed Financial Information of Registrant (continued)
Camping World Holdings, Inc.Condensed Statements of Cash Flows
(Parent Company Only)(In Thousands)
For the Year Ended December 31, 2020 2019 2018
Operating activitiesNet income (loss) $ 122,345 $ (60,591) $ 10,398
Adjustments to reconcile net income (loss) to net cash used inoperating activities:
Equity in net (loss) income of subsidiaries (173,618) 43,317 (39,266)Deferred tax expense 6,534 14,981 10,908Tax Receivable Agreement liability adjustment (141) (10,005) 1,324Change in assets and liabilities, net of acquisitions:
Intercompany receivables — 2,518 (2,518)Prepaid income taxes and other assets (2,685) 7,671 1,464Accounts payable and other accrued liabilities — — (44)Payment pursuant to Tax Receivable Agreement (6,563) (9,425) (8,914)
Net cash used in operating activities (54,128) (11,534) (26,648)
Investing activitiesPurchases of LLC Interest from CWGS, LLC (4,635) — (271)Return of LLC Interest to CWGS, LLC for funding of treasury stockpurchases 21,522 — —Distributions received from CWGS, LLC 107,517 47,866 65,940Net cash provided by investing activities 124,404 47,866 65,669
Financing activitiesDividends paid to Class A common stockholders (61,025) (22,878) (22,697)Proceeds from exercise of stock options 4,635 — 153Repurchases of Class A common stock to treasury (21,522) — —Disgorgement of short-swing profits by Section 16 officer — — 557Net cash used in financing activities (77,912) (22,878) (21,987)
(Decrease) increase in cash and cash equivalents (7,636) 13,454 17,034Cash and cash equivalents at beginning of year 44,991 31,537 14,503Cash and cash equivalents at end of the year $ 37,355 $ 44,991 $ 31,537
See accompanying Notes to Condensed Financial Information
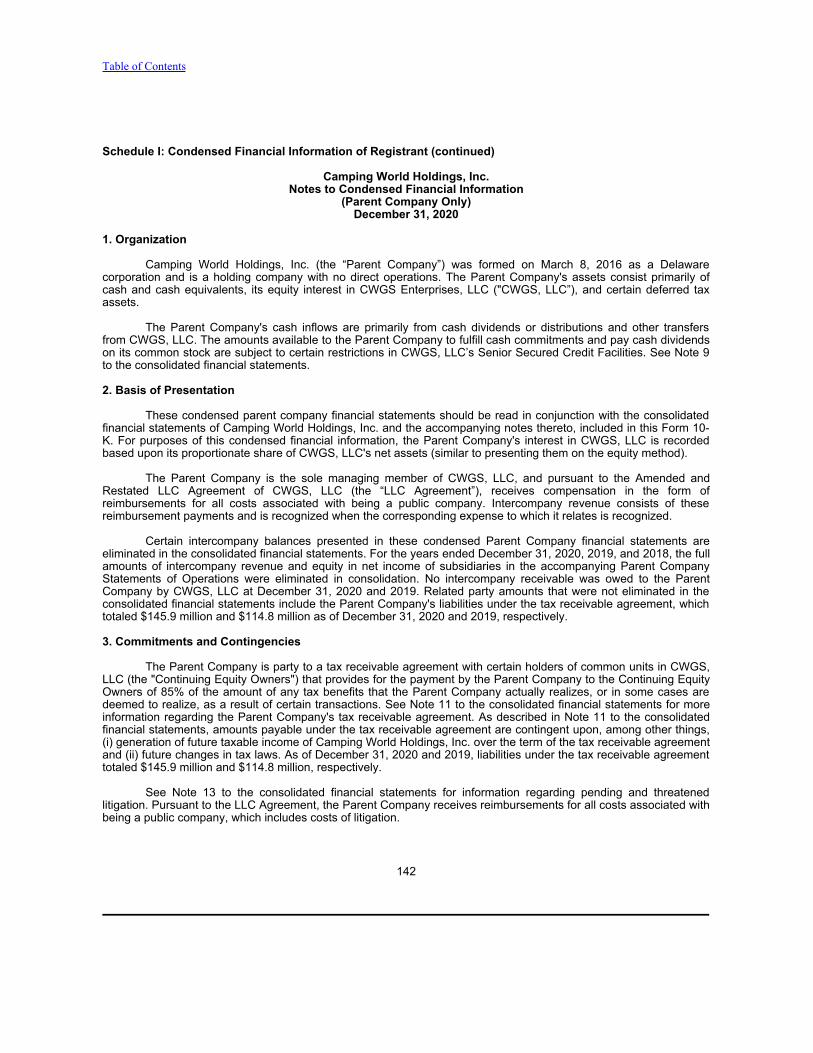
Table of Contents
142
Schedule I: Condensed Financial Information of Registrant (continued)
Camping World Holdings, Inc.Notes to Condensed Financial Information
(Parent Company Only)December 31, 2020
1. Organization
Camping World Holdings, Inc. (the “Parent Company”) was formed on March 8, 2016 as a Delawarecorporation and is a holding company with no direct operations. The Parent Company's assets consist primarily ofcash and cash equivalents, its equity interest in CWGS Enterprises, LLC ("CWGS, LLC”), and certain deferred taxassets.
The Parent Company's cash inflows are primarily from cash dividends or distributions and other transfersfrom CWGS, LLC. The amounts available to the Parent Company to fulfill cash commitments and pay cash dividendson its common stock are subject to certain restrictions in CWGS, LLC’s Senior Secured Credit Facilities. See Note 9to the consolidated financial statements.
2. Basis of Presentation
These condensed parent company financial statements should be read in conjunction with the consolidatedfinancial statements of Camping World Holdings, Inc. and the accompanying notes thereto, included in this Form 10-K. For purposes of this condensed financial information, the Parent Company's interest in CWGS, LLC is recordedbased upon its proportionate share of CWGS, LLC's net assets (similar to presenting them on the equity method).
The Parent Company is the sole managing member of CWGS, LLC, and pursuant to the Amended andRestated LLC Agreement of CWGS, LLC (the “LLC Agreement”), receives compensation in the form ofreimbursements for all costs associated with being a public company. Intercompany revenue consists of thesereimbursement payments and is recognized when the corresponding expense to which it relates is recognized.
Certain intercompany balances presented in these condensed Parent Company financial statements areeliminated in the consolidated financial statements. For the years ended December 31, 2020, 2019, and 2018, the fullamounts of intercompany revenue and equity in net income of subsidiaries in the accompanying Parent CompanyStatements of Operations were eliminated in consolidation. No intercompany receivable was owed to the ParentCompany by CWGS, LLC at December 31, 2020 and 2019. Related party amounts that were not eliminated in theconsolidated financial statements include the Parent Company's liabilities under the tax receivable agreement, whichtotaled $145.9 million and $114.8 million as of December 31, 2020 and 2019, respectively.
3. Commitments and Contingencies
The Parent Company is party to a tax receivable agreement with certain holders of common units in CWGS,LLC (the "Continuing Equity Owners") that provides for the payment by the Parent Company to the Continuing EquityOwners of 85% of the amount of any tax benefits that the Parent Company actually realizes, or in some cases aredeemed to realize, as a result of certain transactions. See Note 11 to the consolidated financial statements for moreinformation regarding the Parent Company's tax receivable agreement. As described in Note 11 to the consolidatedfinancial statements, amounts payable under the tax receivable agreement are contingent upon, among other things,(i) generation of future taxable income of Camping World Holdings, Inc. over the term of the tax receivable agreementand (ii) future changes in tax laws. As of December 31, 2020 and 2019, liabilities under the tax receivable agreementtotaled $145.9 million and $114.8 million, respectively.
See Note 13 to the consolidated financial statements for information regarding pending and threatenedlitigation. Pursuant to the LLC Agreement, the Parent Company receives reimbursements for all costs associated withbeing a public company, which includes costs of litigation.
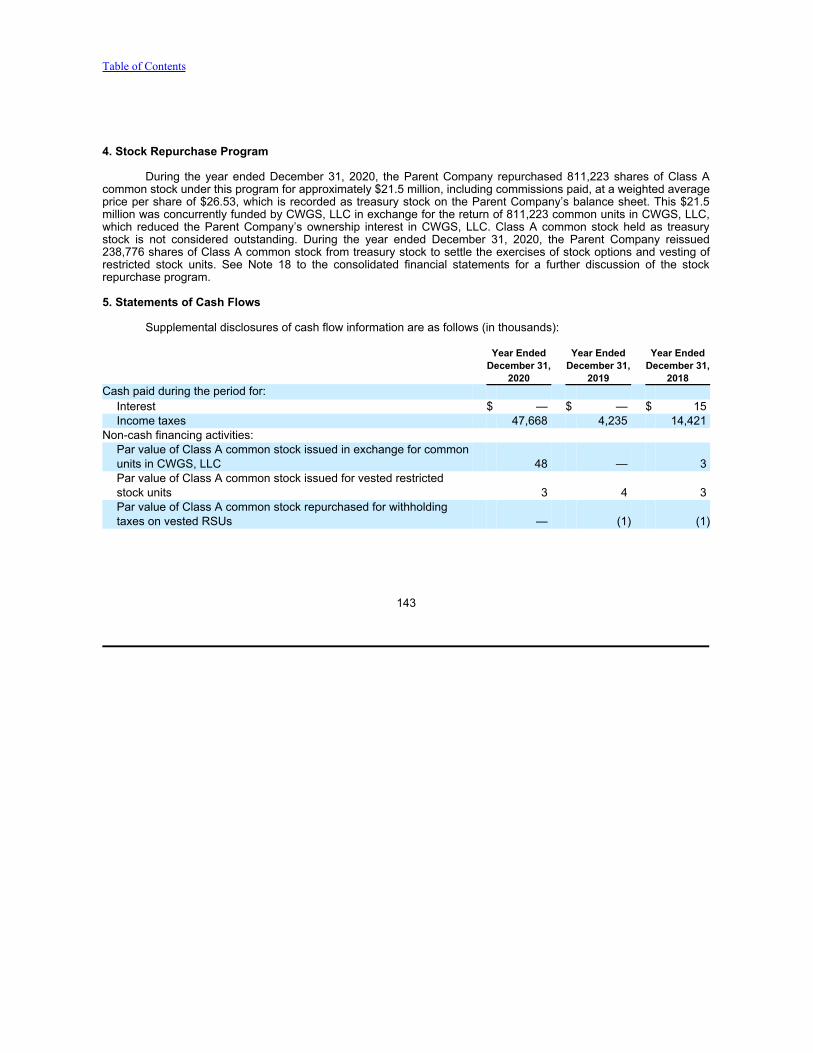
Table of Contents
143
4. Stock Repurchase Program
During the year ended December 31, 2020, the Parent Company repurchased 811,223 shares of Class Acommon stock under this program for approximately $21.5 million, including commissions paid, at a weighted averageprice per share of $26.53, which is recorded as treasury stock on the Parent Company’s balance sheet. This $21.5million was concurrently funded by CWGS, LLC in exchange for the return of 811,223 common units in CWGS, LLC,which reduced the Parent Company’s ownership interest in CWGS, LLC. Class A common stock held as treasurystock is not considered outstanding. During the year ended December 31, 2020, the Parent Company reissued238,776 shares of Class A common stock from treasury stock to settle the exercises of stock options and vesting ofrestricted stock units. See Note 18 to the consolidated financial statements for a further discussion of the stockrepurchase program.
5. Statements of Cash Flows
Supplemental disclosures of cash flow information are as follows (in thousands):
Year Ended Year Ended Year EndedDecember 31, December 31, December 31,
2020 2019 2018Cash paid during the period for:
Interest $ — $ — $ 15Income taxes 47,668 4,235 14,421
Non-cash financing activities:Par value of Class A common stock issued in exchange for commonunits in CWGS, LLC 48 — 3Par value of Class A common stock issued for vested restrictedstock units 3 4 3Par value of Class A common stock repurchased for withholdingtaxes on vested RSUs — (1) (1)
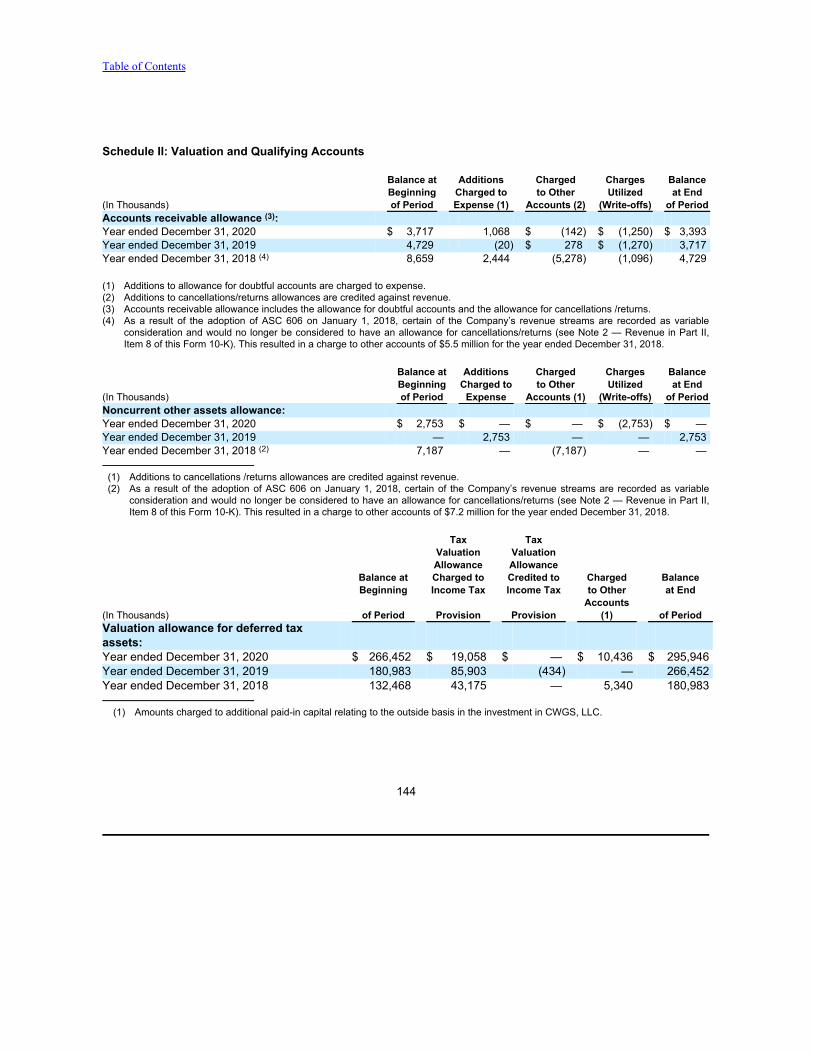
Table of Contents
144
Schedule II: Valuation and Qualifying Accounts
Balance at Additions Charged Charges Balance Beginning Charged to to Other Utilized at End
(In Thousands) of Period Expense (1) Accounts (2) (Write-offs) of PeriodAccounts receivable allowance (3):Year ended December 31, 2020 $ 3,717 1,068 $ (142) $ (1,250) $ 3,393Year ended December 31, 2019 4,729 (20) $ 278 $ (1,270) 3,717Year ended December 31, 2018 (4) 8,659 2,444 (5,278) (1,096) 4,729
(1) Additions to allowance for doubtful accounts are charged to expense.(2) Additions to cancellations/returns allowances are credited against revenue.(3) Accounts receivable allowance includes the allowance for doubtful accounts and the allowance for cancellations /returns.(4) As a result of the adoption of ASC 606 on January 1, 2018, certain of the Company’s revenue streams are recorded as variable
consideration and would no longer be considered to have an allowance for cancellations/returns (see Note 2 — Revenue in Part II,Item 8 of this Form 10-K). This resulted in a charge to other accounts of $5.5 million for the year ended December 31, 2018.
Balance at Additions Charged Charges Balance Beginning Charged to to Other Utilized at End
(In Thousands) of Period Expense Accounts (1) (Write-offs) of PeriodNoncurrent other assets allowance:Year ended December 31, 2020 $ 2,753 $ — $ — $ (2,753) $ —Year ended December 31, 2019 — 2,753 — — 2,753Year ended December 31, 2018 (2) 7,187 — (7,187) — —
(1) Additions to cancellations /returns allowances are credited against revenue.(2) As a result of the adoption of ASC 606 on January 1, 2018, certain of the Company’s revenue streams are recorded as variable
consideration and would no longer be considered to have an allowance for cancellations/returns (see Note 2 — Revenue in Part II,Item 8 of this Form 10-K). This resulted in a charge to other accounts of $7.2 million for the year ended December 31, 2018.
TaxValuation
TaxValuation
Allowance AllowanceBalance at Charged to Credited to Charged Balance
Beginning Income Tax Income Tax to Other at End
(In Thousands) of Period Provision Provision Accounts
(1) of PeriodValuation allowance for deferred taxassets:Year ended December 31, 2020 $ 266,452 $ 19,058 $ — $ 10,436 $ 295,946Year ended December 31, 2019 180,983 85,903 (434) — 266,452Year ended December 31, 2018 132,468 43,175 — 5,340 180,983
(1) Amounts charged to additional paid-in capital relating to the outside basis in the investment in CWGS, LLC.
Table of Contents
145
ITEM 9. Changes in and Disagreements with Accountants on Accounting and Financial Disclosure
None.
ITEM 9A. Controls and Procedures
Limitations on Effectiveness of Controls and Procedures
In designing and evaluating our disclosure controls and procedures, management recognizes that anycontrols and procedures, no matter how well designed and operated, can provide only reasonable assurance ofachieving the desired control objectives. In addition, the design of disclosure controls and procedures must reflect thefact that there are resource constraints and that management is required to apply judgment in evaluating the benefitsof possible controls and procedures relative to their costs.
Evaluation of Disclosure Controls and Procedures
Our management, with the participation of our chief executive officer and chief financial officer, has evaluatedthe effectiveness of our disclosure controls and procedures (as defined in Rules 13a-15(e) and 15d-15(e) under theSecurities Exchange Act of 1934, as amended, or the "Exchange Act,") as of the end of the period covered by thisAnnual Report on Form 10-K. Based on this evaluation, our chief executive officer and chief financial officerconcluded that our disclosure controls and procedures were effective at the reasonable assurance level as ofDecember 31, 2020.
Management’s Annual Report on Internal Control over Financial Reporting
Our management is responsible for establishing and maintaining adequate internal control over financialreporting, as defined in Rule 13a-15(f) under the Exchange Act. Management conducted an assessment of theeffectiveness of our internal control over financial reporting based on the criteria set forth in Internal Control –Integrated Framework issued by the Committee of Sponsoring Organizations of the Treadway Commission (2013framework).
Our management has excluded from its assessment of internal control over financial reporting at December31, 2020 the internal control over financial reporting of several of our recently acquired businesses in 2020,comprised of nine dealerships and an RV furniture distributor (the “Excluded Acquisitions”). The ExcludedAcquisitions constituted $35.7 million and $17.5 million of total assets and net assets, respectively, as of December31, 2020, and $10.1 million and $0.5 million of revenues and net loss, respectively, for the year then ended.
Based on our assessment, our management concluded that our internal control over financial reporting waseffective as of December 31, 2020.
Our internal control over financial reporting as of December 31, 2020, has been audited by Deloitte & ToucheLLP, the independent registered public accounting firm who has also audited our consolidated financial statements,as stated in their report which is included on page 147.
Changes in Internal Control over Financial Reporting
During the quarter ended December 31, 2020, we completed the process of incorporating the internalcontrols for the businesses we acquired in 2019, comprised of three dealerships (the “2019 Excluded Acquisitions”),into our internal control over financial reporting and extending our Section 404 compliance program under theSarbanes-Oxley Act of 2002 and the applicable rules and regulations under such Act to include the 2019 ExcludedAcquisitions.
Table of Contents
146
Except as otherwise described above, there was no change in our internal control over financial reporting (asdefined in Rules 13a-15(f) and 15d-15(f) under the Exchange Act) identified in connection with the evaluation of ourinternal control performed during the fiscal quarter ended December 31, 2020, that has materially affected, or isreasonably likely to materially affect, our internal control over financial reporting.
Table of Contents
147
REPORT OF INDEPENDENT REGISTERED PUBLIC ACCOUNTING FIRM
To the Stockholders and the Board of Directors of Camping World Holdings, Inc. and subsidiaries
Opinion on Internal Control over Financial Reporting
We have audited the internal control over financial reporting of Camping World Holdings, Inc. and subsidiaries (the“Company”) as of December 31, 2020, based on criteria established in Internal Control — Integrated Framework(2013) issued by the Committee of Sponsoring Organizations of the Treadway Commission (COSO). In our opinion,the Company maintained, in all material respects, effective internal control over financial reporting as of December31, 2020, based on criteria established in Internal Control — Integrated Framework (2013) issued by COSO.
We have also audited, in accordance with the standards of the Public Company Accounting Oversight Board (UnitedStates) (PCAOB), the consolidated financial statements as of and for the year ended December 31, 2020, of theCompany and our report dated February 26, 2021, expressed an unqualified opinion on those financial statements.
As described in Management's Annual Report on Internal Control over Financial Reporting, management excludedfrom its assessment the internal control over financial reporting at the Company's recently acquired businesses in2020, comprised of nine dealerships and an RV furniture distributor (the "Excluded Acquisitions"), and whosefinancial statements constitute $35.7 million and $17.5 million of total assets and net assets, respectively, as ofDecember 31, 2020, and $10.1 million and $0.5 million of revenues and net loss, respectively, for the year thenended. Accordingly, our audit did not include the internal control over financial reporting at the Excluded Acquisitions.
Basis for Opinion
The Company’s management is responsible for maintaining effective internal control over financial reporting and forits assessment of the effectiveness of internal control over financial reporting, included in the accompanyingManagement's Annual Report on Internal Control over Financial Reporting. Our responsibility is to express an opinionon the Company’s internal control over financial reporting based on our audit. We are a public accounting firmregistered with the PCAOB and are required to be independent with respect to the Company in accordance with theU.S. federal securities laws and the applicable rules and regulations of the Securities and Exchange Commission andthe PCAOB.
We conducted our audit in accordance with the standards of the PCAOB. Those standards require that we plan andperform the audit to obtain reasonable assurance about whether effective internal control over financial reporting wasmaintained in all material respects. Our audit included obtaining an understanding of internal control over financialreporting, assessing the risk that a material weakness exists, testing and evaluating the design and operatingeffectiveness of internal control based on the assessed risk, and performing such other procedures as we considerednecessary in the circumstances. We believe that our audit provides a reasonable basis for our opinion.
Definition and Limitations of Internal Control over Financial Reporting
A company’s internal control over financial reporting is a process designed to provide reasonable assuranceregarding the reliability of financial reporting and the preparation of financial statements for external purposes inaccordance with generally accepted accounting principles. A company’s internal control over financial reportingincludes those policies and procedures that (1) pertain to the maintenance of records that, in reasonable detail,accurately and fairly reflect the transactions and dispositions of the assets of the company; (2) provide reasonableassurance that transactions are recorded as necessary to permit preparation of financial statements in accordancewith generally accepted accounting principles, and that receipts and expenditures of the company are being madeonly in accordance with authorizations of management and directors of the company; and (3) provide reasonableassurance regarding prevention or timely detection of unauthorized acquisition, use, or disposition of the company’sassets that could have a material effect on the financial statements.
Table of Contents
148
Because of its inherent limitations, internal control over financial reporting may not prevent or detect misstatements.Also, projections of any evaluation of effectiveness to future periods are subject to the risk that controls may becomeinadequate because of changes in conditions, or that the degree of compliance with the policies or procedures maydeteriorate.
/s/ Deloitte & Touche LLP
Los Angeles, CaliforniaFebruary 26, 2021
ITEM 9B. Other Information
Not applicable
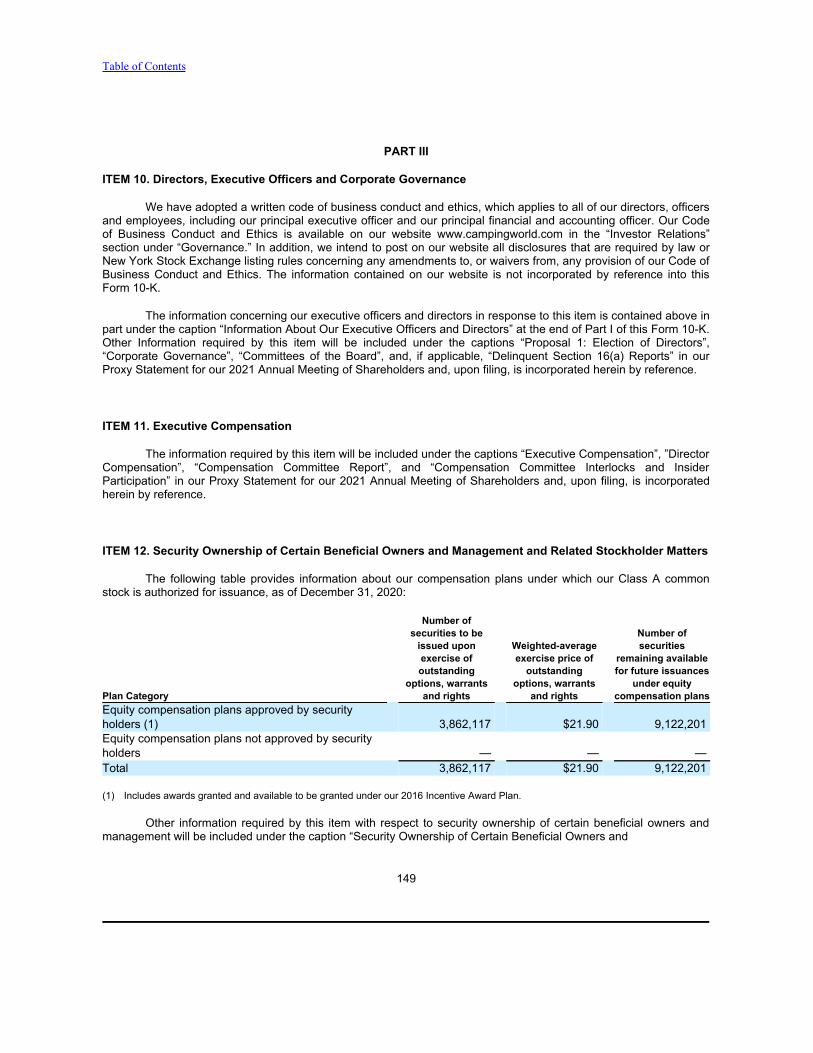
Table of Contents
149
PART III
ITEM 10. Directors, Executive Officers and Corporate Governance
We have adopted a written code of business conduct and ethics, which applies to all of our directors, officersand employees, including our principal executive officer and our principal financial and accounting officer. Our Codeof Business Conduct and Ethics is available on our website www.campingworld.com in the “Investor Relations”section under “Governance.” In addition, we intend to post on our website all disclosures that are required by law orNew York Stock Exchange listing rules concerning any amendments to, or waivers from, any provision of our Code ofBusiness Conduct and Ethics. The information contained on our website is not incorporated by reference into thisForm 10-K.
The information concerning our executive officers and directors in response to this item is contained above inpart under the caption “Information About Our Executive Officers and Directors” at the end of Part I of this Form 10-K.Other Information required by this item will be included under the captions “Proposal 1: Election of Directors”,“Corporate Governance”, “Committees of the Board”, and, if applicable, “Delinquent Section 16(a) Reports” in ourProxy Statement for our 2021 Annual Meeting of Shareholders and, upon filing, is incorporated herein by reference.
ITEM 11. Executive Compensation
The information required by this item will be included under the captions “Executive Compensation”, ”DirectorCompensation”, “Compensation Committee Report”, and “Compensation Committee Interlocks and InsiderParticipation” in our Proxy Statement for our 2021 Annual Meeting of Shareholders and, upon filing, is incorporatedherein by reference.
ITEM 12. Security Ownership of Certain Beneficial Owners and Management and Related Stockholder Matters
The following table provides information about our compensation plans under which our Class A commonstock is authorized for issuance, as of December 31, 2020:
Plan Category
Number ofsecurities to be
issued uponexercise ofoutstanding
options, warrantsand rights
Weighted-averageexercise price of
outstandingoptions, warrants
and rights
Number ofsecurities
remaining availablefor future issuances
under equitycompensation plans
Equity compensation plans approved by securityholders (1) 3,862,117 $21.90 9,122,201Equity compensation plans not approved by securityholders — — —Total 3,862,117 $21.90 9,122,201
(1) Includes awards granted and available to be granted under our 2016 Incentive Award Plan.
Other information required by this item with respect to security ownership of certain beneficial owners andmanagement will be included under the caption “Security Ownership of Certain Beneficial Owners and
Table of Contents
150
Management” and “Equity Compensation Plan Information” in our Proxy Statement for our 2021 Annual Meeting ofShareholders and, upon filing, is incorporated herein by reference.
ITEM 13. Certain Relationships and Related Transactions, and Director Independence
The information required by this item will be included under the captions “Certain Relationships and RelatedPerson Transactions” and “Corporate Governance—Director Independence” in our Proxy Statement for our 2021Annual Meeting of Shareholders and, upon filing, is incorporated herein by reference.
ITEM 14. Principal Accountant Fees and Services
The information required by this item will be included under the caption “Independent Registered PublicAccounting Firm Fees and Other Matters” in our Proxy Statement for our 2021 Annual Meeting of Shareholders and,upon filing, is incorporated herein by reference.
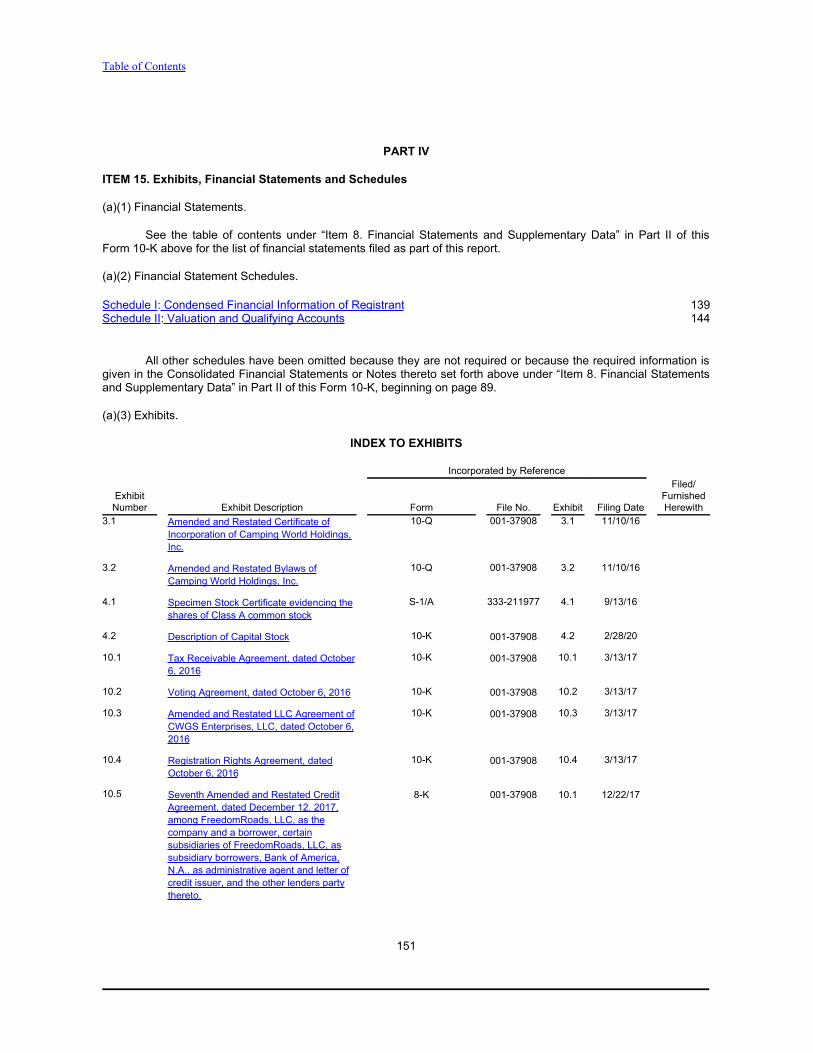
Table of Contents
151
PART IV
ITEM 15. Exhibits, Financial Statements and Schedules
(a)(1) Financial Statements.
See the table of contents under “Item 8. Financial Statements and Supplementary Data” in Part II of thisForm 10-K above for the list of financial statements filed as part of this report.
(a)(2) Financial Statement Schedules.
Schedule I: Condensed Financial Information of Registrant 139Schedule II: Valuation and Qualifying Accounts 144
All other schedules have been omitted because they are not required or because the required information isgiven in the Consolidated Financial Statements or Notes thereto set forth above under “Item 8. Financial Statementsand Supplementary Data” in Part II of this Form 10-K, beginning on page 89.
(a)(3) Exhibits.
INDEX TO EXHIBITS
Incorporated by Reference
ExhibitNumber Exhibit Description Form File No. Exhibit Filing Date
Filed/FurnishedHerewith
3.1 Amended and Restated Certificate ofIncorporation of Camping World Holdings,Inc.
10-Q 001-37908 3.1 11/10/16
3.2 Amended and Restated Bylaws ofCamping World Holdings, Inc.
10-Q 001-37908 3.2 11/10/16
4.1 Specimen Stock Certificate evidencing theshares of Class A common stock
S-1/A 333-211977 4.1 9/13/16
4.2 Description of Capital Stock 10-K 001-37908 4.2 2/28/20
10.1 Tax Receivable Agreement, dated October6, 2016
10-K 001-37908 10.1 3/13/17
10.2 Voting Agreement, dated October 6, 2016 10-K 001-37908 10.2 3/13/17
10.3 Amended and Restated LLC Agreement ofCWGS Enterprises, LLC, dated October 6,2016
10-K 001-37908 10.3 3/13/17
10.4 Registration Rights Agreement, datedOctober 6, 2016
10-K 001-37908 10.4 3/13/17
10.5 Seventh Amended and Restated CreditAgreement, dated December 12, 2017,among FreedomRoads, LLC, as thecompany and a borrower, certainsubsidiaries of FreedomRoads, LLC, assubsidiary borrowers, Bank of America,N.A., as administrative agent and letter ofcredit issuer, and the other lenders partythereto.
8-K 001-37908 10.1 12/22/17
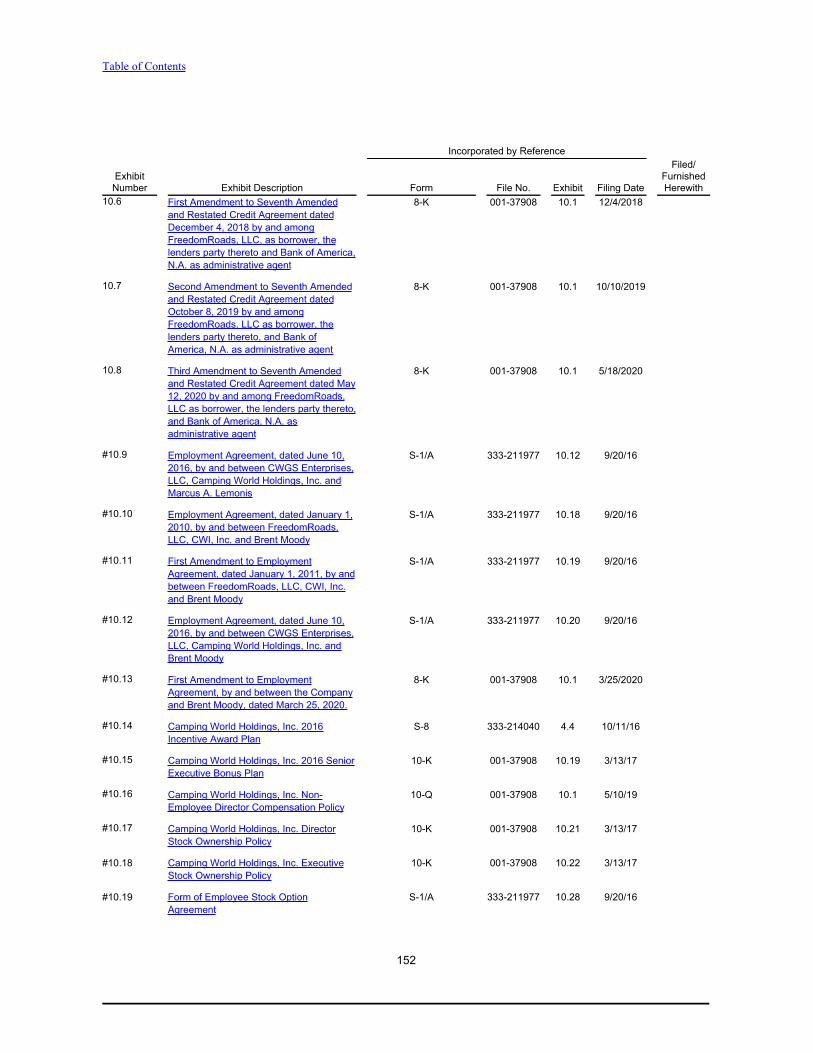
Table of Contents
152
Incorporated by Reference
ExhibitNumber Exhibit Description Form File No. Exhibit Filing Date
Filed/FurnishedHerewith
10.6 First Amendment to Seventh Amendedand Restated Credit Agreement datedDecember 4, 2018 by and amongFreedomRoads, LLC, as borrower, thelenders party thereto and Bank of America,N.A. as administrative agent
8-K 001-37908 10.1 12/4/2018
10.7 Second Amendment to Seventh Amendedand Restated Credit Agreement datedOctober 8, 2019 by and amongFreedomRoads, LLC as borrower, thelenders party thereto, and Bank ofAmerica, N.A. as administrative agent
8-K 001-37908 10.1 10/10/2019
10.8 Third Amendment to Seventh Amendedand Restated Credit Agreement dated May12, 2020 by and among FreedomRoads,LLC as borrower, the lenders party thereto,and Bank of America, N.A. asadministrative agent
8-K 001-37908 10.1 5/18/2020
#10.9 Employment Agreement, dated June 10,2016, by and between CWGS Enterprises,LLC, Camping World Holdings, Inc. andMarcus A. Lemonis
S-1/A 333-211977 10.12 9/20/16
#10.10 Employment Agreement, dated January 1,2010, by and between FreedomRoads,LLC, CWI, Inc. and Brent Moody
S-1/A 333-211977 10.18 9/20/16
#10.11 First Amendment to EmploymentAgreement, dated January 1, 2011, by andbetween FreedomRoads, LLC, CWI, Inc.and Brent Moody
S-1/A 333-211977 10.19 9/20/16
#10.12 Employment Agreement, dated June 10,2016, by and between CWGS Enterprises,LLC, Camping World Holdings, Inc. andBrent Moody
S-1/A 333-211977 10.20 9/20/16
#10.13 First Amendment to EmploymentAgreement, by and between the Companyand Brent Moody, dated March 25, 2020.
8-K 001-37908 10.1 3/25/2020
#10.14 Camping World Holdings, Inc. 2016Incentive Award Plan
S-8 333-214040 4.4 10/11/16
#10.15 Camping World Holdings, Inc. 2016 SeniorExecutive Bonus Plan
10-K 001-37908 10.19 3/13/17
#10.16 Camping World Holdings, Inc. Non-Employee Director Compensation Policy
10-Q 001-37908 10.1 5/10/19
#10.17 Camping World Holdings, Inc. DirectorStock Ownership Policy
10-K 001-37908 10.21 3/13/17
#10.18 Camping World Holdings, Inc. ExecutiveStock Ownership Policy
10-K 001-37908 10.22 3/13/17
#10.19 Form of Employee Stock OptionAgreement
S-1/A 333-211977 10.28 9/20/16
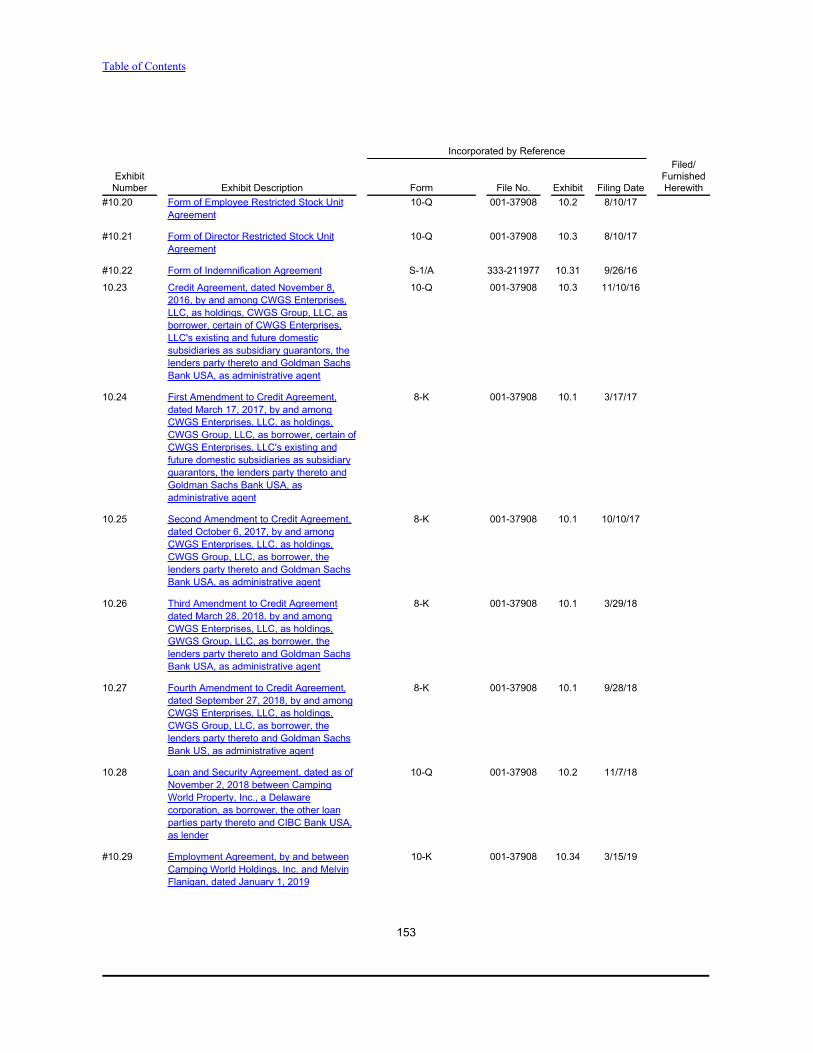
Table of Contents
153
Incorporated by Reference
ExhibitNumber Exhibit Description Form File No. Exhibit Filing Date
Filed/FurnishedHerewith
#10.20 Form of Employee Restricted Stock UnitAgreement
10-Q 001-37908 10.2 8/10/17
#10.21 Form of Director Restricted Stock UnitAgreement
10-Q 001-37908 10.3 8/10/17
#10.22 Form of Indemnification Agreement S-1/A 333-211977 10.31 9/26/16
10.23 Credit Agreement, dated November 8,2016, by and among CWGS Enterprises,LLC, as holdings, CWGS Group, LLC, asborrower, certain of CWGS Enterprises,LLC's existing and future domesticsubsidiaries as subsidiary guarantors, thelenders party thereto and Goldman SachsBank USA, as administrative agent
10-Q 001-37908 10.3 11/10/16
10.24 First Amendment to Credit Agreement,dated March 17, 2017, by and amongCWGS Enterprises, LLC, as holdings,CWGS Group, LLC, as borrower, certain ofCWGS Enterprises, LLC's existing andfuture domestic subsidiaries as subsidiaryguarantors, the lenders party thereto andGoldman Sachs Bank USA, asadministrative agent
8-K 001-37908 10.1 3/17/17
10.25 Second Amendment to Credit Agreement,dated October 6, 2017, by and amongCWGS Enterprises, LLC, as holdings,CWGS Group, LLC, as borrower, thelenders party thereto and Goldman SachsBank USA, as administrative agent
8-K 001-37908 10.1 10/10/17
10.26 Third Amendment to Credit Agreementdated March 28, 2018, by and amongCWGS Enterprises, LLC, as holdings,GWGS Group, LLC, as borrower, thelenders party thereto and Goldman SachsBank USA, as administrative agent
8-K 001-37908 10.1 3/29/18
10.27 Fourth Amendment to Credit Agreement,dated September 27, 2018, by and amongCWGS Enterprises, LLC, as holdings,CWGS Group, LLC, as borrower, thelenders party thereto and Goldman SachsBank US, as administrative agent
8-K 001-37908 10.1 9/28/18
10.28 Loan and Security Agreement, dated as ofNovember 2, 2018 between CampingWorld Property, Inc., a Delawarecorporation, as borrower, the other loanparties party thereto and CIBC Bank USA,as lender
10-Q 001-37908 10.2 11/7/18
#10.29 Employment Agreement, by and betweenCamping World Holdings, Inc. and MelvinFlanigan, dated January 1, 2019
10-K 001-37908 10.34 3/15/19
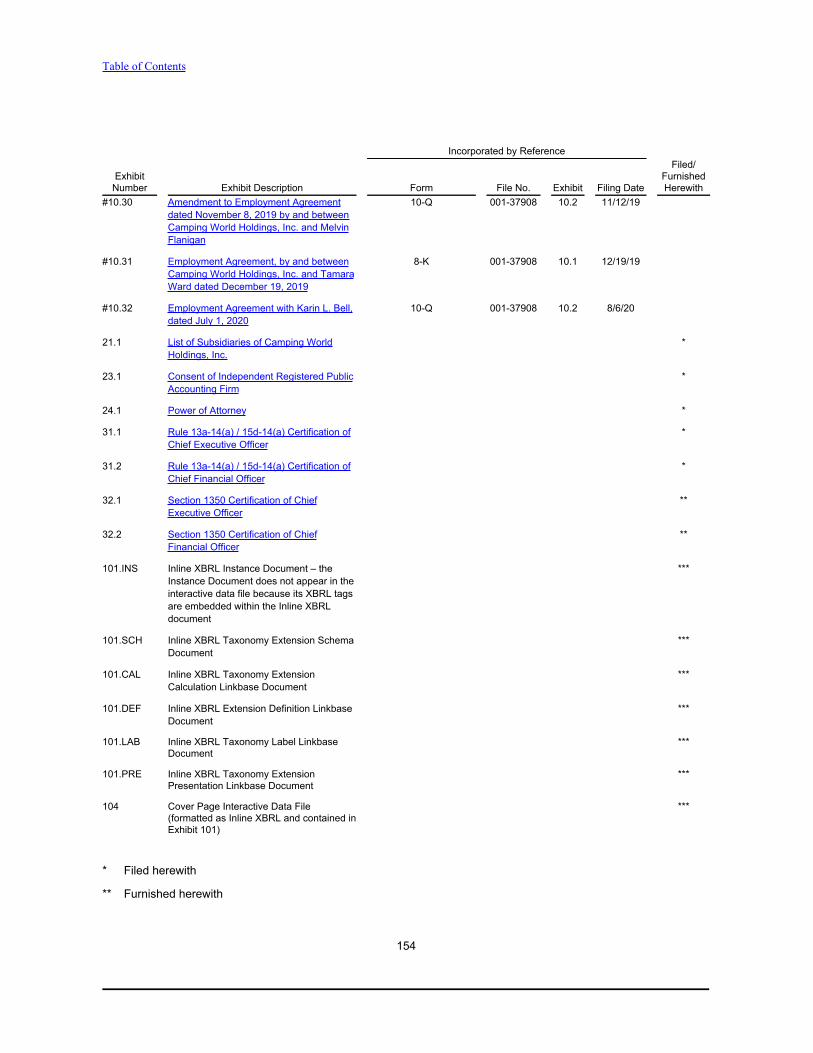
Table of Contents
154
Incorporated by Reference
ExhibitNumber Exhibit Description Form File No. Exhibit Filing Date
Filed/FurnishedHerewith
#10.30 Amendment to Employment Agreementdated November 8, 2019 by and betweenCamping World Holdings, Inc. and MelvinFlanigan
10-Q 001-37908 10.2 11/12/19
#10.31 Employment Agreement, by and betweenCamping World Holdings, Inc. and TamaraWard dated December 19, 2019
8-K 001-37908 10.1 12/19/19
#10.32 Employment Agreement with Karin L. Bell,dated July 1, 2020
10-Q 001-37908 10.2 8/6/20
21.1 List of Subsidiaries of Camping WorldHoldings, Inc.
*
23.1 Consent of Independent Registered PublicAccounting Firm
*
24.1 Power of Attorney *
31.1 Rule 13a-14(a) / 15d-14(a) Certification ofChief Executive Officer
*
31.2 Rule 13a-14(a) / 15d-14(a) Certification ofChief Financial Officer
*
32.1 Section 1350 Certification of ChiefExecutive Officer
**
32.2 Section 1350 Certification of ChiefFinancial Officer
**
101.INS Inline XBRL Instance Document – theInstance Document does not appear in theinteractive data file because its XBRL tagsare embedded within the Inline XBRLdocument
***
101.SCH Inline XBRL Taxonomy Extension SchemaDocument
***
101.CAL Inline XBRL Taxonomy ExtensionCalculation Linkbase Document
***
101.DEF Inline XBRL Extension Definition LinkbaseDocument
***
101.LAB Inline XBRL Taxonomy Label LinkbaseDocument
***
101.PRE Inline XBRL Taxonomy ExtensionPresentation Linkbase Document
***
104 Cover Page Interactive Data File(formatted as Inline XBRL and contained inExhibit 101)
***
* Filed herewith
** Furnished herewith
Table of Contents
155
*** Submitted electronically herewith
# Indicates management contract or compensatory plan
ITEM 16. Form 10-K Summary
None
Table of Contents
156
Signatures
Pursuant to the requirements of Section 13 or 15(d) of the Securities Exchange Act of 1934, the registranthas duly caused this report to be signed on its behalf by the undersigned, thereunto duly authorized.
Camping World Holdings, Inc.
Date: February 26, 2021 By: /s/ MARCUS A. LEMONISMarcus A. Lemonis
Chairman and Chief Executive Officer
Pursuant to the requirements of the Securities Exchange Act of 1934, as amended, this report has beensigned below by the following persons on behalf of the registrant and in the capacities set forth opposite to theirnames and on the dates indicated.
Signature Title Date
/s/ MARCUS A. LEMONIS Chairman, Chief Executive Officer and Director (PrincipalExecutive Officer) February 26, 2021Marcus A. Lemonis
/s/ KARIN L. BELL Chief Financial Officer (Principal Financial Officer andPrincipal Accounting Officer) February 26, 2021Karin L. Bell
* DirectorStephen Adams
* DirectorAndris A. Baltins
* DirectorBrian P. Cassidy
* DirectorMary J. George
* DirectorMichael W. Malone
* President, Camping World Holdings, Inc. and DirectorBrent L. Moody
* DirectorK. Dillon Schickli
*By: /s/ MARCUS A. LEMONISFebruary 26, 2021Marcus A. Lemonis
Attorney-in-fact
Ch 5
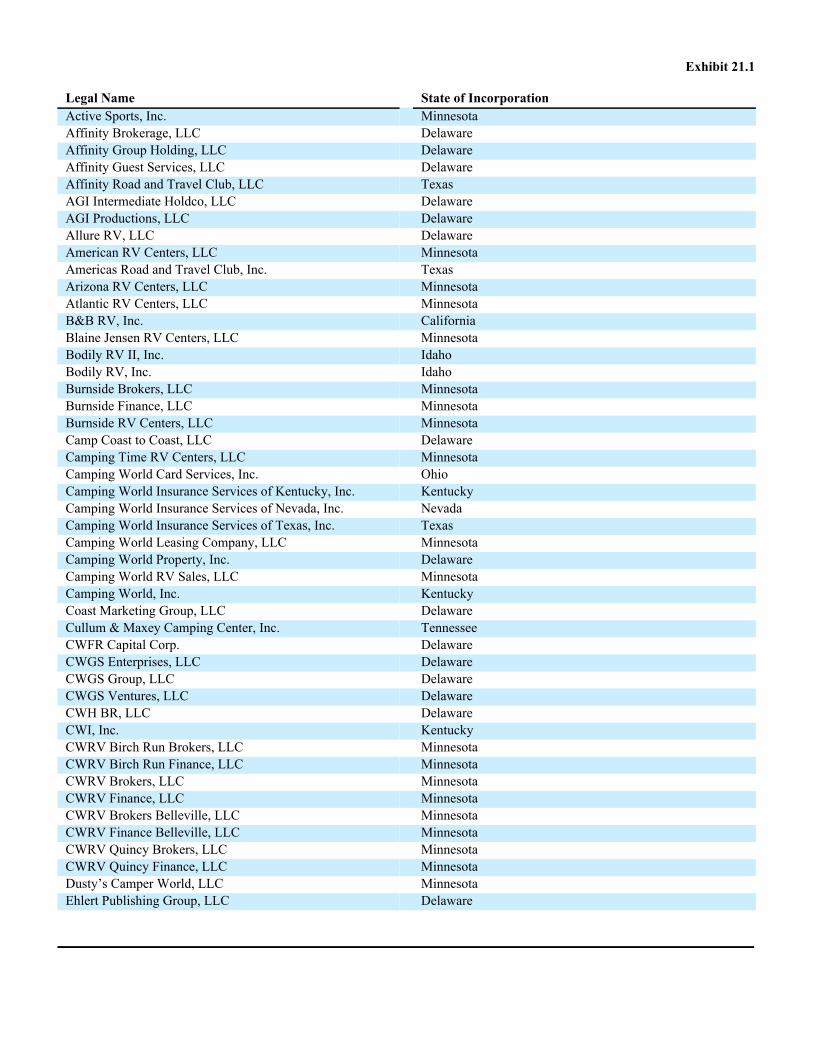
Exhibit 21.1
Legal Name State of IncorporationActive Sports, Inc. MinnesotaAffinity Brokerage, LLC DelawareAffinity Group Holding, LLC DelawareAffinity Guest Services, LLC DelawareAffinity Road and Travel Club, LLC TexasAGI Intermediate Holdco, LLC DelawareAGI Productions, LLC DelawareAllure RV, LLC DelawareAmerican RV Centers, LLC MinnesotaAmericas Road and Travel Club, Inc. TexasArizona RV Centers, LLC MinnesotaAtlantic RV Centers, LLC MinnesotaB&B RV, Inc. CaliforniaBlaine Jensen RV Centers, LLC MinnesotaBodily RV II, Inc. IdahoBodily RV, Inc. IdahoBurnside Brokers, LLC MinnesotaBurnside Finance, LLC MinnesotaBurnside RV Centers, LLC MinnesotaCamp Coast to Coast, LLC DelawareCamping Time RV Centers, LLC MinnesotaCamping World Card Services, Inc. OhioCamping World Insurance Services of Kentucky, Inc. KentuckyCamping World Insurance Services of Nevada, Inc. NevadaCamping World Insurance Services of Texas, Inc. TexasCamping World Leasing Company, LLC MinnesotaCamping World Property, Inc. DelawareCamping World RV Sales, LLC MinnesotaCamping World, Inc. KentuckyCoast Marketing Group, LLC DelawareCullum & Maxey Camping Center, Inc. TennesseeCWFR Capital Corp. DelawareCWGS Enterprises, LLC DelawareCWGS Group, LLC DelawareCWGS Ventures, LLC DelawareCWH BR, LLC DelawareCWI, Inc. KentuckyCWRV Birch Run Brokers, LLC MinnesotaCWRV Birch Run Finance, LLC MinnesotaCWRV Brokers, LLC MinnesotaCWRV Finance, LLC MinnesotaCWRV Brokers Belleville, LLC MinnesotaCWRV Finance Belleville, LLC MinnesotaCWRV Quincy Brokers, LLC MinnesotaCWRV Quincy Finance, LLC MinnesotaDusty’s Camper World, LLC MinnesotaEhlert Publishing Group, LLC Delaware
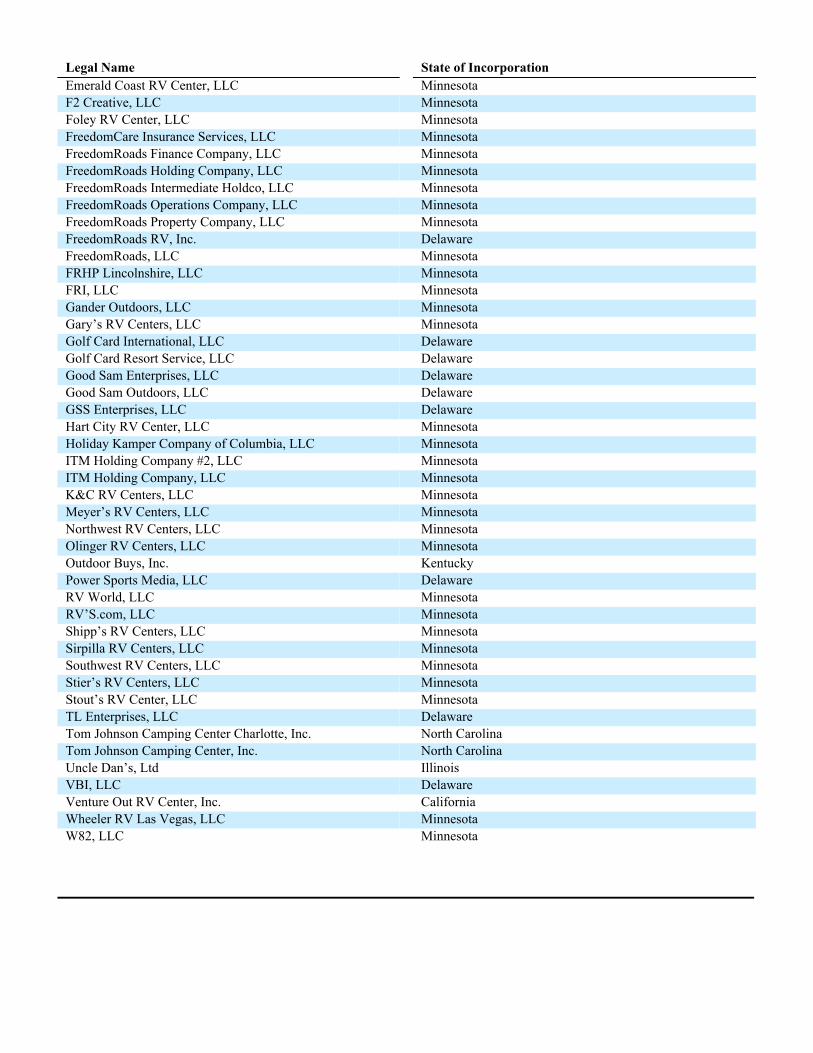
Legal Name State of IncorporationEmerald Coast RV Center, LLC MinnesotaF2 Creative, LLC MinnesotaFoley RV Center, LLC MinnesotaFreedomCare Insurance Services, LLC MinnesotaFreedomRoads Finance Company, LLC MinnesotaFreedomRoads Holding Company, LLC MinnesotaFreedomRoads Intermediate Holdco, LLC MinnesotaFreedomRoads Operations Company, LLC MinnesotaFreedomRoads Property Company, LLC MinnesotaFreedomRoads RV, Inc. DelawareFreedomRoads, LLC MinnesotaFRHP Lincolnshire, LLC MinnesotaFRI, LLC MinnesotaGander Outdoors, LLC MinnesotaGary’s RV Centers, LLC MinnesotaGolf Card International, LLC DelawareGolf Card Resort Service, LLC DelawareGood Sam Enterprises, LLC DelawareGood Sam Outdoors, LLC DelawareGSS Enterprises, LLC DelawareHart City RV Center, LLC MinnesotaHoliday Kamper Company of Columbia, LLC MinnesotaITM Holding Company #2, LLC MinnesotaITM Holding Company, LLC MinnesotaK&C RV Centers, LLC MinnesotaMeyer’s RV Centers, LLC MinnesotaNorthwest RV Centers, LLC MinnesotaOlinger RV Centers, LLC MinnesotaOutdoor Buys, Inc. KentuckyPower Sports Media, LLC DelawareRV World, LLC MinnesotaRV’S.com, LLC MinnesotaShipp’s RV Centers, LLC MinnesotaSirpilla RV Centers, LLC MinnesotaSouthwest RV Centers, LLC MinnesotaStier’s RV Centers, LLC MinnesotaStout’s RV Center, LLC MinnesotaTL Enterprises, LLC DelawareTom Johnson Camping Center Charlotte, Inc. North CarolinaTom Johnson Camping Center, Inc. North CarolinaUncle Dan’s, Ltd IllinoisVBI, LLC DelawareVenture Out RV Center, Inc. CaliforniaWheeler RV Las Vegas, LLC MinnesotaW82, LLC Minnesota
Exhibit 23.1
CONSENT OF INDEPENDENT REGISTERED PUBLIC ACCOUNTING FIRM
We consent to the incorporation by reference in Registration Statement No. 333-214040 on Form S-8 ofour reports dated February 26, 2021, relating to the financial statements of Camping World Holdings,Inc. (the “Company”) and the effectiveness of the Company's internal control over financial reportingappearing in this Annual Report on Form 10-K for the year ended December 31, 2020.
/s/ Deloitte & Touche LLP
Los Angeles, CaliforniaFebruary 26, 2021
Exhibit 24.1
POWER OF ATTORNEY
KNOW ALL MEN BY THESE PRESENTS, that CAMPING WORLD HOLDINGS, INC., a Delaware corporation (the“Company”), and each of the undersigned directors of the Company, hereby constitutes and appoints Marcus A.Lemonis and Karin L. Bell, and each of them (with full power to each of them to act alone), his or her true and lawfulattorney-in-fact and agent, with full power of substitution and resubstitution, for him or her and on his or her behalf inhis or her name, place and stead, in any and all capacities to sign, execute, affix his or her seal thereto and file, orcause such actions to be taken with regards to, the Company’s Annual Report on Form 10-K for the year endedDecember 31, 2020 under the Securities Exchange Act of 1934, as amended, including any amendment oramendments thereto, with all exhibits and any all documents required to be filed with respect thereto with anyregulatory authority.
There is hereby granted to said attorneys-in-fact and agents, and each of them, full power and authority to do andperform each and every act and thing, requisite and necessary to be done in respect of the foregoing as fully as he orshe might or could do if personally present, thereby ratifying and confirming all that said attorneys-in-fact and agents,or their substitute or substitutes may lawfully do or cause to be done by virtue hereof.
This Power of Attorney may be executed in any number of counterparts, each of which shall be an original, but all ofwhich taken together shall constitute one and the same instrument and any of the undersigned directors may executethis Power of Attorney by signing any such counterpart.
Signature Title Date
/s/ Stephen Adams Director February 23, 2021Stephen Adams
/s/ Andris A. Baltins Director February 23, 2021Andris A. Baltins
/s/ Brian P. Cassidy Director February 23, 2021Brian P. Cassidy
/s/ Mary J. George Director February 23, 2021Mary J. George
/s/ Michael W. Malone Director February 23, 2021Michael W. Malone
/s/ Brent L. Moody President, Camping World Holdings andDirector
February 23, 2021Brent L. Moody
/s/ K. Dillon Schickli Director February 23, 2021K. Dillon Schickli

Exhibit 31.1
CERTIFICATIONS
I, Marcus A. Lemonis, certify that:
1. I have reviewed this Annual Report on Form 10-K of Camping World Holdings, Inc.;
2. Based on my knowledge, this report does not contain any untrue statement of a material fact or omit to state amaterial fact necessary to make the statements made, in light of the circumstances under which such statementswere made, not misleading with respect to the period covered by this report;
3. Based on my knowledge, the financial statements, and other financial information included in this report, fairlypresent in all material respects the financial condition, results of operations and cash flows of the registrant as of, andfor, the periods presented in this report;
4. The registrant's other certifying officer and I are responsible for establishing and maintaining disclosure controlsand procedures (as defined in Exchange Act Rules 13a-15(e) and 15d-15(e)) and internal control over financialreporting (as defined in Exchange Act Rules 13a-15(f) and 15d-15(f)) for the registrant and have:
(a) Designed such disclosure controls and procedures, or caused such disclosure controls and procedures tobe designed under our supervision, to ensure that material information relating to the registrant, including itsconsolidated subsidiaries, is made known to us by others within those entities, particularly during the period inwhich this report is being prepared;
(b) Designed such internal control over financial reporting, or caused such internal control over financialreporting to be designed under our supervision, to provide reasonable assurance regarding the reliability offinancial reporting and the preparation of financial statements for external purposes in accordance withgenerally accepted accounting principles;
(c) Evaluated the effectiveness of the registrant's disclosure controls and procedures and presented in thisreport our conclusions about the effectiveness of the disclosure controls and procedures, as of the end of theperiod covered by this report based on such evaluation; and
(d) Disclosed in this report any change in the registrant's internal control over financial reporting that occurredduring the registrant's most recent fiscal quarter (the registrant's fourth fiscal quarter in the case of an annualreport) that has materially affected, or is reasonably likely to materially affect, the registrant's internal controlover financial reporting; and
5. The registrant's other certifying officer and I have disclosed, based on our most recent evaluation of internal controlover financial reporting, to the registrant's auditors and the audit committee of the registrant's board of directors (orpersons performing the equivalent functions):
(a) All significant deficiencies and material weaknesses in the design or operation of internal control overfinancial reporting which are reasonably likely to adversely affect the registrant's ability to record, process,summarize and report financial information; and
(b) Any fraud, whether or not material, that involves management or other employees who have a significantrole in the registrant's internal control over financial reporting.
Date: February 26, 2021 By: /s/ Marcus A. Lemonis Marcus A. Lemonis Chairman and Chief Executive Officer (Principal Executive Officer)
Exhibit 31.2
CERTIFICATIONS
I, Karin L. Bell, certify that:
1. I have reviewed this Annual Report on Form 10-K of Camping World Holdings, Inc.;
2. Based on my knowledge, this report does not contain any untrue statement of a material fact or omit to state amaterial fact necessary to make the statements made, in light of the circumstances under which such statementswere made, not misleading with respect to the period covered by this report;
3. Based on my knowledge, the financial statements, and other financial information included in this report, fairlypresent in all material respects the financial condition, results of operations and cash flows of the registrant as of, andfor, the periods presented in this report;
4. The registrant's other certifying officer and I are responsible for establishing and maintaining disclosure controlsand procedures (as defined in Exchange Act Rules 13a-15(e) and 15d-15(e)) and internal control over financialreporting (as defined in Exchange Act Rules 13a-15(f) and 15d-15(f)) for the registrant and have:
(a) Designed such disclosure controls and procedures, or caused such disclosure controls and procedures tobe designed under our supervision, to ensure that material information relating to the registrant, including itsconsolidated subsidiaries, is made known to us by others within those entities, particularly during the period inwhich this report is being prepared;
(b) Designed such internal control over financial reporting, or caused such internal control over financialreporting to be designed under our supervision, to provide reasonable assurance regarding the reliability offinancial reporting and the preparation of financial statements for external purposes in accordance withgenerally accepted accounting principles;
(c) Evaluated the effectiveness of the registrant's disclosure controls and procedures and presented in thisreport our conclusions about the effectiveness of the disclosure controls and procedures, as of the end of theperiod covered by this report based on such evaluation; and
(d) Disclosed in this report any change in the registrant's internal control over financial reporting that occurredduring the registrant's most recent fiscal quarter (the registrant's fourth fiscal quarter in the case of an annualreport) that has materially affected, or is reasonably likely to materially affect, the registrant's internal controlover financial reporting; and
5. The registrant's other certifying officer and I have disclosed, based on our most recent evaluation of internal controlover financial reporting, to the registrant's auditors and the audit committee of the registrant's board of directors (orpersons performing the equivalent functions):
(a) All significant deficiencies and material weaknesses in the design or operation of internal control overfinancial reporting which are reasonably likely to adversely affect the registrant's ability to record, process,summarize and report financial information; and
(b) Any fraud, whether or not material, that involves management or other employees who have a significantrole in the registrant's internal control over financial reporting.
Date: February 26, 2021 By: /s/ Karin L. Bell Karin L. Bell Chief Financial Officer (Principal Financial Officer)
Exhibit 32.1
CERTIFICATION PURSUANT TO
18 U.S.C. SECTION 1350,
AS ADOPTED PURSUANT TO
SECTION 906 OF THE SARBANES-OXLEY ACT OF 2002
In connection with the Annual Report on Form 10-K of Camping World Holdings, Inc. (the “Company”)for the period ended December 31, 2020, as filed with the U.S. Securities and Exchange Commission on thedate hereof (the “Report”), I, Marcus A. Lemonis, Chairman and Chief Executive Officer of the Company,hereby certify, pursuant to 18 U.S.C. Section 1350, as adopted pursuant to Section 906 of the Sarbanes-OxleyAct of 2002, that, to my knowledge:
(1) the Report fully complies with the requirements of Section 13(a) or 15(d) of the Securities ExchangeAct of 1934, as amended; and
(2) the information contained in the Report fairly presents, in all material respects, the financialcondition and results of operations of the Company.
Date: February 26, 2021 By: /s/ Marcus A. Lemonis Marcus A. Lemonis Chairman and Chief Executive Officer (Principal Executive Officer)
Exhibit 32.2
CERTIFICATION PURSUANT TO
18 U.S.C. SECTION 1350,
AS ADOPTED PURSUANT TO
SECTION 906 OF THE SARBANES-OXLEY ACT OF 2002
In connection with the Annual Report on Form 10-K of Camping World Holdings, Inc. (the “Company”) for theperiod ended December 31, 2020, as filed with the U.S. Securities and Exchange Commission on the date hereof (the“Report”), I, Karin L. Bell, Chief Financial Officer of the Company, hereby certify, pursuant to 18 U.S.C. Section 1350,as adopted pursuant to Section 906 of the Sarbanes-Oxley Act of 2002, that, to my knowledge:
(1) the Report fully complies with the requirements of Section 13(a) or 15(d) of the Securities Exchange Act of1934, as amended; and
(2) the information contained in the Report fairly presents, in all material respects, the financial condition andresults of operations of the Company.
Date: February 26, 2021 By: /s/ Karin L. BellKarin L. BellChief Financial Officer(Principal Financial Officer)
![ç,#-.' - 3 · wv [uwsml pwuu][ kpiz ozqttml umlq\mzzivmiv ^mom\ijtm[ wzmoivw ^qviqozm\\m \]zsma jzmi[\ _ kzivjmzza omt zww\ ^mom\ijtm ozi\qv [uwsml piu ozi^a pz [tw_ kwwsml jmmn](https://img.pdfslide.us/doc/110x75/5f60acb38d678c77916bdd3d/-3-wv-uwsml-pwuu-kpiz-ozqttml-umlqmzzivmiv-momijtm-wzmoivw-qviqozmm.jpg)