Embed Size (px)
Citation preview

2020 © Aker Solutions
4Q 2019February 7, 2020Luis Araujo and Ole Martin Grimsrud

2020 © Aker Solutions
Agenda | 4Q 2019
February 7, 2020
IntroductionLuis AraujoChief Executive Officer
Q&A SessionLuis Araujo CEOOle Martin Grimsrud CFO
Questions
Answers
Fourth-Quarter Results 2019 Slide 2
FinancialsOle Martin GrimsrudChief Financial Officer
2020 © Aker Solutions
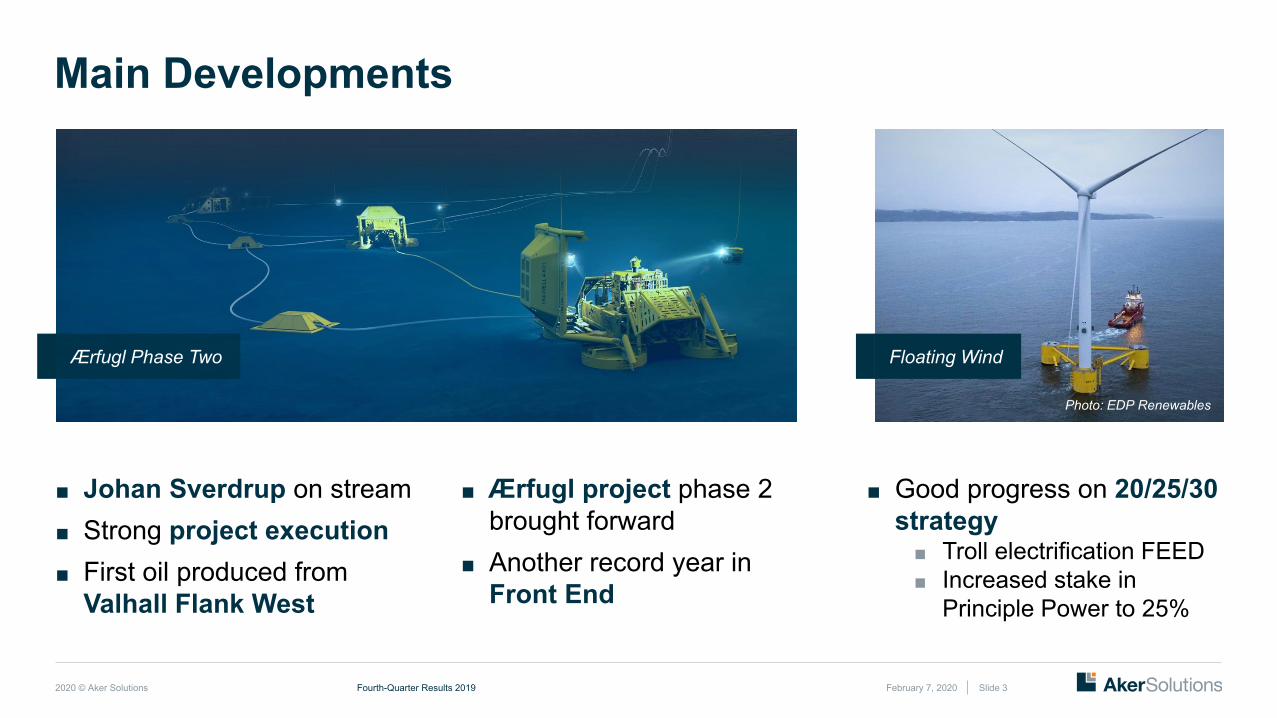
Main Developments
February 7, 2020Fourth-Quarter Results 2019 Slide 3
Ærfugl Phase Two
■ Johan Sverdrup on stream■ Strong project execution■ First oil produced from
Valhall Flank West
■ Ærfugl project phase 2 brought forward
■ Another record year in Front End
■ Good progress on 20/25/30 strategy■ Troll electrification FEED■ Increased stake in
Principle Power to 25%
Floating Wind
Photo: EDP Renewables
2020 © Aker Solutions
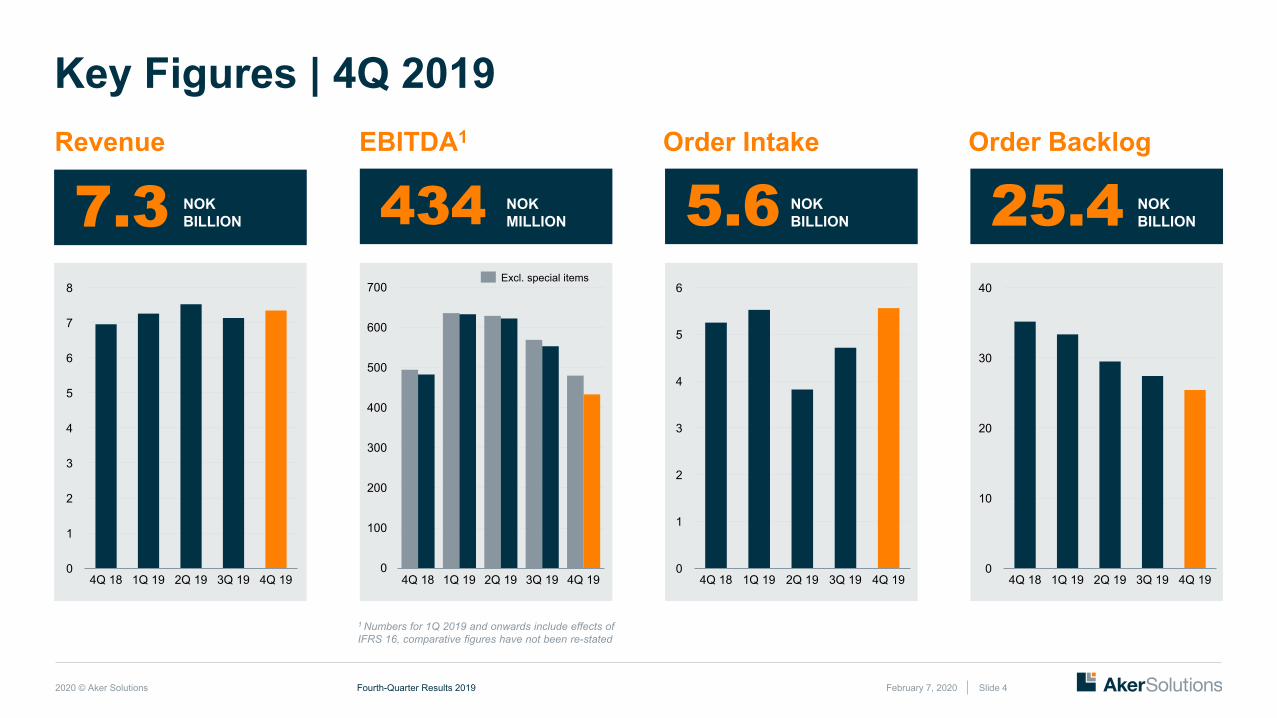
Key Figures | 4Q 2019Revenue EBITDA1 Order Intake
7.3 434 5.6 25.4 NOK BILLION
Order Backlog
NOK BILLION
NOK BILLION
NOK MILLION
0
100
200
300
400
500
600
700
1Q 194Q 18 2Q 19 3Q 19 4Q 190
4Q 18 2Q 191Q 19
2
4
1
3
5
6
3Q 19 4Q 19
40
10
0
20
30
4Q 18 1Q 19 2Q 19 3Q 19 4Q 19
1 Numbers for 1Q 2019 and onwards include effects of IFRS 16, comparative figures have not been re-stated
Excl. special items
February 7, 2020Fourth-Quarter Results 2019 Slide 4
2
0
3
5
1
4
6
7
8
4Q 18 1Q 19 2Q 19 3Q 19 4Q 19
2020 © Aker Solutions
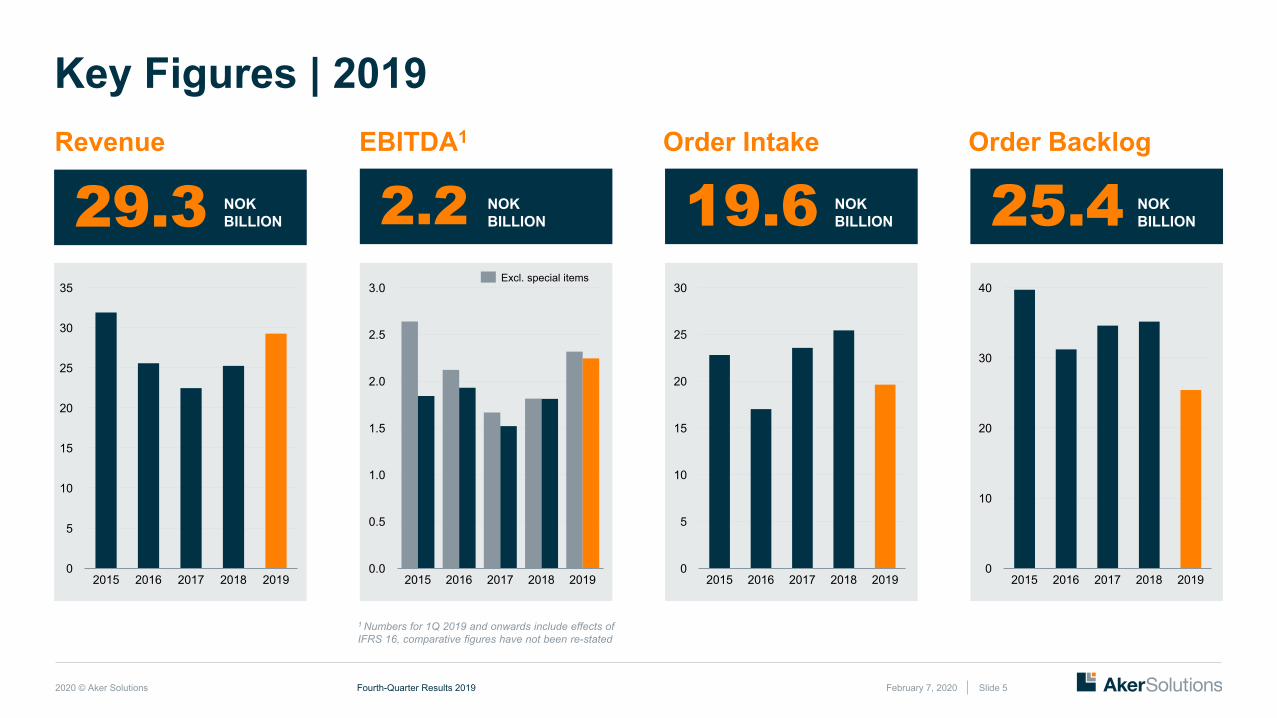
Key Figures | 2019Revenue EBITDA1 Order Intake
29.3 2.2 19.6 25.4 NOK BILLION
Order Backlog
NOK BILLION
NOK BILLION
NOK BILLION
0
10
35
5
15
20
25
30
20192015 2016 2017 2018
1.0
0.0
3.0
2.0
0.5
2.5
1.5
20162015 2017 2018 2019
30
0
5
10
15
20
25
201920162015 2017 2018
40
0
10
20
30
2015 2016 2017 2018 2019
1 Numbers for 1Q 2019 and onwards include effects of IFRS 16, comparative figures have not been re-stated
Excl. special items
February 7, 2020Fourth-Quarter Results 2019 Slide 5
2020 © Aker Solutions
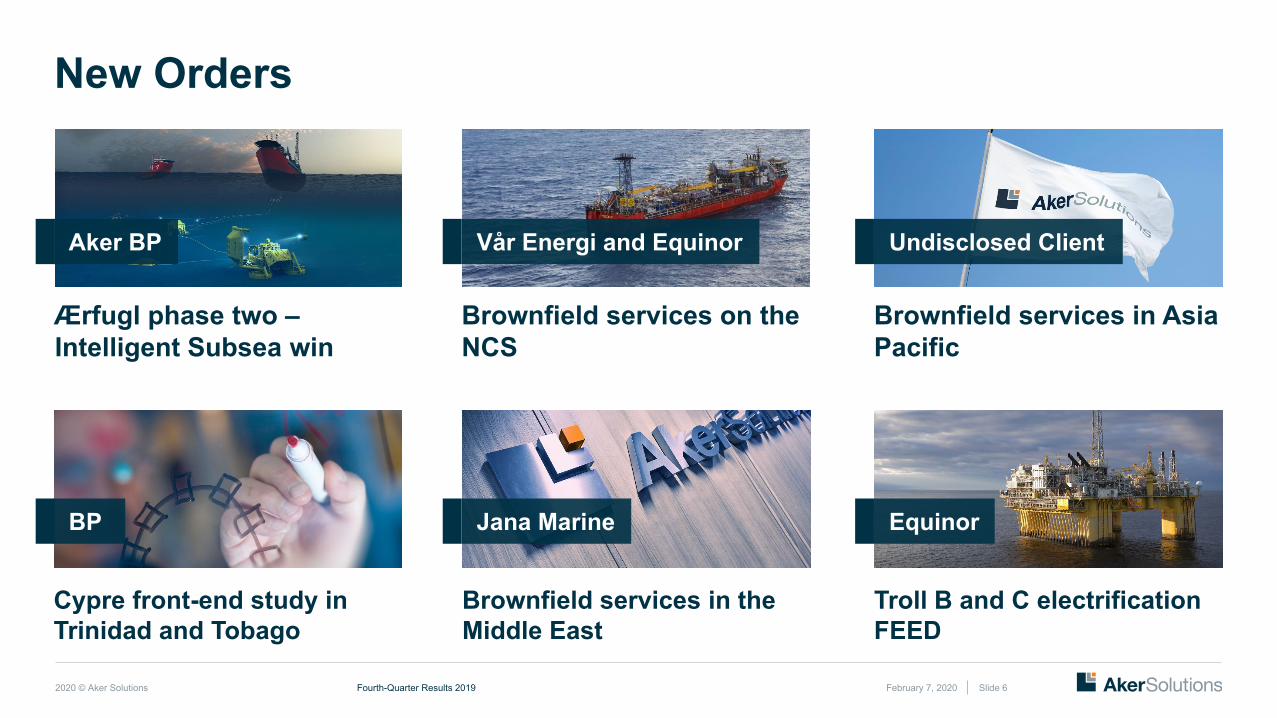
New Orders
February 7, 2020Fourth-Quarter Results 2019 Slide 6
Vår Energi and EquinorAker BP Undisclosed Client
Brownfield services in Asia Pacific
Brownfield services on the NCS
Ærfugl phase two –Intelligent Subsea win
BP EquinorJana Marine
Brownfield services in the Middle East
Cypre front-end study in Trinidad and Tobago
Troll B and C electrification FEED
2020 © Aker Solutions
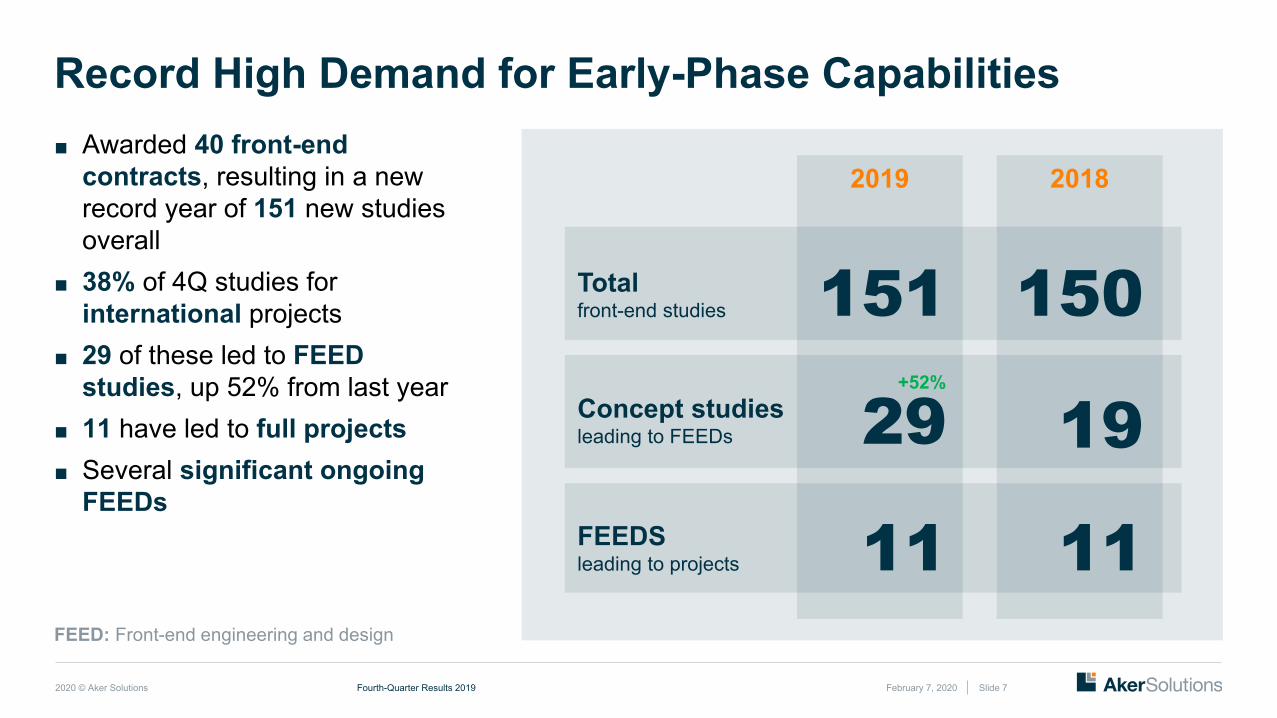
Record High Demand for Early-Phase Capabilities■ Awarded 40 front-end
contracts, resulting in a new record year of 151 new studies overall
■ 38% of 4Q studies for international projects
■ 29 of these led to FEED studies, up 52% from last year
■ 11 have led to full projects■ Several significant ongoing
FEEDs
February 7, 2020
FEED: Front-end engineering and design
2019 2018
Totalfront-end studies 151 150Concept studiesleading to FEEDs 29 19FEEDSleading to projects 1111
Fourth-Quarter Results 2019 Slide 7
+52%
2020 © Aker Solutions
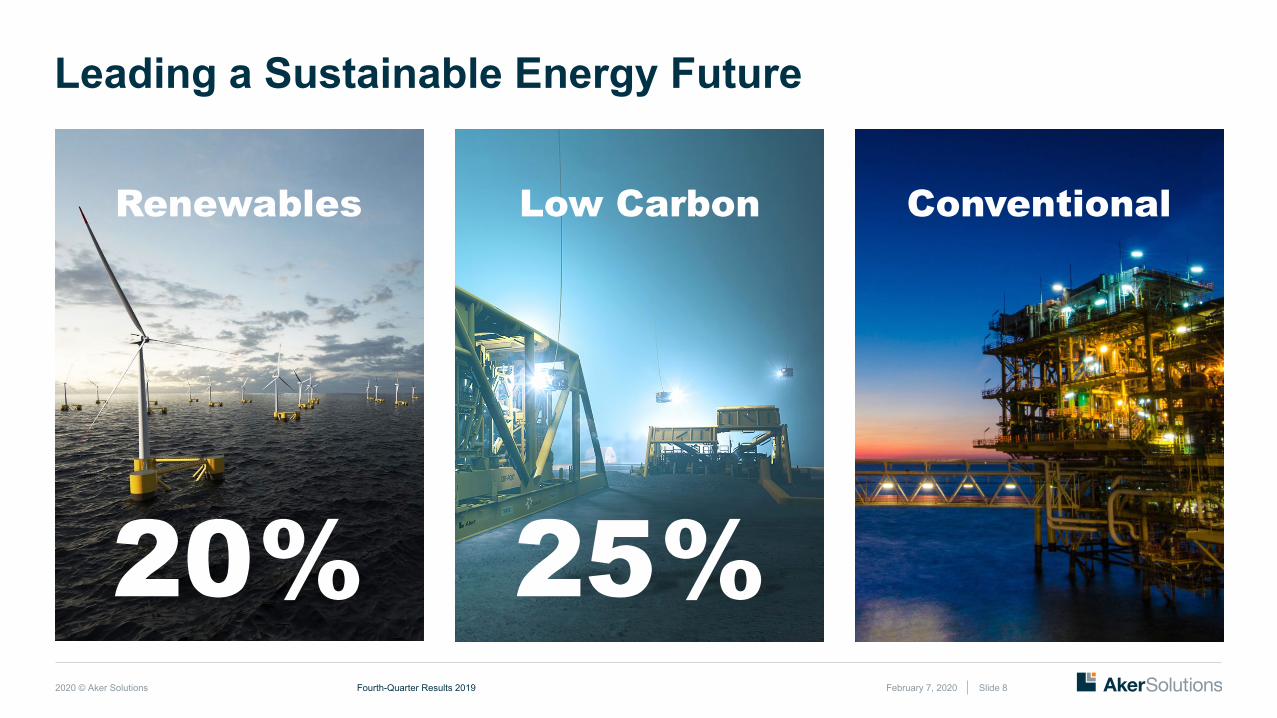
Leading a Sustainable Energy Future
February 7, 2020Fourth-Quarter Results 2019 Slide 8
ConventionalLow CarbonRenewables
20% 25%
2020 © Aker Solutions
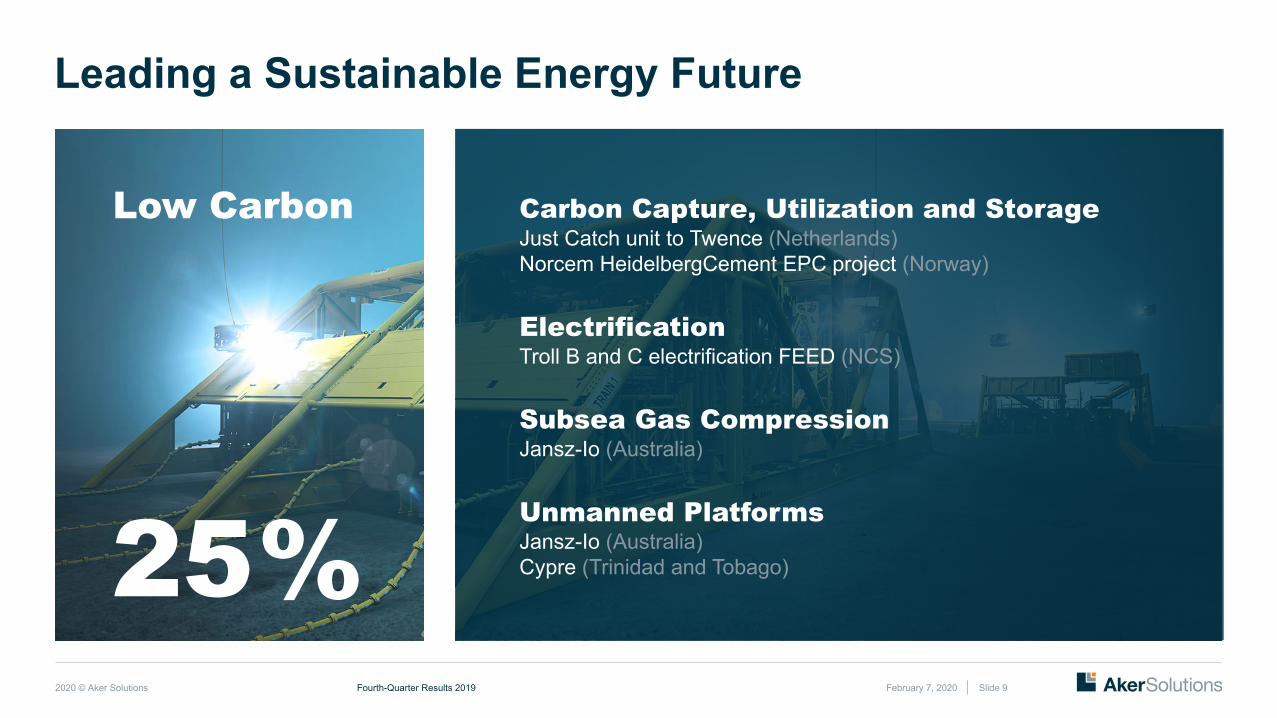
Leading a Sustainable Energy Future
February 7, 2020Fourth-Quarter Results 2019 Slide 9
Low Carbon
25%
Carbon Capture, Utilization and StorageJust Catch unit to Twence (Netherlands)Norcem HeidelbergCement EPC project (Norway)
ElectrificationTroll B and C electrification FEED (NCS)
Subsea Gas CompressionJansz-Io (Australia)
Unmanned PlatformsJansz-Io (Australia)Cypre (Trinidad and Tobago)
2020 © Aker Solutions
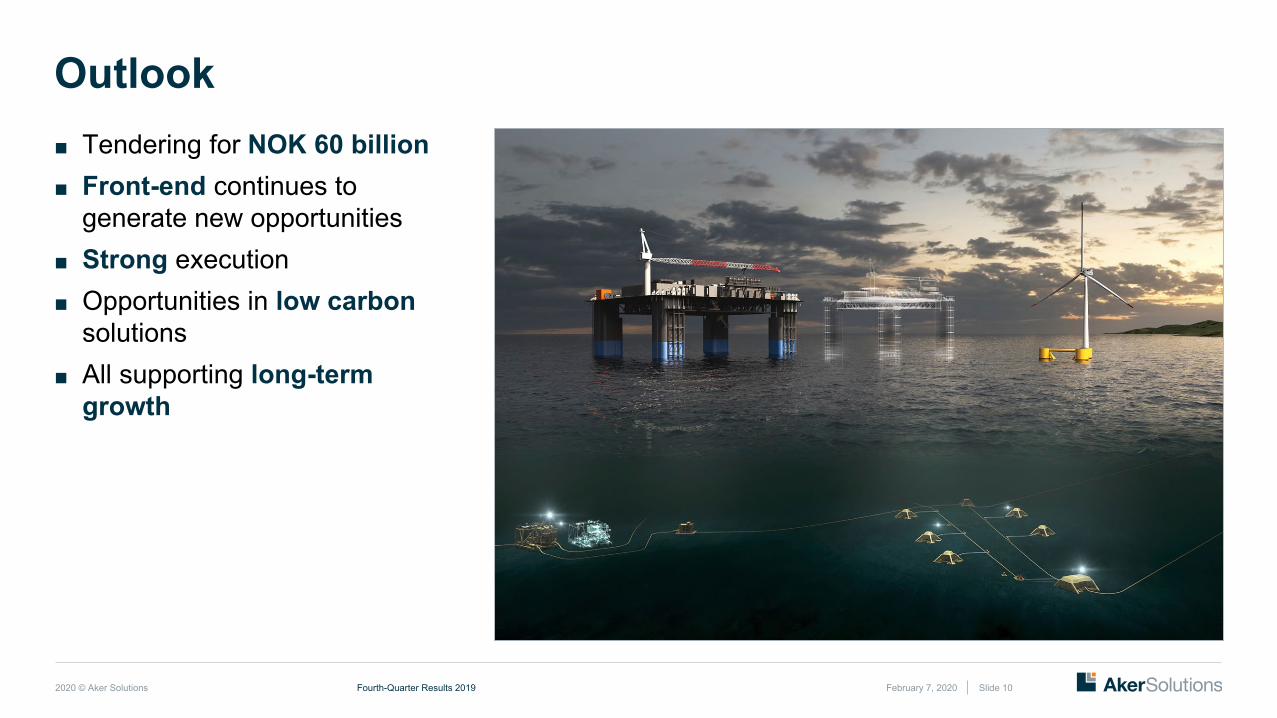
Outlook■ Tendering for NOK 60 billion■ Front-end continues to
generate new opportunities■ Strong execution■ Opportunities in low carbon
solutions■ All supporting long-term
growth
February 7, 2020Fourth-Quarter Results 2019 Slide 10

2020 © Aker Solutions
Agenda | 4Q 2019
IntroductionLuis AraujoChief Executive Officer
Questions
Answers
February 7, 2020Fourth-Quarter Results 2019 Slide 11
FinancialsOle Martin GrimsrudChief Financial Officer
Q&A SessionLuis Araujo CEOOle Martin Grimsrud CFO
2020 © Aker Solutions February 7, 2020Fourth-Quarter Results 2019 Slide 12
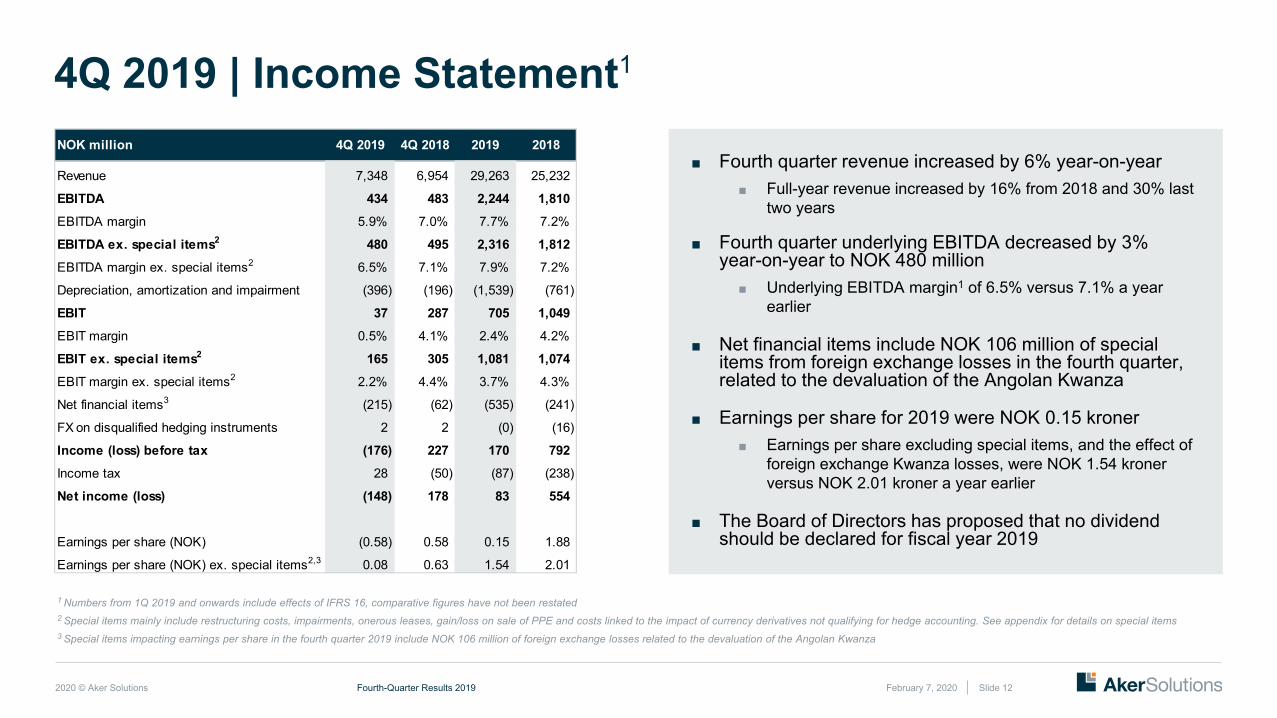
4Q 2019 | Income Statement1
1 Numbers from 1Q 2019 and onwards include effects of IFRS 16, comparative figures have not been restated2 Special items mainly include restructuring costs, impairments, onerous leases, gain/loss on sale of PPE and costs linked to the impact of currency derivatives not qualifying for hedge accounting. See appendix for details on special items3 Special items impacting earnings per share in the fourth quarter 2019 include NOK 106 million of foreign exchange losses related to the devaluation of the Angolan Kwanza
NOK million 4Q 2019 4Q 2018 2019 2018
Revenue 7,348 6,954 29,263 25,232
EBITDA 434 483 2,244 1,810 EBITDA margin 5.9% 7.0% 7.7% 7.2%
EBITDA ex. special items2 480 495 2,316 1,812 EBITDA margin ex. special items2 6.5% 7.1% 7.9% 7.2%
Depreciation, amortization and impairment (396) (196) (1,539) (761)
EBIT 37 287 705 1,049 EBIT margin 0.5% 4.1% 2.4% 4.2%
EBIT ex. special items2 165 305 1,081 1,074 EBIT margin ex. special items2 2.2% 4.4% 3.7% 4.3%
Net financial items3 (215) (62) (535) (241)
FX on disqualified hedging instruments 2 2 (0) (16)
Income (loss) before tax (176) 227 170 792 Income tax 28 (50) (87) (238)
Net income (loss) (148) 178 83 554
Earnings per share (NOK) (0.58) 0.58 0.15 1.88
Earnings per share (NOK) ex. special items2,3 0.08 0.63 1.54 2.01
■ Fourth quarter revenue increased by 6% year-on-year■ Full-year revenue increased by 16% from 2018 and 30% last
two years
■ Fourth quarter underlying EBITDA decreased by 3% year-on-year to NOK 480 million
■ Underlying EBITDA margin1 of 6.5% versus 7.1% a year earlier
■ Net financial items include NOK 106 million of special items from foreign exchange losses in the fourth quarter, related to the devaluation of the Angolan Kwanza
■ Earnings per share for 2019 were NOK 0.15 kroner■ Earnings per share excluding special items, and the effect of
foreign exchange Kwanza losses, were NOK 1.54 kroner versus NOK 2.01 kroner a year earlier
■ The Board of Directors has proposed that no dividend should be declared for fiscal year 2019
2020 © Aker Solutions
-2,000
-1,500
-1,000
-500
0
500
1,000
1,500
February 7, 2020Fourth-Quarter Results 2019 Slide 13
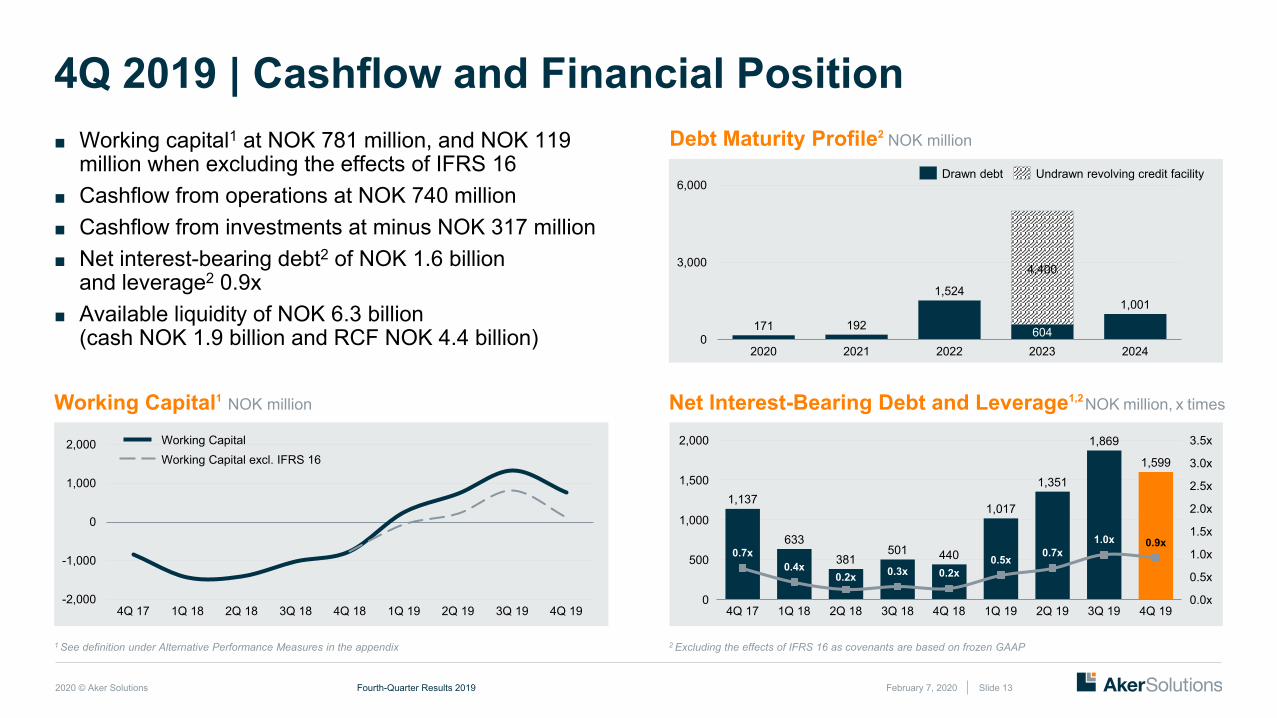
4Q 2019 | Cashflow and Financial Position ■ Working capital1 at NOK 781 million, and NOK 119
million when excluding the effects of IFRS 16■ Cashflow from operations at NOK 740 million■ Cashflow from investments at minus NOK 317 million■ Net interest-bearing debt2 of NOK 1.6 billion
and leverage2 0.9x■ Available liquidity of NOK 6.3 billion
(cash NOK 1.9 billion and RCF NOK 4.4 billion)
Debt Maturity Profile2 NOK million
Net Interest-Bearing Debt and Leverage1,2NOK million, x timesWorking Capital1 NOK million
1,137
633501
1,017
1,599
0.7x0.4x 0.3x 0.2x
0.5x 0.7x1.0x 0.9x
3.5x
1,500
0
1,000
500
2,000
1.5x
0.0x
0.5x
1.0x
2.0x
2.5x
3.0x
2Q 18 3Q 191Q 19
381
4Q 17 1Q 18
0.2x
3Q 18 4Q 18 2Q 19 4Q 19
440
1,351
1,869
2 Excluding the effects of IFRS 16 as covenants are based on frozen GAAP
-2,000
-1,000
0
1,000
2,000
3Q 18 2Q 191Q 184Q 17 2Q 18 4Q 18 1Q 19 3Q 19 4Q 19
171 192
1,524
604
1,001
0
3,000
6,000
20212020 20232022 2024
Drawn debt Undrawn revolving credit facility
1 See definition under Alternative Performance Measures in the appendix
Working CapitalWorking Capital excl. IFRS 16
4,400
2020 © Aker Solutions
348
478
475
455
455
6%
8% 8%
0%
2%
4%
6%
8%
10%
12%
0
100
200
300
400
500
600
199
203 25
5
217 30
3
5%4%
5%
4%
5%
0%
2%
4%
6%
8%
10%
12%
0
100
200
300
400
500
600
February 7, 2020Fourth-Quarter Results 2019 Slide 14
Revenue NOK billion
EBITDA and Margin1
NOK million, %EBIT and Margin1
NOK million, %Working CapitalNOK billion
2.0
4.0
0.0
1.0
3.0
5.0
6.0
7.0
6.0
5.6
4Q 18 1Q 19
6.0
2Q 19
5.6
3Q 19
5.7
4Q 19
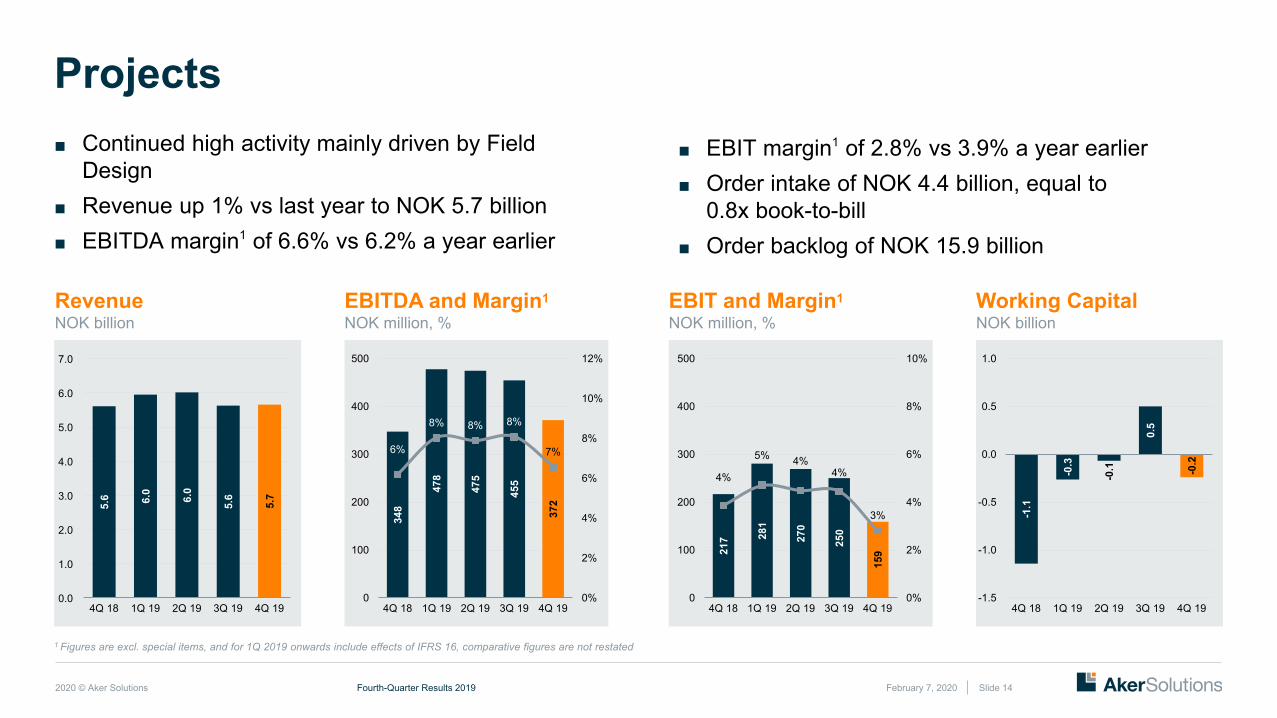
217 28
1
270
250
159
4%
5% 4%
3%
0%
2%
4%
6%
8%
10%
0
100
200
300
400
500
2Q 194Q 18 1Q 19
4%
3Q 19 4Q 19
-1.1
-0.3
-0.1
0.5
-0.2
-1.5
-1.0
-0.5
0.0
0.5
1.0
4Q 18 2Q 191Q 19 3Q 19 4Q 19
Projects■ Continued high activity mainly driven by Field
Design■ Revenue up 1% vs last year to NOK 5.7 billion■ EBITDA margin1 of 6.6% vs 6.2% a year earlier
■ EBIT margin1 of 2.8% vs 3.9% a year earlier■ Order intake of NOK 4.4 billion, equal to
0.8x book-to-bill■ Order backlog of NOK 15.9 billion
1 Figures are excl. special items, and for 1Q 2019 onwards include effects of IFRS 16, comparative figures are not restated
348
478
475
455
372
6%
8% 8% 8%
7%
0%
2%
4%
6%
8%
10%
12%
0
100
200
300
400
500
4Q 18 1Q 19 2Q 19 3Q 19 4Q 19
2020 © Aker Solutions February 7, 2020Fourth-Quarter Results 2019 Slide 15
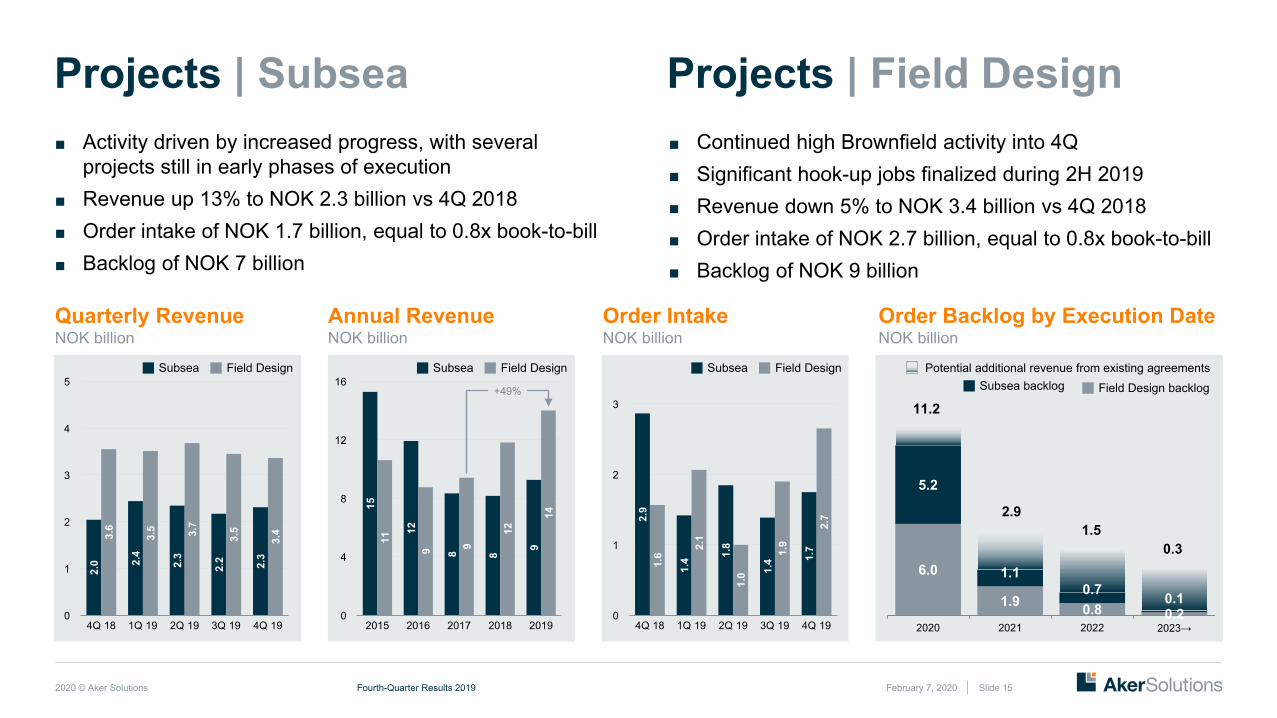
Projects | Subsea Projects | Field Design■ Activity driven by increased progress, with several
projects still in early phases of execution■ Revenue up 13% to NOK 2.3 billion vs 4Q 2018■ Order intake of NOK 1.7 billion, equal to 0.8x book-to-bill■ Backlog of NOK 7 billion
■ Continued high Brownfield activity into 4Q■ Significant hook-up jobs finalized during 2H 2019■ Revenue down 5% to NOK 3.4 billion vs 4Q 2018■ Order intake of NOK 2.7 billion, equal to 0.8x book-to-bill■ Backlog of NOK 9 billion
Quarterly Revenue NOK billion
Order IntakeNOK billion
Potential additional revenue from existing agreementsField Design backlogSubsea backlog
Field DesignSubsea
6.0
1.9 0.8 0.2
5.2
1.10.7 0.1
2020 2021 2022 2023→
11.2
1.50.3
Order Backlog by Execution DateNOK billion
Field DesignSubsea
0
4
8
12
16
14
2018
12
1511
2015
129
2016
89
2017
8
9
2019
+49%
2
1
0
3
4
5
3.5
2Q 19
2.0
4Q 18
3.6
2.4
3.5
1Q 19
2.3
3.7
2.2
3Q 19
2.3
3.4
4Q 19
Field DesignSubsea
0
1
2
3
1.41.
82.1
1.6
2.9
1.0
4Q 18
1.4
1Q 19 2Q 19
1.9
3Q 19
1.7
2.7
4Q 19
Annual Revenue NOK billion
2.9
2020 © Aker Solutions
135 17
3 190
194
190
12%13%
15% 15% 15%
0%
3%
6%
9%
12%
15%
18%
0
50
100
150
200
250
300
135 17
3 190
194
190
12%13%
15% 15% 15%
0%
3%
6%
9%
12%
15%
18%
0
50
100
150
200
250
300
February 7, 2020Fourth-Quarter Results 2019 Slide 16
Revenue NOK billion
EBITDA and Margin1
NOK million, %EBIT and Margin1
NOK million, %Working CapitalNOK billion
0.5
1.5
0.0
2.0
1.0
1.6
1.3
4Q 18
1.3
1Q 19
1.5
2Q 19
1.5
3Q 19 4Q 19
154
120 14
7
112
12%
9%7% 6%
0%
5%
10%
15%
20%
25%
30%
0
50
100
150
200
250
300
4Q 18 1Q 19
10%
2Q 19 3Q 19 4Q 19
107
1.0
0.0
0.5
2.0
1.5
0.7
4Q 18
0.9
2Q 191Q 19
0.9
0.9
3Q 19
0.8
4Q 19
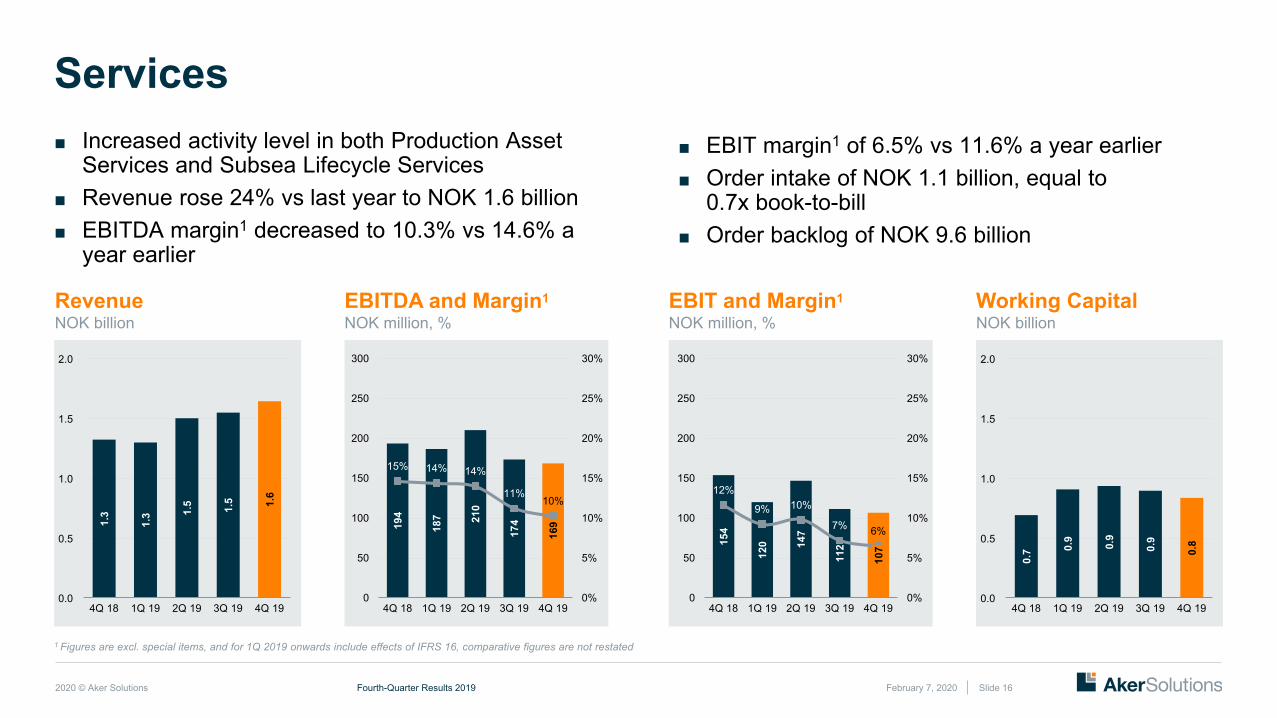
Services■ Increased activity level in both Production Asset
Services and Subsea Lifecycle Services■ Revenue rose 24% vs last year to NOK 1.6 billion■ EBITDA margin1 decreased to 10.3% vs 14.6% a
year earlier
■ EBIT margin1 of 6.5% vs 11.6% a year earlier■ Order intake of NOK 1.1 billion, equal to
0.7x book-to-bill■ Order backlog of NOK 9.6 billion
194
187 21
0
174
169
15% 14% 14%
11%10%
0%
5%
10%
15%
20%
25%
30%
0
50
100
150
200
250
300
4Q 18 3Q 191Q 19 2Q 19 4Q 19
1 Figures are excl. special items, and for 1Q 2019 onwards include effects of IFRS 16, comparative figures are not restated
2020 © Aker Solutions
10%
67%
6%9%10%
8%
6%
57%
6%
13%
February 7, 2020Fourth-Quarter Results 2019 Slide 17
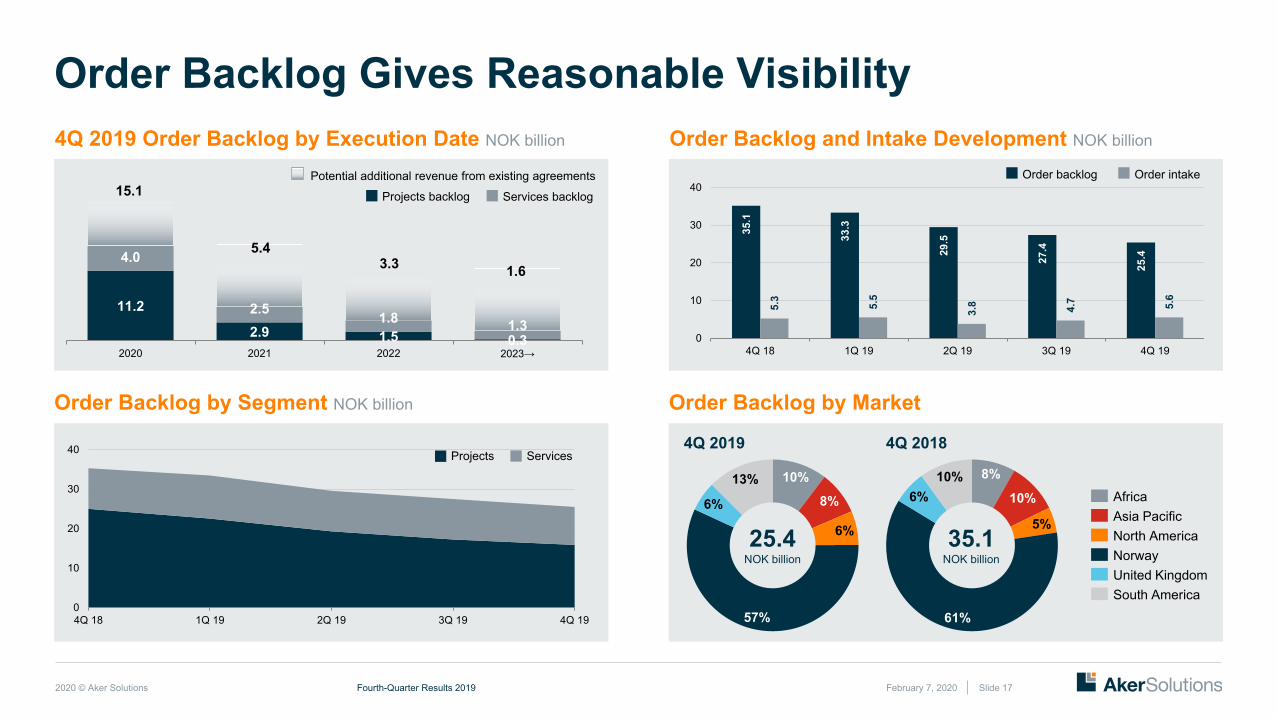
Order Backlog Gives Reasonable VisibilityOrder Backlog and Intake Development NOK billion
Order Backlog by Segment NOK billion
11.2
2.9 1.5 0.3
4.0
2.5 1.8 1.3
2020 2021 2022 2023→
Potential additional revenue from existing agreements
Services backlogProjects backlog
0
10
20
30
40
4Q 18 1Q 19 2Q 19 3Q 19 4Q 19
ServicesProjects
35.1
33.3
29.5
27.4
25.4
5.3
5.5
3.8 4.7 5.6
0
10
20
30
40
4Q 18 1Q 19 2Q 19 3Q 19 4Q 19
Order intakeOrder backlog15.1
5.43.3 1.6
4Q 2019 Order Backlog by Execution Date NOK billion
Order Backlog by Market
Norway
Africa
North AmericaAsia Pacific
United KingdomSouth America
8%
10%
5%
61%
6%10%
35.1NOK billion
4Q 2019 4Q 2018
25.4NOK billion
2020 © Aker Solutions
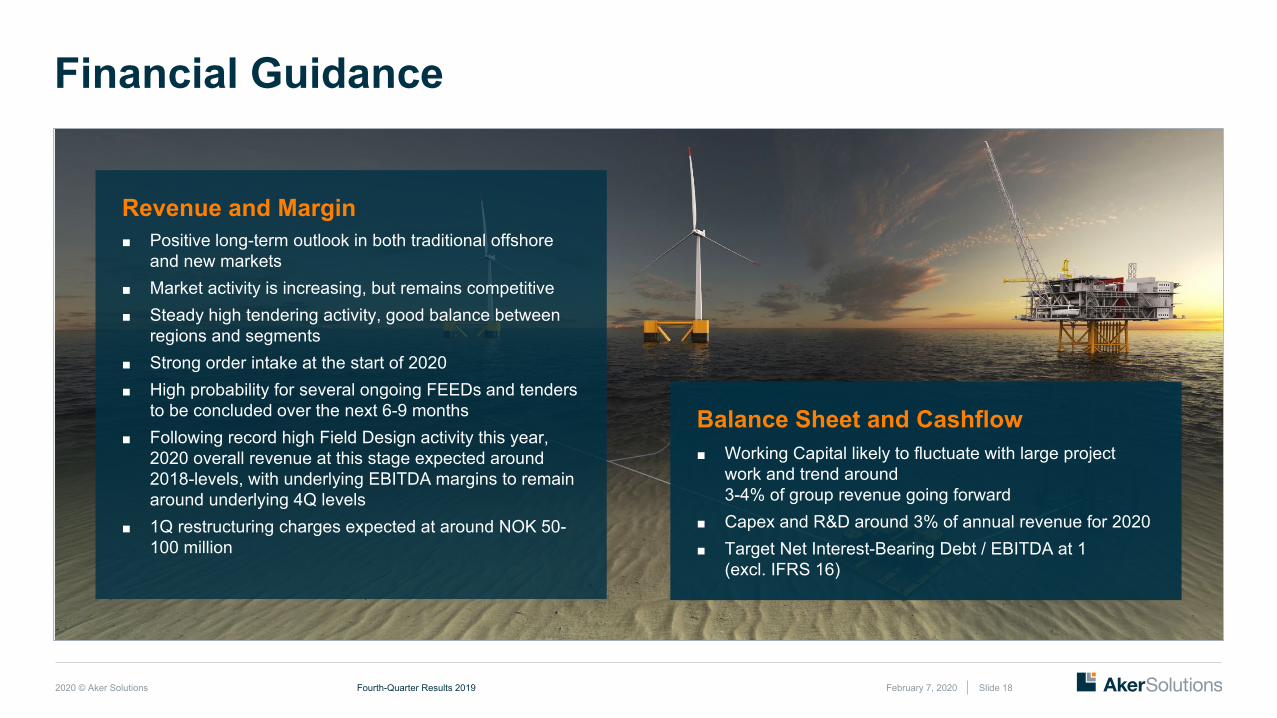
Financial Guidance
February 7, 2020Fourth-Quarter Results 2019 Slide 18
Revenue and Margin■ Positive long-term outlook in both traditional offshore
and new markets■ Market activity is increasing, but remains competitive■ Steady high tendering activity, good balance between
regions and segments■ Strong order intake at the start of 2020■ High probability for several ongoing FEEDs and tenders
to be concluded over the next 6-9 months■ Following record high Field Design activity this year,
2020 overall revenue at this stage expected around 2018-levels, with underlying EBITDA margins to remain around underlying 4Q levels
■ 1Q restructuring charges expected at around NOK 50-100 million
Balance Sheet and Cashflow■ Working Capital likely to fluctuate with large project
work and trend around3-4% of group revenue going forward
■ Capex and R&D around 3% of annual revenue for 2020■ Target Net Interest-Bearing Debt / EBITDA at 1
(excl. IFRS 16)

2020 © Aker Solutions
Agenda | 4Q 2019
Slide 19
IntroductionLuis AraujoChief Executive Officer
Q&A SessionLuis Araujo CEOOle Martin Grimsrud CFO
Questions
Answers
February 7, 2020Fourth-Quarter Results 2019
FinancialsOle Martin GrimsrudChief Financial Officer

2020 © Aker Solutions
Additional Information
February 7, 2020Fourth-Quarter Results 2019 Slide 20
2020 © Aker Solutions February 7, 2020Fourth-Quarter Results 2019 Slide 21
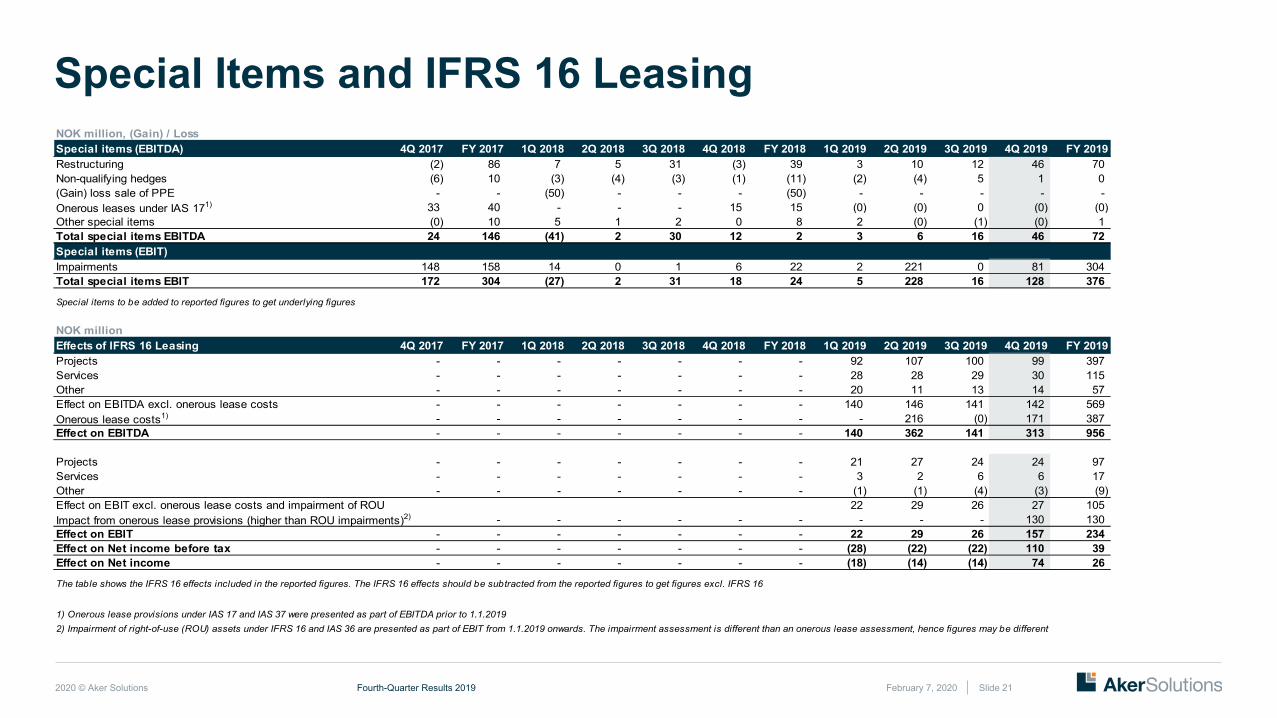
Special Items and IFRS 16 LeasingNOK million, (Gain) / LossSpecial items (EBITDA) 4Q 2017 FY 2017 1Q 2018 2Q 2018 3Q 2018 4Q 2018 FY 2018 1Q 2019 2Q 2019 3Q 2019 4Q 2019 FY 2019Restructuring (2) 86 7 5 31 (3) 39 3 10 12 46 70 Non-qualifying hedges (6) 10 (3) (4) (3) (1) (11) (2) (4) 5 1 0 (Gain) loss sale of PPE - - (50) - - - (50) - - - - - Onerous leases under IAS 171) 33 40 - - - 15 15 (0) (0) 0 (0) (0) Other special items (0) 10 5 1 2 0 8 2 (0) (1) (0) 1 Total special items EBITDA 24 146 (41) 2 30 12 2 3 6 16 46 72 Special items (EBIT)Impairments 148 158 14 0 1 6 22 2 221 0 81 304 Total special items EBIT 172 304 (27) 2 31 18 24 5 228 16 128 376
NOK millionEffects of IFRS 16 Leasing 4Q 2017 FY 2017 1Q 2018 2Q 2018 3Q 2018 4Q 2018 FY 2018 1Q 2019 2Q 2019 3Q 2019 4Q 2019 FY 2019Projects - - - - - - - 92 107 100 99 397 Services - - - - - - - 28 28 29 30 115 Other - - - - - - - 20 11 13 14 57 Effect on EBITDA excl. onerous lease costs - - - - - - - 140 146 141 142 569 Onerous lease costs1) - - - - - - - - 216 (0) 171 387 Effect on EBITDA - - - - - - - 140 362 141 313 956
Projects - - - - - - - 21 27 24 24 97 Services - - - - - - - 3 2 6 6 17 Other - - - - - - - (1) (1) (4) (3) (9) Effect on EBIT excl. onerous lease costs and impairment of ROU 22 29 26 27 105 Impact from onerous lease provisions (higher than ROU impairments)2) - - - - - - - - - 130 130 Effect on EBIT - - - - - - - 22 29 26 157 234 Effect on Net income before tax - - - - - - - (28) (22) (22) 110 39 Effect on Net income - - - - - - - (18) (14) (14) 74 26
The table shows the IFRS 16 effects included in the reported figures. The IFRS 16 effects should be subtracted from the reported figures to get figures excl. IFRS 16
1) Onerous lease provisions under IAS 17 and IAS 37 were presented as part of EBITDA prior to 1.1.2019 2) Impairment of right-of-use (ROU) assets under IFRS 16 and IAS 36 are presented as part of EBIT from 1.1.2019 onwards. The impairment assessment is different than an onerous lease assessment, hence figures may be different
Special items to be added to reported figures to get underlying figures
2020 © Aker Solutions February 7, 2020Fourth-Quarter Results 2019 Slide 22
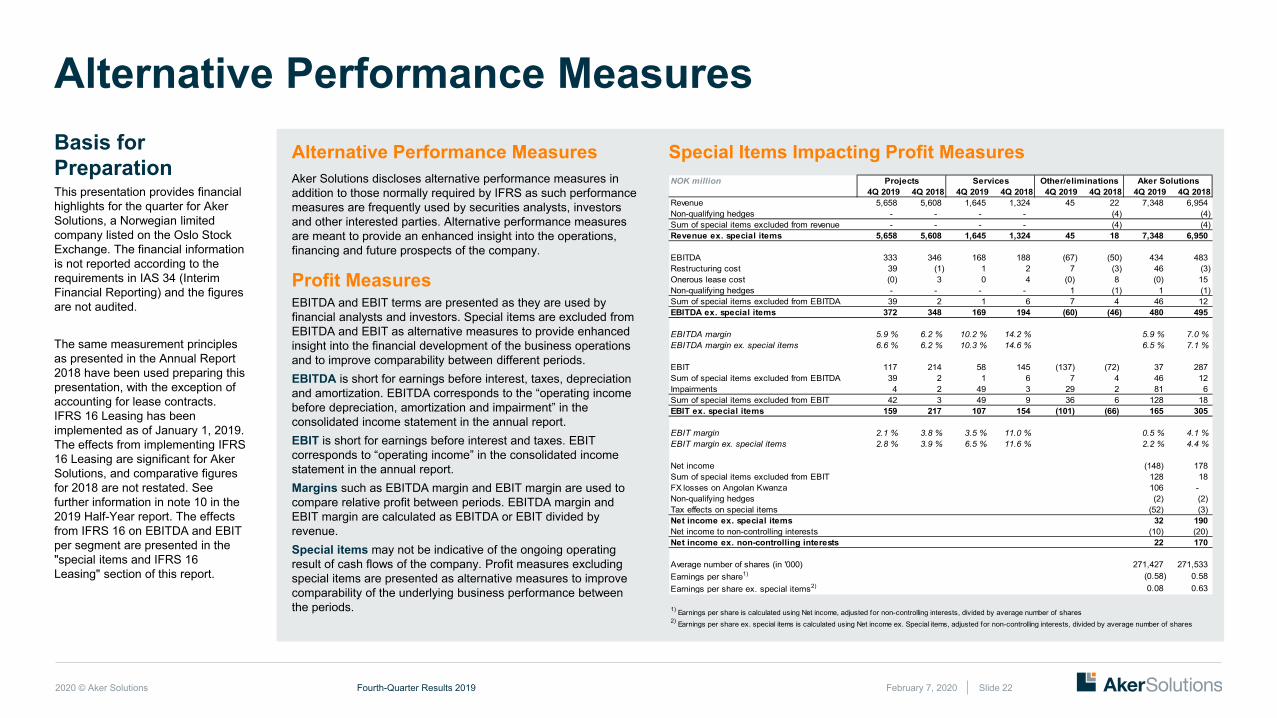
Alternative Performance MeasuresSpecial Items Impacting Profit MeasuresBasis for
PreparationThis presentation provides financial highlights for the quarter for Aker Solutions, a Norwegian limited company listed on the Oslo Stock Exchange. The financial information is not reported according to the requirements in IAS 34 (Interim Financial Reporting) and the figures are not audited.
The same measurement principles as presented in the Annual Report 2018 have been used preparing this presentation, with the exception of accounting for lease contracts. IFRS 16 Leasing has been implemented as of January 1, 2019. The effects from implementing IFRS 16 Leasing are significant for Aker Solutions, and comparative figures for 2018 are not restated. See further information in note 10 in the 2019 Half-Year report. The effects from IFRS 16 on EBITDA and EBIT per segment are presented in the "special items and IFRS 16 Leasing" section of this report.
Profit MeasuresEBITDA and EBIT terms are presented as they are used by financial analysts and investors. Special items are excluded from EBITDA and EBIT as alternative measures to provide enhanced insight into the financial development of the business operations and to improve comparability between different periods.EBITDA is short for earnings before interest, taxes, depreciation and amortization. EBITDA corresponds to the “operating income before depreciation, amortization and impairment” in the consolidated income statement in the annual report.EBIT is short for earnings before interest and taxes. EBIT corresponds to “operating income” in the consolidated income statement in the annual report. Margins such as EBITDA margin and EBIT margin are used to compare relative profit between periods. EBITDA margin and EBIT margin are calculated as EBITDA or EBIT divided by revenue. Special items may not be indicative of the ongoing operating result of cash flows of the company. Profit measures excluding special items are presented as alternative measures to improve comparability of the underlying business performance between the periods.
Alternative Performance MeasuresAker Solutions discloses alternative performance measures in addition to those normally required by IFRS as such performance measures are frequently used by securities analysts, investors and other interested parties. Alternative performance measures are meant to provide an enhanced insight into the operations, financing and future prospects of the company.
NOK million4Q 2019 4Q 2018 4Q 2019 4Q 2018 4Q 2019 4Q 2018 4Q 2019 4Q 2018
Revenue 5,658 5,608 1,645 1,324 45 22 7,348 6,954 Non-qualifying hedges - - - - (4) (4) Sum of special items excluded from revenue - - - - (4) (4) Revenue ex. special items 5,658 5,608 1,645 1,324 45 18 7,348 6,950
EBITDA 333 346 168 188 (67) (50) 434 483 Restructuring cost 39 (1) 1 2 7 (3) 46 (3) Onerous lease cost (0) 3 0 4 (0) 8 (0) 15 Non-qualifying hedges - - - - 1 (1) 1 (1) Sum of special items excluded from EBITDA 39 2 1 6 7 4 46 12 EBITDA ex. special items 372 348 169 194 (60) (46) 480 495
EBITDA margin 5.9 % 6.2 % 10.2 % 14.2 % 5.9 % 7.0 %EBITDA margin ex. special items 6.6 % 6.2 % 10.3 % 14.6 % 6.5 % 7.1 %
EBIT 117 214 58 145 (137) (72) 37 287 Sum of special items excluded from EBITDA 39 2 1 6 7 4 46 12 Impairments 4 2 49 3 29 2 81 6 Sum of special items excluded from EBIT 42 3 49 9 36 6 128 18 EBIT ex. special items 159 217 107 154 (101) (66) 165 305
EBIT margin 2.1 % 3.8 % 3.5 % 11.0 % 0.5 % 4.1 %EBIT margin ex. special items 2.8 % 3.9 % 6.5 % 11.6 % 2.2 % 4.4 %
Net income (148) 178 Sum of special items excluded from EBIT 128 18 FX losses on Angolan Kwanza 106 - Non-qualifying hedges (2) (2) Tax effects on special items (52) (3) Net income ex. special items 32 190 Net income to non-controlling interests (10) (20) Net income ex. non-controlling interests 22 170
Average number of shares (in '000) 271,427 271,533 Earnings per share1) (0.58) 0.58 Earnings per share ex. special items2) 0.08 0.63
2) Earnings per share ex. special items is calculated using Net income ex. Special items, adjusted for non-controlling interests, divided by average number of shares
Projects Services Other/eliminations Aker Solutions
1) Earnings per share is calculated using Net income, adjusted for non-controlling interests, divided by average number of shares
2020 © Aker Solutions February 7, 2020Fourth-Quarter Results 2019 Slide 23
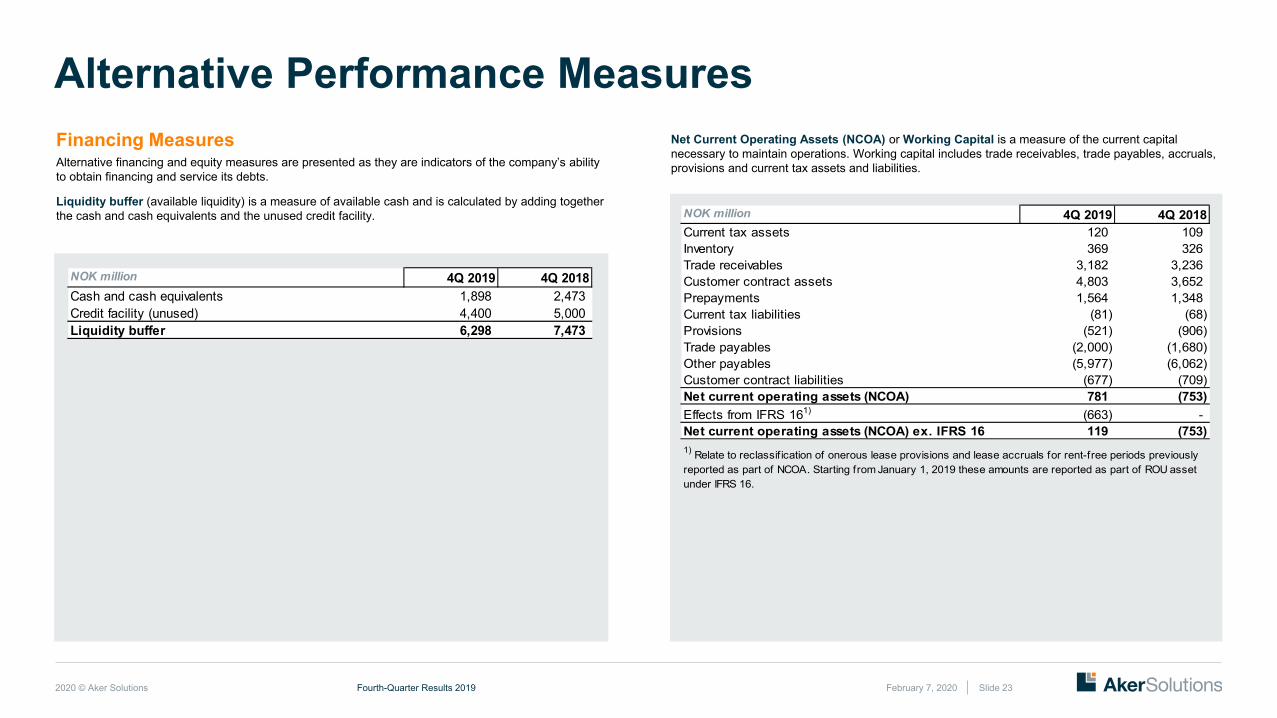
Alternative Performance MeasuresFinancing MeasuresAlternative financing and equity measures are presented as they are indicators of the company’s ability to obtain financing and service its debts.
Liquidity buffer (available liquidity) is a measure of available cash and is calculated by adding together the cash and cash equivalents and the unused credit facility.
Net Current Operating Assets (NCOA) or Working Capital is a measure of the current capital necessary to maintain operations. Working capital includes trade receivables, trade payables, accruals, provisions and current tax assets and liabilities.
NOK million 4Q 2019 4Q 2018Cash and cash equivalents 1,898 2,473 Credit facility (unused) 4,400 5,000 Liquidity buffer 6,298 7,473
NOK million 4Q 2019 4Q 2018Current tax assets 120 109 Inventory 369 326 Trade receivables 3,182 3,236 Customer contract assets 4,803 3,652 Prepayments 1,564 1,348 Current tax liabilities (81) (68) Provisions (521) (906) Trade payables (2,000) (1,680) Other payables (5,977) (6,062) Customer contract liabilities (677) (709) Net current operating assets (NCOA) 781 (753) Effects from IFRS 161) (663) - Net current operating assets (NCOA) ex. IFRS 16 119 (753) 1) Relate to reclassif ication of onerous lease provisions and lease accruals for rent-free periods previously reported as part of NCOA. Starting from January 1, 2019 these amounts are reported as part of ROU asset under IFRS 16.
2020 © Aker Solutions February 7, 2020Fourth-Quarter Results 2019 Slide 24
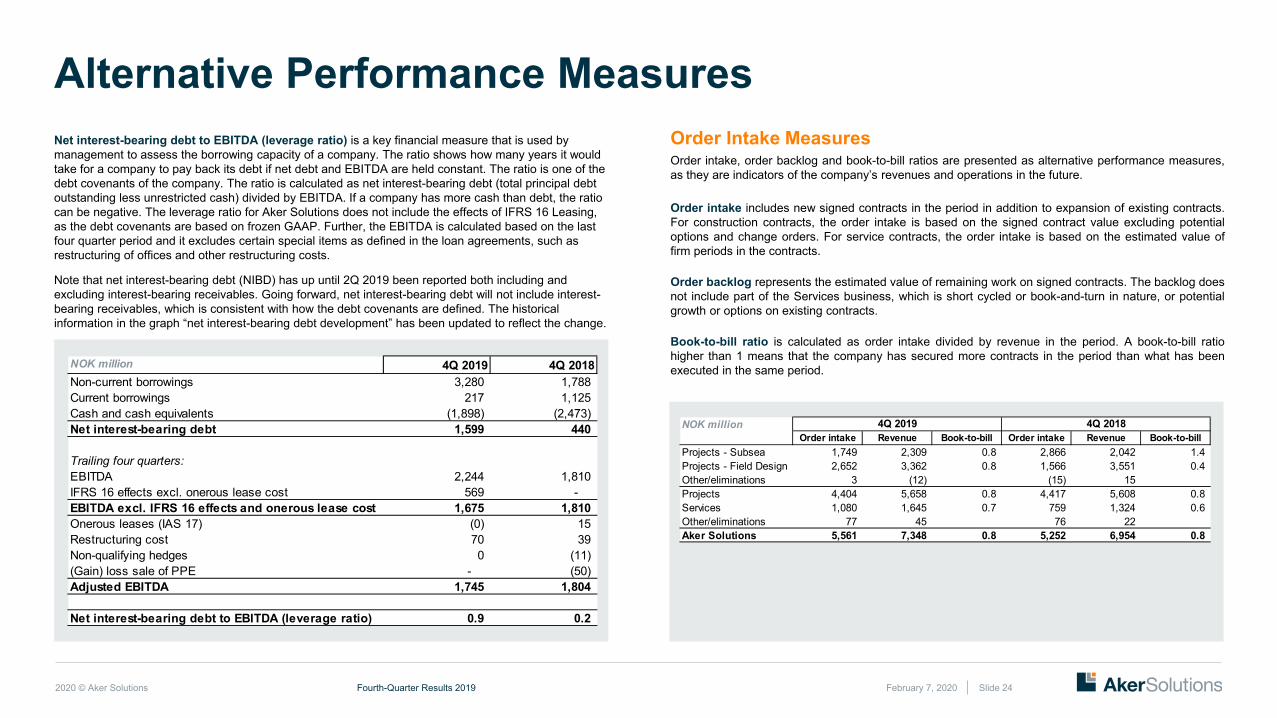
Alternative Performance MeasuresOrder Intake MeasuresOrder intake, order backlog and book-to-bill ratios are presented as alternative performance measures,as they are indicators of the company’s revenues and operations in the future.
Order intake includes new signed contracts in the period in addition to expansion of existing contracts.For construction contracts, the order intake is based on the signed contract value excluding potentialoptions and change orders. For service contracts, the order intake is based on the estimated value offirm periods in the contracts.
Order backlog represents the estimated value of remaining work on signed contracts. The backlog doesnot include part of the Services business, which is short cycled or book-and-turn in nature, or potentialgrowth or options on existing contracts.
Book-to-bill ratio is calculated as order intake divided by revenue in the period. A book-to-bill ratiohigher than 1 means that the company has secured more contracts in the period than what has beenexecuted in the same period.
NOK millionOrder intake Revenue Book-to-bill Order intake Revenue Book-to-bill
Projects - Subsea 1,749 2,309 0.8 2,866 2,042 1.4 Projects - Field Design 2,652 3,362 0.8 1,566 3,551 0.4 Other/eliminations 3 (12) (15) 15 Projects 4,404 5,658 0.8 4,417 5,608 0.8 Services 1,080 1,645 0.7 759 1,324 0.6 Other/eliminations 77 45 76 22 Aker Solutions 5,561 7,348 0.8 5,252 6,954 0.8
4Q 2019 4Q 2018
Net interest-bearing debt to EBITDA (leverage ratio) is a key financial measure that is used by management to assess the borrowing capacity of a company. The ratio shows how many years it would take for a company to pay back its debt if net debt and EBITDA are held constant. The ratio is one of the debt covenants of the company. The ratio is calculated as net interest-bearing debt (total principal debt outstanding less unrestricted cash) divided by EBITDA. If a company has more cash than debt, the ratio can be negative. The leverage ratio for Aker Solutions does not include the effects of IFRS 16 Leasing, as the debt covenants are based on frozen GAAP. Further, the EBITDA is calculated based on the last four quarter period and it excludes certain special items as defined in the loan agreements, such as restructuring of offices and other restructuring costs.
Note that net interest-bearing debt (NIBD) has up until 2Q 2019 been reported both including and excluding interest-bearing receivables. Going forward, net interest-bearing debt will not include interest-bearing receivables, which is consistent with how the debt covenants are defined. The historical information in the graph “net interest-bearing debt development” has been updated to reflect the change.
NOK million 4Q 2019 4Q 2018Non-current borrowings 3,280 1,788 Current borrowings 217 1,125 Cash and cash equivalents (1,898) (2,473) Net interest-bearing debt 1,599 440
Trailing four quarters:EBITDA 2,244 1,810 IFRS 16 effects excl. onerous lease cost 569 - EBITDA excl. IFRS 16 effects and onerous lease cost 1,675 1,810 Onerous leases (IAS 17) (0) 15 Restructuring cost 70 39 Non-qualifying hedges 0 (11) (Gain) loss sale of PPE - (50) Adjusted EBITDA 1,745 1,804
Net interest-bearing debt to EBITDA (leverage ratio) 0.9 0.2
2020 © Aker Solutions February 7, 2020Fourth-Quarter Results 2019 Slide 25
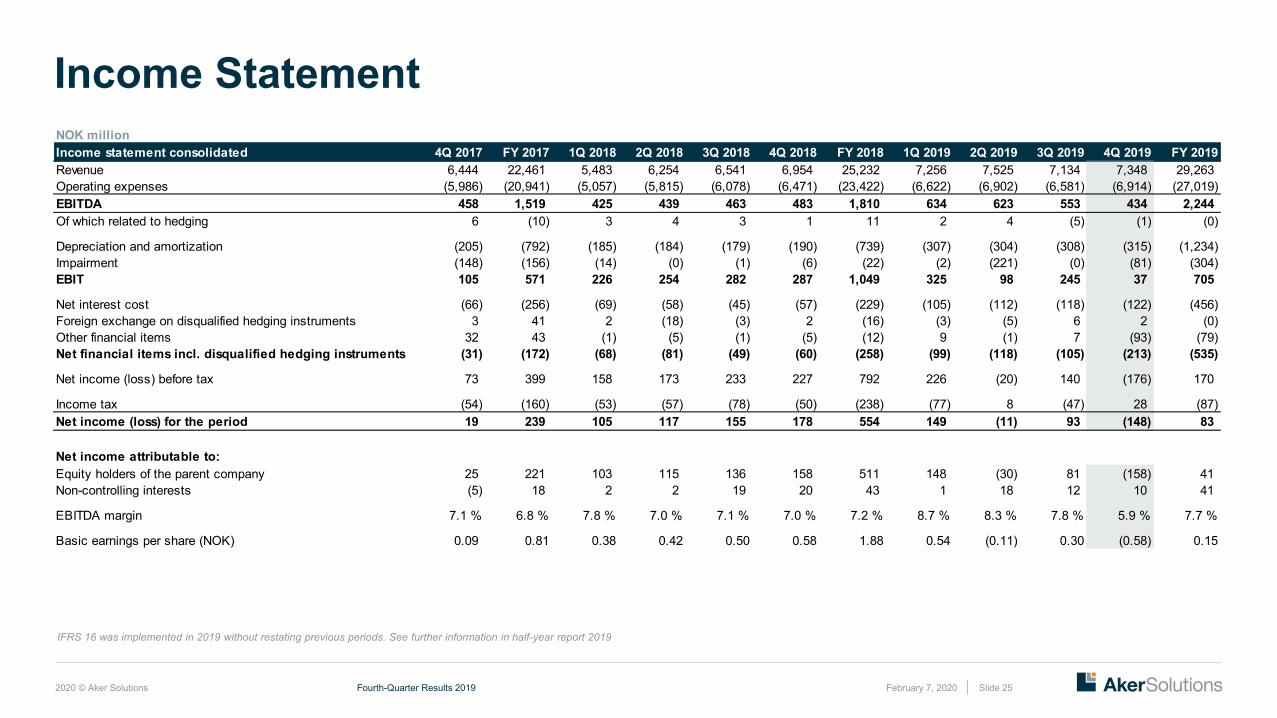
Income Statement NOK millionIncome statement consolidated 4Q 2017 FY 2017 1Q 2018 2Q 2018 3Q 2018 4Q 2018 FY 2018 1Q 2019 2Q 2019 3Q 2019 4Q 2019 FY 2019Revenue 6,444 22,461 5,483 6,254 6,541 6,954 25,232 7,256 7,525 7,134 7,348 29,263 Operating expenses (5,986) (20,941) (5,057) (5,815) (6,078) (6,471) (23,422) (6,622) (6,902) (6,581) (6,914) (27,019) EBITDA 458 1,519 425 439 463 483 1,810 634 623 553 434 2,244 Of which related to hedging 6 (10) 3 4 3 1 11 2 4 (5) (1) (0)
Depreciation and amortization (205) (792) (185) (184) (179) (190) (739) (307) (304) (308) (315) (1,234) Impairment (148) (156) (14) (0) (1) (6) (22) (2) (221) (0) (81) (304) EBIT 105 571 226 254 282 287 1,049 325 98 245 37 705
Net interest cost (66) (256) (69) (58) (45) (57) (229) (105) (112) (118) (122) (456) Foreign exchange on disqualified hedging instruments 3 41 2 (18) (3) 2 (16) (3) (5) 6 2 (0) Other financial items 32 43 (1) (5) (1) (5) (12) 9 (1) 7 (93) (79) Net financial items incl. disqualified hedging instruments (31) (172) (68) (81) (49) (60) (258) (99) (118) (105) (213) (535)
Net income (loss) before tax 73 399 158 173 233 227 792 226 (20) 140 (176) 170
Income tax (54) (160) (53) (57) (78) (50) (238) (77) 8 (47) 28 (87) Net income (loss) for the period 19 239 105 117 155 178 554 149 (11) 93 (148) 83
Net income attributable to:Equity holders of the parent company 25 221 103 115 136 158 511 148 (30) 81 (158) 41 Non-controlling interests (5) 18 2 2 19 20 43 1 18 12 10 41
EBITDA margin 7.1 % 6.8 % 7.8 % 7.0 % 7.1 % 7.0 % 7.2 % 8.7 % 8.3 % 7.8 % 5.9 % 7.7 %
Basic earnings per share (NOK) 0.09 0.81 0.38 0.42 0.50 0.58 1.88 0.54 (0.11) 0.30 (0.58) 0.15
IFRS 16 was implemented in 2019 without restating previous periods. See further information in half-year report 2019
2020 © Aker Solutions February 7, 2020Fourth-Quarter Results 2019 Slide 26
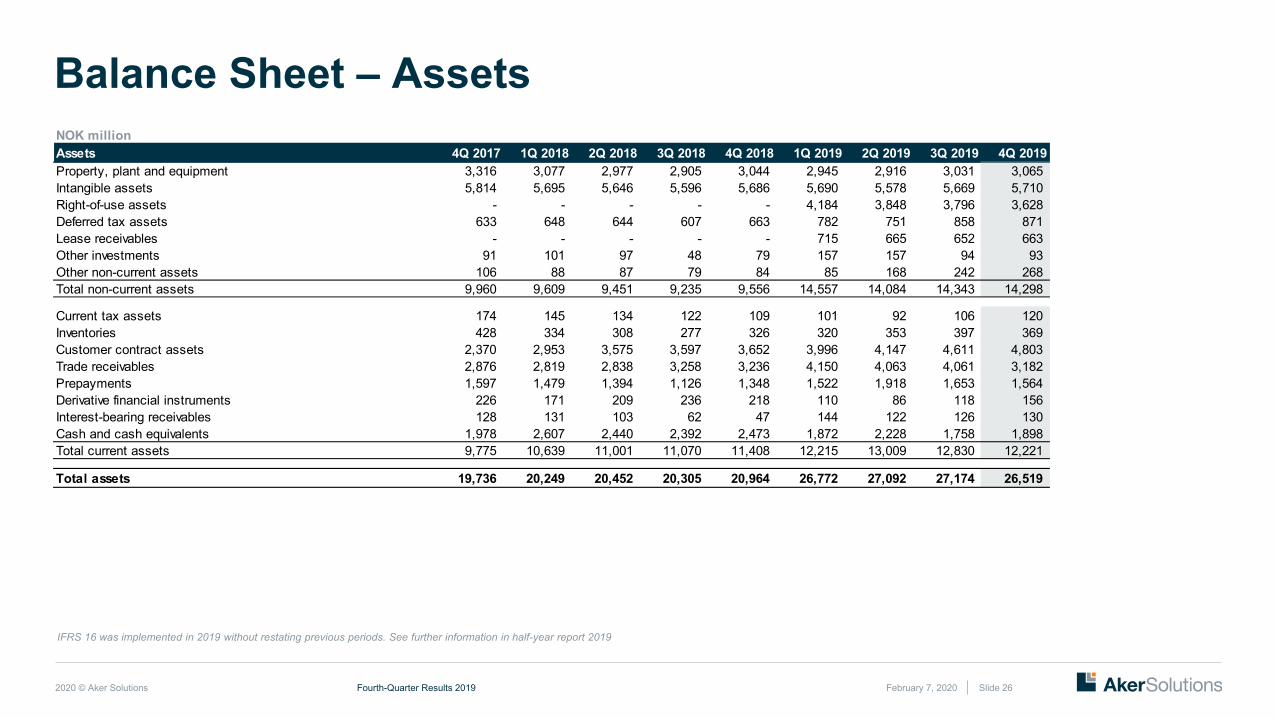
Balance Sheet – AssetsNOK millionAssets 4Q 2017 1Q 2018 2Q 2018 3Q 2018 4Q 2018 1Q 2019 2Q 2019 3Q 2019 4Q 2019Property, plant and equipment 3,316 3,077 2,977 2,905 3,044 2,945 2,916 3,031 3,065 Intangible assets 5,814 5,695 5,646 5,596 5,686 5,690 5,578 5,669 5,710 Right-of-use assets - - - - - 4,184 3,848 3,796 3,628 Deferred tax assets 633 648 644 607 663 782 751 858 871 Lease receivables - - - - - 715 665 652 663 Other investments 91 101 97 48 79 157 157 94 93 Other non-current assets 106 88 87 79 84 85 168 242 268 Total non-current assets 9,960 9,609 9,451 9,235 9,556 14,557 14,084 14,343 14,298
Current tax assets 174 145 134 122 109 101 92 106 120 Inventories 428 334 308 277 326 320 353 397 369 Customer contract assets 2,370 2,953 3,575 3,597 3,652 3,996 4,147 4,611 4,803 Trade receivables 2,876 2,819 2,838 3,258 3,236 4,150 4,063 4,061 3,182 Prepayments 1,597 1,479 1,394 1,126 1,348 1,522 1,918 1,653 1,564 Derivative financial instruments 226 171 209 236 218 110 86 118 156 Interest-bearing receivables 128 131 103 62 47 144 122 126 130 Cash and cash equivalents 1,978 2,607 2,440 2,392 2,473 1,872 2,228 1,758 1,898 Total current assets 9,775 10,639 11,001 11,070 11,408 12,215 13,009 12,830 12,221
Total assets 19,736 20,249 20,452 20,305 20,964 26,772 27,092 27,174 26,519
IFRS 16 was implemented in 2019 without restating previous periods. See further information in half-year report 2019
2020 © Aker Solutions February 7, 2020Fourth-Quarter Results 2019 Slide 27
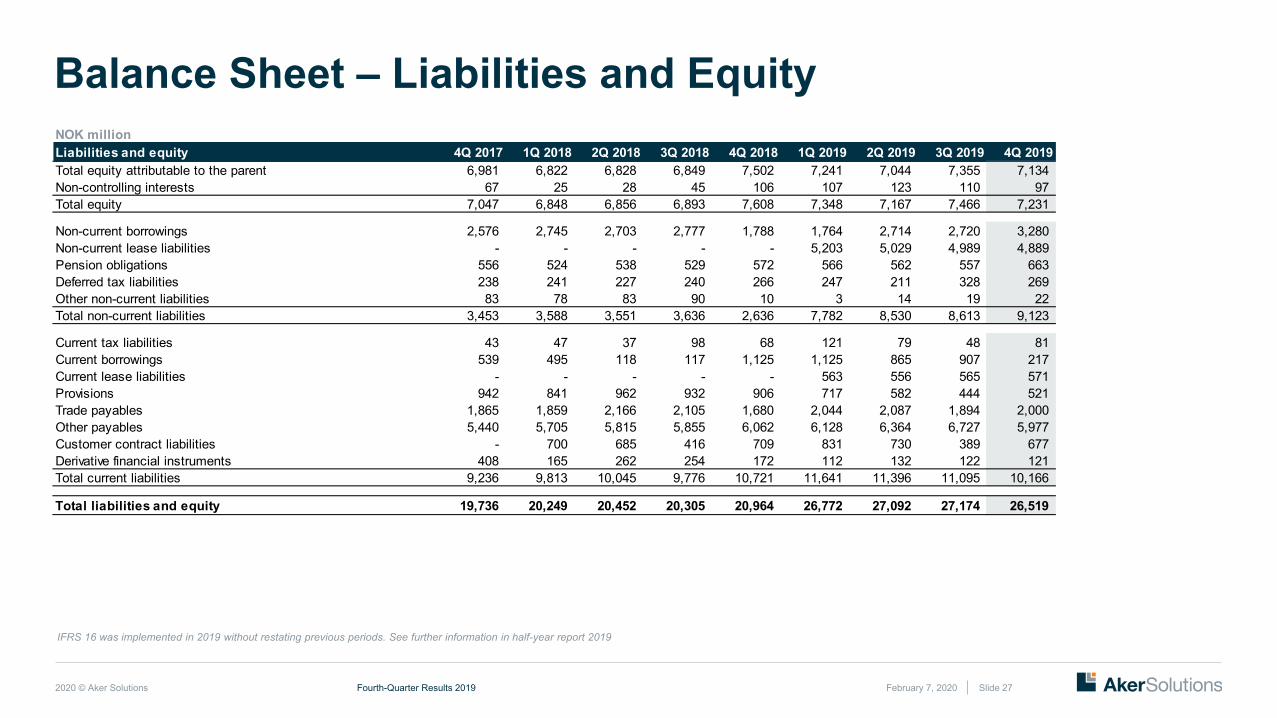
Balance Sheet – Liabilities and EquityNOK millionLiabilities and equity 4Q 2017 1Q 2018 2Q 2018 3Q 2018 4Q 2018 1Q 2019 2Q 2019 3Q 2019 4Q 2019Total equity attributable to the parent 6,981 6,822 6,828 6,849 7,502 7,241 7,044 7,355 7,134 Non-controlling interests 67 25 28 45 106 107 123 110 97 Total equity 7,047 6,848 6,856 6,893 7,608 7,348 7,167 7,466 7,231
Non-current borrowings 2,576 2,745 2,703 2,777 1,788 1,764 2,714 2,720 3,280 Non-current lease liabilities - - - - - 5,203 5,029 4,989 4,889 Pension obligations 556 524 538 529 572 566 562 557 663 Deferred tax liabilities 238 241 227 240 266 247 211 328 269 Other non-current liabilities 83 78 83 90 10 3 14 19 22 Total non-current liabilities 3,453 3,588 3,551 3,636 2,636 7,782 8,530 8,613 9,123
Current tax liabilities 43 47 37 98 68 121 79 48 81 Current borrowings 539 495 118 117 1,125 1,125 865 907 217 Current lease liabilities - - - - - 563 556 565 571 Provisions 942 841 962 932 906 717 582 444 521 Trade payables 1,865 1,859 2,166 2,105 1,680 2,044 2,087 1,894 2,000 Other payables 5,440 5,705 5,815 5,855 6,062 6,128 6,364 6,727 5,977 Customer contract liabilities - 700 685 416 709 831 730 389 677 Derivative financial instruments 408 165 262 254 172 112 132 122 121 Total current liabilities 9,236 9,813 10,045 9,776 10,721 11,641 11,396 11,095 10,166
Total liabilities and equity 19,736 20,249 20,452 20,305 20,964 26,772 27,092 27,174 26,519
IFRS 16 was implemented in 2019 without restating previous periods. See further information in half-year report 2019
2020 © Aker Solutions February 7, 2020Fourth-Quarter Results 2019 Slide 28
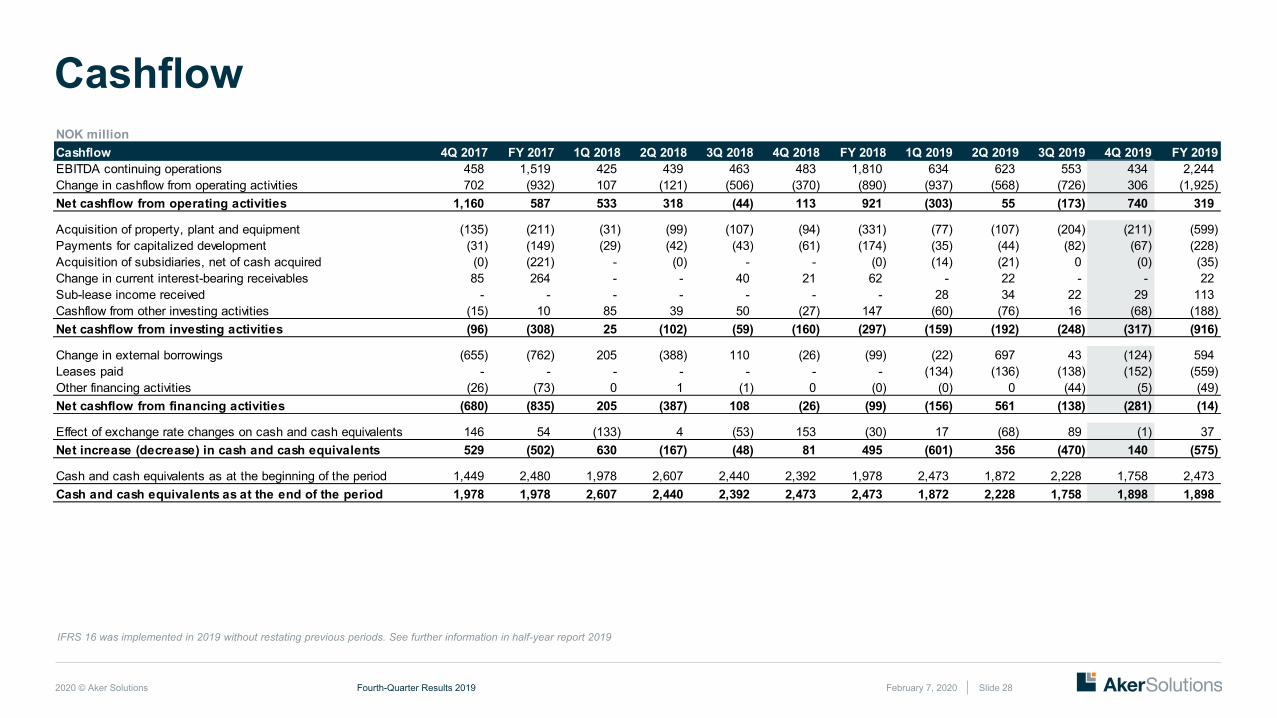
CashflowNOK millionCashflow 4Q 2017 FY 2017 1Q 2018 2Q 2018 3Q 2018 4Q 2018 FY 2018 1Q 2019 2Q 2019 3Q 2019 4Q 2019 FY 2019EBITDA continuing operations 458 1,519 425 439 463 483 1,810 634 623 553 434 2,244 Change in cashflow from operating activities 702 (932) 107 (121) (506) (370) (890) (937) (568) (726) 306 (1,925) Net cashflow from operating activities 1,160 587 533 318 (44) 113 921 (303) 55 (173) 740 319
Acquisition of property, plant and equipment (135) (211) (31) (99) (107) (94) (331) (77) (107) (204) (211) (599) Payments for capitalized development (31) (149) (29) (42) (43) (61) (174) (35) (44) (82) (67) (228) Acquisition of subsidiaries, net of cash acquired (0) (221) - (0) - - (0) (14) (21) 0 (0) (35) Change in current interest-bearing receivables 85 264 - - 40 21 62 - 22 - - 22 Sub-lease income received - - - - - - - 28 34 22 29 113 Cashflow from other investing activities (15) 10 85 39 50 (27) 147 (60) (76) 16 (68) (188) Net cashflow from investing activities (96) (308) 25 (102) (59) (160) (297) (159) (192) (248) (317) (916)
Change in external borrowings (655) (762) 205 (388) 110 (26) (99) (22) 697 43 (124) 594 Leases paid - - - - - - - (134) (136) (138) (152) (559) Other financing activities (26) (73) 0 1 (1) 0 (0) (0) 0 (44) (5) (49) Net cashflow from financing activities (680) (835) 205 (387) 108 (26) (99) (156) 561 (138) (281) (14)
Effect of exchange rate changes on cash and cash equivalents 146 54 (133) 4 (53) 153 (30) 17 (68) 89 (1) 37 Net increase (decrease) in cash and cash equivalents 529 (502) 630 (167) (48) 81 495 (601) 356 (470) 140 (575)
Cash and cash equivalents as at the beginning of the period 1,449 2,480 1,978 2,607 2,440 2,392 1,978 2,473 1,872 2,228 1,758 2,473 Cash and cash equivalents as at the end of the period 1,978 1,978 2,607 2,440 2,392 2,473 2,473 1,872 2,228 1,758 1,898 1,898
IFRS 16 was implemented in 2019 without restating previous periods. See further information in half-year report 2019
2020 © Aker Solutions February 7, 2020Fourth-Quarter Results 2019 Slide 29
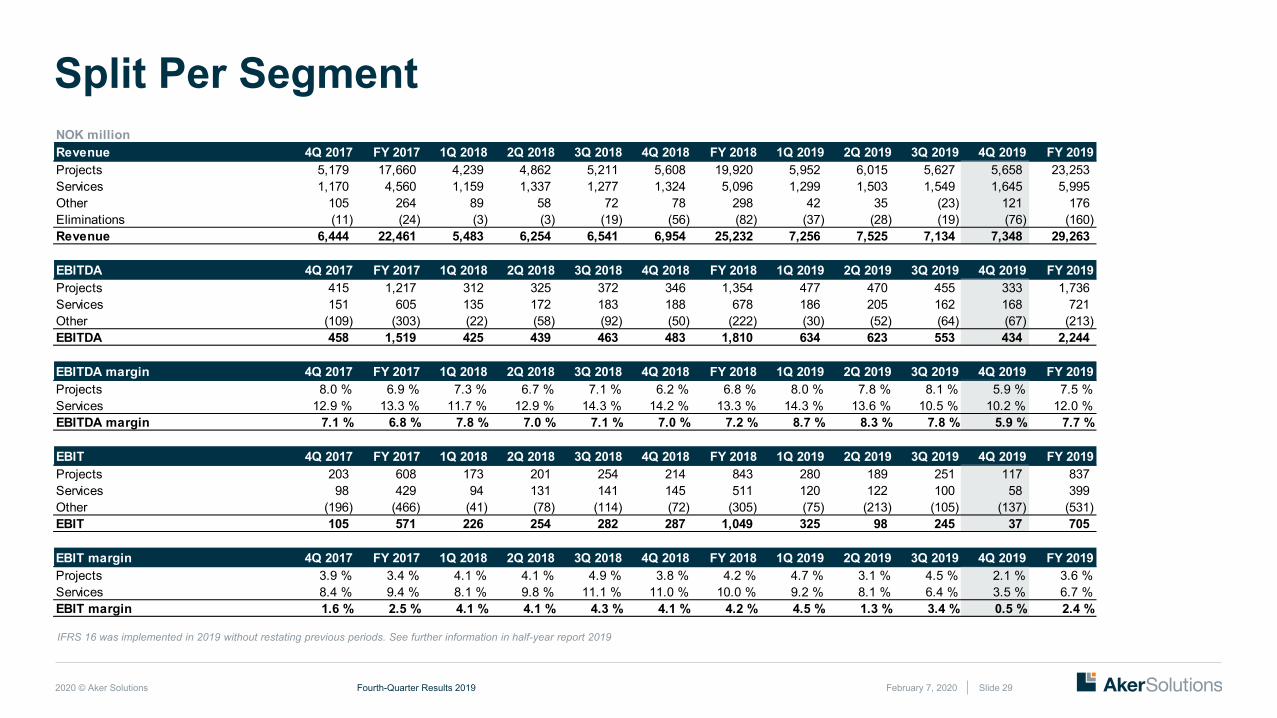
Split Per SegmentNOK millionRevenue 4Q 2017 FY 2017 1Q 2018 2Q 2018 3Q 2018 4Q 2018 FY 2018 1Q 2019 2Q 2019 3Q 2019 4Q 2019 FY 2019Projects 5,179 17,660 4,239 4,862 5,211 5,608 19,920 5,952 6,015 5,627 5,658 23,253 Services 1,170 4,560 1,159 1,337 1,277 1,324 5,096 1,299 1,503 1,549 1,645 5,995 Other 105 264 89 58 72 78 298 42 35 (23) 121 176 Eliminations (11) (24) (3) (3) (19) (56) (82) (37) (28) (19) (76) (160) Revenue 6,444 22,461 5,483 6,254 6,541 6,954 25,232 7,256 7,525 7,134 7,348 29,263
EBITDA 4Q 2017 FY 2017 1Q 2018 2Q 2018 3Q 2018 4Q 2018 FY 2018 1Q 2019 2Q 2019 3Q 2019 4Q 2019 FY 2019Projects 415 1,217 312 325 372 346 1,354 477 470 455 333 1,736 Services 151 605 135 172 183 188 678 186 205 162 168 721 Other (109) (303) (22) (58) (92) (50) (222) (30) (52) (64) (67) (213) EBITDA 458 1,519 425 439 463 483 1,810 634 623 553 434 2,244
EBITDA margin 4Q 2017 FY 2017 1Q 2018 2Q 2018 3Q 2018 4Q 2018 FY 2018 1Q 2019 2Q 2019 3Q 2019 4Q 2019 FY 2019Projects 8.0 % 6.9 % 7.3 % 6.7 % 7.1 % 6.2 % 6.8 % 8.0 % 7.8 % 8.1 % 5.9 % 7.5 %Services 12.9 % 13.3 % 11.7 % 12.9 % 14.3 % 14.2 % 13.3 % 14.3 % 13.6 % 10.5 % 10.2 % 12.0 %EBITDA margin 7.1 % 6.8 % 7.8 % 7.0 % 7.1 % 7.0 % 7.2 % 8.7 % 8.3 % 7.8 % 5.9 % 7.7 %
EBIT 4Q 2017 FY 2017 1Q 2018 2Q 2018 3Q 2018 4Q 2018 FY 2018 1Q 2019 2Q 2019 3Q 2019 4Q 2019 FY 2019Projects 203 608 173 201 254 214 843 280 189 251 117 837 Services 98 429 94 131 141 145 511 120 122 100 58 399 Other (196) (466) (41) (78) (114) (72) (305) (75) (213) (105) (137) (531) EBIT 105 571 226 254 282 287 1,049 325 98 245 37 705
EBIT margin 4Q 2017 FY 2017 1Q 2018 2Q 2018 3Q 2018 4Q 2018 FY 2018 1Q 2019 2Q 2019 3Q 2019 4Q 2019 FY 2019Projects 3.9 % 3.4 % 4.1 % 4.1 % 4.9 % 3.8 % 4.2 % 4.7 % 3.1 % 4.5 % 2.1 % 3.6 %Services 8.4 % 9.4 % 8.1 % 9.8 % 11.1 % 11.0 % 10.0 % 9.2 % 8.1 % 6.4 % 3.5 % 6.7 %EBIT margin 1.6 % 2.5 % 4.1 % 4.1 % 4.3 % 4.1 % 4.2 % 4.5 % 1.3 % 3.4 % 0.5 % 2.4 %
IFRS 16 was implemented in 2019 without restating previous periods. See further information in half-year report 2019
2020 © Aker Solutions February 7, 2020Fourth-Quarter Results 2019 Slide 30
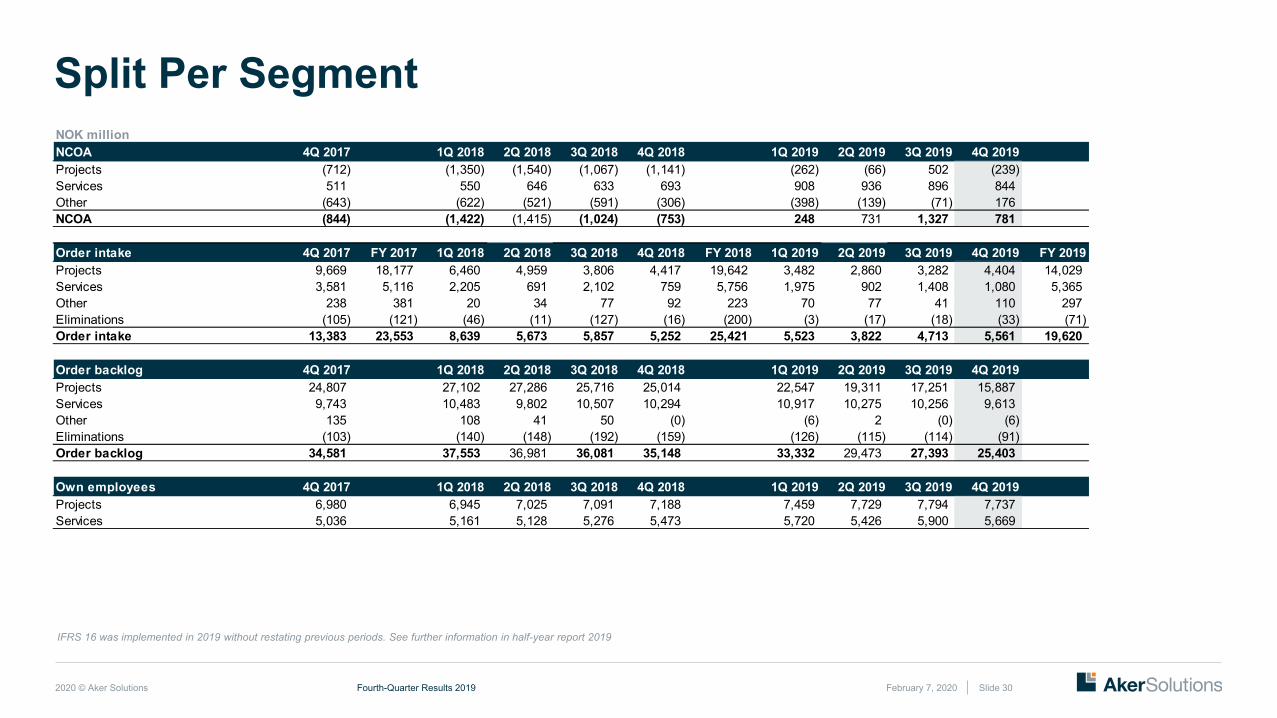
Split Per SegmentNOK millionNCOA 4Q 2017 1Q 2018 2Q 2018 3Q 2018 4Q 2018 1Q 2019 2Q 2019 3Q 2019 4Q 2019Projects (712) (1,350) (1,540) (1,067) (1,141) (262) (66) 502 (239) Services 511 550 646 633 693 908 936 896 844 Other (643) (622) (521) (591) (306) (398) (139) (71) 176 NCOA (844) (1,422) (1,415) (1,024) (753) 248 731 1,327 781
Order intake 4Q 2017 FY 2017 1Q 2018 2Q 2018 3Q 2018 4Q 2018 FY 2018 1Q 2019 2Q 2019 3Q 2019 4Q 2019 FY 2019Projects 9,669 18,177 6,460 4,959 3,806 4,417 19,642 3,482 2,860 3,282 4,404 14,029 Services 3,581 5,116 2,205 691 2,102 759 5,756 1,975 902 1,408 1,080 5,365 Other 238 381 20 34 77 92 223 70 77 41 110 297 Eliminations (105) (121) (46) (11) (127) (16) (200) (3) (17) (18) (33) (71) Order intake 13,383 23,553 8,639 5,673 5,857 5,252 25,421 5,523 3,822 4,713 5,561 19,620
Order backlog 4Q 2017 1Q 2018 2Q 2018 3Q 2018 4Q 2018 1Q 2019 2Q 2019 3Q 2019 4Q 2019Projects 24,807 27,102 27,286 25,716 25,014 22,547 19,311 17,251 15,887 Services 9,743 10,483 9,802 10,507 10,294 10,917 10,275 10,256 9,613 Other 135 108 41 50 (0) (6) 2 (0) (6) Eliminations (103) (140) (148) (192) (159) (126) (115) (114) (91) Order backlog 34,581 37,553 36,981 36,081 35,148 33,332 29,473 27,393 25,403
Own employees 4Q 2017 1Q 2018 2Q 2018 3Q 2018 4Q 2018 1Q 2019 2Q 2019 3Q 2019 4Q 2019Projects 6,980 6,945 7,025 7,091 7,188 7,459 7,729 7,794 7,737 Services 5,036 5,161 5,128 5,276 5,473 5,720 5,426 5,900 5,669
IFRS 16 was implemented in 2019 without restating previous periods. See further information in half-year report 2019
2020 © Aker Solutions February 7, 2020Fourth-Quarter Results 2019 Slide 31
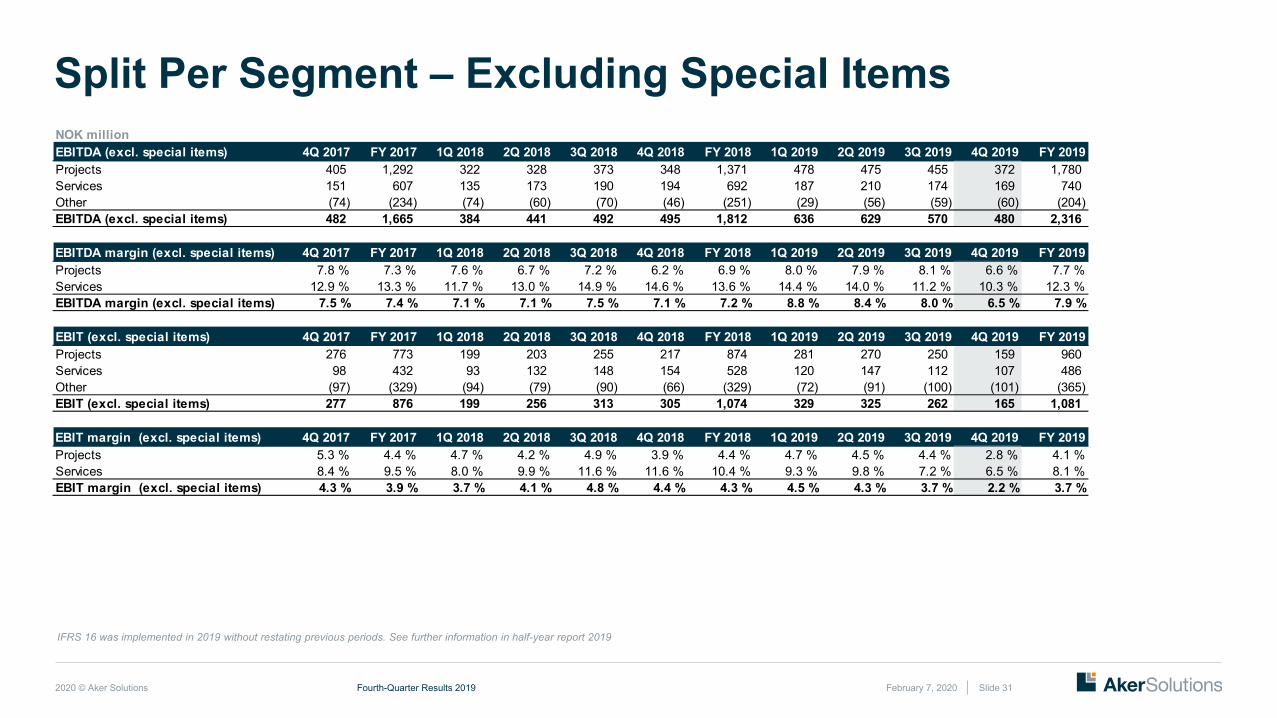
Split Per Segment – Excluding Special ItemsNOK millionEBITDA (excl. special items) 4Q 2017 FY 2017 1Q 2018 2Q 2018 3Q 2018 4Q 2018 FY 2018 1Q 2019 2Q 2019 3Q 2019 4Q 2019 FY 2019Projects 405 1,292 322 328 373 348 1,371 478 475 455 372 1,780 Services 151 607 135 173 190 194 692 187 210 174 169 740 Other (74) (234) (74) (60) (70) (46) (251) (29) (56) (59) (60) (204) EBITDA (excl. special items) 482 1,665 384 441 492 495 1,812 636 629 570 480 2,316
EBITDA margin (excl. special items) 4Q 2017 FY 2017 1Q 2018 2Q 2018 3Q 2018 4Q 2018 FY 2018 1Q 2019 2Q 2019 3Q 2019 4Q 2019 FY 2019Projects 7.8 % 7.3 % 7.6 % 6.7 % 7.2 % 6.2 % 6.9 % 8.0 % 7.9 % 8.1 % 6.6 % 7.7 %Services 12.9 % 13.3 % 11.7 % 13.0 % 14.9 % 14.6 % 13.6 % 14.4 % 14.0 % 11.2 % 10.3 % 12.3 %EBITDA margin (excl. special items) 7.5 % 7.4 % 7.1 % 7.1 % 7.5 % 7.1 % 7.2 % 8.8 % 8.4 % 8.0 % 6.5 % 7.9 %
EBIT (excl. special items) 4Q 2017 FY 2017 1Q 2018 2Q 2018 3Q 2018 4Q 2018 FY 2018 1Q 2019 2Q 2019 3Q 2019 4Q 2019 FY 2019Projects 276 773 199 203 255 217 874 281 270 250 159 960 Services 98 432 93 132 148 154 528 120 147 112 107 486 Other (97) (329) (94) (79) (90) (66) (329) (72) (91) (100) (101) (365) EBIT (excl. special items) 277 876 199 256 313 305 1,074 329 325 262 165 1,081
EBIT margin (excl. special items) 4Q 2017 FY 2017 1Q 2018 2Q 2018 3Q 2018 4Q 2018 FY 2018 1Q 2019 2Q 2019 3Q 2019 4Q 2019 FY 2019Projects 5.3 % 4.4 % 4.7 % 4.2 % 4.9 % 3.9 % 4.4 % 4.7 % 4.5 % 4.4 % 2.8 % 4.1 %Services 8.4 % 9.5 % 8.0 % 9.9 % 11.6 % 11.6 % 10.4 % 9.3 % 9.8 % 7.2 % 6.5 % 8.1 %EBIT margin (excl. special items) 4.3 % 3.9 % 3.7 % 4.1 % 4.8 % 4.4 % 4.3 % 4.5 % 4.3 % 3.7 % 2.2 % 3.7 %
IFRS 16 was implemented in 2019 without restating previous periods. See further information in half-year report 2019
2020 © Aker Solutions February 7, 2020Fourth-Quarter Results 2019 Slide 32
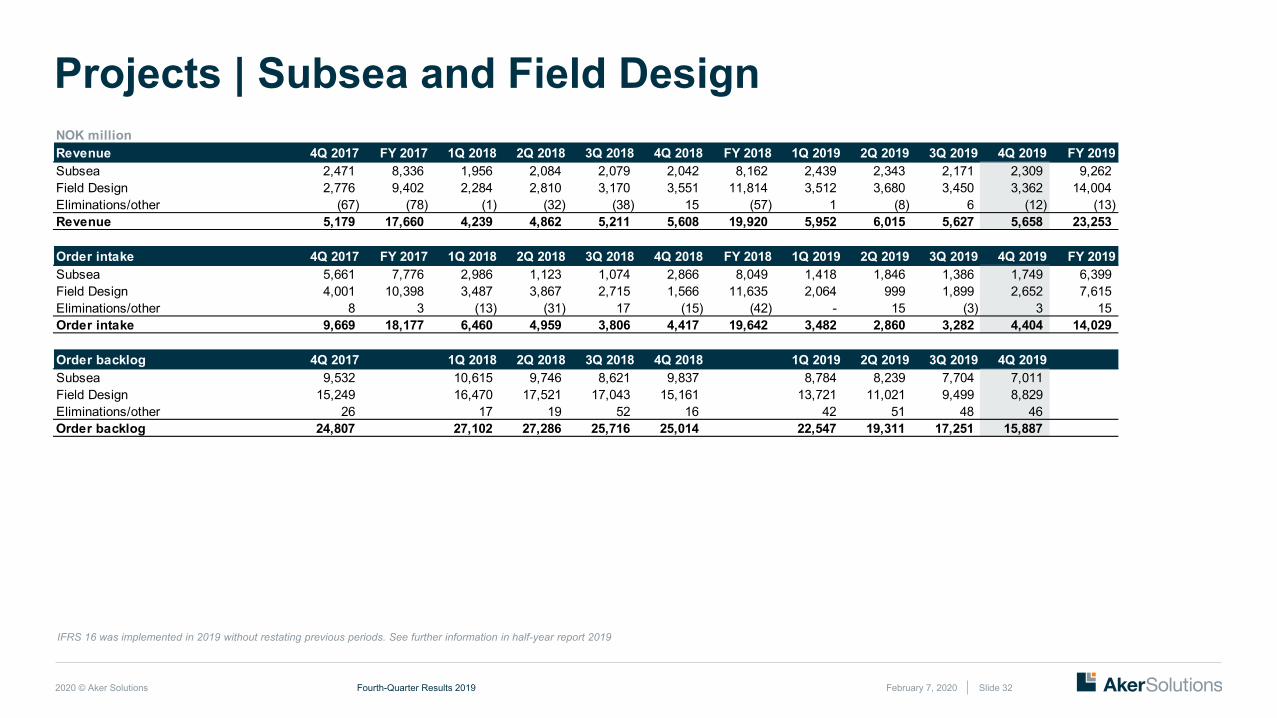
Projects | Subsea and Field DesignNOK millionRevenue 4Q 2017 FY 2017 1Q 2018 2Q 2018 3Q 2018 4Q 2018 FY 2018 1Q 2019 2Q 2019 3Q 2019 4Q 2019 FY 2019Subsea 2,471 8,336 1,956 2,084 2,079 2,042 8,162 2,439 2,343 2,171 2,309 9,262 Field Design 2,776 9,402 2,284 2,810 3,170 3,551 11,814 3,512 3,680 3,450 3,362 14,004 Eliminations/other (67) (78) (1) (32) (38) 15 (57) 1 (8) 6 (12) (13) Revenue 5,179 17,660 4,239 4,862 5,211 5,608 19,920 5,952 6,015 5,627 5,658 23,253
Order intake 4Q 2017 FY 2017 1Q 2018 2Q 2018 3Q 2018 4Q 2018 FY 2018 1Q 2019 2Q 2019 3Q 2019 4Q 2019 FY 2019Subsea 5,661 7,776 2,986 1,123 1,074 2,866 8,049 1,418 1,846 1,386 1,749 6,399 Field Design 4,001 10,398 3,487 3,867 2,715 1,566 11,635 2,064 999 1,899 2,652 7,615 Eliminations/other 8 3 (13) (31) 17 (15) (42) - 15 (3) 3 15 Order intake 9,669 18,177 6,460 4,959 3,806 4,417 19,642 3,482 2,860 3,282 4,404 14,029
Order backlog 4Q 2017 1Q 2018 2Q 2018 3Q 2018 4Q 2018 1Q 2019 2Q 2019 3Q 2019 4Q 2019Subsea 9,532 10,615 9,746 8,621 9,837 8,784 8,239 7,704 7,011 Field Design 15,249 16,470 17,521 17,043 15,161 13,721 11,021 9,499 8,829 Eliminations/other 26 17 19 52 16 42 51 48 46 Order backlog 24,807 27,102 27,286 25,716 25,014 22,547 19,311 17,251 15,887
IFRS 16 was implemented in 2019 without restating previous periods. See further information in half-year report 2019

2020 © Aker Solutions
2020 © Aker Solutions
CopyrightCopyright of all published material including photographs, drawings and images in this document remains vested in Aker Solutions and third party contributors as appropriate. Accordingly, neither the whole nor any part of this document shall be reproduced in any form nor used in any manner without express prior permission and applicable acknowledgements. No trademark, copyright or other notice shall be altered or removed from any reproduction.
DisclaimerThis Presentation includes and is based, inter alia, on forward-looking information and statements that are subject to risks and uncertainties that could cause actual results to differ. These statements and this Presentation are based on current expectations, estimates and projections about global economic conditions, the economic conditions of the regions and industries that are major markets for Aker Solutions ASA and Aker Solutions ASA’s (including subsidiaries and affiliates) lines of business. These expectations, estimates and projections are generally identifiable by statements containing words such as “expects”, “believes”, “estimates” or similar expressions. Important factors that could cause actual results to differ materially from those expectations include, among others, economic and market conditions in the geographic areas and industries that are or will be major markets for Aker Solutions’ businesses, oil prices, market acceptance of new products and services, changes in governmental regulations, interest rates, fluctuations in currency exchange rates and such other factors as may be discussed from time to time in the Presentation. Although Aker Solutions ASA believes that its expectations and the Presentation are based upon reasonable assumptions, it can give no assurance that those expectations will be achieved or that the actual results will be as set out in the Presentation. Aker Solutions ASA is making no representation or warranty, expressed or implied, as to the accuracy, reliability or completeness of the Presentation, and neither Aker Solutions ASA nor any of its directors, officers or employees will have any liability to you or any other persons resulting from your use.
Aker Solutions consists of many legally independent entities, constituting their own separate identities. Aker Solutions is used as the common brand or trade mark for most of these entities. In this presentation we may sometimes use “Aker Solutions”, “we” or “us” when we refer to Aker Solutions companies in general or where no useful purpose is served by identifying any particular Aker Solutions company.
February 7, 2020Fourth-Quarter Results 2019 Slide 34
Copyright and Disclaimer